Technology Singapore 323.05 September 10, 2021 THIS REPORT HAS BEEN PREPARED BY MAYBANK KIM ENG RESEARCH SEE PAGE 46 FOR IMPORTANT DISCLOSURES AND ANALYST CERTIFICATIONS Co. Reg No: 198700034E MICA (P) : 099/03/2012 Gene Lih Lai, CFA [email protected](65) 6231 5832 Sea Ltd (SE US) Southeast Asian Champion ASEAN super-app in the making. Initiate BUY We believe Sea is one of the best proxies to ride the ASEAN digitisation theme, given Shopee’s position as the top e-commerce app regionally, which paves the way for user conversion into digital finance. Growth in these segments appear at an early stage, and investments are funded by cash generative Garena via the Free Fire franchise. Initiate BUY with SOTP- based TP of USD378. Key risk is revenue concentration, as we think Free Fire accounts for a significant portion of current gross profitability. Garena Free Fire still early in its lifecycle We forecast 2020-23E revenue CAGR of 59.4%, driven by growth across digital entertainment (38.1%), e-commerce (75.3%) and digital financial services (118%). In 2Q21, Free Fire was the highest grossing mobile battle royale game in the US for the second consecutive quarter. The game remains extremely popular in Southeast Asia, Taiwan, Latin America, and India. Garena quarterly active users (QAU) saw a 1Q17-2Q21 CQGR of 16.2% to 725m, and we believe Free Fire is still in its early stages of its lifecycle with the potential to be a major IP franchise. Shopee is the top e-commerce app in Southeast Asia Shopee is the top e-commerce marketplace by visits, time spent (Android) and downloads in Southeast Asia. GMV saw a 1Q17-2Q21 CQGR of 20.3% to USD15b. We believe Shopee’s strengths are in its i) localisation, ii) user- friendliness, iii) and aggressive marketing strategies. Current take rates are around 6-8%, and Sea sees high-single-digit or low-teens percentage of GMV (our FY23E: 10.3%) is achievable in the long run. Sea is also excited about SeaMoney’s prospects via Shopee and other avenues in reaching the 74% of population in Southeast Asia that are underbanked or unbanked. Forecasting profit in FY23E We forecast Sea to achieve EBITDA/ net profit of USD1.7b/USD236m in 2023E, largely driven by economies of scale. A factor that could delay Sea’s turn to profitability is if we have underestimated sales & marketing and R&D expenses as it has historically prioritised user acquisition and retention to maximise monetisation opportunities down the road. We have factored Sea’s fundraising of 11m new ADS and USD2.5b of convertible bonds into our forecasts. Share Price USD 323.05 12m Price Target USD 378.00 (+17%) BUY Company Description Statistics 52w high/low (USD) 3m avg turnover (USDm) Free float (%) Issued shares (m) Market capitalisation Major shareholders: 8.4% 8.1% 6.7% 372 156.3 Sea is an internet company that has businesses in gaming, e-commerce and digital financial services. T.Rowe Price Associates Gang Ye Sands Capital Management 353.36/139.51 99.8 USD120.2B Price Performance -100 100 300 500 700 900 1,100 1,300 1,500 1,700 -50 0 50 100 150 200 250 300 350 400 Sep-19 Jan-20 May-20 Sep-20 Jan-21 May-21 Sep-21 Sea Ltd - (LHS, USD) Sea Ltd / NYSE composite index - (RHS, %) -1M -3M -12M Absolute (%) 9 19 132 Relative to index (%) 9 19 76 Source: FactSet FYE Dec (USD m) FY19A FY20A FY21E FY22E FY23E Revenue 2,175 4,376 8,826 13,257 17,710 EBITDA (770) (1,123) (975) (300) 1,711 Core net profit (1,463) (1,618) (1,657) (1,383) 236 Core FDEPS (cts) (315.8) (327.5) (285.9) (243.5) 40.6 Core FDEPS growth(%) nm nm nm nm nm Net DPS (cts) 0.0 0.0 0.0 0.0 0.0 Core FD P/E (x) nm nm nm nm nm P/BV (x) 16.0 29.1 29.3 34.9 30.9 Net dividend yield (%) 0.0 0.0 0.0 0.0 0.0 ROAA (%) (39.4) (20.6) (11.9) (7.7) 1.2 EV/EBITDA (x) nm nm nm nm 99.4 Net gearing (%) (incl perps) net cash net cash net cash net cash net cash Consensus net profit - - na na na MKE vs. Consensus (%) - - na na na
Transcript
Technolo
gy
Sin
gapore
323.05
September 10, 2021
THIS REPORT HAS BEEN PREPARED BY MAYBANK KIM ENG RESEARCH
SEE PAGE 46 FOR IMPORTANT DISCLOSURES AND ANALYST CERTIFICATIONS
As an internet business, we believe social issues is the most relevant, followed by governance and then environmental.
In the e-commerce business, driving social good (e.g. providing and teaching merchants how to use services) is integral to
sustainably grow the platform and to retain merchants while monetising them. For instance, in Indonesia, 57% of MSMEs
reported that they generated higher profits on Shopee than on other marketplaces.
We believe the key issue for Garena are i) addiction and ii) compliance to local laws. For instance, Bangladesh is reportedly
trying to ban Free Fire (alongside other addictive apps like PUBG and Tik Tok). Garena’s response to appease authorities is
important.
The financial sector is also a highly regulated one. In our view SeaMoney’s growth will be in part influenced by not just
adherence to local laws, but how SeaMoney advances government agendas (e.g. facilitate roll-out of financial assistance in
Malaysia and regulatory support for digital banking initiatives in ASEAN).
Data security is also a critical ESG factor. Sea has employed various security measures to ensure this. (e.g. encryption of
sensitive data, monitoring for unauthorized access etc).
Material E issues
Aside the increased use of packaging materials associated
with e-commerce as compared to traditional commerce,
we do not see much environmental issues as the remaining
businesses are digital based (i.e. gaming and digital
financial services)
We believe carbon emissions via the servers that Sea is
also a key environmental footprint, although not much has
been discussed in Sea’s sustainability report pertaining
environmental factors.
Key G metrics and issues
The board consist of 6 members. Out of which, 3 are non-
executive.
Chairman and Group Chief Executive Officer, Forrest Li
owns 25.1% of the total Class A and Class B Ordinary
Shares, while entities Tencent, Blue Dolphin Venture Inc
and T. Rowe Price Associates, Inc owns 22.9%, 8.8% and
6.2% respectively.
From a data security standpoint, Sea is committed in
ensuring that the processing of personal data of
consumers, employers and other stakeholders are carried
out lawfully. Sea states that it uses its data collected to
improve products to better serve its communities.
Given a large part of Sea’s competitive advantage is
derived from the network effects from its large user base
across multiple markets, compliance with laws is of
utmost importance. Further, we believe complementing
its growth strategies with government agenda.
Material S issues
Sea Limited aims to build highly diverse teams within the
company.
Of Sea’s >30,000 global workforce, 46% are females.
Furthermore, 46% of the middle to senior management
positions are held by females. SEA also boast a diverse
culture of over 50 different nationalities in their company.
Sea strongly believes in hiring and grooming local talent,
and is one of the largest employers of fresh graduates
across Southeast Asia.
In 2020, Sea conducted more than 5,000 training sessions
for their employees.
During the Covid-19 pandemic, Shopee provided financial
support and relief to SMEs by easing operational costs and
attracting new customers. Shopee also provided the SMEs
with online courses to help the SMEs to scale and succeed
their business in the long run. Furthermore, SEA Limited
committed more than USD 35m worth of COVID-19 Seller
Support Packages across their markets, and provided
monetary donation of more than USGD 510,000.
¹Risk Rating & Score - derived by Sustainalytics and assesses the company’s exposure to unmanaged ESG risks. Scores range between 0 - 50 in order of increasing severity with low/high scores & ratings representing negligible/significant risk to the company’s enterprise value, respectively, from ESG-driven financial impacts. ²Score Momentum - indicates changes to the company's score since the last update – a negative integer indicates a company’s improving risk score; a positive integer indicates a deterioration. ³Controversy Score - reported periodically by Sustainalytics in the event of material ESG-related incident(s), with the impact severity scores of these events ranging from Category 0-5 (0 - no reports; 1 - negligible risks; ...; 5 - poses serious risks & indicative of potential structural deficiencies at the company).
September 10, 2021 4
Sea Ltd
1. Investment thesis
1.1 Southeast Asian super-app in the making
Sea comprises three core businesses – digital entertainment (Garena), e-
commerce (Shopee), and digital financial services (SeaMoney). We see Sea
as a prime proxy to digitisation in GSEA, premised upon i) Shopee being the
top e-commerce app in the region, with growth momentum accelerated by
Covid-19; ii) SeaMoney’s growth opportunities – from the conversion of
captive Shopee users, further entrenched as SeaMoney expands its
touchpoints, with these being funded by iii) a still sticky Free Fire franchise.
In our view, Sea’s success primarily stems from i) willingness to invest in
long-term growth opportunities; ii) successful strategies in user acquisition
and retention – which have paved the way for monetisation and should
continue to do so; and iii) the resulting network effects of the ecosystems
it builds.
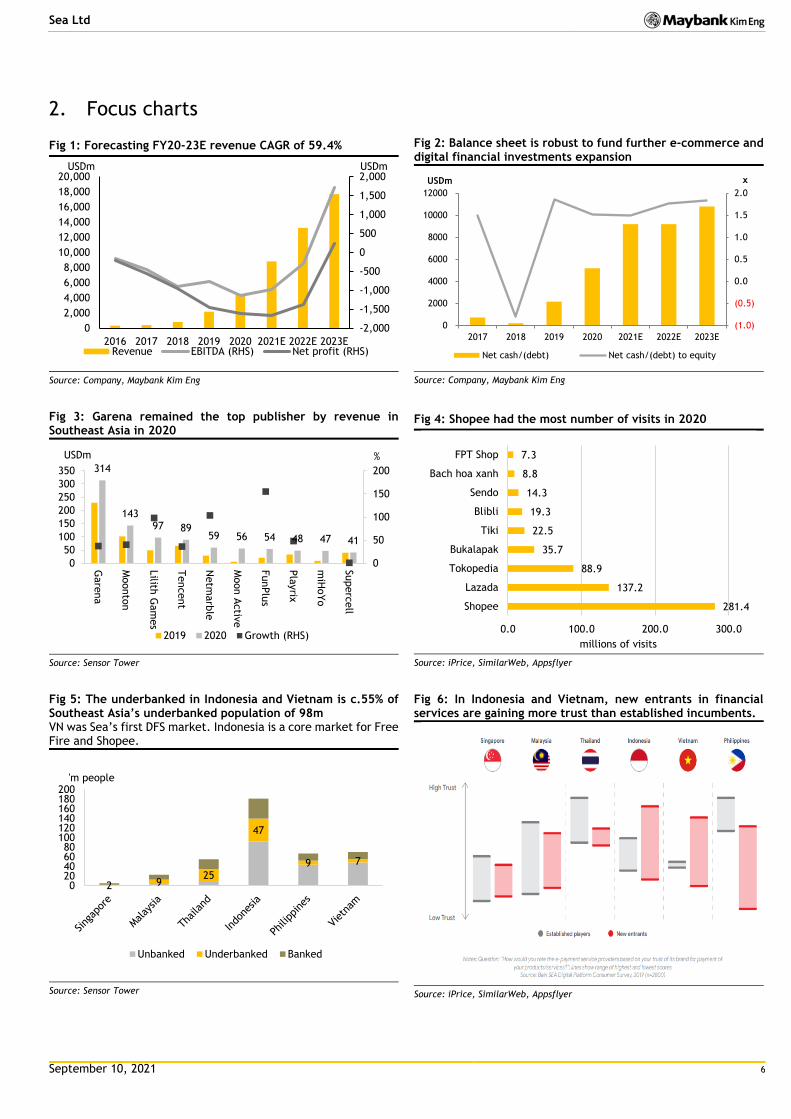
We forecast FY21-23E revenue CAGR of 59.4% to USD17.71b, driven by the
following segmental revenue CAGR rates: i) digital entertainment: 38.1%;
ii) e-commerce: 75.3%, and iii) digital financial services: 118%. In the same
timeframe, we expect sales and marketing expenses, plus R&D to see a 33%
CAGR (FY20: 50% of revenue; FY23E: 29%). We anticipate Sea to turn
profitable in FY23E with profit of USD236m (FY20 loss: USD1.62b), on the
back of economies of scale. Profitability milestone could be delayed if we
have underestimated the investments that Sea will put in to grow e-
commerce and digital financial services prospects.
Garena is highly cash generative (2020 adj EBITDA margin: 62%). In turn, a
large part of Garena’s performance is attributable to Free Fire, a battle
royale game first launched in 2017. While most games that old would begin
to lose their appeal after a few years, Free Fire’s momentum appears
ongoing, as its popularity has now gone beyond Sea’s traditional markets of
Southeast Asia to Latin America, India, and now even the US. Free Fire’s
winning formula is intuitive, being a combination of i) localisation of
content to relate to domestic users in each geography (e.g. app is in local
language, local celebrities are playable as in-game characters); and ii)
easier accessibility for its target audience, as Free Fire’s technical
minimum requirements are much less onerous than other battle royale
games (see Fig 20). Post-Covid-19 lockdowns, Sea observes that while users
generally spend less time on Free Fire than during lockdowns, this metric is
still significantly higher than during pre-Covid-19 lockdowns. Sea remains
optimistic that Free Fire can become a major IP franchise, and also aims to
position Free Fire as a online place for users to hang out, e.g. by socialising
or for listening to music. As at 2Q21, Garena had 725.2m quarterly active
users (QAU), representing a CQGR of 16.2% since 1Q17. In 2Q21, Free Fire
crossed the 1b cumulative download mark on Google Playstore, and is the
first ever mobile battle royale game to achieve this.
Meanwhile, Shopee is the top e-commerce platform in Southeast Asia and
Taiwan, based on monthly active users, total time in app (Android), and
downloads. Shopee’s success has been driven by i) strong localisation
initiatives to cater for domestic market (e.g. understanding preferences,
sales festivals, e.g. 1.1, 2.2, … 12.12), iii) social engagement and
gamification features found in its apps, and most importantly iv) user-
friendliness of the app interface and overall fulfilment service. Shopee has
now ventured into Latin America with the launch of Brazil (4Q19) and
Mexico (1Q21). In Brazil, Shopee was the top shopping app by downloads
GSEA refers go Greater Southeast Asia, comprising Sea’s traditional markets of Taiwan, Singapore, Malaysia, Indonesia, Vietnam,
Philippines and Thailand.
In 2Q21, Free Fire was the top grossing game in: i) Southeast Asia & Latin America (8th consecutive quarter) ii) India (3rd consecutive quarter) iii) United states (2nd consecutive quarter)
September 10, 2021 5
Sea Ltd
and total time spent in app, according to App Annie in 2Q21. The app ranked
second by monthly active users in the quarter. Shopee’s GMV have enjoyed
a CQGR of 20.3% during 1Q17-2Q21 to reach USD15b, while its take rate has
expanded from nil in 1Q17 to hit 7.7% in 2Q21. Management believes that
with further monetisation initiatives, take rates could reach high single
digits or even low double digits in the long run. In 2Q21, Malaysia became
the second market after Taiwan to achieve positive adjusted EBITDA before
allocation of headquarters’ common expenses. During the quarter, overall
e-commerce adjusted EBITDA loss per order narrowed by 20% YoY to
USD0.41. According to Reuters, Shopee is also preparing to launch in Poland,
its first foray into Europe.
On the other hand, we believe that SeaMoney is still in its early stages of
growth. As the digital financial services landscape across ASEAN is very
fragmented, we believe SeaMoney’s long term success will ultimately be
driven by user acquisition, both from the perspective of merchants and end-
users. As we expect Sea to continue its aggressive expansion mode, in
particular for Shopee and SeaMoney, we anticipate sales, marketing and
R&D expenses to remain elevated in coming years.
From a balance sheet perspective, we are projecting Sea to not just
maintain a net cash position, but for cash and cash equivalents to grow from
USD7b to USD14.7b in FY23E, as largely due to cash generation from the
digital entertainment business, as well as from the c.USD6b equity and
convertible debt fund raising announced on 10-Sep-21.
1.2 SOTP derived TP of USD378
Our TP of USD378 is derived from a sum of the parts of the individual
businesses. We value the digital entertainment business at USD112/ADS,
based on 27x FY22E P/E, at a slight premium to peers at 21.9x on account
on faster earnings growth. Meanwhile, we ascribe a valuation of
USD227/ADS for the e-commerce business, which is based on 1.4x FY22E
P/GMV (higher than global peers and relatively in line with Mercado Libre
to factor in upside potential from new markets). For digital financial
services, we value the business based on 0.4x FY22E P/GMV, resulting in a
valuation of USD23 per ADS.
1.3 Risks
We believe the largest risk to Sea is revenue concentration. Sea’s gross
profitability is largely driven by Garena, of which Free Fire contributes a
significant portion of segment revenue. In the e-commerce business, Sea
disclosed that top two markets account for a sizeable number of orders and
GMV. While we note strong growth momentum and stickiness in Free Fire
and Shopee’s core markets, we believe the Achilles heel that could unwind
these dynamics are decline in popularity of these offerings and/or
regulatory risk. Sea faces strong competition in all the verticals and
geographies that it participates in, and a loss in appeal and/or accessibility
of its products can be easily replaced by competitors’ thereby resulting in
market share loss of Sea’s offerings.
Take rate is calculated as e-commerce revenue divided by GMV. In turn, GMV, or gross merchandise value is the value of products sold on an e-commerce platform, in this case, Shopee.
September 10, 2021 6
Sea Ltd
2. Focus charts
Fig 1: Forecasting FY20-23E revenue CAGR of 59.4%
Source: Company, Maybank Kim Eng
Fig 2: Balance sheet is robust to fund further e-commerce and digital financial investments expansion
Source: Company, Maybank Kim Eng
Fig 3: Garena remained the top publisher by revenue in Southeast Asia in 2020
Source: Sensor Tower
Fig 4: Shopee had the most number of visits in 2020
Source: iPrice, SimilarWeb, Appsflyer
Fig 5: The underbanked in Indonesia and Vietnam is c.55% of Southeast Asia’s underbanked population of 98m VN was Sea’s first DFS market. Indonesia is a core market for Free Fire and Shopee.
Source: Sensor Tower
Fig 6: In Indonesia and Vietnam, new entrants in financial services are gaining more trust than established incumbents.
Source: iPrice, SimilarWeb, Appsflyer
-2,000
-1,500
-1,000
-500
0
500
1,000
1,500
2,000
0
2,000
4,000
6,000
8,000
10,000
12,000
14,000
16,000
18,000
20,000
2016 2017 2018 2019 2020 2021E 2022E 2023E
USDmUSDm
Revenue EBITDA (RHS) Net profit (RHS)
(1.0)
(0.5)
0.0
0.5
1.0
1.5
2.0
0
2000
4000
6000
8000
10000
12000
2017 2018 2019 2020 2021E 2022E 2023E
xUSDm
Net cash/(debt) Net cash/(debt) to equity
314
14397 89
59 56 54 48 47 41
0
50
100
150
200
0
50
100
150
200
250
300
350
Gare
na
Moonto
n
Lilith
Gam
es
Tencent
Netm
arb
le
Moon A
ctiv
e
FunPlu
s
Pla
yrix
miH
oYo
Superc
ell
%USDm
2019 2020 Growth (RHS)
281.4
137.2
88.9
35.7
22.5
19.3
14.3
8.8
7.3
0.0 100.0 200.0 300.0
Shopee
Lazada
Tokopedia
Bukalapak
Tiki
Blibli
Sendo
Bach hoa xanh
FPT Shop
millions of visits
2 925
47
9 7
020406080
100120140160180200
'm people
Unbanked Underbanked Banked
September 10, 2021 7
Sea Ltd
3. Corporate overview
Sea is a Singapore-founded global consumer internet company and was
founded as Garena Interactive Holding in 2009. In 2017, the company
changed its name to Sea.
Sea comprises three core businesses:
Garena (digital entertainment): Focuses on offering mobile and PC
games and developing mobile games for the global market. The digital
entertainment business was founded in 2009, and by 2020, Garena has
local game operations across GSEA and Latin America. Its most popular
game is Free Fire which is available in over 130 countries globally.
Shopee (ecommerce platform): The largest e-commerce platform
regionally in 2020, according to Frost & Sullivan. Shopee was launched
across GSEA in 2015, and subsequently in Brazil (4Q19), and Mexico
(1Q21).
Sea Money (digital financial services): The business was launched in both
Vietnam and Thailand in 2014. In 4Q19, Sea introduced SeaMoney as the
overall brand for the digital financial services business.
Sea completed its initial public offering and listed its ADS on the NYSE in
Oct-17. The profiles of the management team are shown in Appendix I.
Meanwhile, further details on the business model and growth outlook is
discussed in the next chapter “Overview by segment”.
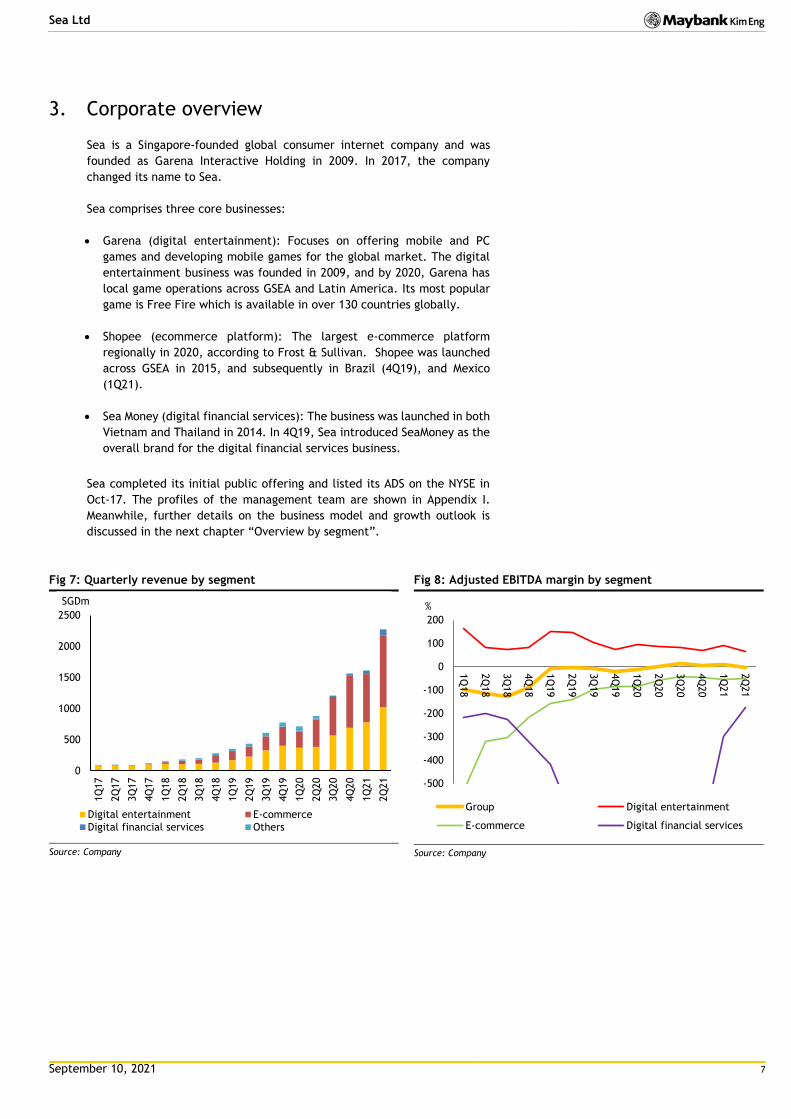
Fig 7: Quarterly revenue by segment
Source: Company
Fig 8: Adjusted EBITDA margin by segment
Source: Company
0
500
1000
1500
2000
2500
1Q
17
2Q
17
3Q
17
4Q
17
1Q
18
2Q
18
3Q
18
4Q
18
1Q
19
2Q
19
3Q
19
4Q
19
1Q
20
2Q
20
3Q
20
4Q
20
1Q
21
2Q
21
SGDm
Digital entertainment E-commerce
Digital financial services Others
-500
-400
-300
-200
-100
0
100
200
1Q
18
2Q
18
3Q
18
4Q
18
1Q
19
2Q
19
3Q
19
4Q
19
1Q
20
2Q
20
3Q
20
4Q
20
1Q
21
2Q
21
%
Group Digital entertainment
E-commerce Digital financial services
September 10, 2021 8
Sea Ltd
4. Overview by segment
4.1 Garena – Free Fire is sticky and becoming a major IP
franchise
Overview
Garena is a game developer and publisher, and is a leader of eSports in
Southeast Asia, Taiwan and Brazil. Its most popular game is Free Fire, which
is Garena’s first fully in-house developed game, launched in Dec-17. Free
Fire belongs to the battle-royale genre.
Aside developing games such as Free Fire, Garena also exclusively licences
and publishes games by third parties. Garena’s games cover some of the
most popular genres, such as battle royale (e.g. Free Fire), multiplayer
online battle arenas (MOBA; Arena of Valor, League of Legends), action role
playing games (action RPGs), massively multiplayer online role-playing
games (MMORPGs), racing and also sports games.
Business model
Garena’s monetisation model is primarily a “freemium” based one, i.e.
users are able to download and play fully functional games. Garena
generates revenue by selling in-game items, including virtual items such as
digital representation of functional or decorative items, as well as season
passes. The freemium model is powerful because it allows for quick
scalability of users, in turn driving network effects. Garena leverages this
further by providing localised content to boost user engagement. Sea
observes that paying users tend to also be stickier, as these users have
invested into the game. This in turn extends the longevity and relevance of
the game.
Sea believes that the larger its active user base is, the greater the likelihood
of users making in-game purchases. Fig 9 shows historical quarterly average
users and quarterly paying users, underscoring Garena’s ability to grow user
base while also deepening monetisation.
Fig 9: % of paying users tend to increase with rising user base as well.
Source: Company
Fig 10: Historical average revenue per paying user (ARPPU)
Source: Company
Growth initiatives and strategy
Garena believes that some of its key success factors include i) social
features – e.g. live streaming of gameplay, user chat and online forums, and
ii) localisation of content. To drive social engagement, Garena organises
hundreds of esports events annually and operate the largest mobile-game
professional league in Southeast Asia, Taiwan and Brazil.
0
2
4
6
8
10
12
14
0
100
200
300
400
500
600
700
800
1Q
17
2Q
17
3Q
17
4Q
17
1Q
18
2Q
18
3Q
18
4Q
18
1Q
19
2Q
19
3Q
19
4Q
19
1Q
20
2Q
20
3Q
20
4Q
20
1Q
21
2Q
21
%millions
QAU QPU % of paying users
0
5
10
15
20
25
3Q
17
4Q
17
1Q
18
2Q
18
3Q
18
4Q
18
1Q
19
2Q
19
3Q
19
4Q
19
1Q
20
2Q
20
3Q
20
4Q
20
1Q
21
2Q
21
3Q
21E
4Q
21E
1Q
22E
2Q
22E
USD
September 10, 2021 9
Sea Ltd
Garena localises licenced games to adapt to each market, by working with
developers to translate content to local languages, revise game design to
suit local preferences, and develop exclusive content to boost the
attractiveness of games for local audiences. Examples of exclusive content
includes includes DJ Alok from Brazil, Bollywood Superstar Hrithik Roshan,
Actor Joe Taslim from Indonesia, Actor and Martial Artist Tony Jaa from
Thailand and Footballer Cristiano Ronaldo from Portugal.
Fig 11: Cristiano Ronaldo featured as a character in Free Fire
Source: Topgamehere.blogspot.com
Fig 12: Cristiano Ronaldo in-game gameplay
Source: Sportskeeda
Another key strategy to keep extend the franchise and longevity of Free
Fire is by expanding in-game content and features. Sea observes that an
increasing number of gamers spend time on the Free Fire platform not just
for core battle-royale gameplay, but also to enjoy other features. In 2Q21,
Sea launched Pet Rumble within Free Fire. Pet Rumble is a social deduction
game mode where players can use their in-game virtual pets to take part in
a game of cooperation and infiltration. Many of the new game modes are
designed to be highlight social to promote interaction within the Free Fire
community.
Sea is backed by Tencent (22.9% stake as at end of FY20). In late 2018, Sea
and Tencent entered into a 5 year agreement where Tencent will Grant Sea
a right of first refusal to publish Tecent’s mobile and PC games in Indonesia,
Taiwan, Thailand, the Philippines, Malaysia and Singapore.
In Jan-20, Garena acquired a Canadian-based games development studio
Phoenix Labs. This is expected to further bolster Garena’s in-house content
creation capabilities. Garena believes its strength is in being able to cater
to highly diversified markets globally, and this is further solidified through
big data that it collects.
Market outlook
The mobile gaming market has seen growth accelerated since Covid-19.
Globally and across Asia, mobile gaming revenues continue to be higher
both YoY and sequentially in 1Q21, indicating that despite exiting
lockdowns, users are still engaged with the games they play (see Fig 13 and
14).
September 10, 2021 10
Sea Ltd
Fig 13: Global mobile gaming revenue has accelerated post-Covid-19 lockdowns…
Source: Sensor Tower
Fig 14: … Similar observations can be made in Asia.
Source: Sensor Tower
According to Sensor Tower, Southeast Asia’s mobile gaming revenue is
expected to be 88% higher by 2023 as compared to 2020, making it the
fastest growing region globally (see Fig 15).
Fig 15: Southeast Asia boasts the highest growth rate for mobile gaming revenue over 2020-23.
Source: Sensor Tower
From the perspective of game genres, battle royale games like Free Fire
and PUBG were consistently ranked within top 10 by downloads. According
to Sensor Tower, Free Fire downloads began to surpass PUBG in 2020, and
this lead has widened in 1Q21 (Fig 16).
0
5
10
15
20
25
30
35
0
5
10
15
20
25%USDb
App store Google Play Growth YoY (RHS)
0
5
10
15
20
25
30
0
2
4
6
8
10
12
14%USDb
App store Google Play Growth YoY (RHS)
September 10, 2021 11
Sea Ltd
Fig 16: Top mobile games in Asia by downloads. Battle Royale games like Free Fire and PUBG consistently rank in top 10
Source: Sensor Tower
Since 2014, the freemium model has been gaining share in favour of paid
games. By 4Q20, only 5% of newly released games were paid games, and
the share of paid games on the App Store had fallen to 12% (1Q14: 43%),
according to Sensor Tower (Fig 17). In Southeast Asia, Garena remained the
top publisher by revenue in 2020, raking in USD314m in 2020 (+37% YoY),
more than double that of the next closest publisher Moonton (Fig 18).
Fig 17: Freemium games continue to be more popular than paid games based on availability, new releases and revenues.
Source: Sensor Tower
September 10, 2021 12
Sea Ltd
Fig 18: Garena was the top publisher in Southeast Asia by revenue
Source: Sensor Tower
Success of Free Fire
Sea sees Free Fire as being early in its life cycle. Based on the increasing
traction globally, Sea views Free Fire increasingly as a platform and major
IP franchise.
Free Fire’s top markets are primarily in emerging markets. According to Sea
referencing data from App Annie (app analytics company), Free Fire
remains the highest grossing mobile game in Latin America, Southeast Asia
and India as at 2Q21. Further, this is the 8th consecutive quarter that Free
Fire has occupied the top spot in Southeast Asia, and the third quarter for
India. Meanwhile, according to Sensor Tower, Garena was within top 10 of
mobile games by worldwide revenue for Jul-21.
Fig 19: Top Mobile games by worldwide revenue (Jul-2021)
Source: Sensor Tower
Aside content localisation and user engagement through e-sports events,
we believe Free Fire’s success is also due to the following:
Playable on low-to-mid tier smartphones – This makes the game
accessible to anyone with a smartphone – in particular, users from
developing regions (Fig 20).
Quicker matches – Most of Free Fire’s matches lasts around 10-20
minutes and consists only 50 players. This allows for quicker gameplay
314
143
97 8959 56 54 48 47 41
0
20
40
60
80
100
120
140
160
180
200
0
50
100
150
200
250
300
350
Gare
na
Moonto
n
Lilith
Gam
es
Tencent
Netm
arb
le
Moon A
ctiv
e
FunPlu
s
Pla
yrix
miH
oYo
Superc
ell
%USDm
2019 2020 Growth (RHS)
September 10, 2021 13
Sea Ltd
as compared to other battle royale games which last around 30 minutes
with 100 users.
Fig 20: Free Fire’s minimum requirements are the least onerous among popular battle-royale games, widening its audience to players in emerging countries
Free Fire PUBG COD: Mobile Fortnite Battleland Royales
Android (Min Requirement)
OS: Android 4.4 CPU: Dual Core 1.2GHz
RAM:1 GB Storage: 1.5GB+
OS: Android 5.1.1 CPU: Snapdragon 425
(1.4GHz) RAM:2 GB
Storage: 2 GB+
OS: Android 5.1 CPU: Dual Core
CPU 1.2Ghz RAM:2 GB
Storage: 3 GB+
OS: Android 8.0 CPU: 64 - bit Android
on an ARM 64 processor RAM:4 GB Storage:
OS: 4.1.0 CPU: Dual Core
1.2GHz RAM:1 GB
Storage: 1.5GB
IOS (Min Requirement)
OS: IOS 9 CPU: Iphone 5s
RAM: 1GB Storage: 1.5GB+
OS: IOS 9 CPU: Iphone 5s
RAM: 1GB Storage: 2GB+
OS: IOS 9 CPU: Iphone SE
RAM: 2 GB Storage: 2 GB
Not Available in the Apple Store
OS: IOS 9 CPU:
RAM: 1 GB Storage: 1 GB
Android (Good Performance)
OS: Android 7 CPU: Dual Core 1.8GHz
RAM:3 GB Storage: 3 GB+
OS: Android 5.1.1 CPU: Snapdragon 636
(1.8GHz) RAM:4 GB
Storage: 2 GB+
OS: Android 6
CPU: Snapdragon 625 (2 GHz) RAM:2 GB
Storage: 1.5
IOS (Good Performance)
OS: IOS 11+ CPU: Iphone 7
RAM: 3GB Storage: 3GB+
OS: IOS 9 CPU: Iphone 7
RAM: 2GB+ Storage: 4GB+
Source: Various sources
Despite many countries exiting strict lockdown, Sea observes that time
spent for daily active user on Free Fire remains much higher than pre-
pandemic levels. Overall, Sea also sees that paying user ratio among older
cohorts (i.e. those playing since the early days of the game) are still rising,
and new cohorts are exhibiting higher and faster growing paying user ratio.
In recent quarters, India has been a strong growth market for Free Fire. A
key catalyst for this was due to the ban of competitor app PUBG (published
by Chinese company Tencent) amid rising geopolitical tensions. According
to Newzoo, Free Fire’s viewership on Twitch and YouTube have rapidly
expanded and surpassed PUBG’s in 3Q20. To maintain Free Fire’s
momentum, Garena’s 2021 esports roadmap for Free Fire includes four
tournaments across two pro circuits, at a cadence of one per quarter. In
our view, a risk to Free Fire’s growth in India is the relaunch of a rebranded
version of PUBG, known as Battlegrounds India Mobile (developed by India-
based Kafton), launched on 18 Jun-21. This is because the relaunched game
could wrest back original fans of PUBG. In 1Q21 earnings briefing, Sea
continues to see India as a promising market with a “very long runway”. At
writing, Sea has yet to observe Battlegrounds Mobile India curtail the
growth trajectory of Free Fire in India.
September 10, 2021 14
Sea Ltd
Fig 21: Viewership of Free Fire rapidly surpassed PUBG following ban of latter in India.
Source: Newzoo
In the US, Free Fire was the highest grossing mobile battle royale game for
two consecutive quarters in the US and was the second highest grossing
mobile game on Google Play in 2Q21, according to App Annie. According to
Sensor Tower, took over PUBG’s position as the top grossing mobile battle
royale game in the country in 1Q21.
Fig 22: Free Fire has taken over PUBG as the top grossing battle royale game in the US in 1Q21
Source: Sensor Tower
Fig 23: Free Fire is 2nd highest grossing battle royale game globally in 1Q21
Source: Sensor Tower
Launching Free Fire MAX to widen audience base
In late Aug-21, Free Fire MAX became available for pre-registration on
Google Play Store. Free Fire MAX is an enhanced version of the original Free
Fire with advanced effects, animations, and graphics, which is widely
expected to be launched in Oct-21. As the gameplay of Free Fire and Free
Fire MAX are identical and players of both games are able to play each other,
we believe Free Fire MAX is to maximize the audience base of the Free Fire
franchise, and potentially to compete more directly with PUBG. We see this
as a sensible move to further solidify the network effects of Free Fire, which
has in 2Q21 crossed one billion cumulative downloads globally on Google
Play. Sea believes Free Fire is the first mobile battle royale game to have
achieved such a feat.
0
5
10
15
20
25
3Q
17
4Q
17
1Q
18
2Q
18
3Q
18
4Q
18
1Q
19
2Q
19
3Q
19
4Q
19
1Q
20
2Q
20
3Q
20
4Q
20
1Q
21
USD
September 10, 2021 15
Sea Ltd
Other games/ pipeline
Other games that Garena has published include Arena of Valor, Call of Duty
Mobile, Speed Drifter, League of Legends, and most recently Moonlight
Blade Mobile.
Moonlight Blade Mobile is a Wuxia-themed massively multiplayer online
role-playing (MMORPG) game that was launched in Jun-21. It is currently
available in Taiwan.
Arena of Valor is a 5v5 multiplayer online battle arena (MOBA) mobile game
that was designed by Tencent Games. In 2017, Garena Launched Arena of
Valor in Southeast Asia. As at May 2021, Arena of Valor has 7.41 million MAU
in Southeast Asia. Arena of Valor is also ranked 16 in Southeast Asia for
mobile games with the most MAU.
Call of Duty Mobile is a free to play shooter mobile game that was developed
by TiMi Studios (Tencent Subsidiary). In 2019, Garena launched Call of Duty
Mobile in Southeast Asia, Hong Kong and Taiwan. As at May 2021, Call of
Duty Mobile has 3.2 million MAU in Southeast Asia. Call of Duty Mobile is
also ranked 82 in Southeast Asia for mobile games with the most MAU.
Speed Drifter is a multiplayer online kart racing mobile game developed by
TiMi Studios. In 2011, Garena launched Speed Drifter in Southeast Asia. As
at May 2021, Speed Drifter has 1.64 million MAU worldwide.
League of Legends is currently the only PC game in Garena’s website.
League of Legends is a multiplayer online battle arena video game that was
developed by Riot Games. Garena launched League of Legends in Southeast
Asia, Taiwan, Hong Kong and Macau. In May 2021, League of Legends is the
2nd most popular game worldwide (According to NewZoo) with 115 million
MAU.
Tencent Game Pipeline
Tencent announced 60 new games in their Annual Games Conference 2021.
Fig 24 below illustrates some of the popular games that were announced in
the conference.
Fig 24: Tencent game pipeline
Title Developer Date
Metal Slug Mobile Timi Studios (Tencent) TBC
Handmade Planet Tencent Dec-21
Digimon (New Century) Qixia Interactive Entertainment & Bandai
Namco
TBC
One Punch Mobile Morefun Studio TBC
The Westward Burning Soul Kuaishou Echo Game Studio 2022
Crossfire HD Smilegate Jun-21
Story of Seasons Mobile Next Studios (Tencent) TBC
Mobile Game based on Uncharted Waters IP and Nobunga's Ambition IP Koei Tamco TBC
Project: Fighter More Fun Studio (Tencent) TBC
CODE: HUA Lightspeed & Quantum Studio (Tencent) TBC
Tetris Adventure Changyou TBC
Dynasty Warriors: Hegemony CMGE / TCI Play Jun-21
Unchartered Waters: Lord of the Sea Koei Tecmo TBC
Our Planet - TBC
Shin Kaku Gi Kou Kazuma Kamachi TBC
Ylands - TBC
Source: Tencent
September 10, 2021 16
Sea Ltd
4.2 Shopee – Top e-commerce marketplace in ASEAN, driven
by mobile first and hyper-localisation strategy
Overview
Shopee is a highly scalable, mobile-first, social-focused B2C e-commerce
platform. Shopee was launched in Jun-15 across all seven of its markets in
GSEA (Indonesia, Taiwan, Vietnam Thailand, Philippines, Malaysia, and
Singapore) and was introduced in Brazil in Oct 2019. According to App Annie,
Shopee continued to be the top shopping app across Southeast Asia and
Taiwan by average MAU and total time spent on Android in 1Q21. Meanwhile,
according to Frost and Sullivan, Shopee was the largest e-commerce
platform in GSEA in 2020 by GMV and total orders. Fig 25 shows that Shopee
was the e-commerce platform that garnered the highest number of visits in
Southeast Asia in 2020.
Fig 25: Shopee garnered the most visits among e-commerce platforms in Southeast Asia (2020).
Source: iPrice, SimilarWeb, Appsflyer
Business model
Sellers on the Shopee platform range from individuals, SMEs, and even large
brands. Each seller has a storefront which they list their products,
communicate with buyers and complete transactions.
Sea mainly monetizes Shopee through i) advertising services to sellers, ii)
transaction-based fees; and iii) value-added services. Shopee also earns
revenue from the direct sell on of some products. These products are
purchased from manufacturers or other third parties
Shopee’s marketplace model allows it to scale rapidly. Aside, Shopee also
implements many social and gamification elements which it believes helps
drive organic user acquisition, user retention and time spent on the
platform. From a product category perspective, Shopee focuses on long-tail,
high-margin categories, such as fashion, health and beauty, home and living
and baby products. That said, Shopee is also diversifying their range of
products.
As the Shopee marketplace is largely 3rd party (3P), Shopee faces minimal
inventory risk. However, a portion of Shopee’s revenues is also earned
through sales of goods that Shopee purchases from manufacturers or 3rd
281.4
137.2
88.9
35.7
22.5
19.3
14.3
8.8
7.3
0.0 50.0 100.0 150.0 200.0 250.0 300.0
Shopee
Lazada
Tokopedia
Bukalapak
Tiki
Blibli
Sendo
Bach hoa xanh
FPT Shop
millions of visits
September 10, 2021 17
Sea Ltd
parties and sells these to users under Shopee’s official store to meet buyers
demand for such products.
Fig 26: Shopee’s GMV and take rate have been gradually increasing. We project this will increase further.
Source: Company, Maybank Kim Eng
Growth initiatives and strategy
The logistics service providers that Shopee cooperates with include the
largest and most reliable ones in their markets. This is important given that
these markets have terrain that are difficult to navigate or have
underdeveloped infrastructure. Shopee also provides last-mile delivery
services, Shopee Xpress to complement its current capacity of 3PLs in some
of the metro areas of its markets. In certain markets, Shopee has also made
strategic investments into local logistics partners to strengthen its logistics
services.
The Shopee platform has a number of innovative social and gamification
features, such as “Shopee Coins”, “Shopee Live”, “Shopee Games” and
“Shopee Feed”. This is a strategy to enhance user engagement and
accelerate user growth. For example, users can win Shopee Coins from
making purchases, playing mini-games or even inviting friends to
participate. These coins can then be used to offset the cost of purchasing
goods from eligible sellers.
One of Shopee’s key growth strategies is by incurring the required sales and
marketing expenses ahead of its monetisation efforts. As such, we continue
to expect sales and marketing expenses to grow in coming years as Shopee
expands its presence in existing and new markets. This is further discussed
in the Financials section.
Industry growth overview
In ASEAN and Latin America, e-commerce growth prospects remain positive.
In ASEAN-6, while penetration is already high (ranging from 80% in Singapore
to 87% in Indonesia), share of e-commerce sales of total retail sales remains
nascent relative to China and the US (Fig 27). Meanwhile, penetration in
Brazil/ Latin America and Caribbean were 4.5%/4.7% in 2020 (Fig 28). This
compares to more matured markets, such as US, Europe, and China at 27%
(1Q20)/53% (2019)/ 25% (2020) respectively, according to Statista and
various other sources.
0
2
4
6
8
10
12
0
5,000
10,000
15,000
20,000
25,000
30,000
35,000
1Q
17
2Q
17
3Q
17
4Q
17
1Q
18
2Q
18
3Q
18
4Q
18
1Q
19
2Q
19
3Q
19
4Q
19
1Q
20
2Q
20
3Q
20
4Q
20
1Q
21
2Q
21
3Q
21E
4Q
21E
1Q
22E
2Q
22E
3Q
22E
4Q
22E
1Q
23E
2Q
23E
3Q
23E
4Q
23E
%USDm
Gross GMV Revenue Take rate
September 10, 2021 18
Sea Ltd
Fig 27: ASEAN e-commerce share of total retail sales is still low compared to China and US
Source: Euromonitor
Fig 28: E-commerce penetration in Latin America is still nascent
Source: Statista
Further, we believe Covid-19 has accelerated the growth potential of e-
commerce, as the e-commerce trend may now be perceived as a new
normal. Fig 29 and 30 shows that across ASEAN-6, people do not just spend
more time online a day post-Covid-19 lockdowns than pre-lockdowns, but
also use more e-commerce too.
Fig 29: Number of hours spent online a day, before, during and after Covid-19 lockdowns
Source: Google Temasek Bain (2020)
Fig 30: Usage of e-commerce before, during and after Covid-19 lockdowns (indexed)
Source: Google Temasek Bain (2020)
From a perspective of GMV, Indonesia is expected to continue to be the
most significant market, due to its size (2020: USD32b, 52% of ASEAN-6 e-
commerce GMV) and rapid growth rate (2020-2025 CAGR: 21%). That said,
growth rates are also expected to remain attractive across other ASEAN
markets, at a 2020-25 CAGR of 21-33%, according to Google, Temasek and
Bain (see Fig 31).
4
20
14
6
22
15
9
27
20
0
5
10
15
20
25
30
ASEAN Mainland China US
%
2018 2019 2020
5.5
4.5
3.1
4.7 4.7
0
1
2
3
4
5
6
Mexico Brazil Argentina Other LatAmcountries
andCaribbean
LatAm andCaribbean
%
0
1
2
3
4
5
6
AcrossAsean-6
Indonesia Malaysia Philippines Singapore Thailand Vietnam
Hours
Before During After
0
0.5
1
1.5
2
2.5
Indonesia Malaysia Philippines Singapore Thailand Vietnam
Before During After
September 10, 2021 19
Sea Ltd
Fig 31: GMV by ASEAN countries, including 2025 projections and 2019-25 CAGR
Source: Google, Temasek, Bain
Competition
Shopee faces formidable competition in the markets it competes in, in
particular Lazada (Singapore, Malaysia, Thailand), Tokopedia and
Bukalapak in Indonesia, and MercadoLibre (Latin America).
Despite this, Sea managed to become the top e-commerce platform in
Southeast Asia. Fig 32 shows that as at 2Q21, Shopee had a dominant lead
in terms of site visits among e-commerce players in Singapore, Malaysia,
Thailand, Philippines, and Vietnam. At the same time, it was a close second
to Tokopedia in Indonesia.
Fig 32: Monthly web visits of e-commerce sites in 2Q21 (Vietnam: 1Q21). Shopee has a dominant lead in SG, MY, TH, PH, and VN, and is a close second in Indonesia.
Source: iPrice, SimilarWeb, App Annie
We believe these were a result of Shopee’s strengths, which include:
Shopee’s localisation in different markets
Shopee’s business model focuses on hyper-localisation activities in order to
build brand loyalty. To ensure that the Shopee app is catered to every
country, Shopee develops a customised standalone mobile app for different
markets. Furthermore, Shopee also sets up local teams in each market to
serve both its sellers and customers. This allows Shopee to formulate
localisation strategies at different levels, such as launching customised
product selection, service portals and marketing campaigns in different
markets.
Shopee’s aggressive marketing strategies
In order to capture a large buyer and seller base, Shopee had to rely hugely
on their marketing campaigns. Two marketing methods that are highly
important to Shopee’s success are influencer marketing and monthly
promotions.
21% 22%
33%
17%
30%
15%
0%
5%
10%
15%
20%
25%
30%
35%
0102030405060708090USDb
2019 2020 2025 2020-25 CAGR (RHS)
September 10, 2021 20
Sea Ltd
Shopee uses major social media influencers to promote the Shopee brand.
The most popular Shopee influencers thus far are Kpop group Blackpink and
football superstar Cristiano Ronaldo. Cristiano Ronaldo is also currently the
most followed influencer on Instagram. Other than employing global
superstars, Shopee also rely heavily on local celebrities to promote their
brand, which is in line with their hyper-localisation strategy. Some
examples of local celebrities are, comedians Mark Lee and Phua Chu Kang
in Singapore, singer Son Tung MTP in Vietnam, Thai Kpop idol Bambam in
Thailand, boxer Manny Pacquiao and actress Anne Curtis in Philippines and
singer Nella Kharisma in Indonesia.
Other than influencer marketing, Shopee also regularly launch sales events.
Shopee launches monthly sales events such as 1.1, 2.2, 3.3,…, 11.11 and
12.12. These events usually generate large sales for Shopee.
Mobile first approach
Currently, over 95% of Shopee orders are made through mobile devices.
When Shopee first entered the e-commerce market, it recognised that
mobile platforms are the future of e-commerce. This is due to the relative
accessibility of mobile vs. desktops and other methods of going online, from
the perspectives of ease of use, portability, and economic accessibility. For
instance, in Indonesia, one of Shopee’s key markets, mobile penetration is
63.4% as at Jun-21, contrasting desktop at 35.6%, according to Statcounter.
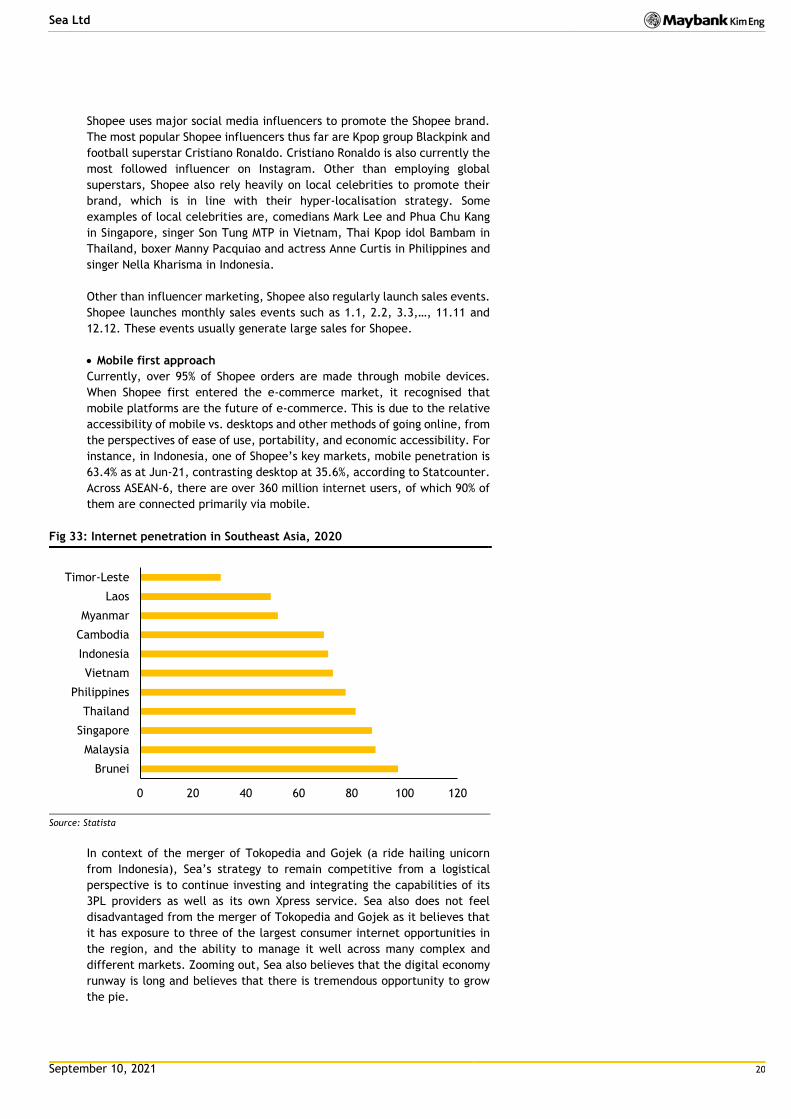
Across ASEAN-6, there are over 360 million internet users, of which 90% of
them are connected primarily via mobile.
Fig 33: Internet penetration in Southeast Asia, 2020
Source: Statista
In context of the merger of Tokopedia and Gojek (a ride hailing unicorn
from Indonesia), Sea’s strategy to remain competitive from a logistical
perspective is to continue investing and integrating the capabilities of its
3PL providers as well as its own Xpress service. Sea also does not feel
disadvantaged from the merger of Tokopedia and Gojek as it believes that
it has exposure to three of the largest consumer internet opportunities in
the region, and the ability to manage it well across many complex and
different markets. Zooming out, Sea also believes that the digital economy
runway is long and believes that there is tremendous opportunity to grow
the pie.
0 20 40 60 80 100 120
Brunei
Malaysia
Singapore
Thailand
Philippines
Vietnam
Indonesia
Cambodia
Myanmar
Laos
Timor-Leste
September 10, 2021 21
Sea Ltd
4.3 SeaMoney – Pursuing growth in digital financial services
Overview
While Sea began offering digital financial services in 2014, it was only in
4Q19 that it introduced SeaMoney as the overall brand for such services.
According to IDC, SeaMoney is a leading digital financial services provider
in the region in 2020.
SeaMoney offerings can be segmented into two components, i.e. payments
and financing. On the payments side, Seamoney provides mobile wallet
solutions where users can make online payments, top up their wallets,
transfer and withdraw funds, and make payments with offline merchants.
The wallet is known as ShopeePay in Indonesia, Malaysia, the Philippines,
and Singapore, while in Thailand and Vietnam, it is branded as AirPay. Aside
implementing the e-wallet on Sea’s own platforms, SeaMoney has been
expanding the e-wallet’s use cases across 3rd party merchants both online
and offline. Current merchants include telcos, entertainment outlets (e.g.
movie theatres, concert venues, etc), food delivery service providers,
credit card issuers, banks, insurance companies and car leasing companies.
As at 2Q21, SeaMoney has 32.7m quarterly paying users (QPU), which is a
growth of 110% YoY. Much of this growth stems from Indonesia. In the same
period, total payment volume rose 156.3% YoY to USD4.1b, and segment
revenue surged nearly 659% YoY to USD89m.
The other part of SeaMoney’s business is consumer financing. As at FY20,
Sea has obtained the necessary approvals to provide loans in Indonesia,
Thailand, Philippines, and Malaysia.
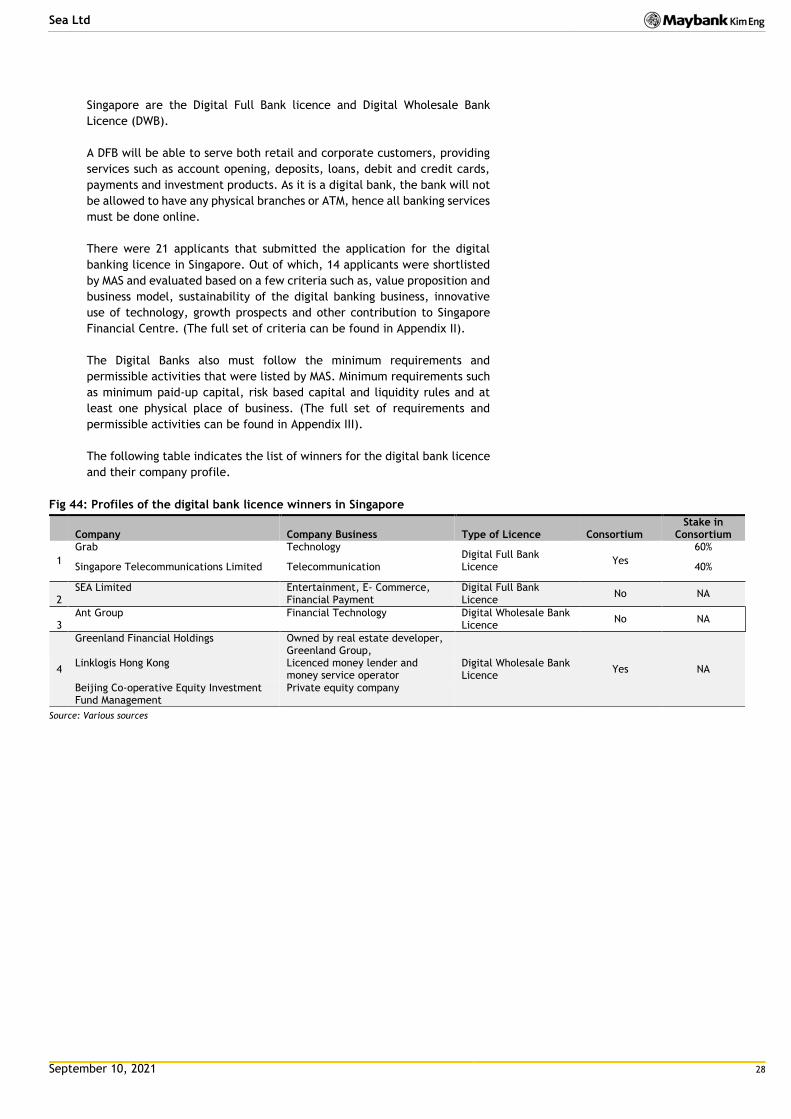
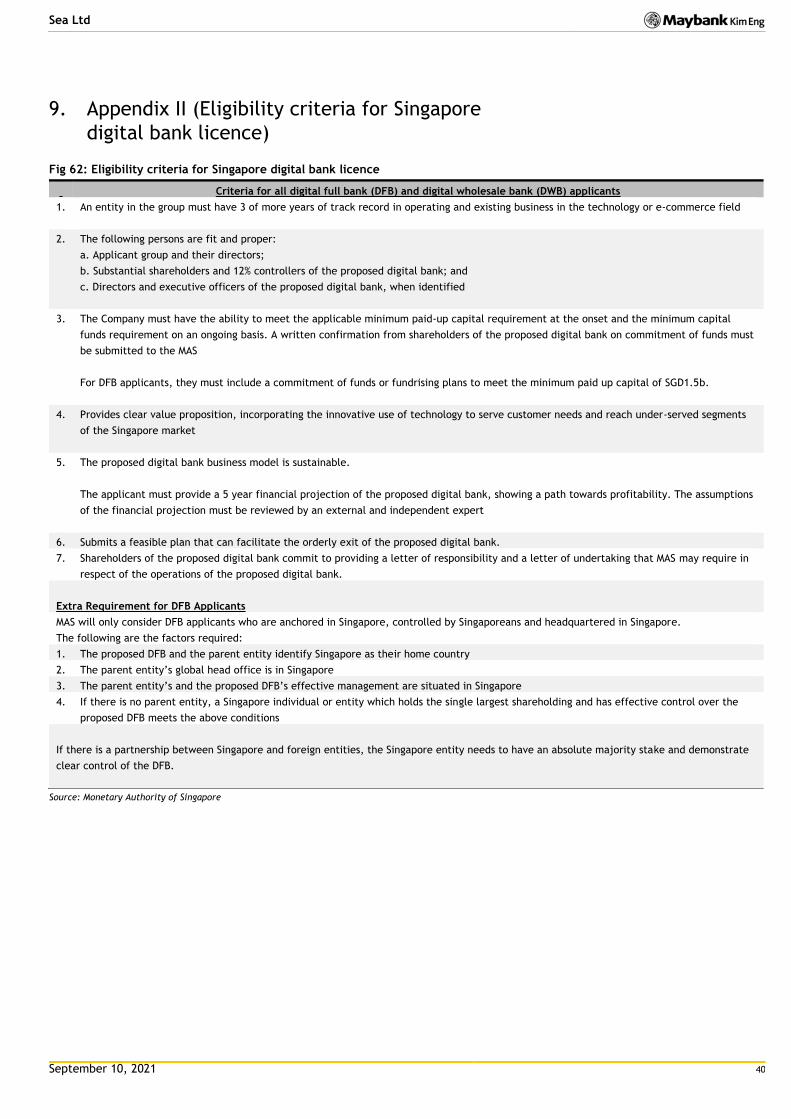
In Dec-2020, MAS announced that Sea’s Singapore subsidiary was among two
applicants that are to be awarded a digital full bank licence. This would
eventually allow Sea to provide retail customers with services such as
opening accounts, deposits, and issuing debit and credit cards. With the
licence, Sea can also serve corporate customers. The key difference
between a digital bank licence vs. a traditional one is that all services will
be done online. Sea has also acquired a controlling interest in a local
commercial bank in Indonesia in 2020.
Sea believes that SeaMoney’s long-term addressable opportunity is highly
significant. For example, in Malaysia, of 1.7m eBelia applicants (eBelia is a
government financial assistance program to assist youths), close to 1m
applicants chose to claim their credits using SeaMoney’s mobile wallet over
other wallets. Sea attributes the rapidly rising popularity of its wallet to its
more than 750,000 touchpoints in Malaysia, and the network effects of the
wallet driving adoption in the region.
Business model
Sea monetizes SeaMoney by charging commissions to 3rd party merchants
for their mobile wallet services, and by earning interest from borrowers
from the consumer credit business. Marketing of SeaMoney’s offerings is
mainly through offline advertisements and in-app advertisements through
the Shopee app.
September 10, 2021 22
Sea Ltd
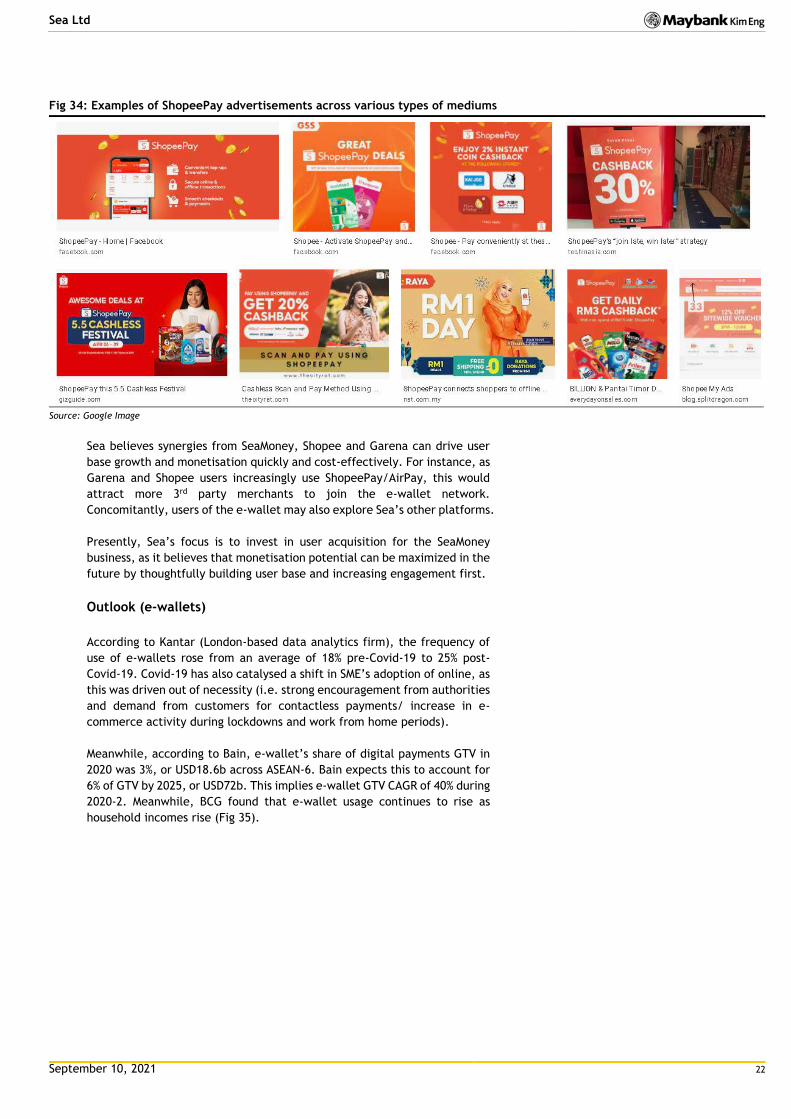
Fig 34: Examples of ShopeePay advertisements across various types of mediums
Source: Google Image
Sea believes synergies from SeaMoney, Shopee and Garena can drive user
base growth and monetisation quickly and cost-effectively. For instance, as
Garena and Shopee users increasingly use ShopeePay/AirPay, this would
attract more 3rd party merchants to join the e-wallet network.
Concomitantly, users of the e-wallet may also explore Sea’s other platforms.
Presently, Sea’s focus is to invest in user acquisition for the SeaMoney
business, as it believes that monetisation potential can be maximized in the
future by thoughtfully building user base and increasing engagement first.
Outlook (e-wallets)
According to Kantar (London-based data analytics firm), the frequency of
use of e-wallets rose from an average of 18% pre-Covid-19 to 25% post-
Covid-19. Covid-19 has also catalysed a shift in SME’s adoption of online, as
this was driven out of necessity (i.e. strong encouragement from authorities
and demand from customers for contactless payments/ increase in e-
commerce activity during lockdowns and work from home periods).
Meanwhile, according to Bain, e-wallet’s share of digital payments GTV in
2020 was 3%, or USD18.6b across ASEAN-6. Bain expects this to account for
6% of GTV by 2025, or USD72b. This implies e-wallet GTV CAGR of 40% during
2020-2. Meanwhile, BCG found that e-wallet usage continues to rise as
household incomes rise (Fig 35).
September 10, 2021 23
Sea Ltd
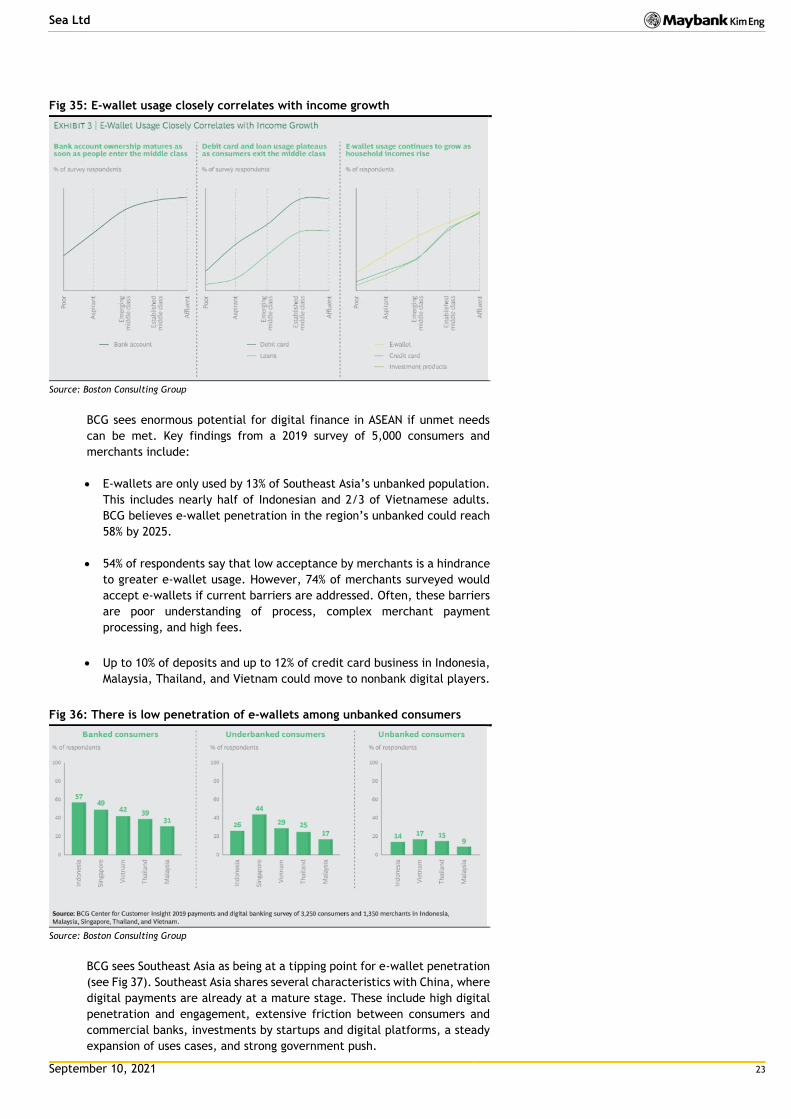
Fig 35: E-wallet usage closely correlates with income growth
Source: Boston Consulting Group
BCG sees enormous potential for digital finance in ASEAN if unmet needs
can be met. Key findings from a 2019 survey of 5,000 consumers and
merchants include:
E-wallets are only used by 13% of Southeast Asia’s unbanked population.
This includes nearly half of Indonesian and 2/3 of Vietnamese adults.
BCG believes e-wallet penetration in the region’s unbanked could reach
58% by 2025.
54% of respondents say that low acceptance by merchants is a hindrance
to greater e-wallet usage. However, 74% of merchants surveyed would
accept e-wallets if current barriers are addressed. Often, these barriers
are poor understanding of process, complex merchant payment
processing, and high fees.
Up to 10% of deposits and up to 12% of credit card business in Indonesia,
Malaysia, Thailand, and Vietnam could move to nonbank digital players.
Fig 36: There is low penetration of e-wallets among unbanked consumers
Source: Boston Consulting Group
BCG sees Southeast Asia as being at a tipping point for e-wallet penetration
(see Fig 37). Southeast Asia shares several characteristics with China, where
digital payments are already at a mature stage. These include high digital
penetration and engagement, extensive friction between consumers and
commercial banks, investments by startups and digital platforms, a steady
expansion of uses cases, and strong government push.
September 10, 2021 24
Sea Ltd
Fig 37: Many ASEAN countries are at the tipping point of e-wallet adoption (red bars indicate SeaMoney’s presence)
Source: Boston Consulting Group
On the other hand, BCG believes that e-wallet providers will have to
overcome several hurdles to be winners in this space, which include:
Making usage ubiquitous: BCG found that 57% of banked respondents use
e-wallets, while only 14% of the unbanked respondents use e-wallets.
This suggests a vastly underserved market. BCG estimates that by 2025,
about 35% of e-wallet purchases would be from small ticket purchases,
a sevenfold increase from what it is now.
Increasing merchant acceptance: One of the current pains in why
merchants are reluctant to accept e-wallet payments is due to
complexity of the process and inconvenience. However, 74% of merchant
respondents expressed willingness to accept e-wallets in the future if
these pain points are resolved.
Increasing customer loyalty and value: 56% of respondents cite
promotional discounts and cash back as a key factor across Southeast
Asia – suggesting low customer loyalty. BCG found that 60% of urban
customers would continue to use e-wallets even if providers did not offer
promotions and discounts. However, this varied by markets (i.e. 76% of
Thais agreed, while only 30% of Singaporeans did).
The e-wallet space is extremely fragmented in Southeast Asia, and
competition is strong. We expect consolidation, as the current model of
customer acquisition through financial incentives with no fees is unlikely to
be sustainable, especially for small independent players. In this regard,
ultimate winners in this space may prove to be i) regional tech disruptors
that are financially well-backed and/ or ii) disruptors that form alliances
with incumbents such as banks.
0.7 1.4 1.42.6
4.96.5 6.6
7.98.8 9.5 9.5 10 10.6 10.6 10.7
15.917.1
21.5
35.2
0
5
10
15
20
25
30
35
40
%
Nascent Adopters Tipping pointMature
September 10, 2021 25
Sea Ltd
Outlook (digital bank and broader digital financial services)
While Sea has been awarded a digital bank licence in Singapore, we believe
this is only a first step to a much larger grand vision, i.e. to tap the growth
opportunity of the underbanked in ASEAN.
For instance, in an article from “The Edge” on 17-Jun-21, it is believed that
Sea and YTL are expected to form a consortium to bid for a digital banking
licence in Malaysia. Malaysia is expected to issue up to five digital banking
licences, and the article also named Petronas, Genting, Grab and the
Sarawak government as potential bidders for the licence.
This is because of the relative advantages that consumer technology
platforms like Sea have over traditional institutions like banks in courting
the underbanked. According to Google, Temasek and Bain, these
advantages are leaner cost structures supported by shared distribution for
a wide suite of products, no outdated technology systems, access to rich
data sets and digital native customer engagement. In contrast, established
players have struggled historically and have been unable to serve this
segment well, as costs are too high, and the absence of credit history has
limited risk appetite to this segment.
In this regard, Indonesia and Vietnam appear the most promising markets,
due to i) a large underbanked population (As at 2018: Indonesia - 47m,
Vietnam – 7m) (Fig 38 & 39), and ii) new entrants have successfully gained
consumers’ trust over established players (Fig 40). It is noteworthy that Sea
gained full control over Indonesia’s Bank Kesejahteraan Ekonomi (or more
commonly known as Bank BKE) in early-2021 to accelerate its growth in
digital financial services. Following the acquisition, Bank BKE has been
renamed as SeaBank and among its products include digital savings as well
as corporate and commercial credit. Indonesia’s financial regulator, the
OJK, has also recently introduced new rules to speed up developments in
the digital banking industry. These include near full ownership of local
lenders and the reduction of red tape.
Fig 38: More than 70% of Southeast Asia’s 400m population is either underbanked or unbanked (2018 data)
Source: Google, Temasek, Bain (2019)
Fig 39: The underbanked in Indonesia and Vietnam account for c.55% of Southeast Asia’s underbanked population of 98m
Source: Google, Temasek, Bain (2019), Maybank Kim Eng
50
215 18
5165 69
24
38
4045
2613 10
26
6045 37
23 22 21
0102030405060708090
100%
Unbanked Underbanked Banked
2 925
47
9 7
020406080
100120140160180200
'm people
Unbanked Underbanked Banked
September 10, 2021 26
Sea Ltd
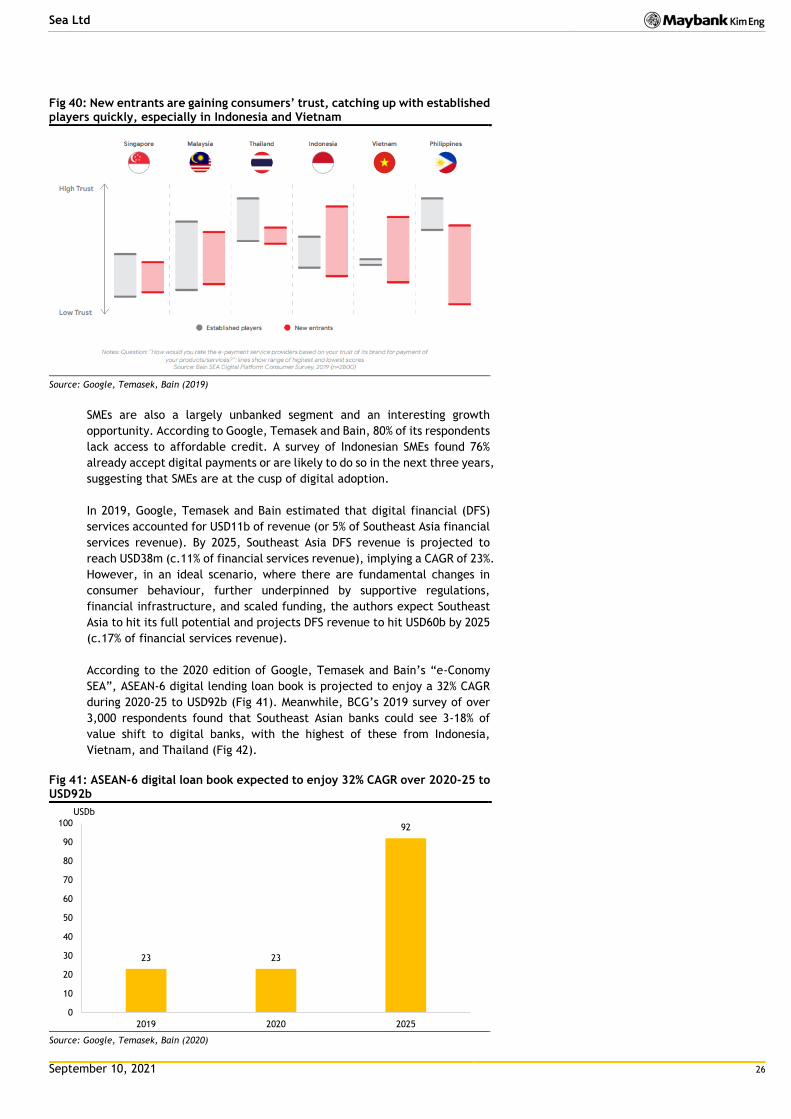
Fig 40: New entrants are gaining consumers’ trust, catching up with established players quickly, especially in Indonesia and Vietnam
Source: Google, Temasek, Bain (2019)
SMEs are also a largely unbanked segment and an interesting growth
opportunity. According to Google, Temasek and Bain, 80% of its respondents
lack access to affordable credit. A survey of Indonesian SMEs found 76%
already accept digital payments or are likely to do so in the next three years,
suggesting that SMEs are at the cusp of digital adoption.
In 2019, Google, Temasek and Bain estimated that digital financial (DFS)
services accounted for USD11b of revenue (or 5% of Southeast Asia financial
services revenue). By 2025, Southeast Asia DFS revenue is projected to
reach USD38m (c.11% of financial services revenue), implying a CAGR of 23%.
However, in an ideal scenario, where there are fundamental changes in
consumer behaviour, further underpinned by supportive regulations,
financial infrastructure, and scaled funding, the authors expect Southeast
Asia to hit its full potential and projects DFS revenue to hit USD60b by 2025
(c.17% of financial services revenue).
According to the 2020 edition of Google, Temasek and Bain’s “e-Conomy
SEA”, ASEAN-6 digital lending loan book is projected to enjoy a 32% CAGR
during 2020-25 to USD92b (Fig 41). Meanwhile, BCG’s 2019 survey of over
3,000 respondents found that Southeast Asian banks could see 3-18% of
value shift to digital banks, with the highest of these from Indonesia,
Vietnam, and Thailand (Fig 42).
Fig 41: ASEAN-6 digital loan book expected to enjoy 32% CAGR over 2020-25 to USD92b
Source: Google, Temasek, Bain (2020)
23 23
92
0
10
20
30
40
50
60
70
80
90
100
2019 2020 2025
USDb
September 10, 2021 27
Sea Ltd
Fig 42: Digital loan book expected to enjoy 32% CAGR over 2020-25 to USD92b
3 Ant Group Financial Technology Digital Wholesale Bank
Licence No NA
4
Greenland Financial Holdings Owned by real estate developer, Greenland Group,
Digital Wholesale Bank Licence
Yes NA Linklogis Hong Kong Licenced money lender and
money service operator
Beijing Co-operative Equity Investment Fund Management
Private equity company
Source: Various sources
September 10, 2021 29
Sea Ltd
5. Financials
5.1 P&L
We project revenue growth of 102%/50%/34% for FY21/22/23E respectively,
driven by broad-based growth across all segments. During the same period,
we are forecasting Sea to break even by FY23E.
On a segmental basis, we expect Digital Entertainment revenue to grow
75%/29%/17% in FY21-23E, driven by low-to-mid single digit QoQ user
growth, while our ARPPU assumptions are around USD12.8-13.4 per quarter
(1Q20-1Q21 range: USD13.9-14.4). At the same time, we project percentage
of paying users to gradually hit 13.5% by 4Q23, from 12.8% in 2Q21. Factors
that drive upside to our forecasts include i) stronger than expected user
and/or paying user growth – if the game gains better than expected traction
in fast growing markets (e.g. India, Latin America, or other new markets),
and/or ii) stronger than expected ARPPU growth.
Fig 45: Digital entertainment QAU and QPU
Source: Company, Maybank Kim Eng
Fig 46: Digital entertainment ARPPU
Source: Company, Maybank Kim Eng
Meanwhile, we expect E-commerce and other services revenue to grow
135%/61%/39% in FY21-23E, driven by rising GMV and improving e-
commerce take rates for the e-commerce business, as well as rising
quarterly paying users and transaction payment volume per user (TPVPU)
for digital financial services. For e-commerce, Sea believes that over a
longer horizon, take rates can further improve to high single digits or even
low-double digits. We currently forecast e-commerce take-rate of 10.3% in
2023E.
Fig 47: E-commerce GMV, revenue and take rate
Source: Company, Maybank Kim Eng
Fig 48: Digital financial services revenue and take rate
Source: Company, Maybank Kim Eng
0
2
4
6
8
10
12
14
16
0
200
400
600
800
1000
1200
1Q
17
3Q
17
1Q
18
3Q
18
1Q
19
3Q
19
1Q
20
3Q
20
1Q
21
3Q
21E
1Q
22E
3Q
22E
1Q
23E
3Q
23E
%millions
QAU QPU % of paying users
0
5
10
15
20
25
3Q
17
1Q
18
3Q
18
1Q
19
3Q
19
1Q
20
3Q
20
1Q
21
3Q
21E
1Q
22E
3Q
22E
1Q
23E
3Q
23E
USD
0
2
4
6
8
10
12
0
5,000
10,000
15,000
20,000
25,000
30,000
35,000
1Q
17
3Q
17
1Q
18
3Q
18
1Q
19
3Q
19
1Q
20
3Q
20
1Q
21
3Q
21E
1Q
22E
3Q
22E
1Q
23E
3Q
23E
%USDm
Gross GMV Revenue Take rate
0.0
0.5
1.0
1.5
2.0
2.5
0
50
100
150
200
1Q
20
2Q
20
3Q
20
4Q
20
1Q
21
2Q
21
3Q
21E
4Q
21E
1Q
22E
2Q
22E
3Q
22E
4Q
22E
1Q
23E
2Q
23E
3Q
23E
4Q
23E
%USDm
Revenue Take rate
September 10, 2021 30
Sea Ltd
We forecast group gross margin of 37.4%/38.9%/39.9% throughout FY21-23E,
as we expect economies of scale on the back of revenue growth in digital
entertainment and e-commerce (See Fig 49).
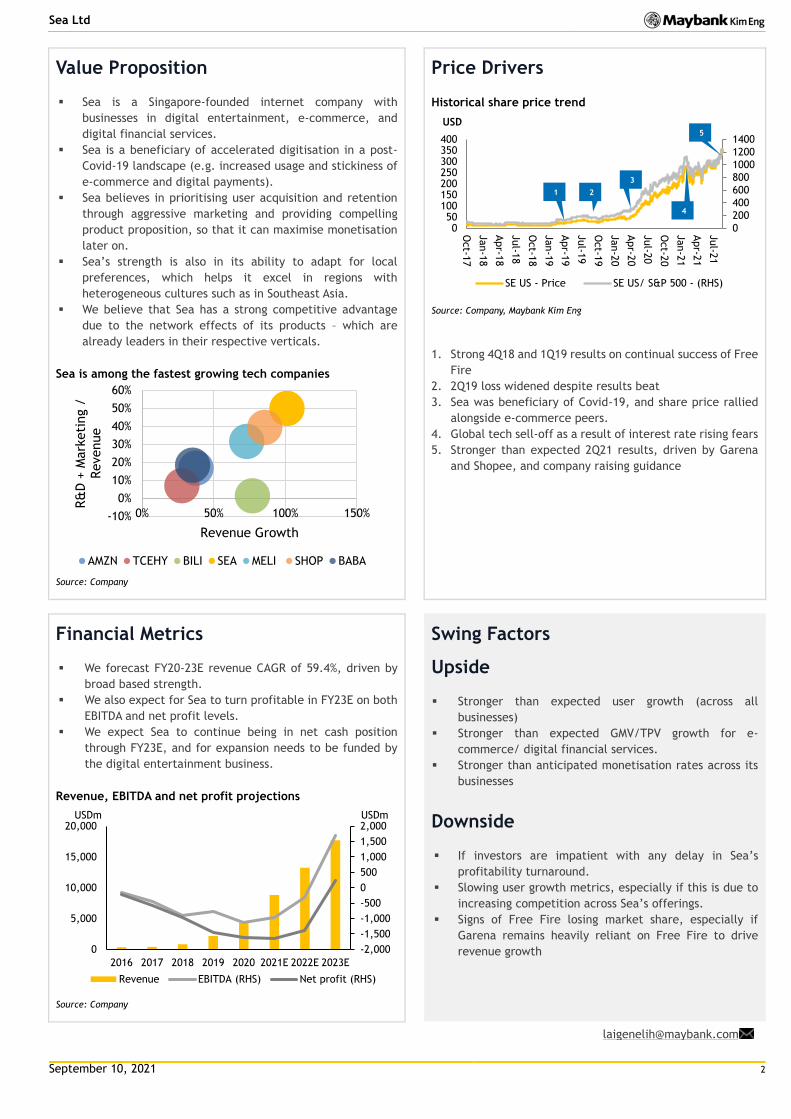
We expect sales & marketing and R&D expenses to remain elevated,
growing 83%/27%/12% in FY21-23E, as Sea continues to invest in e-
commerce and digital financial services. In Fig 53, we observe that while
Sea has one of the largest sales & marketing plus R&D as a percentage of
revenue among large gaming and e-commerce companies, Sea is also among
the fastest growing.
Fig 49: Gross margin profile
Source: Company, Maybank Kim Eng
Fig 50: Adjusted EBITDA margin profile
Source: Company
Fig 51: Sales and marketing expenses
Source: Company, Maybank Kim Eng
Fig 52: R&D expenses
Source: Company, Maybank Kim Eng
-200
-150
-100
-50
0
50
100
1Q
17
2Q
17
3Q
17
4Q
17
1Q
18
2Q
18
3Q
18
4Q
18
1Q
19
2Q
19
3Q
19
4Q
19
1Q
20
2Q
20
3Q
20
4Q
20
1Q
21
2Q
21
FY21E
FY22E
FY23E
%
Group
Digital entertainment
E-commerce and other services
-500
-400
-300
-200
-100
0
100
2001Q
18
2Q
18
3Q
18
4Q
18
1Q
19
2Q
19
3Q
19
4Q
19
1Q
20
2Q
20
3Q
20
4Q
20
1Q
21
%
Group Digital entertainment
E-commerce Digital financial services
0
10
20
30
40
50
60
70
80
0
500
1000
1500
2000
2500
3000
3500
4000
4500
2017 2018 2019 2020 2021E 2022E 2023E
%USDm
S&M (Others)
S&M (E-commerce)
S&M (DE)
S&M as a % or revenue (RHS)
0
1
2
3
4
5
6
7
8
9
0
100
200
300
400
500
600
700
800
900
1000
2017 2018 2019 2020 2021E 2022E 2023E
%USDm
R&D R&D as a % of revenue (RHS)
September 10, 2021 31
Sea Ltd
Fig 53: Sea’s marketing and R&D enables revenue growth. Over time, we anticipate that converted users will be stickier – which provides better monetization opportunities
Source: Companies
Fig 54: Key assumptions driving P&L forecasts
Drivers 2019 2020 2021E 2022E 2023E Comments Digital Entertainment Bookings (USDm) 1,767.4 3,186.4 4,694.0 5,547.1 6,480.9 Revenue (USDm) 1,136.0 2,016.0 3,523.4 4,542.0 5,307.1 Change in deferred revenue (USDm) 1,170.4 1,170.7 1,005.1 1,173.8 Average QAU (m) 314.5 521.2 707.9 816.5 932.0 % change in QAU 66% 36% 15% 14% Average QPU (m) 27.3 56.0 89.9 107.5 124.1 QPU as a % of QAU 8.7% 10.7% 12.7% 13.2% 13.3% Assuming marginally rising share of
QPU vs QAU Booking per QPU (USD) 64.7 56.9 52.2 51.6 52.2 Revenue per QPU (USD) 41.6 36.0 39.2 42.2 42.8 Factoring gradual improvement in
Take rate (%) 4.8% 6.1% 7.5% 8.9% 10.3% Factoring improving take rate
Revenue (USDm) 834.3 2167.1 4826.0 8203.8 11680.7 Sales of goods Gross revenue (USDm) 216.7 582.4 1133.2 1989.0 3037.0 As a % of e-commerce revenues 26% 27% 23% 24% 26% Assuming sales of goods is a relatively
tight % of e-commerce revenues Digital financial services Average QPU (m) na 16.8 35.8 62.4 86.5 Average TPV per user (USD) na 455.2 510.2 524.5 545.8 TPV (USDb) na 7.8 18.2 32.8 47.3 Take rate na 0.8% 1.5% 1.4% 1.3% Revenue (USDm) na 60.8 282.1 444.2 629.9 Gross margin 27.8% 30.8% 37.4% 38.9% 39.9% Digital entertainment 61.6% 65.2% 71.5% 76.7% 78.5% Factoring continued economies of
scale
E-commerce and other services -10.3% 1.9% 17.4% 23.4% 29.1% Factoring increasing scale from e-commerce
Cost of goods sold -4.8% 0.3% 6.6% 6.9% 7.3% Expecting limited ability to expand margins as Shopee is a middleman
Other P&L items as a % of revenue Other operating income 0.7% 4.3% 4.4% 2.0% 2.0% Sales and marketing expenses 44.6% 41.8% 37.8% 30.9% 23.8% Expected to grow at a slower pace
than revenue growth General and admin expenses 17.7% 15.0% 11.3% 10.2% 8.0% R&D expenses 7.2% 8.1% 7.3% 6.2% 5.2% Expected to grow at a slower pace
than revenue growth
Source: Company, Maybank Kim Eng
-10%
0%
10%
20%
30%
40%
50%
60%
0% 20% 40% 60% 80% 100% 120%R&
D +
Mark
eti
ng /
Revenue
Revenue GrowthAMZN TCEHY BILI SEA MELI SHOP BABA
September 10, 2021 32
Sea Ltd
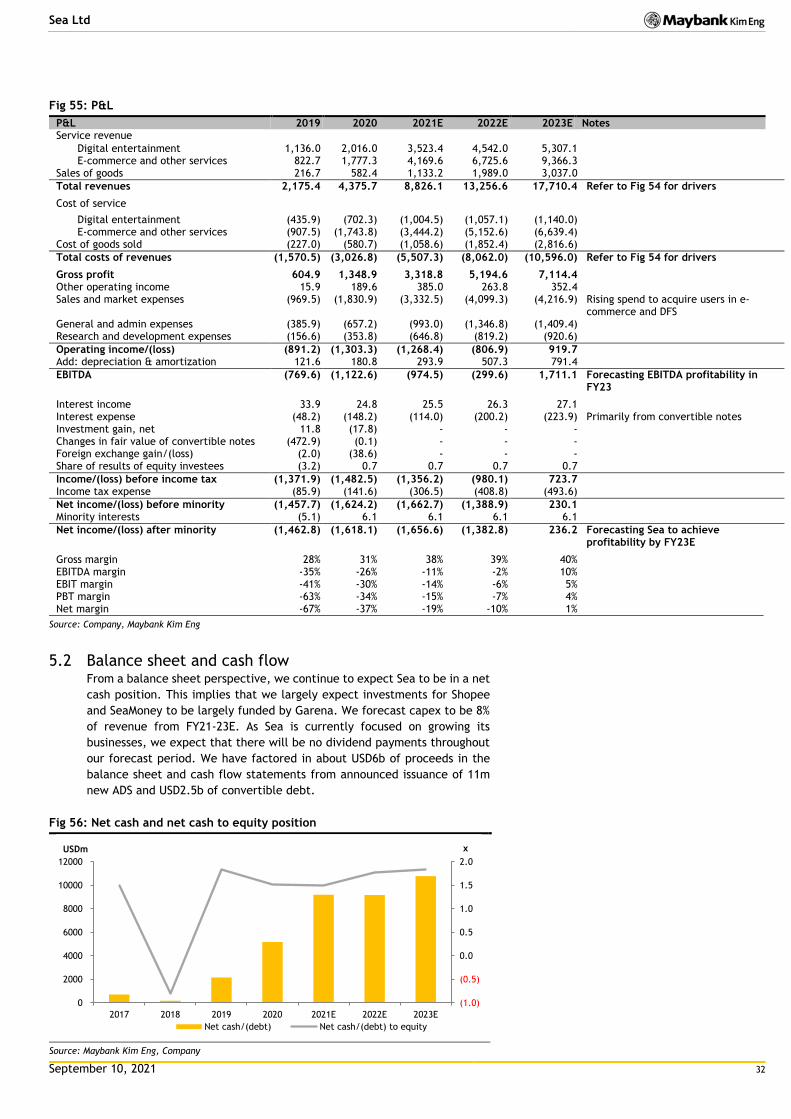
Fig 55: P&L
P&L 2019 2020 2021E 2022E 2023E Notes Service revenue
Digital entertainment 1,136.0 2,016.0 3,523.4 4,542.0 5,307.1 E-commerce and other services 822.7 1,777.3 4,169.6 6,725.6 9,366.3
Sales of goods 216.7 582.4 1,133.2 1,989.0 3,037.0
Total revenues 2,175.4 4,375.7 8,826.1 13,256.6 17,710.4 Refer to Fig 54 for drivers
Cost of service
Digital entertainment (435.9) (702.3) (1,004.5) (1,057.1) (1,140.0) E-commerce and other services (907.5) (1,743.8) (3,444.2) (5,152.6) (6,639.4)
Cost of goods sold (227.0) (580.7) (1,058.6) (1,852.4) (2,816.6)
Total costs of revenues (1,570.5) (3,026.8) (5,507.3) (8,062.0) (10,596.0) Refer to Fig 54 for drivers
Gross profit 604.9 1,348.9 3,318.8 5,194.6 7,114.4 Other operating income 15.9 189.6 385.0 263.8 352.4 Sales and market expenses (969.5) (1,830.9) (3,332.5) (4,099.3) (4,216.9) Rising spend to acquire users in e-
commerce and DFS General and admin expenses (385.9) (657.2) (993.0) (1,346.8) (1,409.4) Research and development expenses (156.6) (353.8) (646.8) (819.2) (920.6)
5.2 Balance sheet and cash flow From a balance sheet perspective, we continue to expect Sea to be in a net
cash position. This implies that we largely expect investments for Shopee
and SeaMoney to be largely funded by Garena. We forecast capex to be 8%
of revenue from FY21-23E. As Sea is currently focused on growing its
businesses, we expect that there will be no dividend payments throughout
our forecast period. We have factored in about USD6b of proceeds in the
balance sheet and cash flow statements from announced issuance of 11m
new ADS and USD2.5b of convertible debt.
Fig 56: Net cash and net cash to equity position
Source: Maybank Kim Eng, Company
(1.0)
(0.5)
0.0
0.5
1.0
1.5
2.0
0
2000
4000
6000
8000
10000
12000
2017 2018 2019 2020 2021E 2022E 2023E
xUSDm
Net cash/(debt) Net cash/(debt) to equity
September 10, 2021 33
Sea Ltd
Fig 57: Balance sheet
2019 2020 2021E 2022E 2023E Comments Cash and cash equivalents
3,119 6,167 12,145 12,083 13,626 Expect positive cash flow to aid in cash build; i.e expansion in e-commerce and DFS is funded by digital entertainment. Have also factored in proceeds from fundraising in Sep-21
Our TP of USD378 is based on an SOTP approach. We value the digital
entertainment business at USD112/ADS, the e-commerce business at
USD227/ADS, and digital financial services at USD23/ADS.
For the digital entertainment business, our valuation is based on 27x FY22E
P/E. This is a 23%/20% premium over global peers/ Tencent respectively,
which we believe is warranted despite concentration risks with Free Fire
given Garena’s faster earnings growth than global peers over FY20E-23E
(Garena: 60%; Tencent: 10%; global peers: 12%). As for the e-commerce
business, we value it at 1.4x FY22 P/GMV, which is a premium to global
peers and in line with Mercado Libre, as we see potential long-term upside
in Shopee’s new markets. We used P/GMV as Shopee, while fast growing, is
still unprofitable due to the investments that it has to make to expand in
both traditional and new markets. Meanwhile, we value the digital financial
services business at 0.4x P/TPV, a premium over PayPal’s 0.25x, as we
believe we may be currently underestimating SeaMoney’s long-term growth
potential from the perspective of the underbanked population in ASEAN.
Fig 59: SOTP valuation
Business Methodology Multiple
(x) Metric Value of metric
(USDm) Value of business
(USDm) Note Digital entertainment
P/E 27 FY22E P/E 2,362 63,769 Premium to global peers on account of faster earnings growth rate
E-commerce P/GMV 1.4 FY22E GMV 92,023 128,832 Higher than global peers but relatively in line with Mercado Libre to account for long-term upside in new markets
Digital financial services
P/TPV 0.4 FY22E TPV 32,752 9,826 Higher than Paypal’s 0.25x to account for long-term potential upside from ASEAN underbanked population
Baozun BZUN US NR - 24.39 1,739 20.8 14.0 10.6 30% 10.6 7.6 1.0 0.7
Average 255.5 128.6 48.6 30% 54.8 46.7 6.2 4.9
Payments and fintechs
Visa V US NR - 225.11 379,905 39.8 31.7 26.7 19% 29.8 23.9 16.1 13.4
Mastercard MA US NR - 340.23 333,027 43.2 32.5 26.5 26% 31.9 24.7 18.0 15.1
Paypal PYPL US NR - 289.13 339,737 61.1 49.2 39.1 24% 43.2 34.8 13.1 10.8
Square SQ US NR - 269.74 107,194 175.7 127.9 92.1 52% 139.3 97.9 5.3 4.6
Afterpay AFTPF US NR - 96.75 28,228 - 265.8 112.9 -216% 472.4 168.3 40.9 24.6
Zip Co Z1P AU NR - 6.78 2,837 - - 376.9 -133% NA 1038 9.7 5.9
Average 59.0 48.6 38.2 19% 50.3 38.6 16.8 13.9
Source: FactSet, Bloomberg, Maybank Kim Eng
September 10, 2021 37
Sea Ltd
7. Risks
7.1 Revenue concentration in digital entertainment and in
e-commerce
The digital entertainment business accounted for 46-56% of revenue in
FY18-20 and is the primary driver of group gross profit as other segments
are either hardly or not yet profitable. In FY20, Sea’s top 5 games accounted
for 96% of digital entertainment revenue, of which Free Fire contributed a
significant portion. Unless Sea successfully launches new games that can
contribute revenues materially, growth of the digital entertainment
business will be reliant on a small number of titles. In turn, current titles
also face risks of slowing or negative growth if these become less popular,
less engaging, or face regulatory issues in the countries that they are
available in. Aside, the e-commerce business is also concentrated as top
two markets account for the majority of total orders and GMV.
7.2 Growth of user base and level of user engagement
Due to network effects, the size of Sea’s user base and engagement are
critical success factors. While Sea continues to invest significant resources
to grow these, there are several factors that could negatively impact user
base/ engagement, such as:
Decline in popularity of Sea’s platforms, in turn possibly driven by
reduction in content/ service quality, and/or failure to innovate and
adapt to new trends.
User concerns pertaining privacy and safety
Sea’s monetisation measures cause users to shift to other platforms
Launch of new games causes cannibalisation from existing games
7.3 Expansion and investment risks
To boost its e-commerce capabilities, Shopee will continue to develop last-
mile delivery and warehousing capacity and expand its offerings (e.g. food
delivery). These are expected to require large capex. Failure to accurately
predict demand or to adapt to evolving business needs may result in
increased costs or impairment charges.
As Sea expands its DFS business and amount of loans disbursed increase, Sea
may require further capital. Inability to raise adequate capital could limit
the growth of the business. Further, Sea is a relatively new entrant in the
digital financial services industry, and there are risks that Sea may not be
able to achieve the required level of market acceptance to recoup the
investments made to expand this business.
Sea established Sea Capital to manage its overall investment efforts
following the acquisition of Composite Capital Management in 1Q21. Failure
to select appropriate investments, or suboptimal terms and arrangement
(e.g. financing) are also risks inherent to Sea’s investment efforts.
7.4 Competition
While Sea is a leader in the businesses that it operates in, it faces intense
competition both directly and indirectly in each of these businesses.
For DE, competitors include companies that have presence in single and
multiple markets, as well as global platforms. Outside of GSEA, Sea has
September 10, 2021 38
Sea Ltd
limited operating history and may see risks in monetising and retaining users.
For e-commerce, Sea faces competition from both single-market and
regional players in most if not all of the markets it operates in. As for DFS,
competition stems from existing online and offline payment methods.
Competition will intensify as industry players introduce new or enhanced
offerings.
For these businesses, competitors may have better access to financial,
technological, and marketing resources that may provide them stronger
competitive advantage over Sea.
7.5 Regulatory risk
Sea’s businesses are subjected to laws and regulations include game
operation, marketing & advertising, privacy, personal information, content
restriction, sale of regulated or prohibited items, anti-bribery and anti-
corruption regulations and digital financial service regulations. As the
industries that Sea operate in are relatively new, the relevant laws and
regulations are often unclear and evolving. This may result in Sea not being
able to renew or obtain new licences. Failure to adhere to regulations may
subject Sea to financial penalties or disruptions in business operations,
which may in turn materially adversely impact business performance.
September 10, 2021 39
Sea Ltd
8. Appendix I (Management profiles)
Fig 61: Management profiles
Name Title Key Experience Forrest Li Chairman and
Group CEO Current role since 2009
Other directorships: Singapore Economic Development Board (BOD), Shangri-La Asia Limited (Independent Non-Executive Director), National University of Singapore (Board of Trustees), Stanford University's Graduate School of Business (Advisory Council).
Education: M.B.A. Degree from Stanford University's Graduate School of Business, Bachelor Degree in Engineering from Shanghai Jiaotong University
Gang Ye Group Chief Operating Officer
Current role since 2017
Previous role: Group Chief Technology Officer (2010-2016)
Key past experience: Worked at Wilmar International and the Economic Development Board of Singapore
Education: B.S. degrees in Computer Science and Econs from Carnegie Mellon University
David Chen Chief Product Officer (Shopee)
Current role since 2019
Previous role: Group Chief Operating Technology Officer (2009-2016), Group Chief of Staff (2017 - 2019)
Key past experience: Held positions at PSA Corporation Limited
Education: Bachelor Degree in Computer Engineering from the National University of Singapore
Tony Hou Group Chief Financial Officer
Current role since 2013
Previous role: Group Financial Controller (2010-2013)
Key past experience: Senior Audit Manager at Ernst & Young, non-practicing U.S. Certified Public Accountant and a non practicing member of the Chinese Institute of Certified Public Accountants
Education: MBA Degree from the University of Chicago's Booth School, Bachelor Degree in Accounting from Fudan University
Chris Feng CEO of Shopee and SeaMoney
Current role since 2015 (Shopee), 2020 (SeaMoney)
Previous role: Head of Mobile Business (2014-2015)
Key past experience: Part of the Founding Team at Rocket Internet SE, where he established ventures such as Zalora and Lazada, and served as Regional Managing Director and at Zalora and Chief Purchasing Officer at Lazada. Was also a consultant at McKinsey.
Education: Bachelor's Degree in Computer Science from the National University of Singapore
Yanjun Wang Group Chief Corporate Officer, Group General Counsel and Company Secretary
Current role since 2019 (Chief Corporate Officer), 2017 (Company Secretary), 2014 (General Counsel)
Key past experience: Attorney at Skadden, Arps, Slate, Meagher & Flom LLP in New York and Kirkland & Ellis in Hong Kong.
Education: J.D. degree from Harvard Law School, B.A. degree in Economics from Harvard University
Nok Anulomsombut
Ceo of Thailand Current role since 2016
Previous role: Chief Operating Officer of Thailand (2014 - 2016)
Key past experience: Management Consultant at The Boston Consulting Group in Bangkok and previous positions at financial and fashion companies in Thailand
Education: Bachelor's Degree in Industrial Engineering from Chulalongkorn University in Thailand, M.B.A. degree from Stanford University Graduate School of Business
Terry Zhao President of Garena
Current role since 2018
Previous role: Various Senior Roles in SEA digital entertainment business across key markets (2009-2018)
Education: Bachelor's Degree in Computer Engineering from Nanyang Technological University
Source: Company
September 10, 2021 40
Sea Ltd
9. Appendix II (Eligibility criteria for Singapore
digital bank licence)
Fig 62: Eligibility criteria for Singapore digital bank licence
Criteria for all digital full bank (DFB) and digital wholesale bank (DWB) applicants
1. An entity in the group must have 3 of more years of track record in operating and existing business in the technology or e-commerce field
2. The following persons are fit and proper:
a. Applicant group and their directors;
b. Substantial shareholders and 12% controllers of the proposed digital bank; and
c. Directors and executive officers of the proposed digital bank, when identified
3. The Company must have the ability to meet the applicable minimum paid-up capital requirement at the onset and the minimum capital
funds requirement on an ongoing basis. A written confirmation from shareholders of the proposed digital bank on commitment of funds must
be submitted to the MAS
For DFB applicants, they must include a commitment of funds or fundrising plans to meet the minimum paid up capital of SGD1.5b.
4. Provides clear value proposition, incorporating the innovative use of technology to serve customer needs and reach under-served segments
of the Singapore market
5. The proposed digital bank business model is sustainable.
The applicant must provide a 5 year financial projection of the proposed digital bank, showing a path towards profitability. The assumptions
of the financial projection must be reviewed by an external and independent expert
6. Submits a feasible plan that can facilitate the orderly exit of the proposed digital bank.
7. Shareholders of the proposed digital bank commit to providing a letter of responsibility and a letter of undertaking that MAS may require in
respect of the operations of the proposed digital bank.
Extra Requirement for DFB Applicants
MAS will only consider DFB applicants who are anchored in Singapore, controlled by Singaporeans and headquartered in Singapore.
The following are the factors required:
1. The proposed DFB and the parent entity identify Singapore as their home country
2. The parent entity’s global head office is in Singapore
3. The parent entity’s and the proposed DFB’s effective management are situated in Singapore
4. If there is no parent entity, a Singapore individual or entity which holds the single largest shareholding and has effective control over the
proposed DFB meets the above conditions
If there is a partnership between Singapore and foreign entities, the Singapore entity needs to have an absolute majority stake and demonstrate
clear control of the DFB.
Source: Monetary Authority of Singapore
September 10, 2021 41
Sea Ltd
10. Appendix III (requirement and permissible
activity of DFB and DWB)
Fig 63: Requirement and permissible activity of DFB
Restricted DFB DFB
Entry Progression
Minimum Paid Up Capital SGD15 Million
To progressively increase
SGD1.5 billion
Deposit Cap
SGD50 million in aggregate SGD75,000 per individual Only solicit deposits from limited scope of customers
Aggregate Cap to progressively increase SGD75,000 per individual No limit on scope of depositors
No Deposit Cap
DFB will be required to be a member of the Deposit Insurance Scheme8
Risk based capital and
liquidity rules
Capital: Same as domestic systemically important banks Liquidity: 16% minimum liquid assets
Capital: Same as local banks Liquidity: Same as local banks
Permissable Activities and
other requirements
Applicable regardless of progression a. 1 Physical Place of Business b. Not allowed access to ATMs or CDMs network but allowed to offer cashback service through EFTPOS terminals at retail merchants
Applicable during restricted phase a. Corporate Governance rules: Phased In b. Not allowed to safeguard other financial institutions' relevant money under the Payment Service Act 2019 c. Unsecured credit limit for an individual: 2 times monthly income of individual d. No proprietary trading activities
Applicable during entry phase a. For investment products offered to individuals, only simple capital markets products b. Banking operations in at most 2 overseas markets
Source: Monetary Authority of Singapore
September 10, 2021 42
Sea Ltd
Fig 64: Requirements and permissible activities for DWB
Requirements
Same Requirements as wholesale banks, including 1. Min paid up capital of S$100 million 2. Risk based capital and liquidity requirements 3. Requirements related to Tech,Money Laundering, Terrorism Financing Risk 4. Conduct of non-financial business
Permissible Activities and Other
Requirements
The permissable activities of a DWB are the same as a traditional Wholesale Bank. A DWB can only conduct the proposed business(ess) outlined in its first 2-3 years and would require MAS approval to expand its business scope. The additional requirements are as follows. 1. Only allowed to operate 1 physical place of business 2. A DWB will not be allowed to grant unsecured credit facilities to retail individuals 3. DWB will not be allowed to perform the function of a “safeguarding institution” under section 23 of the Payment Services Act 2019 4. The DWB will be able to share executive officers with its parent or affiliate entities during the first few years but not beyond 5 years
APPENDIX I: TERMS FOR PROVISION OF REPORT, DISCLAIMERS AND DISCLOSURES
DISCLAIMERS This research report is prepared for general circulation and for information purposes only and under no circumstances should it be considered or intended as an offer to sell or a solicitation of an offer to buy the securities referred to herein. Investors should note that values of such securities, if any, may fluctuate and that each security’s price or value may rise or fall. Opinions or recommendations contained herein are in form of technical ratings and fundamental ratings. Technical ratings may differ from fundamental ratings as technical valuations apply different methodologies and are purely based on price and volume-related information extracted from the relevant jurisdiction’s stock exchange in the equity analysis. Accordingly, investors’ returns may be less than the original sum invested. Past performance is not necessarily a guide to future performance. This report is not intended to provide personal investment advice and does not take into account the specific investment objectives, the financial situation and the particular needs of persons who may receive or read this report. Investors should therefore seek financial, legal and other advice regarding the appropriateness of investing in any securities or the investment strategies discussed or recommended in this report.
The information contained herein has been obtained from sources believed to be reliable but such sources have not been independently verified by Maybank Investment Bank Berhad, its subsidiary and affiliates (collectively, “MKE”) and consequently no representation is made as to the accuracy or completeness of this report by MKE and it should not be relied upon as such. Accordingly, MKE and its officers, directors, associates, connected parties and/or employees (collectively, “Representatives”) shall not be liable for any direct, indirect or consequential losses or damages that may arise from the use or reliance of this report. Any information, opinions or recommendations contained herein are subject to change at any time, without prior notice.
This report may contain forward looking statements which are often but not always identified by the use of words such as “anticipate”, “believe”, “estimate”, “intend”, “plan”, “expect”, “forecast”, “predict” and “project” and statements that an event or result “may”, “will”, “can”, “should”, “could” or “might” occur or be achieved and other similar expressions. Such forward looking statements are based on assumptions made and information currently available to us and are subject to certain risks and uncertainties that could cause the actual results to differ materially from those expressed in any forward looking statements. Readers are cautioned not to place undue relevance on these forward-looking statements. MKE expressly disclaims any obligation to update or revise any such forward looking statements to reflect new information, events or circumstances after the date of this publication or to reflect the occurrence of unanticipated events.
MKE and its officers, directors and employees, including persons involved in the preparation or issuance of this report, may, to the extent permitted by law, from time to time participate or invest in financing transactions with the issuer(s) of the securities mentioned in this report, perform services for or solicit business from such issuers, and/or have a position or holding, or other material interest, or effect transactions, in such securities or options thereon, or other investments related thereto. In addition, it may make markets in the securities mentioned in the material presented in this report. One or more directors, officers and/or employees of MKE may be a director of the issuers of the securities mentioned in this report to the extent permitted by law.
This report is prepared for the use of MKE’s clients and may not be reproduced, altered in any way, transmitted to, copied or distributed to any other party in whole or in part in any form or manner without the prior express written consent of MKE and MKE and its Representatives accepts no liability whatsoever for the actions of third parties in this respect.
This report is not directed to or intended for distribution to or use by any person or entity who is a citizen or resident of or located in any locality, state, country or other jurisdiction where such distribution, publication, availability or use would be contrary to law or regulation. This report is for distribution only under such circumstances as may be permitted by applicable law. The securities described herein may not be eligible for sale in all jurisdictions or to certain categories of investors. Without prejudice to the foregoing, the reader is to note that additional disclaimers, warnings or qualifications may apply based on geographical location of the person or entity receiving this report.
Malaysia Opinions or recommendations contained herein are in the form of technical ratings and fundamental ratings. Technical ratings may differ from fundamental ratings as technical valuations apply different methodologies and are purely based on price and volume-related information extracted from Bursa Malaysia Securities Berhad in the equity analysis.
Singapore This report has been produced as of the date hereof and the information herein may be subject to change. Maybank Kim Eng Research Pte. Ltd. (“Maybank KERPL”) in Singapore has no obligation to update such information for any recipient. For distribution in Singapore, recipients of this report are to contact Maybank KERPL in Singapore in respect of any matters arising from, or in connection with, this report. If the recipient of this report is not an accredited investor, expert investor or institutional investor (as defined under Section 4A of the Singapore Securities and Futures Act), Maybank KERPL shall be legally liable for the contents of this report, with such liability being limited to the extent (if any) as permitted by law.
Thailand Except as specifically permitted, no part of this presentation may be reproduced or distributed in any manner without the prior written permission of Maybank Kim Eng Securities (Thailand) Public Company Limited. Maybank Kim Eng Securities (Thailand) Public Company Limited (“MBKET”) accepts no liability whatsoever for the actions of third parties in this respect.
Due to different characteristics, objectives and strategies of institutional and retail investors, the research products of MBKET Institutional and Retail Research departments may differ in either recommendation or target price, or both. MBKET reserves the rights to disseminate MBKET Retail Research reports to institutional investors who have requested to receive it. If you are an authorised recipient, you hereby tacitly acknowledge that the research reports from MBKET Retail Research are first produced in Thai and there is a time lag in the release of the translated English version.
The disclosure of the survey result of the Thai Institute of Directors Association (“IOD”) regarding corporate governance is made pursuant to the policy of the Office of the Securities and Exchange Commission. The survey of the IOD is based on the information of a company listed on the Stock Exchange of Thailand and the market for Alternative Investment disclosed to the public and able to be accessed by a general public investor. The result, therefore, is from the perspective of a third party. It is not an evaluation of operation and is not based on inside information. The survey result is as of the date appearing in the Corporate Governance Report of Thai Listed Companies. As a result, the survey may be changed after that date. MBKET does not confirm nor certify the accuracy of such survey result.
The disclosure of the Anti-Corruption Progress Indicators of a listed company on the Stock Exchange of Thailand, which is assessed by Thaipat Institute, is made in order to comply with the policy and sustainable development plan for the listed companies of the Office of the Securities and Exchange Commission. Thaipat Institute made this assessment based on the information received from the listed company, as stipulated in the form for the assessment of Anti-corruption which refers to the Annual Registration Statement (Form 56-1), Annual Report (Form 56-2), or other relevant documents or reports of such listed company. The assessment result is therefore made from the perspective of Thaipat Institute that is a third party. It is not an assessment of operation and is not based on any inside information. Since this assessment is only the assessment result as of the date appearing in the assessment result, it may be changed after that date or when there is any change to the relevant information. Nevertheless, MBKET does not confirm, verify, or certify the accuracy and completeness of the assessment result.
US This third-party research report is distributed in the United States (“US”) to Major US Institutional Investors (as defined in Rule 15a-6 under the Securities Exchange Act of 1934, as amended) only by Maybank Kim Eng Securities USA Inc (“Maybank KESUSA”), a broker-dealer registered in the US (registered under Section 15 of the Securities Exchange Act of 1934, as amended). All responsibility for the distribution of this report by Maybank KESUSA in the US shall be borne by Maybank KESUSA. This report is not directed at you if MKE is prohibited or restricted by any legislation or regulation in any jurisdiction from making it available to you. You should satisfy yourself before reading it that Maybank KESUSA is permitted to provide research material concerning investments to you under relevant legislation and regulations. All U.S. persons receiving and/or accessing this report and wishing to effect transactions in any security mentioned within must do so with: Maybank Kim Eng Securities USA Inc. 400 Park Avenue, 11th Floor, New York, New York 10022, 1-(212) 688-8886 and not with, the issuer of this report.
September 10, 2021 47
Sea Ltd
Disclosure of Interest
Malaysia: MKE and its Representatives may from time to time have positions or be materially interested in the securities referred to herein and may further act as market maker or may have assumed an underwriting commitment or deal with such securities and may also perform or seek to perform investment banking services, advisory and other services for or relating to those companies. Singapore: As of 10 September 2021, Maybank KERPL and the covering analyst do not have any interest in any companies recommended in this research report. Thailand: MBKET may have a business relationship with or may possibly be an issuer of derivative warrants on the securities /companies mentioned in the research report. Therefore, Investors should exercise their own judgment before making any investment decisions. MBKET, its associates, directors, connected parties and/or employees may from time to time have interests and/or underwriting commitments in the securities mentioned in this report. Hong Kong: As of 10 September 2021, KESHK and the authoring analyst do not have any interest in any companies recommended in this research report. India: As of 10 September 2021, and at the end of the month immediately preceding the date of publication of the research report, KESI, authoring analyst or their associate / relative does not hold any financial interest or any actual or beneficial ownership in any shares or having any conflict of interest in the subject companies except as otherwise disclosed in the research report.
In the past twelve months KESI and authoring analyst or their associate did not receive any compensation or other benefits from the subject companies or third party in connection with the research report on any account what so ever except as otherwise disclosed in the research report.
MKE may have, within the last three years, served as manager or co-manager of a public offering of securities for, or currently may make a primary market in issues of, any or all of the entities mentioned in this report or may be providing, or have provided within the previous 12 months, significant advice or investment services in relation to the investment concerned or a related investment and may receive compensation for the services provided from the companies covered in this report.
OTHERS
Analyst Certification of Independence
The views expressed in this research report accurately reflect the analyst’s personal views about any and all of the subject securities or issuers; and no part of the research analyst’s compensation was, is or will be, directly or indirectly, related to the specific recommendations or views expressed in the report.
Reminder
Structured securities are complex instruments, typically involve a high degree of risk and are intended for sale only to sophisticated investors who are capable of understanding and assuming the risks involved. The market value of any structured security may be affected by changes in economic, financial and political factors (including, but not limited to, spot and forward interest and exchange rates), time to maturity, market conditions and volatility and the credit quality of any issuer or reference issuer. Any investor interested in purchasing a structured product should conduct its own analysis of the product and consult with its own professional advisers as to the risks involved in making such a purchase.
No part of this material may be copied, photocopied or duplicated in any form by any means or redistributed without the prior consent of MKE.
Definition of Ratings
Maybank Kim Eng Research uses the following rating system
BUY Return is expected to be above 10% in the next 12 months (including dividends)
HOLD Return is expected to be between 0% to 10% in the next 12 months (including dividends)
SELL Return is expected to be below 0% in the next 12 months (including dividends)
Applicability of Ratings
The respective analyst maintains a coverage universe of stocks, the list of which may be adjusted according to needs. Investment ratings are only applicable to the stocks which form part of the coverage universe. Reports on companies which are not part of the coverage do not carry investment ratings as we do not actively follow developments in these companies.
UK This document is being distributed by Maybank Kim Eng Securities (London) Ltd (“Maybank KESL”) which is authorized and regulated, by the Financial Conduct Authority and is for Informational Purposes only. This document is not intended for distribution to anyone defined as a Retail Client under the Financial Services and Markets Act 2000 within the UK. Any inclusion of a third party link is for the recipients convenience only, and that the firm does not take any responsibility for its comments or accuracy, and that access to such links is at the individuals own risk. Nothing in this report should be considered as constituting legal, accounting or tax advice, and that for accurate guidance recipients should consult with their own independent tax advisers.
DISCLOSURES
Legal Entities Disclosures Malaysia: This report is issued and distributed in Malaysia by Maybank Investment Bank Berhad (15938- H) which is a Participating Organization of Bursa Malaysia Berhad and a holder of Capital Markets and Services Licence issued by the Securities Commission in Malaysia. Singapore: This report is distributed in Singapore by Maybank KERPL (Co. Reg No 198700034E) which is regulated by the Monetary Authority of Singapore. Indonesia: PT Maybank Kim Eng Securities (“PTMKES”) (Reg. No. KEP-251/PM/1992) is a member of the Indonesia Stock Exchange and is regulated by the Financial Services Authority (Indonesia). Thailand: MBKET (Reg. No.0107545000314) is a member of the Stock Exchange of Thailand and is regulated by the Ministry of Finance and the Securities and Exchange Commission. Philippines: Maybank ATRKES (Reg. No.01-2004-00019) is a member of the Philippines Stock Exchange and is regulated by the Securities and Exchange Commission. Vietnam: Maybank Kim Eng Securities Limited (Licence Number: 117/GP-UBCK) is licenced under the State Securities Commission of Vietnam. Hong Kong: KESHK (Central Entity No AAD284) is regulated by the Securities and Futures Commission. India: Kim Eng Securities India Private Limited (“KESI”) is a participant of the National Stock Exchange of India Limited and the Bombay Stock Exchange and is regulated by Securities and Exchange Board of India (“SEBI”) (Reg. No. INZ000010538). KESI is also registered with SEBI as Category 1 Merchant Banker (Reg. No. INM 000011708) and as Research Analyst (Reg No: INH000000057) US: Maybank KESUSA is a member of/ and is authorized and regulated by the FINRA – Broker ID 27861. UK: Maybank KESL (Reg No 2377538) is authorized and regulated by the Financial Conduct Authority.