Property Detail Page 1 of 10 The data within this report is compiled by CoreLogic from public and private sources. The data is deemed reliable, but is not guaranteed. The accuracy of the data contained herein can be independently verified by the recipient of this report with the applicable county or municipality. Courtesy of Miguel Aguayo, Miguel Angel Aguayo, California Regional MLS Generated on 09/11/2018 3242 Fowler St, Los Angeles, CA 90063, Los Angeles County Beds N/A Bldg Sq Ft 3,198 Lot Sq Ft 4,744 Sale Price $580,000 Baths N/A Yr Built 1958 Type WHSE Sale Date 08/26/2015 Owner Information Owner Name: Sanchez Alex Tax Billing Zip: 91356 Owner Name 2: Instant Advice Ntwk Ianchat Co Tax Billing Zip+4: 2917 Mail Owner Name: Alex Sanchez Owner Vesting: Married Man Tax Billing Address: 19528 Ventura Blvd #497 Owner Occupied: No Tax Billing City & State: Tarzana, CA Location Information Zip Code: 90063 School District: Los Angeles Carrier Route: C015 Comm College District Code: Los Angeles City Zoning: LCM1* Census Tract: 5307.00 Tract Number: 6332 Tax Information APN : 5224-016-031 Block: 3 % Improved: 28% Water Tax Dist: Central And W Basin Tax Area: 14388 Fire Dept Tax Dist: Consolidated Co Lot: 3 Legal Description: TR=6332 LOT 3 BLK 3 Assessment & Tax Assessment Year 2017 2016 2015 Assessed Value - Total $295,800 $290,000 $139,816 Assessed Value - Land $214,200 $210,000 $112,761 Assessed Value - Improved $81,600 $80,000 $27,055 YOY Assessed Change ($) $5,800 $150,184 YOY Assessed Change (%) 2% 107.42% Tax Year Total Tax Change ($) Change (%) 2015 $3,114 2016 $5,171 $2,056 66.03% 2017 $5,011 -$160 -3.1% Special Assessment Tax Amount La County St Lt 62 $25.00 Solid Waste Fee 62 $17.55 County Library 56 $30.97 Laco Vectr Cntrl80 $8.97 Belvedere Grbage88 $768.00 County Park Dist83 $3.25 Consldated Sewer62 $101.00 Mwd Standby #13 86 $10.44 Trauma/Emerg Srv86 $135.59 Combined Liens $443.94 Total Of Special Assessments $1,544.71
Transcript
Property DetailPage 1 of 10
The data within this report is compiled by CoreLogic from public and private sources. The data is deemed reliable, but is not guaranteed. The accuracy of the data contained herein can be independently verified by the recipient of this report with the applicable county or municipality.
Courtesy of Miguel Aguayo, Miguel Angel Aguayo, California Regional MLS
Generated on 09/11/2018
3242 Fowler St, Los Angeles, CA 90063, Los Angeles County
Beds
N/A
Bldg Sq Ft
3,198
Lot Sq Ft
4,744
Sale Price
$580,000
Baths
N/A
Yr Built
1958
Type
WHSE
Sale Date
08/26/2015
Owner Information
Owner Name: Sanchez Alex Tax Billing Zip: 91356Owner Name 2: Instant Advice Ntwk Ianchat
CoTax Billing Zip+4: 2917
Mail Owner Name: Alex Sanchez Owner Vesting: Married ManTax Billing Address: 19528 Ventura Blvd #497 Owner Occupied: NoTax Billing City & State: Tarzana, CA
Location Information
Zip Code: 90063 School District: Los AngelesCarrier Route: C015 Comm College District Code: Los Angeles CityZoning: LCM1* Census Tract: 5307.00Tract Number: 6332
Tax Information
APN : 5224-016-031 Block: 3% Improved: 28% Water Tax Dist: Central And W BasinTax Area: 14388 Fire Dept Tax Dist: Consolidated CoLot: 3Legal Description: TR=6332 LOT 3 BLK 3
Assessment & Tax
Assessment Year 2017 2016 2015Assessed Value - Total $295,800 $290,000 $139,816Assessed Value - Land $214,200 $210,000 $112,761Assessed Value - Improved $81,600 $80,000 $27,055YOY Assessed Change ($) $5,800 $150,184YOY Assessed Change (%) 2% 107.42%
Tax Year Total Tax Change ($) Change (%)2015 $3,1142016 $5,171 $2,056 66.03%2017 $5,011 -$160 -3.1%
Special Assessment Tax AmountLa County St Lt 62 $25.00Solid Waste Fee 62 $17.55County Library 56 $30.97Laco Vectr Cntrl80 $8.97Belvedere Grbage88 $768.00County Park Dist83 $3.25Consldated Sewer62 $101.00Mwd Standby #13 86 $10.44Trauma/Emerg Srv86 $135.59Combined Liens $443.94Total Of Special Assessments $1,544.71
Property DetailPage 2 of 10
The data within this report is compiled by CoreLogic from public and private sources. The data is deemed reliable, but is not guaranteed. The accuracy of the data contained herein can be independently verified by the recipient of this report with the applicable county or municipality.
Courtesy of Miguel Aguayo, Miguel Angel Aguayo, California Regional MLS
Generated on 09/11/2018
Characteristics
County Land Use: Warehouse Distribution Gross Area: 3,198Universal Land Use: Warehouse Year Built: 1958Lot Acres: 0.1089 Effective Year Built: 1958Lot Area: 4,744 # of Buildings: 1Building Sq Ft: 3,198
Last Market Sale & Sales History
Recording Date: 10/02/2015 Sale Type: FullSale Date: 08/26/2015 Deed Type: Grant DeedSale Price: $580,000 Owner Name: Sanchez AlexPrice Per Square Feet: $181.36 Owner Name 2: Instant Advice Ntwk Ianchat
CoMulti/Split Sale: Multi Seller: Matsumoto Nozomu & KumiDocument Number: 1227123
Recording Date 09/26/2017 10/02/2015 10/02/2015Sale Date 10/26/2016 08/26/2015 08/12/2015Sale Price $580,000Nominal Y YBuyer Name Sanchez Alex Sanchez Alex Sanchez AlexSeller Name Sanchez Alex Matsumoto Nozomu & Kumi Sanchez Martha P CDocument Number 1097167 1227123 1227122Document Type Grant Deed Grant Deed Quit Claim Deed
Mortgage History
Mortgage Date 06/27/2018 09/15/2017 10/02/2015Mortgage Amount $100,000 $200,000 $406,000Mortgage Lender Private IndividualMortgage Code Private Party Lender Private Party Lender
Property Map
*Lot Dimensions are Estimated
ComparablesPage 3 of 10
The data within this report is compiled by CoreLogic from public and private sources. The data is deemed reliable, but is not guaranteed. The accuracy of the data contained herein can be independently verified by the recipient of this report with the applicable county or municipality.
Courtesy of Miguel Aguayo, Miguel Angel Aguayo, California Regional MLS
Generated on 09/11/2018
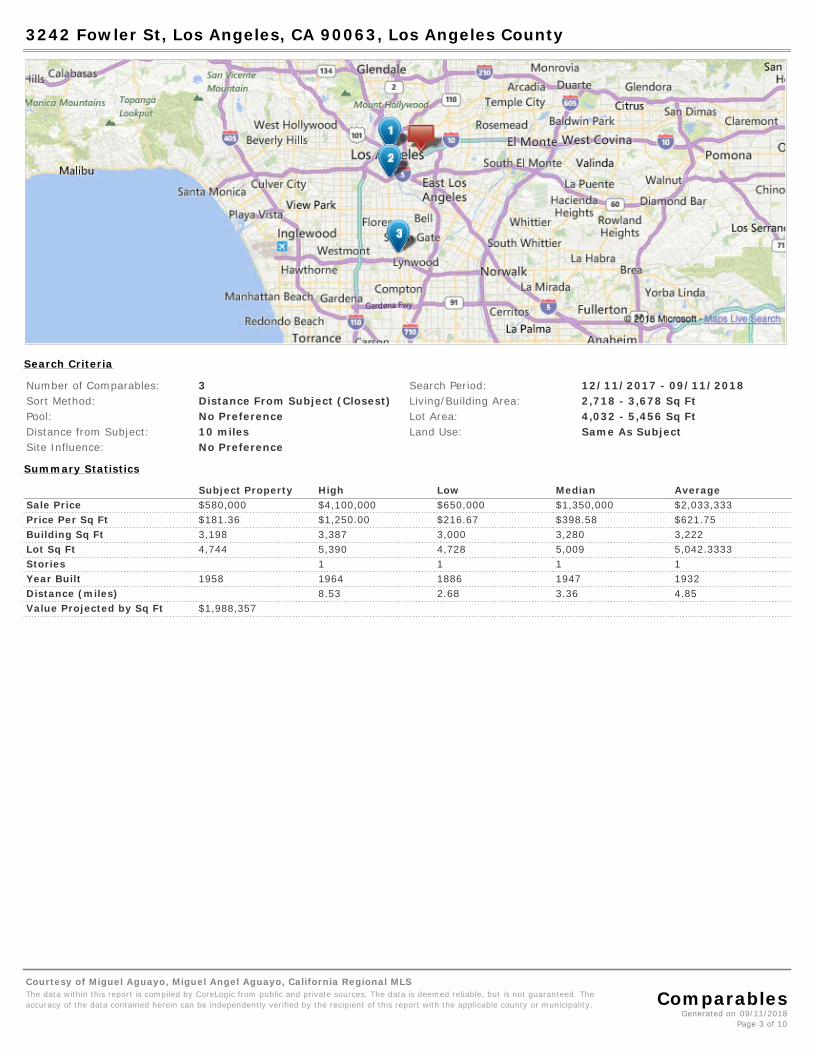
3242 Fowler St, Los Angeles, CA 90063, Los Angeles County
Search Criteria
Number of Comparables: 3 Search Period: 12/11/2017 - 09/11/2018Sort Method: Distance From Subject (Closest) Living/Building Area: 2,718 - 3,678 Sq FtPool: No Preference Lot Area: 4,032 - 5,456 Sq FtDistance from Subject: 10 miles Land Use: Same As SubjectSite Influence: No Preference
Summary Statistics
Subject Property High Low Median AverageSale Price $580,000 $4,100,000 $650,000 $1,350,000 $2,033,333Price Per Sq Ft $181.36 $1,250.00 $216.67 $398.58 $621.75Building Sq Ft 3,198 3,387 3,000 3,280 3,222Lot Sq Ft 4,744 5,390 4,728 5,009 5,042.3333Stories 1 1 1 1Year Built 1958 1964 1886 1947 1932Distance (miles) 8.53 2.68 3.36 4.85Value Projected by Sq Ft $1,988,357
ComparablesPage 4 of 10
The data within this report is compiled by CoreLogic from public and private sources. The data is deemed reliable, but is not guaranteed. The accuracy of the data contained herein can be independently verified by the recipient of this report with the applicable county or municipality.
Courtesy of Miguel Aguayo, Miguel Angel Aguayo, California Regional MLS
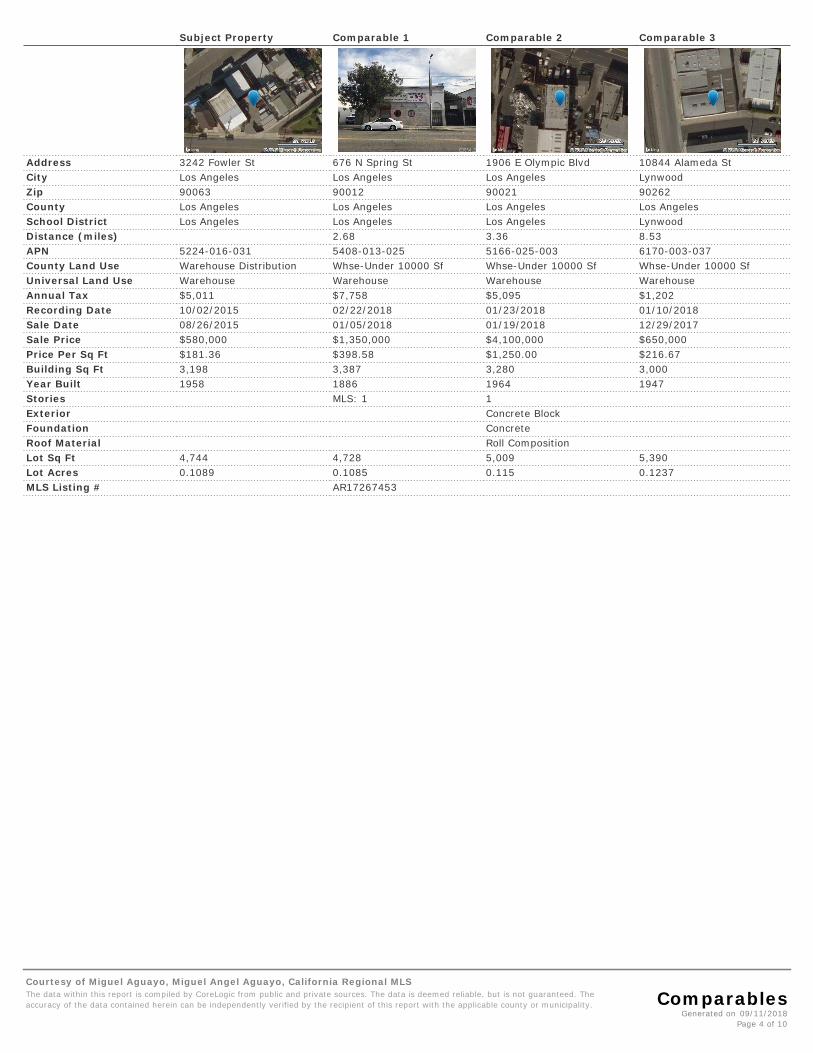
Address 3242 Fowler St 676 N Spring St 1906 E Olympic Blvd 10844 Alameda StCity Los Angeles Los Angeles Los Angeles LynwoodZip 90063 90012 90021 90262County Los Angeles Los Angeles Los Angeles Los AngelesSchool District Los Angeles Los Angeles Los Angeles LynwoodDistance (miles) 2.68 3.36 8.53APN 5224-016-031 5408-013-025 5166-025-003 6170-003-037County Land Use Warehouse Distribution Whse-Under 10000 Sf Whse-Under 10000 Sf Whse-Under 10000 SfUniversal Land Use Warehouse Warehouse Warehouse WarehouseAnnual Tax $5,011 $7,758 $5,095 $1,202Recording Date 10/02/2015 02/22/2018 01/23/2018 01/10/2018Sale Date 08/26/2015 01/05/2018 01/19/2018 12/29/2017Sale Price $580,000 $1,350,000 $4,100,000 $650,000Price Per Sq Ft $181.36 $398.58 $1,250.00 $216.67Building Sq Ft 3,198 3,387 3,280 3,000Year Built 1958 1886 1964 1947Stories MLS: 1 1Exterior Concrete BlockFoundation ConcreteRoof Material Roll CompositionLot Sq Ft 4,744 4,728 5,009 5,390Lot Acres 0.1089 0.1085 0.115 0.1237MLS Listing # AR17267453
Market TrendsPage 5 of 10
The data within this report is compiled by CoreLogic from public and private sources. The data is deemed reliable, but is not guaranteed. The accuracy of the data contained herein can be independently verified by the recipient of this report with the applicable county or municipality.
Courtesy of Miguel Aguayo, Miguel Angel Aguayo, California Regional MLS
Generated on 09/11/2018
3242 Fowler St, Los Angeles, CA 90063, Los Angeles County
Pricing Trends
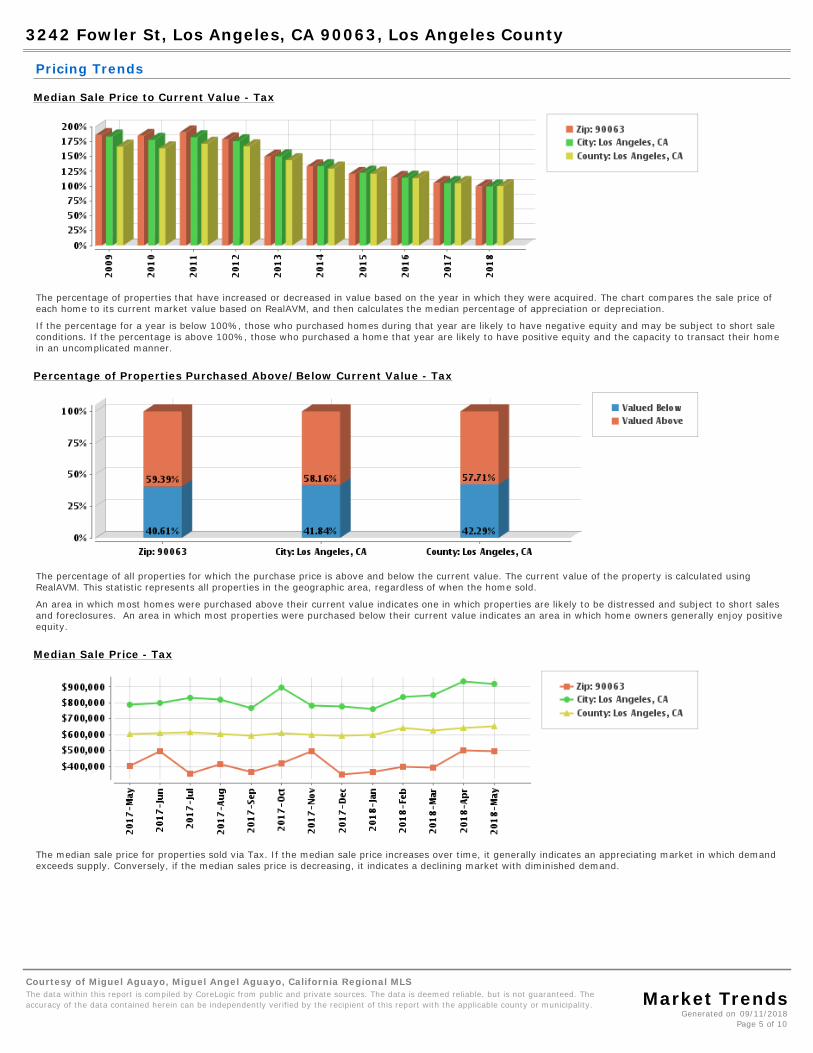
Median Sale Price to Current Value - Tax
The percentage of properties that have increased or decreased in value based on the year in which they were acquired. The chart compares the sale price of each home to its current market value based on RealAVM, and then calculates the median percentage of appreciation or depreciation.
If the percentage for a year is below 100%, those who purchased homes during that year are likely to have negative equity and may be subject to short sale conditions. If the percentage is above 100%, those who purchased a home that year are likely to have positive equity and the capacity to transact their home in an uncomplicated manner.
Percentage of Properties Purchased Above/Below Current Value - Tax
The percentage of all properties for which the purchase price is above and below the current value. The current value of the property is calculated using RealAVM. This statistic represents all properties in the geographic area, regardless of when the home sold.
An area in which most homes were purchased above their current value indicates one in which properties are likely to be distressed and subject to short sales and foreclosures. An area in which most properties were purchased below their current value indicates an area in which home owners generally enjoy positive equity.
Median Sale Price - Tax
The median sale price for properties sold via Tax. If the median sale price increases over time, it generally indicates an appreciating market in which demand exceeds supply. Conversely, if the median sales price is decreasing, it indicates a declining market with diminished demand.
Market TrendsPage 6 of 10
The data within this report is compiled by CoreLogic from public and private sources. The data is deemed reliable, but is not guaranteed. The accuracy of the data contained herein can be independently verified by the recipient of this report with the applicable county or municipality.
Courtesy of Miguel Aguayo, Miguel Angel Aguayo, California Regional MLS
Generated on 09/11/2018
Median Sale Price - MLS
The median sale price for properties sold via the MLS. If the median sale price increases over time, it generally indicates an appreciating market in which demand exceeds supply. Conversely, if the median sales price is decreasing, it indicates a declining market with diminished demand.
Median List Price - MLS
The median list price for properties actively marketed via the MLS. If the median list price increases over time, it generally indicates an appreciating market in which demand exceeds supply. Conversely, if the median list price is decreasing, it indicates a declining market with diminished demand.
Median Sale to Original List Price Ratio - MLS
The median ratio of sale price to list price based on MLS sales. For example, a home listed for $200,000 that sold for $190,000 would have a ratio of 95%. When the ratio is close to or even above 100%, homes are selling at or above their asking price and market demand is high. When the ratio is substantially below 100%, demand for homes is low.
Median Price per Square Foot - Tax
Market TrendsPage 7 of 10
The data within this report is compiled by CoreLogic from public and private sources. The data is deemed reliable, but is not guaranteed. The accuracy of the data contained herein can be independently verified by the recipient of this report with the applicable county or municipality.
Courtesy of Miguel Aguayo, Miguel Angel Aguayo, California Regional MLS
Generated on 09/11/2018
The median price per square foot for sold homes based on Tax sales. An increase in the median price per square foot -- particularly if the median size of sold homes has not also increased -- indicates that buyers are willing to pay more for the similarly sized homes. When the median price per square foot decreases, property values may be generally decreasing, or less costly homes are selling more briskly than higher valued ones.
Median Price per Square Foot - MLS
The median price per square foot for sold homes based on MLS sales. An increase in the median price per square foot -- particularly if the median size of sold homes has not also increased -- indicates that buyers are willing to pay more for the similarly sized homes. When the median price per square foot decreases, property values may be generally decreasing, or less costly homes are selling more briskly than higher valued ones.
Median Loan to Value - Tax
The median loan-to-value ratio (or LTV) is the ratio of the mortgage amount to the purchase price. Conventional wisdom is that homeowners with lower LTV ratios are less likely to default on their mortgage. As a result, lenders typically require mortgage insurance for owners who have an LTV greater than 80%.
The number of properties sold via Tax. Increasing sales activity signifies an accelerating market, while decreasing activity signifies a declining market. Remember that sales activity may also change seasonally, so be sure to compare sales activity between comparable periods and over a sufficiently long enough timeline.
Market TrendsPage 8 of 10
The data within this report is compiled by CoreLogic from public and private sources. The data is deemed reliable, but is not guaranteed. The accuracy of the data contained herein can be independently verified by the recipient of this report with the applicable county or municipality.
Courtesy of Miguel Aguayo, Miguel Angel Aguayo, California Regional MLS
Generated on 09/11/2018
Number of Sales - MLS
The number of properties sold via the MLS. Increasing sales activity signifies an accelerating market, while decreasing activity signifies a declining market. Remember that sales activity may also change seasonally, so be sure to compare sales activity between comparable periods and over a sufficiently long enough timeline.
Change in Sales Activity - Tax
The percentage change in sales activity compared to the corresponding month or quarter of the prior year. Positive percentages reflect improving market conditions, and decreasing ones indicate declining market conditions.
Change in Sales Activity - MLS
The percentage change in sales activity compared to the corresponding month or quarter of the prior year. Positive percentages reflect improving market conditions, and decreasing ones indicate declining market conditions.
Annual Turnover Rate - Tax
Market TrendsPage 9 of 10
The data within this report is compiled by CoreLogic from public and private sources. The data is deemed reliable, but is not guaranteed. The accuracy of the data contained herein can be independently verified by the recipient of this report with the applicable county or municipality.
Courtesy of Miguel Aguayo, Miguel Angel Aguayo, California Regional MLS
Generated on 09/11/2018
The annualized turnover rate indicates the percentage of all homes within the locale that sold via Tax. Comparing the annualized turnover rate between locations provides an indication of each area's relative stability or volatility.
Annual Turnover Rate - MLS
The annualized turnover rate indicates the percentage of all homes within the locale that sold via the MLS. Comparing the annualized turnover rate between locations provides an indication of each area's relative stability or volatility.
The total number of properties entering all stages of foreclosure (Pre-Foreclosure, Auction, or REO) in the monthly or quarterly period. When the combined number of properties entering the foreclosure stage declines, conditions are typically improving and markets will stabilize. When number of properties entering the various foreclosure stages increase, conditions are typically worsening and there is a likelihood that listing inventory will subsequently increase.
Change in Foreclosure Activity - Tax
The change in the foreclosure activity compares the number of properties entering all stages of foreclosure from one period to the corresponding period of the prior year. Negative percentages indicate slowing foreclosure activity, while increasing percentages depict accelerating foreclosure activity.
Market TrendsPage 10 of 10
The data within this report is compiled by CoreLogic from public and private sources. The data is deemed reliable, but is not guaranteed. The accuracy of the data contained herein can be independently verified by the recipient of this report with the applicable county or municipality.
Courtesy of Miguel Aguayo, Miguel Angel Aguayo, California Regional MLS
Generated on 09/11/2018
Percentage of Foreclosed Properties - Tax
The percentage of all properties in the zip, city or county entering the various stages of foreclosure in the period. This will be a very low percentage, but the comparative number period over period depicts improving or worsening conditions.
Percentage of Properties in Each Foreclosure Stage - Tax
The percent of properties in each stage of foreclosure (Pre-Foreclosure, Auction, or REO) for the most recent period. Areas with a high number of REO properties may be subject to listing and price volatility if the REO homes rapidly enter listing inventory.