Three differing sandstones, two synthetic and one field sample, have been tested ultrasonically under a range of confining pressures and pore pressures representative of in-situ reservoir pressures. These sandstones include: a synthetic sandstone with calcite intergranular cement produced using the CSIRO Calcite In-situ Precipitation Process (CIPS); a synthetic sandstone with silica intergranular cement; and a core sample from the Otway Basin Waarre Formation, Boggy Creek 1 well, from the target lithology for a trial CO2 pilot project. Initial testing was carried on the cores at “room-dried” conditions, with confining pressures up to 65 MPa in steps of 5 MPa. All cores were then flooded with CO2, initially in the gas phase at 6 MPa, 22°C, then with liquid-phase CO2 at a temperature of 22°C and pressures from 7 MPa to 17 MPa in steps of 5 MPa. Confining pressures varied from 10 MPa to 65 MPa. Ultrasonic waveforms for both P- and S-waves were recorded at each effective pressure increment. Velocity versus effective pressure responses were calculated from the experimental data for both P- and S-waves. Attenuations (1/Qp) were calculated from the waveform data using spectral ratio methods. Theoretical calculations of velocity as a function of effective pressure for each sandstone were made using the CO2 pressure-density and CO2 bulk modulus-pressure phase diagrams and Gassmann effective medium theory.
Flooding the cores with gaseous phase CO2 produced negligible change in velocity-effective stress relationships compared to the dry state (air saturated). Flooding with liquid-phase CO2 at various pore pressures lowered velocities by approximately 8% on average compared to the air-saturated state. Attenuations increased with liquid-phase CO2 flooding compared to the air-saturated case. Experimental data agreed with the Gassmann calculations at high effective pressures. The “critical” effective pressure, at which agreement with theory occurred, varied with sandstone type. Discrepancies are thought to be due to differing micro-crack populations in the microstructure of each sandstone type. The agreement with theory at high effective pressures is significant and gives some confidence in predicting seismic behaviour under field conditions when CO2 is injected.
INTRODUCTION
Geological sequestration of CO2 is considered by many organisations to be a viable means of dealing with the problem of carbon dioxide generation from the burning of fossil fuels, particularly in the electrical power generating industries. The intention is to inject CO2 into the subsurface at locations and depths associated with depleted hydrocarbon fields. In many of these fields CO2 has existed naturally for millennia either as free gas, locked in carbonates, or dissolved in oils or brines. Provided that the existing reservoir seals remain intact, sequestration of CO2 at depth in depleted hydrocarbon fields should present negligible risk in the near or distant future. Thus, geological sequestration can be regarded as one of the promising mitigation strategies against the negative effects of atmospheric carbon dioxide on global climate change.
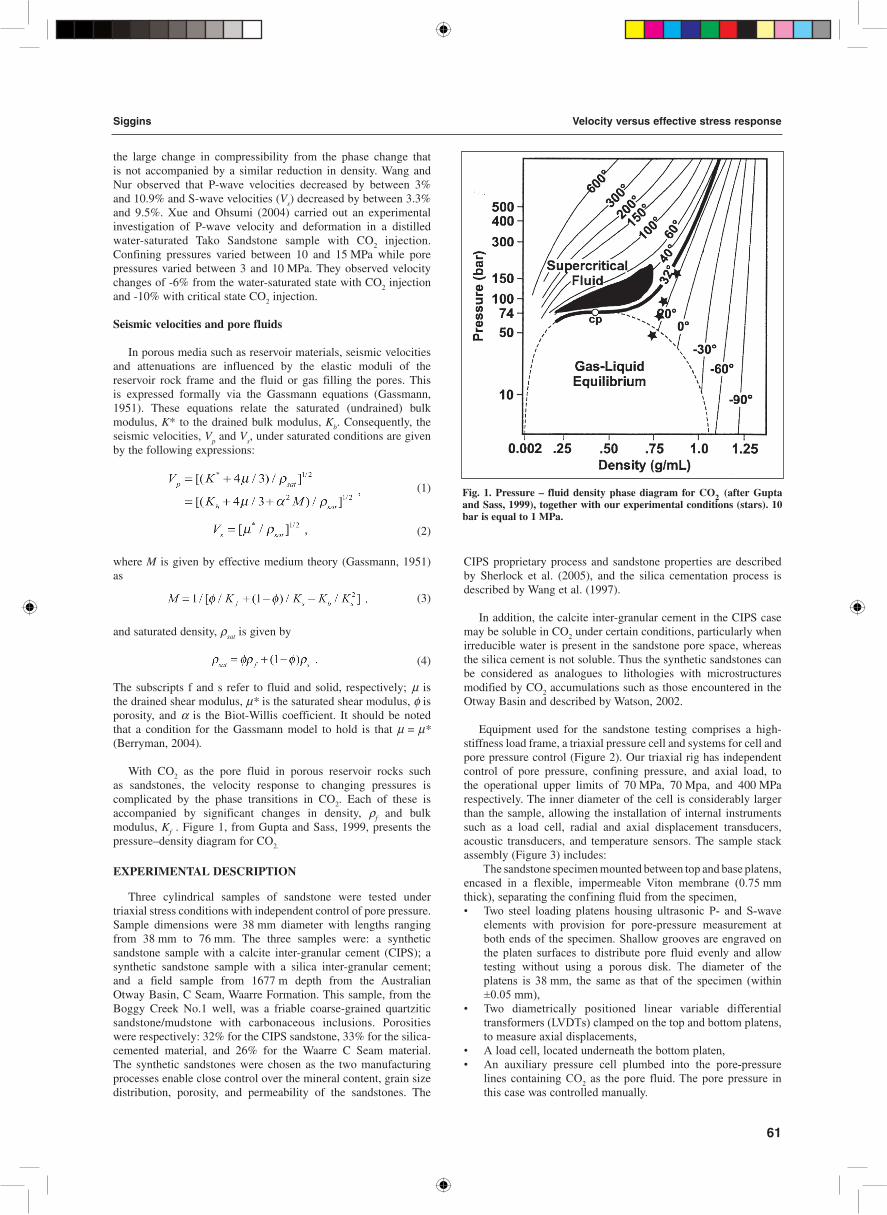
Dependent on the depth of storage, CO2 will exist in various phases: at shallow depths and at ambient temperatures carbon dioxide at pore pressures less than 6 MPa will exist in the pore space of the subsurface lithology in the gaseous phase. At greater depths, where pore pressures exceed 6 MPa, carbon dioxide will be in the liquid phase. When pore pressures are above 7.38 MPa and temperatures are above 31oC, CO2 will be in the supercritical phase.
Currently, one of the most practical geophysical remote sensing tools for monitoring subsurface CO2 injection is seismic imaging. This can be in the form of common depth point reflection profiling, vertical seismic profiling, cross-hole tomography, or borehole acoustic logging. Interpretation of seismic data for the quantitative measurement of the distribution and saturations of CO2 in the subsurface requires a detailed knowledge of the effects of CO2 as a pore fluid on the seismo-acoustic response of the reservoir rocks. This paper describes some recent experiments designed to investigate this aspect under controlled laboratory conditions, but at pressures representative of in-situ reservoir conditions.
Previous work
Literature on laboratory measurements of the effects of CO2 on the seismic properties of reservoir rocks is relatively sparse. Wang and Nur (1989) measured ultrasonic compressional (P) and shear (S) wave velocities in seven sandstones and one unconsolidated sand saturated with hexadecane, both before and after CO2 flooding over a range of pore pressures and at temperatures above and below the critical point.
When hydrocarbons in saturated reservoirs are displaced with CO2 the seismic velocity behaves in a complicated manner, because above the critical pressure the density of CO2 is similar to oil, but the bulk modulus is closer to that of a gas. Duranti et al. (2000) have shown that the interaction between the density and compressibility of the CO2 pore fluid and the subsequent effect on the seismic properties is mostly governed by pressure conditions. Ultrasonic P-wave velocities in the CO2 flooded sandstones cores tested by Wang and Nur (1989) showed a marked decrease in P-wave velocities (Vp) above the critical pressure as a result of
Cooperative Research Centre for Greenhouse Gas Technologies CSIRO Petroleum PO Box 1130 Bentley, WA, Australia, 6102 Phone: +61 8 6436 8730 Facsimile: +61 8 6436 8555 Email: [email protected]
Manuscript received 23 November, 2004. Revised manuscript received 13 December, 2005.
the large change in compressibility from the phase change that is not accompanied by a similar reduction in density. Wang and Nur observed that P-wave velocities decreased by between 3% and 10.9% and S-wave velocities (Vs) decreased by between 3.3% and 9.5%. Xue and Ohsumi (2004) carried out an experimental investigation of P-wave velocity and deformation in a distilled water-saturated Tako Sandstone sample with CO2 injection. Confining pressures varied between 10 and 15 MPa while pore pressures varied between 3 and 10 MPa. They observed velocity changes of -6% from the water-saturated state with CO2 injection and -10% with critical state CO2 injection.
Seismic velocities and pore fluids
In porous media such as reservoir materials, seismic velocities and attenuations are influenced by the elastic moduli of the reservoir rock frame and the fluid or gas filling the pores. This is expressed formally via the Gassmann equations (Gassmann, 1951). These equations relate the saturated (undrained) bulk modulus, K* to the drained bulk modulus, Kb. Consequently, the seismic velocities, Vp and Vs, under saturated conditions are given by the following expressions:
(1)
(2)
where M is given by effective medium theory (Gassmann, 1951) as (3)
and saturated density, ρsat is given by
(4)
The subscripts f and s refer to fluid and solid, respectively; µ is the drained shear modulus, µ* is the saturated shear modulus, φ is porosity, and α is the Biot-Willis coefficient. It should be noted that a condition for the Gassmann model to hold is that µ = µ* (Berryman, 2004).
With CO2 as the pore fluid in porous reservoir rocks such as sandstones, the velocity response to changing pressures is complicated by the phase transitions in CO2. Each of these is accompanied by significant changes in density, ρf and bulk modulus, Kf . Figure 1, from Gupta and Sass, 1999, presents the pressure–density diagram for CO2.
EXPERIMENTAL DESCRIPTION
Three cylindrical samples of sandstone were tested under triaxial stress conditions with independent control of pore pressure. Sample dimensions were 38 mm diameter with lengths ranging from 38 mm to 76 mm. The three samples were: a synthetic sandstone sample with a calcite inter-granular cement (CIPS); a synthetic sandstone sample with a silica inter-granular cement; and a field sample from 1677 m depth from the Australian Otway Basin, C Seam, Waarre Formation. This sample, from the Boggy Creek No.1 well, was a friable coarse-grained quartzitic sandstone/mudstone with carbonaceous inclusions. Porosities were respectively: 32% for the CIPS sandstone, 33% for the silica-cemented material, and 26% for the Waarre C Seam material. The synthetic sandstones were chosen as the two manufacturing processes enable close control over the mineral content, grain size distribution, porosity, and permeability of the sandstones. The
CIPS proprietary process and sandstone properties are described by Sherlock et al. (2005), and the silica cementation process is described by Wang et al. (1997).
In addition, the calcite inter-granular cement in the CIPS case may be soluble in CO2 under certain conditions, particularly when irreducible water is present in the sandstone pore space, whereas the silica cement is not soluble. Thus the synthetic sandstones can be considered as analogues to lithologies with microstructures modified by CO2 accumulations such as those encountered in the Otway Basin and described by Watson, 2002.
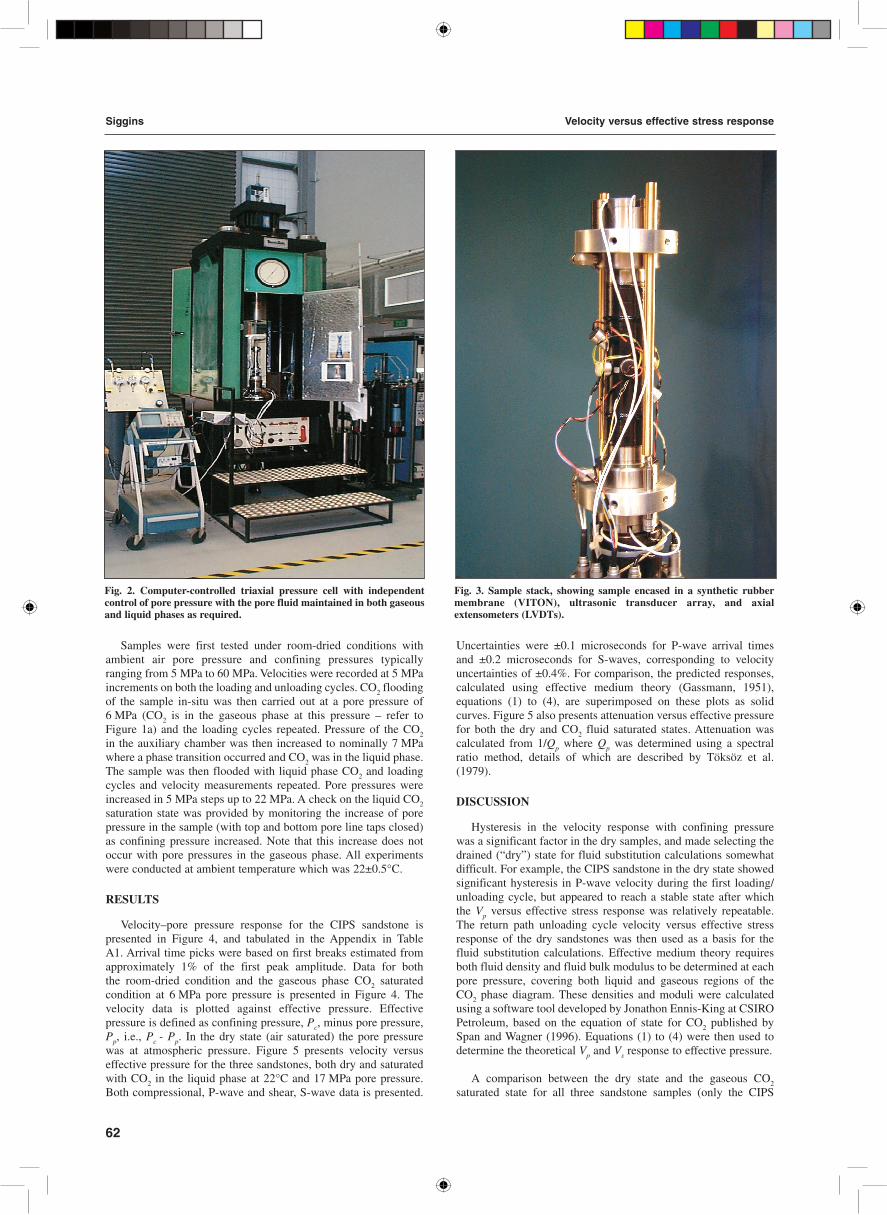
Equipment used for the sandstone testing comprises a high-stiffness load frame, a triaxial pressure cell and systems for cell and pore pressure control (Figure 2). Our triaxial rig has independent control of pore pressure, confining pressure, and axial load, to the operational upper limits of 70 MPa, 70 Mpa, and 400 MPa respectively. The inner diameter of the cell is considerably larger than the sample, allowing the installation of internal instruments such as a load cell, radial and axial displacement transducers, acoustic transducers, and temperature sensors. The sample stack assembly (Figure 3) includes:
The sandstone specimen mounted between top and base platens, encased in a flexible, impermeable Viton membrane (0.75 mm thick), separating the confining fluid from the specimen,• Two steel loading platens housing ultrasonic P- and S-wave
elements with provision for pore-pressure measurement at both ends of the specimen. Shallow grooves are engraved on the platen surfaces to distribute pore fluid evenly and allow testing without using a porous disk. The diameter of the platens is 38 mm, the same as that of the specimen (within ±0.05 mm),
• Two diametrically positioned linear variable differential transformers (LVDTs) clamped on the top and bottom platens, to measure axial displacements,
• A load cell, located underneath the bottom platen,• An auxiliary pressure cell plumbed into the pore-pressure
lines containing CO2 as the pore fluid. The pore pressure in this case was controlled manually.
Siggins Velocity versus effective stress response
61
Fig. 1. Pressure – fluid density phase diagram for CO2 (after Gupta and Sass, 1999), together with our experimental conditions (stars). 10 bar is equal to 1 MPa.
Samples were first tested under room-dried conditions with ambient air pore pressure and confining pressures typically ranging from 5 MPa to 60 MPa. Velocities were recorded at 5 MPa increments on both the loading and unloading cycles. CO2 flooding of the sample in-situ was then carried out at a pore pressure of 6 MPa (CO2 is in the gaseous phase at this pressure – refer to Figure 1a) and the loading cycles repeated. Pressure of the CO2 in the auxiliary chamber was then increased to nominally 7 MPa where a phase transition occurred and CO2 was in the liquid phase. The sample was then flooded with liquid phase CO2 and loading cycles and velocity measurements repeated. Pore pressures were increased in 5 MPa steps up to 22 MPa. A check on the liquid CO2 saturation state was provided by monitoring the increase of pore pressure in the sample (with top and bottom pore line taps closed) as confining pressure increased. Note that this increase does not occur with pore pressures in the gaseous phase. All experiments were conducted at ambient temperature which was 22±0.5°C.
RESULTS
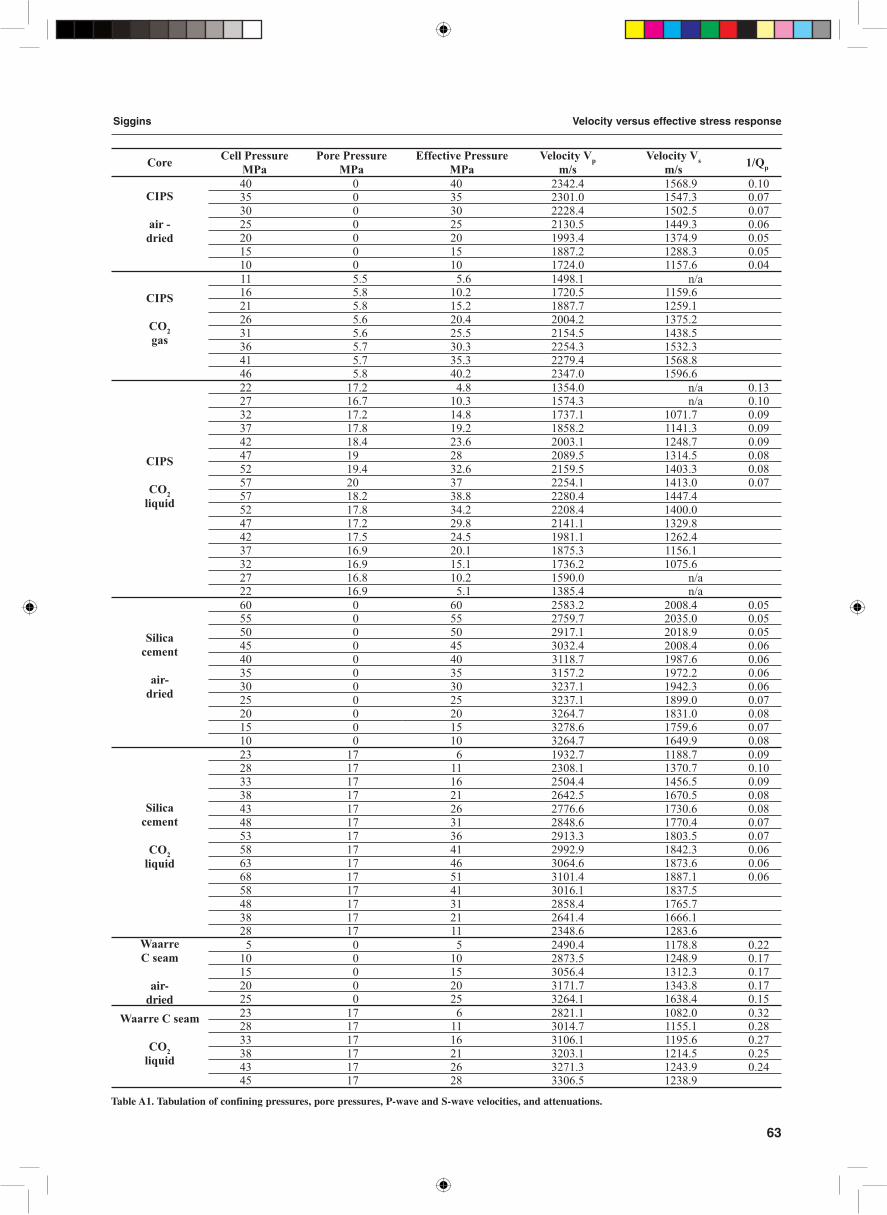
Velocity–pore pressure response for the CIPS sandstone is presented in Figure 4, and tabulated in the Appendix in Table A1. Arrival time picks were based on first breaks estimated from approximately 1% of the first peak amplitude. Data for both the room-dried condition and the gaseous phase CO2 saturated condition at 6 MPa pore pressure is presented in Figure 4. The velocity data is plotted against effective pressure. Effective pressure is defined as confining pressure, Pc, minus pore pressure, Pp, i.e., Pc - Pp. In the dry state (air saturated) the pore pressure was at atmospheric pressure. Figure 5 presents velocity versus effective pressure for the three sandstones, both dry and saturated with CO2 in the liquid phase at 22°C and 17 MPa pore pressure. Both compressional, P-wave and shear, S-wave data is presented.
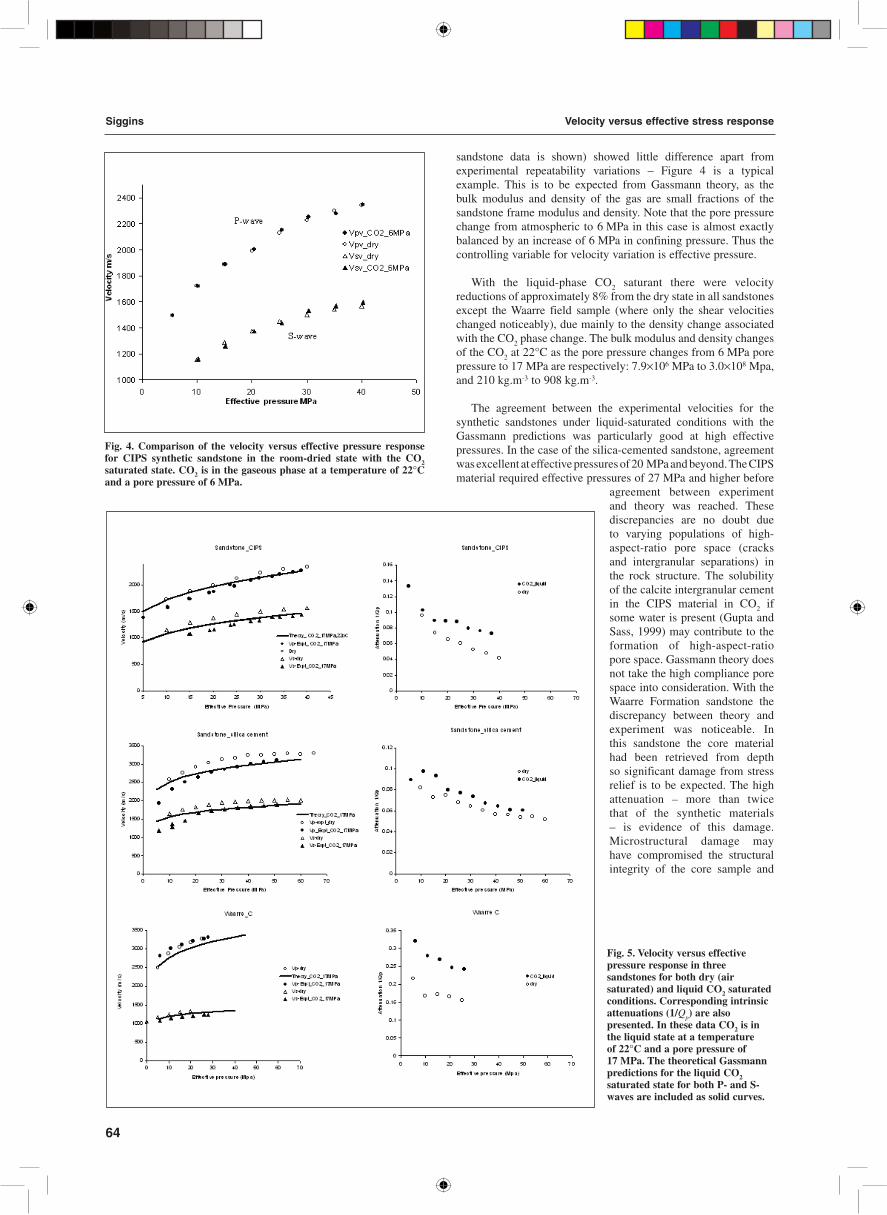
Uncertainties were ±0.1 microseconds for P-wave arrival times and ±0.2 microseconds for S-waves, corresponding to velocity uncertainties of ±0.4%. For comparison, the predicted responses, calculated using effective medium theory (Gassmann, 1951), equations (1) to (4), are superimposed on these plots as solid curves. Figure 5 also presents attenuation versus effective pressure for both the dry and CO2 fluid saturated states. Attenuation was calculated from 1/Qp where Qp was determined using a spectral ratio method, details of which are described by Töksöz et al. (1979).
DISCUSSION
Hysteresis in the velocity response with confining pressure was a significant factor in the dry samples, and made selecting the drained (“dry”) state for fluid substitution calculations somewhat difficult. For example, the CIPS sandstone in the dry state showed significant hysteresis in P-wave velocity during the first loading/unloading cycle, but appeared to reach a stable state after which the Vp versus effective stress response was relatively repeatable. The return path unloading cycle velocity versus effective stress response of the dry sandstones was then used as a basis for the fluid substitution calculations. Effective medium theory requires both fluid density and fluid bulk modulus to be determined at each pore pressure, covering both liquid and gaseous regions of the CO2 phase diagram. These densities and moduli were calculated using a software tool developed by Jonathon Ennis-King at CSIRO Petroleum, based on the equation of state for CO2 published by Span and Wagner (1996). Equations (1) to (4) were then used to determine the theoretical Vp and Vs response to effective pressure.
A comparison between the dry state and the gaseous CO2 saturated state for all three sandstone samples (only the CIPS
Fig. 2. Computer-controlled triaxial pressure cell with independent control of pore pressure with the pore fluid maintained in both gaseous and liquid phases as required.
Fig. 3. Sample stack, showing sample encased in a synthetic rubber membrane (VITON), ultrasonic transducer array, and axial extensometers (LVDTs).
Table A1. Tabulation of confining pressures, pore pressures, P-wave and S-wave velocities, and attenuations.
Siggins Velocity versus effective stress response
63
sandstone data is shown) showed little difference apart from experimental repeatability variations – Figure 4 is a typical example. This is to be expected from Gassmann theory, as the bulk modulus and density of the gas are small fractions of the sandstone frame modulus and density. Note that the pore pressure change from atmospheric to 6 MPa in this case is almost exactly balanced by an increase of 6 MPa in confining pressure. Thus the controlling variable for velocity variation is effective pressure.
With the liquid-phase CO2 saturant there were velocity reductions of approximately 8% from the dry state in all sandstones except the Waarre field sample (where only the shear velocities changed noticeably), due mainly to the density change associated with the CO2 phase change. The bulk modulus and density changes of the CO2 at 22°C as the pore pressure changes from 6 MPa pore pressure to 17 MPa are respectively: 7.9×10⁶ MPa to 3.0×10⁸ Mpa, and 210 kg.m-3 to 908 kg.m-3.
The agreement between the experimental velocities for the synthetic sandstones under liquid-saturated conditions with the Gassmann predictions was particularly good at high effective pressures. In the case of the silica-cemented sandstone, agreement was excellent at effective pressures of 20 MPa and beyond. The CIPS material required effective pressures of 27 MPa and higher before
agreement between experiment and theory was reached. These discrepancies are no doubt due to varying populations of high-aspect-ratio pore space (cracks and intergranular separations) in the rock structure. The solubility of the calcite intergranular cement in the CIPS material in CO2 if some water is present (Gupta and Sass, 1999) may contribute to the formation of high-aspect-ratio pore space. Gassmann theory does not take the high compliance pore space into consideration. With the Waarre Formation sandstone the discrepancy between theory and experiment was noticeable. In this sandstone the core material had been retrieved from depth so significant damage from stress relief is to be expected. The high attenuation – more than twice that of the synthetic materials – is evidence of this damage. Microstructural damage may have compromised the structural integrity of the core sample and
Fig. 4. Comparison of the velocity versus effective pressure response for CIPS synthetic sandstone in the room-dried state with the CO2 saturated state. CO2 is in the gaseous phase at a temperature of 22°C and a pore pressure of 6 MPa.
Fig. 5. Velocity versus effective pressure response in three sandstones for both dry (air saturated) and liquid CO2 saturated conditions. Corresponding intrinsic attenuations (1/Qp) are also presented. In these data CO2 is in the liquid state at a temperature of 22°C and a pore pressure of 17 MPa. The theoretical Gassmann predictions for the liquid CO2 saturated state for both P- and S-waves are included as solid curves.
Siggins Velocity versus effective stress response
64
contributed to the lack of sensitivity of the P-wave velocity to CO2 saturation. Extrapolation of the velocity versus effective stress data trend in the Waarre Formation sample indicates that effective pressures of ~40 MPa are required before agreement with the Gassmann predictions is reached.
Critical state CO2
Figure 6 displays again the CIPS sample data, including the computed responses (solid lines), with liquid CO2 at 17 MPa and 22°C as the pore fluid. However, additional theoretical responses have been included for comparison. Theoretical curves (dashed lines) have been computed from the dry velocity data with CO2 in the “super-critical” state at 17 MPa and 65°C substituted as the pore fluid. There is a further reduction in P-wave velocity, mainly due to the lower bulk modulus, 6.97×10⁷ MPa, of the super-critical fluid while density decreases to 623 kg.m-3. There is only a small change in the S-wave response amounting to a slight increase due to the density reduction.
CONCLUSIONS
Compared to the dry unsaturated state, both P-wave and S-wave velocities decreased in all synthetic sandstones with the addition of liquid CO2 in the saturated state. On average, this decrease was of the order of ~8%, although the reduction in velocity varied slightly with effective pressure.
Intrinsic attenuations (1/Qp) in all sandstones increased with liquid phase CO2 saturation.
There was good agreement between the experimental results and the Gassmann predictions for the synthetic materials, particularly at effective pressures exceeding 30 MPa. Effective pressures at sequestration sites in the field are expected to be of the order of 25 MPa.
Fig. 6. Velocity–effective pressure data from an experiment on the CIPS synthetic sandstone. Dry core data is presented together with the liquid saturated CO2 response with the CO2 at a pore pressure of 17 MPa at a temperature of 22°C. For comparison the theoretical response using Gassmann theory is shown as a solid curve together with the expected behaviour with CO2 in the “super-critical” phase at a pore pressure of 17 MPa at a temperature of 65°C – dashed curve.
At low effective pressures, velocities were lower than the Gassmann predictions in all cases. This is thought to be due to the presence of both compliant porosity (high-aspect-ratio cracks) and less-compliant or “equant” porosity contributions to the sandstone microstructure. This departure was more pronounced in the calcite-cemented sandstone, possibly because of the solubility of the calcite cement in CO2 with some small amounts of water present. (Samples were air-dried at room temperature).
The Waarre Formation C Seam core sample showed poorer agreement with Gassmann predictions than the synthetic samples. Attenuations were also very high (more than twice that of the other samples). This is considered to result from the presence of considerable damage (cracks), possibly due to stress relief during coring. Possible breakdown of the carbonaceous elements in the microstructure during the testing may also be a contributing factor.
These results should be a useful guide for interpreting the response of time-lapse seismic monitoring of similar sandstone formations following CO2 injection at depth. In particular, the experiments and theory indicate that the change in P-wave velocity with CO2 in the liquid phase to the supercritical phase will be difficult to distinguish.
ACKNOWLEDGMENTS
This work was carried out with support from the Cooperative Research Centre for Greenhouse Gas Technologies, Storage Program under the Monitoring and Verification Project. The author thanks his colleagues David Dewhurst, Craig Harbers, and Kevin Dodds for support during these experiments.
REFERENCES
Berryman J.G., 1999, Origin of Gassmann’s equation: Geophysics, 64, 1627–1629.
Duranti, L., Davis, T. L., and Benson, R.D., 2000, Time-lapse analysis and detection of fluid changes at Vacuum Field, New Mexico: 70th Annual International Meeting, Society of Exploration Geophysicists, Extended Abstracts, 1528–1531.
Gassmann F., 1951, Über die Elastizität poröser Medien: Vierteljahrsschrift der Naturforschenden Gesellschaft in Zürich, 96, 1–23.
Gupta, N., and Sass, B., 1999, Hydrodynamic and geochemical modeling for carbon dioxide sequestration in deep saline formations, Final Report, 28 February 1999: DE-AF26-98FT00874: Report to US Department of Energy (DOE), Federal Energy Technology Center.
Sherlock, D.H., Scoby-Smith, L., and Montague, E., 2005, Time-lapse analogue reservoir modelling of turbidite channel sands: Exploration Geophysics, 36, 216–223.
Span, R., and Wagner, W., 1996, A new equation of state for Carbon Dioxide covering the fluid region from the Triple-Point temperature to 1100 K at pressures up to 800 Mpa: Journal of Physical and Chemical Reference Data, 25, 1509–1596.
Töksöz, M.N., Johnston, D.H., and Timur, A., 1979, Attenuation of seismic waves in dry and saturated rocks. 1, Laboratory measurements: Geophysics, 44, 681–690.
Wang, Z., and Nur, A.M., 1989, Effects of CO2 flooding on wave velocities in rocks with hydrocarbons: SPE Reservoir Engineering, 4, 429–436.
Wang, D.F., Yassir, N., Enever, J., and Davies, P., 1997, Laboratory investigation of core-based stress measurement using synthetic sandstone: International Journal of Rock Mechanics and Mining Sciences & Geomechanics Abstracts, 34, 654.
Watson, M.N., Zwingmann, N., and Lemon, N.M., 2004, The Ladbroke Grove-Katnook Carbon Dioxide Natural Laboratory: A Recent C02 Accumulation in a Lithic Sandstone Reservoir: Energy, 29, 1457–1466.
Xue, Z., and Ohsumi, T., 2004, Seismic monitoring of CO2 migration in water-saturated porous sandstone: Exploration Geophysics, 35, 25–32.