4. Lecture: Introduction to IPCC AR5 Hirokazu Murai Climate Prediction Division Japan Meteorological Agency TCC Training Seminar on , Global Warming Projection Information 26 January 2015 (Tokyo, Japan) 1
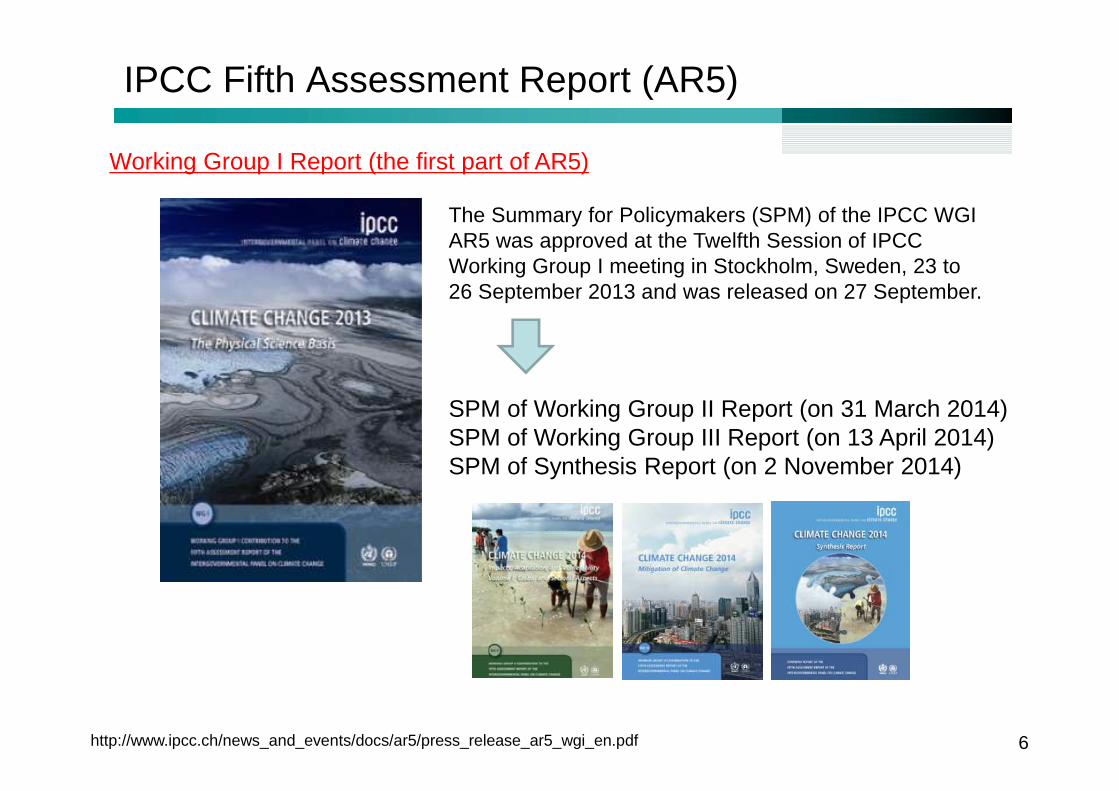
The Summary for Policymakers (SPM) of the IPCC WGI AR5 was approved at the Twelfth Session of IPCC Working Group I meeting in Stockholm, Sweden, 23 to 26 September 2013 and was released on 27 September.
SPM of Working Group II Report (on 31 March 2014)SPM of Working Group III Report (on 13 April 2014)SPM of Synthesis Report (on 2 November 2014)
10 Detection and Attribution of Climate Change : from Global to Regional
11 Near-term Climate Change : Projections and Predictability
12 Long-term Climate Change : Projections, Commitments and Irreversibility
13 Sea Level Change
14 Climate Phenomena and their Relevance for Future Regional Climate Change
I recommend you to read the SPM at least once !
8
Likelihood and Confidence
SPM of WGI AR5
• This report is using a consistent expression of likelihood and confidence.
Term Likelihood of the outcome
Virtually certain 99-100% probability
Extremely likely 95-100% probability
Very likely 90-100% probability
Likely 66-100% probability
More likely than not 50-100% probability
About as likely as not 33-66% probability
Unlikely 0-33% probability
Very unlikely 0-10% probability
Extremely unlikely 0-5% probability
Exceptionally unlikely 0-1% probabilityVery high
High
Medium
Low
Very low
Likelihood Confidence
probabilistically with a quantified likelihood qualitative level
This Lecture’s Schedule
9
14:15 – 16:00
1. About IPCC and its reports
2. What is written in the IPCC AR5 ?
3. Let’s read IPCC AR5
10
Observed Climate Change (1)
Top panel : annual mean values.Bottom panel : decadal mean values including the estimate of uncertainty for one dataset (black). Anomalies are relative to the mean of 1961−1990. Left panel : Temperature trends determined by linearregression.
• Warming of the climate system is unequivocal.
• Each of the last three decades has been successively warmer at the Earth’s surface than any preceding decade since 1850.
• For the longest period when calculation of regional trends is sufficiently complete (1901 to 2012), almost the entire globe has experienced surface warming.
WGI AR5 Figure SPM.1
11WGI AR5 Figure SPM.2
Observed Climate Change (2)
• Confidence in precipitation change averaged over global land areas since 1901 is low prior to 1951 and medium afterwards.
• Averaged over the mid-latitude land areas of the Northern Hemisphere, precipitation has increased since 1901 (medium confidence before and high confidence after 1951).
• For other latitudes area-averaged long-term positive or negative trends have low confidence.
12WGI AR5 Figure SPM.3
Observed Climate Change (3)
• Northern Hemisphere spring snow cover and Arctic sea ice have continued to decrease in extent (high confidence).
• Over the last two decades, the Greenland and Antarctic ice sheets have been losing mass, glaciers have continued to shrink almost worldwide.
13WGI AR5 Figure SPM.3, WGI AR5 FAQ 5.2Figure 1
Observed Climate Change (4)
• Over the period 1901 to 2010, global mean sea level rose by 0.19 [0.17 to 0.21] m.
• The rate of sea level rise since the mid-19th century has been larger than the mean rate during the previous two millennia (high confidence).
• Since the early 1970s, glacier mass loss and ocean thermal expansion from warming together explain about 75% of the observed global mean sea level rise.
+ leadtosurfacewarming
- lead to surface cooling
Drivers of Climate Change (1)
• Natural and anthropogenic substances and processes that alter the Earth’s energy budget are drivers of climate change.
• The strength of drivers is quantified as Radiative Forcing (RF) in units watts per square metre as in previous IPCC assessments.
• RF quantifies the change in energy fluxes caused by changes in thesedrivers for 2011 relative to 1750, unless otherwise indicated.
• Positive RF leads to surface warming, negative RF leads to surface cooling.
14WGI AR5 Figure 2.11
Energy budget of climate system
Infrared radiation
Drivers of Climate Change (2)
• The RF can be reported based on the concentration changes of eachsubstance. Alternatively, the emission-based RF of a compound can bereported, which provides a more direct link to human activities.
• Total radiative forcing is positive, and has led to an uptake of energy by theclimate system.
• The largest contribution to total radiative forcing is caused by the increasein the atmospheric concentration of CO2 since 1750.
15WGI AR5 Figure SPM.5
16WGI AR5 Figure SPM.6
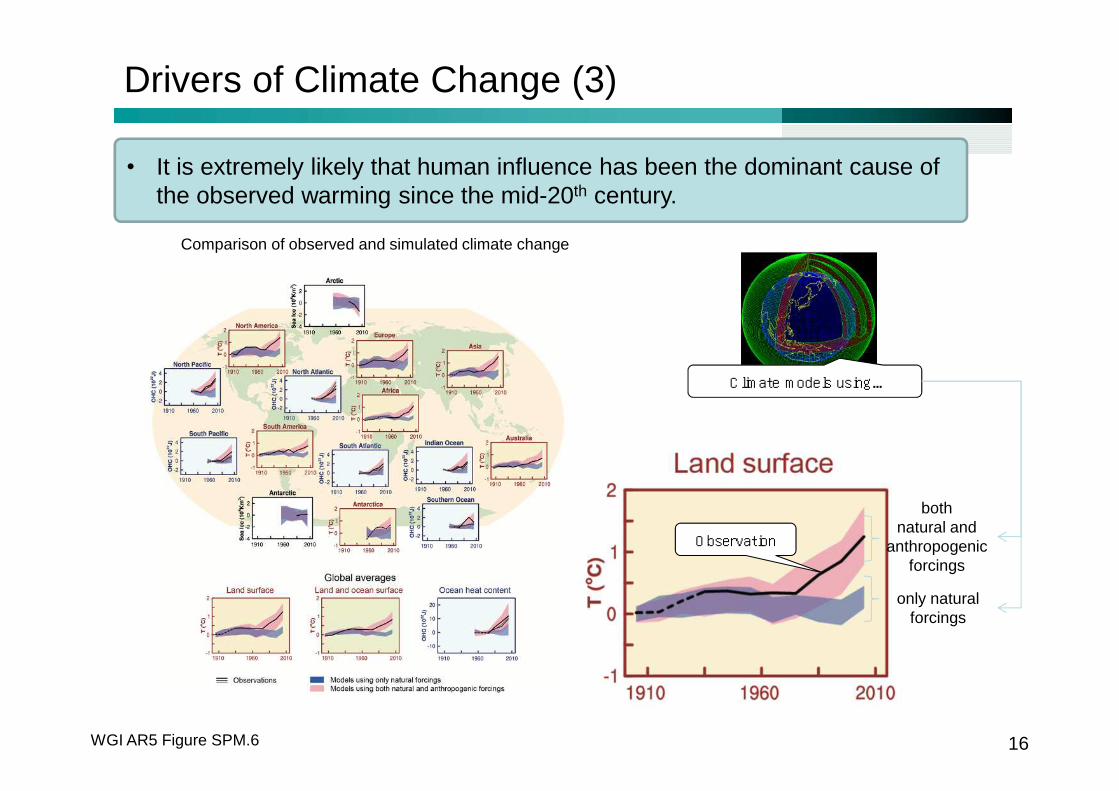
Drivers of Climate Change (3)
• It is extremely likely that human influence has been the dominant cause ofthe observed warming since the mid-20th century.
Observation
Climate models using...
both natural and
anthropogenic forcings
only natural forcings
Comparison of observed and simulated climate change
17
Before explaining future climate change…
WG1 AR5 Figure TS.19
Representative Concentration Pathways (RCPs)
• RCPs are four scenarios of assumed pathway in order to project climate change in the future.
• RCP8.5 is a scenario which assumes no additional mitigation.
• RCP2.6 is a scenario which assumes keeping the temperature rise from pre-industrial to less than 2 deg C.
18
Future Climate Change (1)
• Increase of global mean surface temperatures for 2081–2100 relative to 1986–2005 is projected to 0.3-1.7°C (RCP2.6), 1.1-2.6°C(RCP4.5), 1.4-3.1°C (RCP6.0), 2.6-4.8°C (RCP8.5).
• The Arctic region will warm more rapidly than the global mean, and mean warming over land will be larger than over the ocean (very high confidence).
WG1 AR5 Figure SPM.7, SPM.8
19WG1 AR5 Figure SPM.8
Future Climate Change (2)
• Changes in the global water cycle in response to the warming over the 21st
century will not be uniform.• The contrast in precipitation between wet and dry regions and between wet
and dry seasons will increase, although there may be regional exceptions.
20WG1 AR5 Figure 12.27
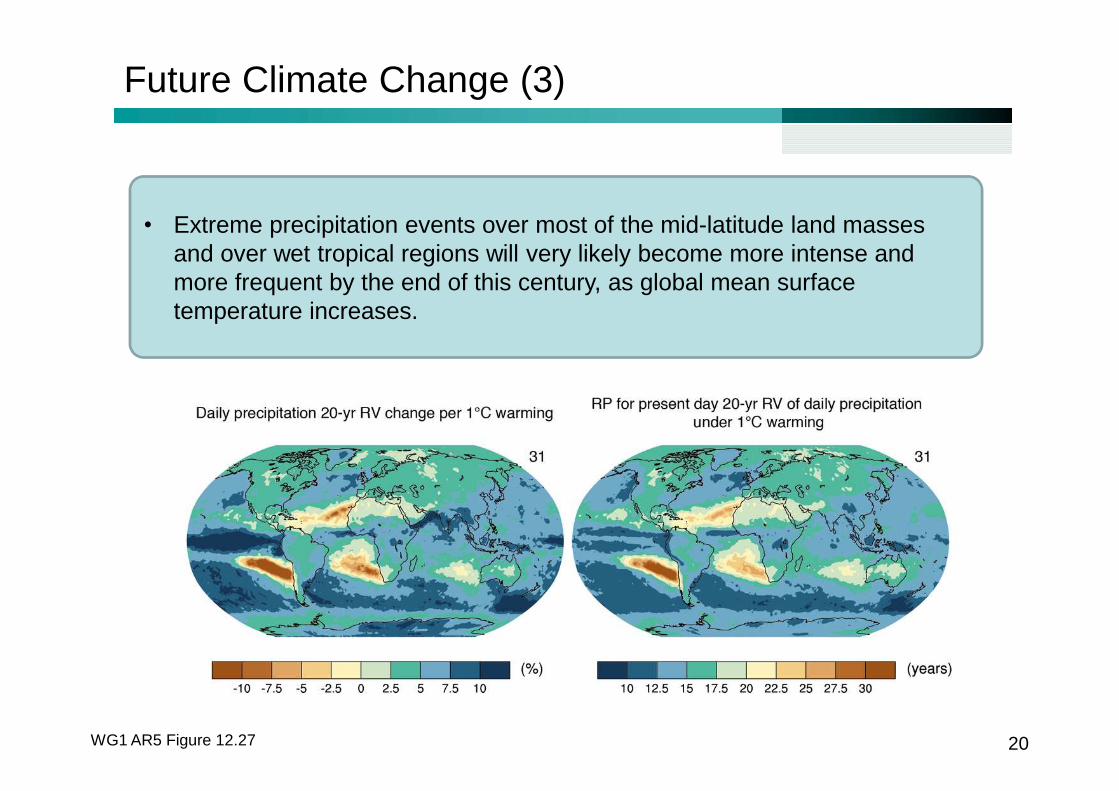
Future Climate Change (3)
• Extreme precipitation events over most of the mid-latitude land masses and over wet tropical regions will very likely become more intense and more frequent by the end of this century, as global mean surface temperature increases.
21WG1 AR5 Figure SPM.9
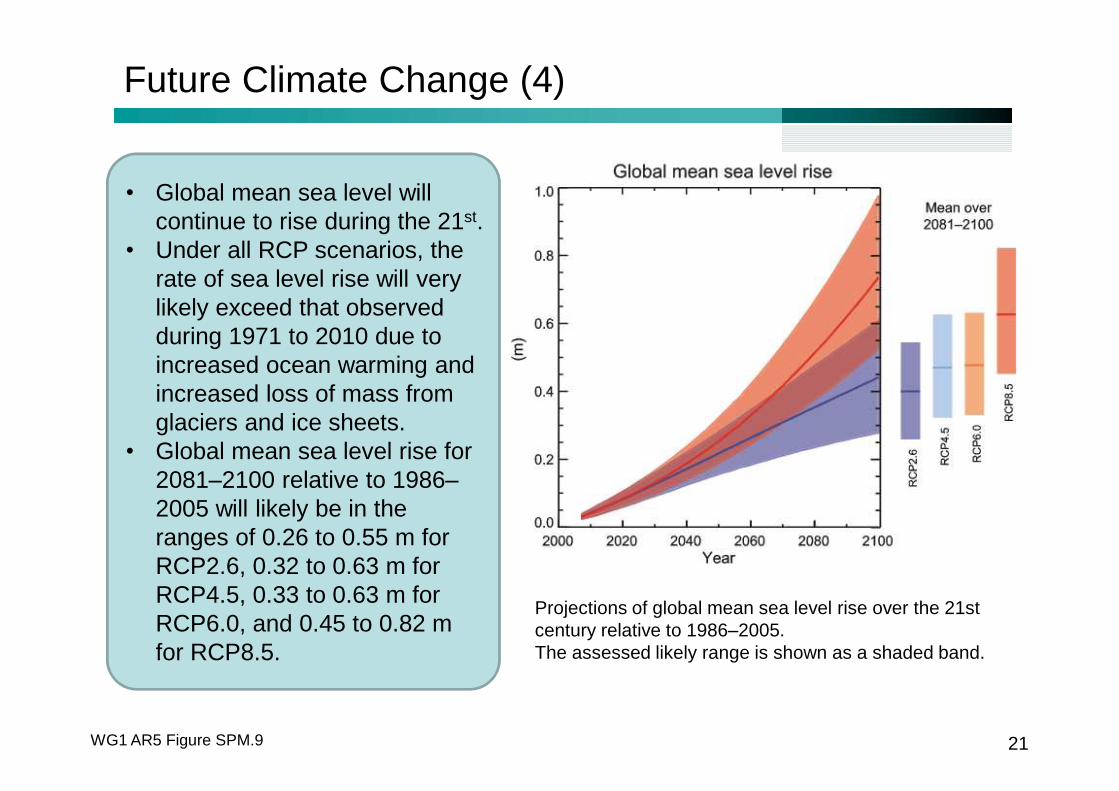
Future Climate Change (4)
• Global mean sea level will continue to rise during the 21st.
• Under all RCP scenarios, the rate of sea level rise will very likely exceed that observed during 1971 to 2010 due to increased ocean warming and increased loss of mass from glaciers and ice sheets.
• Global mean sea level rise for 2081–2100 relative to 1986–2005 will likely be in the ranges of 0.26 to 0.55 m for RCP2.6, 0.32 to 0.63 m for RCP4.5, 0.33 to 0.63 m for RCP6.0, and 0.45 to 0.82 m for RCP8.5.
Projections of global mean sea level rise over the 21st century relative to 1986–2005.The assessed likely range is shown as a shaded band.
22
Future Climate Change (5)
WG1 AR5 Fig.SPM.10
• Cumulative total emissions of CO2and global mean surfacetemperature response areapproximately linearly related.
• Any given level of warming isassociated with a range ofcumulative CO2 emissions, andtherefore, e.g., higher emissions inearlier decades imply loweremissions later.
Limiting the warming with aprobability to less than 2 degC since the period 1861-1880
Only anthropogenic CO2 emissions
Accounting for non-CO2 forcings as in RCP2.6
> 33 % About 1570 About 900
> 50 % About 1210 About 820
> 66 % About 1000 About 790
・An amount of 515 [445 to 585] GtCwas already emitted by 2011.
Upper amount of cumulative total emissions of CO2 (GtC)
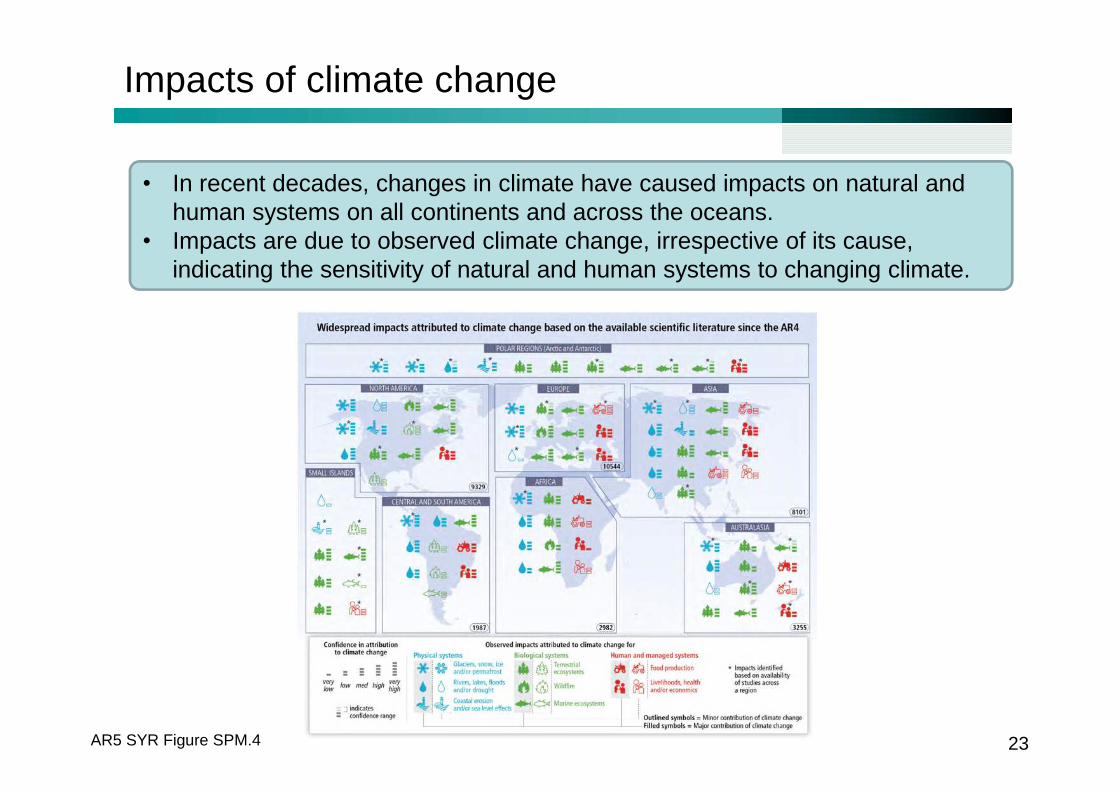
Impacts of climate change
• In recent decades, changes in climate have caused impacts on natural and human systems on all continents and across the oceans.
• Impacts are due to observed climate change, irrespective of its cause, indicating the sensitivity of natural and human systems to changing climate.
23AR5 SYR Figure SPM.4
Illustration of the core concepts of the WGII AR5
• Risk of climate-related impacts results from the interaction of climate-related hazards with the vulnerability and exposure of human and natural systems.
• Changes in both the climate system and socioeconomic processes including adaptation and mitigation are drivers of hazards, exposure, and vulnerability.
24WG2 AR5 Figure SPM1
Vulnerability: The propensity or predisposition to be adversely affected. Vulnerability encompasses a variety of concepts and elements including sensitivity or susceptibility to harm and lack of capacity to cope
and adapt.Exposure: The presence of people, livelihoods, species or ecosystems, environmental functions, services, and resources, infrastructure, or economic, social, or cultural assets in places and settings that could be adversely affected.
Risk & potential for adaptation
• Adaptation is place- and context-specific, with no single approach for reducing risks appropriate across all settings.
25WG2 AR5 Assessment Box SPM.2 Table 1
Total annual anthropogenic greenhouse gas emissions
• Annual GHG emissions grew on average by 2.2 % per year from 2000 to 2010 compared to 1.3 % per year from 1970 to 2000.
• About half of cumulative anthropogenic CO2 emissions between 1750 and 2010 have occurred in the last 40 years.
26WG3 AR5 Figure SPM.1
Characteristics of mitigation pathways (1)
• There are multiple mitigation pathways that are likely to limit warming to below 2°C relative to preindustrial levels.
• These pathways would require substantial emissions reductions over the next few decades and near zero emission of CO2 and other long-lived GHGs by end of the century.
27WG3 AR5 Figure SPM.4
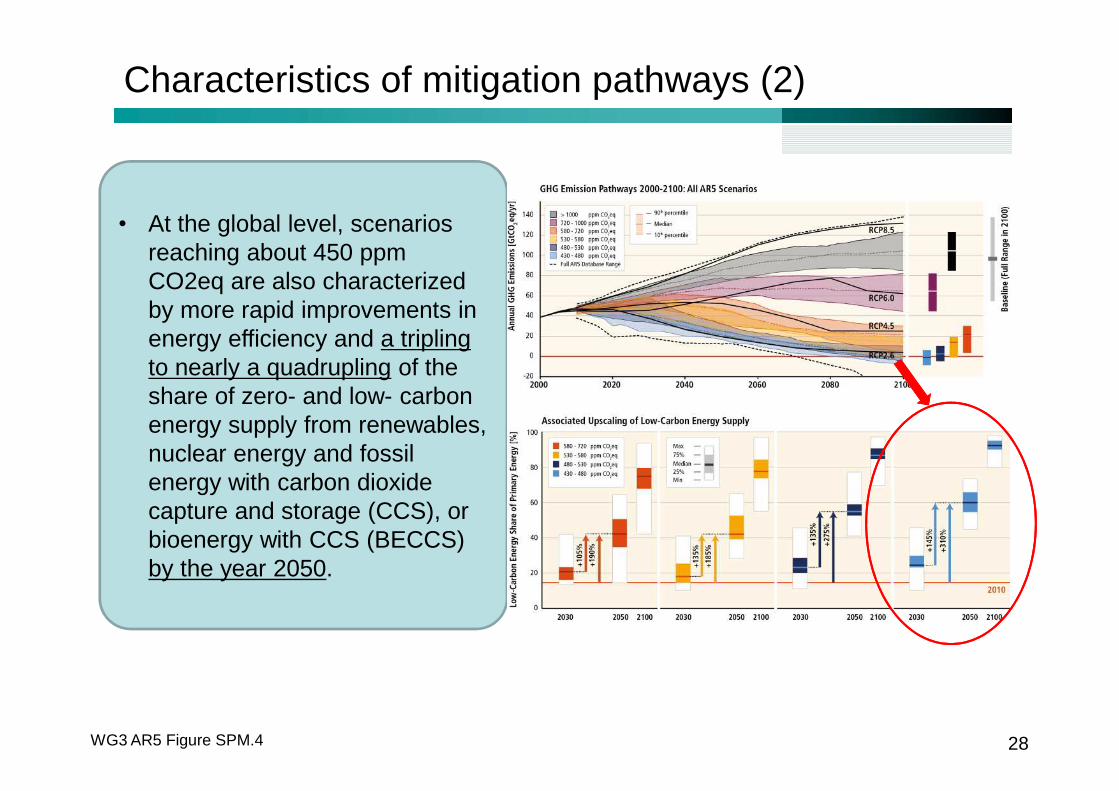
Characteristics of mitigation pathways (2)
• At the global level, scenarios reaching about 450 ppm CO2eq are also characterized by more rapid improvements in energy efficiency and a tripling to nearly a quadrupling of the share of zero- and low- carbon energy supply from renewables, nuclear energy and fossil energy with carbon dioxide capture and storage (CCS), or bioenergy with CCS (BECCS) by the year 2050.
28WG3 AR5 Figure SPM.4
Risks from climate change…
• The relationship between risk from climate change, temperature change, cumulative CO2 emissions, and changes in annual GHG emissions by 2050.
29AR5 SYR Figure SPM.10
Summary of IPCC AR5
30
• Warming of the climate system is unequivocal.• The atmosphere and ocean have warmed, the amounts of snow and ice
have diminished, sea level has risen, and the concentrations of GHGshave increased.
• Total radiative forcing is positive, and has led to an uptake of energy bythe climate system.
• It is extremely likely that human influence has been the dominant causeof the observed warming since the mid-20th century.
• Increase of global mean surface temperatures for 2081–2100 relative to 1986–2005 is projected to 0.3-1.7°C (RCP2.6), 1.1-2.6°C(RCP4.5), 1.4-3.1°C (RCP6.0), 2.6-4.8°C (RCP8.5).
• Cumulative total emissions of CO2 and global mean surface temperatureresponse are approximately linearly related.
• In recent decades, changes in climate have caused impacts on natural and human systems on all continents and across the oceans.
• There are multiple mitigation pathways that are likely to limit warming to below 2°C relative to preindustrial levels.
Free time to read AR5
31
14:15 – 16:00
1. About IPCC and its reports
2. What is written in the IPCC AR5
3. Let’s read IPCC AR5
▶ Computer ▶ Local Disk (C:) ▶ TCC_2015 ▶ Doc ▶ IPCC_AR5