Page 1
Universitat Politecnica de Catalunya (UPC)Escola Tecnica Superior d’Enginyeria de Telecomunicacio de Barcelona (ETSETB)
A framework for network traffic analysis
using GPUs
by
Marc Sune Clos
Advisor: Isaac Gelado Fernandez
Barcelona, January 2010
Page 2
“Everything you say, you say about yourself, especially when you speak of others”Paul Valery (1871-1945)
“Tot el que dius parla de tu, especialment quan parles d’un altre”Paul Valery (1871-1945)
Page 3
Universitat Politecnica de Catalunya (UPC)
Abstract
Escola Tecnica Superior d’Enginyeria de Telecomunicacio de Barcelona (ETSETB)Departament d’Arquitectura de Computadors(DAC).
Grup de Sistemes Operatius (GSO)Computacio d’Altes Prestacions (CAP).
by Marc Sune Clos
During the last years the computer networks have become an important part of our society.Networks have kept growing in size and complexity, making more complex its managementand traffic monitoring and analysis processes, due to the huge amount of data and calculationsinvolved.
In the last decade, several researchers found effective to use graphics processing units (GPUs)rather than a traditional processors (CPU) to boost the execution of some algorithms not re-lated to graphics (GPGPU). In 2006 the GPU chip manufacturer NVIDIA launched CUDA, alibrary that allows software developers to use their GPUs to perform general purpose algorithmcalculations, using the C programming language.
This thesis presents a framework which tries to simplify the task of programming network trafficanalysis with CUDA to software developers. The objectives of the framework have been ab-stracting the task of obtaining network packets, simplify the task of creating network analysisprograms using CUDA and offering an easy way to reuse the analysis code. Several networktraffic analysis have also been developed.
Page 4
Acknowledgements
En primer lloc m’agradaria agraır al meu tutor Isaac Gelado primerament que em dones
la oportunitat de realitzat aquest projecte final de carrera. Agraır-li la seva dedicacio
i esforc, les seves indicacions i comentaris i la seva total predisposicio a resoldre els
innumerables dubtes que m’han anat sorgint durant la realitzacio d’aquest projecte. Per
tot aixo, gracies.
En segon lloc agraır als meus pares, Ester i Jesus i a la meva germana Anna el seu
suport, no solament durant la realitzacio d’aquest projecte, sino durant tota la carrera,
aguantar-me i animar-me en tot moment. Tambe agraır a tots els meus tiets i cosins el
seu suport. . . Ja ho sabeu, gracies.
Tambe, com no, a tota la gent de la uni i dels “di-Mars”; no m’agradaria deixar-me a
ningu (que segur que ho fare), pero gracies a en Jordi (fonamental), Gerard (quan no
dormia), Aleix (Barcelona’s pubs tourist guide), Dani (rock’n’roll star), Jesus, Fran,
Albert (compra’t un Lenovo ja! ), Marc Maceira, Lluis, Ramon, Victor, Miquel,
Yasmina i Ferran&Sandra. Gracies per els bons moments, i per ser-hi en els no tan
bons.
Haig d’agraır molt especialment a tres amics que “sempre estan alla”, tot i que ens
haguem pogut veure menys per culpa del projecte, a en Marc (de Sant Hilari), a
l’Alejandra i a en Bernat. Gracies, ja ho sabeu.
Tambe haig d’agraır a la Sara que tambe ha compartit part d’aquest projecte i gairebe
3 anys de la carrera amb mi. Gracies.
M’agradaria donar les gracies d’una forma especial a el professor Dr. Xavier Hes-
selbach Serra, no solament que m’oferıs projecte final de carrera, per la qual cosa li
estic molt agraıt, sino tambe donar-me la possibilitat de realitzar dues beques amb ell
(i confiar en mi) i en especial participar en el projecte Enigma3. Gracies.
Finalment tambe m’agradaria agraır a l’Albert Claret la seva ajuda en diversos mo-
ments del projecte.
iii
Page 5
Nothingman
Once divided...nothing left to subtract...
Some words when spoken...can’t be taken back...
Walks on his own...with thoughts he can’t help thinking...
Future’s above...but in the past he’s slow and sinking...
Caught a bolt ’a lightnin’...cursed the day he let it go...
Nothingman...
Isn’t it something?
Nothingman...
She once believed...in every story he had to tell...
One day she stiffened...took the other side...
Empty stares...from each corner of a shared prison cell...
One just escapes...one’s left inside the well...
And he who forgets...will be destined to remember...oh...oh...oh...
Nothingman...
Isn’t it something?
Nothingman...
Oh, she don’t want him...
Oh, she won’t feed him...after he’s flown away...
Oh, into the sun...ah, into the sun...
Burn...burn...
Nothingman...
Isn’t it something?
Nothingman...
Nothingman...
Coulda’ been something...
Nothingman...
Pearl Jam
This page is intentionally left blank
Page 6
Contents
Abstract ii
List of Figures vii
List of Tables ix
Abbreviations x
1 Introduction 11.1 Motivation . . . . . . . . . . . . . . . . . . . . . . . . . . . . . . . . . . . 11.2 Objectives . . . . . . . . . . . . . . . . . . . . . . . . . . . . . . . . . . . . 61.3 Project overview . . . . . . . . . . . . . . . . . . . . . . . . . . . . . . . . 71.4 Thesis report structure . . . . . . . . . . . . . . . . . . . . . . . . . . . . . 9
2 Background 112.1 Network packet capturing: sniffers. . . . . . . . . . . . . . . . . . . . . . . 11
2.1.1 A little bit of history. . . . . . . . . . . . . . . . . . . . . . . . . . 122.1.2 How they work. . . . . . . . . . . . . . . . . . . . . . . . . . . . . . 13
2.1.2.1 IEEE 802.3 sniffing details. . . . . . . . . . . . . . . . . . 142.1.2.2 IEEE 802.11 sniffing details. . . . . . . . . . . . . . . . . 16
2.1.3 Libpcap. . . . . . . . . . . . . . . . . . . . . . . . . . . . . . . . . . 172.2 Network traffic analysis theory. . . . . . . . . . . . . . . . . . . . . . . . . 17
2.2.1 A little bit of history on network traffic analysis. . . . . . . . . . . 202.2.2 Network traffic analysis techniques. . . . . . . . . . . . . . . . . . . 22
2.2.2.1 Network traffic data inspection techniques . . . . . . . . 232.2.2.2 Advanced statistical and signal processing techniques ap-
plied to the network traffic analysis . . . . . . . . . . . . 292.3 GPUs . . . . . . . . . . . . . . . . . . . . . . . . . . . . . . . . . . . . . . 30
2.3.1 GPGPU: general-purpose computing on graphics processing units. 322.3.2 CUDA architecture and programming model for GPGPU . . . . . 34
3 Design 383.1 Developing tools and methodology. . . . . . . . . . . . . . . . . . . . . . . 383.2 Framework design overview. . . . . . . . . . . . . . . . . . . . . . . . . . . 39
3.2.1 PacketFeeders. . . . . . . . . . . . . . . . . . . . . . . . . . . . . . 41
v
Page 7
Contents vi
3.2.2 PreAnalyzer. . . . . . . . . . . . . . . . . . . . . . . . . . . . . . . 433.2.3 Analyzer. . . . . . . . . . . . . . . . . . . . . . . . . . . . . . . . . 433.2.4 Analysis. . . . . . . . . . . . . . . . . . . . . . . . . . . . . . . . . 45
4 Implementation 494.1 General considerations . . . . . . . . . . . . . . . . . . . . . . . . . . . . . 49
4.1.1 Framework implementation overview. . . . . . . . . . . . . . . . . 494.1.2 Framework threading model. . . . . . . . . . . . . . . . . . . . . . 524.1.3 Naming conventions. . . . . . . . . . . . . . . . . . . . . . . . . . . 52
4.2 Common classes . . . . . . . . . . . . . . . . . . . . . . . . . . . . . . . . 534.2.1 PacketBuffer . . . . . . . . . . . . . . . . . . . . . . . . . . . . . . 534.2.2 Dissector . . . . . . . . . . . . . . . . . . . . . . . . . . . . . . . . 554.2.3 Network protocol headers . . . . . . . . . . . . . . . . . . . . . . . 57
4.3 PacketFeeder components . . . . . . . . . . . . . . . . . . . . . . . . . . . 594.3.1 LivePacketFeeder . . . . . . . . . . . . . . . . . . . . . . . . . . . . 614.3.2 OfflinePacketFeeder . . . . . . . . . . . . . . . . . . . . . . . . . . 62
4.4 PreAnalyzer component . . . . . . . . . . . . . . . . . . . . . . . . . . . . 634.5 Analyzer component . . . . . . . . . . . . . . . . . . . . . . . . . . . . . . 634.6 Analysis components . . . . . . . . . . . . . . . . . . . . . . . . . . . . . . 66
4.6.1 Analysis basic implementation. . . . . . . . . . . . . . . . . . . . . 674.6.2 Windowed analysis. . . . . . . . . . . . . . . . . . . . . . . . . . . 714.6.3 Global barriers. . . . . . . . . . . . . . . . . . . . . . . . . . . . . . 744.6.4 Template files. . . . . . . . . . . . . . . . . . . . . . . . . . . . . . 824.6.5 Module system . . . . . . . . . . . . . . . . . . . . . . . . . . . . . 834.6.6 Basic Macros. . . . . . . . . . . . . . . . . . . . . . . . . . . . . . . 87
4.6.6.1 User MACROs. . . . . . . . . . . . . . . . . . . . . . . . 884.6.6.2 Module developer Macros and X-Macros. . . . . . . . . . 91
4.6.7 Analysis component current limitations and future work . . . . . . 914.7 Developed modules . . . . . . . . . . . . . . . . . . . . . . . . . . . . . . . 92
4.7.1 Thresholds . . . . . . . . . . . . . . . . . . . . . . . . . . . . . . . 934.7.2 Histograms . . . . . . . . . . . . . . . . . . . . . . . . . . . . . . . 944.7.3 Scandetectors . . . . . . . . . . . . . . . . . . . . . . . . . . . . . . 944.7.4 Other . . . . . . . . . . . . . . . . . . . . . . . . . . . . . . . . . . 944.7.5 Future work . . . . . . . . . . . . . . . . . . . . . . . . . . . . . . . 95
5 Conclusions 96
A Code details 98
B Source Code (digital appendix) 107
C Online Documentation (digital appendix) 108
Bibliography 109
Page 8
List of Figures
1.1 Framework architecture diagram. . . . . . . . . . . . . . . . . . . . . . . . 81.2 Framework workflow diagram. . . . . . . . . . . . . . . . . . . . . . . . . . 9
2.1 BSD packet filter diagram. Extracted from [1] . . . . . . . . . . . . . . . . 132.2 Star topology usually used in IEEE 802.3 networks . . . . . . . . . . . . . 142.3 Example: eavesdropping traffic in the gateway links. . . . . . . . . . . . . 152.4 Using port mirroring switch capability. . . . . . . . . . . . . . . . . . . . . 162.5 Distributed sniffer structure example. . . . . . . . . . . . . . . . . . . . . 162.6 Screen shot of the Wireshark program. . . . . . . . . . . . . . . . . . . . . 242.7 Some graphics obtained with Nagios and Zenoos open-source network
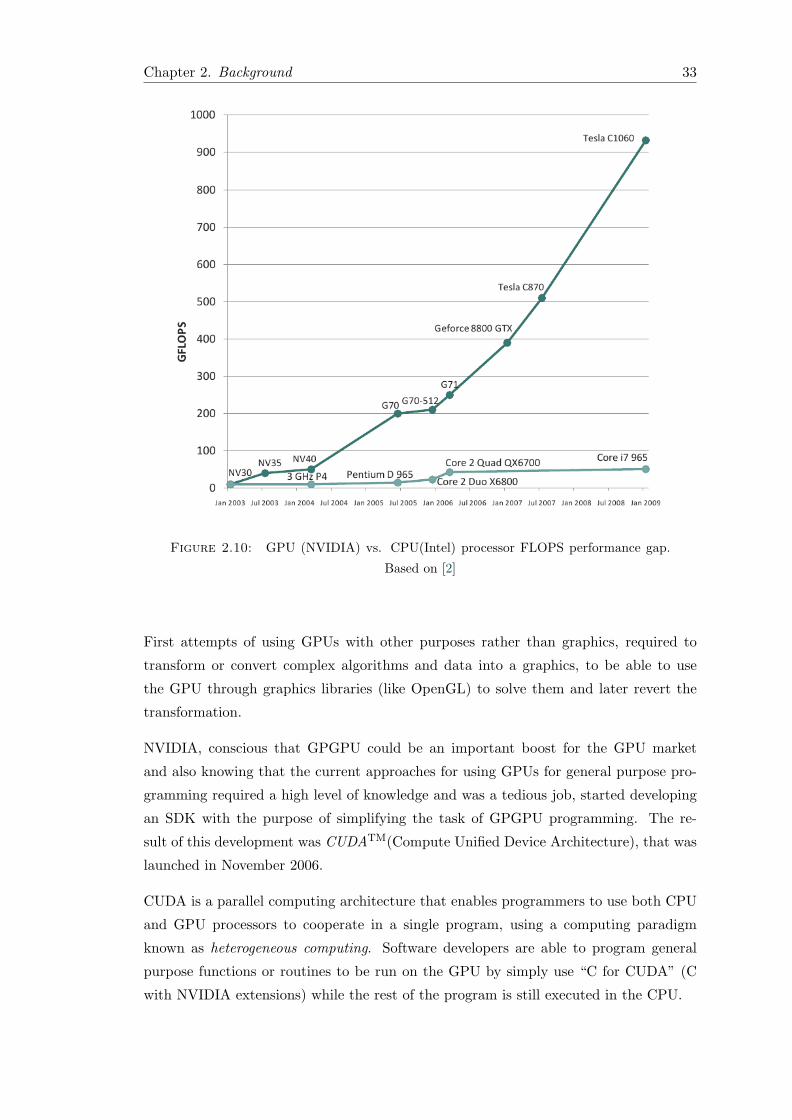
monitoring platform . . . . . . . . . . . . . . . . . . . . . . . . . . . . . . 252.8 Protocol distribution graphic from the NetAnalyzer traffic analysis platform 262.9 Some Snort rules. . . . . . . . . . . . . . . . . . . . . . . . . . . . . . . . . 282.10 GPU (NVIDIA) vs. CPU(Intel) processor FLOPS performance gap. Based
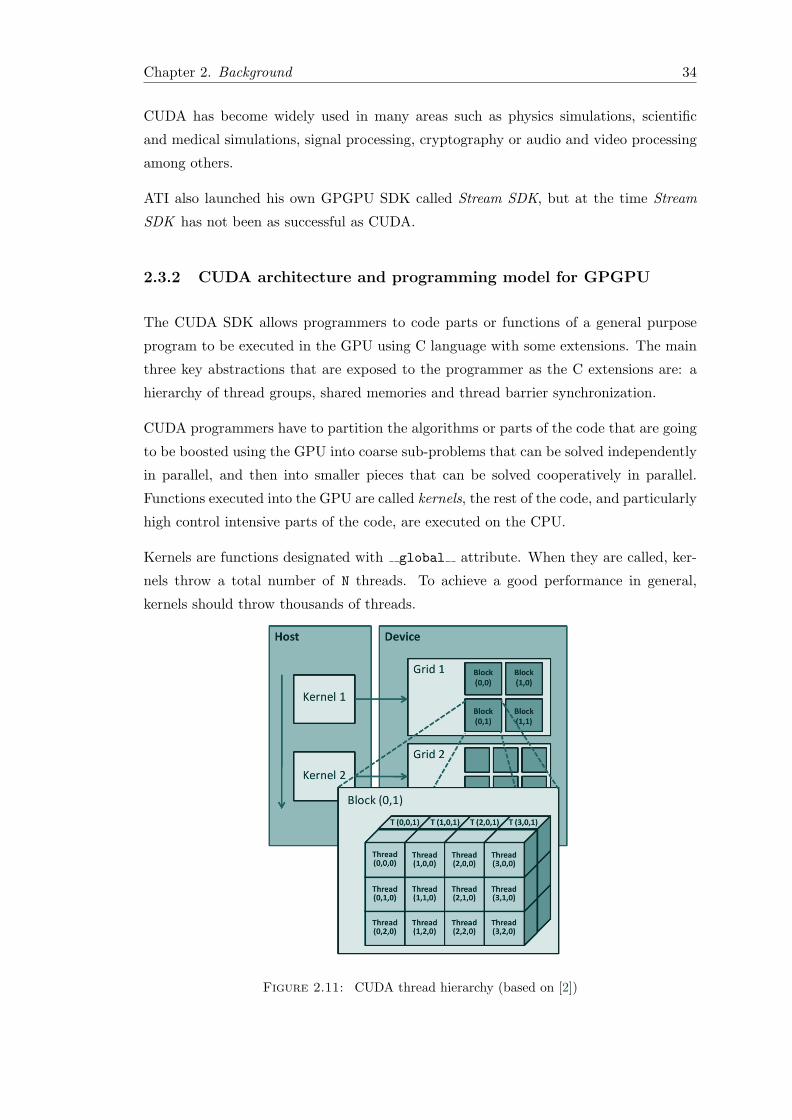
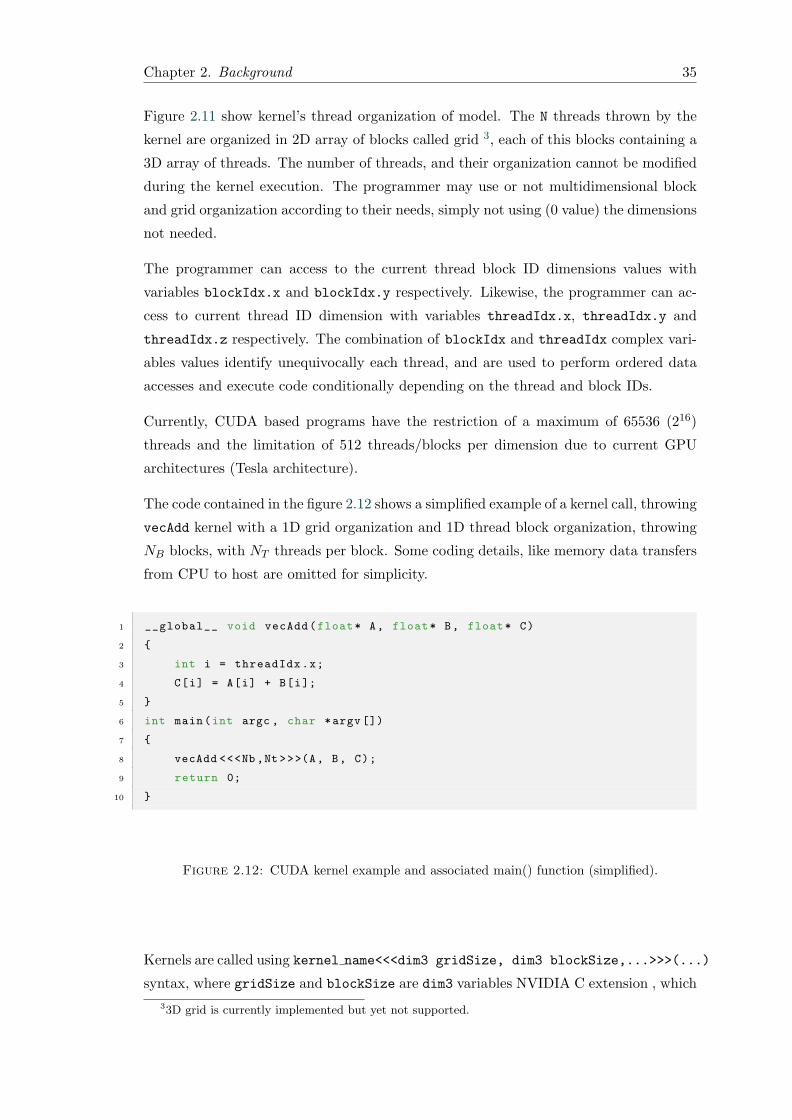
on [2] . . . . . . . . . . . . . . . . . . . . . . . . . . . . . . . . . . . . . . 332.11 CUDA thread hierarchy (based on [2]) . . . . . . . . . . . . . . . . . . . . 342.12 CUDA kernel example and associated main() function (simplified). . . . 352.13 CUDA memory hierarchy (based on [2]) . . . . . . . . . . . . . . . . . . . 36
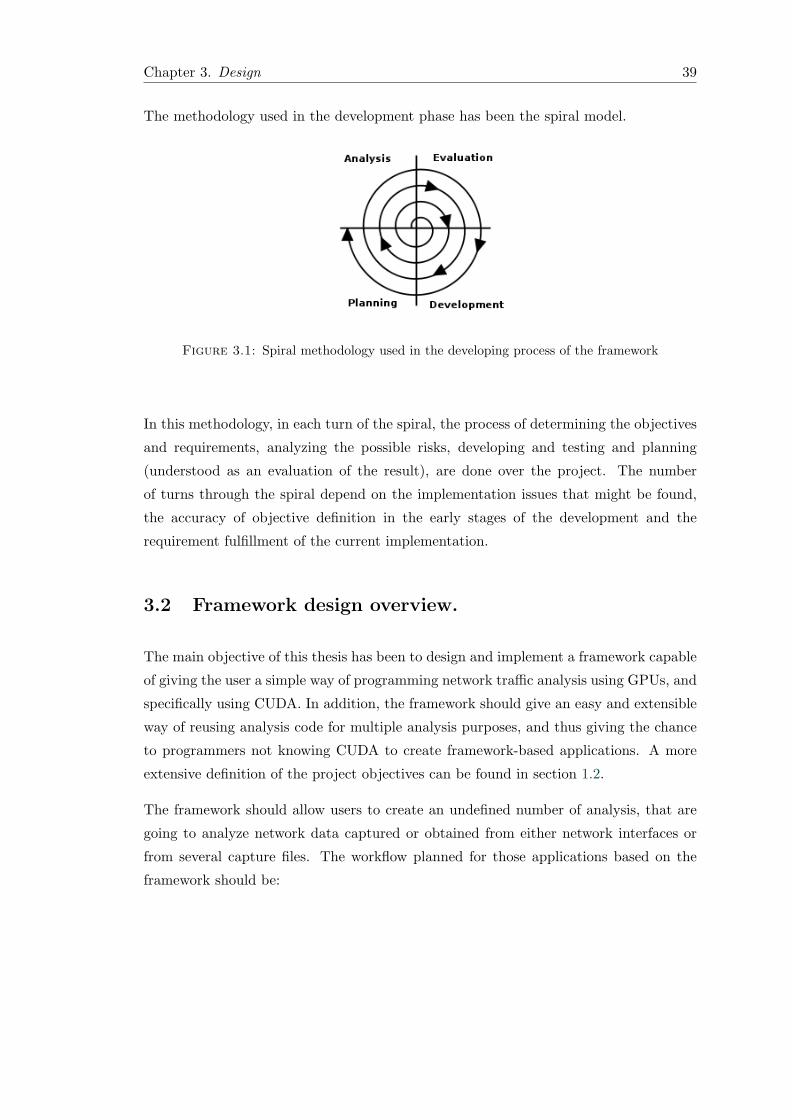
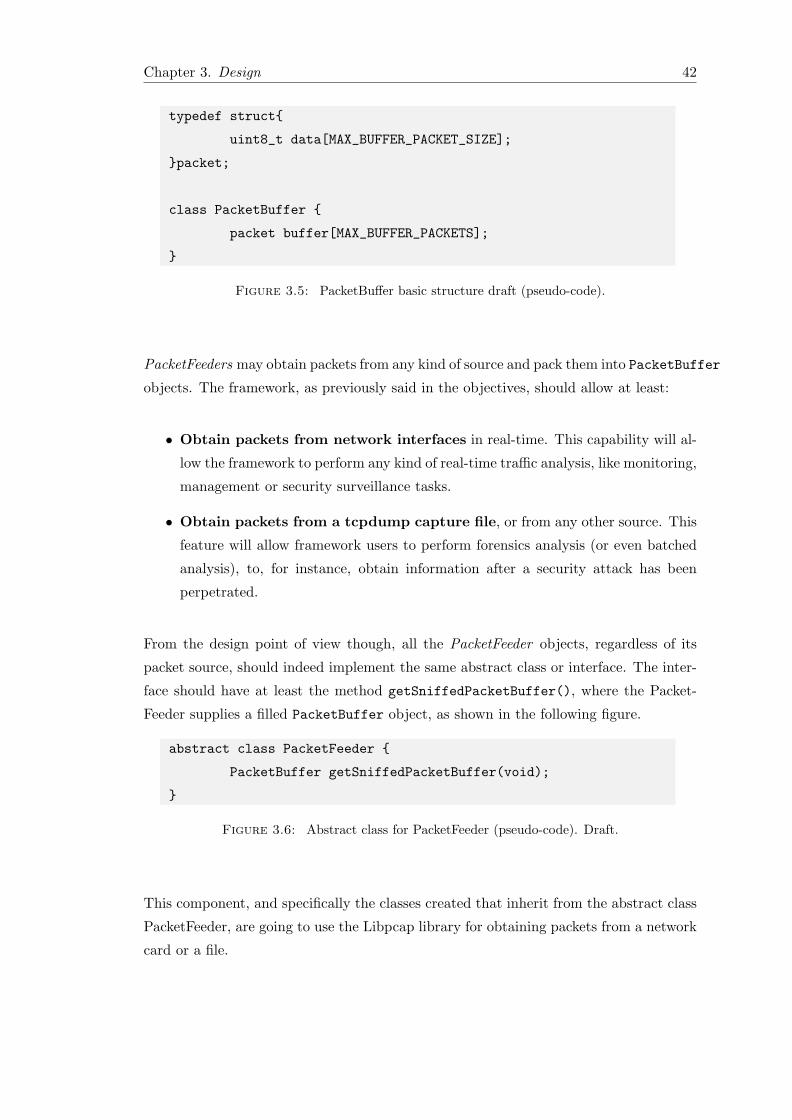
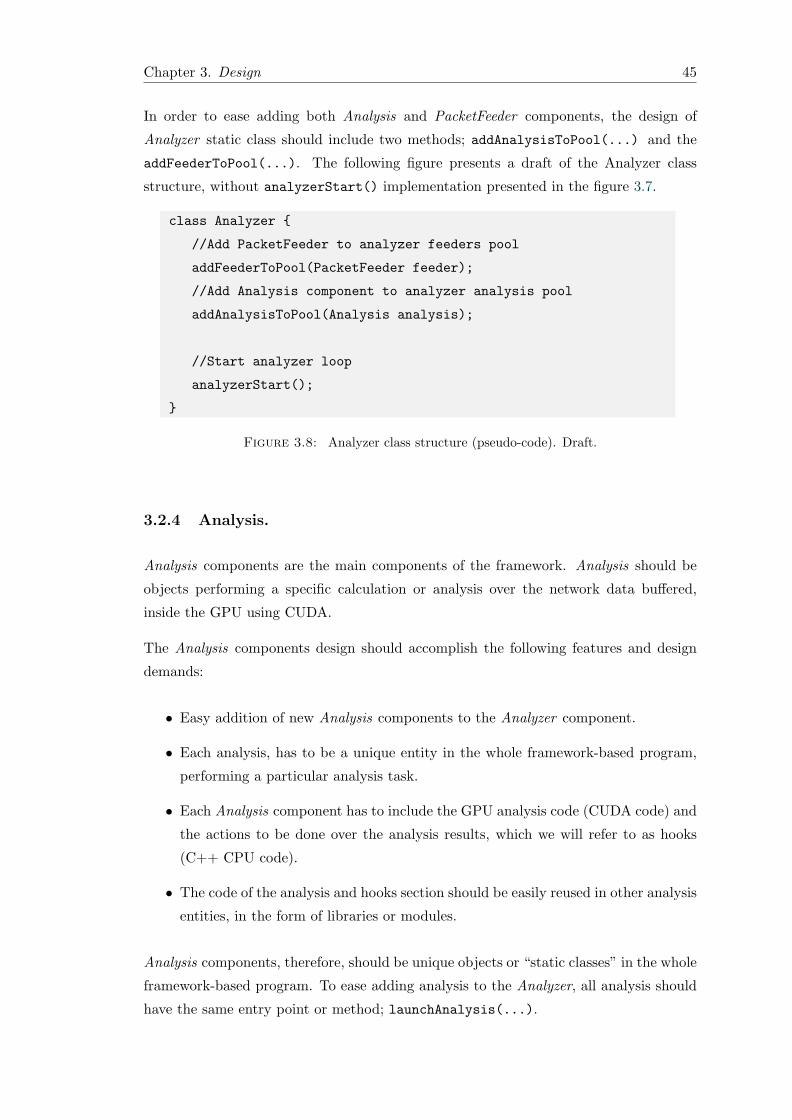
3.1 Spiral methodology used in the developing process of the framework . . . 393.2 Framework workflow (design). . . . . . . . . . . . . . . . . . . . . . . . . . 403.3 Framework design diagram. . . . . . . . . . . . . . . . . . . . . . . . . . . 403.4 main() function structure draft (pseudo-code). . . . . . . . . . . . . . . . 413.5 PacketBuffer basic structure draft (pseudo-code). . . . . . . . . . . . . . . 423.6 Abstract class for PacketFeeder (pseudo-code). Draft. . . . . . . . . . . . 423.7 Functional description of the Analyzer main loop (pseudo-code). Draft. . 443.8 Analyzer class structure (pseudo-code). Draft. . . . . . . . . . . . . . . . . 453.9 Analysis component graphical scheme . . . . . . . . . . . . . . . . . . . . 463.10 Detail of the analysis() routine of Analysis component . . . . . . . . . . . 463.11 Analysis abstract class structure (pseudo-code).Draft. . . . . . . . . . . . 47
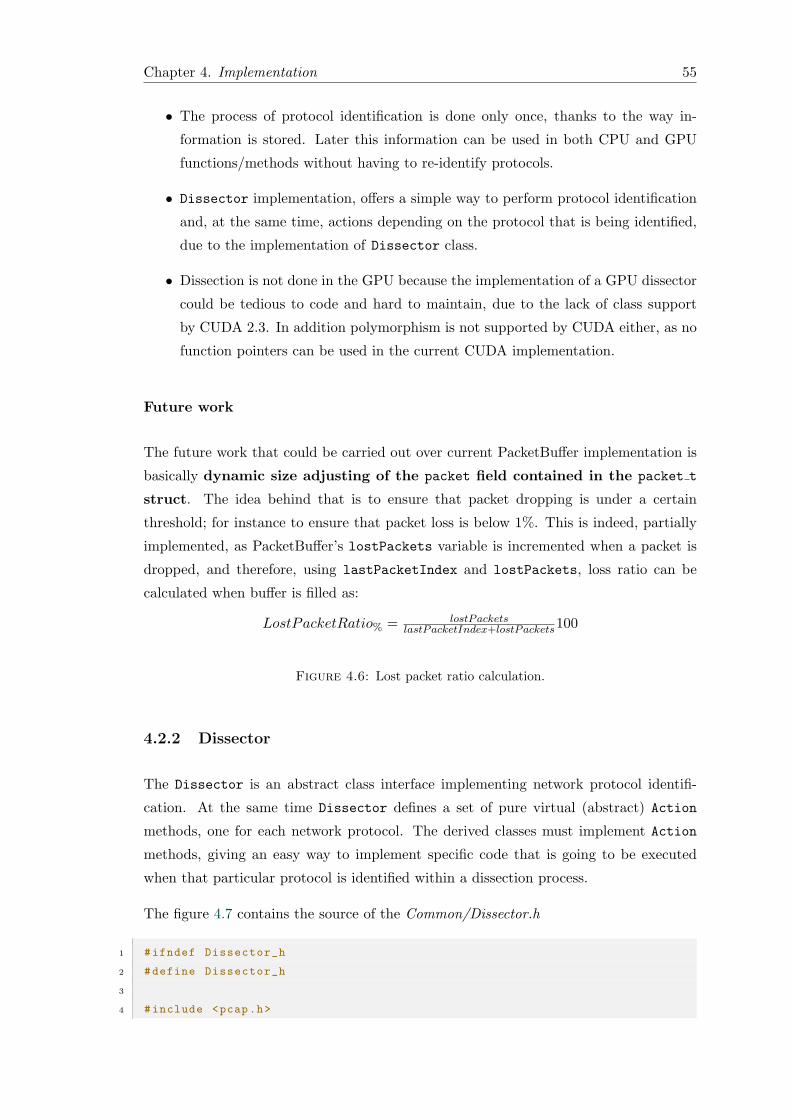
4.1 Analysis components compilation workflow (separately). . . . . . . . . . . 504.2 Framework-based application compilation workflow. . . . . . . . . . . . . 504.3 Framework source code structure (truncated). . . . . . . . . . . . . . . . . 514.4 Framework-based applications threading model (CPU). . . . . . . . . . . 524.5 Extract of PacketBuffer.h . . . . . . . . . . . . . . . . . . . . . . . . . . . 544.6 Lost packet ratio calculation. . . . . . . . . . . . . . . . . . . . . . . . . . 554.7 Dissector.h abstract class. . . . . . . . . . . . . . . . . . . . . . . . . . . . 57
vii
Page 9
List of Figures viii
4.8 MACROs defined in VirtualHeader.h file to store and obtain informationfrom header t struct. . . . . . . . . . . . . . . . . . . . . . . . . . . . . . . 58
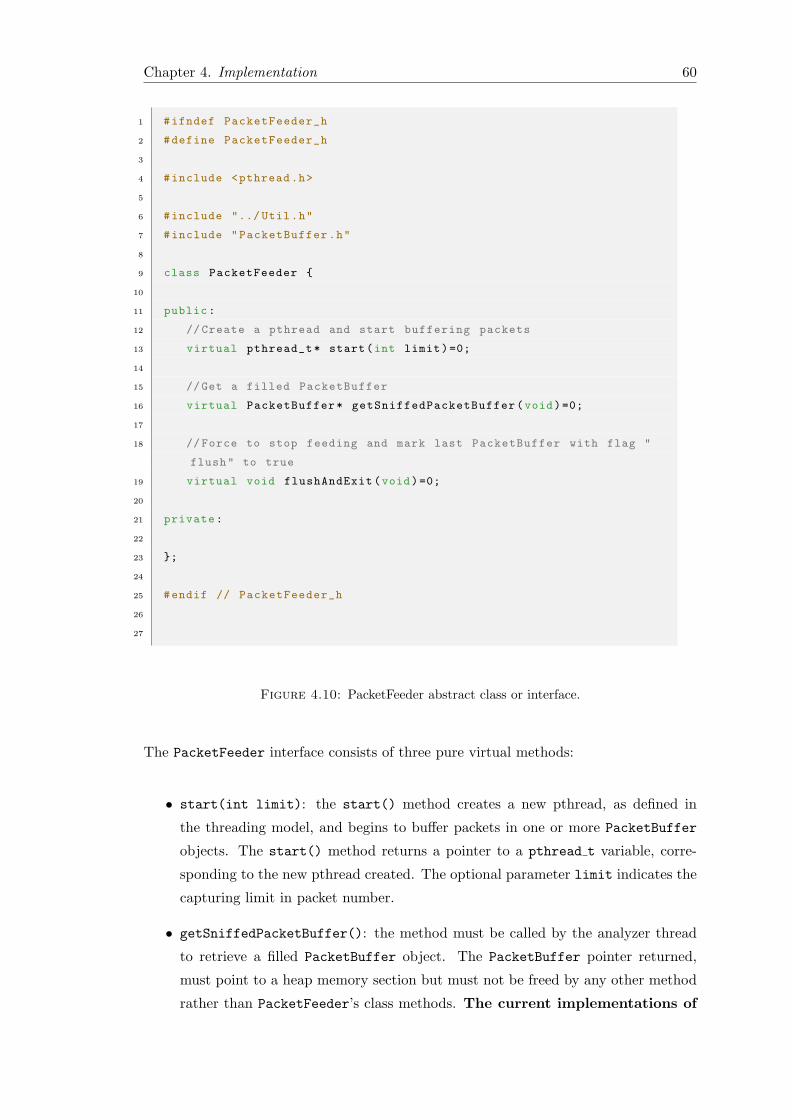
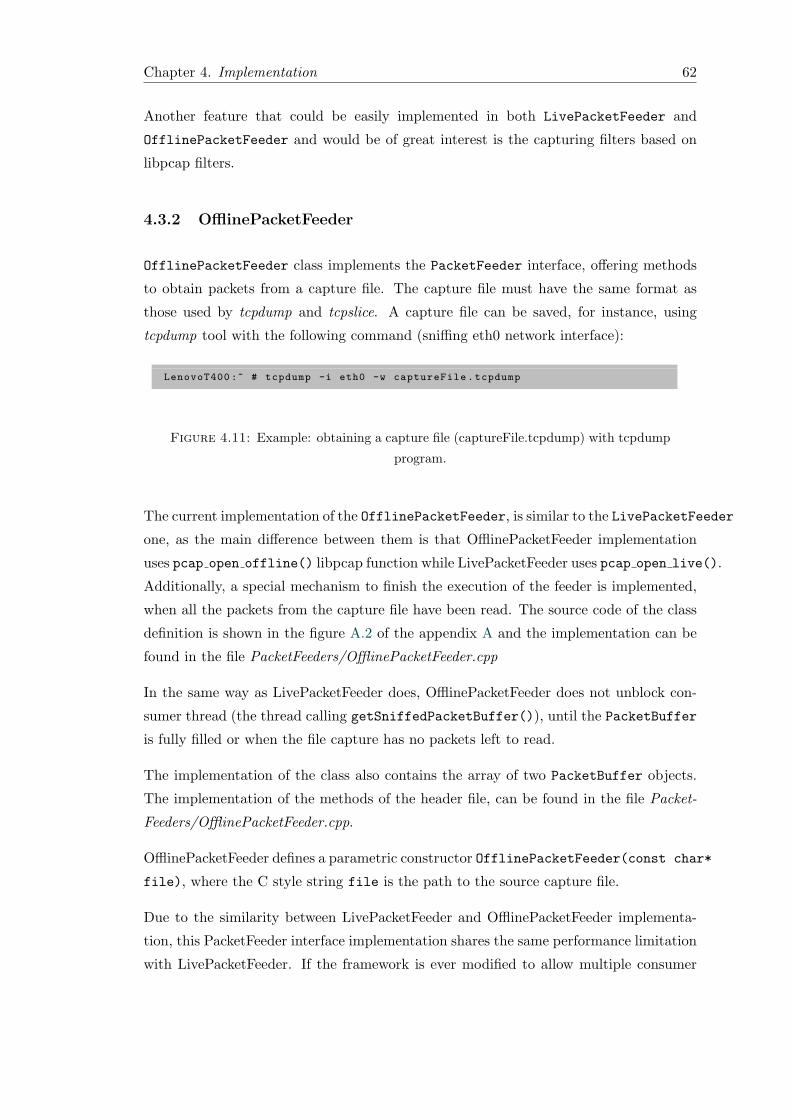
4.9 MACROs extract from the TcpHeader.h file . . . . . . . . . . . . . . . . . 594.10 PacketFeeder abstract class or interface. . . . . . . . . . . . . . . . . . . . 604.11 Example: obtaining a capture file (captureFile.tcpdump) with tcpdump
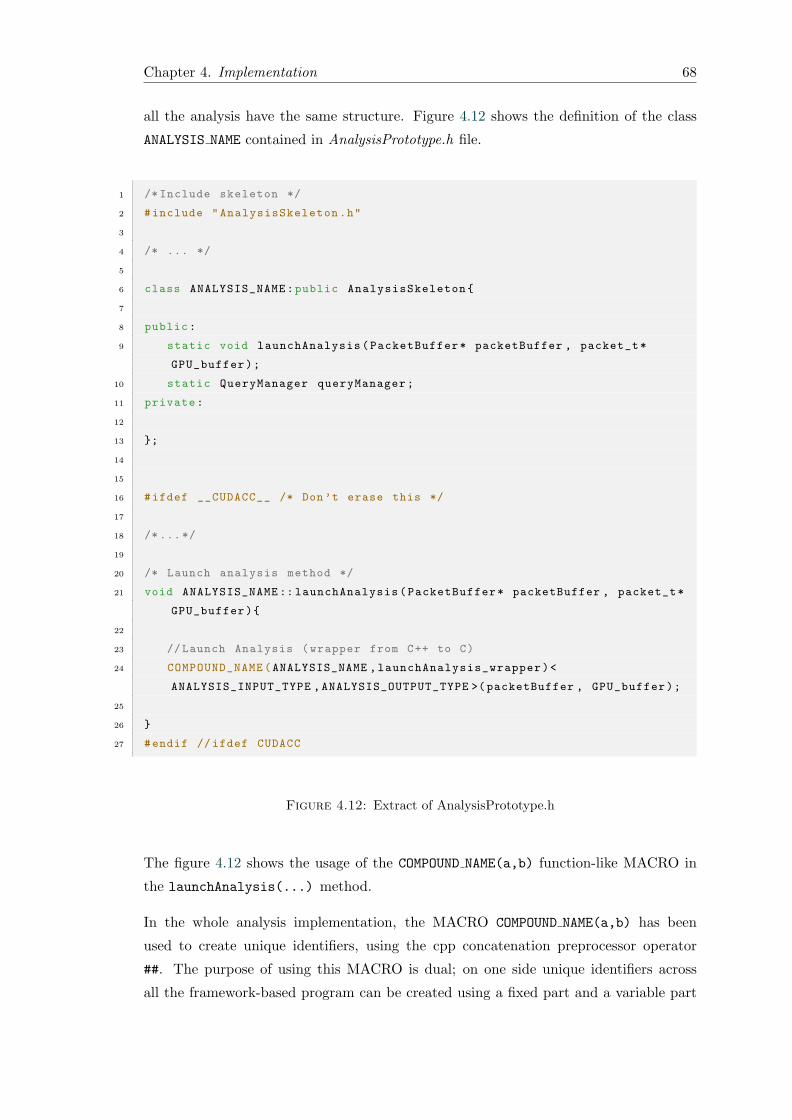
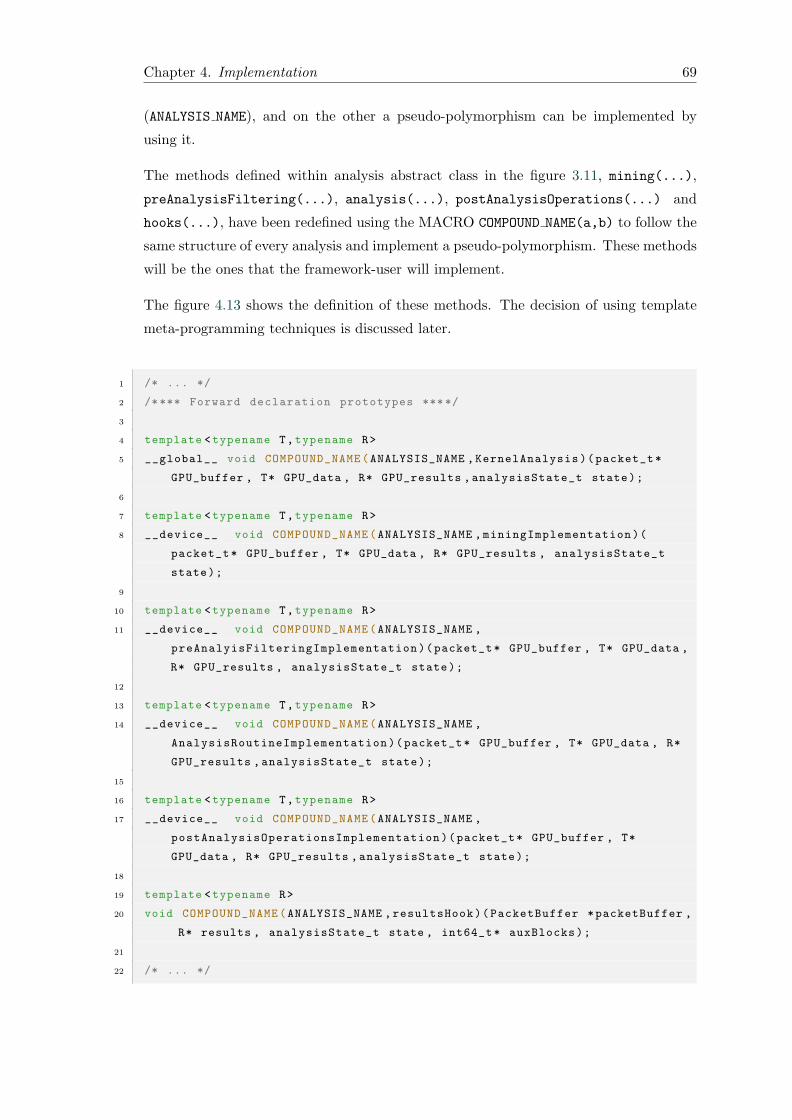
program. . . . . . . . . . . . . . . . . . . . . . . . . . . . . . . . . . . . . . 624.12 Extract of AnalysisPrototype.h . . . . . . . . . . . . . . . . . . . . . . . . 684.13 Implementation of methods contained in an analysis (redefinition). Ex-
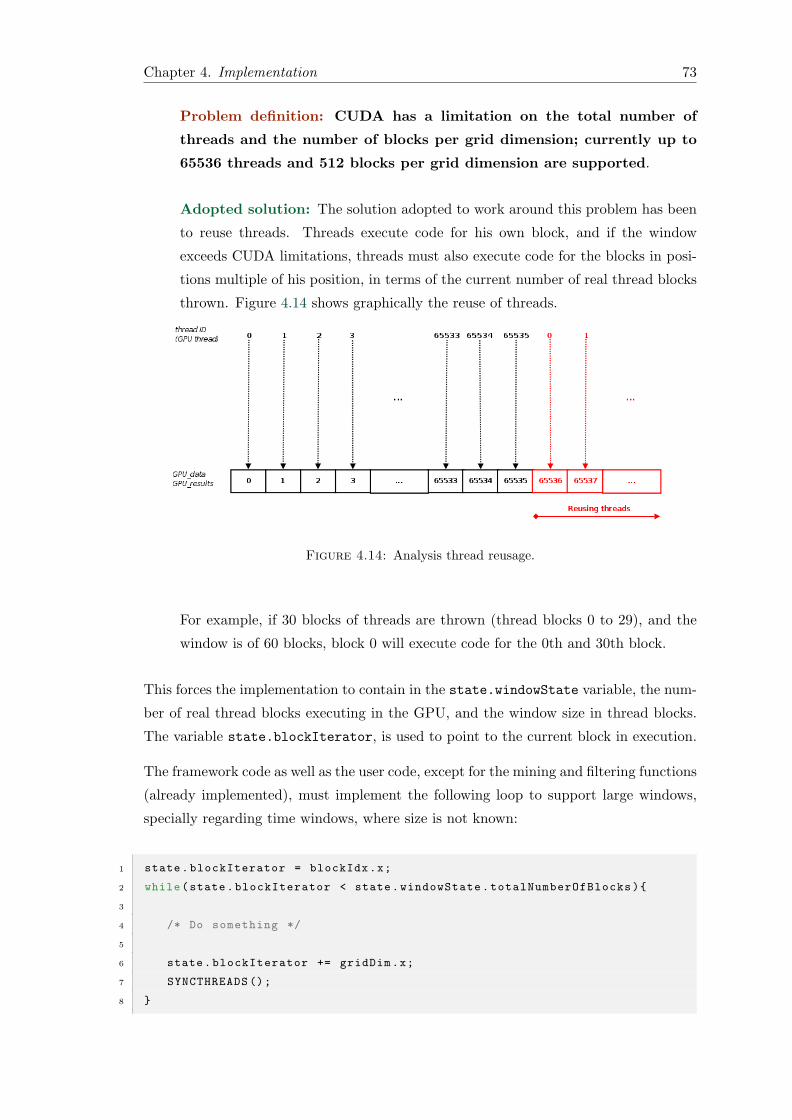
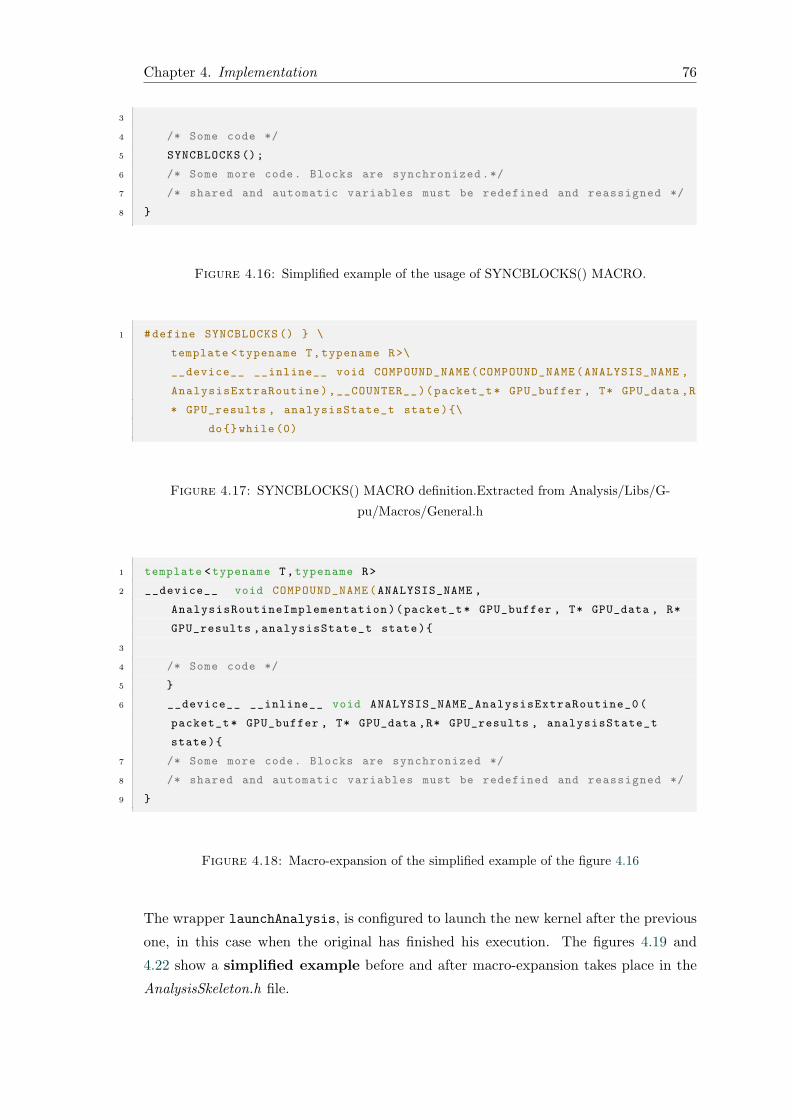
tracted from AnalysisSkeleton.h . . . . . . . . . . . . . . . . . . . . . . . . 704.14 Analysis thread reusage. . . . . . . . . . . . . . . . . . . . . . . . . . . . . 734.15 Required loop to support large windows. . . . . . . . . . . . . . . . . . . . 744.16 Simplified example of the usage of SYNCBLOCKS() MACRO. . . . . . . 764.17 SYNCBLOCKS() MACRO definition.Extracted from Analysis/Libs/G-
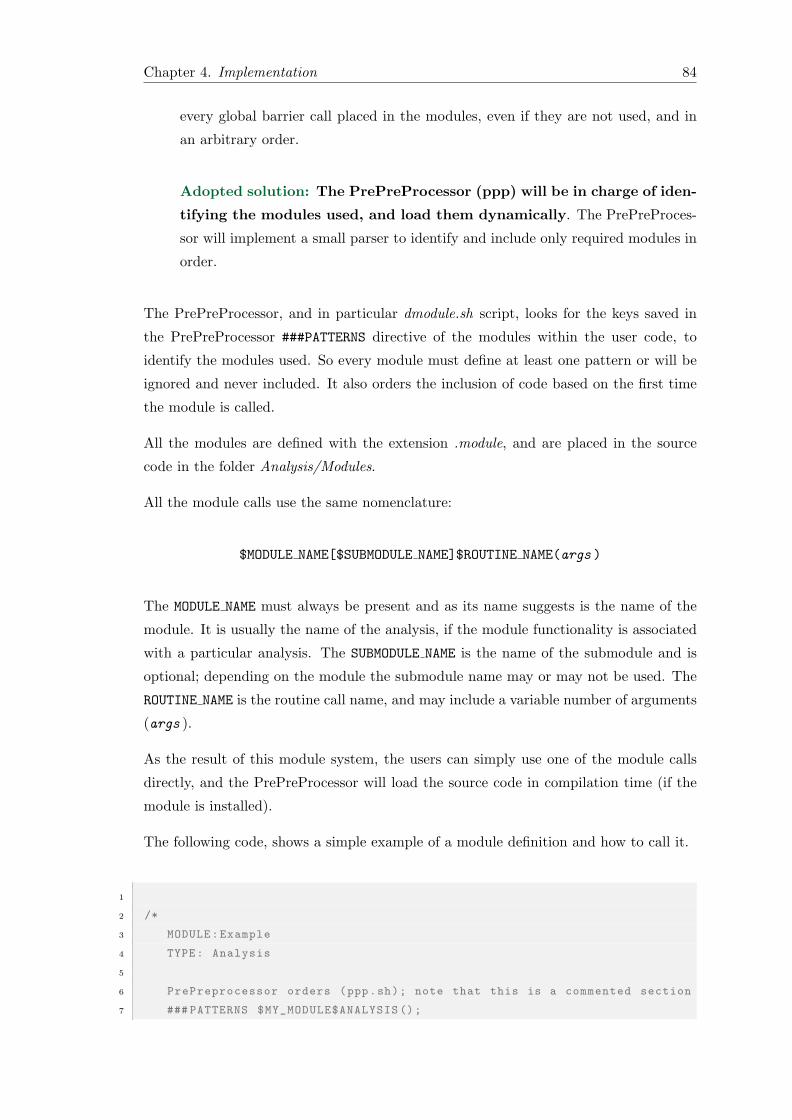
pu/Macros/General.h . . . . . . . . . . . . . . . . . . . . . . . . . . . . . 764.18 Macro-expansion of the simplified example of the figure 4.16 . . . . . . . . 764.19 Simplified code for the launchAnalysis wrapper before macro-expansion . 784.20 X-MACRO defined in the UserExtraKernel.def . . . . . . . . . . . . . . . 794.21 X-MACRO defined in the UserExtraKernelCall.def . . . . . . . . . . . . . 794.22 Macro-expansion of the code listed in figure 4.19 . . . . . . . . . . . . . . 804.23 Template file: BlankAnalysisTemplate.h. . . . . . . . . . . . . . . . . . . . 834.24 Example of a module implementation. (Example.module). . . . . . . . . . 854.25 Example of usage of the module defined in figure 4.24, by using its call in
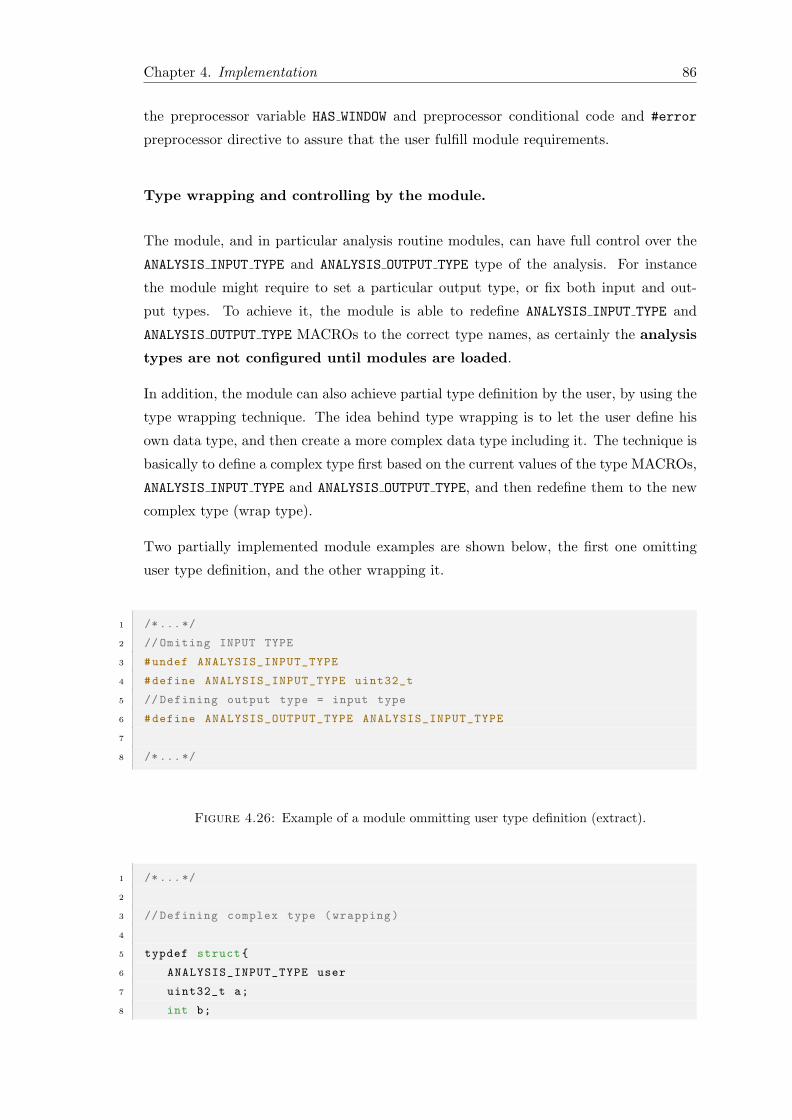
the analysis section. . . . . . . . . . . . . . . . . . . . . . . . . . . . . . . 854.26 Example of a module ommitting user type definition (extract). . . . . . . 864.27 Example of module wrapping user type (extract). . . . . . . . . . . . . . . 874.28 Example of the usage of mining MACROs. . . . . . . . . . . . . . . . . . . 894.29 Filtering operations of the filtering MACROs. . . . . . . . . . . . . . . . . 90
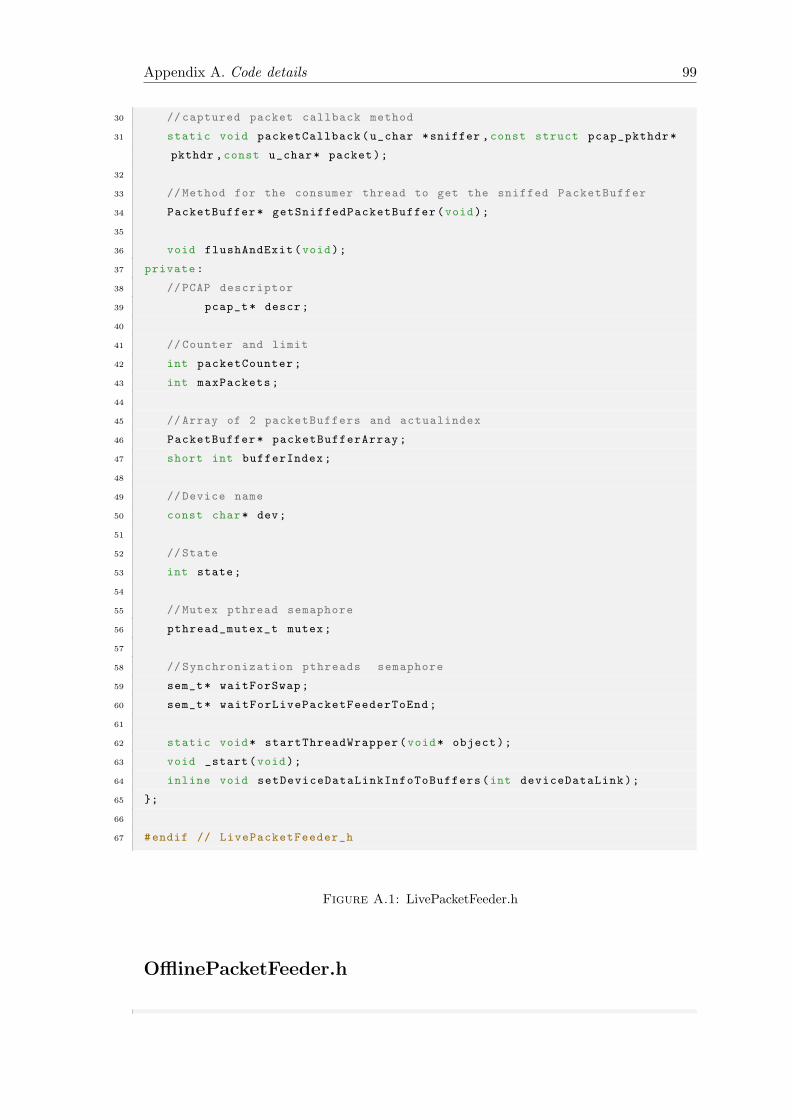
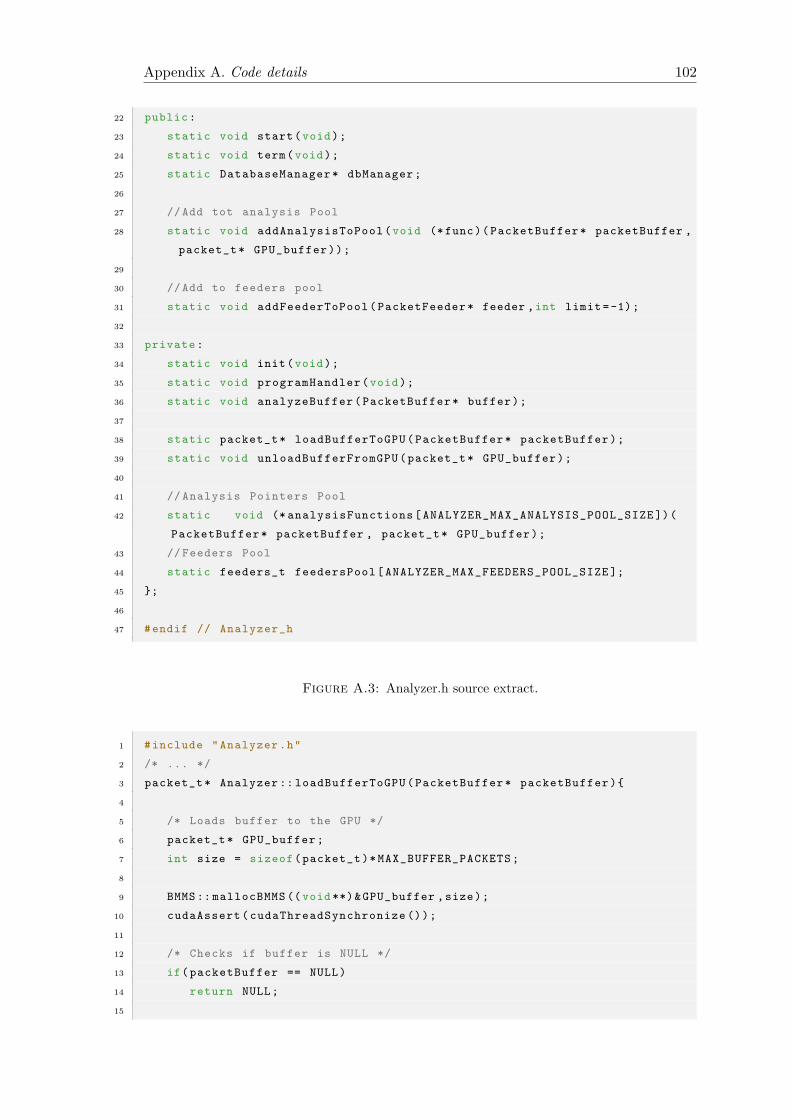
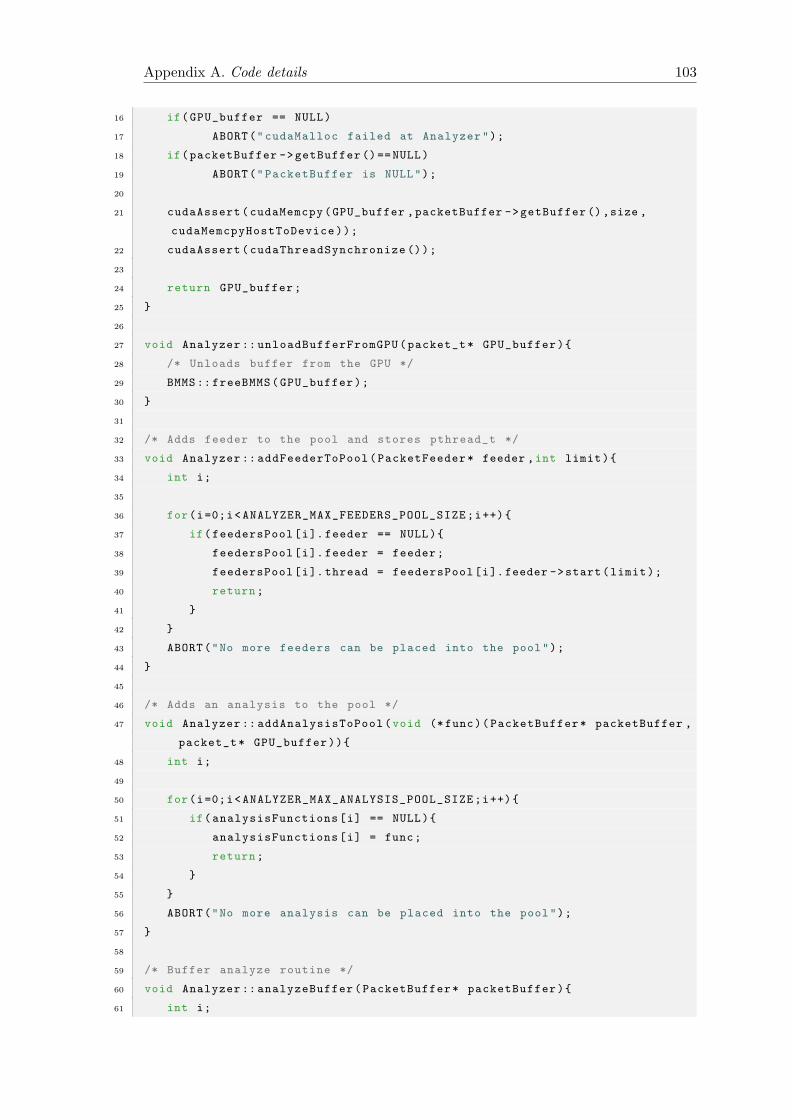
A.1 LivePacketFeeder.h . . . . . . . . . . . . . . . . . . . . . . . . . . . . . . . 99A.2 OfflinePacketFeeder.h . . . . . . . . . . . . . . . . . . . . . . . . . . . . . 101A.3 Analyzer.h source extract. . . . . . . . . . . . . . . . . . . . . . . . . . . . 102A.4 Analyzer.cpp source extract. . . . . . . . . . . . . . . . . . . . . . . . . . . 105A.5 Example of the usage of mining MACROs. . . . . . . . . . . . . . . . . . . 105A.6 Macro-expansion of the code listed in figure A.5 and 4.28. . . . . . . . . . 106
Page 10
List of Tables
2.1 Memory spaces in a Geforce 8800 GTX. Extracted from [3]. . . . . . . . . 37
ix
Page 11
Abbreviations
AI Artificial Intelligence
API Application Programming Interface
ARPA Advanced Research Projects Agency
BSD Berkley Software Distribution
CAD Computer Aided Design
CMU Carnegie Mellon University
CPU Central Processor Unit
CSPF CMU/Standford Packet Filter
CUDA Compute Unified Device Architecture
DARPA Defense Advanced Research Projects Agency
DSP Digital Signal Processor
ETSETB Escola Tecnica Superior d’Enginyeria de Telecomunicacions de Barcelona
FLOPS FLoating-point Operations Per Second
GB Giga Byte
GNU GNU is Not Unix
GPL General Public License
GPGPU General Purpose computing on Graphic Processor Units
GPP General Purpose Processor
GPU Graphics Processor Unit
ICMP Internet Control Message Protocol
ID IDentifier
IDES Intrusion Detection Expert System
IDS Intrusion Detection System
IEEE Institute of Electrical and Electronics Engineers
ILP Instruction-Level Parallelism
x
Page 12
Abbreviations xi
IP Internet Protocol
IP4 Internet Protocol version 4
IP6 Internet Protocol version 6
ISP Internet Service Provider
IT Information Technology
LAN Local Area Network
MAN Metropolitan Area Network
MB Mega Byte
MIDAS Multics Intrusion Detection and Alerting System
NADIR Network Audit Director and Intrusion Reporter
NIDS Network Intrusion Detection System
NIPS Network Intrusion Prevention System
ODBC Open DataBase Connectivity
PC Personal Computer
PF Packet Filter
RAM Random Access Memory
RAP Roving Analysis Port
RISC Reduced Instruction Set Computer
RSPAN Remote Switched Port ANnalyzer
SNMP Simple Network Management Protocol
SPAN Switched Port ANnalyzer
SPP Special-Purpose Processor
TB Tera Byte
TCP Transmission Control Protocol
UDP User Datagram Protocol
UI User Interface
USAF United States Air Force
USSR Union of Soviet Socialist Republics
VPU Video Processing Unit
Page 13
En record de’n “Blanc” que ens ha deixat durant la realitzacio d’aquest projecte.
Dedicat especialment a la meva mare.
xii
Page 14
Chapter 1
Introduction
1.1 Motivation
In the past five decades computer networks have kept up growing in size, complexity
and, overall, in the number of its users as well as being in a permanent evolution. Hence
the amount of network traffic flowing over their nodes has increased drastically.
In particular, the Internet was initially a project from the U.S. government defense
agency ARPA (Advanced Research Projects Agency) to interconnect some government
facilities and protect the country from a USSR attack, called ARPAnet. Later, in 1988,
some U.S. universities joined to this network and in 1995 the network was opened to all
types of organizations (like private companies), experimenting a huge growth. Currently
the Internet has become the world’s largest inter-connection network. Internet, accord-
ing to [4], has currently over 1,733,993,741 estimated users. According to [5], only in the
backbone 1 network of the U.S. during 2008 there was an estimated traffic of between
1,200,000 to 1,800,000 TB/month (TeraByte/month).
At the same time, connection speeds, specially in the backbone networks and between
important inter-network links and also in private networks, are gradually increasing and
are currently of tens or hundreds of MB/s to hundreds of GB/s. Also ISP connections
to the Internet for personal users and small to medium size companies, are increasing
its capacity rapidly, from tens or hundreds of KB/s of the preceding decade to hundreds
of MB/s and in some countries tens of GB/s.1A backbone network or network backbone is a part of computer network infrastructure that inter-
connects various pieces of network, providing a path for the exchange of information between differentsubnetworks.
1
Page 15
Chapter 1. Introduction 2
All that massive amount of data flowing from node to node in either a private or a public
network, contains a lot of information, fundamentally network header’s information,
that in some cases has to be analyzed for one or more purposes, such as:
• Security purposes. To detect, prevent, defeat or analyze in depth security flaws,
threats, attacks. . . to the network or to any element that is connected to it.
• Monitoring and management purposes. To monitor, understood as prevent-
ing and/or detecting problems over the network, like routing problems, element
failures or to enhance network link performance (load balancers, advanced routing
algorithms . . . ).
• Statistical purposes. To obtain any kind of statistical information that may be
of interest.
• Accounting information. To charge users depending on the amount and type
of traffic they produce and/or consume.
• . . .
Depending on the moment that data obtained from the network is processed, one could
distinguish between the following analysis types:
• Real time, or pseudo-real-time analysis. Performing the analysis as the informa-
tion is obtained from the network, or to be precise, nearly in real time (pseudo-real-
time), as small batches or buffers may be used before analysis is indeed performed.
This type of analysis requires a high amount of resources, but offers nearly instant
results.
• Batch analysis. Batch analysis processes data in big data batches in comparison
of real time analysis. This type of analysis gives a medium resources/response time
ratio.
• Forensics analysis. Forensics analysis are usually performed only when a “some-
thing goes wrong”.
It may not seem obvious at first sight, but response time in forensics analysis do matter,
as this amount of time might be the interval of time a network resource, network link,
server or service, in general might be unavailable for a part or all of the network users
or remain vulnerable.
Page 16
Chapter 1. Introduction 3
Problem definition
A quick response time in any of the above analysis types over the huge amount of
data obtained from the network is a must. Performance of network data processing
algorithms is crucial and should be fast, reliable and at the same time, do not interfere (or
interfere as little as possible) in the overall network performance and in the performance
of network connected systems and their services.
The current trend of factors related to the networks and the traffic analysis systems
listed below, complicate the accomplishment of this goal:
1. The number of network nodes is increasing. Most analysis algorithms are
highly dependent on the number of elements (nodes) on the network.
2. Network speed (bit rate) is gradually increasing.
3. The amount of network traffic is increasing heavily.
4. Analysis algorithms are getting more complex. Specially algorithms dealing
with application layer data, are getting more and more complex as security threats
get more complex.
5. Computing analysis systems are reaching two computational limits,
known as memory wall and instruction-level parallelism wall due to sys-
tem architecture limitations, mainly because of the processor and memory tech-
nology and analysis code characteristics.
The first four factors from the above list can not be avoided as are the result of user’s
current needs and technical advances in the networking field, and in any case, the trend
seems to make things even worst for analysis algorithms performance in the near future.
However, regarding the fifth factor which is probably one of the most important factors,
several solutions have been proposed and adopted over the years. But before outlining
some of them and sketching our approach briefly, a small description on the above
mentioned computational limits should be made.
The instruction-level parallelism wall : ILP abbreviated, is commonly referred to
the increasing difficulty of finding enough parallelism in a single instructions stream
to keep a high performance single-core processor busy. That is the main reason of
the last decade interest in the design and development of multi-core processors.
Page 17
Chapter 1. Introduction 4
The memory wall : the increasing difference between the processor and the memory
clock speeds. Currently, the memory wall is an important bottleneck, due to the
high number of CPU-memory-CPU data transactions.
Current approaches
Current approaches to tackle the problem, generally tend to distribute analysis pro-
cessing tasks over a number of computers, in order to reduce hardware computational
resources needed in every single computer, and also reduce the impact of the ILP wall
issue.
This type of approaches offer the following pros and cons:
Pros
• Offers a solution to the problem.
• Scalability. This type of solutions are scalable.
• Distributed systems.
Cons
• Do not reduce the impact of the memory wall.
• Require a data distribution software system. This kind of solutions require
a data distribution software to effectively distribute data over the different network
nodes.
• May require dedicated separate high performance data exchange net-
works to interconnect the different computers, to avoid data distribution delays.
• Hardware costs are considerable, and specially if a high performance dedicated
data exchange network is required.
Our approach: using heterogeneous computing. General-purpose com-
puting on graphics processing units (GPGPU)
This thesis proposes to use what is known as heterogeneous computing, and more specif-
ically using graphics processing units to perform totally or partially network data anal-
ysis.
Page 18
Chapter 1. Introduction 5
Heterogeneous computing could be described as the usage of systems made up by dif-
ferent types of computational units. Computational unit types can be divided into
general-purpose processors (GPP), commonly referred to them as central processor units
(CPUs), as are usually the main processor of the majority of the computing systems,
and special-purpose processors (SPP). Examples of special-purpose processors are digital
signal processors (DSP) or graphics processor units (GPU).
Graphics processor units or GPUs, are processors that originally where conceived to
perform 2D and 3D graphic calculations instead of the the general purpose processors
(CPUs). In fact, their technical evolution is attributed to the popularity and the com-
plexity rise of rendering programs like CAD (Computer Aided Design) programs on
one side, and to 3D video games. The high demanding calculations required by these
software programs that have to be satisfied by the GPUs (specially floating point op-
erations) forced the designers to develop a highly parallel processor structure, capable
of running many execution threads concurrently inside the processor in conjunction of
high speed memory and other processor external lower speed memory resources (typi-
cally RAM memory). This type of computational units are capable of running memory
high intensive operations smoothly.
Since 2005 there is a growing interest in trying to use GPUs to perform computing tasks
that are not strictly related to graphics, and hence taking advantage of the hardware
architecture of this type of computational units. Parallelism and memory bandwidth
led investigators and developers to start using GPUs to enhance complex algorithm
performance.
GPGPU started using GPUs as if they were actually calculating graphics, translating
algorithm’s input data to an image and then use available graphics libraries to perform
operations over that image to finally reconvert resulting data to its original form.
GPUs manufacturers, quickly realised that GPGPU could be a business opportunity, so
they invested in developing tools to make easier to use their products for it. NVIDIA,
which is considered at the time the worldwide GPU manufacturer leader, developed
and released CUDA (an acronym for Compute Unified Device Architecture) 1.0 library
in 2006, which enabled some of their GPUs to run CUDA code for general purpose
computing.
CUDA is the computing engine in NVIDIA GPUs that can be used by software devel-
opers through industry standard programming languages. Programmers can use “C for
CUDA”, which is basically C with NVIDIA extensions and some C++ features.
Our proposal is to apply the concept of general-purpose computing on graphics process-
ing units to the network traffic analysis algorithms implemented typically using general
Page 19
Chapter 1. Introduction 6
purpose processors only systems, and also open the door to the creation and/or im-
plementation of high resources demanding algorithms that had not been implemented
before due to performance limitations. Specifically, we plan to use CUDA to develop a
framework to simplify third party software programmers the task of using and devel-
oping network traffic analysis over the GPUs.
Network traffic GPU based analysis systems have the following theoretical advantages
and disadvantages compared to traditional approaches:
Advantages
• Offers a solution to the problem.
• Better performance. Better memory bandwidth and parallelism capabilities.
• Scalability. The solution is highly scalable.
• Costs should be lower.
• System could still be a distributed system. If high computational capacity
is needed, analysis systems could also be made up by a group computers using
each of them GPUs to distribute computing process.
Disadvantages
• May require adaptation or rewrite of already programmed traffic anal-
ysis algorithms due to GPUs architecture details and CUDA syntax.
• In distributed systems, high performance dedicated distribution net-
works may still be necessary to avoid data distribution delays.
1.2 Objectives
The project main objective is to develop an open source CUDA based framework
to allow programmers using it to center their efforts on programming network traffic
analysis to be executed in the GPUs.
In addition, the framework should fulfill the following requirements:
• Open source. The framework should be developed under the terms of open
source software.
Page 20
Chapter 1. Introduction 7
• The framework should be developed in C/C++ and CUDA languages. This is
basically because of performance and CUDA requirements.
• Easily extensible. Framework should be easily extended in any of its parts.
• Scalable. Framework should be scalable, particularly related to the number of
analysis supported for the framework-based program.
• Modular. Framework structure should be modular, enhancing scalability, exten-
sibility and code maintenance.
• Easy to use. Framework should be easy to use for the users. The framework
should abstract most of the CUDA related work as well as packet data obtaining
job.
In this sense, even if the user does not know CUDA programming, should be able
to create analysis based on what framework defines as modules: precoded routines
that can be used within analysis code.
• Well documented. Framework should be correctly documented, either for users
willing to use it and for developers who aim to contribute to the project. Docu-
mentation should also be easily accessible.
1.3 Project overview
The project’s resulting framework allows users to create programs being able to capture
packets from network interfaces or obtain network data from a capture file and perform
as many analysis over that data using the GPUs (CUDA) as required to finally carry
out actions with the results obtained of these analysis.
The framework also is able to perform already all types of analysis mentioned before:
real-time analysis, batched analysis and forensics analysis
The architecture of the framework is summarized in the following diagram:
Page 21
Chapter 1. Introduction 8
Figure 1.1: Framework architecture diagram.
The main components of the framework architecture are:
• PacketFeeders: objects that implement PacketFeeder abstract class or interface,
and its purpose is to obtain packets from any kind of resource (i.e. network devices
and files) and serve them as PacketBuffer objects to the analyzer component.
• Analyzer: the analyzer is the component of the framework that distributes Pack-
etBuffer objects obtained from every feeder to all of the program’s analysis.
• Analysis: analysis are the main component of the framework. These components
are the ones in charge of examining, inspecting and calculating something with data
contained in the PacketBuffer objects and later execute actions over the results of
the analysis.
Users have to fill the code, either programming their own code in each different
section of the analysis or using what framework defines as modules. Modules are
precoded routines affecting one or more sections of the analysis that users can use
simply calling one of its routines. Modules increase the framework flexibility as
similar analysis routines should only be coded once, and also enables developers
to add new modules to improve the framework and share them.
The users workflow is summarized in the following diagram:
Page 22
Chapter 1. Introduction 9
Figure 1.2: Framework workflow diagram.
The user’s framework-based program is made-up by, on one side a file containing the
main() method (Main.cpp), and in the other all the analysis components defined using
the template files 2 (files .cu and .h). On the other hand, the framework library and
all the other underlying libraries, like CUDA, are required to build the application.
1.4 Thesis report structure
This thesis report is divided into the following sections or chapters:
1. Introduction
2. Background. In this section an introduction to the different technologies and
theory that sustain the project is exposed. The background section contains infor-
mation about network packet capturing software (commonly known as sniffers),
GPGPU and CUDA programming environment and a brief introduction to the
current network traffic analysis techniques.
3. Design. Design section offers a detailed description of the methodology followed
during the development stage of the framework, as well as description of the dif-
ferent parts that the framework is made of and the design patterns used.2See section 4.6.4
Page 23
Chapter 1. Introduction 10
4. Implementation. Implementation section focuses on the current implementation
of the framework. Implementation section offers a detailed description of the
implementation details and solutions adopted as well as a summary of the future
work that could be carried out over the resulting framework.
5. Conclusions. Contains the conclusions of this dissertation, a summary of the
knowledge acquired during the development of the project and a brief overview of
the future work that could be done.
Page 24
Chapter 2
Background
2.1 Network packet capturing: sniffers.
Network packet capturing software, commonly known as packet sniffers, network sniffers
or simply sniffers, are programs or libraries that obtain (actually eavesdrop) data packets
flowing through a certain network segment in which the system is connected to by means
of a network card.
The term sniffer or packet sniffer may be a little confusing. Most software programs
capturing packets from a network and processing them, for instance decoding headers
information and showing it or extracting data from headers for later calculations, are
called sniffers, packet sniffers, network sniffers, packet analyzers or network analyzers
indistinctly. In this thesis we are going to refer to the term sniffing as the act of
obtaining raw packets from a network card or network interface, and as packet
analyzing the act of performing analysis over network data previously ob-
tained.
Therefore, packet decoding and analyzing software like tcpdump[6], Wireshark [7] (pre-
viously called Ethereal) or OmniPeek [8] (formerly AiroPeek, EtherPeek) for instance,
should be considered as sniffers (as all of them rely on a sniffing library) and packet
analyzers. In the other hand, libraries like Libpcap[6] or Winpcap[6] for example, should
be considered formerly as pure sniffing software libraries.
In this section we are going to introduce some fundamentals over network data capturing
techniques and a little bit of history. In the Network traffic analysis theory section, a brief
summary of network traffic decoding, examining and analyzing techniques is presented.
11
Page 25
Chapter 2. Background 12
2.1.1 A little bit of history.
Since first networks started to be used in the early 1960s, security has increasingly
become a major concern. In this sense, it was not until early 1980s, as computer net-
works where starting to become widely used in government and big companies facilities,
that network traffic monitoring and control started to be considered a very useful task,
particularly against attacks to hosts and their services, network failures and network
performance issues.
First network programs, including network monitors and network analyzers, where
operating-system-level processes which included the processing code in it. Due to the
necessity of supporting user-level applications as well as to improve performance (as
most of the code did not require to be run as a system-level process code), researchers
of several universities started to think about creating a capturing library that would
run in the operating system’s kernel space and offer to the user an API (Application
Programming Interface) to program their own user-level network applications. This was
commonly known as Packet Filter.
In 1980 the CMU (Carnegie Mellon University) and Standford university joined their
efforts to develop CMU/Standford Packet Filter (CSPF) implementing the idea of kernel
based “packet filtering” library. CSPF was inspired in Xerox Alto Packet Filter, and it
is considered an adaptation and enhancement of Xerox Alto Packet Filter.
In 1992 the Berkeley university developed the BSD Packet Filter [1] that was pretty
much an adaptation of the CMU/Standford CSPF to RISC architectures, as CSPF was
originally designed for being used in memory-stack based computer architectures and
hence very inefficient in RISC architectures (predominant architectures already in the
90s). Due to its design and performance, BSD Packet Filter and other versions highly
inspired in it are the packet filter libraries currently in use by the vast majority of the
UNIX-like operating systems.
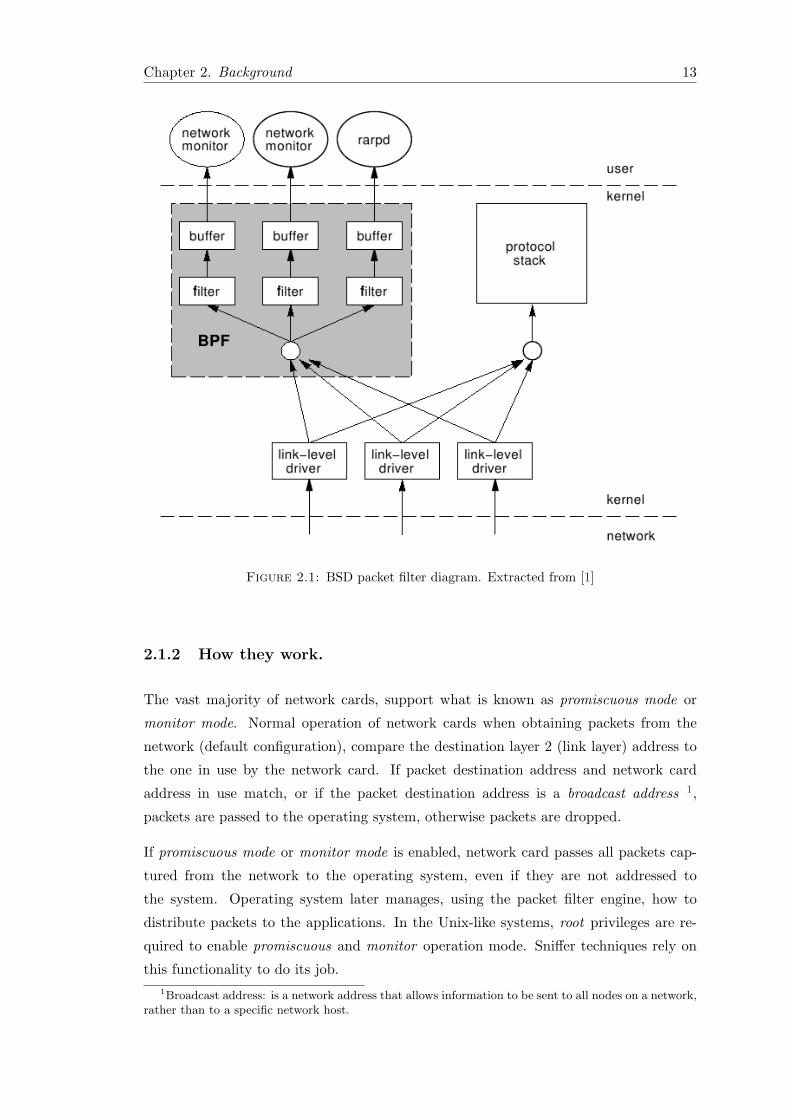
Following diagram shows the structure of BSD Packet Filter based packet filters, widely
used in Unix-like operating systems (including BSD OSs and GNU/Linux OSs).
Page 26
Chapter 2. Background 13
Figure 2.1: BSD packet filter diagram. Extracted from [1]
2.1.2 How they work.
The vast majority of network cards, support what is known as promiscuous mode or
monitor mode. Normal operation of network cards when obtaining packets from the
network (default configuration), compare the destination layer 2 (link layer) address to
the one in use by the network card. If packet destination address and network card
address in use match, or if the packet destination address is a broadcast address 1,
packets are passed to the operating system, otherwise packets are dropped.
If promiscuous mode or monitor mode is enabled, network card passes all packets cap-
tured from the network to the operating system, even if they are not addressed to
the system. Operating system later manages, using the packet filter engine, how to
distribute packets to the applications. In the Unix-like systems, root privileges are re-
quired to enable promiscuous and monitor operation mode. Sniffer techniques rely on
this functionality to do its job.1Broadcast address: is a network address that allows information to be sent to all nodes on a network,
rather than to a specific network host.
Page 27
Chapter 2. Background 14
It is important to remark that capturing packets from a network is highly dependent of
the type of the network used and of the topology and configuration of the network.
Clear examples of this fact can be found in LAN (Local Area Network) networks based on
the IEEE 802.XX (physical and link layer protocols) protocol macro-family, for instance
in the IEEE 802.3 [9] protocol based networks, also known as Ethernet networks, and
in the IEEE 802.11[10] based networks, so-called Wifi or Wireless networks.
In the following subsections some details over sniffing on both network types are exposed.
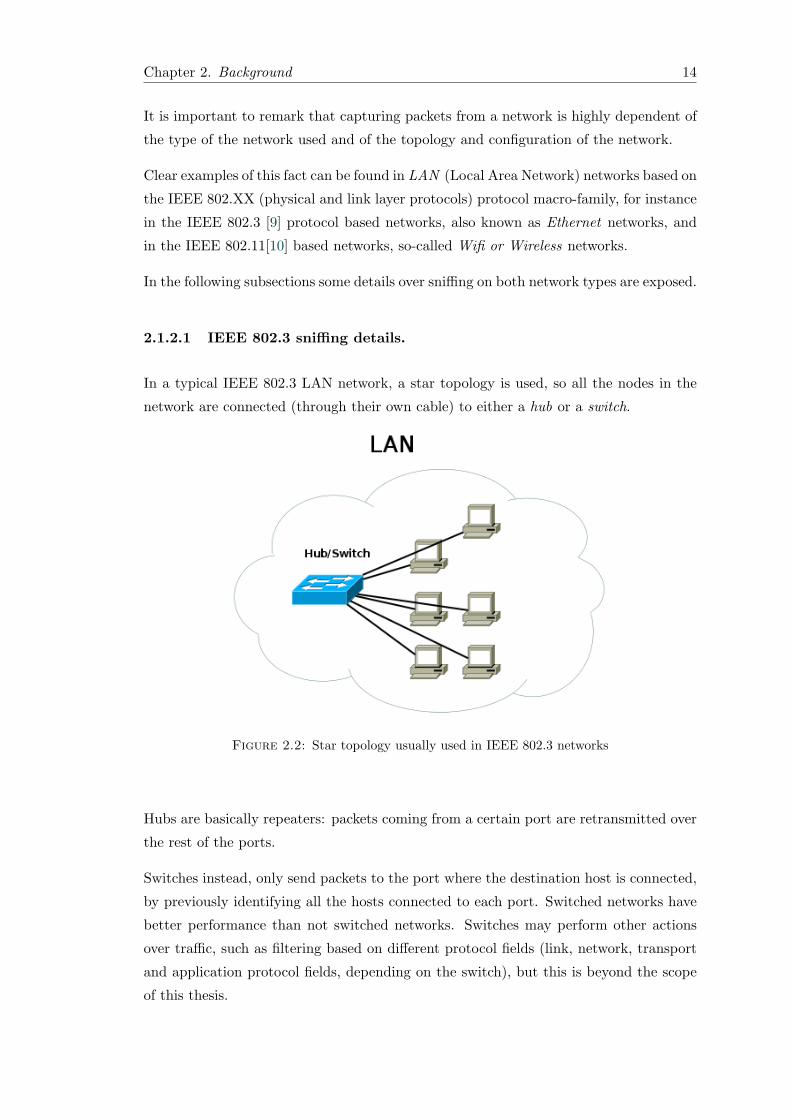
2.1.2.1 IEEE 802.3 sniffing details.
In a typical IEEE 802.3 LAN network, a star topology is used, so all the nodes in the
network are connected (through their own cable) to either a hub or a switch.
Figure 2.2: Star topology usually used in IEEE 802.3 networks
Hubs are basically repeaters: packets coming from a certain port are retransmitted over
the rest of the ports.
Switches instead, only send packets to the port where the destination host is connected,
by previously identifying all the hosts connected to each port. Switched networks have
better performance than not switched networks. Switches may perform other actions
over traffic, such as filtering based on different protocol fields (link, network, transport
and application protocol fields, depending on the switch), but this is beyond the scope
of this thesis.
Page 28
Chapter 2. Background 15
That means that if a switched network is used, only packets flowing to or from the
particular host running the sniffer or broadcast packets will be captured.
Several techniques have been used to overcome this problem:
• Using a hub: an obvious but bad solution is to use hubs instead of switches. It
is not a valid solution as its performance is very reduced compared to switched
networks and their production is practically discontinued.
• Placing the sniffer in the gateway links as a bridge/router: this technique
is widely used and has the advantage of being able to sniff packets from a lot
of sub-networks by only placing one network tap. The disadvantage is that only
traffic going through that link is captured, so internal traffic (between nodes in
the same subnetwork or between different sub-networks) is not captured, which in
some cases, like data centers for instance, is very relevant[11] [12]. In those cases
the only solution is to use distributed sniffers, port mirroring or a combination of
both of them. Figure 2.3 illustrates this technique with an example.
Figure 2.3: Example: eavesdropping traffic in the gateway links.
• Switch port mirroring: some switches have what is called port mirroring or
monitoring port2. If port mirroring is enabled, a copy of all the packets flowing in
the switched are transmitted to the mirroring port selected. On networks formed
by several switches, obtaining packets in a single host is more complex, and may
require to use advanced switch capabilities like Cisco’s RSPAN 2 or combine them
with a distributed sniffer.2Switch manufacturers use several names to refer to their port mirroring technologies: Cisco Systems
generally refers to them as Switched Port Analyzer (SPAN) or Remote Switched Port Analyzer (RSPAN)for capturing traffic from more than one switch. 3Com calls them Roving Analysis Port (RAP).[13][14]
Page 29
Chapter 2. Background 16
Figure 2.4: Using port mirroring switch capability.
• Distributed sniffer: distributed sniffers use a software based architecture to
collect traffic in several network taps (hosts), and combine them to obtain them
in a unique host. The main advantages of this type of systems are their scalability
and flexibility. The drawbacks of this kind of systems are that distributed network
sniffers have less performance than port mirroring due to overhead introduced by
software architecture and the increase of network traffic. The figure 2.5 shows
graphically the structure of a distributed sniffer platform.
Figure 2.5: Distributed sniffer structure example.
2.1.2.2 IEEE 802.11 sniffing details.
IEEE 802.11 based networks share access medium, so it may be easier than IEEE 802.3
switched networks to capture packets, as having a network card being able to be set to
promiscuous mode (actually monitor mode) is all the hardware required.
Page 30
Chapter 2. Background 17
Nevertheless, some considerations have to be kept in mind. When placing a sniffer in
a wireless network, some packets or even all the packets sent by a certain host may be
lost, due to environment conditions (shadowing) and the physical position of the sniffer
host and the other hosts in the network (attenuation due to propagation). IEEE 802.11
networks made up by several access points may increase capturing problems, due to the
larger coverage area (and therefore the higher reception antenna gain needed when using
a unique sniffer host).
Some approaches to solve these problems are:
• Capture packets in the wired network section: sometimes is preferable
to sniff packets in the wired section rather than capturing them in the wireless
subnetwork. This is conceptually similar to place a sniffer in the gateway link
above mentioned, so the main disadvantage is that internal wireless traffic is not
captured. This approach has also the drawback that link layer protocol (level 2)
information is lost.
• Distributed sniffer: usage of distributed systems. Pros and cons are similar
than above mentioned.
2.1.3 Libpcap.
Libpcap is the capture library for Unix systems. Windows systems use a port of Libcap
called Winpcap. This library offers the programmer an API to use BSD Packet Filter
kernel facilities or any other Packet Filter kernel architecture that is based on Berkeley
Packet Filter, to create user-level network capturing programs. Libpcap was released by
the tcpdump developers in the Network Research Group at Lawrence Berkeley Labora-
tory.
Libpcap offers the following capabilities: packet capturing from a network card, packet
capturing from a file and capturing packets to save them into a file. Libpcap was
extracted from the tcpdump program and made into a library. Development of Libpcap
is in charge of tcpdump group [6].
2.2 Network traffic analysis theory.
Network Network traffic analysis could be defined as: “the inference of information from
observation of the network traffic data flow”. Analysis in general, and hence network
Page 31
Chapter 2. Background 18
traffic analysis, can be categorized by time (or frequency) criteria and by the purpose
of the analysis.
Time based analysis categorization
Regarding time and frequency criteria, any network traffic analysis can be classified
in one of the following three categories: real-time analysis, batched analysis and
forensics analysis. The first two categories are not event orientated analysis in the
sense that analysis is performed continuously, and not when a particular event occurs
like forensics analysis do.
Real-time analysis are performed over the data as it is obtained, or using small batches
often called buffers to efficiently analyze data. The response time of this kind of analy-
sis, understood as the time elapsed between a certain event occurs and is computed or
detected, is low thanks to the low delay obtaining data and the fact that real-time anal-
ysis are fully automated. Real-time analysis though, have usually high computational
resources requirements.
In contrast, batched analysis performs analysis periodically, where the period is enough
to accumulate data in so-called data batches. Depending on the batching policies, the
response time and associated computational resources requirements may be higher or
lower, but in general they offer a higher response time and lower computational resources
requirements than real-time analysis (although they require larger storage size).
Forensics analysis in the other hand, are analysis performed when a particular event
occurs (triggered analysis). A typical example of forensics analysis are the analysis
performed when an intrusion is detected to a particular host. This kind of analysis
require that data had been previously stored to be analyzed, and may also require of
human intervention.
Network traffic analysis purposes: applications.
The main purposes for network traffic analysis and some of their applications are listed
below:
• Monitoring and management purposes. To monitor, understood as prevent-
ing and/or detecting problems over the network, like routing problems, element
failures or to enhance network link performance (load balancers, advanced routing
algorithms . . . ).
Page 32
Chapter 2. Background 19
Monitoring and management use a variety of applications and platforms, from
packet analysis tools, like tcpdump[6], Wireshark [7] or Airopeek [8], to monitor-
ing and management platforms like Nagios[15], OpenNMS [16], Pandora FMS [17],
IBM monitoring and management integrated solution[18] or Cisco Works[19].
• Security purposes. To detect, prevent, defeat or analyze in depth security flaws,
threats, attacks. . . to the network or to any element that is connected to it. Fire-
walls and Network Intrusion Detection Systems (NIDS) are the main applications
that take advantage of network traffic analysis techniques for security.
Firewalls, are basic policy based network traffic analysis systems, and due to per-
formance principally analysis are restricted to a few inspection operations over
network packets and usually run in the kernel space of the operating system of the
filtering device. Examples of them are the BSD packet filter[20] (pf) and Linux
NetFilter[21] (iptables).
The other main application that uses network data traffic analysis techniques for
security purposes are so-called network intrusion detection systems (NIDS) or net-
work intrusion prevention systems (NIPS). NIDS have the objective of inspect
network traffic in search of network intrusions to hosts connected to the network,
traffic anomalies and network misuse. NIPS in addition, try to minimize the ef-
fects of the intrusions or anomalies, by performing actions against threats, like
modifying firewall policies.
To achieve this goal, NIDS use either what is known as signature detection or
statistical approaches (or a combination of both). In signature detection based
NIDS, network traffic is examined for pre-configured and predetermined attack
patterns known as signatures or rules, contained in a ruleset. This kind of systems
effectively detect known attacks, but are unable to detect new threats and attacks
(or variations of them), and need to have rulesets updated frequently.
In the other hand, statistical based NIDS (also known as behaviour based NIDS)
use advanced statistical techniques and signal processing techniques to detect
anomalous and malicious traffic. They have the advantage of being able to detect
new threats and attacks at the expense of more computational resources required
and usually a higher number of false alarms.
Some examples are Snort [22] or Bro[23] as open source signature based NIDS, and
Cisco Systems NIPS and IBM ISS platforms as commercial NIDS/NIPS global
solutions.
• Information gathering and statistical purposes. To obtain any kind of in-
formation or statistical parameters that may be of interest to any area except of
previously mentioned monitoring, management and security areas.
Page 33
Chapter 2. Background 20
2.2.1 A little bit of history on network traffic analysis.
Network traffic analysis history could be fundamentally summarized with the history of
network monitoring on one hand and network intrusion detection on the other. Both of
them have been the main areas in which network analysis engineering efforts have been
centered in due to their interest and outcome.
Network monitoring history
Network monitoring tasks have been taken place in computer networks since first net-
works where starting to be used. Network monitoring could be defined as the use of a
system that constantly monitors a computer network for slow or failing components and
that notifies the network administrator in case of problems.
Over the years, two different kind of techniques mainly have been found effective for
monitoring purposes[24]:
• Agent based monitoring: agent based monitoring relies on a piece of software
running on the network devices that should be monitored (hosts, routers . . . ),
called agent. This piece of software collects information from the device, such as
the connectivity state of its network interfaces, link performance like throughputs
and any other information that may be of interest, and send them to a management
platform through the same network or through a dedicated management network.
SNMP (Simple Network Management Protocol)[25], in all of its versions, is a clear
example of a typical agent based monitoring and management protocol (although
SNMP has limited management capabilities, specially in versions 1 and 2).
This kind of monitoring techniques are out of the scope of this project, as agent
based monitoring generally do not involve traffic analysis engineering.
• Agentless monitoring: does not rely on agents collecting information from each
of the hosts of the network under surveillance, but on analyzing network traffic
obtained directly from the network. In this sense this kind of systems typically
supervises network traffic in terms of connection throughputs, packet routing in-
formation, TCP[26] window state to estimate congestion, host services (web, ftp,
ssh . . . ) being used among others.
This kind of systems may be totally passive systems, and hence do not interfere
on the traffic flowing in the network or be also an active system, in which the
monitoring system is able to deliberately inject packets to force devices to respond
to them obtaining information by capturing and analyzing devices responses. The
Page 34
Chapter 2. Background 21
weakness of this kind of monitoring systems is that not all the information can
be gathered from the network data observation, specially information related to of
particular hardware and software parameters on the hosts which agents are able
to supply.
Most IT administrators agree that agent based monitoring and agentless network mon-
itoring are complementary.
Intrusion detection history
Is often considered that 1972 James P. Anderson paper of the United State Air Force
(USAF)[27] set the bases of what later will be considered formerly as network intrusion
detection. Anderson highlighted the fact that the USAF had “become increasingly aware
of computer security problems. This problem was felt virtually in every aspect of USAF
operations and administration”.
The USAF, in those years, had the huge task of providing users shared access to their
computer systems, which contained different levels of classifications to be accessed by
various types of users with different levels of security clearance. The problem was: how
to assure secure access to separate classification domains within the same network.
In 1980, Anderson published a study [28] in where he presented new approaches to
improve computer security auditing and surveillance. The idea of automated intrusion
detection is often credited to him for his paper on “How to use accounting audit files to
detect unauthorized access”.
Several years later, Dorothy Denning and Peter Neumann published the first model
of a real-time intrusion detection system (IDS), called IDES (Intrusion Detection Ex-
pert System)[29]. IDES was a rule-based (signature based) system developed to detect
already known malicious traffic patterns.
In the following years several enhancements on the IDES were performed. In addition,
throughout 1980s and 1990 researchers worldwide started to investigate on the intrusion
detection field. Different projects where started, most of them funded by the U.S.
government like Discovery, Haystack, Multics Intrusion Detection and Alerting System
(MIDAS), Network Audit Director and Intrusion Reporter (NADIR).
Since the 1990s the intrusion field, and particularly network intrusion detection field
(NIDS) has become a major research field of interest. The raise of networks usage and
the Internet, as well as the 1996 successful attacks to the U.S. government website,
CIA website, U.S. Air Force, United States Department of Justice or 1997 successful
Page 35
Chapter 2. Background 22
penetration to Yahoo!’s servers for instance[30], increased the interest on the network
intrusion detection. In the later 1990s several companies, like Wheelgroups Netranger
and Internet Security Systems Real, developed their own NIDS.
In the last years, many different commercial and open source network intrusion detection
systems have been developed. Most of them are evolving from NIDS to NIPS (Network
Intrusion Prevention Systems).
Some of the most common NIDS and NIPS, both commercial and open source, are listed
below:
Open-source:
• Snort: combining the benefits of signature, protocol and anomaly based inspection
Snort is possibly the most widely deployed NIDS/NIPS technology worldwide.
Snort NIDS is free (NIPS solution is not).
• Bro: Unix-based Network Intrusion Detection System. Its analysis includes de-
tection of specific attacks (including those defined by signatures, but also those
defined in terms of events). Bro is free.
Commercial:
• Cisco Systems Network IPS: NIPS system based on signature and anomaly
analysis.
• IBM ISS (Internet Security Systems): made up by several components in-
cluding an NIDS/NIDP.
2.2.2 Network traffic analysis techniques.
In this section a brief introduction of main network traffic analysis techniques currently
in use is exposed, focusing on the analysis procedures but also outlining some of the
analysis purposes which take advantage of them. But first, some considerations over the
network traffic analysis inputs (network data) should be sketched out.
The main input source of any network traffic analysis is the collection of packets captured
from the network, commonly called the dataset or the analysis dataset. From that
dataset which may contain all protocol header information as well as application an
user information, a process of extracting (mining) the useful pieces of data for every
particular analysis has to be carried out.
Page 36
Chapter 2. Background 23
Datasets may also be broken up in smaller parts, resulting in data subsets, to later
be analysed separately. The reasons of splitting dataset are usually performance issues
with non-linear computing cost analysis algorithms, as working with large datasets may
increase computing time exponentially, or to achieve a higher time resolution due to
the reduced time interval of the datasubset. In these cases analysis are said to be
performed over windowed datasets or simply called windowed analysis. Depending on
the criteria followed to split the dataset into data subsets, two different types of windowed
datasubsets can be obtained:
• Packet windowed datasubsets. Dataset is splitted in portions of equal number of
packets each.
• Time windowed datasubsets. Dataset is splitted in time intervals. The size of the
subsets is unknown, and depends on the amount of traffic collected per second.
The usage and type of dataset windowing may affect to the results of the different
analysis performed over it, and hence windowing parameters have to be taken into
account when analysis results have to be evaluated and interpreted.
2.2.2.1 Network traffic data inspection techniques
Network data inspection techniques obtain information of network data by inspecting
network header fields of each packet, compute them and produce outputs or results.
Packet decoding (packet analyzing)
The simplest network data inspection possible is packet decoding, also called packet
analysis, in which all header’s field are decoded and presented in a human readable way.
Network analyzers like tcpdump, Wireshark or OmniPeek are some examples of packet
decoding applications.
Page 37
Chapter 2. Background 24
Figure 2.6: Screen shot of the Wireshark program.
Packet decoding is used for the vast majority of purposes, being the most reliable se-
curity (intrusion detection, bandwidth abuse...) and network management and failure
detection.
This kind of techniques are specially of interest in network security forensics analysis.
Specific packet data extraction and analysis
The extraction of pieces of data from the packets contained in the dataset instead of
decoding all packet headers information, and processing them is a strategy used when
particular aspects of traffic need to studied.
Different processing tasks can be performed over data collected:
• Graphical representation of raw data.
• Statistical information and pattern extraction
• Rule based (signature based) analysis, anomaly detection and policies.
• Flow based analysis.
Page 38
Chapter 2. Background 25
Graphical representation of raw data is of interest in many areas, principally in
network monitoring, network management and security. Representations are usually
in the form of 2D and 3D scatter plots, time based graphs, histograms, pie charts or
diagrams.
Network monitoring applications make an extensible usage of graphs like node state
monitor graphs, throughputs and link performance graphs, source and destination hosts
(IPs) histograms and scatter plots, service usage (TCP and UDP ports) histograms and
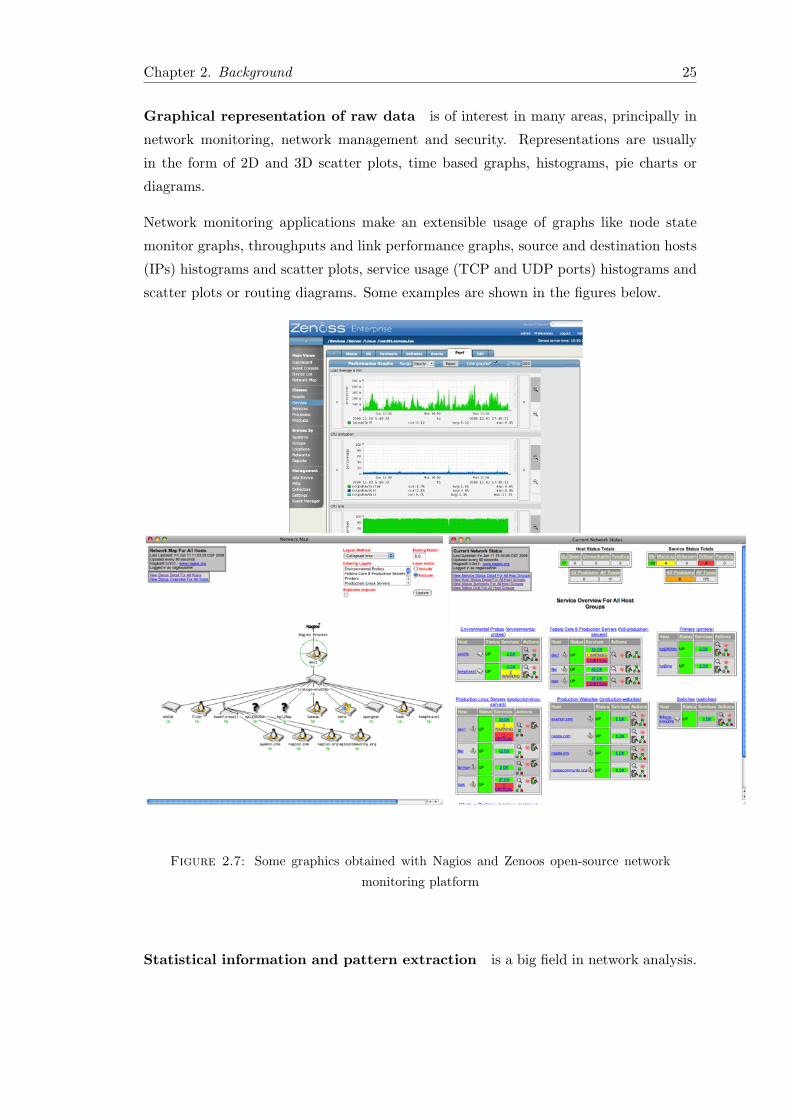
scatter plots or routing diagrams. Some examples are shown in the figures below.
Figure 2.7: Some graphics obtained with Nagios and Zenoos open-source network
monitoring platform
Statistical information and pattern extraction is a big field in network analysis.
Page 39
Chapter 2. Background 26
First and second order statistical moments, averages, time distributions and probability
distributions functions are some of the basic statistical analysis that can be performed
over network data.
Obtaining interesting statistics over network traffic is widely used primarily in moni-
toring platforms. Average number of connections to a certain hosts, average inbound
and outbound throughputs, transport and application layer protocol distribution, time
distribution of connections to servers, time distribution of average network through-
put are some examples. These statistics can also be applied for other purposes rather
tan monitoring and network management, like security or marketing purposes (specially
application level statics).
Figure 2.8: Protocol distribution graphic from the NetAnalyzer traffic analysis plat-
form
On the other hand, statistical pattern recognition or statistical pattern extraction is an
extensive area related to network traffic analysis. They are applicable to security and
marketing fields. Due to the extension of this field and complexity, further information
is given in the 2.2.2.2 section.
Rule based (signature based) analysis and policies are all the analysis that in-
spect traffic searching packets that match a certain rule or signature. Rules or signatures
Page 40
Chapter 2. Background 27
are defined as values of certain headers fields or a combination of several values of certain
headers fields. Rules may also define adequate field value intervals or thresholds.
Rule based analysis is also frequently called signature pattern matching. There is quite a
confusing usage of the term pattern over the network analysis literature, and particularly
in network intrusion detection analysis literature: while some authors use the word
pattern to designate statistical patterns (statistical user behaviour patterns, statistical
usage patterns in general) like W.S. Chen in [31] or Yung Wang in [32], some others like
Richard Bejtlich in several books like [33] use them to refer as rule based analysis. In
this thesis be are going to refer to patterns as statistical patterns only.
Rule based analysis techniques are used above all for security purposes and specially
in signature based intrusion detection systems (NIDS), like Snort. Threshold rules are
commonly used in security (for instance to detect DoS attacks and other resource abuse
attacks) and also for network management purposes like for example in network link
load monitoring.
Page 41
Chapter 2. Background 28
# (C) Copyright 2001-2004, Martin Roesch, Brian Caswell, et al.
# All rights reserved.
# $Id: ddos.rules,v 1.26 2005/02/10 01:11:03 bmc Exp $
#-----------
# DDOS RULES
#-----------
alert icmp $EXTERNAL_NET any -> $HOME_NET any
(msg:"DDOS TFN Probe"; icmp_id:678; itype:8;
content:"1234"; reference:arachnids,443;
classtype:attempted-recon; sid:221; rev:4;)
alert icmp $EXTERNAL_NET any -> $HOME_NET any
(msg:"DDOS tfn2k icmp possible communication";
icmp_id:0; itype:0; content:"AAAAAAAAAA";
reference:arachnids,425; classtype:attempted-dos; sid:222; rev:2;)
alert udp $EXTERNAL_NET any -> $HOME_NET 31335
(msg:"DDOS Trin00 Daemon to Master PONG message detected";
content:"PONG"; reference:arachnids,187;
classtype:attempted-recon; sid:223; rev:3;)
alert icmp $EXTERNAL_NET any -> $HOME_NET any
(msg:"DDOS TFN client command BE"; icmp_id:456;
icmp_seq:0; itype:0; reference:arachnids,184;
classtype:attempted-dos; sid:228; rev:3;)
Figure 2.9: Some Snort rules.
In this sense, rules could be considered as policies, as certainly define the type and
amount of traffic permitted and not permitted in the network.
Flow based analysis techniques are focused in the treatment of network traffic as
flows, as most information exchanged in a computer network is session or connection
oriented and not packet oriented, so analysis can take advantage of it. A clear example
of a typical network flow is a TCP connection, where data exchanged is ruled by the
TCP state machine[26].
Page 42
Chapter 2. Background 29
Their main applications are in the monitoring and security field. Regarding security,
most NIDS like Snort, use flow based analysis techniques to detect possible threats,
based on anomalies and well known attacks.
Monitoring platforms on the other hand, inspect network traffic in search of flows, to
generally list them or represent them in a diagram.
2.2.2.2 Advanced statistical and signal processing techniques applied to the
network traffic analysis
Since early 1990’s, researchers all over the world have devoted some of their efforts in the
research of advanced statistical analysis techniques and also applying signal processing
techniques to the network traffic analysis. The efforts have been centered in the network
intrusion detection and prevention field, due to the fact that signature based NIDS
(and NIPS) have important limitations detecting new security threats, as new rules
for detection appear as new attacks and security threats are discovered. In addition,
signature based NIDS have the obvious drawback that rulesets have to be frequently
updated.
Platforms or applications that use statistical techniques for the network intrusion de-
tection are known as Statistical Network Intrusion Detection Systems or alternately
Behaviour based Network Intrusion Detection Systems. This kind of NIDS rely on ad-
vanced statistical techniques, heuristic pattern extraction and signal processing to detect
anomalies and classify network traffic.
Y. Wang exposes in his book [32] a general and up to date state-of-the-art of most
reliable statistical techniques in the field of statistical network intrusion detection. There
is also an extensive set of publications from researchers over new statistical and signal
processing techniques applied to network intrusion detection. Some of the techniques
are briefly introduced here.
Linear and Nonlinear modeling methods
Significance tests, like χ2 (chi-square) test and t-test have been proposed for a sim-
ple network intrusion detection, examining frequency difference between two categorical
variables and differences between two continuous variables respectively. Linear methods
like logistic models, regression models, principal component analysis or clus-
tered based analysis are some of the main methods suitable to use complex statistical
modeling techniques to examine user behaviour based on network traffic data.
Page 43
Chapter 2. Background 30
Non linear methods are fundamentally based in AI (artificial intelligence) algorithms
like Artificial neural networks, Fuzzy logic algorithms and K-nearest neighbour
algorithms have also been found effective for aiding network intrusion detection decisions.
Bayesian and probability approaches
Bayesian and probability approaches assume that parameters that are being studied are
random rather than fixed parameters. Before looking at the current data, old infor-
mation can be used to construct a prior distribution model for these parameters and
therefore classify new data based on how likely various values of the unknown param-
eters are, and then make use of the current data to revise this starting assessment so
that parameters can be considered random, not fixed. This attribute allows an intrusion
detection systems to make a more precise decision based on the probability approach.
Latent class model based analysis like proposed in Wang, Kim, Mbateng and Ho [34]
or Bayes role based analysis like proposed by Barbard, Wu and Jajodia [35] are some
examples of Bayesian and probability approaches.
Other
Data mining techniques are based on the combination of machine learning, statistical
analysis modeling and database technology to find patterns and subtle relations between
network data fields to allow future prediction results. Several research papers have been
published in this direction like Lee, Stolgo and Mok 1999 paper [36].
Fourier model has been proposed [37] for effectively detect DoS and Probe attacks
by analyzing periodicity in either packet arrival or connection arrivals.
2.3 GPUs
Graphical processor units commonly referred to them as GPUs and occasionally called
visual processing units or VPUs, are a specialized type of processors that its purpose is
to offload 3D graphics rendering from the microprocessor or CPU.
The history of GPUs started in 1970s, where ANTIC and CTIA chips provided for
hardware control of mixed graphics and text mode on Atari 8-bit computers. The
ANTIC chip was a special purpose processor, that mapped text and graphics data to
the video output.
Page 44
Chapter 2. Background 31
Later, in 1984 the IBM Professional Graphics Controller appeared as one of the first
2D/3D graphics accelerators available for the IBM PC architecture compatible systems.
IBM’s chip did not succeed, due to the lack of compatibility with already existing pro-
grams and due to its high price.
The first mass-market computer to include a dedicated graphics processor was the Com-
modore Amiga, that was launched in 1985. The dedicated graphics processor from
Amiga was the first full graphics accelerator as offloaded practically all video operations
from the CPU.
By the time, IBM’s 8514 graphics system was the first PC video cards to implement 2D
primitives in hardware.
In 1991, S3 manufacturer introduced the S3 86C911 to the market, which claimed to be
the first single-chip graphics card to implement 2D acceleration functions in hardware.
The rest of the manufacturers followed the 86C911 model, and by 1995, all major PC
graphics processor vendors had added 2D hardware acceleration support to their chips.
During the first half of 1990s decade, CPU based real-time 3D graphics were becoming
increasingly significant, specially in the CAD (Computer Aided Design) field and spe-
cially in computer video games. As video games gained popularity, and the consequent
increasing demand of 3D hardware acceleration, graphics manufacturers started the de-
velopment of 2D and 3D graphics accelerators. This milestone was reached with the
launch of Verite V1000 chip in 1996 by Rendition.
During the second half of 1990s decade, and thanks to the increasingly success of 3D
graphic programs, fundamentally video games, several manufacturers appeared to com-
pete over the GPU market. By the end of 1990s, manufacturers leaders were 3dfx,
ATI and NVIDIA. NVIDIA launched the Geforce 256 in 1999 being the first card on
the market with hardware transform and lighting capabilities, adopting new hardware
solutions that set the precedence for future designs like pixel shaders and vertex shaders.
During the early 2000s, thanks to the OpenGL API, a multiplatform and multilanguage
API that was created in 1992 by Silicon Graphics Inc. to help programmers draw 3D
images, and new the hardware architectures that allowed each image pixel be processed
by a short program that could include additional image textures as inputs and geometric
vertex be processed similarly, 3D applications experienced a major graphical capabil-
ity improvement.The first device that supported vertex shaders programming was the
NVIDIA’s Geforce 3.
In 2000 3dfx was acquired by NVIDIA. From that point to the present, the market of
high performance GPU chips has been dominated by NVIDIA on one hand, with an
Page 45
Chapter 2. Background 32
estimated market-share of 63.46% in October of 2009 according to [38], and ATI, with
and estimated of 28.97% of market-share according to [38] at the same date.
The latest chips of NVIDIA are the G80 and G90 chip family (Geforce 8 and 9 ) gener-
ation. Recently NVIDIA has published a new architecture for the CUDA enabled chips
with the code name Fermi[39], which will have 512 cores integrated in the chip, as well
as bigger L1 and L2 cache memory sizes and memory error correction among others,
making it more suitable for general purpose computing. For his part ATI has developed
Radeon 5000 family, with the Evergreen graphic chipsets.
2.3.1 GPGPU: general-purpose computing on graphics processing units.
GPGPU stands for General-Purpose Computing on Graphics Processing Units. Since
2003, several researchers like Harris, Mark J., William V. among others [40], outlined
that current architecture of high performance GPUs in terms of FLOPS (FLoating-point
Operations Per Second), with programmable fragment and vertex shaders that enabled
the programmers to create more realistic and complex graphics, could be used for other
purposes rather than graphic calculations.
The motivation of GPGPU was performance improving of computing algorithms, and
particularly to overcome limitations of traditionally CPU based computing already
pointed in section 1.1: the instruction-level parallelism wall and the memory wall.
On one hand, although GPUs architecture offer a limited set of operations to be per-
formed over data, they have the ability to process many of them in parallel, thanks
fundamentally to the programmable shaders that were added to the GPU processor’s
pipelines. GPUs are able to compute many vertices or fragments of graphics in the
same way in so-called streams. A stream is simply a set of elements that require similar
computation, providing data parallelism, and kernels are the functions that are applied
to each element in the stream.
In the other hand, the usage of graphical processor units have another important advan-
tage over traditionally computing CPU based model; its memory bandwidth. In the last
decade the gap between CPU and memory speed have kept growing, and thus memory
latency has become a major bottleneck in CPU computing, specially in applications
with an intensive usage of memory. The evolution of theoretical single precision floating
point operations (FLOPS) [2] for both Intel based CPU processors and NVIDIA based
GPU processors is shown in the figure 2.10.
Page 46
Chapter 2. Background 33
Figure 2.10: GPU (NVIDIA) vs. CPU(Intel) processor FLOPS performance gap.
Based on [2]
First attempts of using GPUs with other purposes rather than graphics, required to
transform or convert complex algorithms and data into a graphics, to be able to use
the GPU through graphics libraries (like OpenGL) to solve them and later revert the
transformation.
NVIDIA, conscious that GPGPU could be an important boost for the GPU market
and also knowing that the current approaches for using GPUs for general purpose pro-
gramming required a high level of knowledge and was a tedious job, started developing
an SDK with the purpose of simplifying the task of GPGPU programming. The re-
sult of this development was CUDATM(Compute Unified Device Architecture), that was
launched in November 2006.
CUDA is a parallel computing architecture that enables programmers to use both CPU
and GPU processors to cooperate in a single program, using a computing paradigm
known as heterogeneous computing. Software developers are able to program general
purpose functions or routines to be run on the GPU by simply use “C for CUDA” (C
with NVIDIA extensions) while the rest of the program is still executed in the CPU.
Page 47
Chapter 2. Background 34
CUDA has become widely used in many areas such as physics simulations, scientific
and medical simulations, signal processing, cryptography or audio and video processing
among others.
ATI also launched his own GPGPU SDK called Stream SDK, but at the time Stream
SDK has not been as successful as CUDA.
2.3.2 CUDA architecture and programming model for GPGPU
The CUDA SDK allows programmers to code parts or functions of a general purpose
program to be executed in the GPU using C language with some extensions. The main
three key abstractions that are exposed to the programmer as the C extensions are: a
hierarchy of thread groups, shared memories and thread barrier synchronization.
CUDA programmers have to partition the algorithms or parts of the code that are going
to be boosted using the GPU into coarse sub-problems that can be solved independently
in parallel, and then into smaller pieces that can be solved cooperatively in parallel.
Functions executed into the GPU are called kernels, the rest of the code, and particularly
high control intensive parts of the code, are executed on the CPU.
Kernels are functions designated with global attribute. When they are called, ker-
nels throw a total number of N threads. To achieve a good performance in general,
kernels should throw thousands of threads.
Figure 2.11: CUDA thread hierarchy (based on [2])
Page 48
Chapter 2. Background 35
Figure 2.11 show kernel’s thread organization of model. The N threads thrown by the
kernel are organized in 2D array of blocks called grid 3, each of this blocks containing a
3D array of threads. The number of threads, and their organization cannot be modified
during the kernel execution. The programmer may use or not multidimensional block
and grid organization according to their needs, simply not using (0 value) the dimensions
not needed.
The programmer can access to the current thread block ID dimensions values with
variables blockIdx.x and blockIdx.y respectively. Likewise, the programmer can ac-
cess to current thread ID dimension with variables threadIdx.x, threadIdx.y and
threadIdx.z respectively. The combination of blockIdx and threadIdx complex vari-
ables values identify unequivocally each thread, and are used to perform ordered data
accesses and execute code conditionally depending on the thread and block IDs.
Currently, CUDA based programs have the restriction of a maximum of 65536 (216)
threads and the limitation of 512 threads/blocks per dimension due to current GPU
architectures (Tesla architecture).
The code contained in the figure 2.12 shows a simplified example of a kernel call, throwing
vecAdd kernel with a 1D grid organization and 1D thread block organization, throwing
NB blocks, with NT threads per block. Some coding details, like memory data transfers
from CPU to host are omitted for simplicity.
1 __global__ void vecAdd(float* A, float* B, float* C)
2 {
3 int i = threadIdx.x;
4 C[i] = A[i] + B[i];
5 }
6 int main(int argc , char *argv [])
7 {
8 vecAdd <<<Nb ,Nt >>>(A, B, C);
9 return 0;
10 }
Figure 2.12: CUDA kernel example and associated main() function (simplified).
Kernels are called using kernel name<<<dim3 gridSize, dim3 blockSize,...>>>(...)
syntax, where gridSize and blockSize are dim3 variables NVIDIA C extension , which33D grid is currently implemented but yet not supported.
Page 49
Chapter 2. Background 36
define the number of blocks in the grid and their organization in gridSize, and the num-
ber of thread per block and their organization in the case of blockSize (they can be
constants, in which case 1D organizations are assumed).
When executing kernel functions, threads within the same block can cooperate sharing
data using special variables residing in so-called shared memory space, tagging those
variables with the shared attribute. CUDA also offers the possibility to synchronize
all the threads within the same block only with a barrier, by using syncthreads()
API function.
In CUDA architecture several different memory spaces are defined. Figure 2.13 shows a
simplified diagram of memory spaces[2].
Figure 2.13: CUDA memory hierarchy (based on [2])
All the threads in the block have their own read-and-write local memory and registers
that can only be accessed by itself. Shared memory instead, is defined with shared
variable attribute, and all the threads within the block can read-and-write in it (note that
shared memory is not race-condition free). Additionally CUDA offers the programmer
two more read-only memory spaces, a reduced size (currently 64KB) constant memory
space ( constant ), which is fast as it is cached and texture memory ( texture ),
which is also very fast. Finally global memory space ( global ) is a read-and-write mem-
ory space, with large capacity but slow access speed. the global, texture and constant
memory spaces are persistent across multiple kernel launches by the same application.
The following table summarize memory spaces access costs.
Page 50
Chapter 2. Background 37
Memory space Size Latency R/W
Global up to 768MB 200-300 cycles R/W
Shared 16KB/SM ' Register latency R/W
Constant 64KB total ' Register latency R/-
Texture up to global ≥ 100 cycles R/-
Local up to global 200-300 cycles R/W
Table 2.1: Memory spaces in a Geforce 8800 GTX. Extracted from [3].
CUDA also has several limitations compared to the traditional CPU based programming.
CUDA does not support at the time function pointers and the accesses to global memory
must be aligned to a 4-byte address[3]. This is basically due to hardware architecture
limitations, and is possible that in future GPU architectures these limitations have been
solved, as NVIDIA have assured that new architectures will be CUDA compatible.
Page 51
Chapter 3
Design
3.1 Developing tools and methodology.
As previously outlined in section 1.2, the tools and programming languages that have
been used in the developing process of the framework are:
Languages:
• C++[42]: to take advantage of object oriented programming (classes, inheritance
and polymorphism) and also due to the performance requirements, C++ has been
used in the entire program, except when using CUDA as C++ is still not fully
supported by CUDA1.
• CUDA[43]: CUDA is the “language” or SDK used to perform general purpose
calculations in the GPUs.
• Bash scripting: bash scripting language has been used for several pre-compiling
scripts.
Libraries:
• Libpcap[6]: library to obtain packets from the Packet Filter.
• unixODBC[44]: ODBC library used to save analysis results to a database.
• GNU utilities[45]: Several GNU programs have been used. Further information
can be found in Implementation section.1CUDA 2.3 supports C++ template meta-programming but not classes.
38
Page 52
Chapter 3. Design 39
The methodology used in the development phase has been the spiral model.
Figure 3.1: Spiral methodology used in the developing process of the framework
In this methodology, in each turn of the spiral, the process of determining the objectives
and requirements, analyzing the possible risks, developing and testing and planning
(understood as an evaluation of the result), are done over the project. The number
of turns through the spiral depend on the implementation issues that might be found,
the accuracy of objective definition in the early stages of the development and the
requirement fulfillment of the current implementation.
3.2 Framework design overview.
The main objective of this thesis has been to design and implement a framework capable
of giving the user a simple way of programming network traffic analysis using GPUs, and
specifically using CUDA. In addition, the framework should give an easy and extensible
way of reusing analysis code for multiple analysis purposes, and thus giving the chance
to programmers not knowing CUDA to create framework-based applications. A more
extensive definition of the project objectives can be found in section 1.2.
The framework should allow users to create an undefined number of analysis, that are
going to analyze network data captured or obtained from either network interfaces or
from several capture files. The workflow planned for those applications based on the
framework should be:
Page 53
Chapter 3. Design 40
Figure 3.2: Framework workflow (design).
Framework design has been divided in several subsystems or components. The diagram
contained in figure 3.3 shows the relationship between these components.
Figure 3.3: Framework design diagram.
• PacketFeeders: in charge of obtaining network packets and buffering them into
PacketBuffer objects.
• Analyzer: obtaining the PacketBuffer objects from PacketFeeders and distribut-
ing them to all the Analysis components.
• Analysis: performing analysis calculations over the data contained in the Pack-
etBuffer objects. They also perform actions depending on the results obtained.
Page 54
Chapter 3. Design 41
The framework should simply require that the program main() function contain the
addition of new Analysis and PacketFeeder components to the Analyzer component,
prior to start the analysis process. The figure 3.4 shows how this should be translated
into code (pseudo-code):
main(){
// Add as much Analysis components as desired
Analyzer.addAnalysis(analysis1);
Analyzer.addAnalysis(analysis2);
// ...
Analyzer.addAnalysis(analysisN);
// Add as much PacketFeeeder components as desired
Analyzer.addFeeder(packetfeeder1);
Analyzer.addFeeder(packetfeeder2);
// ...
Analyzer.addFeeder(packetfeederM);
//Start obtaining packets and analyzing
Analyzer.start()
}
Figure 3.4: main() function structure draft (pseudo-code).
3.2.1 PacketFeeders.
The framework defines PacketFeeders as the components in charge of obtaining network
packets and packing them into a PacketBuffer class object.
The PacketBuffer class should define an array of MAX BUFFER PACKETS packets, in
which raw network data, basically network headers, are stored. The size of each packet
buffer should be fixed to MAX BUFFER PACKET SIZE bytes, to easily be accessed by GPU
threads as a function of the thread id. The figure below outlines the basic structure of
the PacketBuffer class.
Page 55
Chapter 3. Design 42
typedef struct{
uint8_t data[MAX_BUFFER_PACKET_SIZE];
}packet;
class PacketBuffer {
packet buffer[MAX_BUFFER_PACKETS];
}
Figure 3.5: PacketBuffer basic structure draft (pseudo-code).
PacketFeeders may obtain packets from any kind of source and pack them into PacketBuffer
objects. The framework, as previously said in the objectives, should allow at least:
• Obtain packets from network interfaces in real-time. This capability will al-
low the framework to perform any kind of real-time traffic analysis, like monitoring,
management or security surveillance tasks.
• Obtain packets from a tcpdump capture file, or from any other source. This
feature will allow framework users to perform forensics analysis (or even batched
analysis), to, for instance, obtain information after a security attack has been
perpetrated.
From the design point of view though, all the PacketFeeder objects, regardless of its
packet source, should indeed implement the same abstract class or interface. The inter-
face should have at least the method getSniffedPacketBuffer(), where the Packet-
Feeder supplies a filled PacketBuffer object, as shown in the following figure.
abstract class PacketFeeder {
PacketBuffer getSniffedPacketBuffer(void);
}
Figure 3.6: Abstract class for PacketFeeder (pseudo-code). Draft.
This component, and specifically the classes created that inherit from the abstract class
PacketFeeder, are going to use the Libpcap library for obtaining packets from a network
card or a file.
Page 56
Chapter 3. Design 43
3.2.2 PreAnalyzer.
The PreAnalyzer component has been used in the development process for debugging
purposes, and specifically to debug PacketFeeder components and to obtain useful in-
formation over the network capture files that have been used. During the development
phase, PreAnalyzer component has been executed right before the buffers retrieved from
PacketFeeders have been sent to all the analysis, giving to the programmer the chance to
check and decode network packet information, and also verify the correct implementation
and operation of PacketFeeder objects using host code (C++).
From the framework design point of view, PreAnalyzer will not be a part of the user-
framework, although it will be included in the source code to help developing and ex-
tending the framework architecture.
3.2.3 Analyzer.
The Analyzer should be a unique object (static object) in the whole framework-based
program, acting as a distributor or hub of the PacketBuffer objects filled by Packet-
Feeders and all the Analysis of the framework-based program. This component should
provide the flexibility to the framework, in terms of easy inclusion of new PacketFeeder
and Analysis components to the framework-based program.
As the framework should allow users to have a multiple PacketFeeder objects and also
multiple Analysis components in the same program, different policies on how to retrieve
and distribute PacketBuffer objects on programs using multiple PacketFeeder and
Analysis components, could be implemented:
Buffer retrieving policies:
• Event oriented buffer retrieving (interruptions). The buffers are retrieved as
they are filled, and require an interruption or signaling mechanism to the Analyzer.
This policy make no sense with PacketFeeder objects obtaining packets from a
capture file.
• Retrieve buffers sequentially, by obtaining Nbuffers buffers from each Packet-
Feeder object contained in the program. A particular case of this, is obtaining a
buffer from each feeder sequentially.
The drawback of this kind of policy is that packet rates between feeders obtain-
ing packets in real-time should be similar or analysis time should be less than
capturing time, to avoid packet loss.
Page 57
Chapter 3. Design 44
Buffer broadcasting policies:
• Broadcast buffers to all Analysis components.
• Broadcast buffers to only a set of Analysis components, based on Packet-
Buffer object parameters, for instance network interface or file origin.
• Broadcast buffers to only one Analysis components sequentially. This
policy makes no sense with the current design of the framework.
Obtaining buffers sequentially, one by one from each feeder (Nbuffers = 1), and broad-
casting them to all analysis policies have been assumed in the design and implementation
of the framework, as they are in our opinion the most reliable. However, the design of
the Analyzer could be easily extended to allow other policies, and they are considered
in the future work subsection of section 4.5.
The following diagram shows a functional description of the Analyzer component main
execution loop in pseudo-code.
//Assuming sequential buffer obtaining policy
//and buffer broadcasting to all analysis policy
analyzerStart(){
while(1){
//For each feeder in allFeeders
foreach feeder in allFeeders{
//Obtain buffer from a PacketFeeder
buffer = feeder.obtainBuffer();
//For each analysis in allAnalysis
foreach analysis in allAnalysis{
//Analyze buffer
//execute GPU(analysis) and CPU(hooks) code
analysis.analyze(buffer);
}
}
}
}
Figure 3.7: Functional description of the Analyzer main loop (pseudo-code). Draft.
Page 58
Chapter 3. Design 45
In order to ease adding both Analysis and PacketFeeder components, the design of
Analyzer static class should include two methods; addAnalysisToPool(...) and the
addFeederToPool(...). The following figure presents a draft of the Analyzer class
structure, without analyzerStart() implementation presented in the figure 3.7.
class Analyzer {
//Add PacketFeeder to analyzer feeders pool
addFeederToPool(PacketFeeder feeder);
//Add Analysis component to analyzer analysis pool
addAnalysisToPool(Analysis analysis);
//Start analyzer loop
analyzerStart();
}
Figure 3.8: Analyzer class structure (pseudo-code). Draft.
3.2.4 Analysis.
Analysis components are the main components of the framework. Analysis should be
objects performing a specific calculation or analysis over the network data buffered,
inside the GPU using CUDA.
The Analysis components design should accomplish the following features and design
demands:
• Easy addition of new Analysis components to the Analyzer component.
• Each analysis, has to be a unique entity in the whole framework-based program,
performing a particular analysis task.
• Each Analysis component has to include the GPU analysis code (CUDA code) and
the actions to be done over the analysis results, which we will refer to as hooks
(C++ CPU code).
• The code of the analysis and hooks section should be easily reused in other analysis
entities, in the form of libraries or modules.
Analysis components, therefore, should be unique objects or “static classes” in the whole
framework-based program. To ease adding analysis to the Analyzer, all analysis should
have the same entry point or method; launchAnalysis(...).
Page 59
Chapter 3. Design 46
The design of the Analysis is divided in two different sections: the analysis code section,
containing CUDA code, and the actions or hooks code section, containing CPU code.
According to the study carried out to find a general structure suitable for most of the
network traffic analysis, the analysis code section has been divided in several functions
or methods. The following functions have been identified:
• mining(). This function is defined as the routine in charge of obtaining the data
needed by the analysis function from the network packets contained in the buffer,
and place it into the analysis input data array.
• preAnalysisFiltering(). The pre-analysis filtering function is intended to con-
tain code filtering the analysis input data array of the analysis() function. This
function might filter data by other criterias rather than the ones used in the
mining()function.
• analysis(). The analysis function must contain the analysis algorithms, taking
as algorithms input data the input data array and placing the results into a results
array. In general, the data-type of the input and output array may be different,
as well as the number of results.
• postAnalysisOperations(). In this function, the programmer should be able to
define operations over the results array, filter the results or perform small calcula-
tions over them.
Figure 3.9: Analysis component graphical scheme
Figure 3.10: Detail of the analysis() routine of Analysis component
Page 60
Chapter 3. Design 47
The operations or hooks section, in the form of the hooks() function, is defined as the
function where programmers have the ability to code actions depending on the analysis
results obtained from the GPU analysis. C/C++ code, external libraries, like unixODBC
library, and in general any other programming tool that may be of interest should be
used within hooks() function, in contrast of the analysis section.
According to all what was previously highlighted, any analysis of the framework should
follow the structure outlined in the subsequent figure.
abstract class Analysis {
/*
User must implement:
1. analysis section (kernel) functions
2. hooks() function
*/
//CUDA analysis main function (kernel)
__global__ kernel(packetBuffer buffer, OUTPUT_TYPE results){
mining(...);
preAnalysisFiltering(...);
analysis(...);
postAnalysisOperations(...);
}
//Analysis launch function
launchAnalysis(packetBuffer buffer){
//Analysis section: call GPU functions
kernel<<<gridSize,blockSize>>>(buffer,results);
//Hooks section
hooks(buffer,results);
}
}
Figure 3.11: Analysis abstract class structure (pseudo-code).Draft.
Finally, Analysis components should allow to reuse code of analysis and hooks sections
in the form of a libraries or a modules. The idea behind this, is to create an open-
source set of modules to be delivered with framework source code, containing analysis
Page 61
Chapter 3. Design 48
algorithms, hooks and other useful routines, to be used by other user programmers in
order to take advantage of them.
Page 62
Chapter 4
Implementation
4.1 General considerations
The current implementation of the framework has been developed using the following
versions of the libraries and programming tools:
• GCC 4.3.
• CUDA release 2.3.
• LibPcap 0.8.
• Libc6 version 2.07.
• unixODBC version 2.2.11.
• Autotools version 1.11.
4.1.1 Framework implementation overview.
The framework has been developed based on the design presented in the chapter 3. The
framework user workflow obtained though, has been heavily modified due to the facts
exposed in the section 4.6.
The framework compilation workflow resulting of the development process has been:
49
Page 63
Chapter 4. Implementation 50
Figure 4.1: Analysis components compilation workflow (separately).
Figure 4.2: Framework-based application compilation workflow.
The components are made up from a set of template files to simplify the task of the
framework user, containing the analysis .cpp and .h file and a Makefile. The analysis
components are first compiled into .o objects with nvcc and the framework library, after
the process of code parsing to obtain the files .syncblocks.ppph and .dmodule.ppph
is made, to automatically configure some parameters of each analysis.
The framework-based executable is then created by compiling the file containing the
main() method, the rest of analysis objects and the framework library.
Page 64
Chapter 4. Implementation 51
Source structure
The source code of the framework (trunk) is the one showed in the figure 4.3, obtained
using the tree -d command (truncated):
.
|-- Analysis
| |-- BlankAnalysisTemplate
| |-- Libs
| | |-- Gpu
.............
| | |
| | ‘-- Host
.............
| |
| ‘-- Modules
.........
|
|-- Analyzer
|-- Common
| ‘-- Protocols
|-- ConfigFiles
|-- Examples
| |--
.....
|-- PacketFeeders
|-- PreAnalyzer
|-- TestBench
‘-- Tools
Figure 4.3: Framework source code structure (truncated).
Each component has his own directory within the source directory, like Analysis, An-
alyzer . . . The Analysis component is where most of the code is placed, and has two
important subfolders Libs and Modules. The first subfolder contains both CPU and
GPU libraries, while the Modules folder contains the code modules1 of the framework.
The Common directory contains common classes like PacketBuffer or protocol headers
(Protocols subfolder). The Testbench folder contains tcpdump capture files for testing
purposes, and the Tools folder contains fundamentally the PrePreProcessor scripts.1Section 4.6.5
Page 65
Chapter 4. Implementation 52
4.1.2 Framework threading model.
The framework has been developed using the pthreads library. The implementation cur-
rently uses the main thread(the one executing main() routine) for all the analysis tasks,
including the analyzer, and one for each packetFeeder object created by the framework-
based application.
The reason of having a thread for each packet feeder, independent from the analysis/-
analyzer thread, is to assure that the capturing tasks of the feeder do not affect to the
analysis performance or to the capturing rate of other packetFeeder objects.
The figure below shows the threading model of the framework-based applications graph-
ically.
Figure 4.4: Framework-based applications threading model (CPU).
4.1.3 Naming conventions.
All the source code developed in this project uses the same name convention. The style
used to define types, classes, functions, methods and variable names is basically C++
style.
• Class names are spelled in mixed case starting with upper case. Examples: MyClass,
MySecondClass.
• Methods are spelled using mixed case starting with lower case. Examples: myFunction(),
myOtherFunction().
• Types defined with typedef are spelled using mixed case starting with lower case
and with the suffix t. Examples: myType t, anotherType t.
Page 66
Chapter 4. Implementation 53
• Variable names are spelled using mixed case starting with lower case. Examples:
variableName, anotherVariableName.
In addition, all the pointers corresponding to addresses of the GPU memory space are
named using the variable name style, and with the prefix GPU . Examples: GPU buffer,
GPU data.
4.2 Common classes
In this section an overview of the common implementation classes used in several com-
ponents of the framework is presented, corresponding to the classes contained in the
folder Common of the source code.
4.2.1 PacketBuffer
PacketBuffer as described in section 3.2.1, is in charge of the network packet data buffer-
ing. Figure 4.5 shows partially the implementation of the header of the class.
1 /* ... */
2 #define MAX_BUFFER_PACKETS 3840 //Max number of packets
3 #define MAX_BUFFER_PACKET_SIZE 94 // Packet max size
4 #define TIMESTAMP_OFFSET sizeof(int)
5
6 typedef struct{
7 int proto [7];
8 int offset [7];
9 }headers_t;
10
11 typedef struct{
12 timeval timestamp;
13 headers_t headers;
14 uint8_t packet[MAX_BUFFER_PACKET_SIZE ];
15 }packet_t;
16
17 class PacketBuffer {
18
19 public:
20 /* ... */
21 int pushPacket(uint8_t* packetPointer , const struct pcap_pkthdr* hdr);
22 packet_t* getPacket(int index);
23 /* ... */
24 protected:
Page 67
Chapter 4. Implementation 54
25 // DataLink info for all packets
26 int deviceDataLink;
27
28 unsigned int lastPacketIndex;
29 unsigned int lostPackets;
30 packet_t* buffer;
31 /* ... */
Figure 4.5: Extract of PacketBuffer.h
The class implements packet buffering by defining a protected packet t array named
buffer, containing up to MAX BUFFER PACKETS packet t elements (dynamically allo-
cated, in the source code of PacketFeeders/PacketBuffer.cpp file).
The defined packet t type structure, contains three elements: the packet timestamp,
in timestamp field, a header t structure object headers and the packet data in the
uint8 t array packet.
The content of packet data, in this case the network protocol headers, is stored in the
field packet by copying directly the raw data from the captured packet. That means
the data contained in the field packet, and particularly the headers, are not aligned
and they are in network bit representation (BIG ENDIAN format). These facts
will have their implications in analysis component implementation.
The headers field is used to store packet protocol dissection result. The dissection
process is described in depth in section 4.2.2, and is carried out by classes implement-
ing abstract methods of Dissector class. Regarding PacketBuffer, the usage of the
SizeDissector class is required for two reasons:
• Protocol identification. Network protocol headers are identified, and the infor-
mation is stored in headers struct.
• Packet data size calculation. As packet field has a fixed and limited size
(MAX BUFFER PACKET SIZE), packets not fitting buffer should be dropped, as net-
work headers can be cracked, and hence packet data size calculation is needed.
The implementation decision of saving the protocol identification information in the
headers field, responds to four main reasons:
• Packet data size calculation is needed, and hence a protocol identification process
has to take place anyway.
Page 68
Chapter 4. Implementation 55
• The process of protocol identification is done only once, thanks to the way in-
formation is stored. Later this information can be used in both CPU and GPU
functions/methods without having to re-identify protocols.
• Dissector implementation, offers a simple way to perform protocol identification
and, at the same time, actions depending on the protocol that is being identified,
due to the implementation of Dissector class.
• Dissection is not done in the GPU because the implementation of a GPU dissector
could be tedious to code and hard to maintain, due to the lack of class support
by CUDA 2.3. In addition polymorphism is not supported by CUDA either, as no
function pointers can be used in the current CUDA implementation.
Future work
The future work that could be carried out over current PacketBuffer implementation is
basically dynamic size adjusting of the packet field contained in the packet t
struct. The idea behind that is to ensure that packet dropping is under a certain
threshold; for instance to ensure that packet loss is below 1%. This is indeed, partially
implemented, as PacketBuffer’s lostPackets variable is incremented when a packet is
dropped, and therefore, using lastPacketIndex and lostPackets, loss ratio can be
calculated when buffer is filled as:
LostPacketRatio% = lostPacketslastPacketIndex+lostPackets100
Figure 4.6: Lost packet ratio calculation.
4.2.2 Dissector
The Dissector is an abstract class interface implementing network protocol identifi-
cation. At the same time Dissector defines a set of pure virtual (abstract) Action
methods, one for each network protocol. The derived classes must implement Action
methods, giving an easy way to implement specific code that is going to be executed
when that particular protocol is identified within a dissection process.
The figure 4.7 contains the source of the Common/Dissector.h
1 #ifndef Dissector_h
2 #define Dissector_h
3
4 #include <pcap.h>
Page 69
Chapter 4. Implementation 56
5 #include <inttypes.h>
6 #include <iostream >
7 #include <arpa/inet.h>
8
9 #include "../ Util.h"
10
11 // Protocols
12 #include "Protocols/Ethernet2Header.h"
13 #include "Protocols/Ip4Header.h"
14 #include "Protocols/TcpHeader.h"
15 #include "Protocols/UdpHeader.h"
16 #include "Protocols/IcmpHeader.h"
17
18 using namespace std;
19
20 class Dissector {
21
22 public:
23 unsigned int dissect(const uint8_t* packetPointer ,const struct
pcap_pkthdr* hdr ,const int deviceDataLinkInfo ,void* user);
24 private:
25 void dissectEthernet(const uint8_t* packetPointer ,unsigned int *
totalHeaderLength ,const struct pcap_pkthdr* hdr ,void* user);
26 void dissectIp4(const uint8_t* packetPointer ,unsigned int *
totalHeaderLength ,const struct pcap_pkthdr* hdr ,void* user);
27 void dissectTcp(const uint8_t* packetPointer ,unsigned int *
totalHeaderLength ,const struct pcap_pkthdr* hdr ,void* user);
28 void dissectUdp(const uint8_t* packetPointer ,unsigned int *
totalHeaderLength ,const struct pcap_pkthdr* hdr ,void* user);
29 void dissectIcmp(const uint8_t* packetPointer ,unsigned int *
totalHeaderLength ,const struct pcap_pkthdr* hdr ,void* user);
30
31 // Virtual Actions:
32 virtual void EthernetVirtualAction(const uint8_t* packetPointer ,
unsigned int* totalHeaderLength ,const struct pcap_pkthdr* hdr ,
Ethernet2Header* header ,void* user)=0;
33
34 virtual void Ip4VirtualAction(const uint8_t* packetPointer ,unsigned
int* totalHeaderLength ,const struct pcap_pkthdr* hdr ,Ip4Header* header
,void* user)=0;
35
36 virtual void TcpVirtualAction(const uint8_t* packetPointer ,unsigned
int* totalHeaderLength ,const struct pcap_pkthdr* hdr ,TcpHeader* header
,void* user)=0;
37
38 virtual void UdpVirtualAction(const uint8_t* packetPointer ,unsigned
int* totalHeaderLength ,const struct pcap_pkthdr* hdr ,UdpHeader* header
,void* user)=0;
Page 70
Chapter 4. Implementation 57
39
40 virtual void IcmpVirtualAction(const uint8_t* packetPointer ,unsigned
int* totalHeaderLength ,const struct pcap_pkthdr* hdr ,IcmpHeader*
header ,void* user)=0;
41
42 virtual void EndOfDissectionVirtualAction(unsigned int*
totalHeaderLength ,const struct pcap_pkthdr* hdr ,void* user)=0;
43
44 };
45 #endif // Dissector_h
Figure 4.7: Dissector.h abstract class.
Dissector class defines the main method dissect to start the dissection process, and
all the protocol dissection methods are named dissectPROTOCOL NAME . These meth-
ods receive a pointer to the packet header data (packetPointer), the size counter
totalHeaderLength, the struct pcap pkthdr hdr and the void* user pointer.
The pointer user is passed between every method of the dissector, and can be used by the
virtual action methods. The name of the virtual action methods follow PROTOCOL NAME-
VirtualAction nomenclature.
In the framework two different Dissector-based classes are used; SizeDissector on one
hand, used by PacketBuffer class to calculate packet size and store protocol informa-
tion, and on the other PreAnalyzerDissector, that can be used for multiple purposes,
but currently is used to decode and dump network protocol information for debugging
purposes.
Future work
The future work that could be done over Dissector class is to add support for more
protocols from link, network, transport and application layers.
In addition the Dissector could also be extended to dinamically load shared objects at
runtime, and hence not having to recompile the framework-based applications to add
more protocols.
4.2.3 Network protocol headers
The network protocol files are placed in the directory Common/Protocols. All the net-
work protocols are modeled as a class inheriting from the abstract class VirtualHeader.
Page 71
Chapter 4. Implementation 58
VirtualHeader interface has a unique pure virtual method dump() that must be imple-
mented for dumping the network protocol decoding (debugging purposes).
The implementation of each protocol header file contains:
• Protocol header struct definition.
• Header class definition, containing a pointer to protocol header struct which is set
in the constructor of the class and the prototype for the dump() method. Class
may also define useful methods to obtain data from the header.
• MACROS for inserting and retrieving the network protocol information from the
headers t struct.
MACROs for inserting and retrieving the network protocol identification from headers t
are tools to simplify the task of storing and obtaining information from the dissection.
The information saved in the headers t struct is, on one hand a unique protocol iden-
tifier number in the proto field, and on the other the offset from the start of the packet
where that particular header is, in the offset field. This information is saved in one of
the seven positions of the arrays depending on the type of protocol header.
All the protocol must implement their own MACROs as a invoking the two general
MACROs contained in the VirtualHeader.h file:
1 /*...*/
2 #define INSERT_HEADER(headers , level , offseT ,protocol) do{ \
(headers)->proto[level] = protocol; \
(headers)->offset[level] = offseT; \
}while (0)
3
4 #define IS_HEADER_TYPE(headers , level ,protocol)\
(headers)->proto[level] == protocol
5 /*...*/
Figure 4.8: MACROs defined in VirtualHeader.h file to store and obtain information
from header t struct.
The current network protocols implemented are: Ethernet, IP4, IP6 2, TCP, UDP and
ICMP. Current implementation does not support protocol tunneling, although the sys-
tem is designed to support it.2Partially implemented; test-pending
Page 72
Chapter 4. Implementation 59
An example of the MACROs defined by the TCP protocol is shown below:
1 /*...*/
2 #define HEADER_TCP_HEXVALUE 0x0006
3
4 /* MACROS HEADERS */
5 #define TCP_HEADER_TYPENAME struct tcp_header
6
7 #define INSERT_HEADER_TCP(headers , level , offseT) INSERT_HEADER(headers ,
level , offseT ,HEADER_TCP_HEXVALUE)
8 #define IS_HEADER_TYPE_TCP(headers , level) IS_HEADER_TYPE(headers , level ,
HEADER_TCP_HEXVALUE)
9 /*...*/
Figure 4.9: MACROs extract from the TcpHeader.h file
Each protocol within the framework must define a unique ID, in this case 0x0006.
The protocols use INSERT HEADER and IS HEADER TYPE MACROs defining a MACRO
“wrapper” in which the ID is used to mask the usage of this ID to the user (actually
this MACROs are “rewrapped” to be more easy to use by the user in the Analysis
component).
Future work
Adding new protocols, and modifying the dissectors to support them are the main
improvements that could be done over this part of the source code.
4.3 PacketFeeder components
Following the schematic design presented in section 3.2.1 and in figure number 3.6,
and also according to the threading model exposed in section 4.1.2, the abstract class
PacketFeeder has been implemented as the following figure shows.
Page 73
Chapter 4. Implementation 60
1 #ifndef PacketFeeder_h
2 #define PacketFeeder_h
3
4 #include <pthread.h>
5
6 #include "../ Util.h"
7 #include "PacketBuffer.h"
8
9 class PacketFeeder {
10
11 public:
12 // Create a pthread and start buffering packets
13 virtual pthread_t* start(int limit)=0;
14
15 //Get a filled PacketBuffer
16 virtual PacketBuffer* getSniffedPacketBuffer(void)=0;
17
18 //Force to stop feeding and mark last PacketBuffer with flag "
flush" to true
19 virtual void flushAndExit(void)=0;
20
21 private:
22
23 };
24
25 #endif // PacketFeeder_h
26
27
Figure 4.10: PacketFeeder abstract class or interface.
The PacketFeeder interface consists of three pure virtual methods:
• start(int limit): the start() method creates a new pthread, as defined in
the threading model, and begins to buffer packets in one or more PacketBuffer
objects. The start() method returns a pointer to a pthread t variable, corre-
sponding to the new pthread created. The optional parameter limit indicates the
capturing limit in packet number.
• getSniffedPacketBuffer(): the method must be called by the analyzer thread
to retrieve a filled PacketBuffer object. The PacketBuffer pointer returned,
must point to a heap memory section but must not be freed by any other method
rather than PacketFeeder’s class methods. The current implementations of
Page 74
Chapter 4. Implementation 61
the abstract class block the calling thread, if no buffer is ready yet. An
asynchronous implementation of the PacketFeeder interface is proposed in the
future work section.
• flushAndExit(): the flushAndExit() method flushes immediately the current
buffer, and ends PacketFeeder pthread execution.
4.3.1 LivePacketFeeder
LivePacketFeeder class implements the PacketFeeder interface, offering methods to
sniff packets from network interfaces or cards in pseudo real-time.
The current implementation of the feeder does not unblock consumer thread (the thread
calling getSniffedPacketBuffer()) and therefore returning a valid pointer to a filled
PacketBuffer object, until the PacketBuffer is fully filled or when Analyzer calls asyn-
chronously flushAndExit() method.
The internal implementation of the class, contains an array of two PacketBuffer objects,
one that is currently being consumed by last consumer thread, and the one that is being
used to buffer the packets being captured (double buffer).
The implementation of this class can be found in the figure A.1 of the appendix A and
in the file PacketFeeders/LivePacketFeeder.cpp of the source code.
LivePacketFeeder constructor, LivePacketFeeder(const char* device), requires the
C string parameter device, indicating the system’s network interface name (Unix-style
name, like lo, eth0, eth1, wlan0...). A special network interface defined by Libpcap
library, any, can be used as device value to sniff from all the network interfaces on the
system.
Current implementation has been developed to achieve the maximum performance with
a unique consumer thread. Nevertheless, if in the future the framework requires mul-
tiple consumer threads to concurrently call getSniffedPacketBuffer() method, the
class could be easily improved by increasing the number of PacketBuffer objects in
packetBufferArray variable to the maximum number of concurrent consumer threads.
Future work
A feature that has not been implemented, and could be considered as future work
over this class is timeout buffer dispatching. This could be done, by using libpcap
pcap loop() or pcap dispatch() packet number capturing limit and a timer.
Page 75
Chapter 4. Implementation 62
Another feature that could be easily implemented in both LivePacketFeeder and
OfflinePacketFeeder and would be of great interest is the capturing filters based on
libpcap filters.
4.3.2 OfflinePacketFeeder
OfflinePacketFeeder class implements the PacketFeeder interface, offering methods
to obtain packets from a capture file. The capture file must have the same format as
those used by tcpdump and tcpslice. A capture file can be saved, for instance, using
tcpdump tool with the following command (sniffing eth0 network interface):
LenovoT400 :~ # tcpdump -i eth0 -w captureFile.tcpdump
Figure 4.11: Example: obtaining a capture file (captureFile.tcpdump) with tcpdump
program.
The current implementation of the OfflinePacketFeeder, is similar to the LivePacketFeeder
one, as the main difference between them is that OfflinePacketFeeder implementation
uses pcap open offline() libpcap function while LivePacketFeeder uses pcap open live().
Additionally, a special mechanism to finish the execution of the feeder is implemented,
when all the packets from the capture file have been read. The source code of the class
definition is shown in the figure A.2 of the appendix A and the implementation can be
found in the file PacketFeeders/OfflinePacketFeeder.cpp
In the same way as LivePacketFeeder does, OfflinePacketFeeder does not unblock con-
sumer thread (the thread calling getSniffedPacketBuffer()), until the PacketBuffer
is fully filled or when the file capture has no packets left to read.
The implementation of the class also contains the array of two PacketBuffer objects.
The implementation of the methods of the header file, can be found in the file Packet-
Feeders/OfflinePacketFeeder.cpp.
OfflinePacketFeeder defines a parametric constructor OfflinePacketFeeder(const char*
file), where the C style string file is the path to the source capture file.
Due to the similarity between LivePacketFeeder and OfflinePacketFeeder implementa-
tion, this PacketFeeder interface implementation shares the same performance limitation
with LivePacketFeeder. If the framework is ever modified to allow multiple consumer
Page 76
Chapter 4. Implementation 63
threads to call concurrently getSniffedPacketBuffer() method, the current imple-
mentation will underperform. The solution in this case should be the same as the
solution outlined in section 4.3.1.
4.4 PreAnalyzer component
The PreAnalyzer component has been implemented in the PreAnalyzer class containing
a main entry method preAnalyze(PacketBuffer* bufferPointer). The code of this
method can be modified to fulfill debugging needs. PreAnalyzer has also a private object
that inherits from Dissector, PreAnalyzerDissector, which implements pure virtual
Action functions of the dissector, and can also be used to obtain information from
packets in the buffer. The PreAnalyzer objects have to be created and called from the
Analyzer code, in order to be used.
The files are all implemented in the PreAnalyzer/ directory.
4.5 Analyzer component
The Analyzer component has been developed based on the description of section 3.2.3.
The Analyzer class has been defined with static methods and attributes solely, and hence
is a “static class”. An extract of the code of files Analyzer/Analyzer.h and Analyzer/-
Analyzer.cpp is presented in figures A.3 and A.4 of the appendix A.
The Analyzer class offers to the framework-user programmer three methods:
• Analyzer::addFeederToPool(PacketFeeder* feeder,int limit)
• Analyzer::addAnalysisToPool(void (*func)(PacketBuffer* packetBuffer,
packet t* GPU buffer))
• Analyzer::start(void)
The first two methods must be executed before Analyzer::start() is called.
As its names suggests, Analyzer::addFeederToPool method adds a feeder to the feeders
pool, to later retrieve buffers from it. The optional parameter limit should be used in
the future to implement a limit in the number of packets to capture, but is currently
not implemented.
Page 77
Chapter 4. Implementation 64
In the other hand, users are able to add analysis to the Analyzer analysis pool by using
the static method Analyzer::addAnalysisToPool(...). The implementation of the
method Analyzer::addAnalysisToPool(...) requires a function pointer instead of a
pointer to an analysis abstract class object (interface). This is implemented this way
because analysis classes have been developed as static classes3, and as C++ virtual func-
tions and pure virtual functions cannot be declared as static, the addAnalysisToPool,
cannot be implemented by getting a pointer from an abstract class, which might be a
more natural way to implement it (like addFeederToPool implementation does).
Nevertheless, as all the analysis are implemented defining the same entry method, the
static method ANALAYSIS NAME::launchAnalysis, adding new analysis to the pool by
the framework users is quite natural and simple too. Syntax for adding new analysis is
as follows:
Analyzer::addAnalysisToPool(ANALYSIS NAME::launchAnalysis);
The buffer retrieving policy implementation is the one described in section 3.2.3, and
is implemented in the Analyzer::start() method. It should be remarked that if new
retrieving policies may be implemented, buffer obtaining should be encapsulated in one
or more private methods of the same Analyzer class, for better code organization.
Buffers are distributed across all the analysis contained in the pool. According to the
threading model, as all the analysis run in the same thread as the Analyzer, the distri-
bution of the buffers to the analysis is sequential, so analysis are performed sequentially.
The Analyzer has also the task to load and unload the PacketBuffer buffer from the
GPU memory space. All the analysis contained in the pool will receive, in addition to
the PacketBuffer object, the GPU buffer pointer that is going to be used by CUDA
kernels.
Finally Analyzer::start() is the method that start the analysis process. Before calling
the start() method, the framework-based program should have introduced at least one
feeder and one analysis to the pool. This method only returns when program execution
is terminated by a SIGTERM signal or if there are no more packets to obtain in the
case of a program containing OfflinePacketFeeders.3The decision of implementing analysis with static methods is further described in section 4.6.
Page 78
Chapter 4. Implementation 65
Known limitations
The framework gives to the framework-user the chance to define windowed analysis. The
user is able to program analysis that accumulate several PacketBuffer objects before
the analysis routine is actually performed.
There is a known limitation of the current implementation of Analyzer related to the win-
dowed analysis implementation. When multi-feeding feature is used, windowed analysis
cannot assume time-coherence of captured packets (in other words, that all the packets
are in timestamp order), as it can indeed be assumed by analysis from a single feeder
program. The current window buffering policy of analysis is to place new packets at the
end of the window buffer (in the GPU), as later explained in section 4.6.2.
Some of the modules developed, listed in section 4.7, currently assume this time-coherence
property of buffers and window buffers, and therefore the usage of multi-feeding pro-
grams in conjunction with these modules, or any other analysis that might be defined,
may lead to erroneous results. The current framework implementation sets macro
ANALYZER MAX FEEDERS POOL SIZE to the value of one, to prevent the creation of multi-
feeding framework-based programs.
Several strategies could be used to work around time-coherence limitation:
• Change current implementation, from GPU memory buffering to host buffering,
and sort buffer before throwing analysis.
• Maintain current implementation, and therefore sort the buffer inside the GPU,
prior to the analysis routine. Due to the current implementations of sorting algo-
rithms, and the fact that fast sorting algorithms are generally difficult to program
in stream processing, among other limitations4, this might be less efficient than
the above mentioned.
Future work
The future work that could be carried out over the Analyzer component is:
• Solving the time-coherence limitation previously described with the techniques
outlined before.4Current sorting algorithms support only reduced types, 32 bit types in general.
Page 79
Chapter 4. Implementation 66
• Implementation and performance evaluation of an event-oriented buffer re-
trieving policy. This implementation would require an asynchronous communi-
cation system between feeders and Analyzer (avoiding inefficient polling synchro-
nization).
• Implementation and performance evaluation of selective buffer distribution
to analysis policy to allow users to only send buffers with particular properties
to a group of Analysis; i.e. send all the buffers obtained from a certain network
interface, to a subset of analysis.
• Interactive feeder/analysis control: enable, disable, add and delete actions.
This would offer users the ability to disable and enable, and add or delete from the
pool feeder and/or analysis at runtime, without having to stop framework-based
program execution, recompile and re-execute. This would require the implemen-
tation of a text-based, graphical or both text-based and graphical user interface
(UI) and an asynchronous communication system with the Analyzer.
4.6 Analysis components
The Analysis component has been developed under the directives described in sec-
tion 3.2.4. The generic execution of an analysis had been divided into five differ-
ent generic sections or routines; mining(), preAnalysisFiltering(), analysis(),
postAnalysisOperations() and hooks(). The first four methods had to be executed
inside the GPU and hence being CUDA, functions while hooks() method had to be
executed in the CPU.
The appropriate way to design and implement analysis in C++ language would have
been to define an abstract class Analysis as presented in figure 3.11 of section 3.2.4. All
the analysis created by the framework-users therefore, would have defined classes derived
from Analysis, implementing the abstract methods mining(), preAnalysisFiltering(),
analysis(), postAnalysisOperations() and hooks() defined by the interface, to ful-
fill their needs.
However several CUDA architecture and CUDA library limitations have been found,
which had forced to fully redesign and change implementation of the Analysis component
from its foundations. A brief summary of the current limitations that have been found,
regarding CUDA 2.35 version and CUDA enabled GPU architecture are:
• CUDA 2.3 does not support C++ classes.5The limitations also apply to versions 2.1 and 2.2 of CUDA.
Page 80
Chapter 4. Implementation 67
• CUDA 2.3 does not allow kernels to be called from non-static methods or C++
class methods.
• CUDA 2.3 does not support function pointers, and hence although C++ classes
would have been supported by CUDA, abstract methods could not have been used
(polymorphism). This is more of a hardware limitation rather than a software
limitation, and it is possible that next generations of CUDA compatible NVIDIA
graphic processors support function pointers.
• CUDA 2.3 does not support dynamic memory allocation from inside kernel func-
tions. Currently memory has to be allocated and freed from the CPU code, using
the API calls.
Therefore, the challenge has been to create library component capable of building new
analysis in the most user-friendly way, based on the structure outlined in section 3.2.4,
overcoming the limitations exposed. The component must still support the rest of anal-
ysis features described.
It is possible that future versions of the CUDA library and CUDA-enabled graphic cards
overcome some (or all) of the limitations described before.
4.6.1 Analysis basic implementation.
Problem definition: CUDA 2.3 does not support C++ classes nor func-
tion pointers (and therefore any form of inheritance and polymorphism).
Adopted solution: To overcome CUDA class support limitation and function
pointer limitation, the strategy followed has been to create a pseudo-polymorphism
using a more primary tool; the preprocessor (in particular, the GNU/cpp pre-
processor).
The Analysis components have been defined as static classes, all with the same struc-
ture, similar to the basic structure outlined in section 3.2.4. Instead of using C++
class inheritance and polymorphism, the task of preserving the same structure for every
analysis defined in the framework is done by the preprocessor. The reason why analysis
classes have been defined as static is merely to simplify its usage by the users.
All the analysis define a class with a static method launchAnalysis(...). The class
name must be defined by the user with the ANALYSIS NAME MACRO, and this class does
inherit from AnalysisSkeleton class, a completely blank class, just to remark that
Page 81
Chapter 4. Implementation 68
all the analysis have the same structure. Figure 4.12 shows the definition of the class
ANALYSIS NAME contained in AnalysisPrototype.h file.
1 /* Include skeleton */
2 #include "AnalysisSkeleton.h"
3
4 /* ... */
5
6 class ANALYSIS_NAME:public AnalysisSkeleton{
7
8 public:
9 static void launchAnalysis(PacketBuffer* packetBuffer , packet_t*
GPU_buffer);
10 static QueryManager queryManager;
11 private:
12
13 };
14
15
16 #ifdef __CUDACC__ /* Don’t erase this */
17
18 /*...*/
19
20 /* Launch analysis method */
21 void ANALYSIS_NAME :: launchAnalysis(PacketBuffer* packetBuffer , packet_t*
GPU_buffer){
22
23 // Launch Analysis (wrapper from C++ to C)
24 COMPOUND_NAME(ANALYSIS_NAME ,launchAnalysis_wrapper)<
ANALYSIS_INPUT_TYPE ,ANALYSIS_OUTPUT_TYPE >( packetBuffer , GPU_buffer);
25
26 }
27 #endif // ifdef CUDACC
Figure 4.12: Extract of AnalysisPrototype.h
The figure 4.12 shows the usage of the COMPOUND NAME(a,b) function-like MACRO in
the launchAnalysis(...) method.
In the whole analysis implementation, the MACRO COMPOUND NAME(a,b) has been
used to create unique identifiers, using the cpp concatenation preprocessor operator
##. The purpose of using this MACRO is dual; on one side unique identifiers across
all the framework-based program can be created using a fixed part and a variable part
Page 82
Chapter 4. Implementation 69
(ANALYSIS NAME), and on the other a pseudo-polymorphism can be implemented by
using it.
The methods defined within analysis abstract class in the figure 3.11, mining(...),
preAnalysisFiltering(...), analysis(...), postAnalysisOperations(...) and
hooks(...), have been redefined using the MACRO COMPOUND NAME(a,b) to follow the
same structure of every analysis and implement a pseudo-polymorphism. These methods
will be the ones that the framework-user will implement.
The figure 4.13 shows the definition of these methods. The decision of using template
meta-programming techniques is discussed later.
1 /* ... */
2 /**** Forward declaration prototypes ****/
3
4 template <typename T,typename R>
5 __global__ void COMPOUND_NAME(ANALYSIS_NAME ,KernelAnalysis)(packet_t*
GPU_buffer , T* GPU_data , R* GPU_results ,analysisState_t state);
6
7 template <typename T,typename R>
8 __device__ void COMPOUND_NAME(ANALYSIS_NAME ,miningImplementation)(
packet_t* GPU_buffer , T* GPU_data , R* GPU_results , analysisState_t
state);
9
10 template <typename T,typename R>
11 __device__ void COMPOUND_NAME(ANALYSIS_NAME ,
preAnalyisFilteringImplementation)(packet_t* GPU_buffer , T* GPU_data ,
R* GPU_results , analysisState_t state);
12
13 template <typename T,typename R>
14 __device__ void COMPOUND_NAME(ANALYSIS_NAME ,
AnalysisRoutineImplementation)(packet_t* GPU_buffer , T* GPU_data , R*
GPU_results ,analysisState_t state);
15
16 template <typename T,typename R>
17 __device__ void COMPOUND_NAME(ANALYSIS_NAME ,
postAnalysisOperationsImplementation)(packet_t* GPU_buffer , T*
GPU_data , R* GPU_results ,analysisState_t state);
18
19 template <typename R>
20 void COMPOUND_NAME(ANALYSIS_NAME ,resultsHook)(PacketBuffer *packetBuffer ,
R* results , analysisState_t state , int64_t* auxBlocks);
21
22 /* ... */
Page 83
Chapter 4. Implementation 70
Figure 4.13: Implementation of methods contained in an analysis (redefinition). Ex-
tracted from AnalysisSkeleton.h
As the preprocessor needs to know the value of the ANALYSIS NAME MACRO during
macro-expansion time, the definition of this MACRO and others, like input and output
type definition or windowing parameters must be defined prior to the usage of them,
basically by AnalysisSkeleton.h and AnalysisPrototype.h files. Due to this fact all the
analysis, as separate preprocessor units, need to comply with the following order of
MACRO definition and file inclusion:
1. Analysis name (ANALYSIS NAME), input and output type (ANALYSIS INPUT TYPE
and ANALYSIS OUTPUT TYPE), windowing parameters ... cpp MACRO definitions.
2. Inclusion of the AnalysisPrototype.h file to define launching functions. The inclu-
sion of this file in this point also allows programmers to use the Basic MACROs
(4.6.6) and Modules (4.6.5).
3. Include the code of the analysis user functions implementation:
• COMPOUND NAME(ANALYSIS NAME,miningImplementation)
• COMPOUND NAME(ANALYSIS NAME,preAnalysisFilteringImplementation)
• COMPOUND NAME(ANALYSIS NAME,AnalysisRoutineImplementation)
• COMPOUND NAME(ANALYSIS NAME,postAnalysisOperationsImplementation)
• COMPOUND NAME(ANALYSIS NAME,resultsHook)
Problem definition: CUDA 2.3 does not support kernel calling from
within class methods.
Adopted solution: To work around this problem, a wrapper function has been
created. The wrapper COMPOUND NAME(ANALYSIS NAME,launchAnalysis wrapper)
is defined as a C function, containing the code for launching CUDA kernel of the
analysis and the hook() function. A different launchAnalysis wrapper C func-
tion must be defined for every single analysis in the framework-based program, and
to achieve it, COMPOUND NAME(ANALYSIS NAME,launchAnalysis wrapper) MACRO
has been used to create unique identifiers for all this wrapper functions.
Page 84
Chapter 4. Implementation 71
Problem definition: CUDA 2.3 does not support dynamic memory allo-
cation inside CUDA kernels. The framework-user must be able to define
the types of the analysis. Each analysis routine, formerly defined as the func-
tion COMPOUND NAME(ANALYSIS NAME,AnalysisRoutineImplementation), is im-
plemented according to the section 3.2.4 with an input array and an output array
type to place the results. Analysis components must allow users to define analysis
with user-defined input/output types. At the same time, the framework should
allocate and free GPU memory for the GPU data (input array) and GPU results
(output array) arrays.
Adopted solution: To be able to handle analysis with user-defined types, C++
template meta-programming techinques have been used. All the functions,
from which an analysis is made up, are defined as templatized functions with two
types; typename T as the input type and typename R as the output type of the
analysis.
The types are defined by the user by defining the MACROS ANALYSIS INPUT TYPE
and ANALYSIS OUTPUT TYPE. In addition, if output type is not defined, input type
is assumed as the output type.
The wrapper COMPOUND NAME(ANALYSIS NAME,launchAnalysis wrapper) is the first
function which is called templatized. All the functions in the analysis, including global
and device CUDA functions as well as hooks() function are called using the tem-
plate arguments T and R.
As described in section 3.2.4, the structure of the thread blocks and the grid in all
the analysis is linear, only using the x dimension in both block and grid size. The
framework implementation allows to the programmer to define the size of the block in
threads per block that is going to be used in this particular analysis, by defining the
MACRO ANALYSIS TPB. The total number of threads is defined as the total number of
threads contained in the buffer6, and therefore is fixed.
4.6.2 Windowed analysis.
One of the features implemented in the framework is the support of so-called windowed
analysis. The idea behind windowed analysis is to store a set of packets before the
analysis takes place.6If the analysis is not windowed
Page 85
Chapter 4. Implementation 72
The implementation of windowed analysis in the framework allows the user to define
two types of window, in accordance with what is exposed in section 2.2.2:
• Packet windowing. Accumulates Npackets before analysis takes place.
• Time windowing. Waits tinterval seconds before analysis takes place, accumulating
an undefined number of packets.
The default behaviour of the framework is to create non-windowed analysis. If windowed
analysis feature wants to be used in a particular analysis, three MACROs have to be
defined by the user:
• HAS WINDOW with the value of 1
• WINDOW TYPE defining window type. The value of this MACRO depends on the
type of window aimed to use:
– For packet windowing, the value of WINDOW TYPE must be PACKET WINDOW.
Then the MACRO WINDOW LIMIT must be defined with an integer value cor-
responding to the number of packets that will be accumulated.
– For time windowing, the value of WINDOW TYPE must be TIME WINDOW. Then
the MACRO WINDOW LIMIT must be defined with an integer value correspond-
ing to the number of seconds of the tinterval.
The current implementation of windowing system stores the packets in the GPU. Instead
of accumulate packets in a large buffer in the CPU, and finally execute the analysis over
the large array (previously loading it to the GPU memory space), the packets are being
accumulated in the GPU array GPU data.
Mining and prefiltering operations are always performed over the current data contained
in the GPU (actually with the new data that is being inserted), while the rest of functions
can be conditionally run depending on the programmer requirements. This can be
achieved by conditionally execute code based on a special flag contained in the state
variable (state.windowState.hasReachedWindowLimit).
The state variable, as its name suggests, defines the state of the current analysis. The
state variable is of analysisState t type, and defines among other parameters, the
state of the window in the windowState t variable state.windowState.
To implement time windowing, the size of GPU data array is calculated in compilation
time. In the case of time windowing, as the size of the array is unknown, the size is
being adapted depending of the needs.
Page 86
Chapter 4. Implementation 73
Problem definition: CUDA has a limitation on the total number of
threads and the number of blocks per grid dimension; currently up to
65536 threads and 512 blocks per grid dimension are supported.
Adopted solution: The solution adopted to work around this problem has been
to reuse threads. Threads execute code for his own block, and if the window
exceeds CUDA limitations, threads must also execute code for the blocks in posi-
tions multiple of his position, in terms of the current number of real thread blocks
thrown. Figure 4.14 shows graphically the reuse of threads.
Figure 4.14: Analysis thread reusage.
For example, if 30 blocks of threads are thrown (thread blocks 0 to 29), and the
window is of 60 blocks, block 0 will execute code for the 0th and 30th block.
This forces the implementation to contain in the state.windowState variable, the num-
ber of real thread blocks executing in the GPU, and the window size in thread blocks.
The variable state.blockIterator, is used to point to the current block in execution.
The framework code as well as the user code, except for the mining and filtering functions
(already implemented), must implement the following loop to support large windows,
specially regarding time windows, where size is not known:
1 state.blockIterator = blockIdx.x;
2 while(state.blockIterator < state.windowState.totalNumberOfBlocks){
3
4 /* Do something */
5
6 state.blockIterator += gridDim.x;
7 SYNCTHREADS ();
8 }
Page 87
Chapter 4. Implementation 74
Figure 4.15: Required loop to support large windows.
4.6.3 Global barriers.
CUDA 2.3 provides block barriers with the API call syncthreads() inside kernels,
which synchronize all the threads within the block. Nevertheless, CUDA does not pro-
vide to the programmers a global barrier for all the threads in a kernel, or in other
words, a inter-block barrier, from inside the kernel.
Most algorithms require, in a point of the execution, to synchronize all the threads of
the kernel function, and for this reason the framework must allow the programmers to
call global barriers in a simple way.
There are currently two ways to implement global barriers in CUDA:
• GPU global memory barrier implementations. Current implementations
define a barrier using global memory. These barrier implementations do not work
in some GPUs (dead lock), while in the rest their performance is poor compared
to the other alternative.
• Finishing the current kernel execution, call the CUDA API function
cudaThreadSynchronize(), and start a new kernel with the rest of the
code. This way to implement barriers certainly synchronizes all the threads of the
kernel, and currently is the one achieving the highest performance. The drawback
is that new kernels have to be coded, splitting the code in several kernels, having
to define a new kernels call and cudaThreadSynchronize() for each of them, and
hence this solution presents a low scalability. In addition the automatic variables
and shared variables within the function must also be redefined and its value
reassigned.
From the user point of view, the global barrier synchronization should be as easy as
calling syncthreads() API function, from within the current kernel execution, without
having to care about how the kernels are called and, at the same time, achieving the
maximum performance.
Problem definition: CUDA does not provide global barriers (inter-block
barriers) API calls from inside the kernels. In addition current ways to
implement barriers are either not fully compatible with all the GPUs or
difficult to implement from the framework programmer point of view.
Page 88
Chapter 4. Implementation 75
Solution may define a syncblocks() function to provide kernel thread synchro-
nization.
Global barriers issue has possibly been the biggest challenge of the whole framework
implementation.
Adopted solution: The solution needed to be fully compatible with all the GPUs
out in the market. The only way to achieve it had been creating as many kernels
as needed and calling the cudaThreadSynchronize() API function before every
new kernel is called.
The users are able to create global barriers by calling the MACRO SYNCBLOCKS()
only. To achieve this level of abstraction, the framework uses a combination of
the preprocessor (cpp) tool and a pre-compiling parser called the PrePrePro-
cessor (ppp).
The implementation of the kernel launching system defines two types of global barri-
ers, the user SYNCBLOCKS() and the X-MACRO #include "PrecodedSyncblocks.def"
used mainly in the modules. However both barriers use the same underlying system.
The SYNCBLOCKS() MACRO ends the current function and kernel execution, printing
the } symbol, and then starting a new device function. To define the new function,
the MACRO COMPOUND NAME is used to create unique identifiers for each function name,
combining the analysis name, a fixed part and a counter that is incremented every time
the SYNCBLOCKS() MACRO is called. In this case, the counter is implemented using
the recently added functionality in GCC preprocessor7 COUNTER , that is an integer
counter that is incremented every time it is macro-expanded8.
The framework later defines the global function or kernel, in which the device
function mentioned before is called. The framework also manages how to call them, by
adding the code in the launchAnalysis function.
The figures 4.16 and 4.18, show a simple example on how the SYNCBLOCKS() MACRO
can be used, and how the framework manages the creation of the appropriate functions.
1 template <typename T,typename R>
2 __device__ void COMPOUND_NAME(ANALYSIS_NAME ,
AnalysisRoutineImplementation)(packet_t* GPU_buffer , T* GPU_data , R*
GPU_results ,analysisState_t state){
7GCC 4.3 and above8The module global barrier uses a preprocessor counter instead
Page 89
Chapter 4. Implementation 76
3
4 /* Some code */
5 SYNCBLOCKS ();
6 /* Some more code. Blocks are synchronized.*/
7 /* shared and automatic variables must be redefined and reassigned */
8 }
Figure 4.16: Simplified example of the usage of SYNCBLOCKS() MACRO.
1 #define SYNCBLOCKS () } \
template <typename T,typename R>\
__device__ __inline__ void COMPOUND_NAME(COMPOUND_NAME(ANALYSIS_NAME ,
AnalysisExtraRoutine),__COUNTER__)(packet_t* GPU_buffer , T* GPU_data ,R
* GPU_results , analysisState_t state){\
do{}while (0)
Figure 4.17: SYNCBLOCKS() MACRO definition.Extracted from Analysis/Libs/G-
pu/Macros/General.h
1 template <typename T,typename R>
2 __device__ void COMPOUND_NAME(ANALYSIS_NAME ,
AnalysisRoutineImplementation)(packet_t* GPU_buffer , T* GPU_data , R*
GPU_results ,analysisState_t state){
3
4 /* Some code */
5 }
6 __device__ __inline__ void ANALYSIS_NAME_AnalysisExtraRoutine_0(
packet_t* GPU_buffer , T* GPU_data ,R* GPU_results , analysisState_t
state){
7 /* Some more code. Blocks are synchronized */
8 /* shared and automatic variables must be redefined and reassigned */
9 }
Figure 4.18: Macro-expansion of the simplified example of the figure 4.16
The wrapper launchAnalysis, is configured to launch the new kernel after the previous
one, in this case when the original has finished his execution. The figures 4.19 and
4.22 show a simplified example before and after macro-expansion takes place in the
AnalysisSkeleton.h file.
Page 90
Chapter 4. Implementation 77
1 #ifdef __CUDACC__
2 //User kernels
3 #define ITERATOR__ 0
4 #include "UserExtraKernel.def"
5
6 #define ITERATOR__ 1
7 #include "UserExtraKernel.def"
8 /* ... */
9
10 // default Kernel
11 template <typename T,typename R>
12 __global__ void COMPOUND_NAME(ANALYSIS_NAME ,KernelAnalysis)(packet_t*
GPU_buffer , T* GPU_data , R* GPU_results , analysisState_t state){
13 state.blockIterator = blockIdx.x;
14 COMPOUND_NAME(ANALYSIS_NAME ,miningImplementation)(GPU_buffer , GPU_data
, GPU_results , state);
15 __syncthreads ();
16
17 state.blockIterator = blockIdx.x;
18 COMPOUND_NAME(ANALYSIS_NAME ,preAnalyisFilteringImplementation)(
GPU_buffer , GPU_data , GPU_results , state);
19 __syncthreads ();
20
21 /* Analysis implementation */
22 COMPOUND_NAME(ANALYSIS_NAME ,AnalysisRoutineImplementation)(GPU_buffer ,
GPU_data , GPU_results , state);
23 __syncthreads ();
24
25 /* If there are SYNCBLOCKS barriers do not put Operations function
call here */
26 #if __SYNCBLOCKS_COUNTER == 0 && __SYNCBLOCKS_PRECODED_COUNTER == 0
27 COMPOUND_NAME(ANALYSIS_NAME ,postAnalysisOperationsImplementation)(
GPU_buffer , GPU_data , GPU_results , state);
28 #endif
29
30 }
31
32 /**** Launch wrapper ****/
33 // default Launch Wrapper for Analysis not using Windows
34
35 template <typename T,typename R>
36 void COMPOUND_NAME(ANALYSIS_NAME ,launchAnalysis_wrapper)(PacketBuffer*
packetBuffer , packet_t* GPU_buffer){
37
38 /* ... */
39
40 /*** KERNEL CALL ***/
Page 91
Chapter 4. Implementation 78
41 COMPOUND_NAME(ANALYSIS_NAME ,KernelAnalysis)<<<grid ,block >>>(GPU_buffer
,GPU_data ,GPU_results ,state);
42 cudaAssert(cudaThreadSynchronize ());
43
44 /* EXTRA KERNEL CALLS */
45 /* ... */
46
47 /* Userdefined Extra Kernels calls */
48 #define ITERATOR__ 0
49 #include "UserExtraKernelCall.def"
50
51 #define ITERATOR__ 1
52 #include "UserExtraKernelCall.def"
53
54 /* ... */
55
56 /*** END OF EXTRA KERNEL CALLS ***/
57 /*** Copy results & auxBlocks arrays ***/
58
59 /* ... */
60
61 /*** LAUNCH HOOK (Host function) ***/
62 COMPOUND_NAME(ANALYSIS_NAME ,resultsHook)(packetBuffer , results , state ,
auxBlocks);
63
64 }
65
66 #endif // __CUDACC__
Figure 4.19: Simplified code for the launchAnalysis wrapper before macro-expansion
1 #if ITERATOR__ < __SYNCBLOCKS_COUNTER
2
3 // Extra kernel __device__ function prototype
4 template <typename T,typename R>
5 __device__ void COMPOUND_NAME(COMPOUND_NAME(ANALYSIS_NAME ,
AnalysisExtraRoutine),ITERATOR__)(packet_t* GPU_buffer ,T* GPU_data ,R*
GPU_results , analysisState_t state);
6
7 // Define extraKernel __global__ function
8 template <typename T,typename R>
9 __global__ void COMPOUND_NAME(COMPOUND_NAME(ANALYSIS_NAME ,
KernelAnalysis),ITERATOR__)(packet_t* GPU_buffer , T* GPU_data , R*
GPU_results , analysisState_t state){
10
11
Page 92
Chapter 4. Implementation 79
12 COMPOUND_NAME(COMPOUND_NAME(ANALYSIS_NAME ,AnalysisExtraRoutine),
ITERATOR__)(GPU_buffer , GPU_data , GPU_results ,state);
13 __syncthreads ();
14
15 }
16 #endif
17 #undef ITERATOR__
Figure 4.20: X-MACRO defined in the UserExtraKernel.def
1 #if ITERATOR__ < __SYNCBLOCKS_COUNTER
2 // Throwing Extra kernel ITERATOR__
3 COMPOUND_NAME(COMPOUND_NAME(ANALYSIS_NAME ,KernelAnalysis),ITERATOR__)
<<<grid ,block >>>(GPU_buffer ,GPU_data ,GPU_results ,state);
4 cudaAssert(cudaThreadSynchronize ());
5
6 #endif
7
8 #undef ITERATOR__
Figure 4.21: X-MACRO defined in the UserExtraKernelCall.def
1 #ifdef __CUDACC__
2 //User kernels
3 template <typename T,typename R>
4 __device__ void ANALYSIS_NAME_AnalysisExtraRoutine_0(packet_t*
GPU_buffer ,T* GPU_data ,R* GPU_results , analysisState_t state);
5
6 template <typename T,typename R>
7 __global__ void ANALYSIS_NAME_KernelAnalysis_0(packet_t* GPU_buffer , T*
GPU_data , R* GPU_results , analysisState_t state){
8 ANALYSIS_NAME_AnalysisExtraRoutine_0(GPU_buffer , GPU_data , GPU_results
,state);
9 __syncthreads ();
10 }
11
12 // default Kernel
13
14 /*...*/
15
16 /**** Launch wrapper ****/
17 // default Launch Wrapper for Analysis not using Windows
18
Page 93
Chapter 4. Implementation 80
19 template <typename T,typename R>
20 void COMPOUND_NAME(ANALYSIS_NAME ,launchAnalysis_wrapper)(PacketBuffer*
packetBuffer , packet_t* GPU_buffer){
21
22 /* ... */
23 /*** KERNEL CALL ***/
24 COMPOUND_NAME(ANALYSIS_NAME ,KernelAnalysis)<<<grid ,block >>>(GPU_buffer
,GPU_data ,GPU_results ,state);
25 cudaAssert(cudaThreadSynchronize ());
26
27 /* EXTRA KERNEL CALLS */
28 /* ... */
29 /* Userdefined Extra Kernels calls */
30 ANALYSIS_NAME_KernelAnalysis_0 <<< grid , block >>>(GPU_buffer ,
GPU_data , GPU_results , state) ;
31 cudaAssert (cudaThreadSynchronize ()) ;
32
33 /*** Copy results & auxBlocks arrays ***/
34 /* ... */
35
36 /*** LAUNCH HOOK (Host function) ***/
37 COMPOUND_NAME(ANALYSIS_NAME ,resultsHook)(packetBuffer , results , state ,
auxBlocks);
38
39 }
40
41 #endif // __CUDACC__
Figure 4.22: Macro-expansion of the code listed in figure 4.19
As can be seen in the definition of the X-MACROS, the preprocessor expands code
conditionally based on the value of the preprocessor MACRO SYNCBLOCKS COUNTER,
which contains the number of the extra kernels that must be created by the framework
for this particular analysis. Because of the limitations of the GNU cpp preprocessor, the
value of this MACRO must be calculated (set) before the cpp macro-expansion of the
code takes place.
The only way to do it has been to develop a pre-compilation parser, called PrePrePro-
cessor, that among other functions, has the task to count the number of SYNCBLOCKS()
calls that the user has placed in the source code. The PrePreProcessor, is a set of bash
scripts using several GNU shell commands, such as cat, grep, find, sort or awk.
As the PrePreProcessor must be executed by every single analysis, the compilation of
each analysis has to be made separately, creating an object for each analysis (.o file).
Page 94
Chapter 4. Implementation 81
In every single analysis a .syncblocks counters.ppph9 local file (in the same directory of
the analysis) is created setting the barrier counters. This file is later included by the
AnalysisSkeleton.h file.
Known limitations.
The current implementation, although certainly fulfill the requirements in terms of sim-
plicity for the framework-user, and offers and scalable solution to the global barrier issue,
presents a number of limitations:
• Analysis must be placed in separated directories and Analysis must be
compiled separately, as the file syncblocks counters.ppph is a local file included
as #include ".syncblocks counters.ppph".
• The code must be pre-parsed. The code must be pre-parsed, and so compila-
tion time is incremented.
• The PrePreProcessor is slow. As the PrePreProcessor is developed with shell
scripting, the execution is slow compared to other scripting languages.
• Automatic and shared variables must be redeclared and reassigned
after a global barrier call, as it is indeed a new function. This limitation could
only be overcome if a global barrier in the GPU could be implemented.
Future work.
The future work that could be carried out over the kernel launching system could be on
one side, improve the PrePreProcessor, by coding it using more advanced interpreted
scripting languages like Perl or Python. Another option would be to use a source-to-
source compiler, in which case the compilation time would also be reduced and which
would offer much more complex parsing capabilites.
On the other side, the efforts could be centered in adding more intelligence into the
kernel launching system, not launching kernels that are known to be blank in certain
calls, like when windows are used and no actions are done before the window limit has
been reached (introducing conditional code).9The extension .ppph is used to remark that the files are a product of the PrePreProcessor (ppp)
Page 95
Chapter 4. Implementation 82
4.6.4 Template files.
During the development of the framework, where the structure of the analysis had been
progressively modified and adapted to a heavily preprocessor-based structure, it was
clear that the creation of new analysis was getting more and more complicated.
In order to avoid that the user would have to deal with the current complex function
names (COMPUND NAME(a,b) MACRO based names), and to assure that the user would
follow the required order of file inclusions and, at the same time, assure that the user
would compile the analysis source code separately and having executed PrePreProcessor
before (ppp), the framework defines the template files.
The template files are three files listed below
• BlankAnalysisTemplate.h. Containing all the MACROs defined by the frame-
work, like ANALYSIS NAME for instance. After that the inclusion of the Analysis-
Prototype.h file is performed.
1 // --> Do not delete/edit this line
2 #include <netgpu/Initializer.h>
3
4 /* ANALYSIS TEMPLATE HEADER FILE.
5 Fill at least uncommented LINES with appropiate values
6 !! Read documentation for more info */
7
8 /* ******** Edit this section ********* */
9
10 // [[ GENERAL PARAMETERS ]]
11 // --> Analysis Name: unique name here for all the program
12 #define ANALYSIS_NAME change_me
13 // --> int ,uint ,floats , double (*) intXX_t , uintXX_t , structs
etc.. or typedefs (define new types below)
14 #define ANALYSIS_INPUT_TYPE type
15 // --> Threads Per Block (unidimensional): [8-512], default 128
16 #define ANALYSIS_TPB 128
17
18 /*** DEFINE COMPLEX TYPES HERE ***/
19 // typedef struct{
20 // int x,y,z;
21 //}mytype;
22
23 /*** DEFINE HERE WINDOW PARAMS ***/
24 // --> HAS_WINDOW: value of 1 to enable
25 //#define HAS_WINDOW 0
Page 96
Chapter 4. Implementation 83
26 // --> WINDOW_TYPE
27 //#define WINDOW_TYPE TYPE
28 // --> HAS_WINDOW: window limit
29 //#define WINDOW_LIMIT put_the_numeric_limit_here
30
31 /*** OUTPUT DATA TYPE ***/
32 // --> If you are NOT USING PREDEFINED ANALYSIS OR if INPUT
TYPE IS DIFFERENT THAN OUTPUT TYPE , uncomment and modify
33 // --> this line
34 //#define ANALYSIS_OUTPUT_TYPE type
35
36 /* ******** End of editable section ********* */
37 // --> DO NOT EDIT REST OF THE FILE
38 #include <netgpu/AnalysisPrototype.h>
Figure 4.23: Template file: BlankAnalysisTemplate.h.
• BlankAnalysisTemplate.cpp. It includes BlankAnalysisTemplate.h, and con-
tains the definition of the implementation of the functions listed in the figure 4.13
by the user.
• Makefile. The Makefile rules the analysis compilation process, executing first of
all the PrePreProcessor (ppp.sh) and then compiling the analysis into an object
file (.o file).
The framework also includes a small utility (command) to create new analysis, creating
a folder with the analysis name and modifying the template files with the analysis name.
4.6.5 Module system
The module system allows the objective defined in the project objectives section to
allow the users of the framework to reuse analysis code for multiple analysis entities. It
is basically designed to allow programmers to develop modules which will define unique
calls per each analysis section, although current implementation allows several calls to
be used in a section, taking advantage of it (specially in the operations section).
Problem definition: Due to the way global barriers are implemented
(kernel launching system), all the modules cannot be included and com-
piled in a analysis. As modules may use global barriers, if all the module sources
were included, the preprocessor barrier counter will certainly be incremented by
Page 97
Chapter 4. Implementation 84
every global barrier call placed in the modules, even if they are not used, and in
an arbitrary order.
Adopted solution: The PrePreProcessor (ppp) will be in charge of iden-
tifying the modules used, and load them dynamically. The PrePreProces-
sor will implement a small parser to identify and include only required modules in
order.
The PrePreProcessor, and in particular dmodule.sh script, looks for the keys saved in
the PrePreProcessor ###PATTERNS directive of the modules within the user code, to
identify the modules used. So every module must define at least one pattern or will be
ignored and never included. It also orders the inclusion of code based on the first time
the module is called.
All the modules are defined with the extension .module, and are placed in the source
code in the folder Analysis/Modules.
All the module calls use the same nomenclature:
$MODULE NAME[$SUBMODULE NAME]$ROUTINE NAME(args )
The MODULE NAME must always be present and as its name suggests is the name of the
module. It is usually the name of the analysis, if the module functionality is associated
with a particular analysis. The SUBMODULE NAME is the name of the submodule and is
optional; depending on the module the submodule name may or may not be used. The
ROUTINE NAME is the routine call name, and may include a variable number of arguments
(args ).
As the result of this module system, the users can simply use one of the module calls
directly, and the PrePreProcessor will load the source code in compilation time (if the
module is installed).
The following code, shows a simple example of a module definition and how to call it.
1
2 /*
3 MODULE:Example
4 TYPE: Analysis
5
6 PrePreprocessor orders (ppp.sh); note that this is a commented section
7 ### PATTERNS $MY_MODULE$ANALYSIS ();
Page 98
Chapter 4. Implementation 85
8
9 */
10
11 //It is not strictly needed
12 #ifdef __CUDACC__
13
14 // Defining the CALL as a MACRO
15 #define $MY_MODULE$ANALYSIS () \
16 COMPOUND_NAME(ANALYSIS_NAME ,preDefinedAnalysisCodeMyModule)(GPU_buffer
,GPU_data ,GPU_results ,state);\
17 __syncthreads ()
18
19 // Implementing it in a device inline function
20 template <typename T,typename R> __device__ __inline__ void COMPOUND_NAME(
ANALYSIS_NAME ,preDefinedAnalysisCodeMyModule)(packet_t* GPU_buffer , T*
GPU_data , R* GPU_results , analysisState_t state){
21
22 // Dummy: Putting in the results array data_element *2
23 RESULT_ELEMENT = DATA_ELEMENT *2;
24 }
25 #endif // __CUDACC__
Figure 4.24: Example of a module implementation. (Example.module).
To use it, and hence loading it, it only has to be called in the appropriate section.
1 template <typename T,typename R>
2 __device__ void COMPOUND_NAME(ANALYSIS_NAME ,
AnalysisRoutineImplementation)(packet_t* GPU_buffer , T* GPU_data , R*
GPU_results ,analysisState_t state){
3 // Calling the analysis routine of the module
4 $MY_MODULE$ANALYSIS ();
5 }
Figure 4.25: Example of usage of the module defined in figure 4.24, by using its call
in the analysis section.
Windowed analysis module support.
The modules may support windowed analysis or not, or even only allow programmers
to use it when the analysis is windowed. To achieve it, the module developer can use
Page 99
Chapter 4. Implementation 86
the preprocessor variable HAS WINDOW and preprocessor conditional code and #error
preprocessor directive to assure that the user fulfill module requirements.
Type wrapping and controlling by the module.
The module, and in particular analysis routine modules, can have full control over the
ANALYSIS INPUT TYPE and ANALYSIS OUTPUT TYPE type of the analysis. For instance
the module might require to set a particular output type, or fix both input and out-
put types. To achieve it, the module is able to redefine ANALYSIS INPUT TYPE and
ANALYSIS OUTPUT TYPE MACROs to the correct type names, as certainly the analysis
types are not configured until modules are loaded.
In addition, the module can also achieve partial type definition by the user, by using the
type wrapping technique. The idea behind type wrapping is to let the user define his
own data type, and then create a more complex data type including it. The technique is
basically to define a complex type first based on the current values of the type MACROs,
ANALYSIS INPUT TYPE and ANALYSIS OUTPUT TYPE, and then redefine them to the new
complex type (wrap type).
Two partially implemented module examples are shown below, the first one omitting
user type definition, and the other wrapping it.
1 /*...*/
2 // Omiting INPUT TYPE
3 #undef ANALYSIS_INPUT_TYPE
4 #define ANALYSIS_INPUT_TYPE uint32_t
5 // Defining output type = input type
6 #define ANALYSIS_OUTPUT_TYPE ANALYSIS_INPUT_TYPE
7
8 /*...*/
Figure 4.26: Example of a module ommitting user type definition (extract).
1 /*...*/
2
3 // Defining complex type (wrapping)
4
5 typdef struct{
6 ANALYSIS_INPUT_TYPE user
7 uint32_t a;
8 int b;
Page 100
Chapter 4. Implementation 87
9 float c;
10 }myWrappedType_t;
11
12 // Redefining INPUT TYPE
13 #undef ANALYSIS_INPUT_TYPE
14 #define ANALYSIS_INPUT_TYPE myWrappedType_t
15 // Defining output type = input type
16 #define ANALYSIS_OUTPUT_TYPE ANALYSIS_INPUT_TYPE
17
18 /*...*/
Figure 4.27: Example of module wrapping user type (extract).
4.6.6 Basic Macros.
One of the main objectives of the project is that framework must easy to use for the users.
Throughout the development stage, in addition of the problems summarized in sections
4.6.1, 4.6.2 and 4.6.3, several other issues where found which reduced framework’s usage
simplicity and usability:
Problem definition: CUDA only allows global memory accesses to 4-
byte multiple addresses [3]. This is a big limitation, as data stored in the
GPU buffer array is raw data. The network protocol headers, and therefore the
header fields are stored without any kind of alignment.
Adopted solution: There were two possible solutions; align the types while
storing them in the buffer (CPU) or create a wrapper function to obtain misaligned
types in the GPU.
The solution adopted has been to create a wrapper cudaSafeGet(...). The reason
of this election is performance, as aligning the types in the CPU, although would
increase GPU performance, will be very time consuming for the CPU. The wrapper
is able to safely get types of 8,16,32 and 64 bits.
Problem definition: Network information is BIG ENDIAN format, while
CPU and therefore GPU (as the GPU uses CPU endianism), uses LIT-
TLE ENDIAN type representation format. This problem was already
known from the start.
Page 101
Chapter 4. Implementation 88
Adopted solution: The inline function cudaNetworkToHost(...) has been
defined to convert values when obtaining them from the GPU buffer array to little
endian format. The function is able to convert values of 8,16,32 and 64 bit types.
To simplify the task of the users of the framework and the module developers, several
MACROs have been defined. The MACROs simplify different tasks in various areas of
the analysis, like obtaining network protocol information from the GPU buffer, accessing
to GPU data and GPU results arrays or for thread synchronizing purposes. Two types
of MACROs are supplied, User MACROs intended to be used by all the users and the
module developers, and Module Developer MACROs which may only be used by the
second ones.
4.6.6.1 User MACROs.
A brief summary of the most important User MACROs are listed below:
General MACROs
These MACROs have been defined to easily access to the elements contained in the
input and output array and to easily access to the information contained in the buffer
array.
• DATA ELEMENT: Obtains the element or elements (in case of windowed analysis)
of the input array GPU data. It Expands to the dereferenced pointer of the
ANALYSIS INPUT TYPE object for this particular thread.
Note that it may not always point to GPU data[absoluteThreadId], as certain
modules wrap10 the type defined by the user by a more complex type including
the user type. In these cases, DATA ELEMENT dereferences a user object. Mainly
used in the mining section.
• RESULT ELEMENT: Obtains the element or elements (in case of windowed analysis)
of the output array GPU results. Expands to the dereferenced pointer of the
ANALYSIS OUTPUT TYPE object for this particular thread. This MACRO is used
mainly in the analysis and postanalysis routines.10See details in section 4.6.5
Page 102
Chapter 4. Implementation 89
Mining MACROs
MACROs to be used in the mining section principally.
• GET FIELD(field ): safely gets a field of a network protocol header by using
cudaSafeGet(...) and cudaNetworkToHost(...) functions to avoid errors.
The field must be in the form of PROTOCOLNAME HEADER.struct field, where
the struct field is the header struct field defined in the protocol.
The network protocol header related MACROs are implemented for all the pro-
tocols currently supported, listed in section 4.2.3.
• PROTOCOL NAME HEADER: Expands to a dereferenced pointer (object) of the type
PROTOCOL NAME. It assumes that there is no tunneling, so for example the
IP4 header is in the network level.
• IS PROTOCOL NAME (): Expands to a boolean value depending if the packet con-
tains or not the PROTOCOL NAME.
• ...
Particular protocols may define their own MACROs apart of the above mentioned. For
instance, IP4 defines the MACRO IP4(a,b,c,d) to define ips and be able to compare
them. A detailed description of all the protocols MACROs is exposed in the online
documentation in the appendix C.
An example of usage:
1 template <typename T,typename R>
2 __device__ void COMPOUND_NAME(ANALYSIS_NAME ,miningImplementation)(
packet_t* GPU_buffer , T* GPU_data , R* GPU_results , analysisState_t
state){
3
4 //If is Ethernet and source IP == 10.0.0.0/16
5 if(IS_ETHERNET && IS_IP4 () && (IP4_NETID(GET_FIELD(IP4_HEADER.ip_src)
,16) == IP4(10,0,0,0))){
6 // Store to data Element protocol of the header
7 DATA_ELEMENT = GET_FIELD(IP4_HEADER.protocol);
8 }
9 }
Figure 4.28: Example of the usage of mining MACROs.
Page 103
Chapter 4. Implementation 90
The MACRO expansion of the code shown in figure 4.28 is presented in the figure A.6
of appendix A (code might have some extra *, () and & operators).
Filtering MACROs
The filtering MACROs are intended to only be used in the filtering and operations
section.
• PRE FILTER(field to compare, filterOps operation,op1[,op2]): Can only
be used in the preAnalyisFilteringImplementation section. Filters (erases)
elements that match the condition made up by operation, op1 and depending on
operation by op2 in the GPU data array.
• POST FILTER(field to compare,filterOps operation,op1[,op2]): Can only
be used in the postAnalysisOperationsImplementation section. It filters (erases)
elements that match the condition made up by operation, op1 and depending on
operation by op2 in the GPU results array.
The operations of the filter are defined as:
1 enum FilterOps{
2 //One operator operations
3 Equal , // ==
4 NotEqual , // !=
5 LessThan , // <
6 GreaterThan , // >
7 LessOrEqualThan , // <=
8 GreaterOrEqualThan , // >=
9
10 //Two operator operations
11 InRangeStrict , // ()
12 NotInRangeStrict , // !()
13 InRange , // []
14 NotInRange // ![]
15 };
Figure 4.29: Filtering operations of the filtering MACROs.
Synchronization MACROs
• SYNCTHREADS(): expands directly to syncthreads() CUDA function and is de-
fined to maintain a coherent style across the whole framework calls.
Page 104
Chapter 4. Implementation 91
• SYNCBLOCKS(): as previously outlined synchronizes all the threads of the kernel
(synchronization between blocks).
4.6.6.2 Module developer Macros and X-Macros.
The module developers, the ones developing code in the form of *.module files for an
specific section (or several), in addition to the previous MACROs, have a couple of extra
MACROs.
Operations MACROs (windowed analysis)
For windowed analysis, a set of MACROs are defined for the proper execution of the
code in the operations section. Basically allows programmers to conditionally execute
code in windowed analysis depending if the window limit has been reached.
As this functions have no been used in the developed modules, they are not going to
be exposed here. The reader can fulfill his curiosity by taking a look to the MACRO
definitions in the file Operations.h.
Synchronization
The developers can use the following X-MACRO to achieve the same effect as SYNCBLOCKS().
The module developers must use this X-MACRO instead of the users barriers.
• #include "PATH BACK /PrecodedSyncblocks.def": where PATH BACK is the path
to the .def file, which is placed in the modules root folder.
4.6.7 Analysis component current limitations and future work
The limitations of the current implementation are above all a consequence of the current
implementation of global barriers and the current state of the CUDA library (C++
support). In future CUDA releases and with the new CUDA-enabled devices it is highly
possible that global barriers could be implemented in global memory, and hence not
having to resort to preprocessor techniques.
The module system could be improved by using more advanced code parsing techniques
or a source-to-source compiler.
Page 105
Chapter 4. Implementation 92
The current way to access the elements of the GPU buffer could also be improved(specially
regarding the headers t struct), as in the current implementation each protocol veri-
fication and data extraction requires a global memory access which is high costing. The
decision of implementing it this way it has been due to the fact that CUDA does not
allow to pass shared memory pointers between functions, and hence to achieve the
goal of reducing global memory accesses an extra MACRO call would have been needed
to be placed by the user in the mining section.
In addition to all the issues mentioned above, the number of registers used by each
thread (basically the analysisState t struct) should also be reduced somehow, as it
impacts on the performance of the kernels (as it reduces the number of concurrent
threads running in a GPU multiprocessor). In this sense, this modifications should not
mean more global memory access, as it would be far more inefficient than the current
implementation.
4.7 Developed modules
The framework development has also consisted of the creation of several basic network
traffic analysis routines, a set of basic operations over these analysis and finally several
hook modules.
The basic network analysis implemented are:
• Threshold based analysis. Application of policy based techniques to detect
traffic anomalies or resource abuse.
• Histograms. To obtain any type of histogram regarding any parameter/s aimed
to be observed of the network traffic.
• Scan detectors. Two scan detectors have been developed, a portscan detector
and an ipscan detector. This are examples of fixed type modules.
All the analysis modules have their own operations and hooks, and the user is able
to dump the analysis results into a file, the screen or a database (using unixODBC
library).
It is necessary to remark, that the implementation of some modules, basically the
threshold and histogram module, has a balance between performance and flexibil-
ity. Modules have been implemented trying to archive the maximum performance
assuring user type definition support.
Page 106
Chapter 4. Implementation 93
If required, more specific modules could always be developed to get maximum
performance for a particular routine.
During the development of some of the modules there was a need of supporting
multiple types and partially user-defined types within a module. As comparison
operators (<, >, <=, =>, == and !=) can only be used with basic types (int,
float ...), a memcmp function has been needed to develop in the GPU.
Problem definition: To enable modules to support multiple type
sizes, a device (GPU) memcmp() implementation was needed. This
operation must be fast, and hence should be implemented in using shared
memory or registers. First implementations using shared pointers ran-
domly failed.
Adopted solution: The solution has been to implement the cudaSharedMemcmp()
function casting the types to a uint8 t type and using the operator [] (and
using the template meta-programming technique).
Several examples are included in the Examples/ folder of the source code, showing
several applications of the developed modules.
The documentation of all the modules is presented in the appendix C and includes
complete information about the syntax, parameters and additional MACROs sup-
plied by each module, as well an accurate description and examples of usage. It
also includes a list of modules related to the module.
4.7.1 Thresholds
Three different analysis modules have been developed within this type of analysis:
• $DETECTOR$ module. Detects user-type elements that are not null elements, and
counts the number of user-type elements within the input array. It can be used
for example to detect abnormal header field values and known malicious packets.
It should be improved to increase performance for multiple anomaly detection (like
in signature-based NIDS).
• $RATES$ module. Rates module allows the programmers to implement threshold
detection in number of user-type elements per second.
The user is able to define a type and fill the values of this user-type elements.
The module then, identifies elements that are not null, calculating the rate of
equal elements in number of elements per second. If the rate is above a certain
Page 107
Chapter 4. Implementation 94
threshold, a result is placed in the output array. An operations submodule is able
to perform multi-threshold analysis for different values of the user-type element.
This module has multiple usages. It can be used for instance to calculate de
number of packets flowing to a certain host/service (and therefore detecting DoS
attacks), the number of connections between two hosts which may indicate an
strange behaviour . . .
• $THROUGHPUTS$ module. The throughputs is similar to the $RATES$ modules, but
is able to calculate any magnitude, basically bytes, per second. The user, must in
addition to mine values for the user-type element, mine the magnitude for each
packet using a special MACRO defined by the module. An operation submodule
also allows to define multiple thresholds.
4.7.2 Histograms
The $HISTOGRAMS$ analysis module allows to create histograms of the type of elements
chosen by the programmer. The module counts the number of equal user-type elements
using a memcmp function implemented in the GPU (in shared memory), and stores
the results in the beginning of the array.
It must be remarked that the histograms are discrete, in the sense that only not null
elements are outputted. At the same time, as the users define input type (output type
is assumed as the same) of the analysis, complex types like structs can be used without
any problem, creating complex histograms (that can be represented as multidimensional
histograms or compound key histograms).
4.7.3 Scandetectors
As port scanning and ip scanning are techniques known to be potentially suspicious,
two different modules have been developed to try to detect this kind of actions: the
$PORTSCAN DETECTOR$ module and the $IPSCAN DETECTOR$ module. The implementa-
tion of this detection algorithms has been based in the intuitive idea that the rate of
connections/second in the case of portscans, and destination ips/second in the case of
ipscans are high during the elapsed time of the scan.
4.7.4 Other
It should also be remarked that a special hooks section module called $PROGRAM LAUNCHER$
has been released. This module, not related to any analysis module and hence being
Page 108
Chapter 4. Implementation 95
able to be used in any analysis, allows to the framework user to call external programs
and scripts passing information to them.
4.7.5 Future work
The future work that could be carried out over the modules currently released would be
to improve them, basically improving the performance of some of them.
In the other hand, and due to project time limitations, there are two big modules that
have not been implemented and should be considered as a future work: a behaviour
based NIDS and a signature based NIDS module.
The behaviour based NIDS is probably the analysis that could take the most advantage
of the GPU capabilities, due to the mathematical calculations behind their algorithms.
Several research papers, like the ones cited in the section 2.2.2.2, should be studied in
depth to implement it.
In the other hand, the signature based NIDS could be implemented using the rule-sets
defined in the opensource NIDS Snort, translating them into framework code somehow.
An implementation of a signature-based NIDS based on Snort paper, [46], has recently
been published (but not the source code) and should be also taken into consideration
throughout the implementation.
The hope of the framework creators is that, once the framework is published on the
Internet, developers all over the world contribute to the project creating new modules
to extend the framework functionality and also improve the current modules.
Page 109
Chapter 5
Conclusions
The Thesis result is a framework capable of achieving all the objectives exposed in sec-
tion 1.2 of the thesis report. The framework allows a simple way to create programs
that allow to the framework-programmer capture packets from either the network inter-
face or network capture files and analyse the traffic using the GPUs under the CUDA
architecture. The task of programming network traffic analysis routines has been sim-
plified by the framework structure as well as by all the tools, framework functions and
MACROs developed within this thesis project. Thus, all the objectives defined have
been successfully met.
The resulting workflow for the framework-based programs is simple, as the users only
have to define the main() function of the program and code the analysis based on the
structure contained in the template files.
At the same time, the framework’s built-in module system brings to the framework
developers and user-programmers an easy way to share analysis code in a simple way,
without having to renounce to neither any of the framework capabilities nor CUDA’s
power. In this sense, modules give the chance to programmers that even do not known
anything about CUDA programming, to use the framework. The module system also
grants that the framework will be easily extended, as adding more analysis capabilities
to it is as easier as adding new files (modules) with the code in the appropriate folder.
In this respect, the decision of releasing the code under the GPL license is, apart from
a conviction in the way software is conceived, an instrument to assure that there will be
the possibility to allow other programmers to join to the project development to enrich
it.
The framework project should be considered as in an open development state. Al-
though the current state of the framework’s implementation is fully functional there
96
Page 110
Chapter 5. Conclusions 97
are several aspects of the project that can be improved, most of them outlined in the
future work sections of each component. In addition, the framework might also be ex-
tended, particularly regarding network traffic analysis routines, to fulfill the needs of
more framework-users.
Regarding the personal side of the project, as indeed is the final subject of the “ETSETB
Enginyeria de telecomunicacions” university degree, this thesis has reported me a lot of
personal satisfaction and above all, knowledge. Although during the development stage
some aspects of the project have gotten more complicated than initially expected, thanks
to the unconditional support of my advisor and the work carried out, all the problems
have finally been solved.
During the development of this project, C++ (including template meta-programming
techniques) programming language has been learnt as well as GPGPU techniques based
on the CUDA architecture. In addition, knowledge about Libcap library, ODBC libraries
has been acquired. An extensible study of the possibilities of the GNU cpp preprocessor
has been carried out also. Autotools has also been used for the first time.
At the same time, tough it may not be fully perceived throughout the lecture of this thesis
report, a significant study on network traffic analysis techniques, security threats against
the network and/or its hosts as well as NIDS/NIPS systems and particularly statistical
NIDS/NIPS, has been carried out and allowed me to acquire a lot of knowledge in this
areas.
In addition, LATEX program has been used for the first time to write this thesis report
and dokuwiki has been used to create web documentation for the framework, which had
also never been used.
The student’s hope is that the framework will be of interest by IT and software commu-
nity, and that the release of the source code under the GPL license will make possible
that developers all over the world use and contribute to its development.
Page 111
Appendix A
Code details
LivePacketFeeder.h
1 #ifndef LivePacketFeeder_h
2 #define LivePacketFeeder_h
3
4 /* Inclusion of library headers */
5
6 #include "../ Util.h"
7 #include "../ Common/PacketFeeder.h"
8 #include "SizeDissector.h"
9
10 #define CAPTURING_TIMEms 1000
11 #define SNIFFER_BUFFER_SIZE 8192
12 #define SNIFFER_NUM_OF_BUFFERS 2
13
14
15 #define SNIFFER_GO_STATE 0
16 #define SNIFFER_LASTBUFFER_STATE 1
17 #define SNIFFER_END_STATE 2
18
19 using namespace std;
20
21 class LivePacketFeeder:public PacketFeeder {
22
23 public:
24
25 LivePacketFeeder(const char* device);
26 ~LivePacketFeeder(void);
27
28 pthread_t* start(int limit);
29
98
Page 112
Appendix A. Code details 99
30 // captured packet callback method
31 static void packetCallback(u_char *sniffer ,const struct pcap_pkthdr*
pkthdr ,const u_char* packet);
32
33 // Method for the consumer thread to get the sniffed PacketBuffer
34 PacketBuffer* getSniffedPacketBuffer(void);
35
36 void flushAndExit(void);
37 private:
38 //PCAP descriptor
39 pcap_t* descr;
40
41 // Counter and limit
42 int packetCounter;
43 int maxPackets;
44
45 // Array of 2 packetBuffers and actualindex
46 PacketBuffer* packetBufferArray;
47 short int bufferIndex;
48
49 // Device name
50 const char* dev;
51
52 // State
53 int state;
54
55 // Mutex pthread semaphore
56 pthread_mutex_t mutex;
57
58 // Synchronization pthreads semaphore
59 sem_t* waitForSwap;
60 sem_t* waitForLivePacketFeederToEnd;
61
62 static void* startThreadWrapper(void* object);
63 void _start(void);
64 inline void setDeviceDataLinkInfoToBuffers(int deviceDataLink);
65 };
66
67 #endif // LivePacketFeeder_h
Figure A.1: LivePacketFeeder.h
OfflinePacketFeeder.h
Page 113
Appendix A. Code details 100
1 #ifndef OfflinePacketFeeder_h
2 #define OfflinePacketFeeder_h
3
4 /* Inclusion of header libraries */
5
6 #include "../ Util.h"
7 #include "../ Common/PacketFeeder.h"
8 #include "SizeDissector.h"
9
10 #define CAPTURING_TIMEms 1000
11 #define SNIFFER_BUFFER_SIZE 8192
12 #define SNIFFER_NUM_OF_BUFFERS 2
13
14
15 #define OFFLINE_SNIFFER_GO_STATE 0
16 #define OFFLINE_SNIFFER_LASTBUFFER_STATE 1
17 #define OFFLINE_SNIFFER_END_STATE 2
18
19 using namespace std;
20
21 class OfflinePacketFeeder:public PacketFeeder {
22
23 public:
24
25 OfflinePacketFeeder(const char* file);
26 ~OfflinePacketFeeder(void);
27 pthread_t* start(int limit);
28
29 static void packetCallback(u_char *useless ,const struct pcap_pkthdr*
pkthdr ,const u_char* packet);
30
31 PacketBuffer* getSniffedPacketBuffer(void);
32
33 void flushAndExit(void);
34 private:
35 //PCAP descriptor
36 pcap_t* descr;
37
38 // Counter and limit
39 int packetCounter;
40 int maxPackets;
41
42 // Array of 2 packetBuffers and actualindex
43 PacketBuffer* packetBufferArray;
44 short int bufferIndex;
45
46 // Device name
47 const char* file;
Page 114
Appendix A. Code details 101
48
49 // State
50 int state;
51
52 // Mutex
53 pthread_mutex_t mutex;
54
55 // Synchronization semaphore
56 sem_t* waitForSwap;
57 sem_t* waitForOfflinePacketFeederToEnd;
58
59 void _start(void);
60 static void* startThreadWrapper(void* object);
61 inline void setDeviceDataLinkInfoToBuffers(int deviceDataLink);
62 };
63
64 #endif // OfflinePacketFeeder_h
Figure A.2: OfflinePacketFeeder.h
Analyzer.h and Analyzer.cpp
1 #ifndef Analyzer_h
2 #define Analyzer_h
3
4 /* Inclusion of library headers */
5 #include "../ Util.h"
6 #include "../ Common/PacketBuffer.h"
7 #include "../ Common/PacketFeeder.h"
8 /* Inclusion of other own headers */
9
10 #define ANALYZER_MAX_ANALYSIS_POOL_SIZE 128
11 #define ANALYZER_MAX_FEEDERS_POOL_SIZE 1 //DO NOT MODIFY. Still not able
to handle more than 1 feeder at the time
12
13 typedef struct{
14 PacketFeeder* feeder;
15 pthread_t* thread;
16 }feeders_t;
17
18 using namespace std;
19
20 class Analyzer{
21
Page 115
Appendix A. Code details 102
22 public:
23 static void start(void);
24 static void term(void);
25 static DatabaseManager* dbManager;
26
27 //Add tot analysis Pool
28 static void addAnalysisToPool(void (*func)(PacketBuffer* packetBuffer ,
packet_t* GPU_buffer));
29
30 //Add to feeders pool
31 static void addFeederToPool(PacketFeeder* feeder ,int limit =-1);
32
33 private:
34 static void init(void);
35 static void programHandler(void);
36 static void analyzeBuffer(PacketBuffer* buffer);
37
38 static packet_t* loadBufferToGPU(PacketBuffer* packetBuffer);
39 static void unloadBufferFromGPU(packet_t* GPU_buffer);
40
41 // Analysis Pointers Pool
42 static void (* analysisFunctions[ANALYZER_MAX_ANALYSIS_POOL_SIZE ])(
PacketBuffer* packetBuffer , packet_t* GPU_buffer);
43 // Feeders Pool
44 static feeders_t feedersPool[ANALYZER_MAX_FEEDERS_POOL_SIZE ];
45 };
46
47 #endif // Analyzer_h
Figure A.3: Analyzer.h source extract.
1 #include "Analyzer.h"
2 /* ... */
3 packet_t* Analyzer :: loadBufferToGPU(PacketBuffer* packetBuffer){
4
5 /* Loads buffer to the GPU */
6 packet_t* GPU_buffer;
7 int size = sizeof(packet_t)*MAX_BUFFER_PACKETS;
8
9 BMMS:: mallocBMMS ((void **)&GPU_buffer ,size);
10 cudaAssert(cudaThreadSynchronize ());
11
12 /* Checks if buffer is NULL */
13 if(packetBuffer == NULL)
14 return NULL;
15
Page 116
Appendix A. Code details 103
16 if(GPU_buffer == NULL)
17 ABORT("cudaMalloc failed at Analyzer");
18 if(packetBuffer ->getBuffer ()==NULL)
19 ABORT("PacketBuffer is NULL");
20
21 cudaAssert(cudaMemcpy(GPU_buffer ,packetBuffer ->getBuffer (),size ,
cudaMemcpyHostToDevice));
22 cudaAssert(cudaThreadSynchronize ());
23
24 return GPU_buffer;
25 }
26
27 void Analyzer :: unloadBufferFromGPU(packet_t* GPU_buffer){
28 /* Unloads buffer from the GPU */
29 BMMS:: freeBMMS(GPU_buffer);
30 }
31
32 /* Adds feeder to the pool and stores pthread_t */
33 void Analyzer :: addFeederToPool(PacketFeeder* feeder ,int limit){
34 int i;
35
36 for(i=0;i<ANALYZER_MAX_FEEDERS_POOL_SIZE;i++){
37 if(feedersPool[i]. feeder == NULL){
38 feedersPool[i]. feeder = feeder;
39 feedersPool[i]. thread = feedersPool[i].feeder ->start(limit);
40 return;
41 }
42 }
43 ABORT("No more feeders can be placed into the pool");
44 }
45
46 /* Adds an analysis to the pool */
47 void Analyzer :: addAnalysisToPool(void (*func)(PacketBuffer* packetBuffer ,
packet_t* GPU_buffer)){
48 int i;
49
50 for(i=0;i<ANALYZER_MAX_ANALYSIS_POOL_SIZE;i++){
51 if(analysisFunctions[i] == NULL){
52 analysisFunctions[i] = func;
53 return;
54 }
55 }
56 ABORT("No more analysis can be placed into the pool");
57 }
58
59 /* Buffer analyze routine */
60 void Analyzer :: analyzeBuffer(PacketBuffer* packetBuffer){
61 int i;
Page 117
Appendix A. Code details 104
62
63 packet_t* GPU_buffer;
64
65 //Load buffer from PacketBuffer to GPU
66 GPU_buffer = loadBufferToGPU(packetBuffer);
67
68 /*** Throwing Analysis ***/
69 for(i=0;i<ANALYZER_MAX_ANALYSIS_POOL_SIZE;i++){
70 if(analysisFunctions[i] != NULL){
71 analysisFunctions[i]( packetBuffer ,GPU_buffer);
72 }else
73 break;
74 }
75
76 // UNload buffer from GPU
77 unloadBufferFromGPU(GPU_buffer);
78 }
79
80 /* Start routine. Infinite loop that obtains buffer and analyzes it*/
81 void Analyzer ::start(void){
82
83 int i;
84 bool hasFeedersLeft;
85 PacketBuffer* buffer=NULL;
86
87 /* SIGTERM signal handler */
88 programHandler ();
89
90 /* Implements infinite loop */
91 for (;;){
92 for(i=0, hasFeedersLeft = false;i<ANALYZER_MAX_FEEDERS_POOL_SIZE;i
++){
93
94 //If slot has valid Feeder pointer
95 if(feedersPool[i]. feeder != NULL){
96 //Get buffer
97 buffer = feedersPool[i].feeder ->getSniffedPacketBuffer ();
98
99 // Analyse it
100 analyzeBuffer(buffer);
101
102 // Check if(offline) feeder has no more packets to get
103 if(buffer == NULL || buffer ->getFlushFlag ())
104 feedersPool[i]. feeder = NULL;
105 else
106 hasFeedersLeft = true;
107 }
108 }
Page 118
Appendix A. Code details 105
109
110 if(hasFeedersLeft == false)
111 break;
112 }
113 }
114
115 void Analyzer ::term(void){
116
117 int i;
118
119 cerr <<"Sending term"<<endl;
120
121 // Force all feeders to flush their buffers and to exit
122 for(i=0;i<ANALYZER_MAX_FEEDERS_POOL_SIZE;i++){
123 if(feedersPool[i]. feeder != NULL)
124 feedersPool[i].feeder ->flushAndExit ();
125 }
126 }
Figure A.4: Analyzer.cpp source extract.
Example of basic MACROs usage.
1 template <typename T,typename R>
2 __device__ void COMPOUND_NAME(ANALYSIS_NAME ,miningImplementation)(
packet_t* GPU_buffer , T* GPU_data , R* GPU_results , analysisState_t
state){
3
4 //If is Ethernet and source IP == 10.0.0.0/16
5 if(IS_ETHERNET && IS_IP4 () && (IP4_NETID(GET_FIELD(IP4_HEADER.ip_src)
,16) == IP4(10,0,0,0))){
6 // Store to data Element protocol of the header
7 DATA_ELEMENT = GET_FIELD(IP4_HEADER.protocol);
8 }
9 }
Figure A.5: Example of the usage of mining MACROs.
The MACRO expansion of the code shown above (code might have some extra *, ()
and & operators) is:
Page 119
Appendix A. Code details 106
1 template <typename T,typename R>
2 __device__ void Example_miningImplementation(packet_t* GPU_buffer , T*
GPU_data , R* GPU_results , analysisState_t state
3 ){
4
5
6 if (((&((& GPU_buffer [( threadIdx.x + ((state.blockIterator -state.
windowState.blocksPreviouslyMined)*blockDim.x))])->headers))->proto [2]
== 0x0001) && ((&((& GPU_buffer [( threadIdx.x + ((state.blockIterator -
state.windowState.blocksPreviouslyMined)*blockDim.x))])->headers))->
proto [3] == 0x0800) && (( cudaNetworkToHost(cudaSafeGet (&((*(( struct
ip4_header *) ((( uint8_t *)&((& GPU_buffer [( threadIdx.x + (( state.
blockIterator -state.windowState.blocksPreviouslyMined)*blockDim.x))])
->packet))+(& GPU_buffer [( threadIdx.x + ((state.blockIterator -state.
windowState.blocksPreviouslyMined)*blockDim.x))])->headers.offset [3]))
).ip_src))) & (( uint32_t)(0xFFFFFFFF < <(32-16)))) == (( uint32_t)
((10 <<24)|(0<<16)|(0<<8)|0)))){
7
8 GPU_data[threadIdx.x + (state.blockIterator*blockDim.x)] =
cudaNetworkToHost(cudaSafeGet (&((*(( struct ip4_header *) ((( uint8_t *)
&((& GPU_buffer [( threadIdx.x + ((state.blockIterator -state.windowState.
blocksPreviouslyMined)*blockDim.x))])->packet))+(& GPU_buffer [(
threadIdx.x + (( state.blockIterator -state.windowState.
blocksPreviouslyMined)*blockDim.x))])->headers.offset [3]))).protocol))
);
9 }
10 }
Figure A.6: Macro-expansion of the code listed in figure A.5 and 4.28.
Page 120
Appendix B
Source Code (digital appendix)
The source code of the application, the modules and the examples can be found in the
folder src/ of the CD.
107
Page 121
Appendix C
Online Documentation (digital
appendix)
The User’s manual documentation, developed with dokuwiki, can be found in the folder
doc/, and specifically in the file doc/index.html of the CD.
Note that as it has been impossible to get a “static html version” of it. Therefore
Internet connection is required to contact the server and browse it. Simply open
the page with your favourite web browser.
108
Page 122
Bibliography
[1] McCanne, S. and Jacobson, V., The BSD Packet Filter: A New Architecture
for User-level Packet Capture, 12 1992.
[2] Hwu, W. and Kirk, D., Ece 498 al programming massively parallel processor
textbook, 2006-2008.
[3] NVIDIA, NVIDIA CUDA Programming Guide 2.3, 4 2009.
[4] Internet World Stats, World Internet Users and Population Stats, http://www.
internetworldstats.com/stats.htm.Retrieved2009-11-06, 6 2009.
[5] University of Minesota., Minnesota Internet Traffic Studies (MINTS), 2008.
[6] Tcpdump, Libpcap and Winpcap, http://www.tcpdump.org/.
[7] Wireshark, http://www.wireshark.org/.
[8] Omnipeek, http://www.wildpackets.com/products/network_analysis/
omnipeek_network_analyzer.
[9] IEEE, IEEE 802.3 LAN/MAN CSMA/CD (Ethernet) Access Method., 2008.
[10] IEEE, IEEE 802.11 LAN/MAN Wireless LANS., 2007.
[11] Zhang, H., Ma, J., Wang, Y. and Pei, Q., An Active Defense Model and
Framework of Insider Threats Detection and Sense, 2009.
[12] Doss, G. and Tejay, G., Developing Insider Attack Detection. Model: A Grounded
Approach., 2009.
[13] Cisco Systems Inc. website, http://www.cisco.com/, 2009.
[14] 3com Corporation Website, http://www.3com.com/, 2009.
[15] Nagios, http://www.nagios.org/.
[16] OpenNMS, http://www.opennms.org/.
109
Page 123
Bibliography 110
[17] PandoraFMS, http://www.pandorafms.org/.
[18] IBM ISS, http://www.iss.net/.
[19] Cisco Works, http://www.cisco.com/en/US/products/sw/cscowork/ps2425/
index.html.
[20] PacketFilter (pf), http://www.openbsd.org/faq/pf/.
[21] Iptables (NetFilter), http://www.netfilter.org/.
[22] Snort, http://www.snort.org/.
[23] Snort, http://www.bro-ids.org/.
[24] Asensio, J. et al., Slides of the subject: “Complementos Telematicos I”.
[25] SNMP (Simple Network Management Protocol), http://en.wikipedia.org/
wiki/Simple_Network_Management_Protocol.
[26] Defense Advanced Research Projects Agency (DARPA), Transmission
Control Protocol, DARPA Internet program protocol specificiation (TCP RFC),
1981.
[27] Anderson, J. P., Computer Security Technology Planning Study Volume 2, 1972.
[28] Anderson, J. P., Computer Security Threat Monitoring and Surveillance, 1980.
[29] Denning, D. and Neumann, P., Requirements and Model for IDES A Real-
Time Intrusion Detection Expert System. Final report., 1985.
[30] Wikipedia, Timeline of computer security hacker history, http://en.wikipedia.
org/wiki/Timeline_of_computer_security_hacker_history, 2009.
[31] Chen, W. W., Statistical Methods in computer security, 2005.
[32] Wang, Y., Statistical techniques for Network security, 2009.
[33] Bejtlich, R., The TAO of network security: Beyond Intrusion Detection, 2004.
[34] Wang, Kim, Mbateng, Ho et al., A latent class modeling approach for anomaly
intrusion detection, 2006.
[35] Barbard, D, Wu, N and Jajodia, Detecting novel network intrusions using
Bayes estimators. A latent class modeling approach for anomaly intrusion detection,
Proceedings of the 1st SIAM International Conference on Data Mining, pp. 24-29.,
2001.
Page 124
Bibliography 111
[36] Lee, W., Stolfo, S. and Mok, K., A data mining framework for building intrusion
detection models., Proceedings of the IEEE Symposium on Security and Privacy,
120-132., 1999.
[37] Zhou, M. and Lang, S. D., Mining frequency content of network traffic for intru-
sion detection. A data mining framework for building intrusion detection models.,
Proceedings of the IASTED International Conference on Communication, Network,
and Information Security, 101-107., 2003.
[38] Corporation, V., Gaming hardware survey, using the Steam library, http://
store.steampowered.com/hwsurvey/, 12 2009.
[39] NVIDIA, Gnort: High Performance Network Intrusion Detection Using Graphics
Processors, http://www.nvidia.com/object/fermi_architecture.html, 2009.
[40] Harris, M. J., III, W. V. B., Scheuermann, T. and Lastra, A., Simulation
of Cloud Dynamics on Graphics Hardware, Proceedings of the SIGGRAPH/Euro-
graphics Workshop on Graphics Hardware 2003, 2003.
[41] NVIDIA, NVIDIA CUDA Reference Manual 2.3, 4 2009.
[42] Stroustrup, B., The C++ Programming Language, Addison-Wesley, 3rd edn.,
1997.
[43] CUDA Zone, http://www.nvidia.com/cuda/.
[44] UnixODBC, http://www.unixodbc.org/.
[45] The GNU project, http://www.gnu.org/.
[46] Vasiliadis, G., Antonatos, S., Polychronakis, M., Markatos, E. P. and
Ioannidis, S., Gnort: High Performance Network Intrusion Detection Using
Graphics Processors, 2009.