Aalborg Universitet CFD Simulation of Air Velocity Distribution in Occupied Livestock Buildings Svidt, Kjeld; Zhang, G.; Bjerg, B. Publication date: 1998 Document Version Publisher's PDF, also known as Version of record Link to publication from Aalborg University Citation for published version (APA): Svidt, K., Zhang, G., & Bjerg, B. (1998). CFD Simulation of Air Velocity Distribution in Occupied Livestock Buildings. Aalborg: Dept. of Building Technology and Structural Engineering. Indoor Environmenatl Engineering, No. 87, Vol.. R9831 General rights Copyright and moral rights for the publications made accessible in the public portal are retained by the authors and/or other copyright owners and it is a condition of accessing publications that users recognise and abide by the legal requirements associated with these rights. ? Users may download and print one copy of any publication from the public portal for the purpose of private study or research. ? You may not further distribute the material or use it for any profit-making activity or commercial gain ? You may freely distribute the URL identifying the publication in the public portal ? Take down policy If you believe that this document breaches copyright please contact us at [email protected] providing details, and we will remove access to the work immediately and investigate your claim. Downloaded from vbn.aau.dk on: juli 07, 2018
Transcript
Aalborg Universitet
CFD Simulation of Air Velocity Distribution in Occupied Livestock Buildings
Svidt, Kjeld; Zhang, G.; Bjerg, B.
Publication date:1998
Document VersionPublisher's PDF, also known as Version of record
Link to publication from Aalborg University
Citation for published version (APA):Svidt, K., Zhang, G., & Bjerg, B. (1998). CFD Simulation of Air Velocity Distribution in Occupied LivestockBuildings. Aalborg: Dept. of Building Technology and Structural Engineering. Indoor Environmenatl Engineering,No. 87, Vol.. R9831
General rightsCopyright and moral rights for the publications made accessible in the public portal are retained by the authors and/or other copyright ownersand it is a condition of accessing publications that users recognise and abide by the legal requirements associated with these rights.
? Users may download and print one copy of any publication from the public portal for the purpose of private study or research. ? You may not further distribute the material or use it for any profit-making activity or commercial gain ? You may freely distribute the URL identifying the publication in the public portal ?
Take down policyIf you believe that this document breaches copyright please contact us at [email protected] providing details, and we will remove access tothe work immediately and investigate your claim.
The Indoor Environmental Engineering papers are issued for early dissemination of research results from the Indoor Environmental Engineering Group at the Department of Building Technology and Structural Engineering , Aalborg University. These papers are generally submitted to scientific meetings, conferences or journals and should therefore not be widely distributed. Whenever possible, reference should be given to the final publications (proceedings, journals, etc.) and not to the Indoor Environmental Engineering papers .
Pri nted at Aa lborg University
I
CFD Simulation of Air
Velocity Distribution in
Occupied Livestock
Buildings
K. Svidt, G. Zhang, B. Bjerg
CFD SIMULATION OF AIR VELOCITY DISTRIBUTION IN OCCUPIED LIVESTOCK BUILDINGS
3Royal Veterinary and Agricultural University, Copenhagen, DENMARK, [email protected]
ABSTRACT In modem livestock buildings the design
of the ventilation systems is important in order to obtain good air distribution. The use of Computational Fluid Dynamics for predicting the air flow and air quality makes it possible to include the effect of room geometry, equipment and occupants in the design of ventilation systems. However, it is not appropriate to include the detailed geometry of a large group of lying or standing animals affecting the air flow in the building. It is necessary to have relatively simple models of the animals, which are easier to implement in the computer models. In this study laboratory measurements in a ventilated test room with "pig simulators" are compared with CFD-simulations.
Real building
KEYWORDS Airflow pattern, Air velocity, CFD,
Mixing ventilation, Livestock buildings.
INTRODUCTION In recent years the use of Computational
Fluid Dynamics (CFD) for prediction of airflow in office buildings and industrial buildings has increased significantly due to the extension of powerful desktop workstations and easy to use CFD-codes. The CFD tool is also an interesting possibility to predict airflow and air quality in modem livestock buildings, since there is an increasing attention on working environment and animal welfare. A number of authors have investigated the use of CFD for the
Model
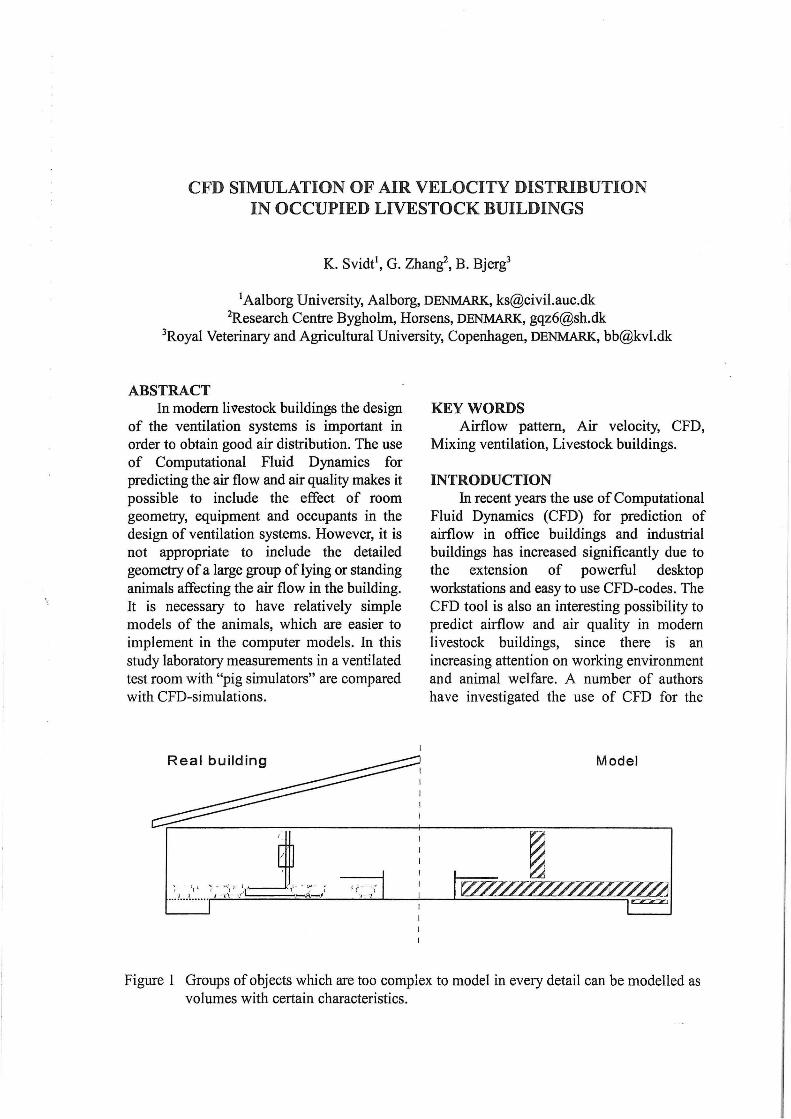
Figure 1 Groups of objects which are too complex to model in every detail can be modelled as volumes with certain characteristics.
prediction of air flow in livestock buildings, e. g. H arra/ et a/ (/997), Ho If et a/ (/992, 1995) and Svidt (1994).
For practical PU!poses it is not possible to mode/ every detail of the building including all types of equipment and animals. To mode/ the overall airflow pattern, a simpler model will often be adequate.
characteristics. In the present study laboratory measurements in a ventilated test room with "pig simulators" are compared With CFDsimulations.
If tl1e building in case has only a fuw internal walls or relatively large solid obstacles, it is obvious to mode/ these obJects
METHODs
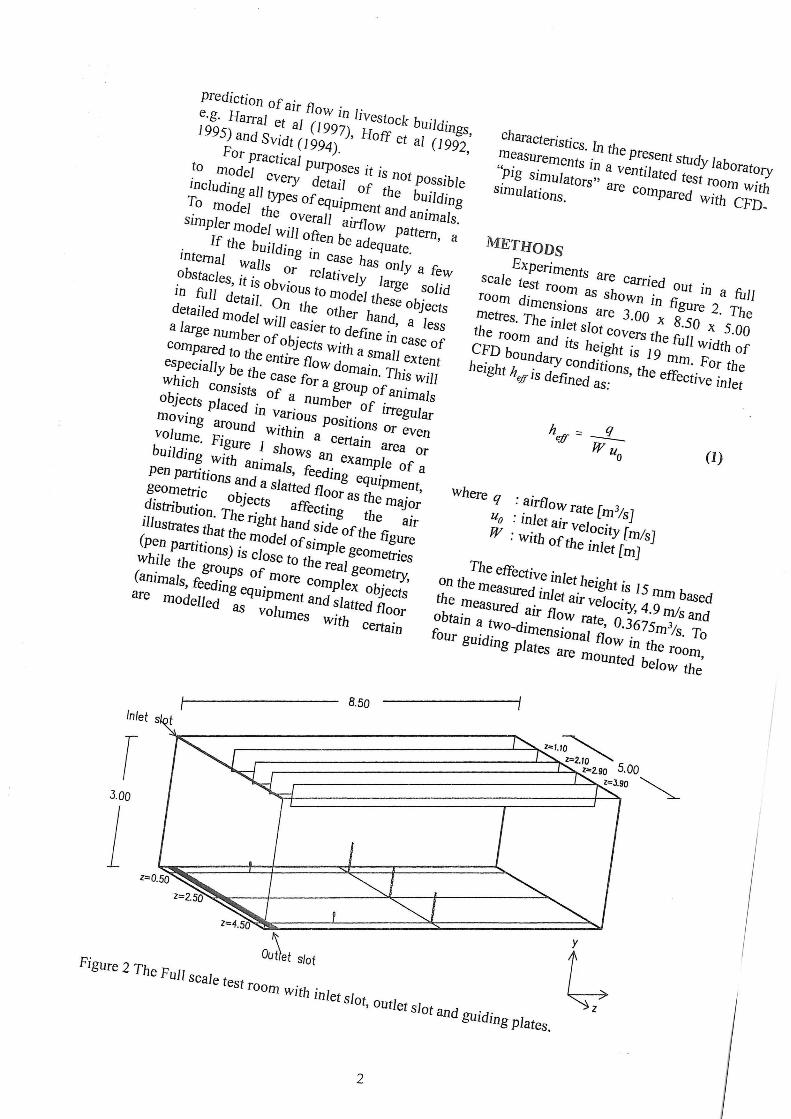
Experiments are carried out in a full scale test room as shown in figure 2. The room dimensions are 3.oo x B.so x s.oo metres. The in/et slot covers the full Width of the room and its height is 19 mm. For t/1e CFD boundary conditions, the effective inlet height heff is defined as:
(1)
in full detail. On the other hand, a less detailed mode/ will easier to define in case of a large number of objects With a small extent compared to the entire flow domain. This will especially be the case for a &roup of animals Which consist, of a number of irregular objects placed in Various Positions or even moving around within a certain area or volume. Figure 1 shows an example of a building with animals, feeding equipment,
pen Partitions and a s/atted floor as the mtYor geometric obJects affecting the air distribution. The right hand side of the figure illustrates that the mode/ of simple geometries (pen Partitions) is close to the rea/ geometry, While the groups of more complex objects (animals, feeding equipment and s/atted floor
where q :airflow rate [m%]
u0 :inlet air velocity [mls] W :with of the inlet [m]
are modelled as volumes with certain
a. so
The effective inlet height is /5 mm based on the measured inlet air velocity, 4.9 mfs and the measured air flow rate, 0.367Sm'ls. To obtain a two-dimensional flow in the room, four guiding plates are mounted below the
r J.oo
1 1==4-~.50~ ~lli:::====~======:::....-
Ou~et slot
Figure 2 The Full scale test room with inlet slot, outlet slot and guiding plates.
2
D ,- -.
4.375 0
Q) 0 3.75 > u . 1
Q) i 3.125 0)
0 I Return f low c:: I along floor Q)
l Ill( (.)
1.875 0 -m 1.625 - 0
Q)
1.25 c:: u I
0
z
X 3.45 3 .70 4 .80
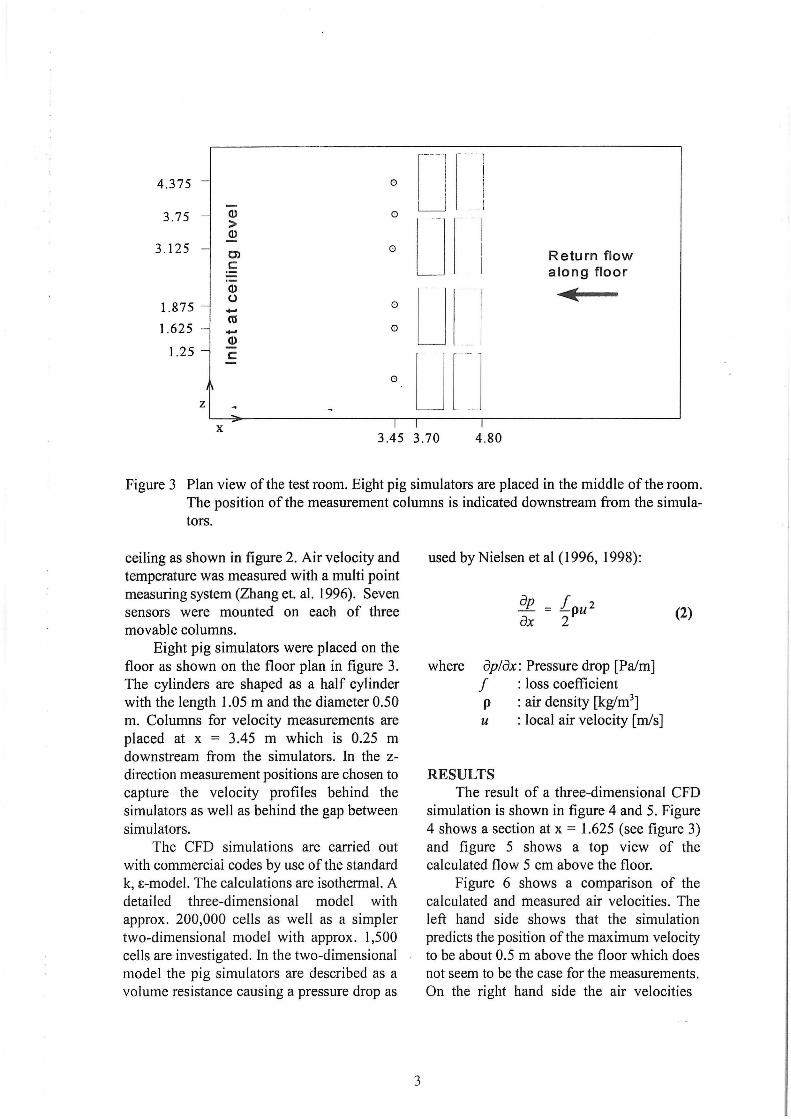
Figure 3 Plan view of the test room. Eight pig simulators are placed in the middle of the room. The position of the measurement columns is indicated downstream from the simulators.
ceiling as shown in figure 2. Air velocity and temperature was measured with a multi point measuring system (Zhang et. al. 1996). Seven sensors were mounted on each of three movable columns.
Eight pig simulators were placed on the floor as shown on the floor plan in figure 3. The cylinders are shaped as a half cylinder with the length 1.05 m and the diameter 0.50 m. Columns for velocity measurements are placed at x = 3.45 m which is 0.25 m downstream from the simulators. In the zdirection measurement positions are chosen to capture the velocity profiles behind the simulators as well as behind the gap between simulators.
The CFD simulations are carried out with commercial codes by use of the standard k, t-model. The calculations are isothermal. A detailed three-dimensional model with approx. 200,000 cells as well as a simpler two-dimensional model with approx. 1,500 cells are investigated. In the two-dimensional model the pig simulators are described as a volume resistance causing a pressure drop as
3
used by Nielsen et al (1996, 1998):
fpu2 2
where Bp lax: Pressure drop [Palm] f : loss coefficient p : air density [kg/m3
]
u : local air velocity [ m/s]
RESULTS
(2)
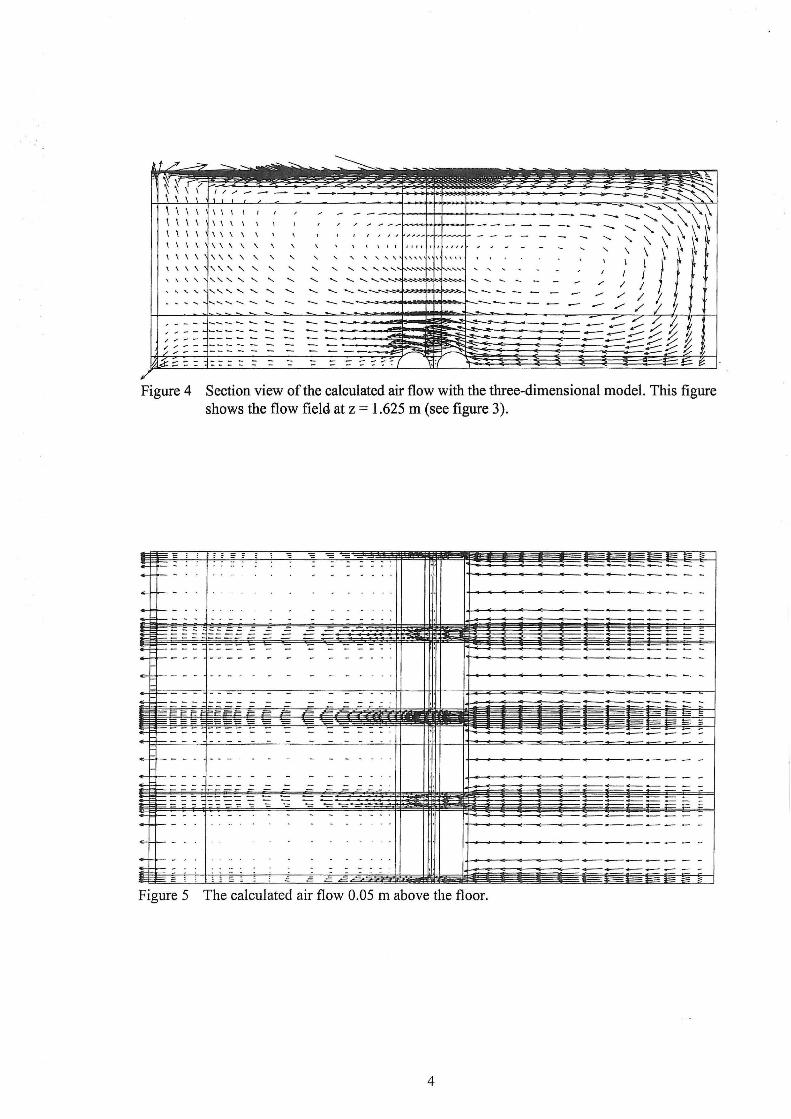
The result of a three-dimensional CFD simulation is shown in figure 4 and 5. Figure 4 shows a section at x = 1.625 (see figure 3) and figure 5 shows a top view of the calculated flow 5 cm above the floor.
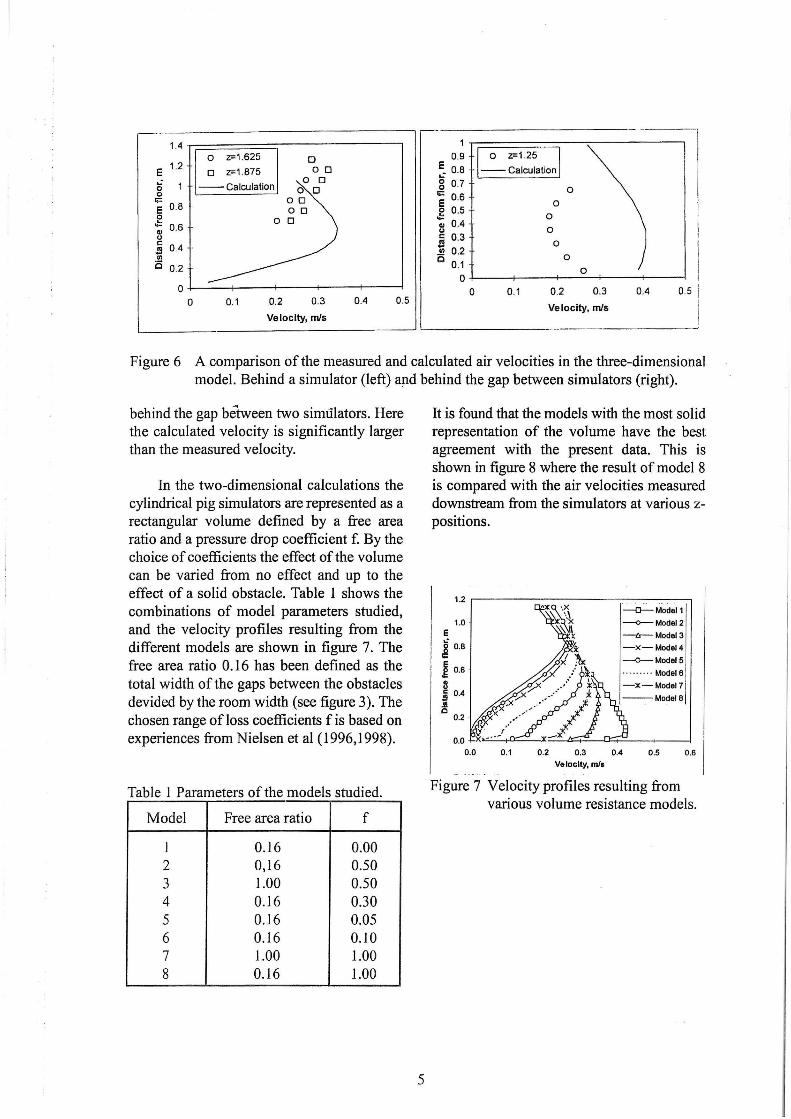
Figure 6 shows a comparison of the calculated and measured air velocities. The left hand side shows that the simulation predicts the position of the maximum velocity to be about 0.5 m above the floor which does not seem to be the case for the measurements. On the right hand side the air velocities
----- ----.......... "-I I ---- --.. ....... '-.. \ \ \ \ \ \ \ \ I ...... " \.
Figure 4 Section view of the calculated air flow with the three-dimensional model. This figure shows the flow field at z = 1.625 m (see figure 3).
Figure 5 The calculated air flow 0.05 m above the floor.
4
1.4 r.=====:;--'------, E 1.2
5 0
c;:: E 0.8 ,g .. 0.6 0
.§ 0.4 .. i5 0.2
0
0 z=1.625 D
D z=1 .875 0 D 0 D
--Calculation 0 D
0.1
OD OD
0 D
0.2 0.3
Velocity, m/s
0.4 0.5
0 z=1.25
--Calculation
0
0
0
0
Velocity, m/s
Figure 6 A comparison of the measured and calculated air velocities in the three-dimensional model. Behind a simulator (left) and behind the gap between simulators (right).
behind the gap between two simulators. Here the calculated velocity is significantly larger than the measured velocity.
In the two-dimensional calculations the cylindrical pig simulators are represented as a rectangular volume defined by a free area ratio and a pressure drop coefficient f. By the choice of coefficients the effect of the volume can be varied from no effect and up to the effect of a solid obstacle. Table 1 shows the combinations of model parameters studied, and the velocity profiles resulting from the different models are shown in figure 7. The free area ratio 0.16 has been defined as the total width of the gaps between the obstacles devided by the room width (see figure 3). The chosen range of loss coefficients f is based on experiences from Nielsen et al (1996,1998).
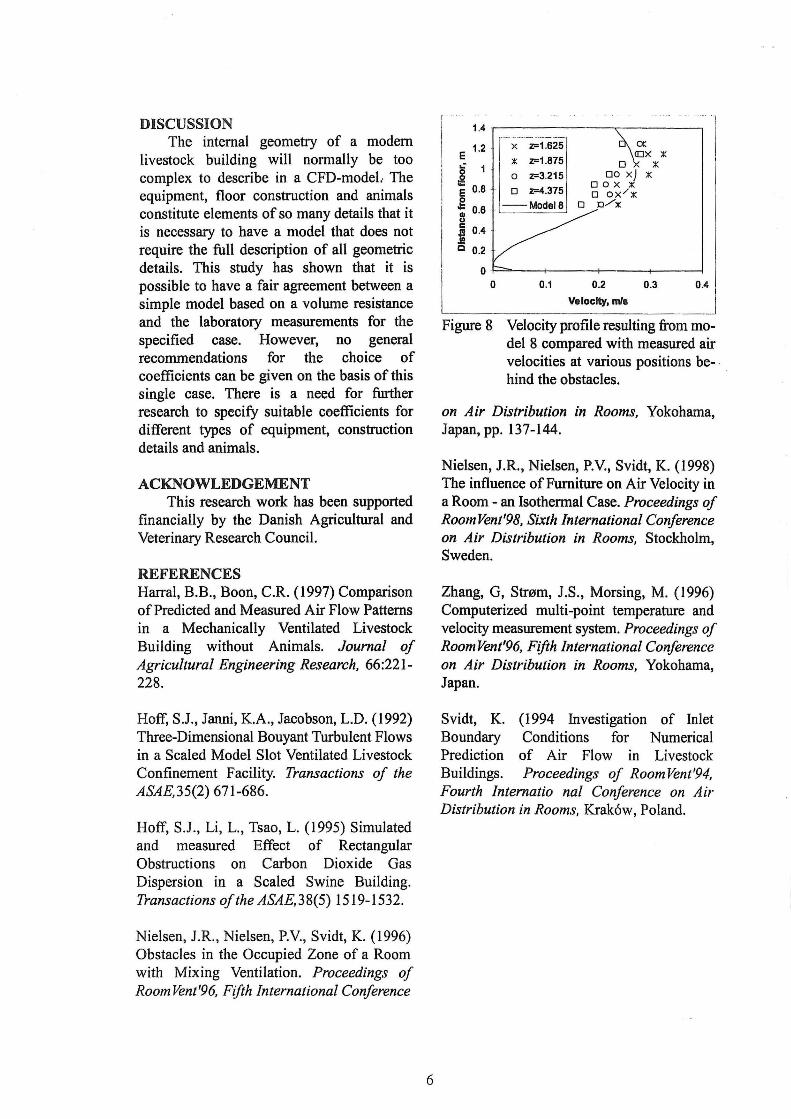
It is found that the models with the most solid representation of the volume have the best agreement with the present data. This is shown in figure 8 where the result of model 8 is compared with the air velocities measured downstream from the simulators at various zpositions.
1.2 ·,------------::-:--::-:.c-. ---,
1.0 E 1 0.8
~ 0.8
B .5 0.4 .11 c
0.0 0.0
---o- Model1
--<>---- Model 2
0.2 0.3 0.4 0.5 0.8 1~ Velocity, m/a
Figure 7 Velocity profiles resulting from various volume resistance models.
DISCUSSION The internal geometry of a modern
livestock building will normally be too complex to describe in a CFD-modeL The equipment, floor construction and animals constitute elements of so many details that it is necessary to have a model that does not require the full description of all geometric details. This study has shown that it is possible to have a fair agreement between a simple model based on a volume resistance and the laboratory measurements for the specified case. However, no general recommendations for the choice of coefficients can be given on the basis of this single case. There is a need for further research to specify suitable coefficients for different types of equipment, construction details and animals.
ACKNOWLEDGEMENT This research work has been supported
financially by the Danish Agricultural and Veterinary Research Council.
REFERENCES Harral, B. B., Boon, C.R. ( 1997) Comparison of Predicted and Measured Air Flow Patterns in a Mechanically Ventilated Livestock Building without Animals. Journal of Agricultural Engineering Research, 66:221-228.
Hoff, S.J., Janni, K.A., Jacobson, L.D. (1992) Three-Dimensional Bouyant Turbulent Flows in a Scaled Model Slot Ventilated Livestock Confinement Facility. Transactions of the ASAE,35(2) 671-686.
Hoff, S.J., Li, L., Tsao, L. (1995) Simulated and measured Effect of Rectangular Obstructions on Carbon Dioxide Gas Dispersion in a Scaled Swine Building. Transactions of the ASAE,38(5) 1519-1532.
Nielsen, J.R., Nielsen, P.V., Svidt, K. (1996) Obstacles in the Occupied Zone of a Room with Mixing Ventilation. Proceedings of Room Vent'96, Fifth International Conference
Figure 8 Velocity profile resulting from model 8 compared with measured air velocities at various positions be- -hind the obstacles.
on Air Distribution in Rooms, Yokohama, Japan,pp. 137-144.
Nielsen, J.R., Nielsen, P.V., Svidt, K. (1998) The influence of Furniture on Air Velocity in a Room - an Isothermal Case. Proceedings of Room Vent'98, Sixth International Conference on Air Distribution in Rooms, Stockholm, Sweden.
Zhang, G, Stmm, J.S., Morsing, M. (1996) Computerized multi-point temperature and velocity measurement system. Proceedings of Room Vent'96, Fifth International Conference on Air Distribution in Rooms, Yokohama, Japan.
Svidt, K. (1994 Investigation of Inlet Boundary Conditions for Numerical Prediction of Air Flow in Livestock Buildings. Proceedings of Room Vent'94, Fourth Intematio nal Conference on Air Distribution in Rooms, Krak6w, Poland.
RECENT PAPERS ON INDOOR ENVIRONMENTAL ENGINEERING
PAPER NO. 79 : P.V. Nielsen: Design ofLocal Ventilation by Full-Scale and Scale Modelling Techniques. ISSN 1395-7953 R97 43.
PAPER NO. 80 : P. Heiselberg, K. Svidt, H. Kragh: Application of CFD in Investigation of Ventilation Strategies for Improvement of Working Environment in a Waste Incineration Plant.ISSN 1395-7953 R9745 .
PAPER NO. 81: P. Heiselberg , C. Topp : Removal of Airborne Contaminants from a Sw1ace Tank by a Push-Pull System. ISSN 1395-7953 R97 46.
PAPER NO. 82 : P. Heiselberg : Simplified Method for Room Air Distribution Design . ISSN 1395-7953 R9747.
PAPER NO. 83 : L. Davidson , ev. Nielsen : A Study ofLaminar Backward-Facing Step Flow. I SSN 1395-7953 R9802 .
PAPER NO. 84 : P.V. Nielsen : Aitflow in a World Exposition Pavilion Studied by Scale-Model Experiments and Computational Fluid Dynamics. ISSN 1395-7953 R9825.
PAPER NO. 85: P.V. Nielsen: Stratified Flow in a Room with Displacement Ventilation and Wall-Mounted Air Terminal Devices. ISSN 1395-7953 R9826 .
PAPER NO. 86 : P.V. Nielsen: The Selection of Turbulence Models for Prediction of Room Aitflow. ISSN 1395-7953 R9828 .
PAPER NO. 87 : K. Svidt, G. Zhang , B. Bjerg : CFO Simulation of Air Velocity OistriiJution in Occupied Livestock Buildings . ISSN 1395-7953 R9831.
PAPER NO. 88 : P. V. Nielsen , T. Tryggvason : Computational Fluid Dynamics and Building Energy Petformance Simulation. ISSN 1395-7953 R9832 .
PAPER NO. 89 : K. Svidt, B. Bjerg , S. Morsing, G. Zhang : Modelling of Air Flow through a S/attecl Floor by CFO. ISSN 1395-7953 R9833 .
PAPER NO. 90 : J.R. Nielsen , P.V. Nielsen , K. Svidt: The Influence of Furniture on Air Velocity in a Room- An Isothermal Case. ISSN 1395-7953 R9843 .
PAPER NO. 91 : P. Lengweiler, J.S. Stnom, H. Taka i, P. Ravn, P.V. Nielsen , A. Maser: Oust Load on Sutfaces in Animal Buildings: An Experimental Measuring Method. ISSN 1395-7953 R9844 .
PAPER NO. 92 : P. Lengweiler, P.V. Nielsen , A. Maser, P. Heiselberg , H. Takai : Deposition and Resuspension of Patticles: Which Parameters are Important? ISSN 1395-7953 R9845 .
PAPER NO. 93: C. Topp, P.V. Nielsen , P. Heiselbe1·g, L.E. Sparks , E.M. Howard , M. Mason : Experiments on Evaporative Emissions in Ventilated Rooms. ISSN 1395-7953 R9835 .
PAPER NO. 94 : L. Davidson, P.V. Nielsen : A Study of Low-Reynolds NumiJer Effects in Backward-Facing Step Flow using Large Eddy Simulations . ISSN 1395-7953 R9834 .
Complete list of papers: http://iee. civil.auc. dkli6/publliee. html
ISSN 1395-7953 R9831
Dept. of Building Technology and Structural Engineering