Page 1
L AD-76i 217
THE SIGNIFICANCE O# MATERI-AL DUCTILITYTO THE RELIABILITY AND LOAD CARRYINGCAPACITY -OF PEAK PERFOR-MANC-ESTRUCTURES
Volker Weiss, er al
-Syracuse Univyxsity
Prepared- for:
'Naval Air Sys4tembs Command
January 1973
DISTRIBUTED BY:
Matil TochkcaI Infrmatin SevceU. S. DEPAFTMEKt OF COMMERCE5285-Port Royal Road, Springfield Va. 22151
Page 2
DMUZKTCONTROL qxAtA it
9049imaIrslo ACTIVIV " e*V-_10
Syracase University, Off Ice of "psred Propus __________
T SIGX1YICAXM. CF *?P7Z1A bICUIY T0 TE RELTABU.ITY N LOAD -CAR IMWACaTi -OPFTAK Poloww s maST uCTUEs (u)
a.. aoa-colorrm "eit (g2~w o Poomq stabmhowdowe
Final Report -(I Jainuary i-972 to 31 December 1972)3' k~ Fbe A4.ITMO I~t7. m WM Ses -0
Volker VeiisH. Se~gupta1W. -Sanford . . At .. ug#-
.. P~k 0g. 6,S14L , -January 1973 I 26
so. COMtXaCi On ... M. sm. omsm!AT*Ns amg-ow-s ueW60
W00019-72-C-O2l46- P*0j1ECT. TASK. AMD WOF,4 umr MS-VW-1705-F173
c. Soo ELEMENT 00. .armftA RLPI' MOMh£'V~tF
This document has been~ approved for public release and sale,, its distributionfIs unlimaited.
I s. SUIPLI.&WICKTAN't NOYCrsJ 12. OPSPORNGN iMLITANY AC aIIy
NAVAL AI~k SYSTM CWWDP epartment of the Navy
IS, gSTRC: IWashi.ngton', D.C.'The relationships between fracture toughness, flow stress and material ductility
-were' studied for the high strength steels, Dj6AC and 300K, each heat 9treated to 33strength levels. In addition to the experimental pazt of the mtdy which included
bia);ial ductility test, notche-tensile test and fracture tbughness iest the theore-tical studies, to 'develop an analytical basi. for correlat16ns between fracturetoughness and- flow propeities of solids, were continued.The fracture ductility was found to decrease significantly on going from thne uri-.
axial stress state to the plane strain stress state to the balan -ced biaxial condi-tion. k strong influence of the surface finish was noted. This gave rise to somescatter, particularly-for the bulge tests. More experimentation is planned in thecontinuing program to clarify this point.. The notch sensitivity decreases with n-creasing tempering temperature for both materials, with a reduction. being some-what greater for 300.4 steel. The values of the Neuber micro support effect cohst-p*, were determined and found to lie between 0.0002 to 0.0014 inches.The analytical studies suggested that the correlation between fracture toughness
and ductility should have the general-form K10,-AeiEfs4;ci where E is the modulus of,elasticity, s the shape -factor for the pla-stic zone, ei the effective fracturestrain corresponding t- the stress state i and Aci a corresponding constant. Theexperim~ental results were found to be in good agreement with the bulge ductilitycorrelation. The analytical correlations were also extended to the plane stressfracture condition,
FORM Unclasaifiedrecuity UlnaaificatuOft
Page 3
Unclassified
f racturg; ftov stes --cuetug.,es
multiaxial 'fracture, strain r- mnotch sensitivity
srres-i ratios a and -6;j I [stress strain relation-exponent, IInlf;
JNeuberfsmikro-support effect cofistafit pIj Iplastic zone shape factor 's';-
61ltra-high- strength. waterialt;
D6AC steel (ft 30i Xt 46.5i R, 42.51-jC- C C
30D.Ifstee, (R~ 51.5, R~ 473 R 39.0).1
U~nclassifiedSocurity Claaification
Page 4
THE SIGNIICCaftC O? XUMaERA DUTIL11,1Y
TO THE RELIaBILITX? AND LOAD CAWRYUfGV C~aACiTY op PEm PER.FoRywa STucTuRES (u)
Final Report
(1 January 1972-to 31 114cember 1972)
Janiuary 1973
r D'
ByDEYVolker Weis
H.Sengtipta r M t IHW. Sanford
Prepared under Contract No. N00019-72-C-0214for
Naval Air Systems ConuandDepartment of the Navy
THIS DOCUMENT HAS BEEN APPROVE.''RELEASE AND SALE, ITS DISTRIBUTtO I. EU. -
-* ~ . ~ EVALUATION
IW USyracuse Universit ~
Office of Sponsored Pro R
Department of Chemical Engineering and terials ScienceSyracuse, New YorkMS-VW-1705-FI73
Page 5
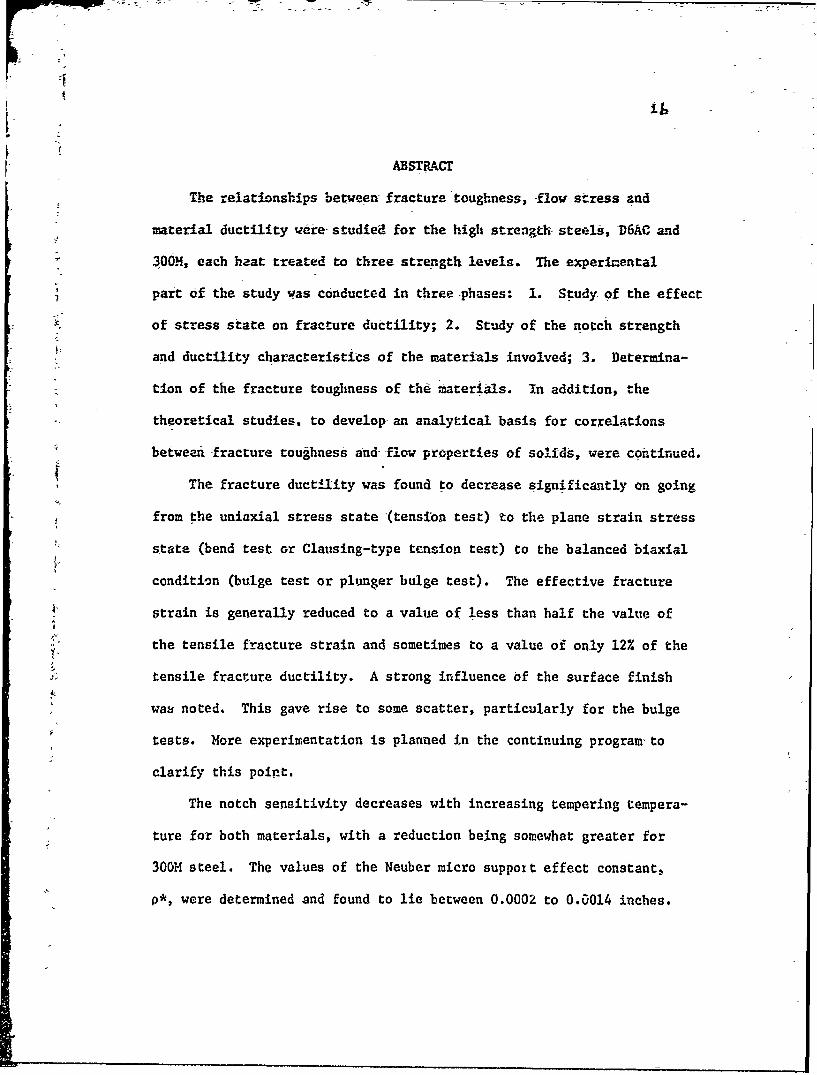
ABSTRACT
The relationships between fracture toughness, flow stress and
material ductility were- studied for the high strength- steels, D6AC and
306H, each heat treated to three strength levels. The experimental
part of the study was conducted in three phases: 1. Study of the effect
of stress state on fracture ductility; 2. Study of the notch strength
and ductility characteristics of the materials involved; 3. Determina-
tion of the fracture toughness of the materials. In addition, the
theoretical studies, to develop an analytical basis for correlations
between fracture toughness and flow properties of solids, were continued.
The fracture ductility was found to decrease significantly on going
from the uniaxial stress state (tension test) to the plane strain stress
state (bend test or Clausing-type tension test) to the balanced biaxial
condition (bulge test or plunger bulge test). The effective fracture
strain is generally reduced to a value of less than half the value of
the tensile fracture strain and sometimes to a value of only 12% of the
tensile fracture ductility. A strong influence of the surface finish
was noted. This gave rise to some scatter, particularly for the bulge
tests. More experimentation is planned in the continuing program to
clarify this point.
The notch sensitivity decreases with increasing tempering tempera-
ture for both materials, with a reduction being somewhat greater for
300H steel. The values of the Neuber micro suppoit effect constant,
p*, were determined and found to lie between 0.0002 to 0.0014 inches.
Page 6
711
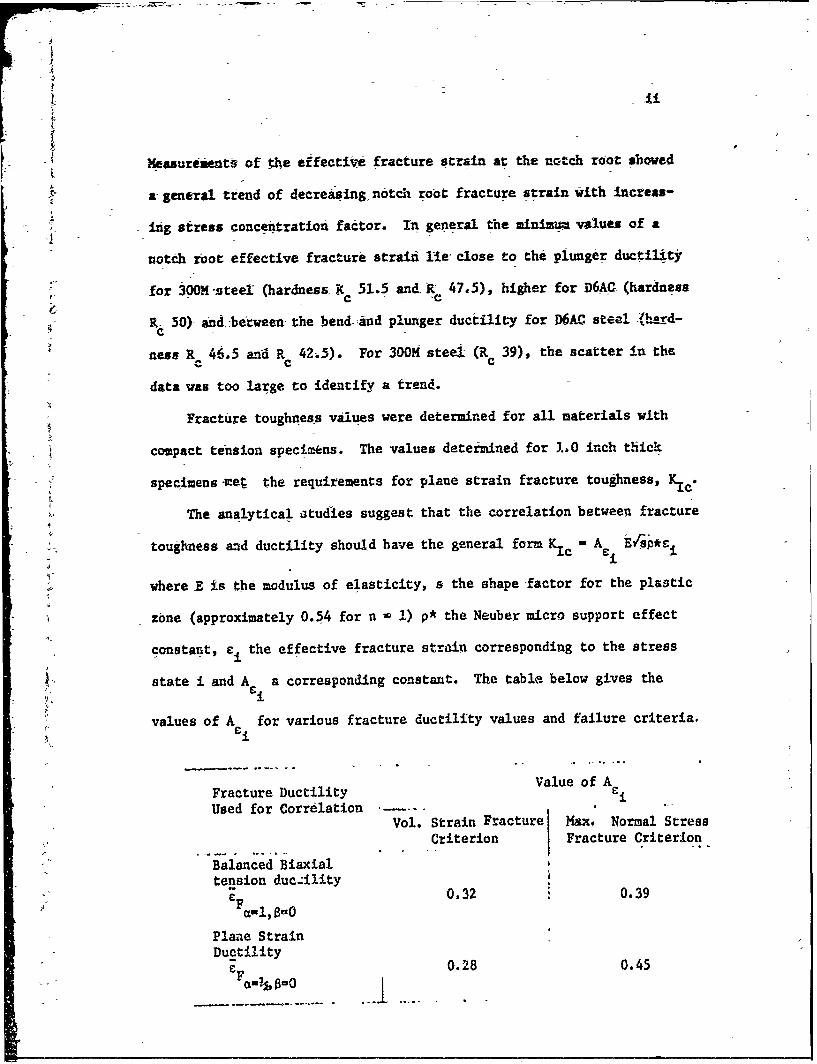
Keasureients of he effective, fracture strain at the notch root shoved
&-general trend of decreasing, notch ro-ot fracture strain wi4th incteas-
ifig stress concentration factor. In general the minimum values of a
notch toot effective fracture straini lie close to thei plunger ductility
for 300M -zteel (hardness, 9 51.5 and 'R 47.5), higher for 6AG. (hardnessc C
R- 50)- and.:berween- the bend.:and plunger ductility for M6AC steel (adc
ness R C46.5 and R c4245). For 30014 ste1. (R c39), the scatter in the
data was too large to identify a trend.
Fracture toughness values were determined for all materials with
compact tension specim+ns. The values determined for 1.0 inch thick
specimens-met the requivements for plane strain fracture toughness, K1c
The analytical atudies suggest that the correlation betweeAi fracture
toughness and ductility should have the general form Kc A tvE 1pcL
where ZE is the modulus of elasticity, s the shape 'factor for the plas3tic
zone (approximately 0.54 for n - 1) p* the Neuber micro support effect
constanit, Li the effective fracture strain corresponding to the stress
state i and A a corresponding constant. The table. below gives the
values of A Cfor various fracture ductility values and failure criteria.
Fracture Ductility Value of Ae
Used for Correlation .-
Vol. Strain Fracture Max* Normal StressCriterion Fracture Criterion
Balanced Biaxialtension ducAlity
£0.32 0.39
Plane Strain
Ductility0.8.4e Fan% On 0f28 0.4
Page 7
ii
The experimental results were found to be In good agreement with the
bulge ductility correlation but in somewhat poor agreement t:ith the
bend ductilicy correlation. Surface finish effects in the measurements
of the bend ductility could be partly responsible for this discrepancy.
The analytical correlations were also extended to the plane stress
fracture condition. However, reliable estimates of the fracture
strain corresponding to the plane stress condition ahead of a crack
could not be mgde. Furthermore an experimental determination of the
true plane stress fracture toughness is difficult. Nevertheless, it
is anticipated that similar correlations can be estublished for
plane stress conditions or mixed mode fracture.
Page 8
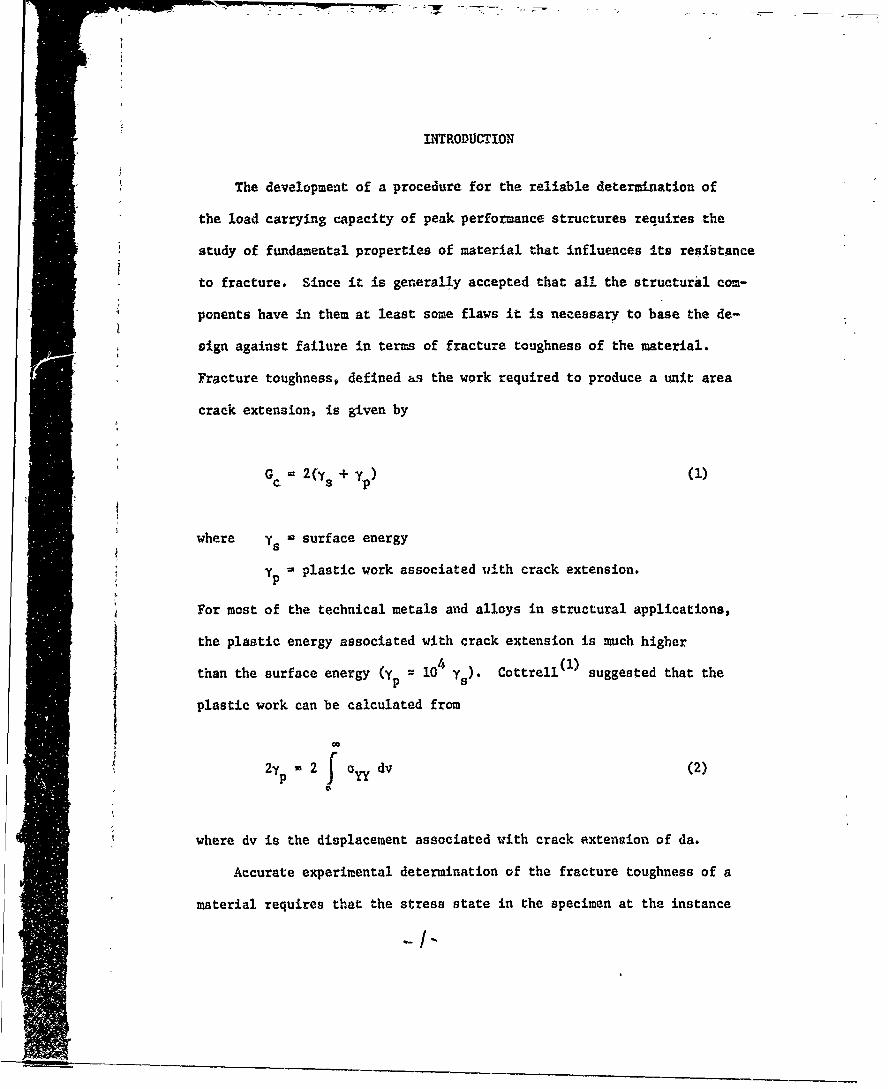
M RODUcTION
The development of a procedure for the reliable determination of
the load carrying capacity of peak performance structures requires the
study of fundamental properties of material that influences its resistance
to fracture. Since it is generally accepted that all the structural com-
ponents have in them at least some flaws it is necessary to base the de-
sign against failure in terms of fracture toughness of the material.
Fracture toughness, defined as the work required to produce a unit area
crack extension, is given by
Gc = 2(y +y) (1)
where Ys 0 surface energy
p= plastic work associated with crack extension.
For most of the technical metals and alloys in structural applications,
the plastic energy associated with crack extension is much higher
than the surface energy (yp = 104 Ys). Cottrell(I) suggested that the
plastic work can be calculated from
2y 2 a dv (2)foydp Y
where dv is the displacement associated with crack extension of da.
Accurate experimental determination of the fracture toughness of a
material requires that the stress state in the specimen at the instance
-/-.
Page 9
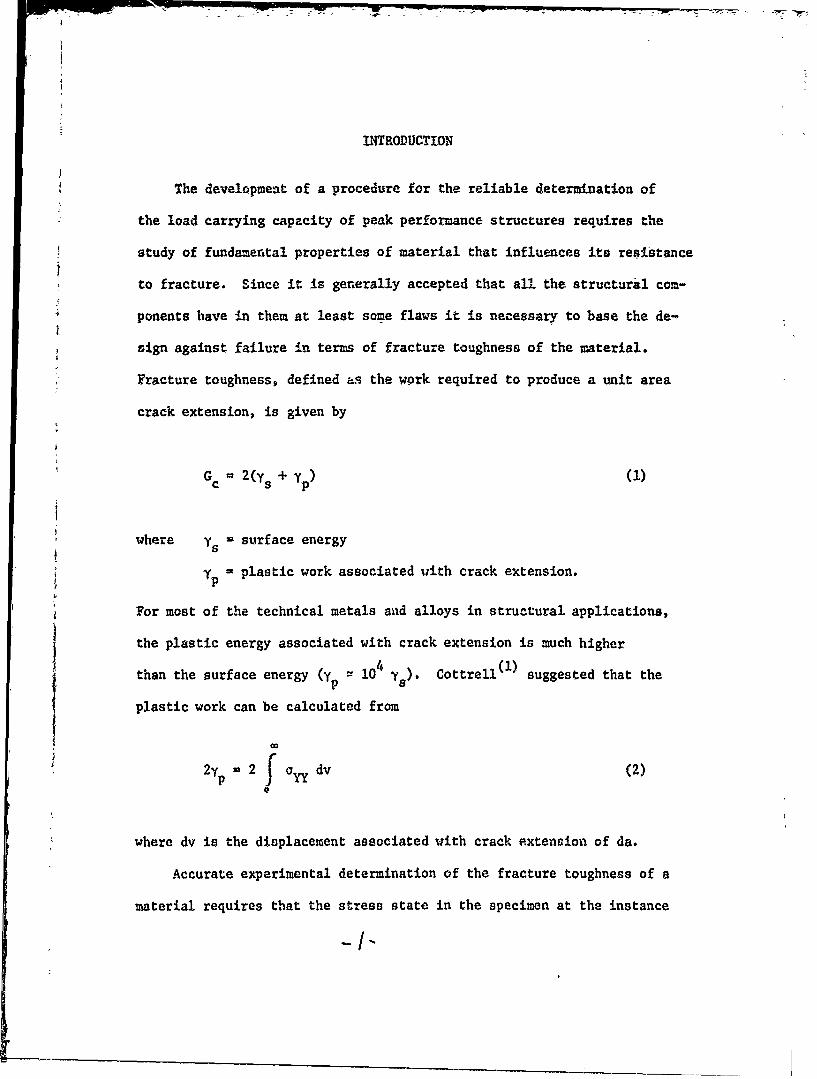
INTRODUCTION
The development of a procedure for the reliable determination of
the load carrying capacity of peak performance structures requires the
study of fundamental properties of material that influences its resistance
to fracture. Since it is generally accepted that all the structural com-
ponents have in them at least some flaws it is necessary to base the de-
sign against failure in terms of fracture toughness of the material.
Fracture toughness, defined as the work required to produce a unit area
crack extension, is given by
Gc =2(y +y) (1)
where Ys W surface energy
y = plastic work associated with crack extension.
For most of the technical metals and alloys in structural applications,
the plastic energy associated with crack extension is much higher
than the surface energy (y -- 104 Ys). Cottrell(I) suggested that the
plastic work can be calculated from
C0
2yp 0 2 aOy dv (2)
where dv is the displacement associated with crack extension of da.
Accurate experimental determination of the fracture toughness of a
material requires that the stress state in the specimen at the instance
-I[-.
Page 10
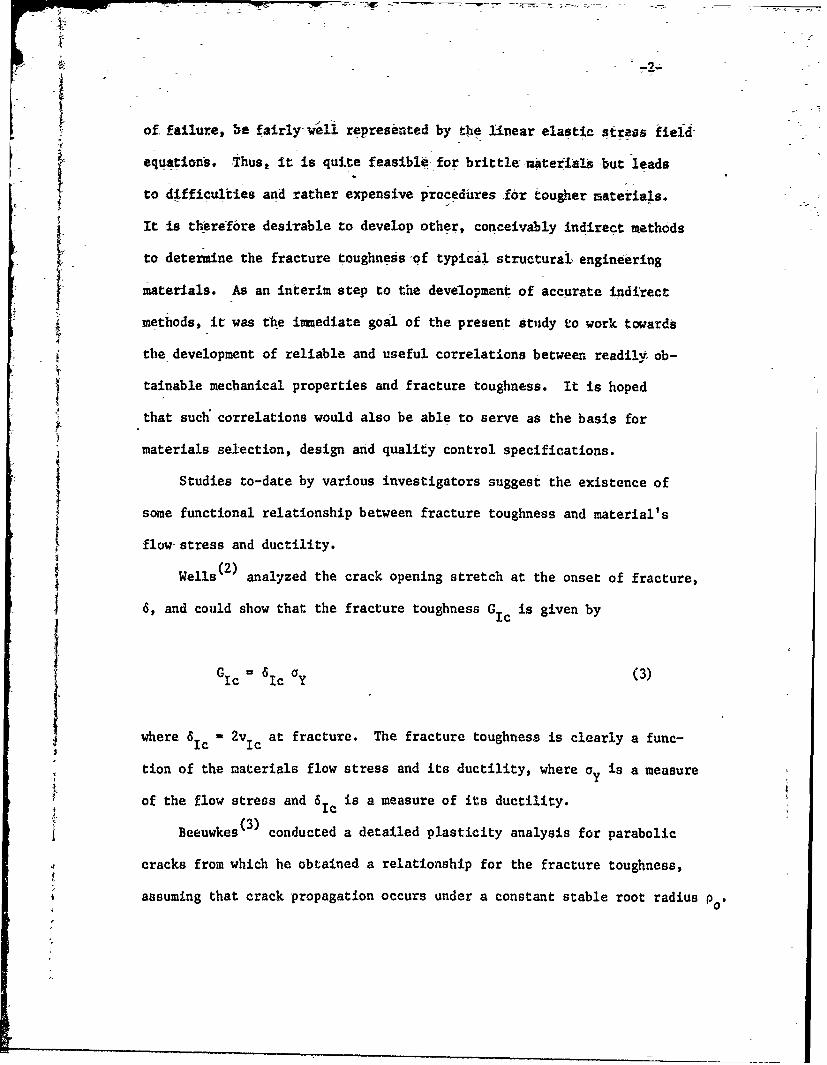
of failure, be fairly- weli represented by the linear elastic stress field-
equations. Thus, it is quite feasiblO, for brittle- raterlas but leads
to difficulties and rather expensive procedures .for tougher materials.
It is therefbre desirable to develop other, conceivably indirect methods
to determine the fracture toughness 'of typical structural enginetering
materials. As an interim step to the development of accurate indirect
methods, it was the immediate goal of the present Sttudy to work towards
the development of reliable and useful correlations between readily ob-
tanable mechanical properties and fracture toughness. It is hoped
that such" correlations would also be able to serve as the basis for
materials selection, design and quality control specifications.
Studies to-date by various investigators suggest the existence of
some functional relationship between fracture toughness and material's
flow stress and ductility.
Wells (2) analyzed the crack opening stretch at the onset of fracture,
6, and could show that the fracture toughness Gic is given by
G = 6 c ay (3)
where 61c - 2v1 c at fracture. The fracture toughness is clearly a func-
tion of the materials flow stress and its ductility, where a is a measure iYof the flow stress and 6 is a measure of its ductility.
Ic
Beeuwkes conducted a detailed plasticity analysis for parabolic
cracks from which he obtained a relationship for the fracture toughness,
assuming that crack propagation occurs under a constant stable root radius po.
Page 11
-3-
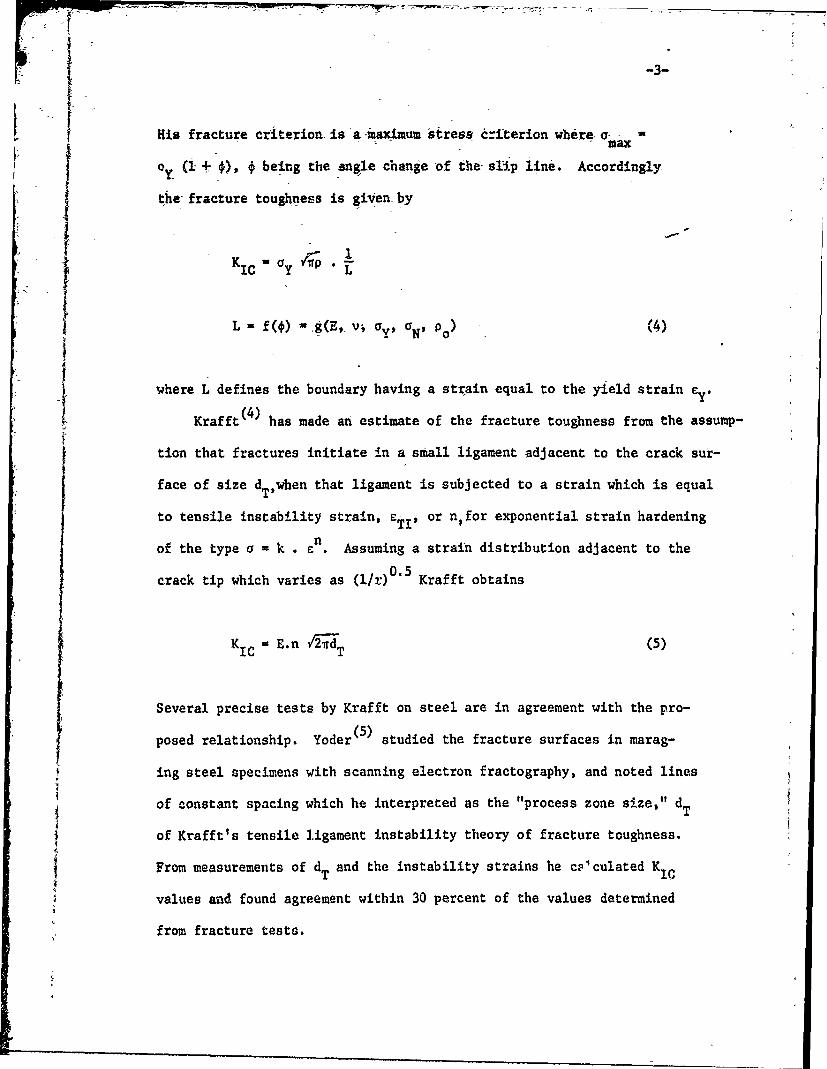
I His fracture criterion is-a-maximum stress c=iterion where-q-max
I (1 + 0) * being the angle change of the slip line. Accordingly
the- fracture tougness is given, by
(/
K uca~ 1IC Y L
L - f(0) g(E,, v av, N ) (4)I0where L defines the boundary having a strain equal to the yield strain
Krafft(4) has made an estimate of the fracture toughness from the assump-
tion that fractures initiate in a small ligament adjacent to the crack sur-face of size d Vwhen that ligament is subjected to a strain which is equal
to tensile instability strain, et,, or n~for exponential strain hardening
nof the type a - k . en . Assuming a strain distribution adjacent to the
crack tip which varies as (/r) 0.5 Krafft obtains
K E .n 2 d (5)IC T
Several precise tests by Krafft on steel are in agreement with the pro-
posed relationship. Yoder (5) studied the fracture surfaces in marag-
ing steel specimens with scanning electron fractography, and noted lines
of constant spacing which he interpreted as the "process zone size," dT
of Krafft's tensile ligament instability theory of fracture toughness.
From measurements of dT and the instability strains he co'culated KIC
values and found agreement within 30 percent of the values determined
from fracture tests.
Page 12
-4-
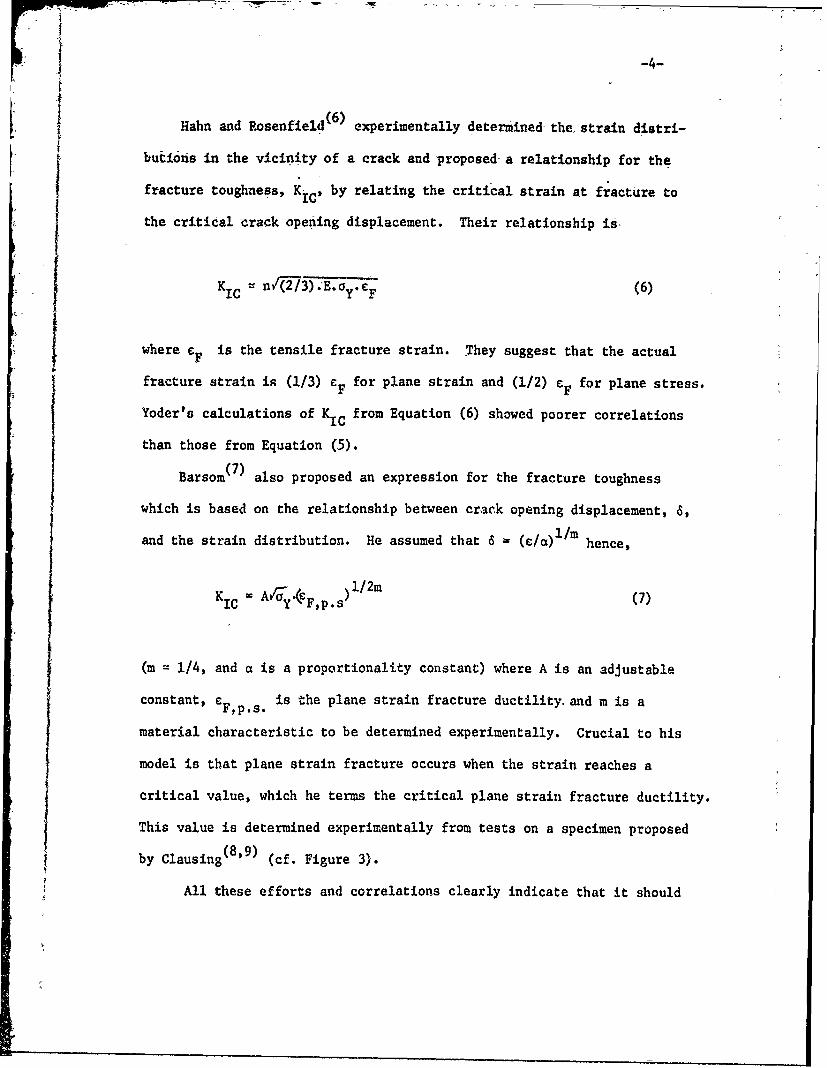
Hahn and Rosenfield ( 6 ) experimentally determined the strain distri-
butions in the vicinity of a crack and proposed a relationship for the
fracture toughness, KtC, by relating the critical strain at fracture to
the critical -crack opening displacement. Their relationship is--
I KIC n/2/3).E. oy. CF (6)
where cF is the tensile fracture strain. They suggest that the actual
fracture strain is (1/3) eF for plane strain and (1/2) cF for plane stress.
Yoder's calculations of KIC from Equation (6) showed poorer correlations
than those from Equation (5).
Barsom (7) also proposed an expression for the fracture toughness
which is based on the relationship between crack opening displacement, 6,
and the strain distribution. He assumed that 6 - /a)I/m hence,
KIC ' A/ay(F,p.s)/ 2m (7)
(m = 1/4, and a is a proportionality constant) where A is an adjustable
constant, cF,p.s. is the plane strain fracture ductility, and m is a
material characteristic to be determined experimentally. Crucial to his
model is that plane strain fracture occurs when the strain reaches a
critical value, which he terms the critical plane strain fracture ductility.
This value is determined experimentally from tests on a specimen proposed
by Clausing(8,9) (cf. Figure 3).
All these efforts and correlations clearly indicate that it should
Page 13
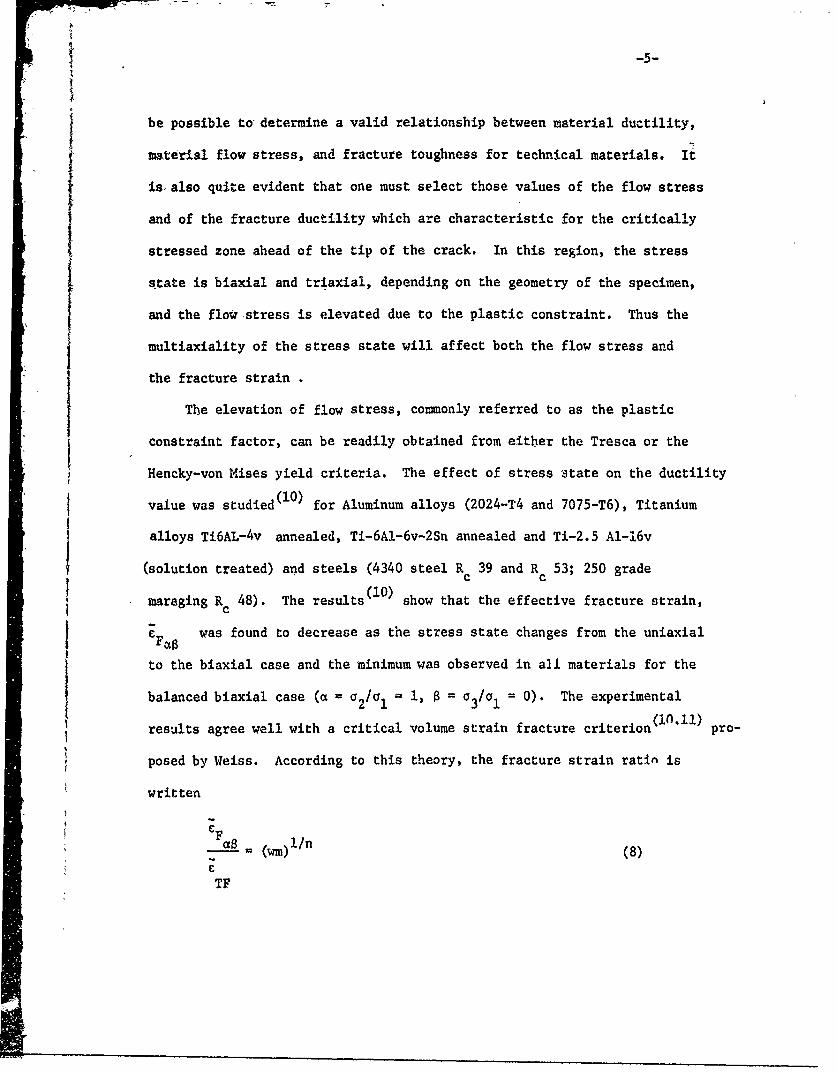
I. be possible to determine a valid relationship between material ductility,
material flow stress, and fracture toughness for technical materials. It
is. also quite evident that one must select those values of the flow stress
and of the fracture ductility which are characteristic for the critically
Istressed zone ahead of the tip of the crack. In this region, the stress
state is biaxial and triaxial, depending on the geometry of the specimen,
and the flow-stress is elevated due to the plastic constraint. Thus the
multiaxiality of the stress state will affect both the flow stress and
the fracture strain ,
The elevation of flow stress, commonly referred to as the plastic
constraint factor, can be readily obtained from either the Tresca or the
jHencky-von Mises yield criteria. The effect of stress state on the ductility
value was studied (10) for Aluminum alloys (2024-T4 and 7075-T6), Titanium
alloys Ti6AL-4v annealed, Ti-6Ai-6v-2Sn annealed and Ti-2.5 Al-16v
(solution treated) and steels (4340 steel Rc 39 and Rc 53; 250 grade
maraging Rc 48). The results ( 0) show that the effective fracture strain,
C Faa was found to decrease as the stress state changes from the uniaxial
to the biaxial case and the minimum was observed in all materials for the
balanced biaxial case (a = a2/a1 . 1, a = = 0). The experimental
results agree well with a critical volume strain fracture criterion (i '10 1 ) pro-
posed by Weiss. According to this theory, the fracture strain ratin is
written
C_ (1/n (8)
TF
Page 14
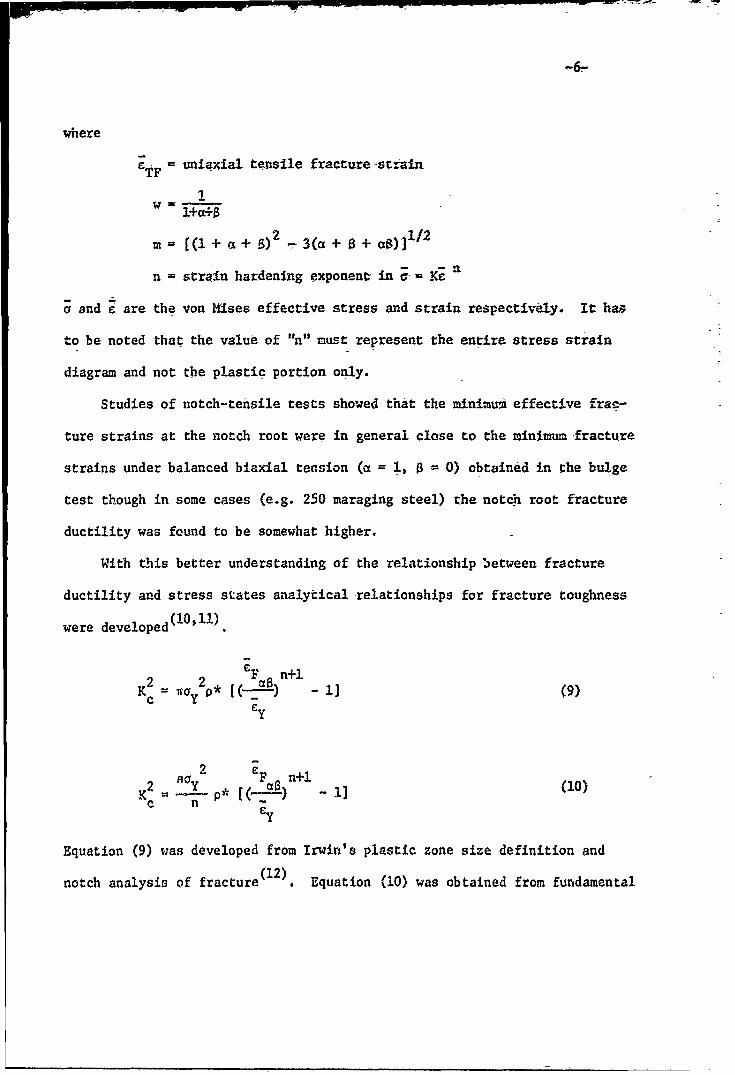
wheree = unia ial tensile fracture -straintF
l +a,-0 2 1/
m (+ a+ 5)2 -3(a+ + )] I2
n = strain hardening exponent in -KC
a and £ are the von Rises effective stress and strain respectively. it has
to be noted that the value of "n" must represent the entire stress strain
diagram and not the plastic portion only.
Studies of notch-tensile tests showed that the minimum effective frac-
ture strains at the notch root were in general close to the minimum fracture
strains under balanced biaxial tension (a = 1, 0 = 0) obtained in the bulge
test though in some cases (e.g. 250 maraging steel) the notch root fracture
ductility was found to be somewhat higher.
With this better understanding of the relationship between fracture
ductility and stress states analytical relationships for fracture toughness
(10,11)were developed
2 2 CF n+lK ny P* [ - 1] (9)
K2 -. 1](0
Cy
2 Ar Y 2 F a n+1 10
Equation (9) was developed from Irwin's plastic zone size definition and
notch analysis of fracture (12 ). Equation (10) was obtained from fundamental
Page 15
energy approach and using notch analysis of fracture. The above correla-
tions were applied ( i )0 in the case of Al 2014 T6 alloy with in&Ifferent
success.
The principal objective of this year's program was concerned with the
development of a design sysrem for definitely idenriiable design situations,
nanly (a) the plane strain iracture toughness of ultra high strength
materials, (b) the plane strain. fracture toughness for zedium strength
structural materials requiring. inordinately large test specimens to obtain
valid KT values, (r.) the fracture toughness under non-plane strain condi-
tions and (d) the load carrying capacity of parts containing finite stress
concentration such as notches, grooves, fillets etr- This required- further
refinement of the analytical formula developed in the last year and per-
forming a nuitber of tests on some selected materials to check the proposed
analysis.
Research experience in the past ( 1 3) has clearly indicated that the
sharp crack fracture mechanics is well suited for the case of ultra high
strength materials and therefore, can- provide an important bench mark for
any correlations between KIC and the materials strength and deformation
characteristics. Our experimental investigations this year were, there-
fore, concerned mainly with ultra high strength materials namely 300H
steel and D6AC steel. To obtain a range of strength levels 3 different
tempers on each of these alloys were carried out and the predictive power
and accuracy of K c and KIc values from the proposed analysis was checked
by comparing with the experimental values. It is also intended to perform
Page 16
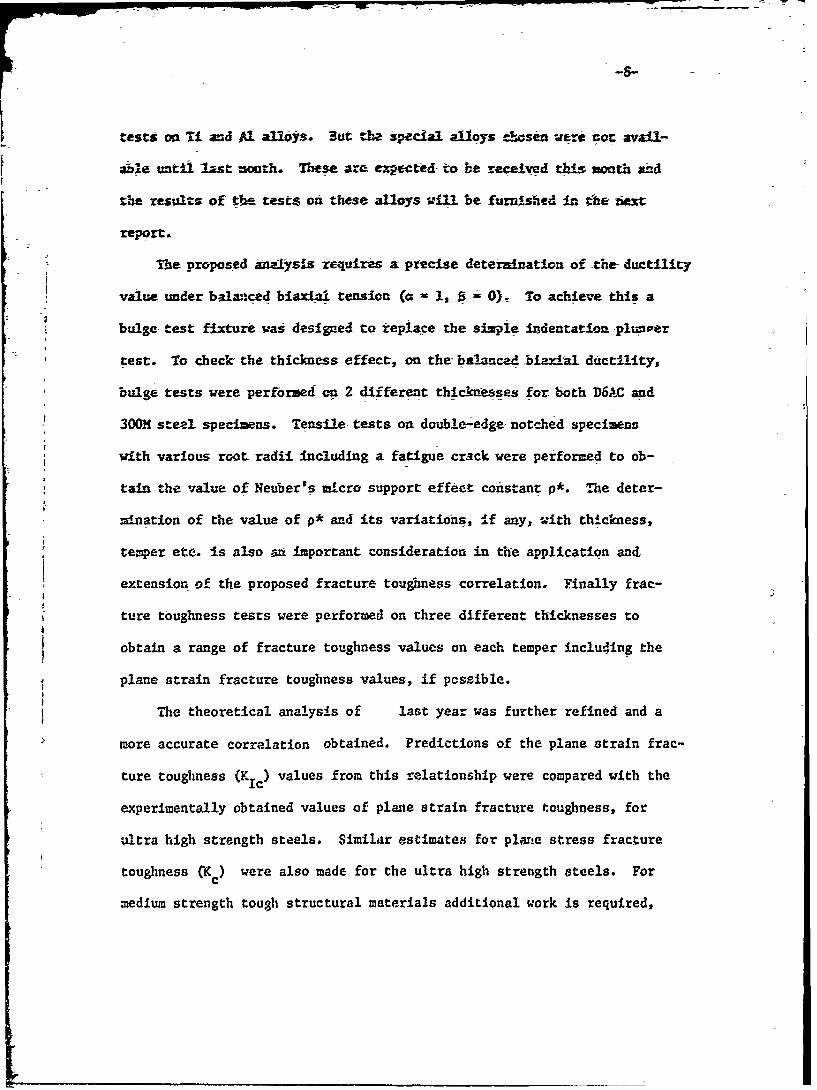
tests oa Ti amd Al alloys. But the special ailipys; chasena were rot avail-
able unt las month. These ae xpected to bereceived this motrh And
the results of tbhe tests on these alloys will be furols'hed In the ie n
report.
The proposed analysis requires a precise deteiauination of -the ductility
value wnder balanced biaxial tension. (a - 1, 0 ). To achieve this a
bulge- test fixture w"s designed to replace the simple indentation plwiser
test, To check-the thickness effect, on the- balanced b iaxial ductility,
bulge tests were performed cn 2 different thicknesses for both M6AC and
300fl steel specimens. Tensile tests on double-edgenotched specimens
with various root radii including a fatigue crack were performed to ob-
tain the value of Neuber's micro support effet constant p*. -The deter-
nadnation of the value of p* and its variations, if any,-with thicitness,
temper etc. Is also ani important consideration in the application and
extension of the proposed fractre toughness correlation. Finally frae-
ture toughness tests were performed on three different thicknesses toi obtain a range of fracture toughness values on each temper inclu4ing the
plane strain fracture toughness values, if possible.
jThe theoretical analysis of last year was further refined and a
more accurate correlation obtained. Predictions of the plane strain frac-
*ture toughness (K IC) values from this relationship were compared with the
experimentally obtained values of plane strain fracture toughness, for
ultra high strength steels. Similair estimates for plarie stress fracture
toughness (K C) were also made for the ultra high strength steels. For
medium strength tough structural materials additional work is required,
Page 17
especialy accurate deteriatis of p*. Ifilge ductiLity tesc vgs per-
* formed on EiY-80 steel and the literature value.m of Its fracture toughnest
reported. This reort contsins the results of t6e experimental aad ania-
lytical studies conducted durifg the repdrtIng year.
Page 18
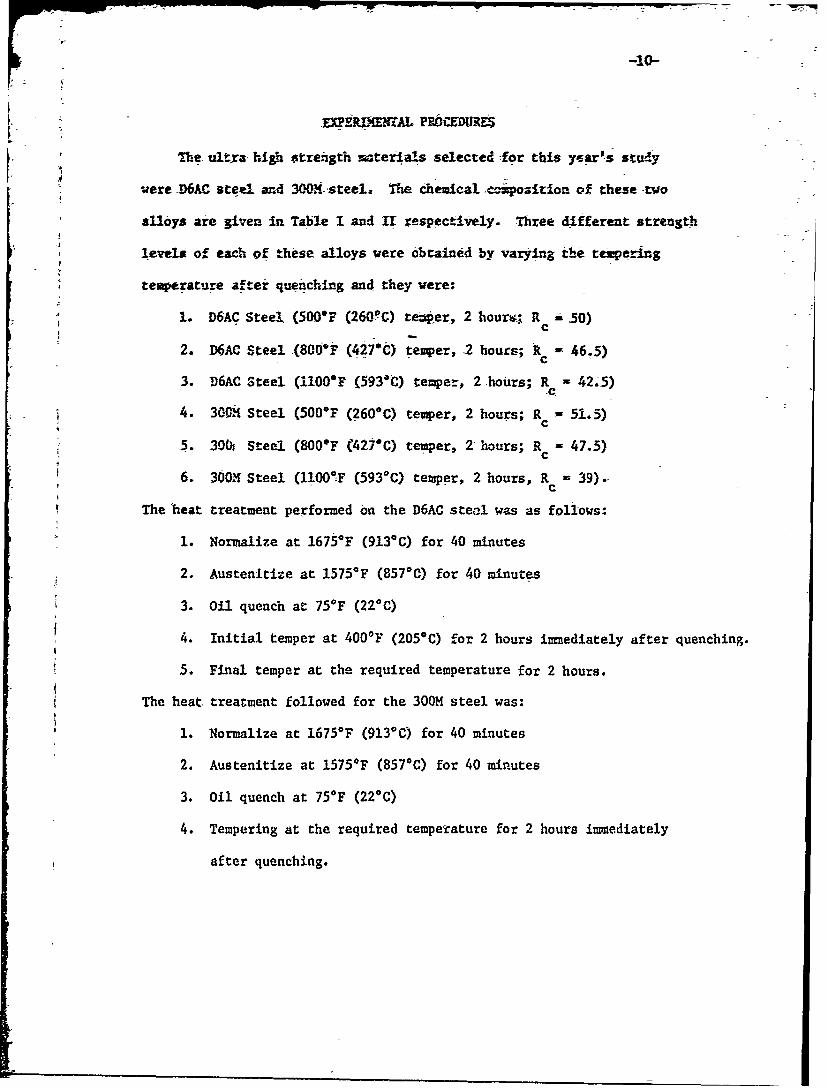
[ P!EVROINAI PRbCEDURE$
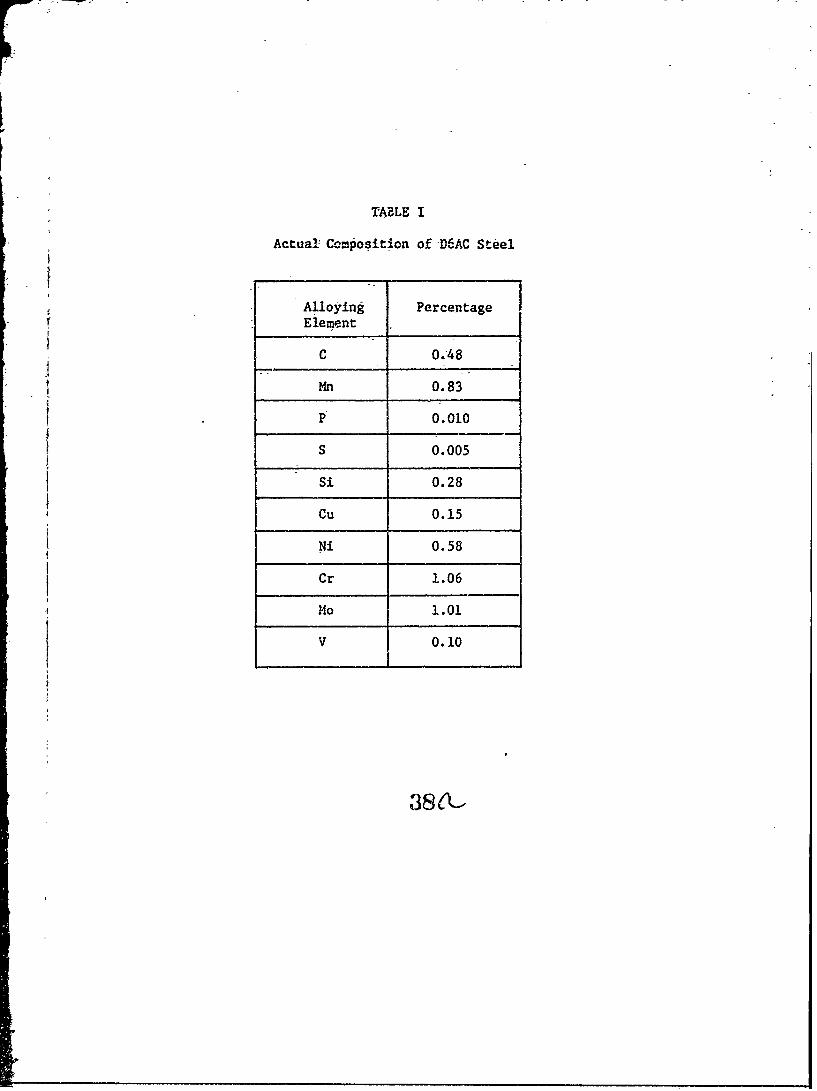
The, ulexa hihtrezhgth materials selectedi for this year' a studywere DCste.d3stee tel The chemical ca mposition of these -twIo
alloys are given ini Table I and- II respectively. Three different strengt~h
levels of each of these alloys were abrained by varying the texpering
temperature after quenching and they were:
1. D6AC Steel~ (500*F (260?C) te4per, 2 hours.4 R 3 0)c
2. _D6AC Steel _(8C0JP' (427 C) temper, .2 hours; R C 46.5)
3. D6AC Steel (lIOO*F (593't) temper, 2 houirs; R 42.-5)
4. 300M Steel (500OF (260*C) temper, 2 hours; R 51.5)C
5.301 Steel (8006F (42!*C) temper, 2-hours; R =47.5)C
6. 30M Steel (1100F (593'C) temper, 2 hours, R =39).
The heat treatment performed on the D6AC steal was as follows:
1. Normalize at 1675F (913*C) for 40 minutes
2. Austenitize at 1575'F (857*0 for 40 minutes
3. Oil quench at 75-F (22-C)
4.. Initial temper at 400*F (205*C) for 2 hours immediately after quenching.
5. Final temper at the required temperature for 2 hours.
The heat treatment followed for the 300M steel was:
1. Normalize at 16'75*F (913*0 ) for 40 minutes
2. Austenitize at 1575*F (857C) for 40 minutes
3. Oil quench at 75*F (22*C)
4. Tempering at the required temperature for 2 hours immediately
after quenching.
Page 19
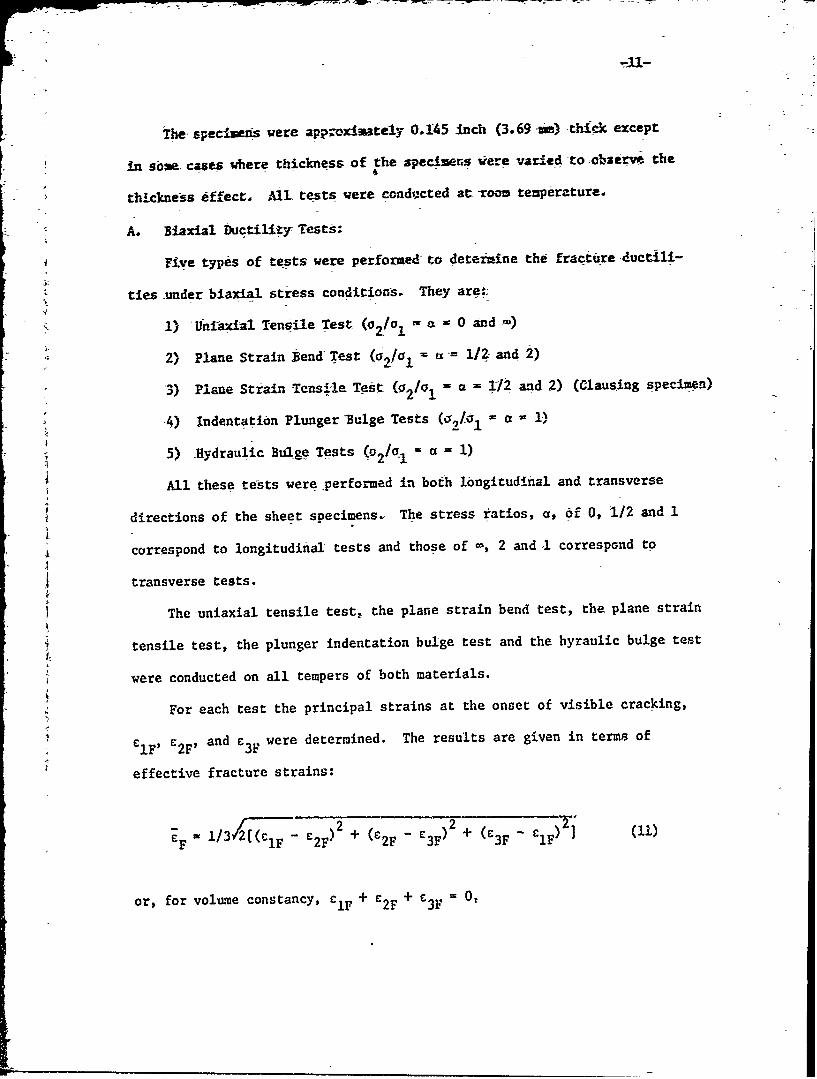
The specimens were approximately 0.145 Inch (3.69 -i) thick except
in sode. cases where thickness of the specimens were varied -to :observe the
thickness effect. AIL tests were condg cted at-room teuperature.
A. Biaxial buctility-Tests:
Five types of tests were performed to determine the fracture ductli-
ties .uder biaxial stress conditions. They are.
1) Unfaxial Tensile Test (2 1a - a 0 and '.
2) Plane Strain tend Test (a 2 f 1 = a -= 1/2 and 2)
3) Plane Strain Tensile Test (o 2 /o! a = 112 and 2) (Clausing specimen)
-4) Indentation Plunger Bulge Tests (qi10_ = a I 1)
5) Hydraulic Bulge Tests (o2 1 a = 1)
All these tests were performed in both longitudinal and transverse
directions of the sheet svecimens. The stress ratios, a, of 0, 1/2 and 1
correspond to longitudinal tests and those of , 2 and 1 correspond to
transverse tests.
The uniaxial tensile test, the plane strain bend test, the plane strain
tensile test, the plunger indentation bulge test and the hyraulic bulge test
were conducted on all tempers of both materials.
For each test the principal strains at the onset of visible cracking,
C IF' '2F' and C3F were determined. The results are given in terms of
effective fracture strains:
C F = 1/32[ 2 + ( 2F - E3F) + (C 3F-l) 2 ] (1)
or, for volume constancy, c,, + C2F + C3F = 0,
Page 20
+ 2 Z 2 )112-[ ej )1 (12) ,
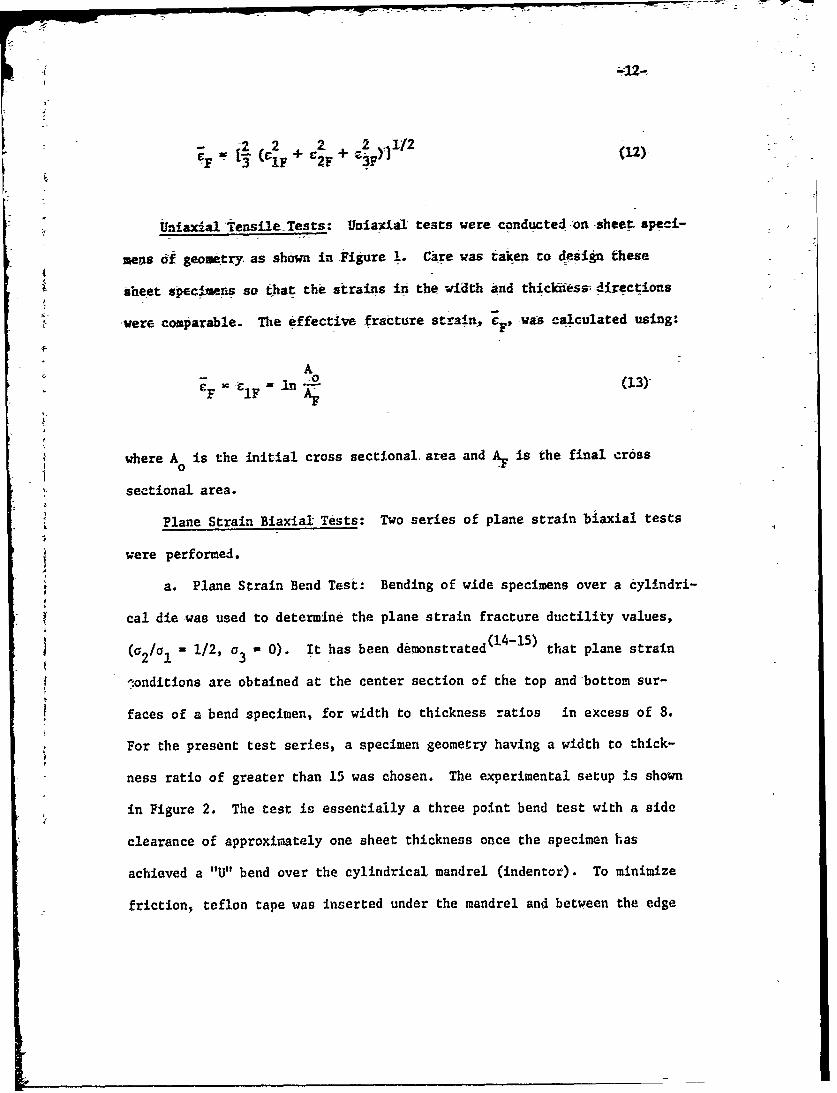
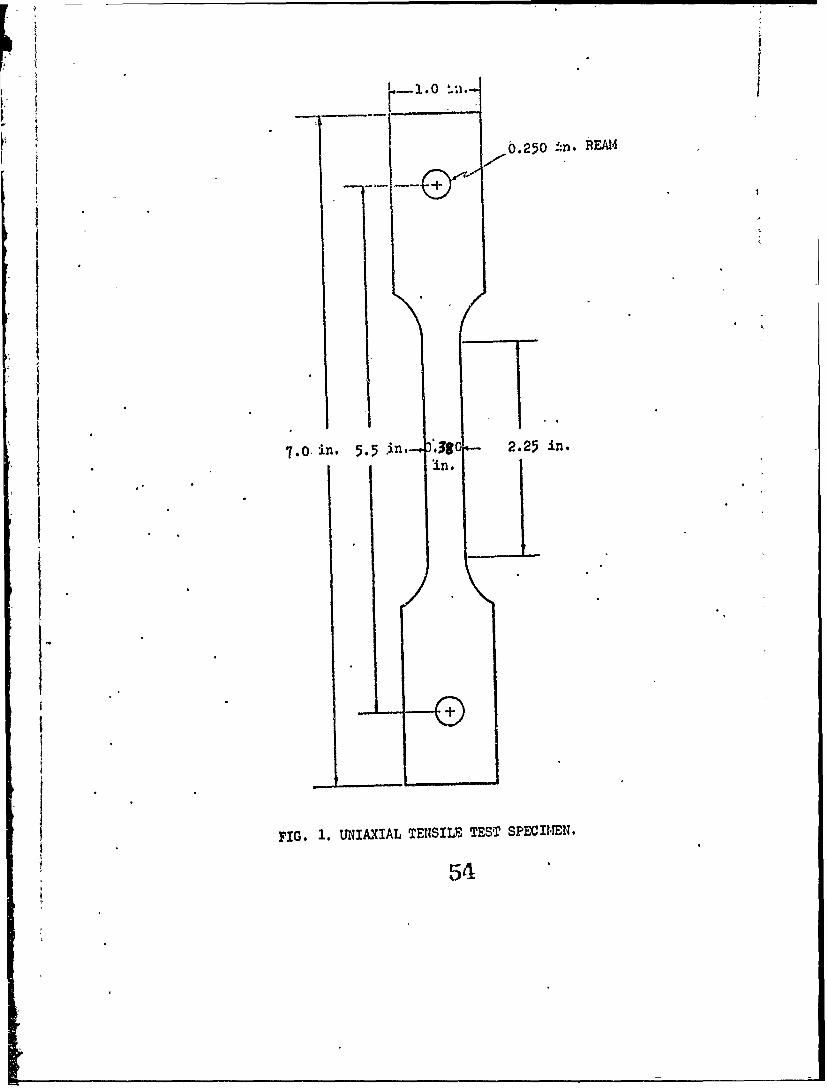
tniaxial TenslleTests: Uniaxial tests were conducted on-sheet speci-
mens of geometry, as shown in Figure 1. Care was taken to design these
sheet specimens so that the strains In the width and thickiess -directions
were comparable. The effective fracture strain, , was calculated using:
A
N.
where A is the initial cross sectional area and AF is the final cross
~0
sectional area.
*Plane Strain Biaxial Tests: Two series of plane strain biaxial tests
were performed.
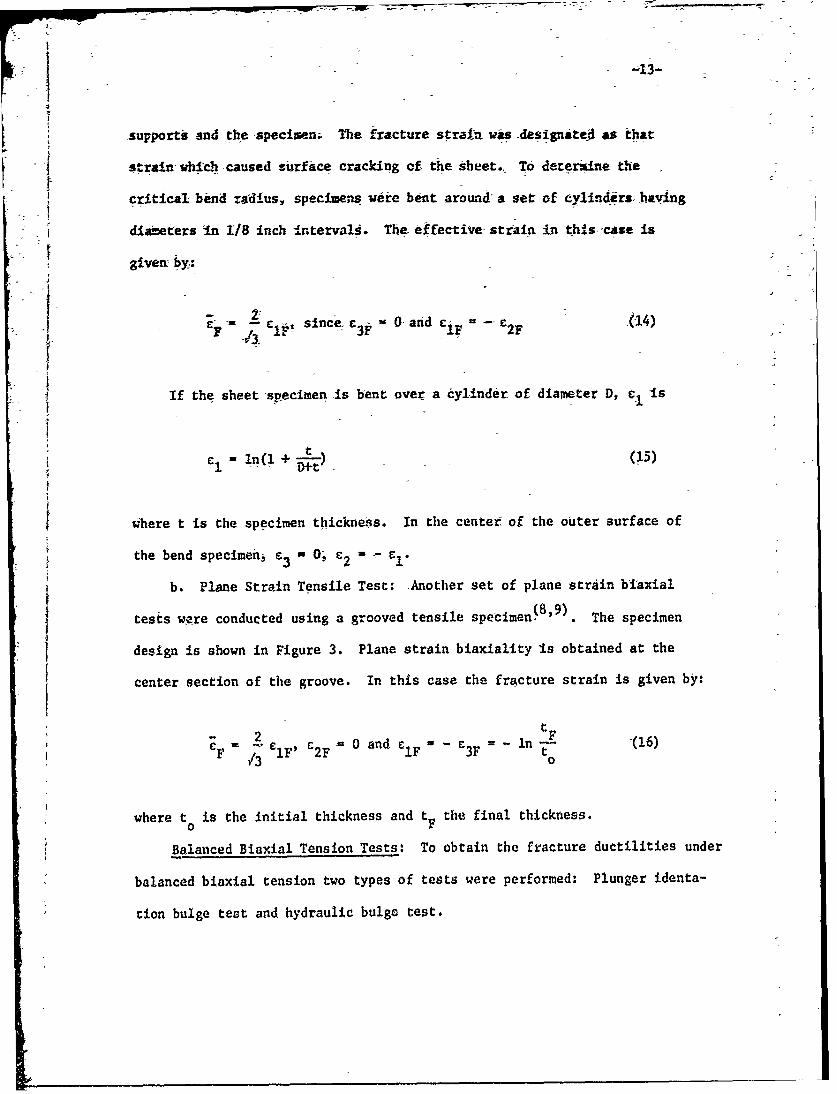
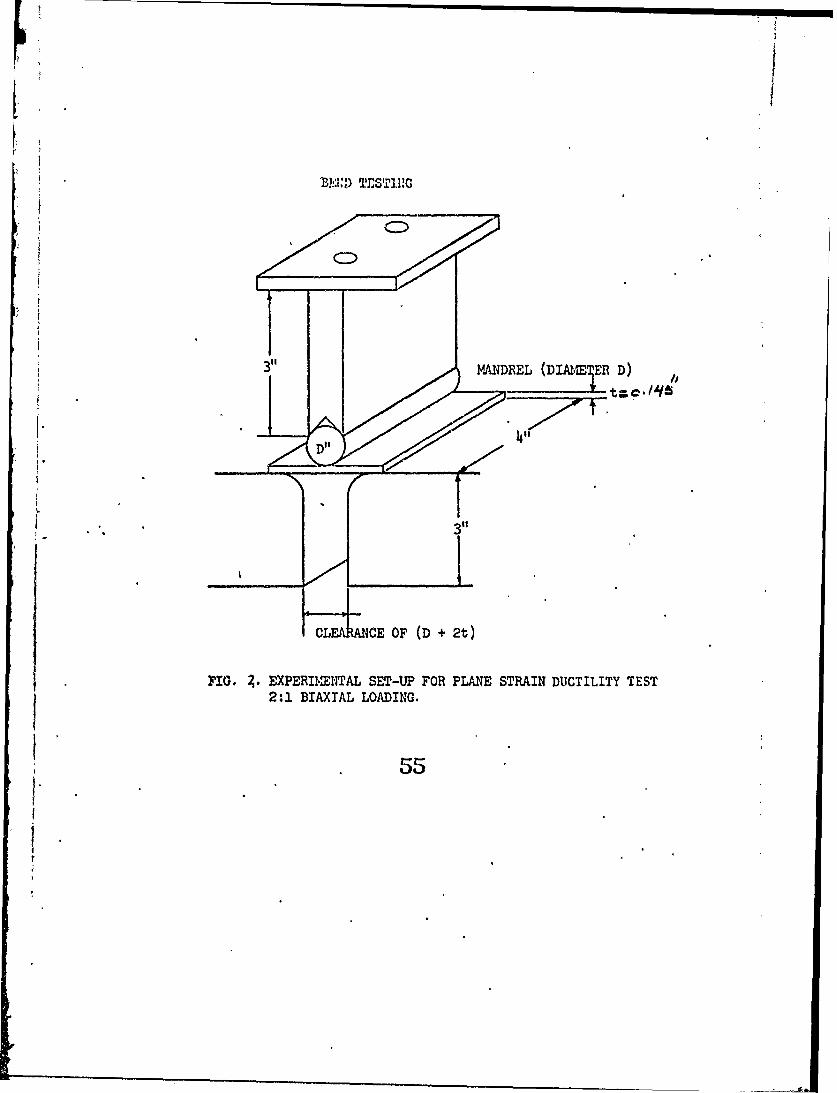
a. Plane Strain Bend Test: Bending of wide specimens over a cylindri-
cal die was used to determine the plane strain fracture ductility values,
(a2/a1 = 1/2, a3 - 0). It has been demonstrated (14-15) that plane strain
-onditions are obtained at the center section of the top and-bottom sur-
faces of a bend specimen, for width to thickness ratios in excess of 8.
For the present test series, a specimen geometry having a width to thick-
ness ratio of greater than 15 was chosen. The experimental setup is shown
in Figure 2. The test is essentially a three point bend test with a side
clearance of approximately one sheet thickness once the specimen has
achieved a "U" bend over the cylindrical mandrel (indentor). To minimize
friction, teflon tape was Inserted under the mandrel and between the edge
Page 21
4: -13-
supports and the -specimen; The fracture strain was designated as that
- strain which caused surface cracking of, the sheet., To dereruine the
critical bIend rdus, specmens were bent aroundn a set of eylinders, having
dlimeters in 1/8 Inch Intervals. The effective, strain in thls-case is
given: by.:
C -/ C1 e since. c3 F O-andciF -ci 2 F (,4)
If the sheet-specimen is bent over a cylinder of diameter D, c-Is
dI ln(l + (!-) (15)
where t is the specimen thickness. In the center of the outer surface of
the bend specimen £3 0; 92 = V
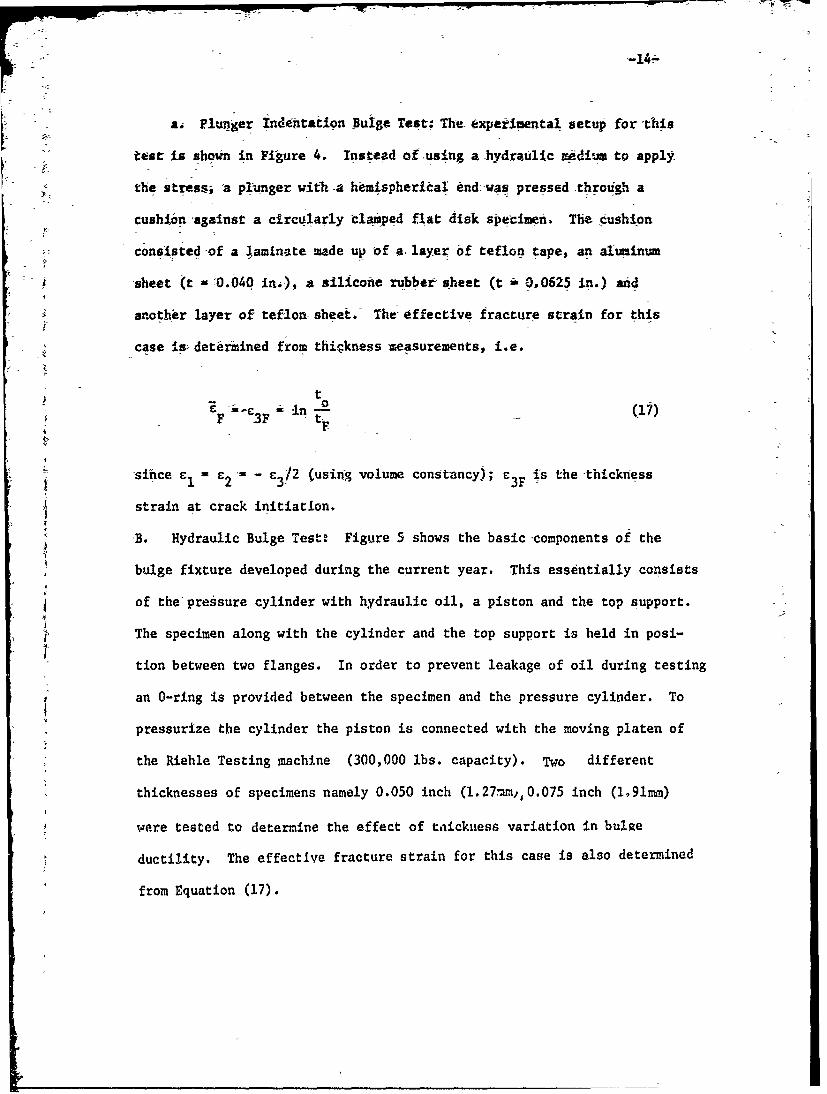
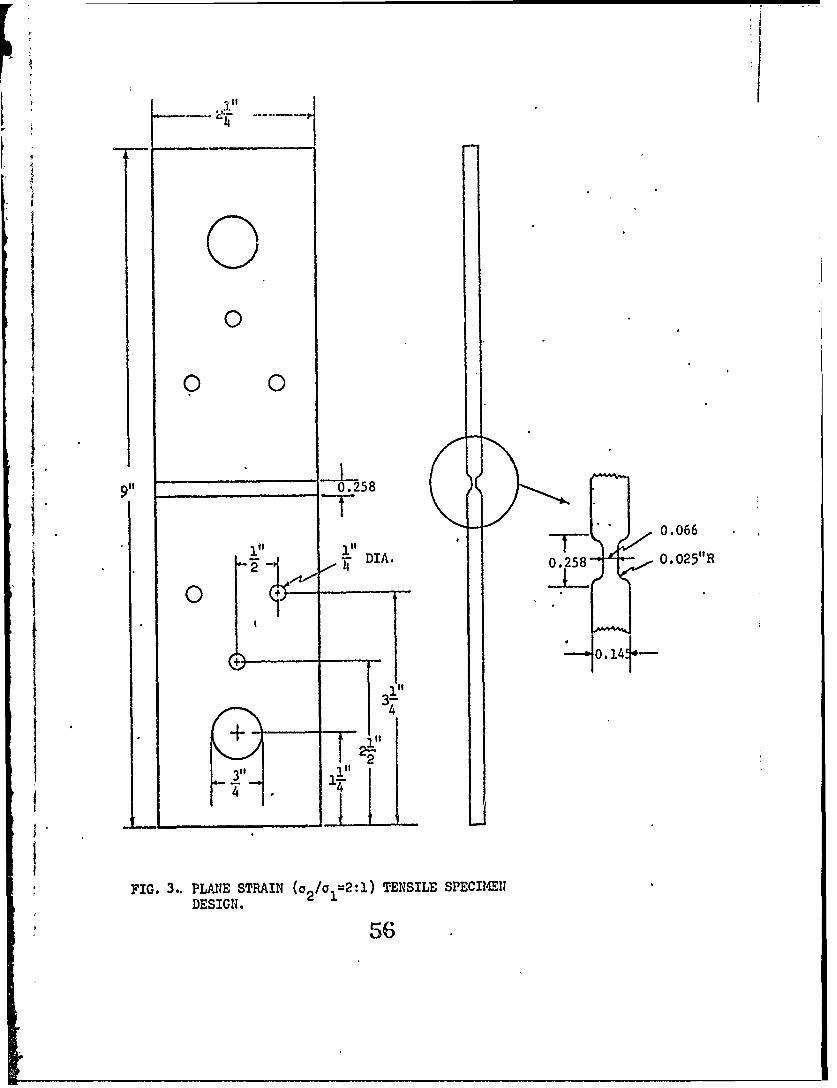
b. Plane Strain Tensile Test:- Another set of plane strain biaxial
tests were conducted using a grooved tensile specimen 8 '9 ) . The specimen
design is shown in Figure 3. Plane strain biaxiality :Is obtained at the
center section of the groove. In this case the fracture strain is given by:
tF2 C 0and - =- ln - (16)
F lF' C2F 1F 3F to
where t is the initial thickness and tF the final thickness.
Balanced Biaxial Tension Tests: To obtain the fracture ductilities under
balanced biaxial tension two types of tests were performed: Plunger identa-
dcon bulge test and hydraulic bulge test.
Page 22
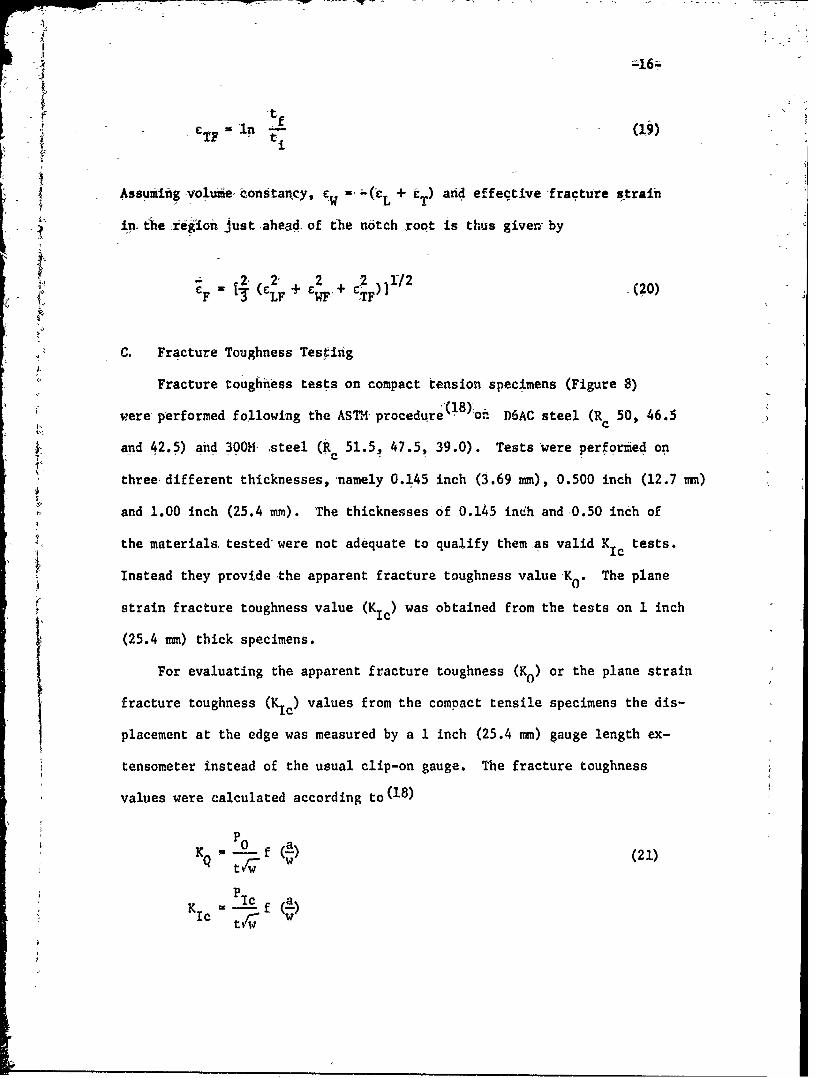
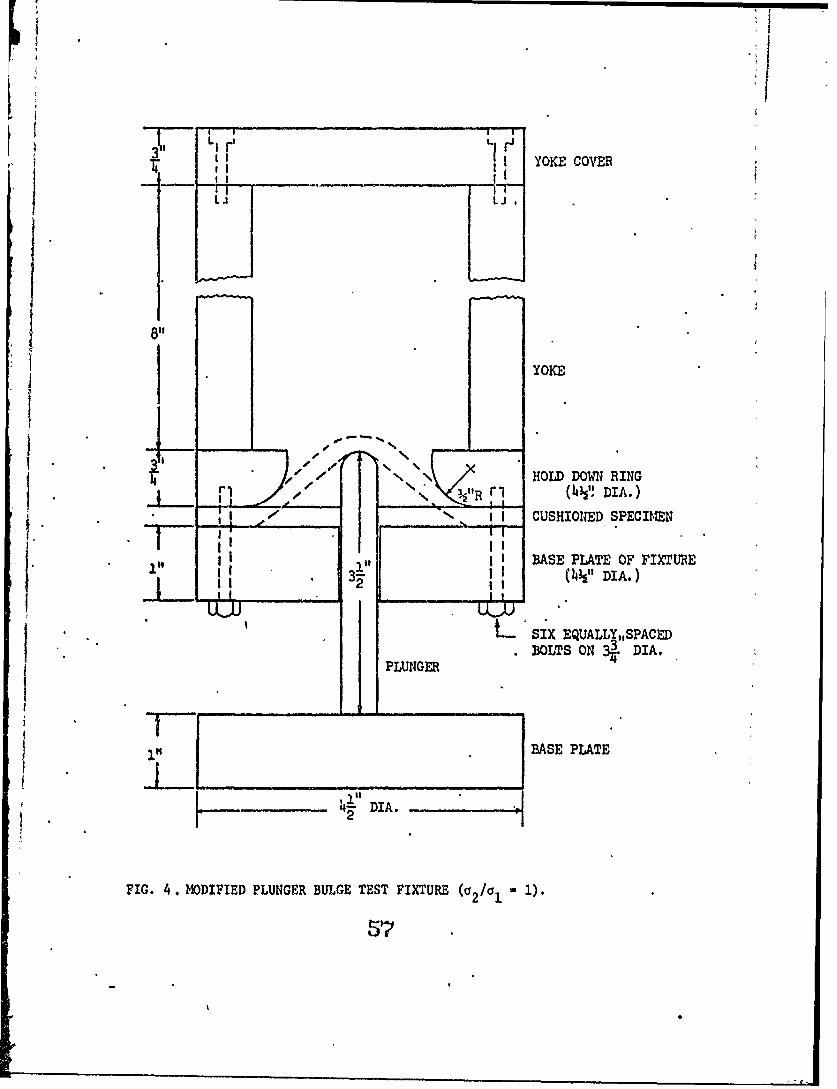
- ai Plunger Indeitation Buige Test; The experimental setup for this
test is shown in Figure 4. Instead of using a hydraulic medium to apply
the stressi 'a plunger with-a hemispherical end was pressed through a
cushion against a circularly clamped flat disk specimen. The cushion
consisted-of a ;aminate made up -of a. layer of teflon tape, an aluminum
-sheet (t ---0.040 in.), a silicone rubber sheet (t i 0,0625 in.) and
another layer of teflon sheet. The- effective fracture strain for this
case ij: determined from thickness measurements, i.e.
tt eF _3F ic tF (7
-since 2 - /2 (using volume constancy); c3F is the -thickness
strain at crack initiation.
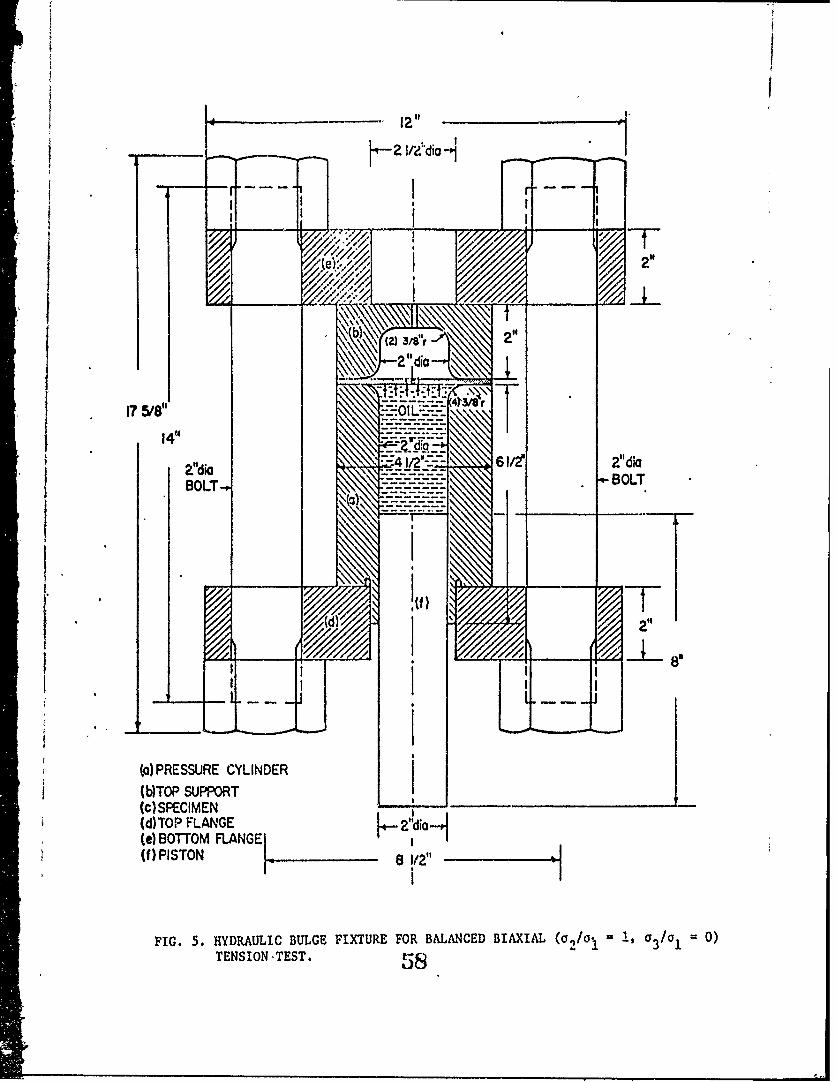
B. Hydraulic Bulge Test! Figure 5 shows the basic-components of the
bulge fixture developed during the-current year. This essentially consists
of the-pressure cylinder with hydraulic oil, a piston and the top support. - -
The specimen along with the cylinder and the top support is held in posi-
tion between two flanges. In order to prevent leakage of oil during testing
an O-ring is provided between the specimen and the pressure cylinder. To
pressurize the cylinder the piston is connected with the moving platen of
the Riehle Testing machine (300,000 lbs. capacity). Two different
thicknesses of specimens namely 0.050 inch (l.27.mm,0.075 inch (l,91Mn)
were tested to determine the effect of tnickiess variation in bulge
ductility. The effective fracture strain for this case is also determined
from Equation (17).
Page 23
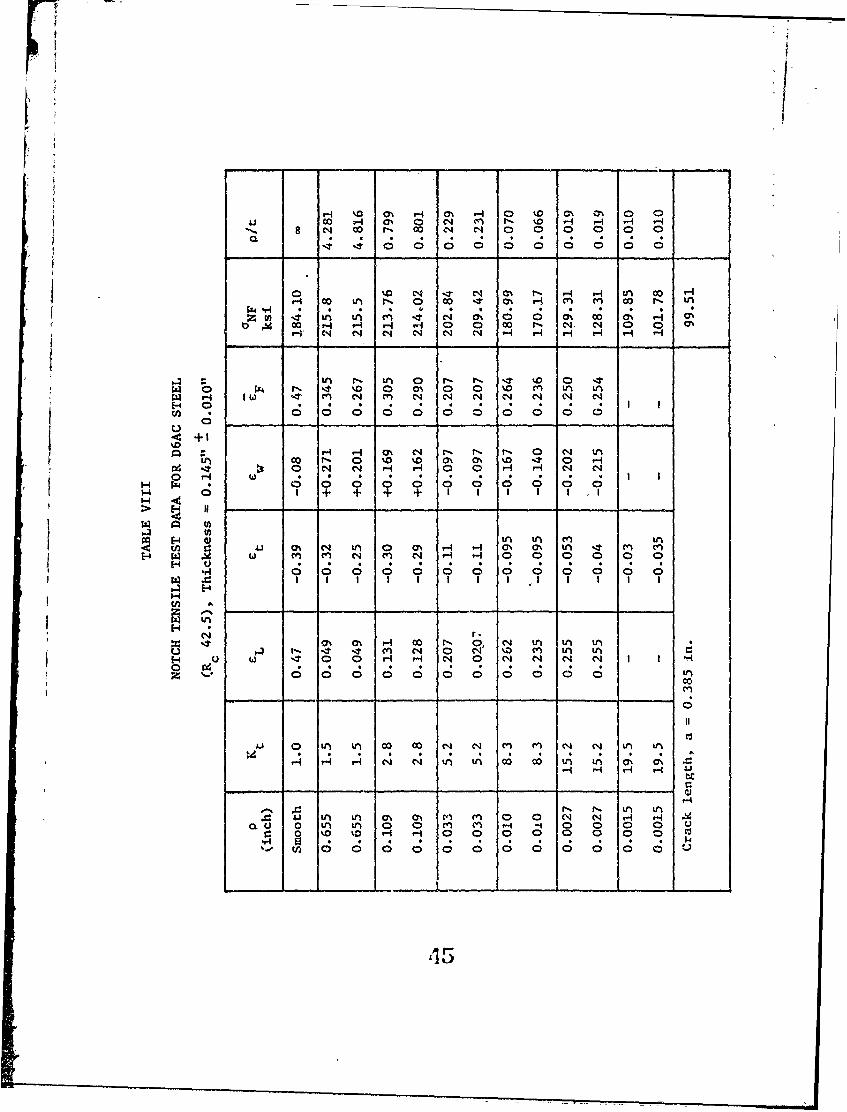
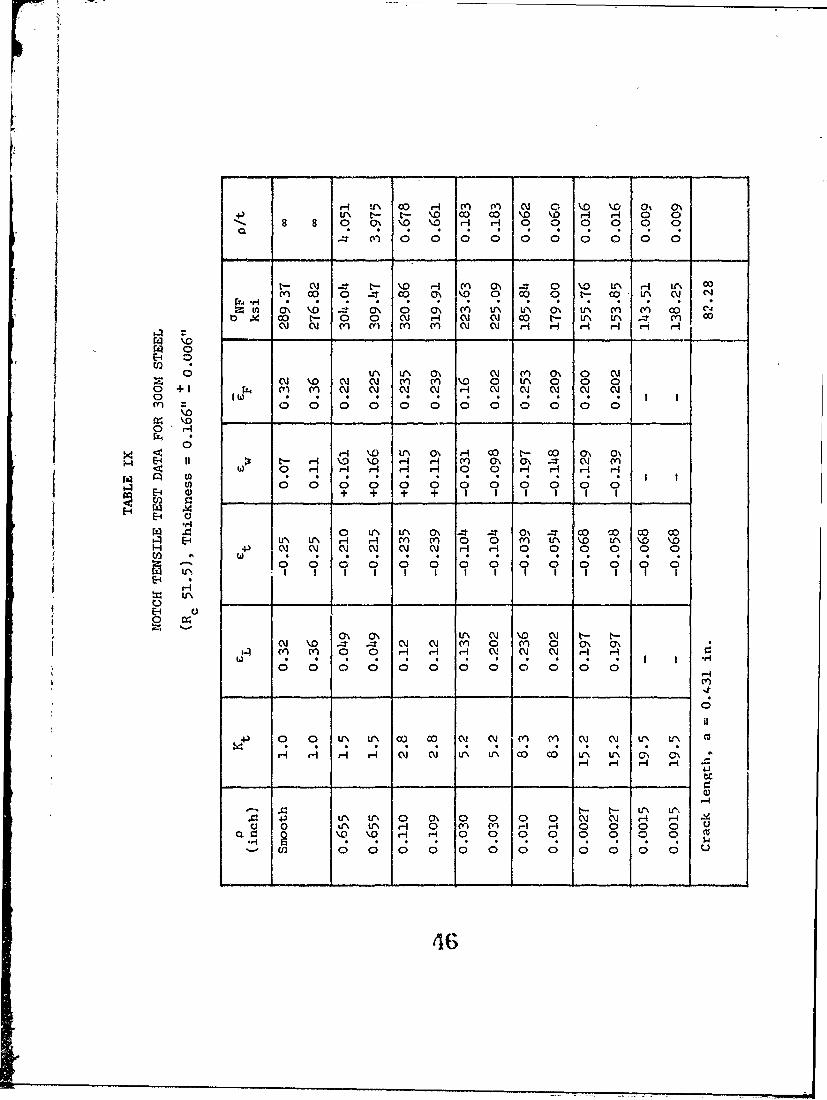
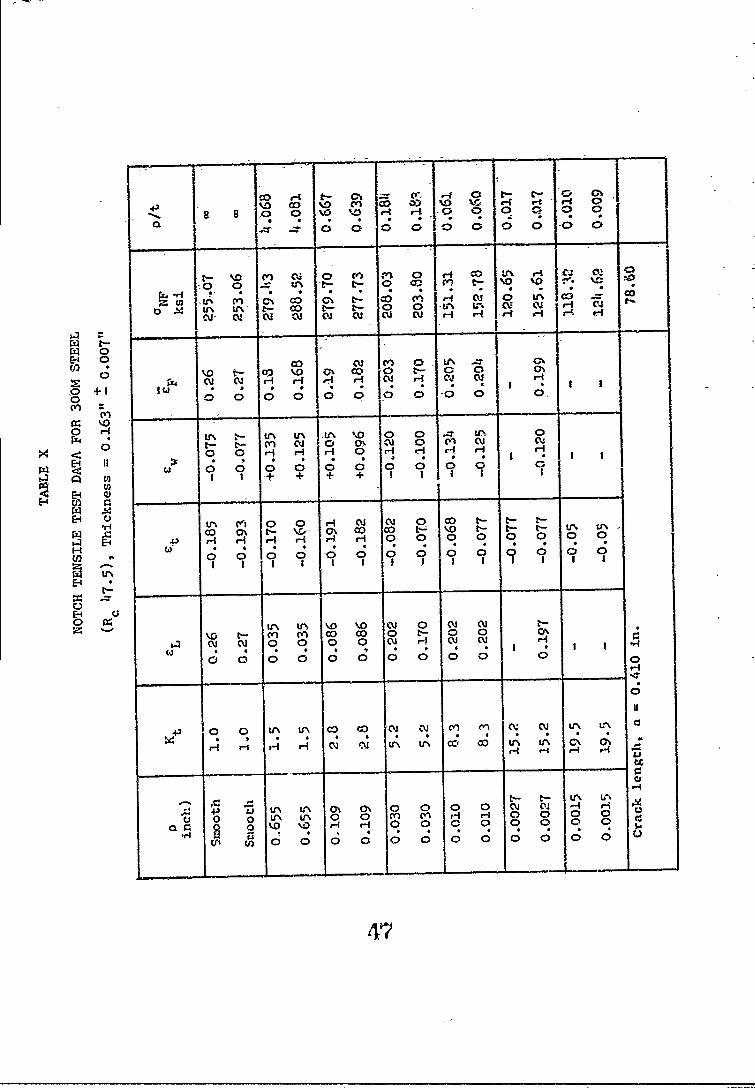
LB. Notih Tensile Tests:Notch tensiie tests- have been completed'on D6AC steel (R 50, 463and
42.5)and 300M steel(R 51.5, 4.5, 39.0). The test specimen geoimetry isC
shown in Figure 6. The specimens were double-edge notched, with a
30%notch depth0 The variation in stress concentration factor was
achieved'by vaiyin6 the notch root radius (p). The stress concentration
factors, Kt , were determined' from Peterson's tables(16) and ranged from
1.54 (P - .655 zu)- to as high as that of a crack (p, ' 0, obtained by a
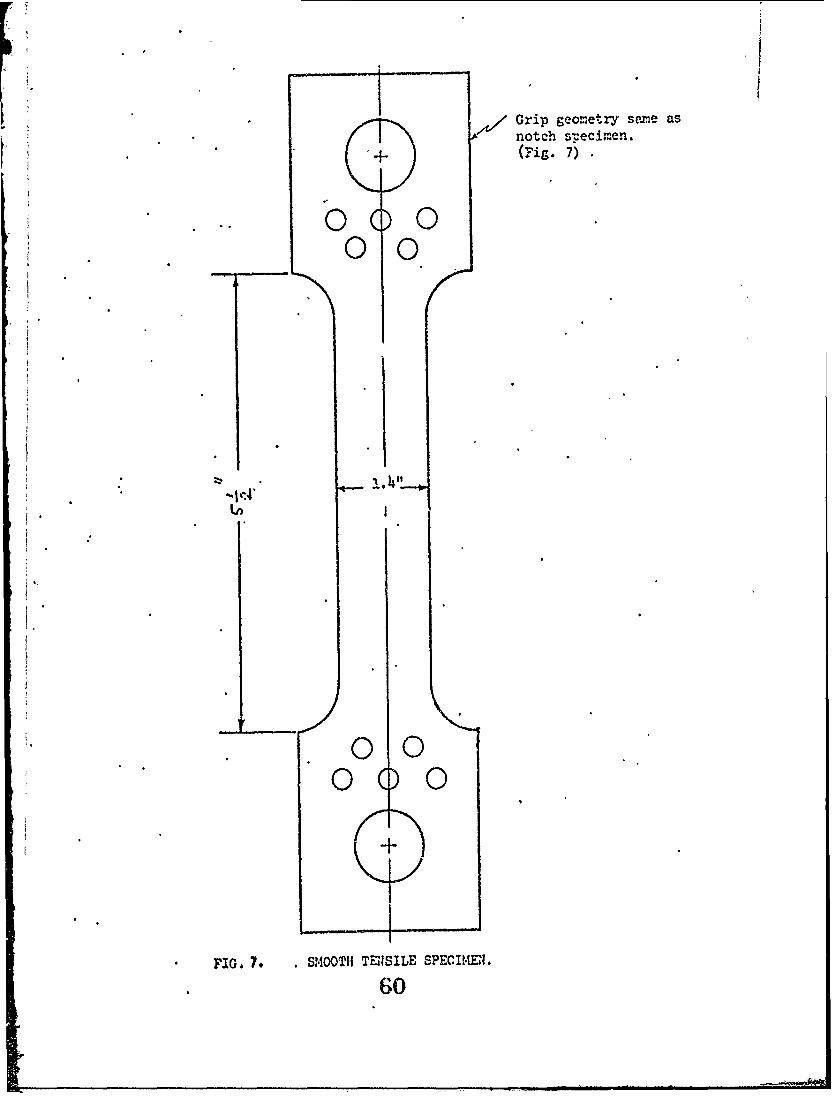
fatigue crack). In addition, tensile specimens (Figure 7) were tested in
the same series. These specimens had the same net cross sectional-area as
the notched specimens.
The notch strength; qNF' was calculated from the-maximum load by
dividing it through the original net cross sectional area. The longitudi-
nal strain and-the thickness strain at the notch root at fracture waE
measured on the broken specimens, The longitudinal strain was determined
from
£LF = in f1/2 (18)
where pi is the initial and pf is the final root radius. This relationship
has been shown to be a good approximation of the longitudinal root radius
strain 1 The thickness strain at fracture was determined in the usual
way from the initial and final thickness values near the notch root, ti
and tf, from
4i
Page 24
I -
J -16-
F InL Assuming voluie constancy, W = "( L + cT) and effective fracture strain
in. the Yedioi just ahead of the notch root is thus given by
2, 2 2 2 2 1/2 (0CF (C LF + C WF- TF ;
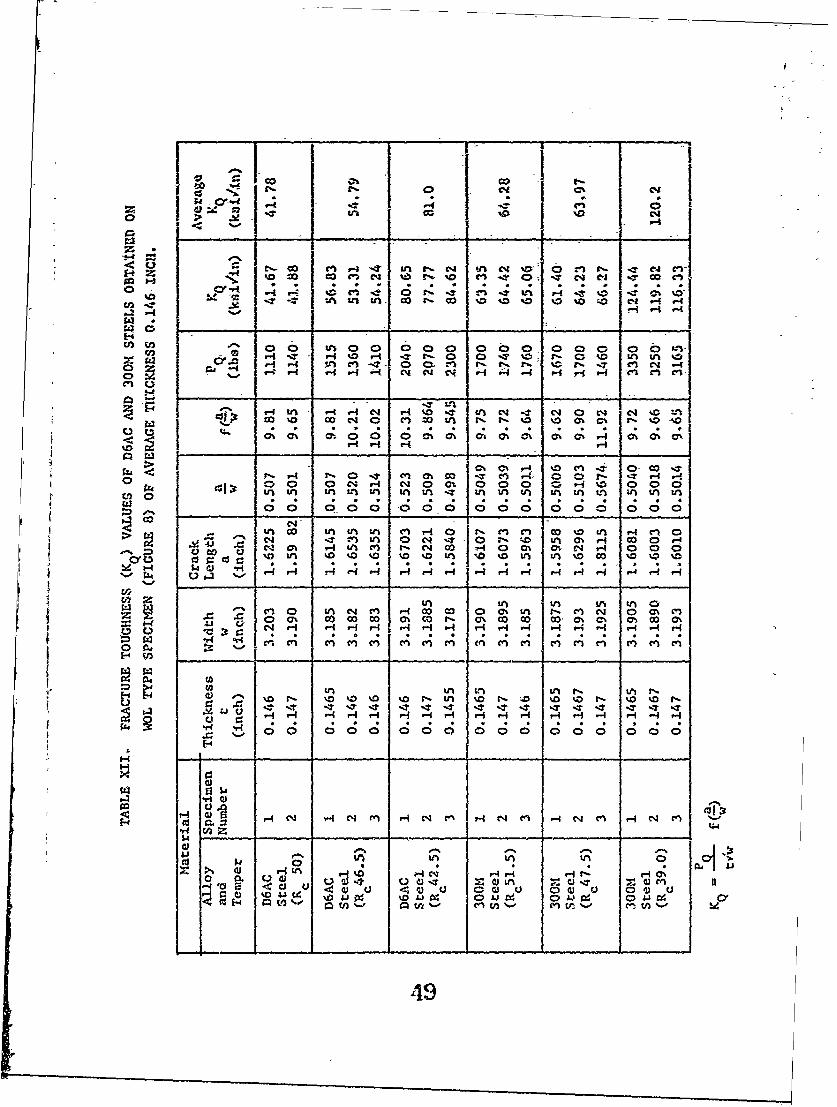
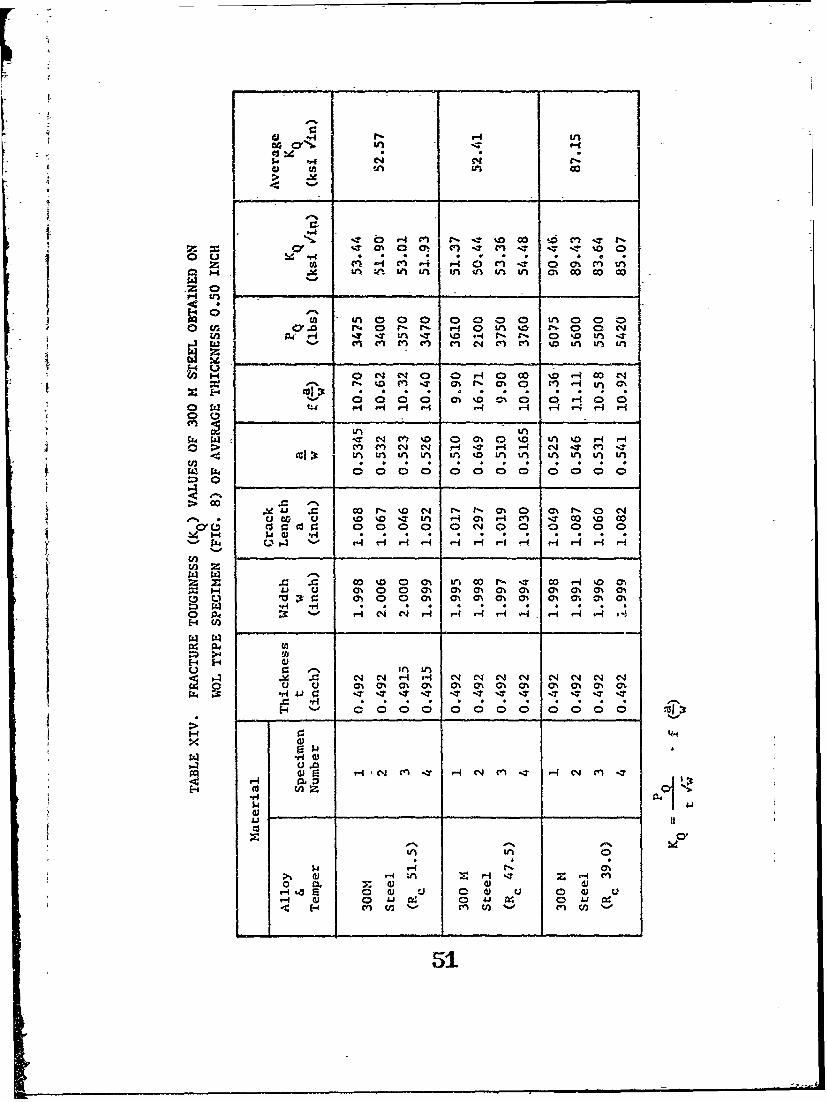
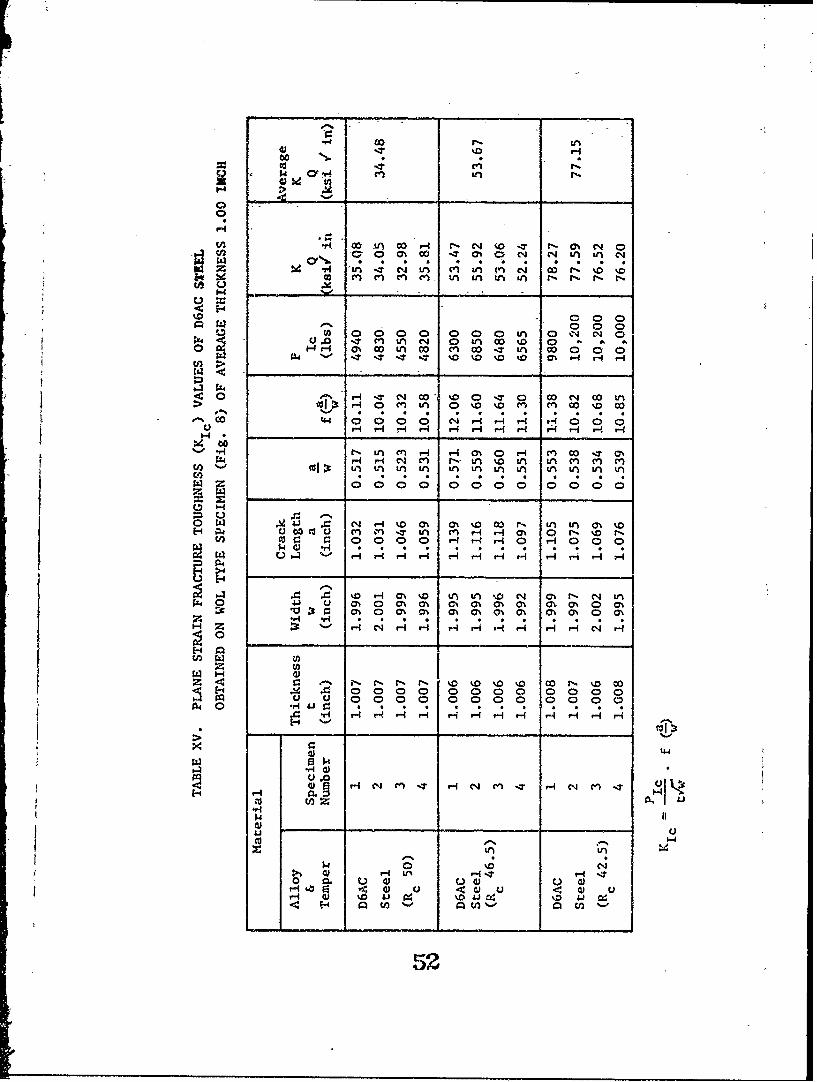
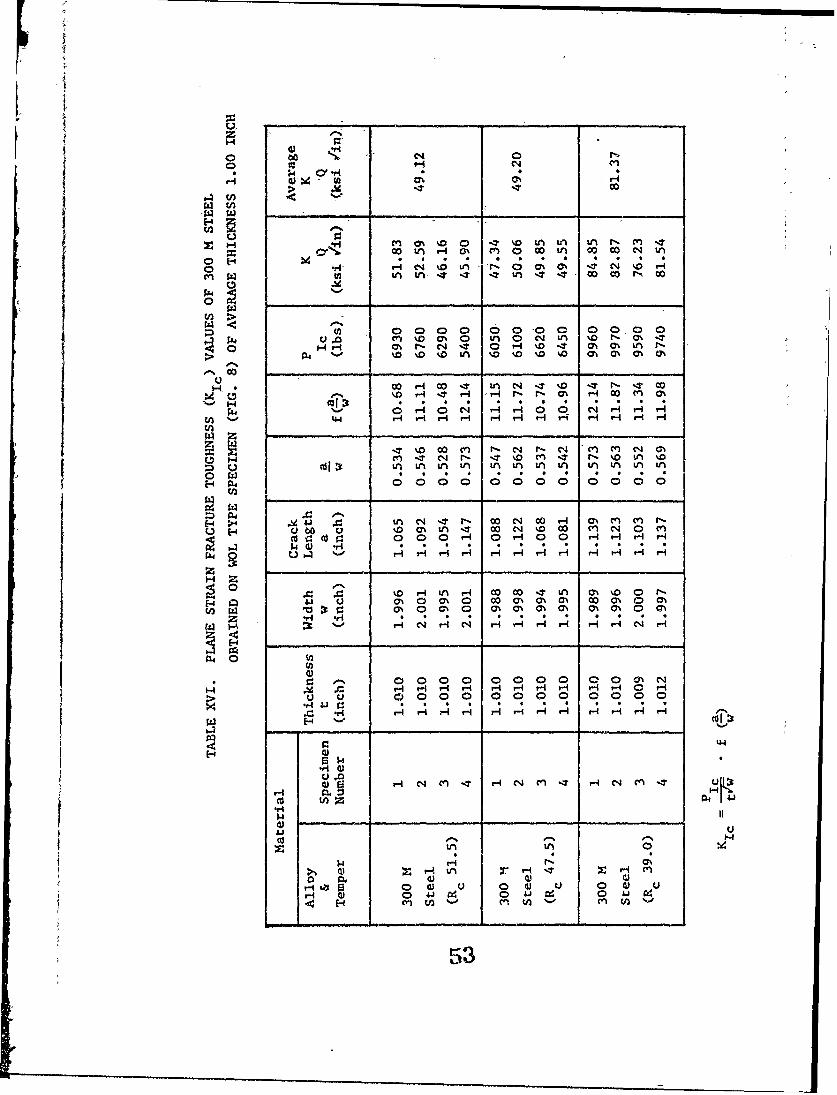
C. Fracture Toughness Testing
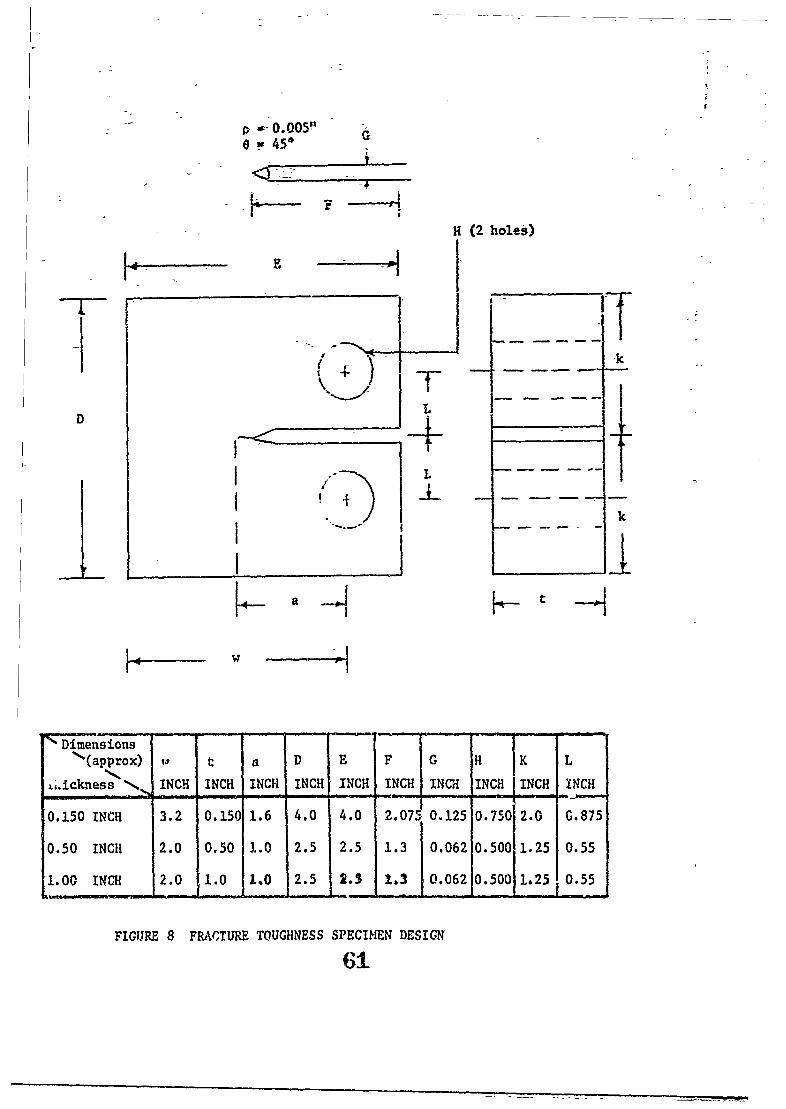
Fracture toughness tests on compact tension specimens (Figure 8)
were performed following the ASTm procedure -1-n D6AC steel (Rc 50, 46.5
and 42.5).and 30011 steel (R 51.5, 47.5, 39.0). Tests were performed on
three different thicknesses, namely 0.145 inch (3.69 mm), 0.500 inch (12.7 mm)
and 1.00 inch (25.4 mm). The thicknesses of 0.145 indh and0.50 inch of
the materials tested were not adequate to qualify them as valid Kic tests.
Instead they provide the apparent fracture toughness value-KO . The plane(0
strain fracture toughness value (KIc) was obtained from the tests on 1 inch
(25.4 mm) thick specimens.
For evaluating the apparent fracture toughness (K.) or the plane strain
fracture toughness (KIt) values from the compact tensile specimens the dis-
placement at the edge was measured by a 1 inch (25.4 mm) gauge length ex-
tensometer instead of the usual clip-on gauge. The fracture toughness
values were calculated according to(18)
P 0K -- f ~A (21)
K Ic aK f ()Ic ffi W
t w
Page 25
I - -17-
where P represents the load for 5S, secant of fset, P -is the load at pop-QI
in, t '- thicknes,v w idth- and, a is the crack length of the-specimen.
!he, value of the function, f(a/w) was obtained from-the listed table-18
-for'the ratio a/v.
Also from the double edge notched specimens (with a.'fatigue crack),,
jK, Values werei calculated using the formula 19
K Pa(.,98 + 0.36 a 2-12 3.4 2a 3 (22c 'tw w +3.4222)
where P is the maximum load for the pre-cracked specimen of gross width
w, thickness t and- U Is the total crack length.
Page 26
RESULTS ANDDISCUSSIONS
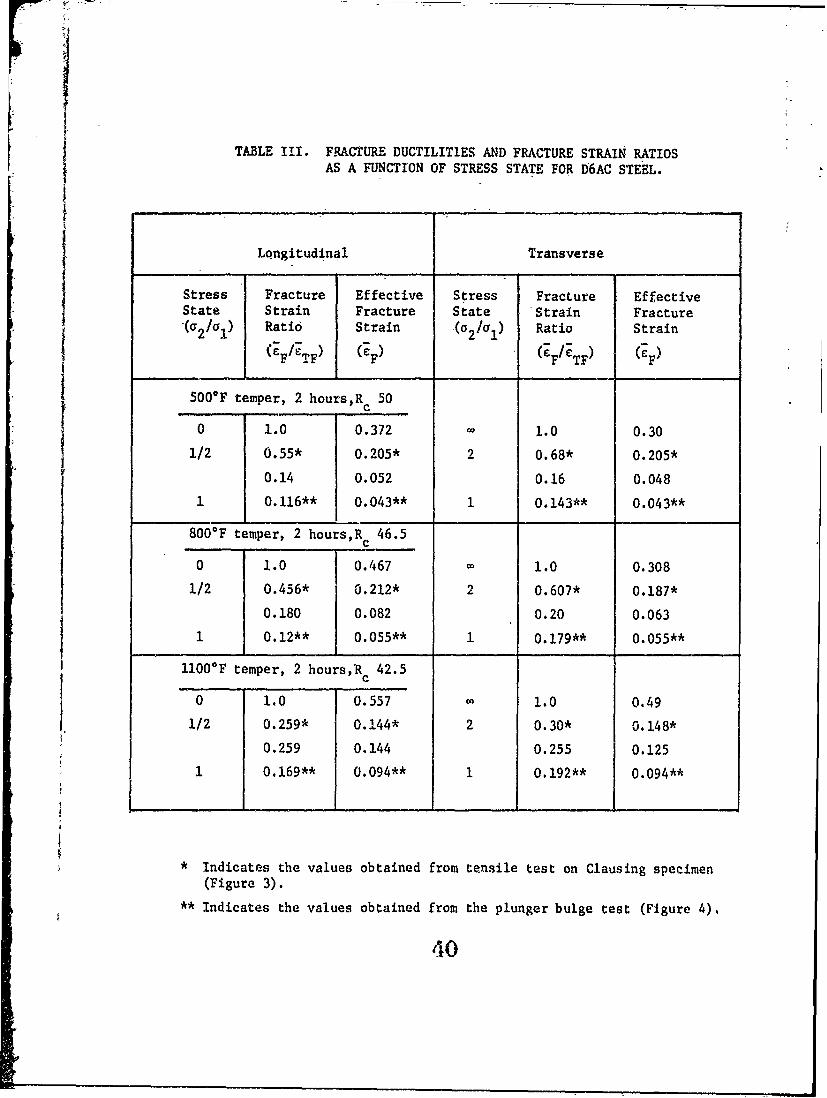
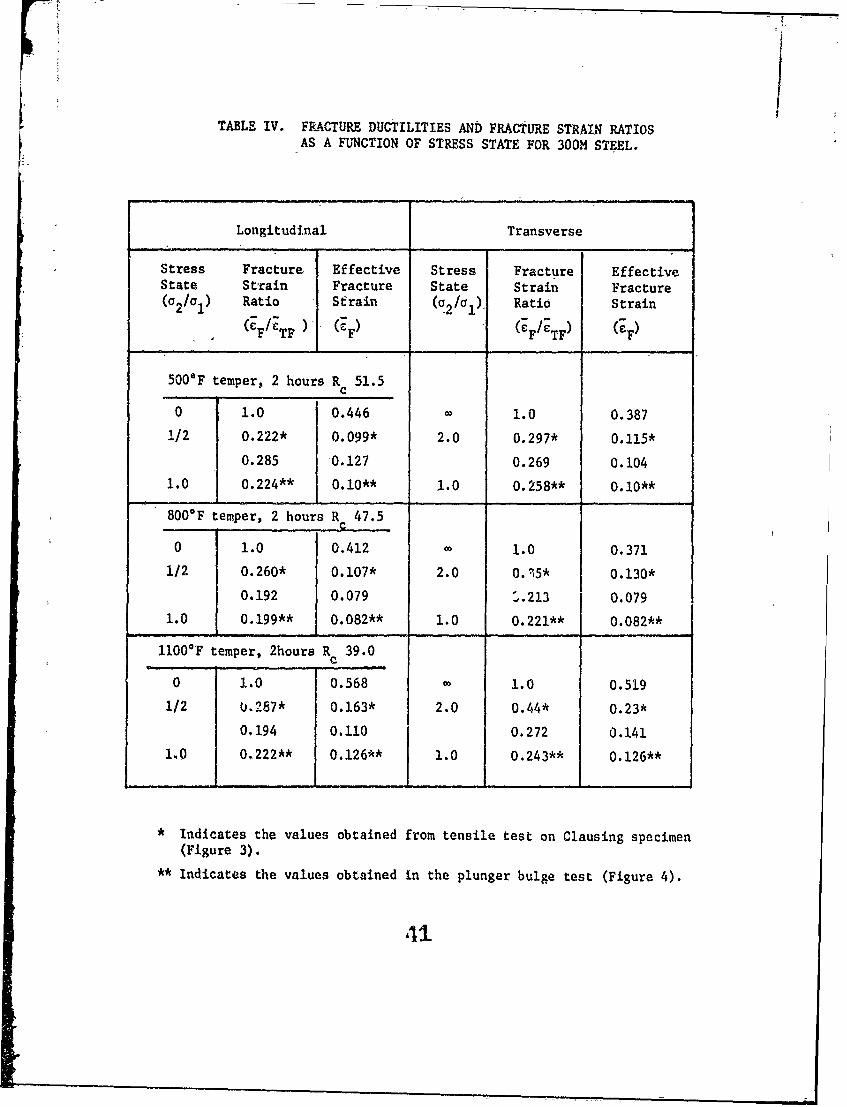
Biaxial Ductility Tests The experimental results of the effect of
stress biaxiality on fracture ductility are presented in'Tabies UlI and
T1 and plotted in Figures 9 - 14. To supplement the balanced biaxial
ductility values obtained by the plunger indentation bulge test, hy-
draulic bulge tests were performed on two different thicknesses,, 0.05
and 0. 076 in. The -results of the hydraulic bulge tests are presented in
Table V and also plotted in Figures 9 - 14.
Figures 9 - 14 indicate that there is a significant loss in ductility
on going from the uniaxial stress state to the plane strain state (a - 1/2,
8 - 0). Considering the plunger indentation bulge ductility, the observed
effects of the stress state on material ductility are similar to those
obtained by similar tests on other materials (10) namely a minimum frac-
tuie ductility for the balanced biaxial condition for all materials ex-
cept 300M steel (39 R c) where the plane strain ductility measured from
the bend test was slightly lower than the balanced biaxial tension ductility
(Figure 14).
It is noted that the hydraulic bulge ductility values are consistently
higher than the previously determined ductility values for balanced bi-
axial tension by the plunger test, as indicated in Figures 9 - 14. A
difference in the surface condition between the plunger bulge test speci-
mens and the hydraulic bulge test specimens is the principal cause for
this discrepancy. The final grinding on the former as well as the ten-
sion and Clausing specimens resulted in a surface roughness of an RMS
value between 18 and 20 micro-inches. The surface roughness of the hy-
draulic bulge test specimens was RMS 9 to 12 micro-inches. A comparison
Page 27
-19-
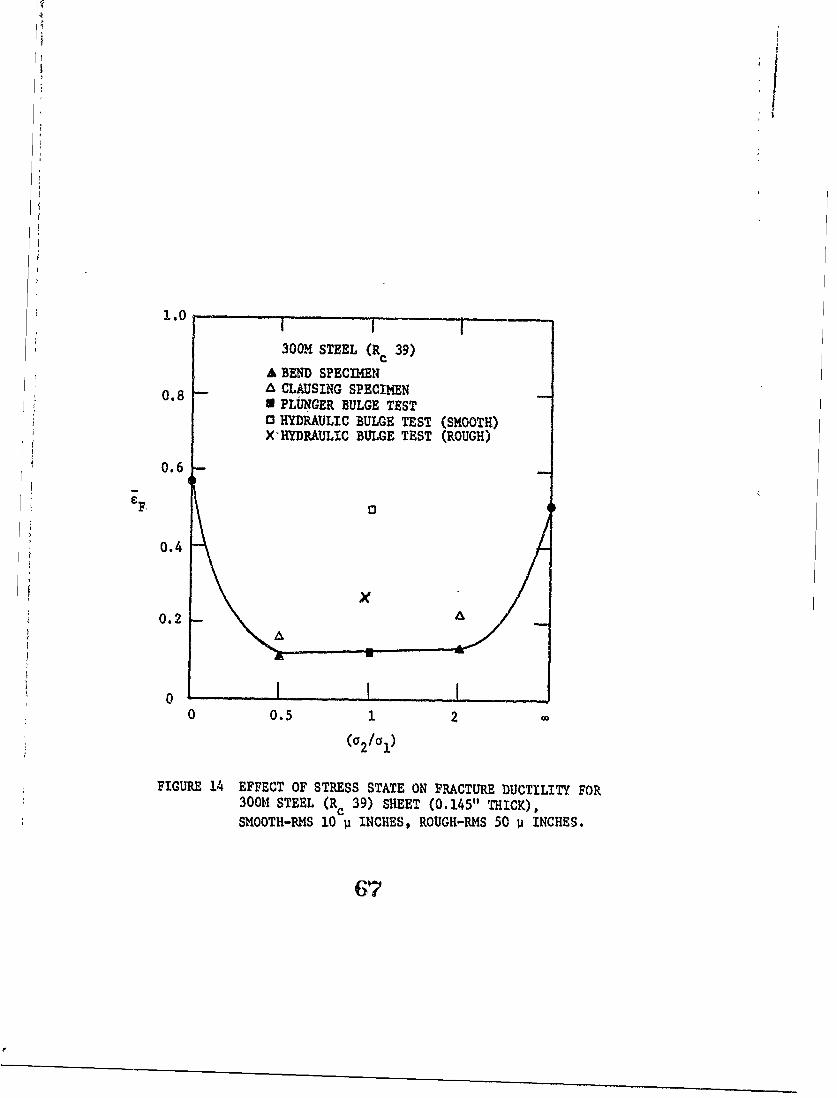
hydraulic bulge test on 300M steel (R- 39) clearly showed this effect.C
For a fine surface finish, RMS 9-12, the bulge ductility was 0.45, fora coarse finish, RMS 50 micro-inches, the bulge ductility was only 0.27.
Different grinding methods could also cause different residual stress
patternsand thereby affect the ductility. Moreover, it was noted that
the hydraulic bulge specimens were frequently in the lower hardness
range for a given heat treatment - possibly due to a higher thickness
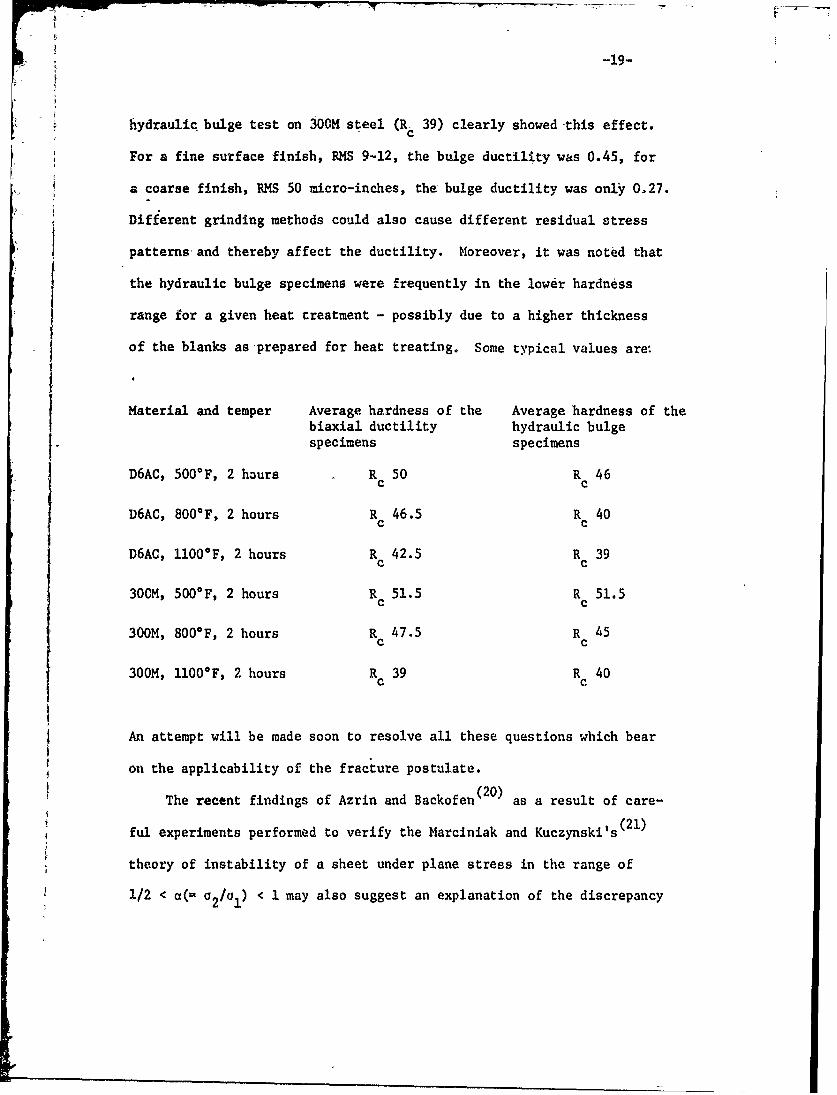
of the blanks as prepared for heat treating. Some typical values are:
Material and temper Average hardness of the Average hardness of the
biaxial ductility hydraulic bulgespecimens specimens
D6AC, 500*F, 2 h3urs Rc 50 R 46
D6AC, 800*F, 2 hours R 46.5 R 40C c
D6AC, 1100*F, 2 hours R 42.5 R 39c c
300M, 500*F, 2 hours Rc 51.5 R 51.5c c
300M, 800*F, 2 hours Rc 47.5 R 45c c
300M, 1100*F, 2 hours Rc 39 R 40c C
An attempt will be made soon to resolve all these questions which bear
on the applicability of the fracture postulate.
The recent findings of Azrin and Backofen (20) as a result of care-
ful experiments performed to verify the Marciniak and Kuczynski's(21)
theory of instability of a sheet under plane stress in the range of
1/2 < c(- a2/a1) I may also suggest an explanation of the discrepancy
Page 28
-20-
between the balanced biaxial ductility values obtained iY hydraulic
bulge test and, plunger Indentation bulge teat. Their prncip a1 to
servation is the development of a plane strain -ittability regio-n in
a balanced biaxial tension test due to the pressure of 4 material in-
homogeneity. According to these findings one might e xect little
difference between the plane Straiit (Clausing or bend test) duet!lity
and- the bulge ductility, especially as determined by the pltiiger bul ge
test.
Values of fracture duct iity obtained in the transverse region
are generally lower than those obtained in the longitudinal region.
This difference is attributed to the mechanical anisotropy of the
sheet materials tested.
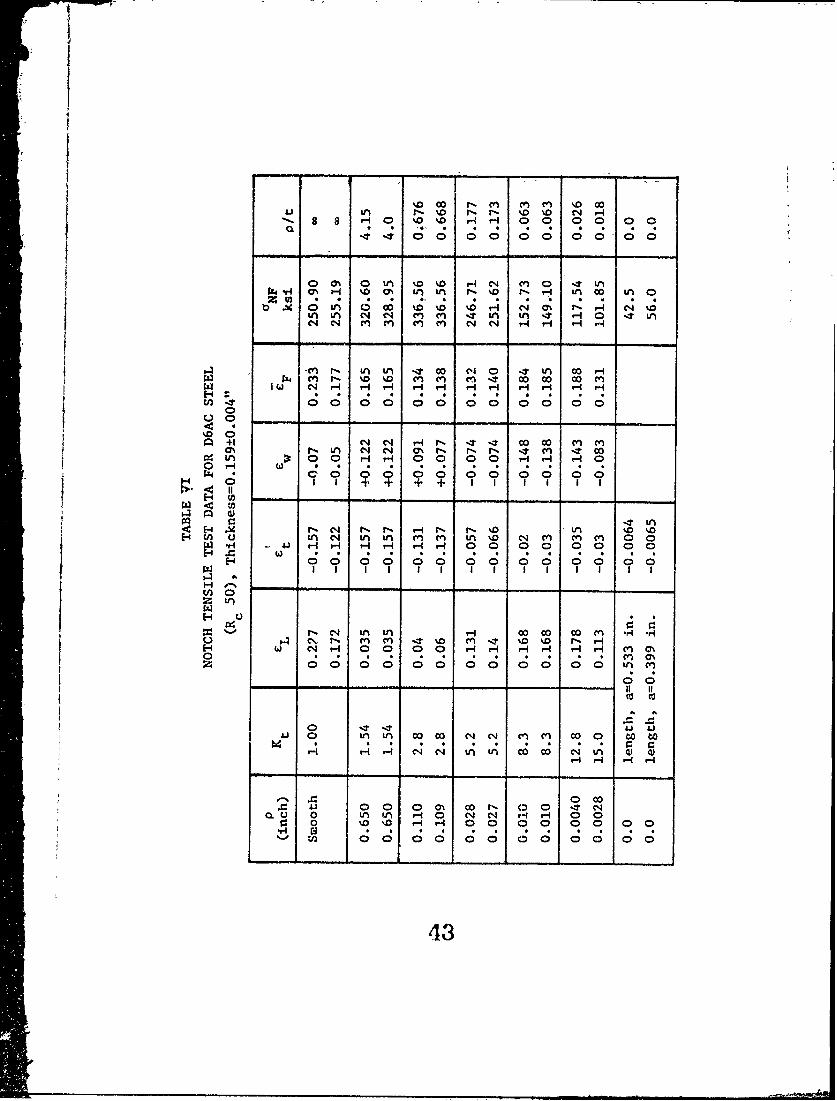
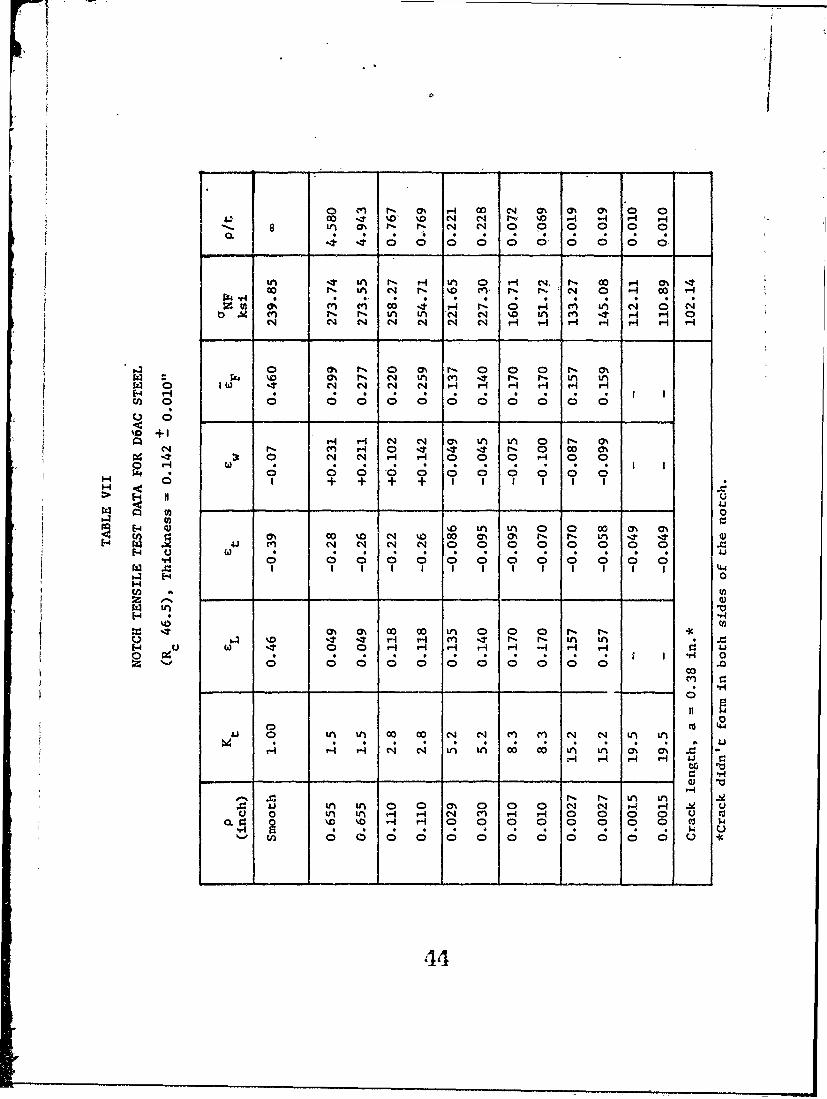
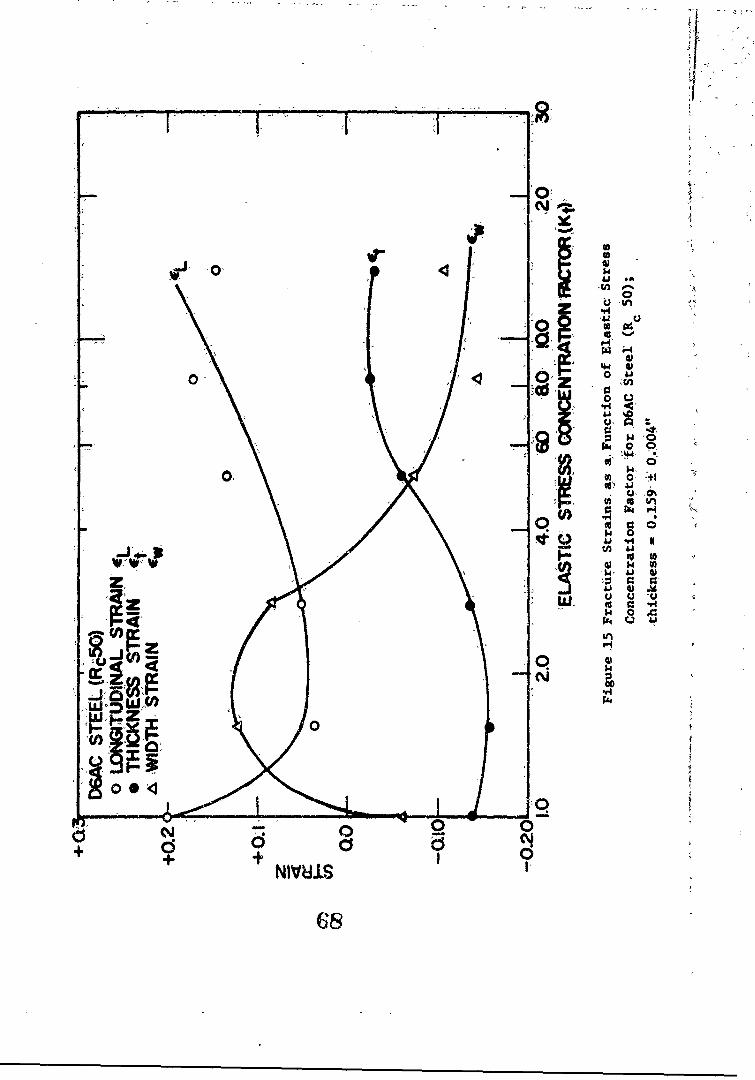
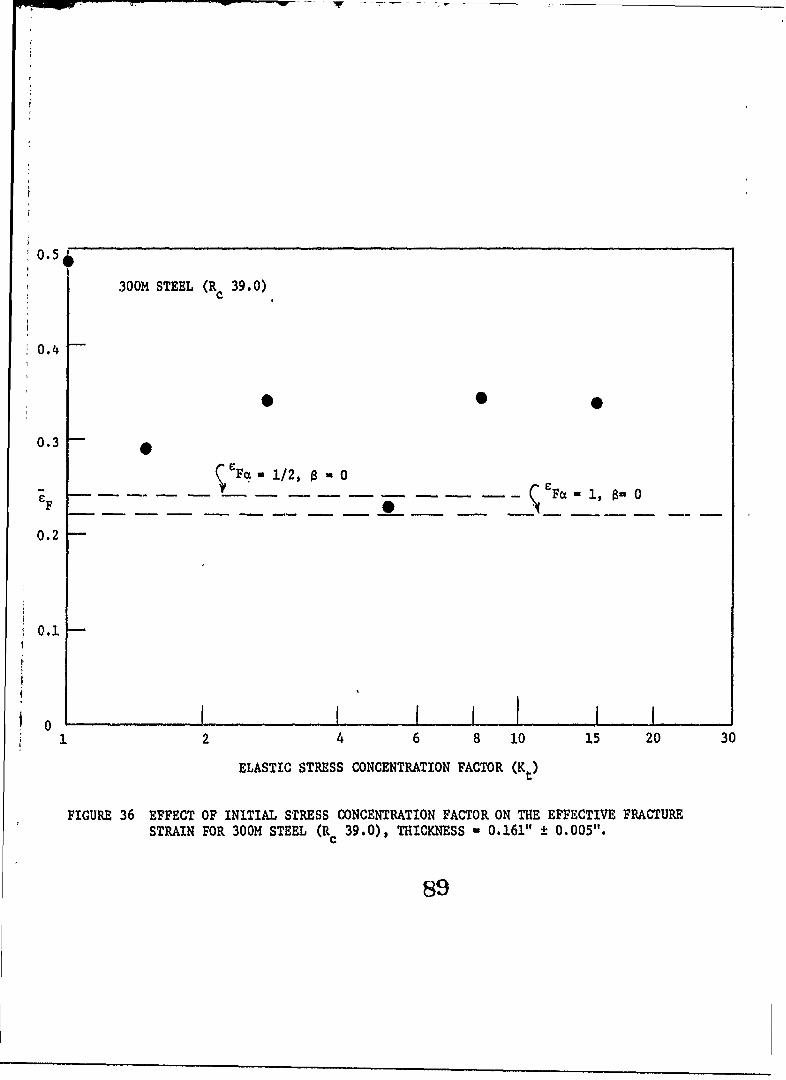
Notch Tensile Tests The results of the notch tensile tests are
presented in Table VI - XI and plotted in Figuies 15 - 38. The individual
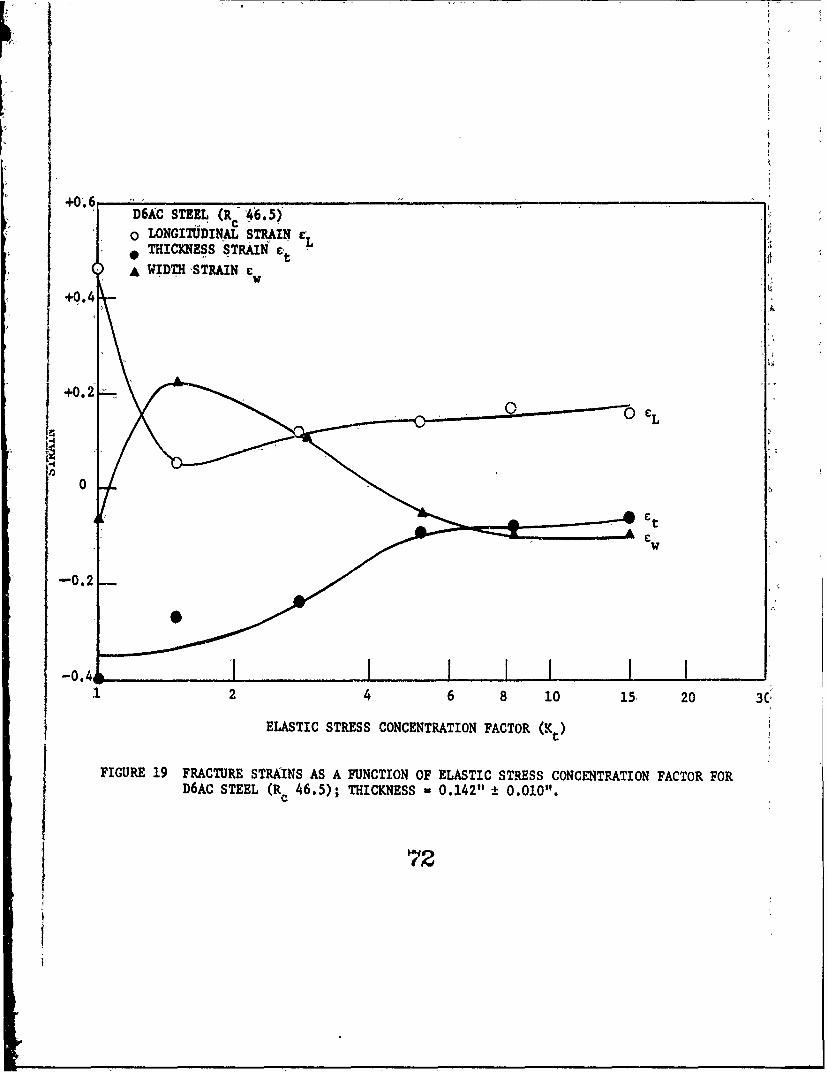
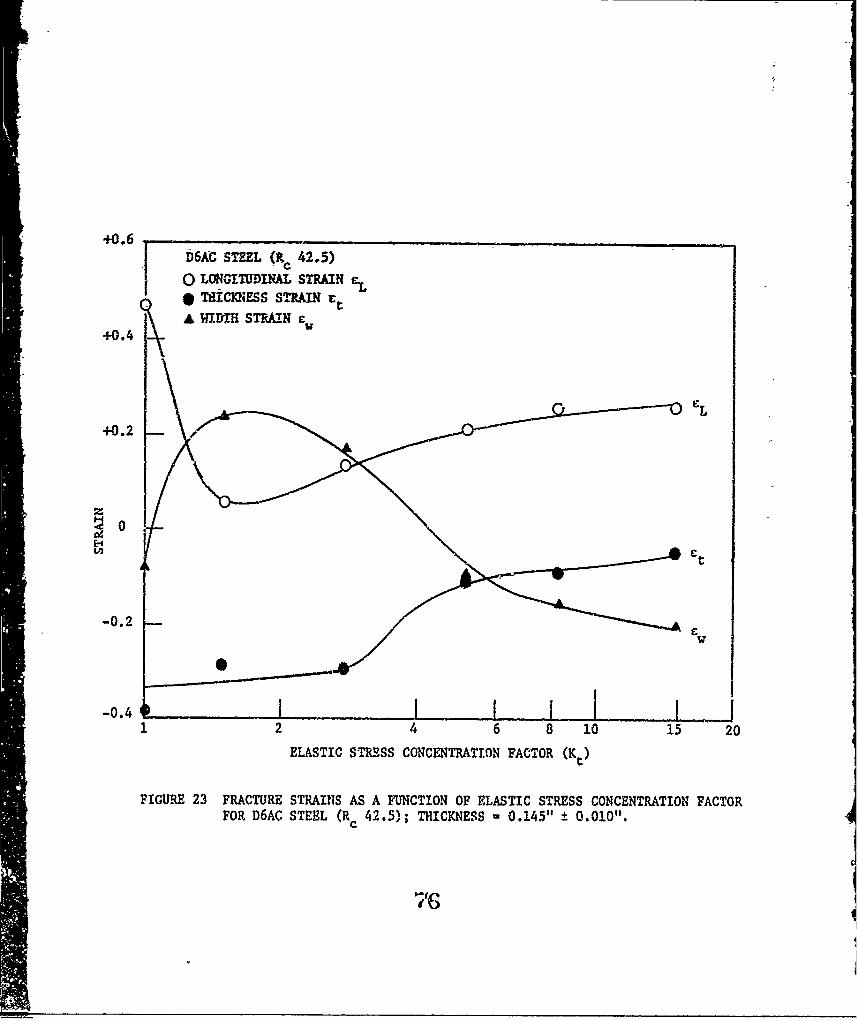
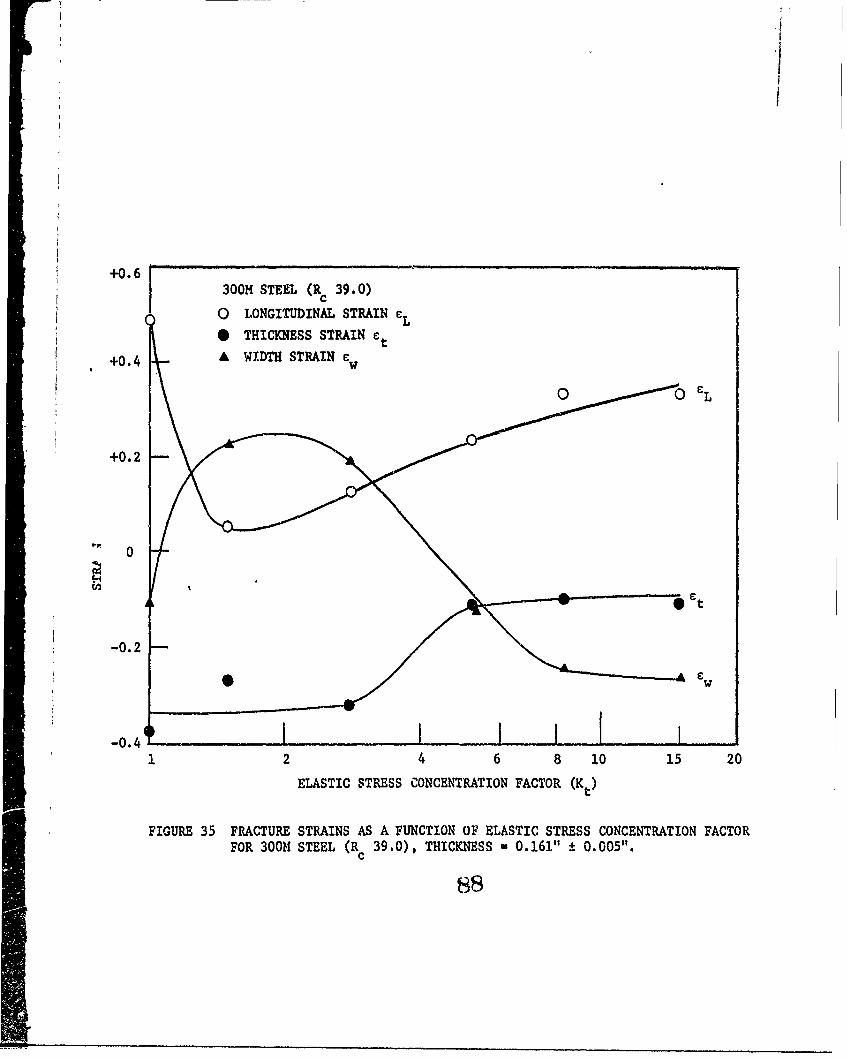
fracture strains, i.e. the longitudinal thickness and the width strains,
vary greatly with the original specimen geometry as indicated in Figure
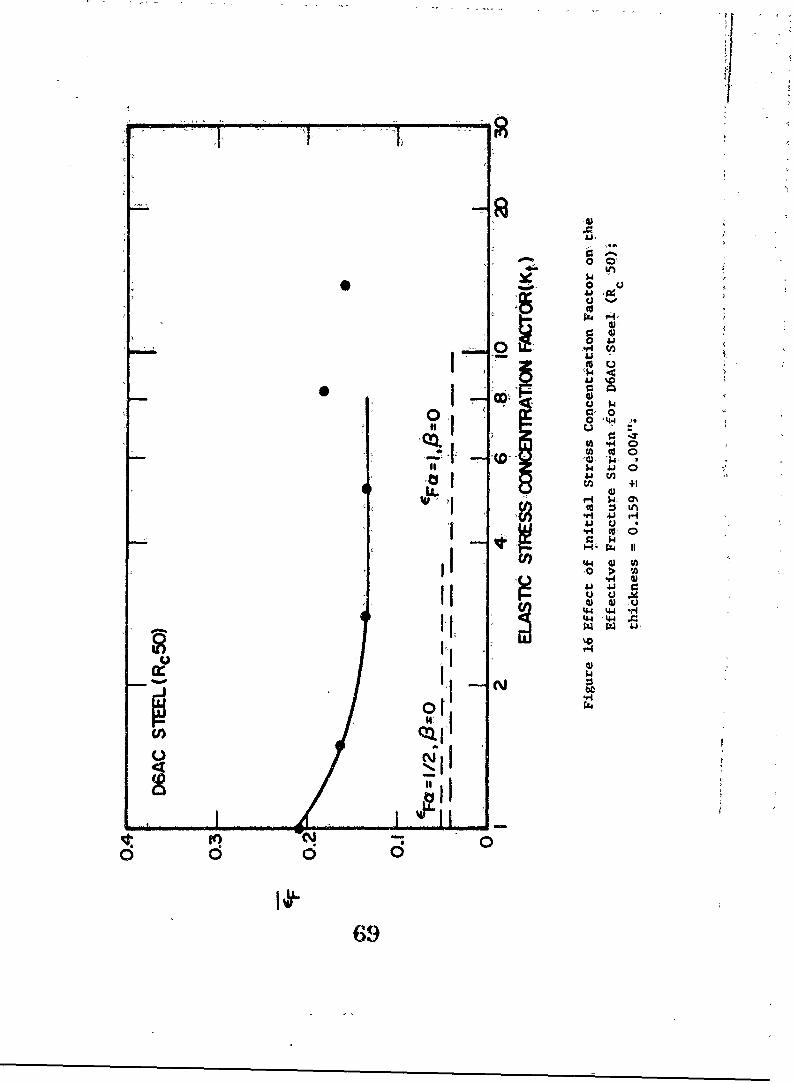
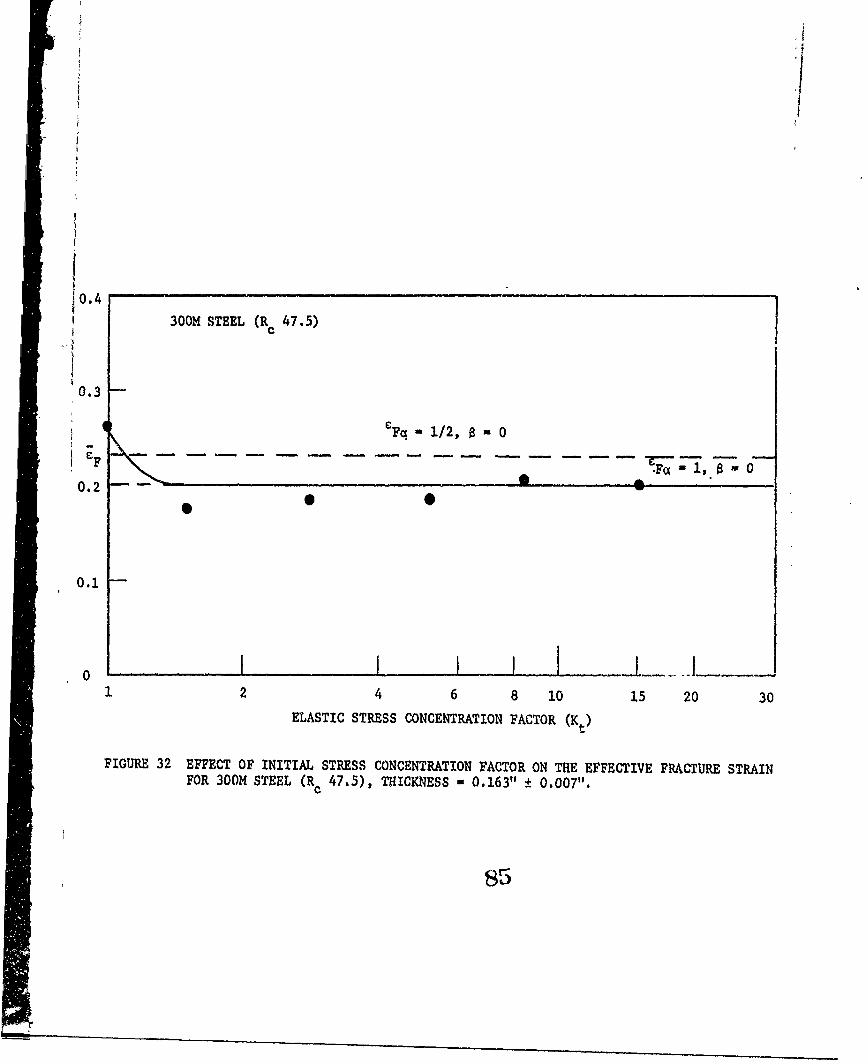
15, 19, 239 27, 31 and 35. The effective fracture strains calculated in
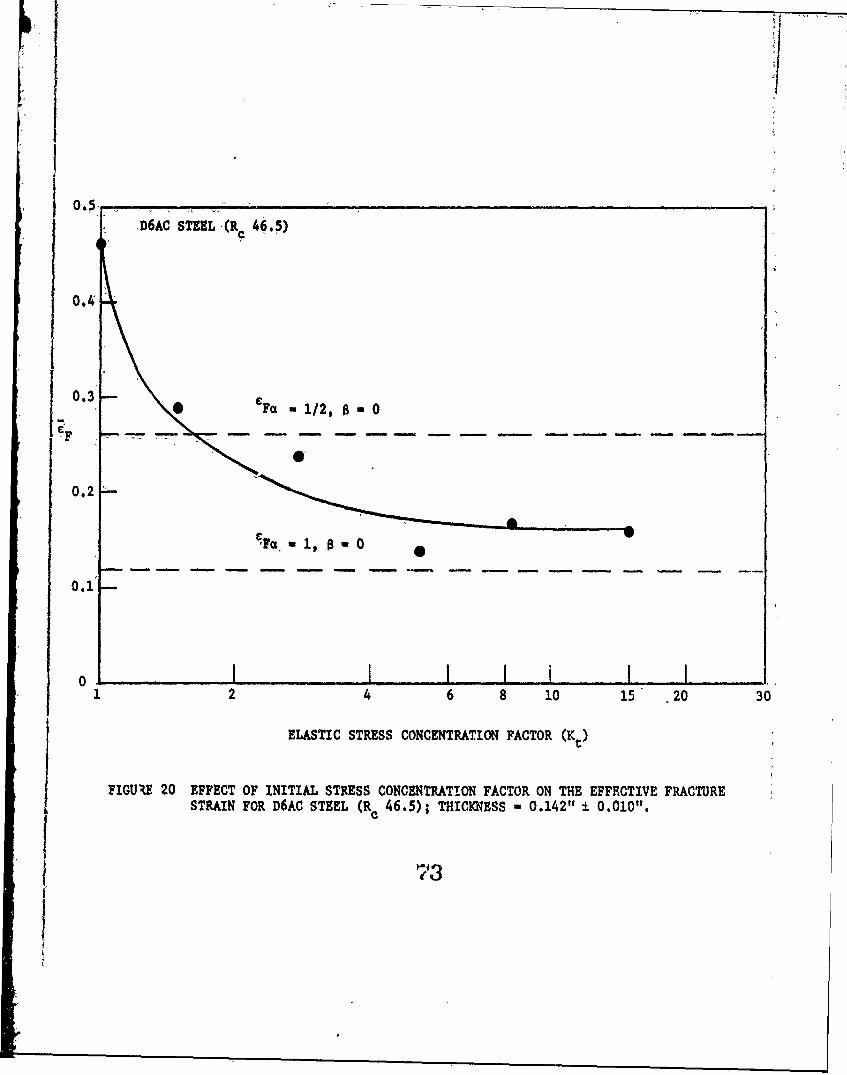
accordance with Equation (20) show a decrease (Figures 16, 20, 24, 28
and 32) with increasing stress concentration factor to a plateau, though
there is some scatter observed at higher stress concentration factors.
The effective fracture strain values obtaine with the lower strength
(Rc 39.0) 300M steel show large amounts of scatter (Figure 36) in the
results and do not seem to decrease to a plateau.
For the sake of comparison the minimum fracture ductility values
obtained from the biaxial ductility teuts are also plotted in Figure 16,
20, 24, 28, 32 and 36. The minimum notch root effective fracture
Page 29
strains lie between the plane strain ductility value c the plunger
Indentition bulge ductility (FiVgres 20 and 24) for D6AC steel
(R 46.5 and 42.5) nd are very clese (Figure 23 and 32) to te
plunjer indentation ductility vzlues for 30ON steel (RC 51.5 and 47.5).
4 The notch roor mnim= strain for D-AC steel (C 50) Is higher (Figure
16) than the minizum blaxial ductility value. the results for the
" 300fl steel (Rc 39.0) show too =ch -scatter to identify any parccular
-trend (Figure 36).
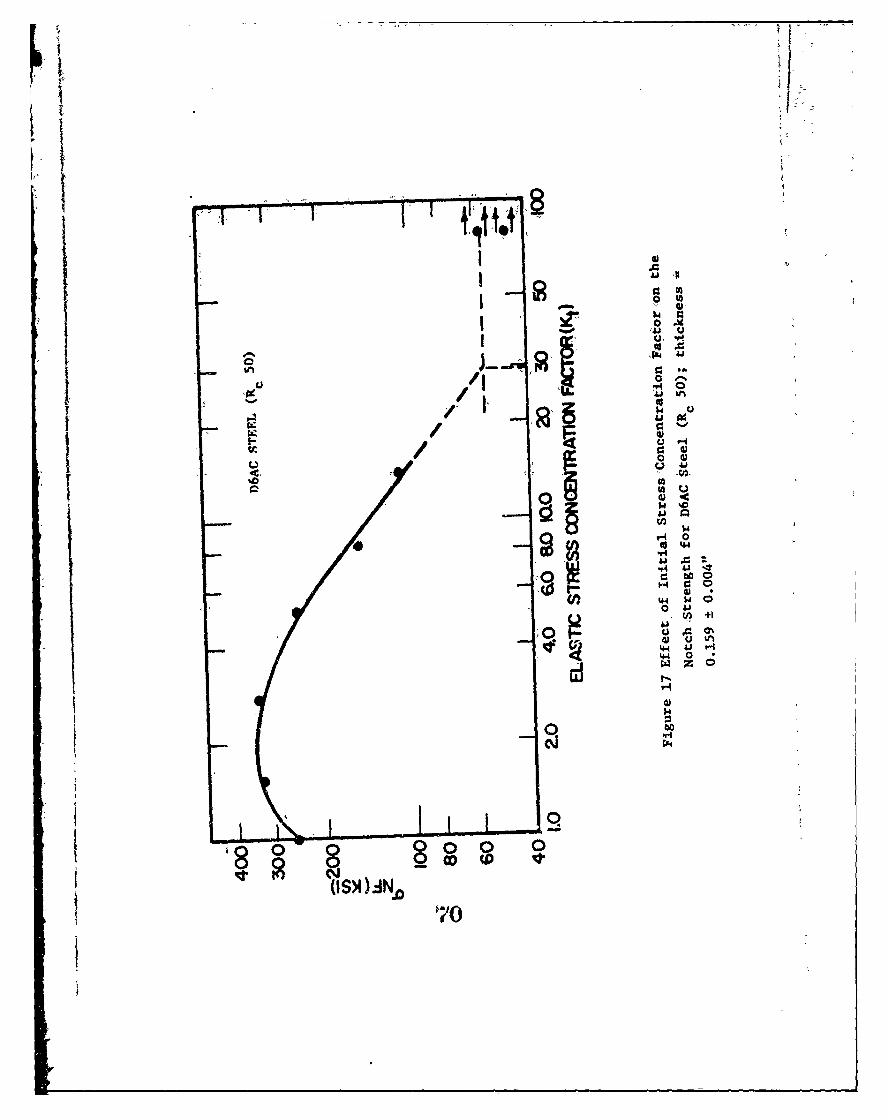
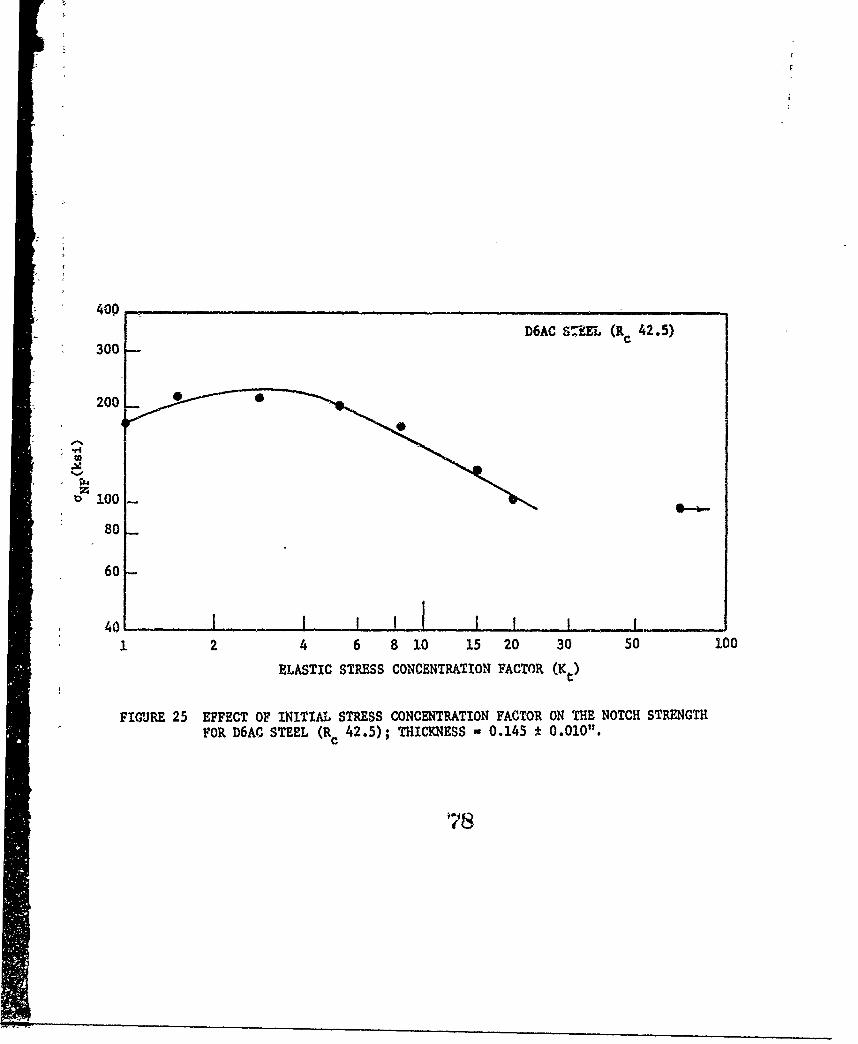
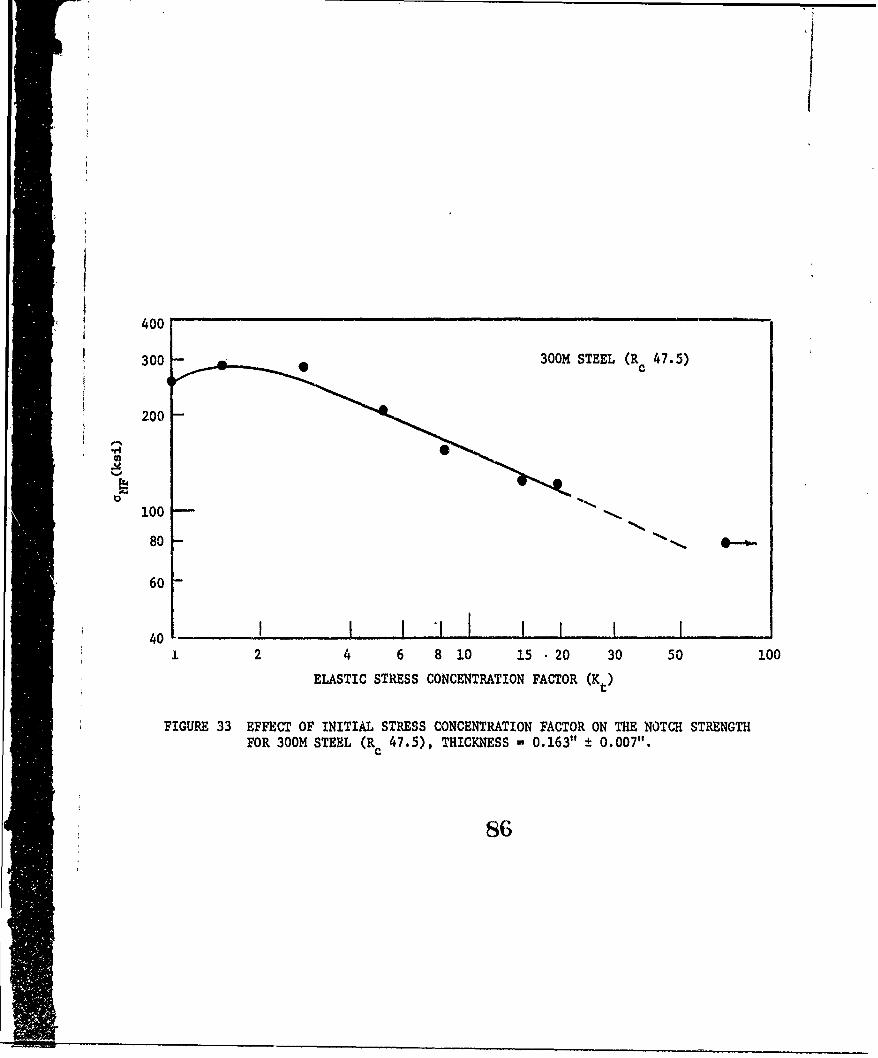
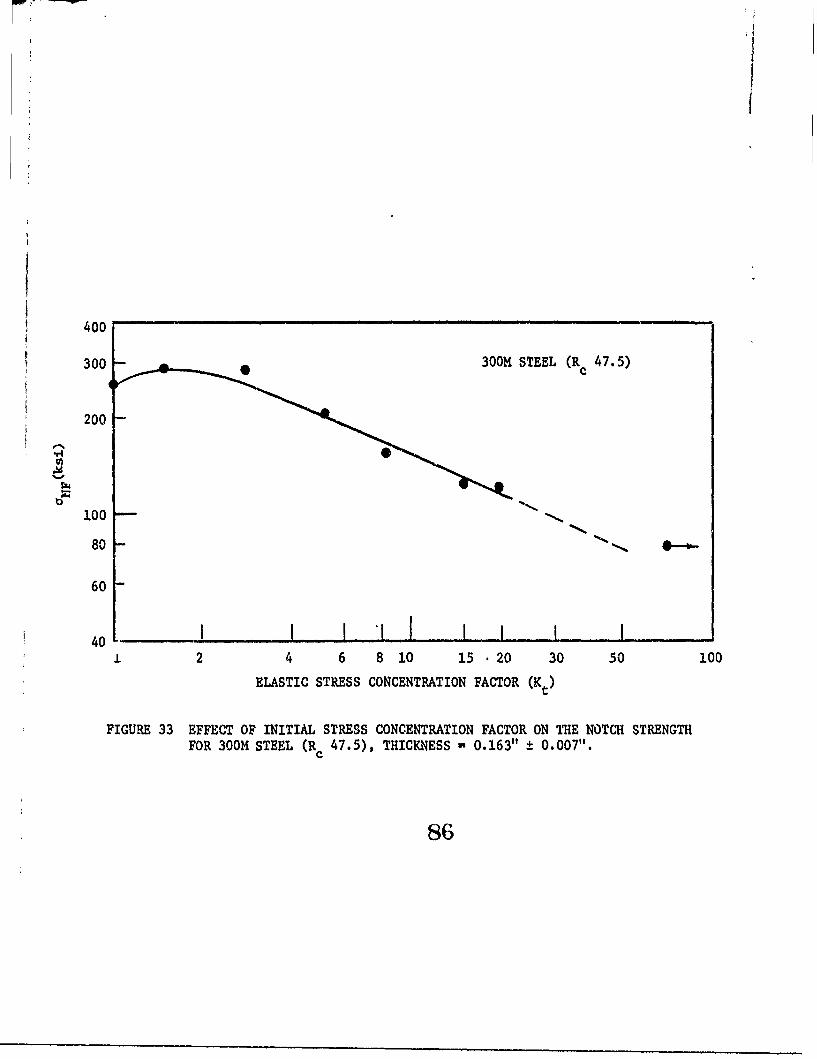
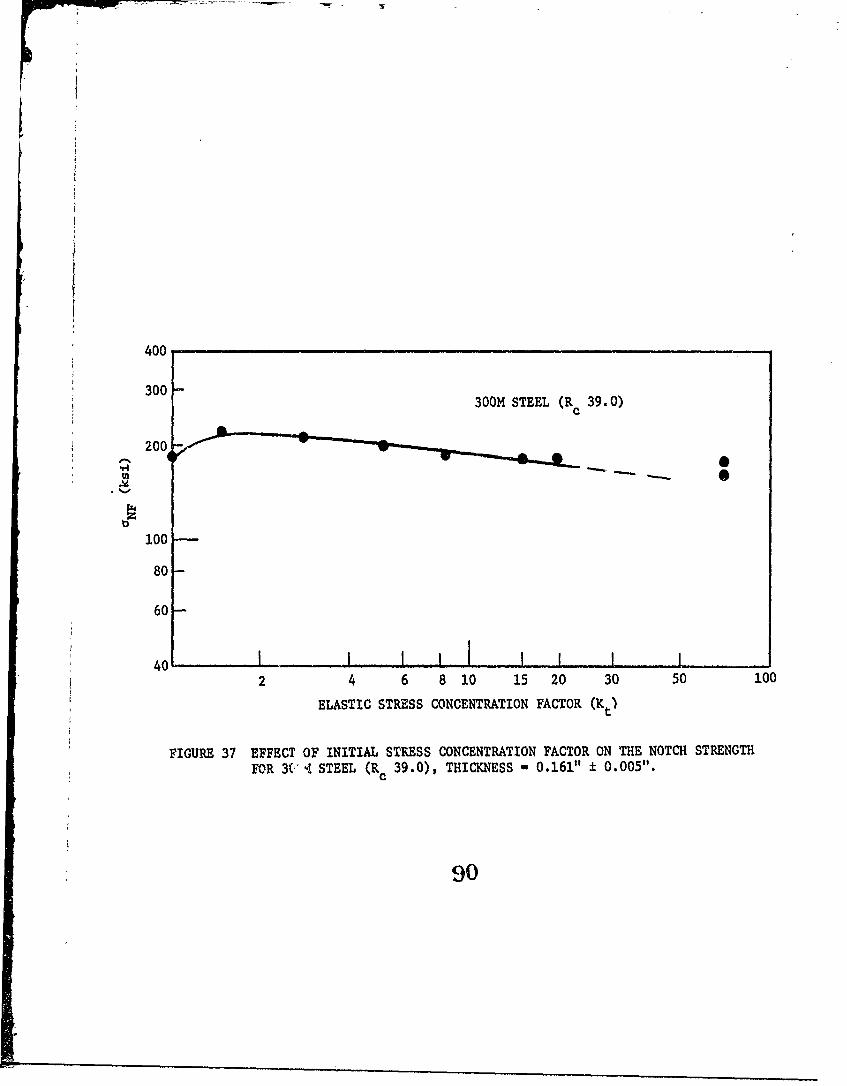
The variation- of notch strength with increasing stress concentra-
tion factors are shewm In Figures 17, 21,. 25, 29, 33 and 37. A11 of
them show an initial notch strengthening followed by a dckrefse in
notch strength with increasing stress concentration factors. The notch
sensitivity, in general, tends to decrease with increas-ng temPering
temperature for both materials, though this is more predominant in
3001 steel. For high K values the cures reach a plateau. Fro-m the
transition point between the decreasing and the fiat portiop of the
(12curve Kt* can be obtained and using the formula
(1 2 )
K* = I + 2,c12o* (23)
where c is the crack length (in this casej the length of the fatigue
crack, p z 0), the appropriate values of the Neuber's micro support effect
constant P* are determined for the materials tested. The values of p*
obtained are 0.0007 inch or 0,0178 mm (Kt* 39), 0.0012 inch or 0.0305 mm
(Kt*= 26), and 0.0014 inch or 0.0356 mm (K * 24) for D6AC steel having
Page 30
-22-
hardness values of R - 50, R 46.5 and R 42.5 .espectively andC C C
are O.G0CZ inch or 0,005 zo (K:* = 57), 0.0003 inzh or 0.008 m
(Kt* - 51), and 0.0004 Inch or 0.010-= (K* 45) for 3001 steel-
harvlng hardaess Values of R = 51.5. P.C 47. and it 39.0-respetcively.C C
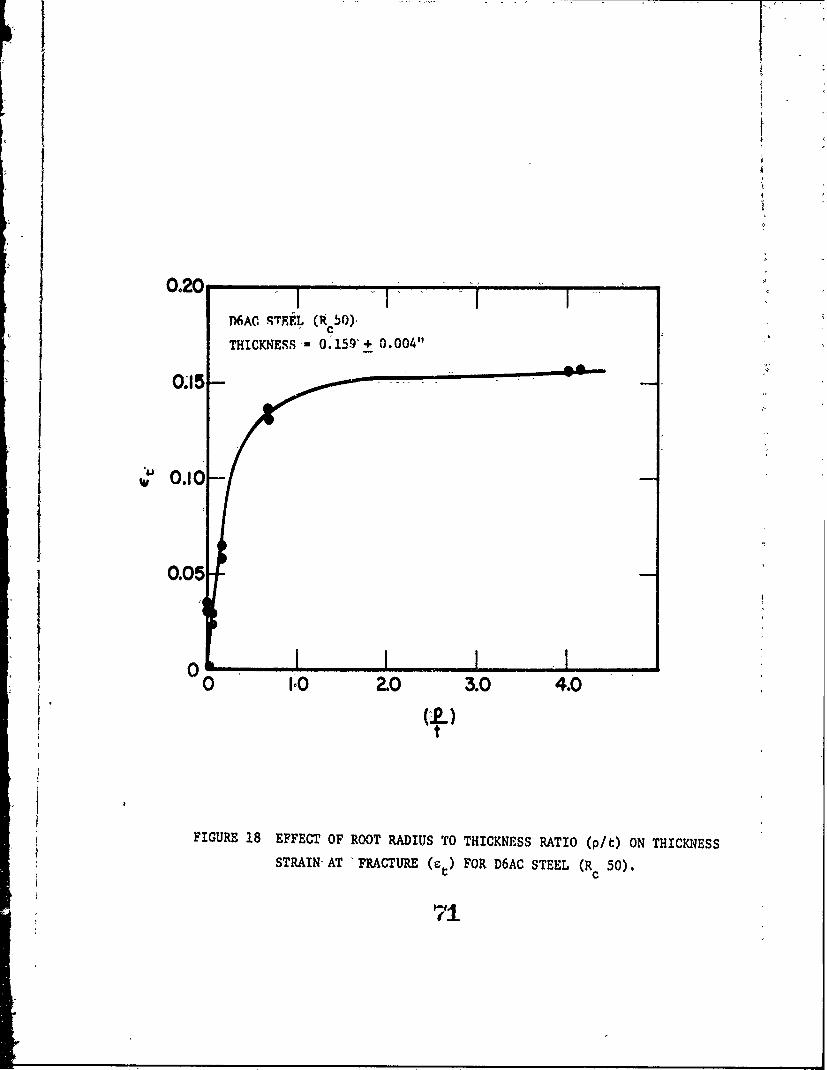
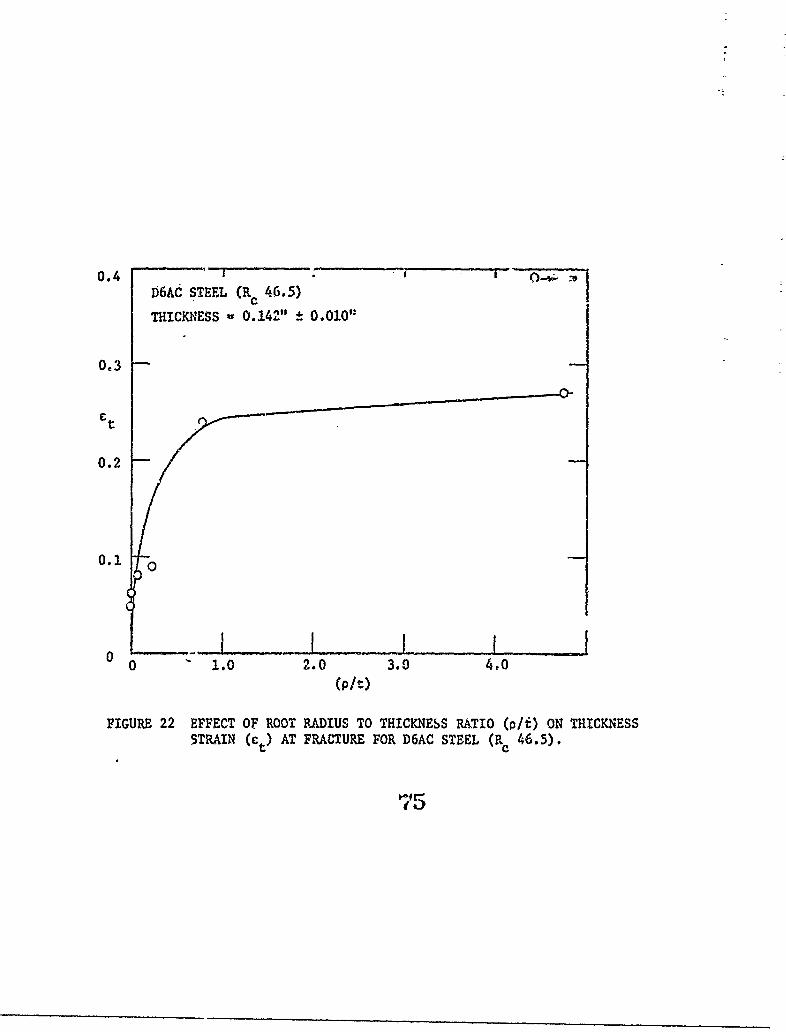
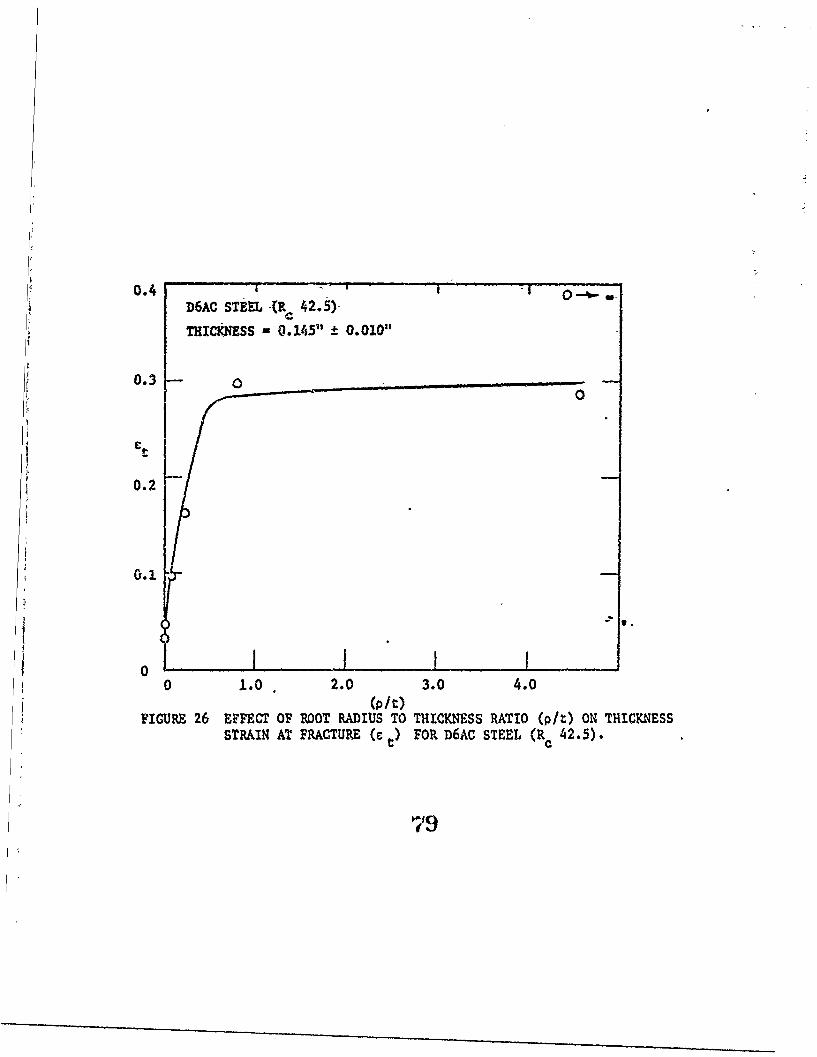
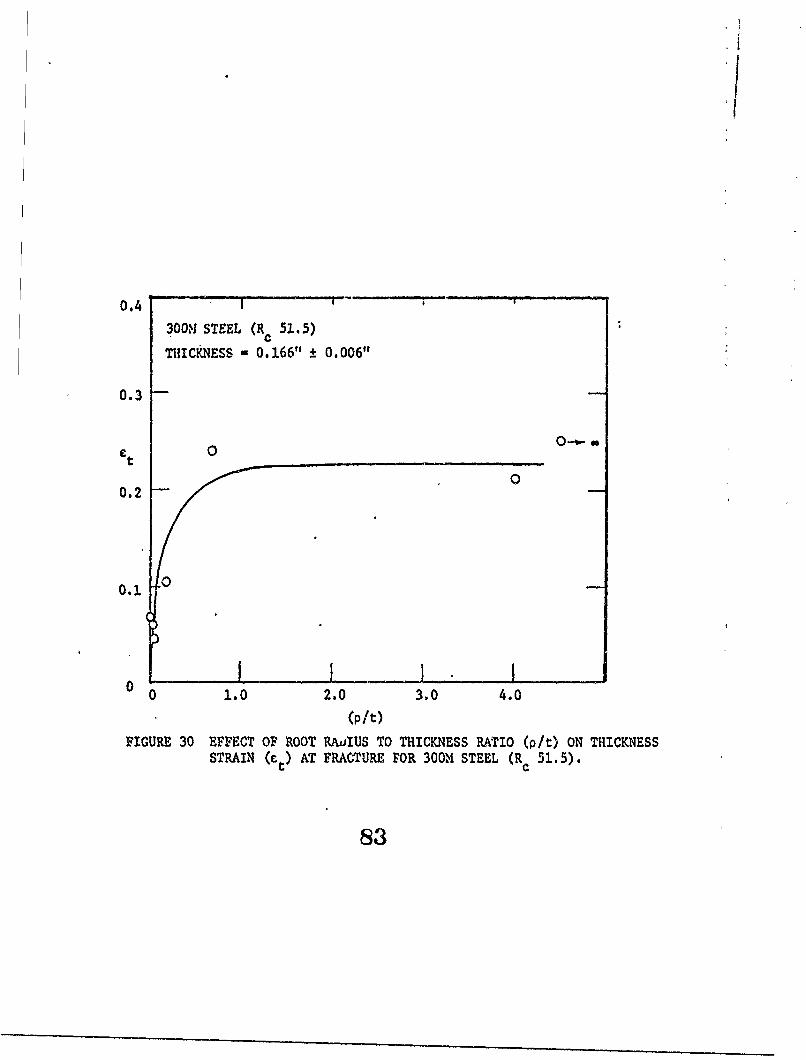
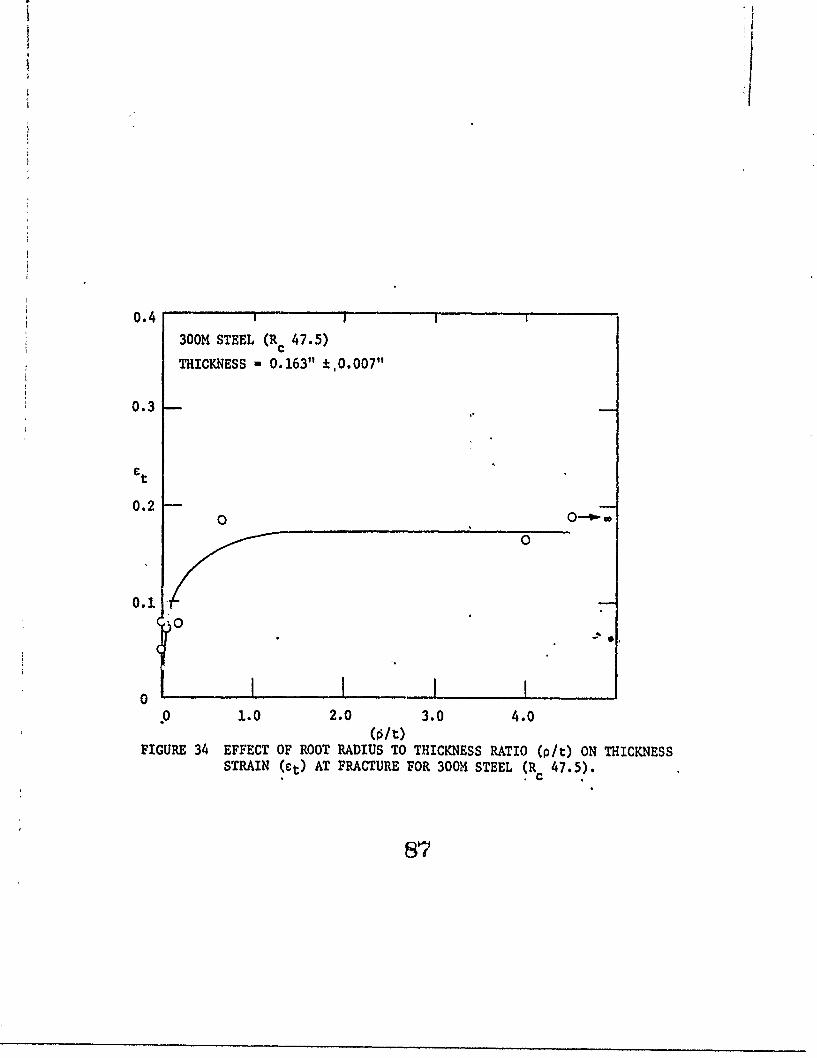
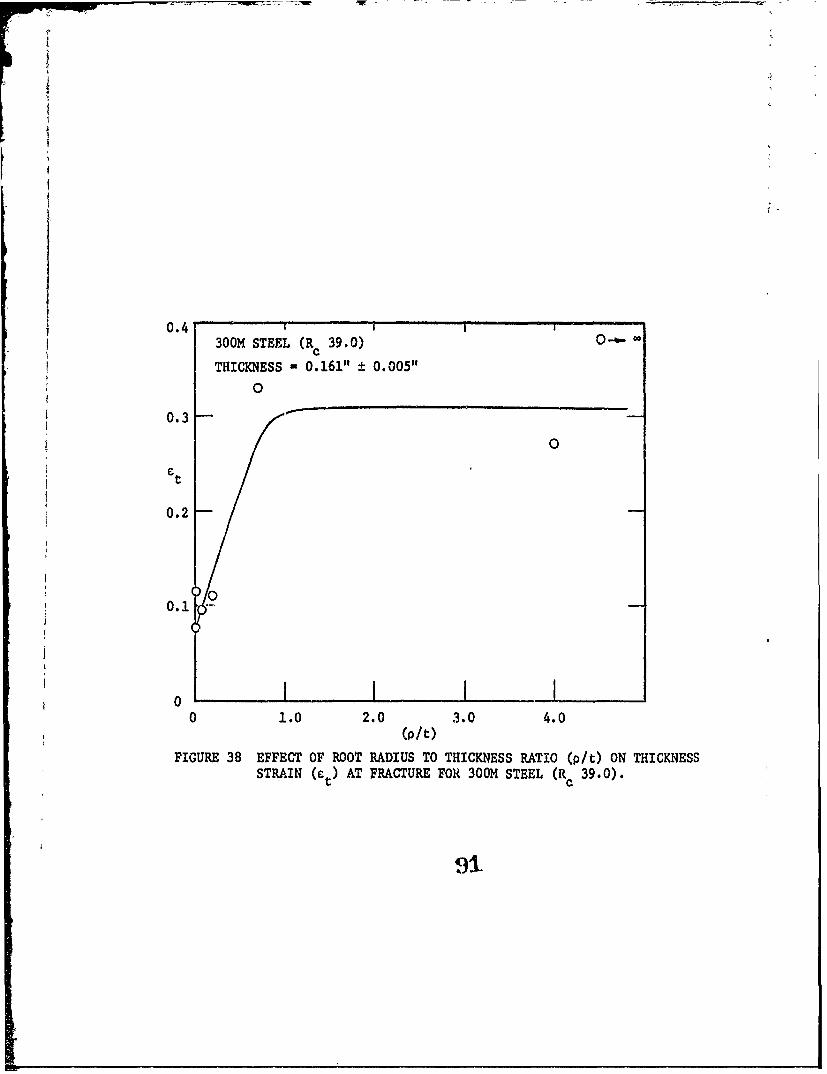
The notch root thickness contraction, zt, ia the sheet thickness
directicn, is -plotted as a function of root radius to thickness ratio
(p/t) in Figures 18, 22, 26, 30, 34 and 38. The data followI the general
(22)trend postulated- by Yoder, Weiss and Liu
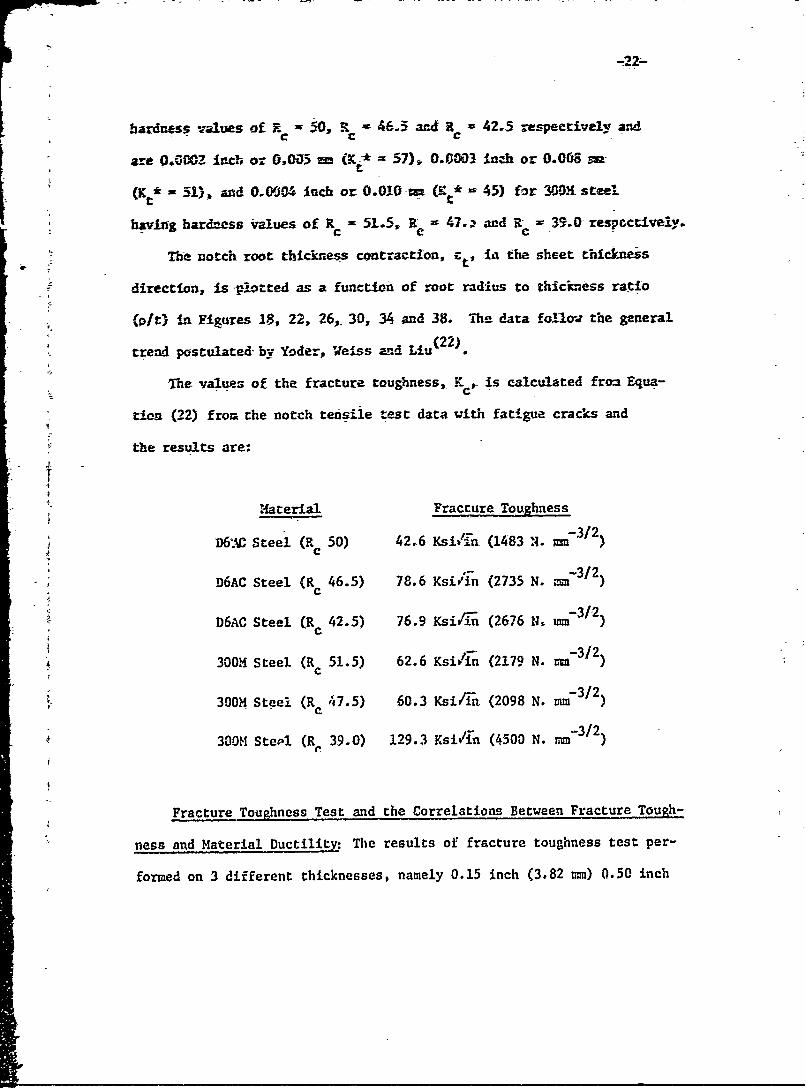
The values of the fracture toughness,- K, is calculated from Equa-
tion (22) from the notch ten sLie test data with fatigue cracks and
the results are:
M aterial Fracture Toughness
D6;.C Steel (R 50) 42.6 KsiC.-i (1483 Ni. 73/2)
, ,- -3/2)
D6AC Steel IR 46.5) 78.6 Ksiwin (2735 N. 31C
D6AC Steel (Rc 42.5) 76.9 Ksi ri1n (2676 Ns mm-3/2)
-3/2)
1300H Steel (Rc 51.5) 62.6 Ksifin (2179 N. MM 3 2
300H Steel (R 47.5) 60.3 Ksi/in (2098 N. MM- 3 / 2 )
300H Ste.- (Re 39.0) 129.3 KsiV/n (4500 N. m - 3/2)
Fracture Toughness Test and the Correlations Between Fracture Tough-
ness and Material Ductility: The results of fracture toughness test per-
formed on 3 different thicknesses, namely 0.15 inch (3.82 mm) 0.50 inch
Page 31
-23-
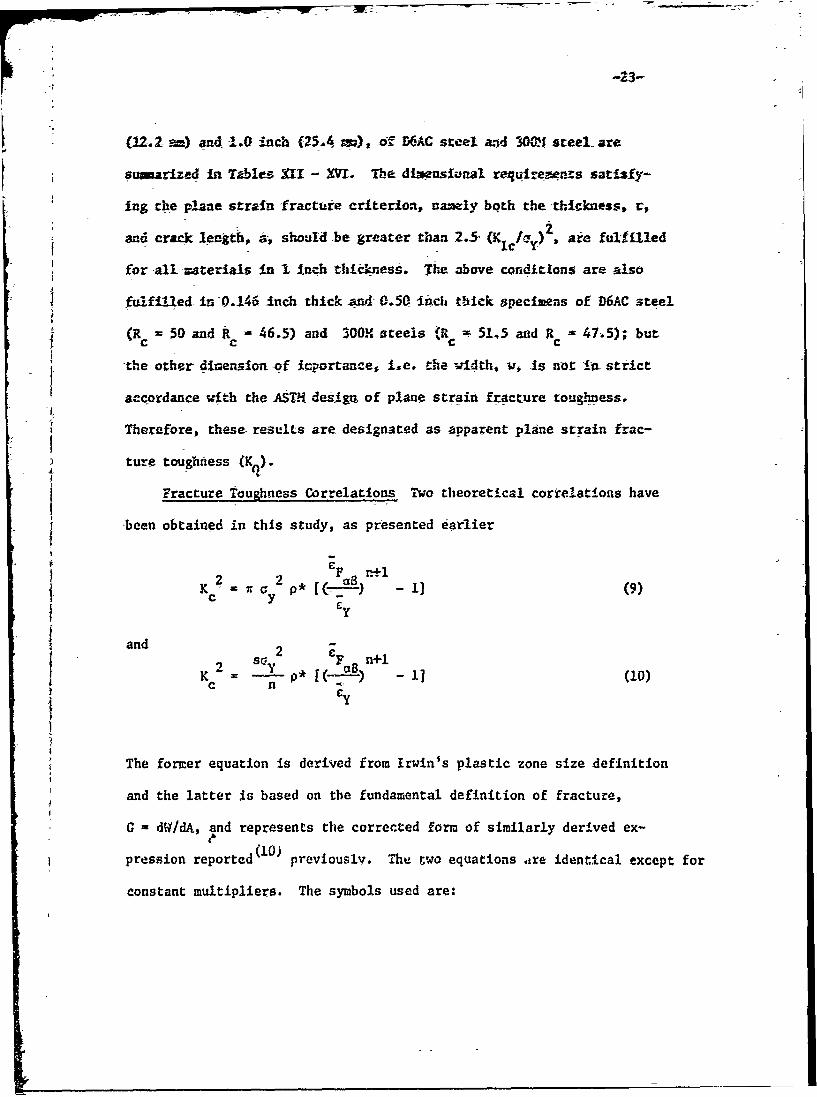
(12.-Z~ am) .o inch (-25.4 ),of D6AC steel a.1d 300!f steel- are
sumarized in Tables III - XVI. The diwasiumal reijuire-neass satisy-
Ing the pla2ne strain -fracturze criterion, na~ely both the thickness, r,
and crack leakth, a&, shou*ld .be greater thaa 2.5 (JK~~ /a are fulftilled
for -all -materials in -1 Inch thickness4. The above conditions are also
fulfilled in -0.1-46 :inch thick And- 0.50 Inh thick tapecimens of D6AC steel
(R 50 and R 46.5) and 300H{ steels (it =F 51,~5 and Rc 47.-5); but
_the other dinenion of 1rportance, i.e. the width, v, is not 1m strict
accordance w-1th the AS11 desilgm of plane- strain fracture toughness.
Therefore, these- results are designated as apparent plane strain frac-
ture- toughness (K.).
Fracture toughness Correlations Two theoretical coritelations have
*-been obtained in this study, as presented earlier
K a ' c P*[ ) -1 (9)
* Yand 2nii
K = * -. w -1] (10)c n
The former equation is derivred from Irwin's plastic zone size definition
and the latter Is based on the fundamental definition of fracture,
G - dtddA, and represents the corrected form of similarly derived ex-
pression reported(O previouslv. The rwo equations ire identical except for
constant multipliers. The symbols used are:
Page 32
-- 24-
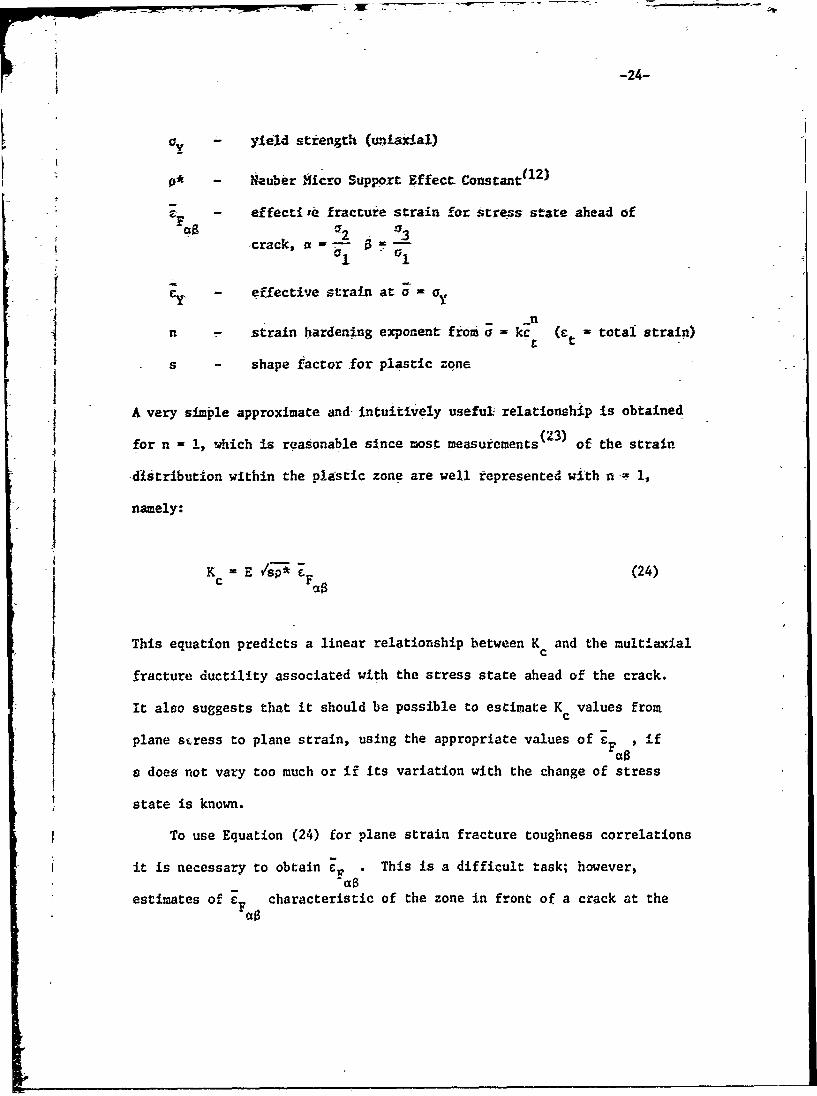
ov - yield strength (unlaidal)
0* - Nuber 4icro Support Effect Constant( 1 2 )
effecti ,e fracture strain for stress- state ahead ofa 0
-c ra ck , a - - -
i -ic. effective strain a t a- a
n - strain hardening exponent from a = kc (e= total strain)Ct t
s - shape factor .for plastic zoneIA very simple approximate and- intuitively useful relationship is obtained
for n - 1, hich is rea-sonable since most measurements of the strain
-distribution within the plastic zone are well represented with n =- 1,
namely:
Kc E /;p* C F (24)
This equation predicts a linear relationship between K and the multiaxial
fracture ductility associated with the stress state ahead of the crack.
It also suggests that it should be possible to estimate Kc values from
plane sLress to plane strain, using the appropriate values of C
a does not vary too much or if its variation with the change of stress
state is known.
To use Equation (24) for plane strain fracture toughness correlations
it is necessary to obtain e1 . This is a difficult task; however,
estimates of C characteristic of the zone in front of a crack at the
Page 33
-25-
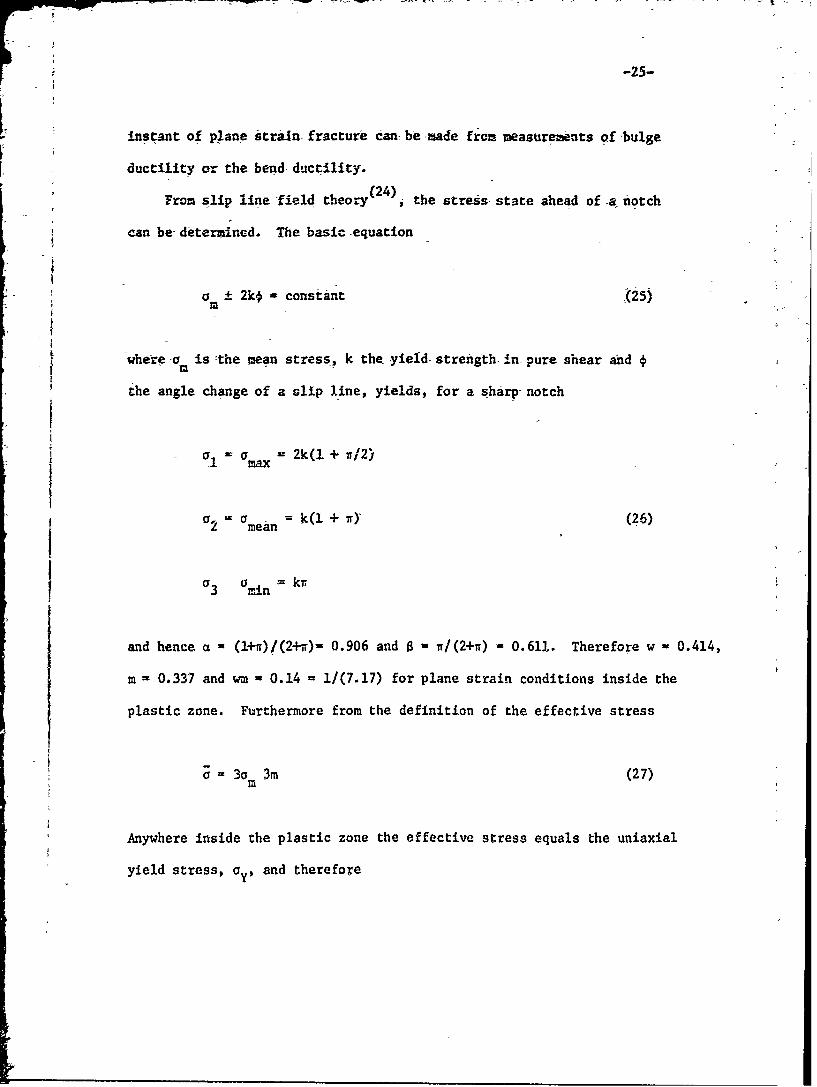
instant of plane strain fracture can: be -made from measurements of bulgeV
ductility or the bend-ductility.
From slip line field theory (24), the stress state ahead of a notch
can be-determined. The basic equation
o -2k - constant J25)
m
where -a is :the mean stress., k the, yield- strength- in-pure shear and
the angle change of a slip line, yields, for a sharp-notch
c 2 ' ea =k(1+r) (26)
a3 amin = kr
and hence a = (1+,)/(2+ir)= 0.906 and 0 w i/(2+7r) 0.611. Therefore w - 0.414,
m = 0.337 and wm - 0.14 = 1/(7.17) for plane strain conditions inside the
plastic zone. Furthermore from the definition of the effective stress
a- 3a 3m (27)m
Anywhere inside the plastic zone the effective stress equals the uniaxial
yield stress, ay, and therefore
Page 34
-26-
a 3% wi (28)-UY
alsoa m k(I + w) (29)
For the Hencky-von, Mises yield-pcriterion ay = /3k. Putting the value in
Equatidn (28) and substituting in Equation (2§) one also obtains
2m- 1/(7.17), -as already, shown4-bove. Fot the ratio of fracture ductilities
for'different stress states one obtainis
tV
2 = (2) I/n(30)1 l
for the mean stress (volume strain) failure postulate, and
_F- m- 1/2
AM) (31)C 1
F1
for a maximum normal stress failure postulate. For n I the ratio be-
tween bulge ductility and plane strain fracture ductility is
(CFps/CFa 1 8 0) = 0.28 for the volume strain fracture postulate; and
(C /CF ) = 0.34 for the maximum normal stress failure criterion.
Similarly, the relationship for the bend ductilities, c, , are
Page 35
-:27-
( F / F )- = 0.24 for the -volume strain fracture postulate and
~ps a-1l/2,40::~ w sirc r
Eqttation (24) Can be rewritten for the plane strain fracture don-
K " (32)
Ic 4F
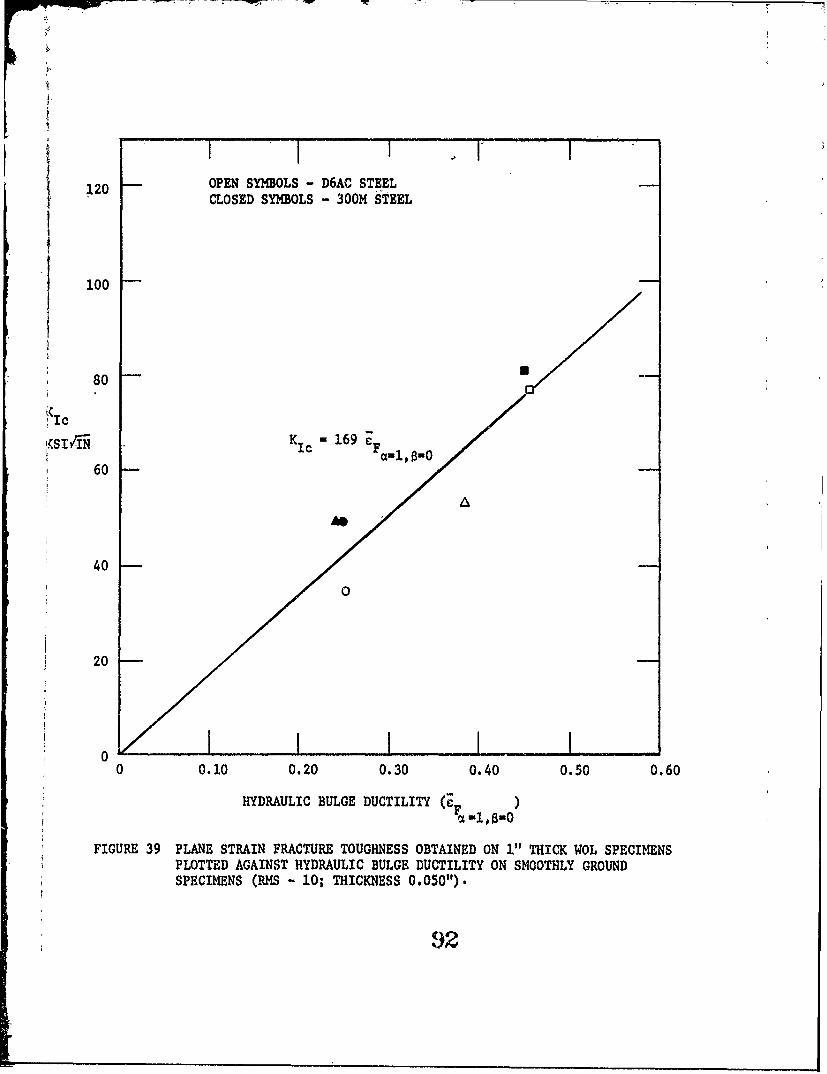
Correlating Kc with the-bulge ductility one-obtains,for v 1/1,
K IC 0.32 Es/ * -i F (vol. strain frac.) (33)
KIc " 0.39 E/;" PF 8I (maxm. normal stress frac.) (34)
Figure 39 shows the plot of K c values obtained on.1 inch (25.4 mm) WOL
specimens vs. the hydraulic bulge ductility on smoothly ground (10 micro-
inches RMS) specimens of thickness - 0.050 inch (1.27 mm). It shows a
very good correlation with
K ic= 169 eF (35)
A rough calculation of the shape factor s yields the value of 0.54
for n = 1. Taking the Young's modulus E = 28.5 x 10³ ksi, Equation (35)
and (37) yields a value of p* = 6.4 x 10⁻⁴ inch (0.016 mm) with the
volume strain fracture criterion and Equation (36) and (37) yields a
Page 36
value of p* - 4.28 x 10 4 inch (0.0109 am) for the critical normal
stress failure post-ulate. This value of P* calculated from thi slope
of the line is very close to the average value of p* for these -steels
obtained from the notch tensile test; approximately 7.0 x 10⁻⁴ inch,
(0.0178 m).
Similar correlations '.etween plane strain fracture toughness ALd
the bend ductility may be obtained by expressing the plane strain
fracture ductility ahead of the crack tip region in terms .of e
Thus one obtains
K 0.28 Es-p7'-Z (vol. strain frac.) (36)IC F= 1 1 2 , 0
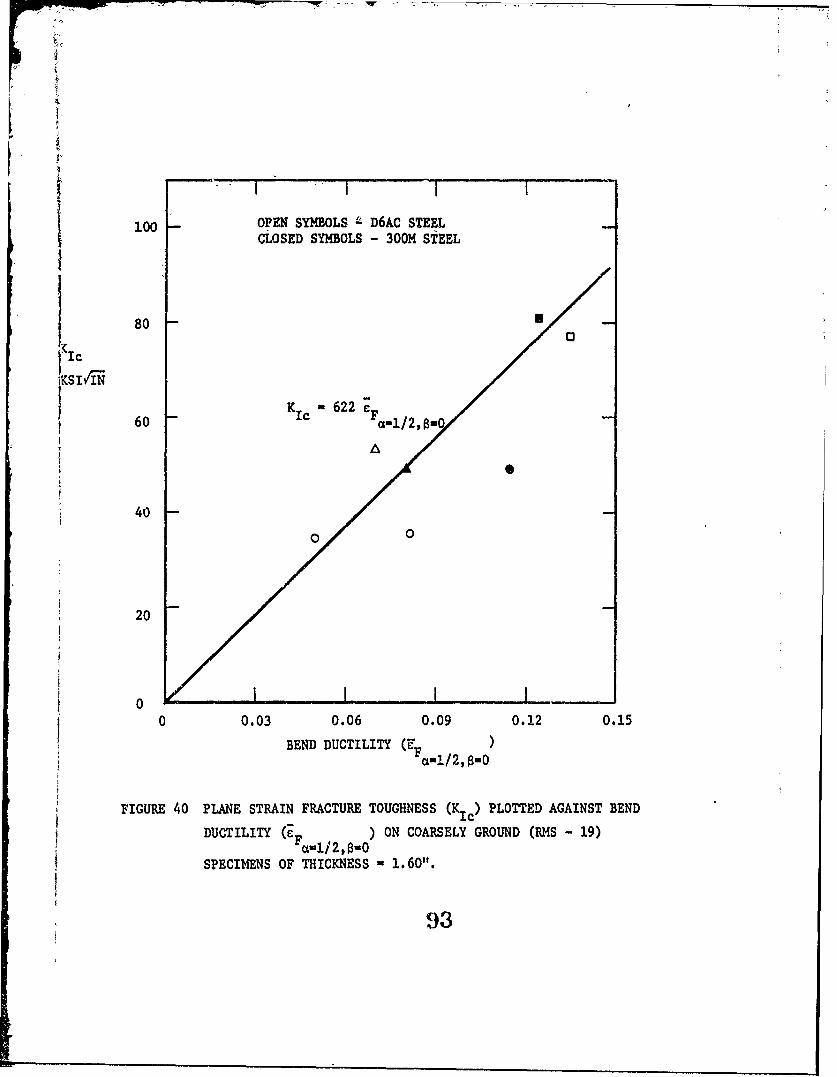
K Ic 0.45 E-W *e: /2 (maxm. normal stress frac.) (37)
Figure 40 shows the plot of Kic values obtained on 1 inch (25.4 mm) WOL
specimens against the bend ductility values obtained on coarsely ground
(RMS - 19) specimens of average thickness 0.15 inch (3.81 mm). Here
again the data fall on a straight line with
KIc =622 cF (38)c=i/2,8=0
The calculated p* values do not agree with those obtained from the notch
-4data, namely 7 x 10 inch (0.0178 mm). This could be attributed to
the poor surface finish of the bend specimens. Also the plastic zone
shape factor s could be different.
Page 37
-29-
To obtain the value of fracture tou'ghness -for non-plane strain
conditions, -it -is necess-ary, to know the-'c corre9spodingtothe stress
state ahead 6f the crack. The elastic solution (5 of the-stress field
ahead of a crack suggests a stress state-a - a2/al 1, 8 - 03/o1 = 0
for the plane stress condition. Thus the balan.ed biaxial ductility can
directly be used to obtain the plane stress fracture toughness as
k E F (39)1aal, 8-0
Comparing-Equation (39) with. Equations (33) and (34) we find that the
plane stress fracture toughness is given by a line throughthe origin
with a slope which is approximately 3.13 times steeper than that for
'the KIc- correlation line for the volume strain fracture concept and
2.57 times steeper than that for the K c-correlation line for the
critical normal stress fracture criterion. Accordingly from Equation (37)
the predicted plane stress fracture toughness values for these steels are
given by
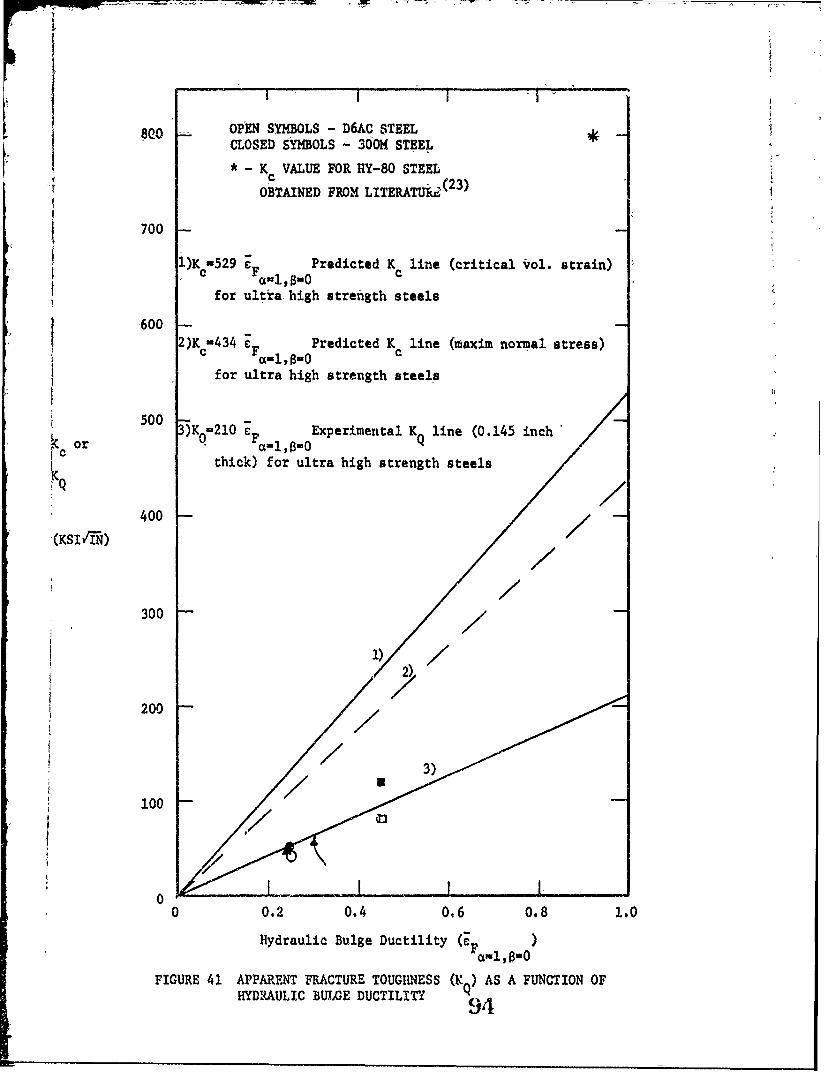
Kc - 529 cF (vol. strain frac.) (40)ct'l, -O
K = 434 eF (maxm. normal stress frac.) (41)Kc a=l,an0
It was not possible to obtain true plane stress fracture toughness value
K experimentally. However, all the apparent fracture toughness (KQ)iC
Page 38
values obtained in-thinner specimens lie within the above limit when
based on the hydraulic bulge ductility (Figure 41). The figure also
shows the plot of the data for annealed HY-80 steel, a mediih strength
tough structural material. The hydraulic bulge ductility was measured
to be,0.92 and the literature 2 value of fracture toughness was
800 ksi in (27840 N. m Since the value of p* for this steel is
not known it is difficult to comment on this particular point-; however,
if the suggested correlation canbe extended for these-materials, it
seems that p* value for this steel should be about 4 times the value
obtained for ultra high strength steels, i.e. approximately 3 x 10 - inch
compared to 7 x 10- inch obtained as the average p* value for D6AC and
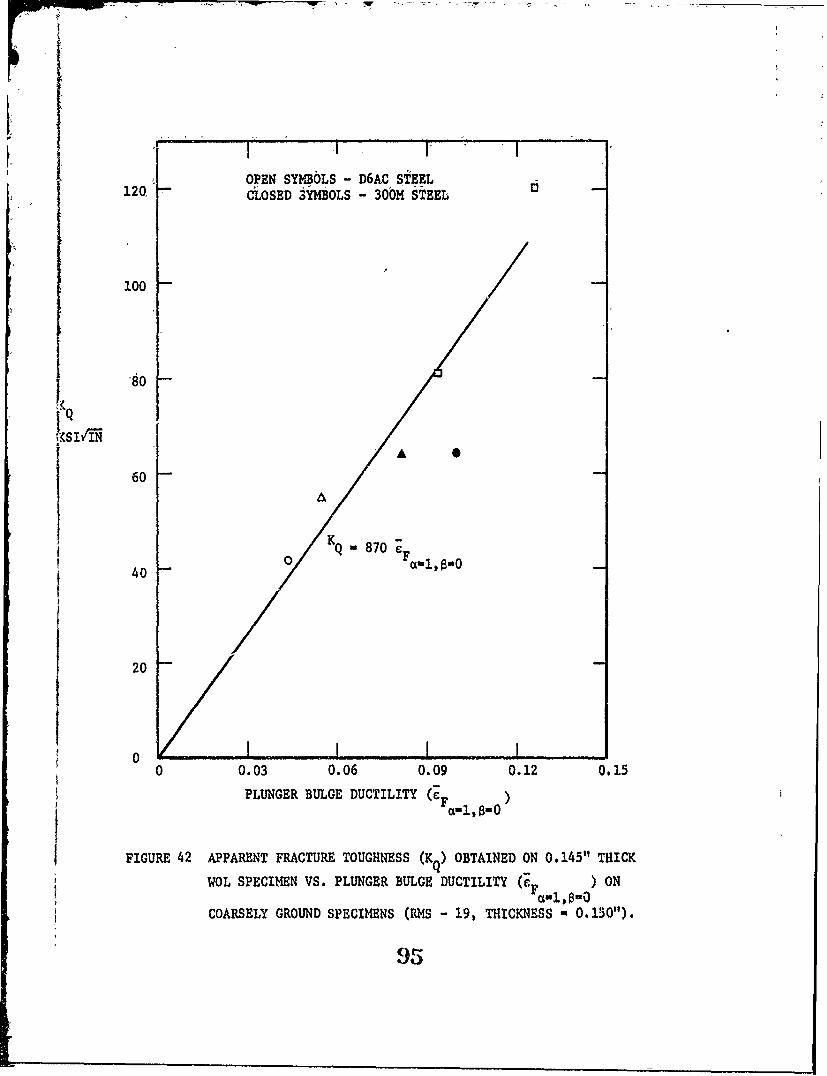
300M steel. If the plunger indentation ductility correlation is -made,
the data seem to lie on a line having slope 870 ksi AW (Figure 42), i.e.,
K 870 cF (41)
This slope is higher than that predicted by the upper limit given by
Equation (40).
Although the elastic solutions suggest a balanced biaxial stress state
in tie region ahead of a crack, direct measurements (26) of strain in the
vicinity of a crack showed that a stress state producing c = 0 exists
where x is the direction in the crack plane along the width. Thus
for the plane stress case this leads to a stress state corresponding to
the biaxial bend test and therefore the plane stress fracture toughness
(K ) can be correlated with bend ductility, i.e.
[C
Page 39
-" -31- "
- K
k c E Vsp* eF a12 i (42)
i Equation (42) when compared with Equatiqns (36) and (37). suggests that
the Kc vs. line will have a slope which is 3.57 times
greater than the slope of K VS. e line for the volume strain,. %-1/2,0-0
fracture criterion and is 2.22 tizes greater than the slope of the
K vs. e line for the maximum normal stress failure criterion,.
'Thus for the materials tested, Equation (42) predicts
- 2220 F (vol. strain frac.)
~(43)
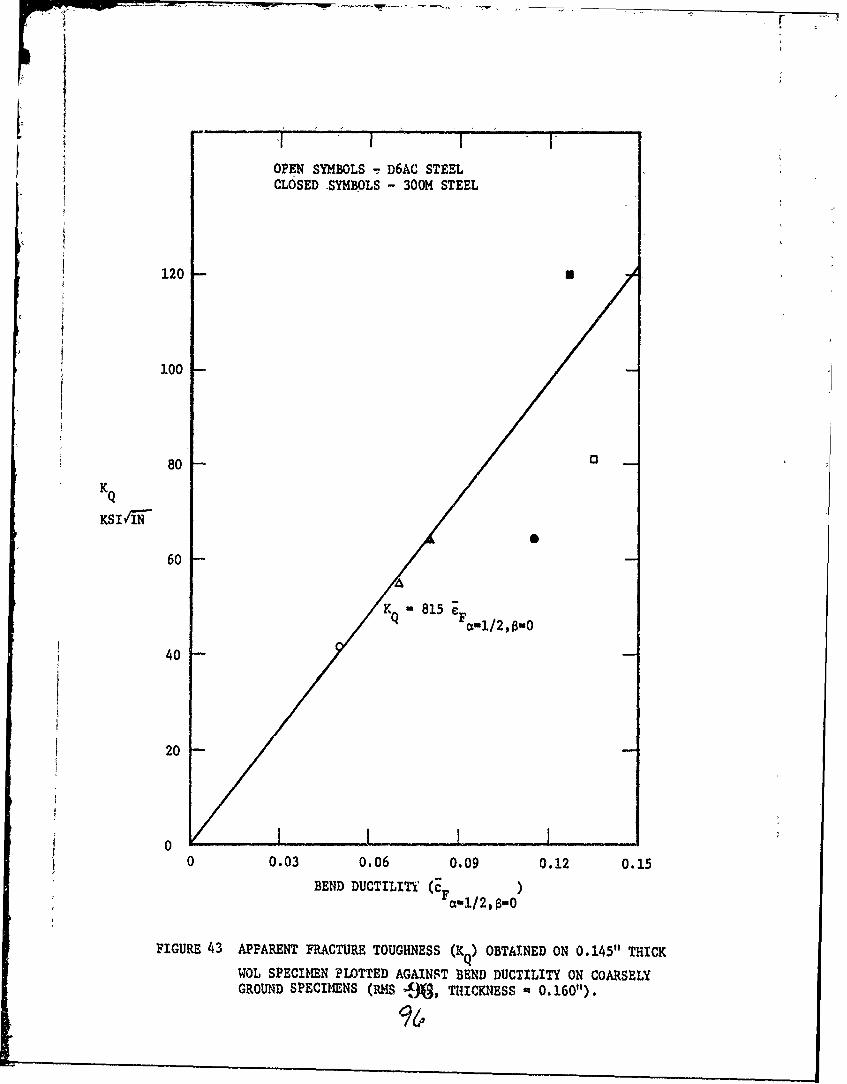
Kc - 1380 -cF (maxm. normal stress frac.)
Figure 43 shows a plot of apparent fracture toughness (KQ) values ob-
tained on 0.150 inch (3.81 mm) thick WOL specimens against bend ductility
(eF a 1 /2,a0 ) obtained on coarsely ground specimens (19 micro-inches RMS).
The data can be represented by a straigth line as
K - 815 e (44)QFaf1/2,0-0
This slope 815 ksilin lies within the limit predicted by Equation (43).
I__I
Page 40
-32-
SUMMARY AND CONCLUSIONtjThe relationships between fracture toughness and material ductility
were studied for high strength steels, D6AC and 300M, each heat treated
to three strength levels. The results are summarized as follows:
1. Biaxial ductility tests on-D6AC steel (hardness R 50, R 46.5c C
and R 42.5) and 300M steel (hardness R 51.5, R 47.5 and R 39.0)c c c c
showed that the fracture ductility decreased significantly on going
from the uniaxial stress state (tension test) to the plane strain
stress state (bend test or Clausing type tension test) to the balanced
biaxial condition (bulge test or plunger bulge test). The effective
fracture strain is generally reduced to a value of less than half the
value of the tensile fracture strain and sometimes to a value as low
as 12% of the tensile fracture ductility. A strong influence of the
surface finish was noted. This gave rise to some scatter, particularly
for the bulge tests.
2. Notch tensile tests on D6AC steel (hardness R 50, R 46.5
and Rc 42.5) and 300M steel (Rc 51.5, Rc 47.5 and Rc 39.0) showed
that the notch sensitivity decreases with increasing tempering
temperature for both materials, with the reduction being somewhat
greater for 300M steel. The values of the Neuber micro support
effect constant, p*, were determined and found to vary from 0.0002
inches (0.005 mm) (300M steel hardness R 51.5) to 0.0014 inches
Page 41
12 -33-
(0.035.mm) D6AC steel, hardness R 42.5). Measurement of the effectivec
fracture strain at the notch root showed a general trend of decreasing
notch root fracture strain with increasing stress concentration factor.
In general the minimum values of the notch root effective fracture strain
lie close to the plunger ductility for 300M steel (hardness Rc 51.5 and
R 47.5), higher for D6AC steel (hardness R 50) and between the bendc c
andplunger ductility for D6AC steel (hardness R 46.5 and R 42.5).C c
For 300M steel (hardness R 39), the scatter in the data was too largec
to identify a trend.
3. The analytical studies yield a correlation between fracture
toughness and ductility which assume a simple form for negligible
plasticity, namely, K = E 'sp* -c , where E is the modulus of elas-c 8
ticity, s the shape factor for the plastic zone (approximately 0.54 for
n - 1), p* the Neuber micro support effect constant, cF the effective
fracture strain corresponding to the stress state a,$ representing the
condition ahead of a crack.
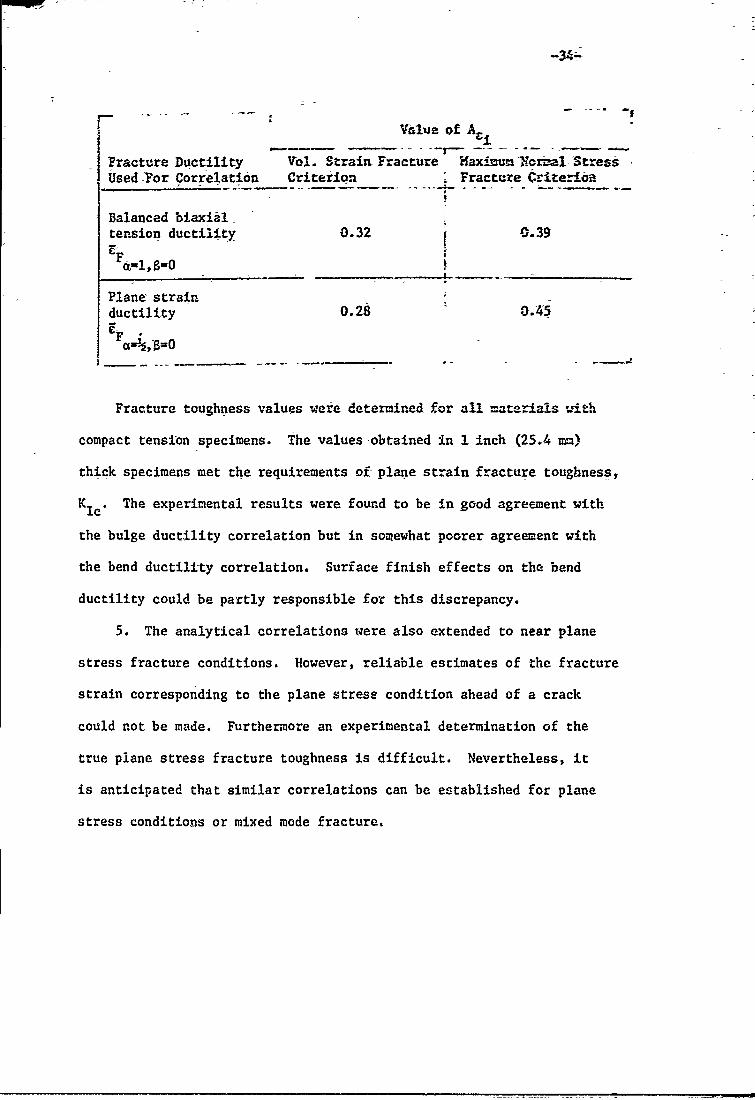
4. To estimate the plane strain fracture toughness, Klc, from
easily measureable ductility values, c: the relationship Klc' ACiE sp* -
is suggested, where A is a constant corresponding to the stress stateCi
for which the ductility ci was measured. The table below gives the
value of A for various fracture ductility correlations and failureCi
criteria
Page 42
Vr1ie of A- -
Fracture Ductility Vol. Strain Fracture Maxium Ncrr-l- StressUsed'For Correlation Criterion Fracture CriteriOa
Balanced biaxiatension ductility 0.32 I .39
Plane strainductility 0.28 o.45
Fracture toughness values were determined for all materials uith
compact tension specimens. The values -obtained in I inch (25.4 mm)
thick specimens met the requirements of plane strain fracture toughness,
K Ic. The experimental results were found to be in good agreement with
the bulge ductility correlation but in somewhat poorer agreement with
the bend ductility correlation. Surface finish effects on the bend
ductility could be partly responsible for this discrepancy.
5. The analytical correlations were also extended to near plane
stress fracture conditions. However, reliable estimates of the fracture
strain corresponding to the plane strese condition ahead of a crack
could not be made. Furthermore an experimental determination of the
true plane stress fracture toughness is difficult. Nevertheless, it
is anticipated that similar correlations can be established for plane
stress conditions or mixed mode fracture.
Page 43
-35- .
6. Finally, since both the bulge and 1;--d ductility values were
very sensit~ive to the surface preparation, it is necessary to resolve
the effects of such factors as surface Jinish, residual stresses,
Metallurgical variations on the surface ec-. before the analytIcal
correlations developed can be effectively utilized as a basis for
the development of taterials selection and acceptance--standards.
Page 44
-36-
REFEXCES
1. -Cortre-l1, A.HL Proc. Roy. Soc., X. 282, No. 138S (1964), p. 2-.
2. 'Wells, A. A., Bric. Weld. journal, v. 10, (1963), p.'563.
3. BUeuwkes, R., Jr., Surfaces and lnrtrfaces I1 Syrracuse 'UniversityPress, (1968), p. 277.
4. Xkafft, 1.11., "Fracture Toughness of Metals, R~eport -of WRL Progress,Novezber (A963), also: Applied Materials Research, X. 1, (1964), p. 88.
5. Yoder, G.R, '"Macrofractographic. Lines Ir. Haraging Steel: Correlations,with Fracture Toughness," Personal Co~zunicatioL - to be published-.
6. -Hahn, G.T. and Rosenfield, A.R., Applications Related Phencoena, inTiania= Alloys, ASTH ST? No. 432, p. 5, Am. Soc. Testing Materials*(1968).
7. Barsom, J.H., "Relationship Between Plane-Strain Ductility and KFor Various Steels," First Nati. Congress for Pressure VesselsPiping, San Francisco, Calif., Rfay (1071).
8. Corrigan, D.A., Travis, R.E., Ardito, V.P., and Adams, C.H., Jr.,"Biaxial Strengths of Welds in Heat Treated Steel Sheet," WeldingResearch Supplement, March (1962_), p. 123.
9. Clausing,. D.?., "Effect of Plas'tic Strain Rate in Ductility andToughness," International Journal of Fracture Mechanics, vyol. 6,(1970), p. 71-85.
10. Weiss, V., Sengupta, M., and Lal, D., "The Significance of MaterialDuctility to the Reliability and Load Carrying Capacity of PeakPerformance Structures," Syracuse University Final Report to theNaval Air System Command, OHS-VW1915-F-172,
11. Weiss, V.,, "Material Ductility and Fracture Toughness of Metals,"Paper, Kyoto, Japan (1971), International Conference on MechanicalBehavior of Materials.
12. Weiss, V., Fracture - Treatise on Fracture, editor, H. Liebowitz,Academic Press, vol. 3, (1971), p. 245.
Page 45
[K -37-
RFERECES (COAH-1)
11. !Jeiss, V., "Fracture Mechanids for Design and Failure Analysig,"Unteri= Technical Report August (1970), Submitted to, _S . Navy,Air Syster4 Comand under Contract #f N.0019-7Q-C-0044.
14. Veiss, V. and, Sessler, J.G., "A;nalysls of the Effects of TesrTemperature cn the Notch Strength of High Strength Sheet Alloys,,,Synosim~ on EvaIuaIion -of Metallic Material~s In Design for LowTezzerature Serv;ceAM STP No, 302, Am. Sect. Testing Mats.,(1962), p. 3-.
15. Sahgdahl, G.S., Aul, E.L., and Sachs .G., "An investigation ofthe Stress ind Strain States Occurring in Bendin&- RectangularBars," Proc. Soc. Exp. Stress Analy., vol. 6. zb. 1, (1941), p. 1L
16, Peterson, R.E., "Stress Concentration Design. Factors, Johnt Wiley* and Sons, Inc. (1953).
-17. Ogasawara, Masao, "sCrack-Initiation at Notches in low Cycle Fatigue-Faster's thesis, Syracuse Utfiveristy, June (10969).
* 118. 1970 Annual.Book of ASIX Standards, Part 31, July, Page 911, ASTHDesignation E399-7QT.
19. Srawley, J.E. and Brown, W.E., Jr., "Fracture Toughness TestingMethods," ASTh, STP Ml0, pp. -1-12.9.
20. Azrin, H. and Backofen, W.A., "Deformation and Failure of a BiaxiallyStretched Sheet," -in Metallurgical Transactions, vol. 1, October 1970,
p. 2857-2865.
21. Harciniak, Z. and Kuczniski, K., "Limit Strains in the Processes ofStretch-Forming Sheet Metal," in Journal of Mechanical Sciences,vol. 9, 19679 p. 609-620.
22. Yoder, G., Weiss, V., and Liu, I1.W., "Notch Properties of Some Lowand Medium Strength Constructional Steels," ASME Metals EngineeringConference, Houston, Texas, Welding Research Council Bul~letin #120,p. 21-28, February (1967).
Page 46
i -38-
-REFERECES (CONT,.)
23. Ke, J.S., and Liu, H.U., "International Journal Of Fracture Mechanics,"Vol. 7 (1971), p. 487.
24. Hill, R., "Hathematical Theory of Plasticity," Clarendon Press, Oxford1950.
25. Westergaard, H.M.,-"Bearing Pressures and Cracks," ifi Transactions,American Society of Mechanical Engineers* Journal of AppliedMechanics, 1939.
26. Liu, H.W., Gavigan, W.J., and Ke, J.S., "Crack TIp Deformation inMetallic Plates Beyond General Yielding With Application -to DuctileFracture," Technical Report, Syracuse University Research Institute,Dept. of Chemical Engg. & Metallurgy, MET-HWL-123-0470 (May 1970),
Page 47
TABLE I
Actual Composition of D6-AC Steel
Alloying Percentage
Y Element
C 0.48
Mn 0.83
P 0.010
s 0.005
Si 0.28
Cu 0.15
Ni 0.58
Cr 1.06
Mo 1.01
V 0.10
38CL-
Page 48
TABLE II
Actual Composition of 300M Steel
-Alloying PercentageElement by weight
IC 0.39
Mn 0.85
P 0.008
S 0.005
Si 1.61
Ni 1.80
Cr 0.89
Mo 0.40
V 0.08
139
Page 49
TABLE III. FRACTURE DUCTILITIES AND FRACTURE STRAIN RATIOSAS A FUNCTION OF STRESS STATE FOR D6AC STEEL.
Longitudinal Transverse
Stress Fracture Effective Stress Fracture EffectiveState Strain Fracture State Strain Fracture-(a2/a) Ratio Strain (o2/l I) Ratio Strain
(C F/ eTF) (e F) (F / -TF) (EF)
500*F temper, 2 hours,Rc 50
0 1.0 0.372 1.0 0.30
1/2 0.55* 0.205* 2 0.68* 0.205*
0.14 0.052 0.16 0.048
1 0.116** 0.043** 1 0.143** 0.043**
800*F temper, 2 hours,R 46.5
0 1.0 0.467 c 1.0 0.308
1/2 0.456* 0.212* 2 0.607* 0.187*
0.180 0.082 0.20 0.0631 0.12** 0.055** 1 0.179** 0.055**
II00 F temper, 2 hours,R c 42.5 co0 1.0 0.557 1.0 0.491/2 0.259* 0.144* 2 0.30* 0.148*
0.259 0.144 0.255 0.125
1 0.169** 0.094** 1 0.192** 0.094**
* Indicates the values obtained from tensile test on Clausing specimen
(Figure 3).
** Indicates the values obtained from the plunger bulge test (Figure 4).
40
Page 50
w
TABLE IV. FRACTURE DUCTILITIES AND FRACTURE STRAIN RATIOS-AS A FUNCTION OF STRESS STATE FOR 300M STEEL.
Longitudinal Transverse
Stress Fracture Effective Stress Fracture EffectiveState Strain Fracture State Strain Fracture(a2/a1) Ratio Strain (a2/a) Ratio Strain
- , /TF) (F) eF / TF) ( F)
500*F temper, 2 hours R 51.5
0 1.0 0.446 1.0 0.387
1/2 0.222* 0.099* 2.0 0.297* 0.115*
0.285 0.127 0.269 0.104
1.0 0.224** 0.i0** 1.0 0.258** 0.10**
800*F temper, 2 hours R 47.5
0 1.0 0.412 0 1.0 0.371
1/2 0.260* 0.107* 2.0 0.15* 0.130*
0.192 0.079 $.213 0.079
1.0 0,.199** 0.082** 1.0 0.221** 0.082**
1100*F temper, 2hours Rc 39.0
0 1.0 0.568 c 1.0 0.519
1/2 .287* 0.163* 2.0 0.44* 0.23*
0.194 0.110 0.272 0.141
10 0,222** 0.126** 1.0 0.243** 0.126**
* Indicates the values obtained from tensile test on Clausing specimen
(Figure 3).
** Indicates the values obtained in the plunger bulge test (Figure 4).
41
Page 51
TABLE V. HYDRAULIC BULGE TEST (o2/a 1 1) DATA ON TWO
DIFFERENT THICKNESSES OF D6AC AND 300M STEEL.
Material Initial Final Thickness Effective_ Thickness Thickness Strain Fracture
Alloy,- Temper and (t) (tf) t StrainSpecification-' Hardness inch inch £3 u" ln(" tF = 3
i
500*F, 2 hours Rc 50 0.0515 0.040 -0.253 0.253D6AC Steel 800*F, 2 hours Rc 46.5 -0.0515 0.035 -0.385 0.385
1100*F, 2 hours R 42.5 0.052 0.033 -0.454 0.454
500"F, 2 hours R 51.5 0.0513 0.040 -0.249 0.249
C300M Steel 800*F, 2 hours R c 47.5 0.0518 0.0405 -0.247 0.247
1100*F, 2 hours R 39.0 0.0515 * *
500*F, 2 hours Rc 50 0.0765 * * *
D6AC Steel 8000F, 2 hours R 46.5 0.0765 0.051 -0.405 0.405C
1100'F, 2 hours R 42.5 0.0765 0.045 -0.530 0.530
c500*F, 2 hours Rc C 4.5 0.0755 0.0575 -0.252 0.252
300M Steel 800*F, 2 hours R 47.5 0.0165 * * *C
1100*F, 2 hours R 39.0 0.0765 0.046 -0.507 0.507c
*Speciman did not fail at the bulge but failed around the edge of the grip.
42
Page 52
-D - - - - -n c 0 O
Lq f- %0 N r- '- 0 '0 0 H
- C7 3 HO '0'%0 HHI 04c 0 00r 00
.4 t 00 00 00 0000C
0n O'n 01 LA ''N MCAT L L - 0 - .T A0'4 N '00 M cn M '40 N H LA H A
enA r4 LA LA -,t oo NOi -4r LA 0 H
(A) 04 H H- H- H- H H H H- H H- Hq
0
+1 N N H4 CACA LA T-- 0OD c
a%4 U -n - * N 0%r - r-ItM -r 0
0 HO
Cfl~C U LA N; LA L C A LA. CA A CA 0
E-4 .14 r- 04 * . -* -* l . , . 0 en *o %D00 00 00-IrI 0 0 0 0 0 0 0 0
NN LA L H 0C CC r4*
r-4 N H A U 00 00 0 H H H H j rj0
w 0041- 0 0 0 0 00 00 - rq f4 l
H I * 0.) 00) 00' CO 00 N4 1 0 0
0.0 LALA H N H 00.a 0 ' '0 H aH 00 0 )0 00 004r4 (u 0 4n tn P- 4% 4 - --00 0 0% Drir 0 0 0 0 00 0 0
43
Page 53
O CA Ch 0% H 0 C1 0% 0m 0% 0 0u 00 -It %D %0 N C1 N. %0 -4 "q H- H
8 In m% C14 N.q 0 0 0C0 0
.4 4 0 0 0 0 ol 0 0 0 0l
LA . Ln r- H Ln 0 H N.4 N. 00 H4 m -T0) N LnA N- t. '0 CnA r, rN. CN 0 H4 00 H
(j h M% mA 0; -' H r 0 CA LA N~ O N 140 .9 en f N. r% in LA V4 C4 %D L cn -41 PA H 0
N1 N1 N N1 N N1 N* r4 r- H H H H H
0 0% r" 0 m% r" 0 0 0 r- 0hwZ ' 0% N.% Nl V) CF) -.4 N. LA LAwz W ' N N N1 N1 H H H H- H H
in 0I+ + + + I I
HJ Ci Nl N1 N% Nn 0 0 0 0 a00%0r4 0- 0 0- 0 0* 0I 04 0 0 0 0 0-T N C14 5 - _ _i 5D5 1 r4
1- + +
'.0%D Ln L% 0 ) ) L 0 0 C7% C.
in '0 00 %0 C-4 HD 0 C IA~ N N.- LA Ln -I *
41 0n 01 0 0 01 0 0 0 0 0 0 .00
1.4 0
01
% 0 % MA WA 0) 0) N N A CA N NlA
31~~ H (n .T Ul r n I
Ln n N N c cn N N. LA LA
tn U L L 0 0 0 0 0 0 N N H- H4 uU 0 LA LA H H4 N* C41 H H- 0 0 0 0 ti m
a C4'. H 0 0 0 0 0 0 w~I
'- ) 0 0 0 0 0 0 0 0 0 V.;
44
Page 54
t- CO 0% m ?-I H 0 D '.0 0% 0 0co CD' N en~ fl %D H Hq H- H-B ~ ~ 0 Nl 0 N 0 0 0
-- 000 0 0 0 0 0 0 0
0 OD ul %.0 N -It N 0% t~- H- H- LI 00 ?
914 ,-I * Q * * * *U) It1 LI tn en IT N4 0% 0 0*% Cc ' H 0
00 H4 H- H VH 0 0 00 1l- N, N 0 0 0v4 N- N N N N PA t-4 H H4 H- H
LA 91 LI 0 CN ND C)'. --T1* 0%D4N ~ 0 ON 0) 0 %.0 ml Ln IA
i H (A) -: (n N Ml N N Nq N Nq N N
r-4 0- m N *1 *l *l N * * * .
*n 0 0 0 %0 0D 0N 0 0D 0: 0 f
IAC) N 0 H. '.0 0a 0 '.0-1 HN N N L0 H w* * * * . * . * * I I
Hh C-4 in0 0 0 0% 0- 0- 0N 0N 0l 0 l
04r
N( A 0f- 00 H l,% A -C)' C1 CltA%T0t C4 004N% M O O O O O
w4 0 0 0 0L 0 0 0 0 0 0* 0 0
~ jP4
C) 0~ 0% 0% H 0c N 0. N0
C.) .) N ~ t A 0 N .0C45A I
Page 55
Hq UN co H mV ml CMJ 0 %,0 '.0 Oi a%
4-)L t- - '0, O CD '0 \0 H- Hq 0 08 8 0 \~ .0 '.0 H- H 0 0 0 0 0 0
t- ~j -r t- \D H- ((M O\ -1 0 '.0 UlA Hq LA\ 0C j CO 0 00 mO 'D0 0 wO 0 t~- wL n N
%' 0 C\ C'. 0\ m' U LA 0' LA 4 M,~ O, C,40 .4 CO tl- 0 0 C\J H- 01j ('1 CO j-- LA\ tA -T m 0
01j C~J m~ mt mY mf 01j (1 H- H H H- Hq H
~ 0
01j \0 0M 01j C() Cm \0 0 LA\ 0 0 0
M+ ' 0 0 0 0 0 H 0 0 0 0 0
0 H W5551
0H- \.0 ULA 0\. H CO t- CO 0\. 0\
H E-4 11 t-- H- \.0 \.0 H- H 1 o\. 0C\ - C'i m~0 ) 0 H H- H- H- H 0 0 H H H H
-4 E-4 C
V~0 LA LA\ 0'\ . - 0\. w cO mO wO0- E-1 UN. LA H H M1 (n 0 0 C1 U'\ \0 LA\ %0 \'0H 4-) N1 N1 N1 0i 0j H H 0 0 0 0 0 0
0o W0'. 0'. LA 01 '0 01C; C;- C-
01j '0 Z -t 0M 0m 01 0 m 0 0\ 0C\
S 0 0 0 0 H H H 0 0 0 H H
~0 0 LA LA 9O 9 C'J 0\1 1 M1 01 01 LA LA \H H~ H~ t-I 01 1, LA LACO C LA\ LA C C\.
U~~ ~ ~ ~ ~ 0HNt H 0 m c - H H 0 C
Cl 0
*~(2 0 0 0 0 0 0 0 0 0 0 0 0
Page 56
t- -% CC.____ _f
8~ ~ ' 8 00 *%%0 9. C4 u-i 00o 0 0
~0 -I, d o 0 o
.. . .3 0 .V * . .l ~ !, . 0
w~~~V t.- cn '0 co '0t o m ci 0 N c
U\ V_ c o C_, t- 11 ?I 9 -
03 03
r-i 0-
0 ' t %0 '0 4* CO t.- 0 0%;4 0q N H i-I I.H i-I co ~ 03 c" c e
'0 +1 1 t, . . .
0 0 0 0 0 0 10 0-0 0 0,
'I WN CVN L0 l% % < 0
E4 t.- t. 1n cm 0 N Im 0 "u 00 0 0 0 0 0-
E- 11 -- +
W~ .54-
09N 0 0 H 0 N0100t-t_4-) Hi H -H i H 4 H 0 0 0 0 0 0 0 0
Z ~ UN nt \0 \0 03 0 03 03j
\0 m- mV w1 wO 0 t- 0 0 0\C~ W3 0 0 0 0 0 03 H cu 03M
o o 0 0 o 0 0 00
43 '0 0 U\ it' CO co 03 %N CI mV CV 0M ItA 4\ C
.4 , 4 4 * .* *A * * u* * *
H i-i H H 03 03 IA t' CO CO it' I '
Hl I= -I r
a 43 0j It' 1.0 Cf H 0 0 0 0 0 0 -4
o r 0 I' 0 0 o V C) C; C; 0 0 0
47
Page 57
t-%0 Olt CC 11 -4 f-I .
.0~~ 0 aI, ~ -
0 r4 t- %C no1=4 C2% %0 UAI UN 3 z t:~ 0 %0
E~ 0* '.(' -4i to cs t ' of t-' M
.1 c '- j t 0 Va co t- s-o CV) 'D'.
0- 0
(V) u-I mV '.. C4 m- %00 H Ch.C') ca r-- 0 *n U% m t- I %
t:5 -i m- m ms c'. C4 m~ m- m- mu (0 0+t 0 0 0 0
0:
1-d 0 * -**mI 4 0 0D 0i 0- 0 00 V0 0. 0%
Ci -i I~ cu I I I 34 0- Iu a C
EA CJ)Cf) c
0 ID t- cu %0J t-) 0 % m .x
0% 0 X0mo N 0 o 0 0 0 01-4 w0
ra 0
HrI H- H H Nu Nu m' m1
ID mD r. r.0.QH u-; u-3 u-u .IZ C; C 3 C; 0 ; C;
co 40
C-1u- H- 4
la 4) 4- U P 0' 0'. 0 0 0 0 0u 05i H- u-I !d .&V 0 0 UN a%' 0 0 MV ty) H H 0 0 0 C0 U
CL0 0 0 '.0 '.D H H 0 0 0 0 0 0 0 0 0-E .; C; .l $4 * *
- U) U) 0 0 0 0 0 0 0 0 0 0Its
Page 58
a~4- j4 4rt'C cc ~ i 0CC4 1
0l- 1
'~co elk oTojoor C4 oo %00 00in 4 llH __ _ _ mM_.D to f___
04 I) .- - Cl "-4 .T VI? Ls - _t 0 0 Cl D
En Q FS o 0 0 C o o1 C)0 0o~ 0 a fn
r-i r4 -P.4 c o1 -q cq .4l 0n M
Cl
_Z;
r4 'Loi v-4c' 4 r 1 0 1 i N-1 in4 C14 N 46Z-Ma! o o ,-in 0 NCIO 04 0n r, ,I -D 000
P- r4 0 'T r 0%-0 mi~- 4n 0 0 .- 4 s-I t-
V) in U! U t V i1 n i in 0 '0 0-0 0 0 0 0~i 0 0 0 0 0 01C
%0 Ln No % DiD% n to 40 n UP %0
t.4OrI
LM Ln &n in tinc n 0 l " m r o c si %c
1o 5% c co co -0 0oP 00 co 0c1 CC 00 U%N r l H r 1-4 J H&J 0rJI &4 T1 "4JJ" " q fq -
m n 0;" V m1 C ; 444r9V 1
Page 59
isn
0 ~ : 0.-t inl - N n 0lC~
in a* 0% qn v0 -- o o~ co C% %a0 V! 0.-
0*.. -- lr - C-1c"-. r- LnIirl m' c'r fq U% irtUN xn t. f-. P-. f-
a,) 0' 0 C o C
V3 4 "- 7 7 .? in Cl) '.0 C-1 c- -o o 1~j- c0 ' ' N - ' ('c) in en
Pa~C- Ln.0 gn C47U l ) U0N-.7t.
0 -.
a- -Z 00 m 'IT V) ~ * 4
zr0= c0 0 00 0 0 00 0 a000
'-4
~14 .C
9Ni .0 H7- C. 0 0- 0 "q C-I "i -i 0 0'i0 00 00 0 000
vi3 in 3.4 ui in' v n I
0(i0
-a50
Page 60
VcA V) I nc
499
w ~ ~ L LA LA IA 0' CO CO Cno O
0 .0 m or r. ,-f 0 LA'.0 r'. 0N0.4 %T-T tn T % 1.0-4 r- 1 0 %.0 U 'T
m m n m 4 n iL
Ht r 0 c %D C-1 w N'
'44 0-4 9 -9- -4 -4 r-i -4 - -4-4q
9Ln LA-.T CzJi mt %D a 01 %.0 IA %0 H4 r-
> M c-i C~j " H. '--7 - N .? mLA<L Cal :t nA nA w!0 uA n ! LA w, Ln LA
00 0 0 00 0 0
w~4 .Zr- '.0 a%~-t. 0 0a% t- Nu. w0 i '.D %D IT LA 9- o% .-4 c-i %T 00 'o 0
Q'(. 9:0r 0 0 00 OO 0000$4 CD rq d
es- q4 14r4 r4 H, r-I s-4-w4e-4
'5-%
C~ co %D' 00Ch L', co r % O c -4 %0 ON41 Li C 0 00 a% 0' 010' 0' at 0'a 00 m'
m. UO 000 ' 0 ' 10 a, m0as a 0% C%0a
0 4 5 - ' r4 r~i H4 H4 -4 -f .4
W 04
r4 .0 . .10 . .0 0. 0. .' . 0. .' 0.H- '-d 0 00 0 0 00 0 0 0 00
x014
"-4
HA La 0 )00 4
(9 0 0) "i W d 0 " ca'-En tn 0n (n U U
Page 61
LID.4j'
60' 0- t'Q'
w cyv . 0 . .04 z -A Ln -. t C,4 Nn cn I. M. ' D - %D
m cl) cn en % i n A r r .r--
000)
U)0 0 CC C W
r-q C1 C %0 '0 'T0 C O C C14 '0 LM
co4 3 C .4 4 P. . * .~~HH H r - H H- HHrq . 4 -
H t Ln en r- H0 OH 0 ~ CCi .n 0'.7rz4 -i H ci i r-, in 5 i tA Wi ncnb" V 3 Ln in in Ln LA tn v) Ln vi
c . *q %o c% q% %o *o r*
E-4~ AdoO mA %n Ln mA H Ha'. 0m''.0oO 0 0 00 0 HHHO HOOO.q4 r4 q .A .q q 4 4 41 4
.~'o m %0 tn L -- N 0%f' tnCh 0 ' 0 0 '. C)% 0'. m ' C% m0'. 0 m'
E-4 r4 1
E4
~H 04 Mr T. -1 N M T P- 0. M %T .
tx LI-4,4
4) 4H, to_ _ _ __. )
&JC U(n0oI
Page 62
00c
W CY 'r'
sIJcW
tA in- T *1:T In %TCOD Co r" 00
:3( 00 0 C)0000 0 00 0V 0 % 0% 0 LM N C-4 Ln ND r- % *T
0H f- N T 0 "1%D -1 m% 0% in V>0 '.D 0 %D n %0 % D '.0 <n G% m% m
(OC H o-? LA N -1 '0 --T N- sT w
r-4 ,T~ r-4 H-i I* rN N % Hr Ii0
~f S44 v- -H H H- H H IH Hi H r- H-
-t 1-4 -T fl- No N n N %
::) u o5I IA ' tn 'A tn tn in %n in in V) in
E-4 tv- C,4 -.T r- Nct N N CO H4 ON en mA Nl
0 Ln .- I w. wi H: COO n 0%'. ON0 l
E-4 Q u U 3% 00 (% 0 Co a% 0% % O ON 00%
w V 0o 00 0 c%0 a% c% C7% % 0 %
(00
000 000 C4%
~1U4
to U)
tnO
Page 63
0.250 !. REAM
I/
7.0. in. 5.5 in.-, ).3 2.25 in.ln.
FIG. 1. UNIIAXIAL TENSILM TEST SPECIM.EN.
54
Page 64
3 D1 411~ E
3t"
CLI CE O(D +2t)
FIG. ~.EXPERIMENiTAL SET-UP FOR PLANE STRAIN DUCTILITY TEST2:1 BIAXIAL LOADING.
55
Page 65
K
0
00
I It
.-'1-0.066
" 1
_ / DIA. OI- .025"R
0 "
t4 4- 0-4: ll
334
FIG. 3.. PLA E STRAIN ( =2/01=2:1) TENSILE SPECIMEII
DESIGN.
56
Page 66
L A r IIA
31 YOKE COVER
L.1 L J
4 i,
YOKE
/\ N HOLD DOWN RINGrl ;$"R ", rl (4V,, DIA.)'I " II CUSHIIONED SPECIMlEN
IIt" I BASE PLATE OF FIXTURE
II (it" DIA.)IIj * II
L ' SIX EQUALLYSPACED
BOLTS ON 3 DIA.PLUNGER
BASE PLATE
! . , .. .ll - DIA. '1- 2
FIG. 4. MODIFIED PLUNGER BULGE TEST FIXTURE (02/0o 1)
57
Page 67
14'' -- [
I/ 2 2"
edia ------ BOL
BOBOLT
(e) BOTO FLANG
Mf PISTON I8, 1 I
FIG. 5. HYDRAULIC BULGE FIXTURE FOR BALANCED BIAXIAL ( 2/o.1 1a 3/01* 0)TENSIOW TEST. 5
Page 68
-, i;
- p7________ - -0.655 1.54
0.109 2.8
0.010 8.3_ _10.030 5.13, ~0.0027 15.2
._,_0.0015 19.2C'70.0 Crack
p0 0
I" radius
S21:
*.600. notch root radins (p)(variable)
diam.eter
59FIG. 6. NO0TCHI TENSILE TEST SPECIMEN.
Page 69
Grip geometry sa.ne asnotch s-ecimens(Fig 7)
FIG. 7. SMOO10TH TEIISILE SPECIME1,
GO
Page 70
p '0.00590 . 45*
H (2 holes)
A-k:
I L
, k
- --- -- - - - -g
~Dimenisions">approx) a D E F C H K L
J..icknes . INCH INCH INCH INCH INCH INCH INCH INCH INCH INCH
0.150 INCH 3.2 0.150 1.6 4.0 4.0 2.075 0.125 0.750 2.0 C.875
0.50 INCH 2.0 0.50 1.0 2.5 2.5 1.3 0.062 0.500 1.25 0.55
1.00 INCH 2.0 1.0 1,.0 2.5 1.5 1.3 0.062 0.500 1.25 0.55
FIGURE 8 FRACTURE TOUGHNESS SPECIMEN DESIGN61
Page 71
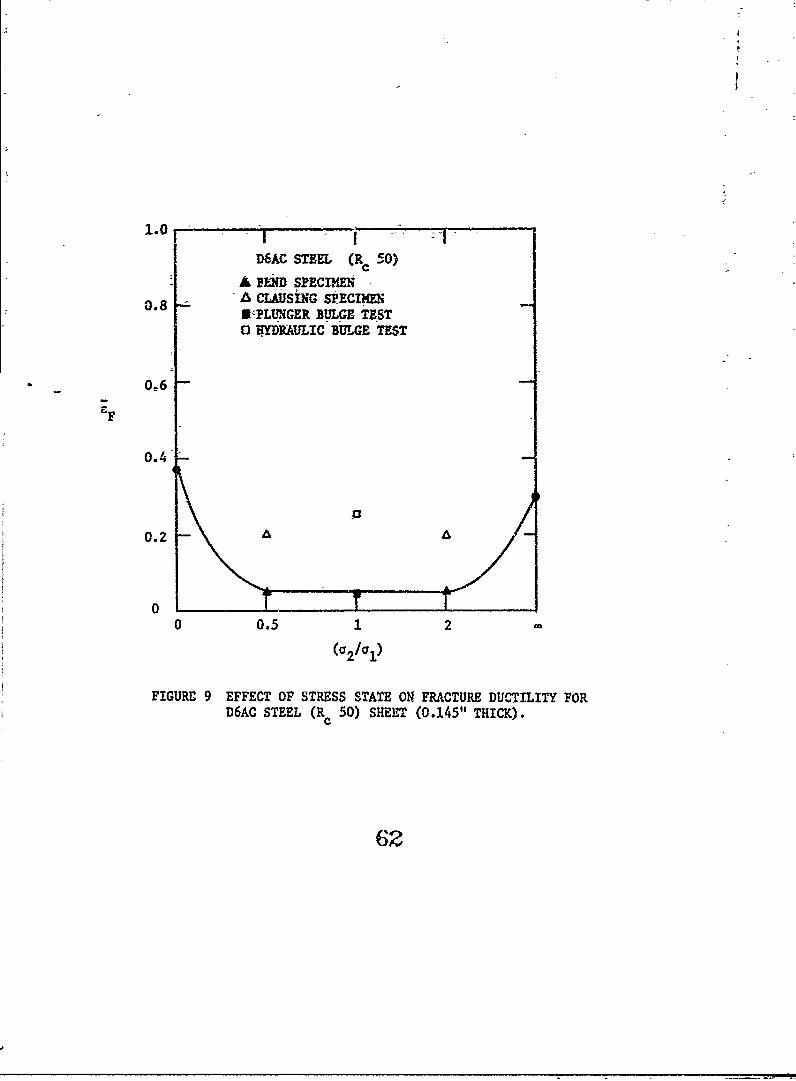
D6AC STEEL (R 50)
ABmom SPECIMENc
0.8 A CLADSING SPECIM*zPLJNGER BULGE TE STO NYbRAULIC BULGE TEST
0,6
0.2
00 0.5 1 2
(2o1)
FIGURE 9 EFFECT OF STRESS STATE ON FRACTURE DUCTILITY FORD6AC STEEL (R c50) SHEET (0.14511 THICK).
Page 72
[ 1.01
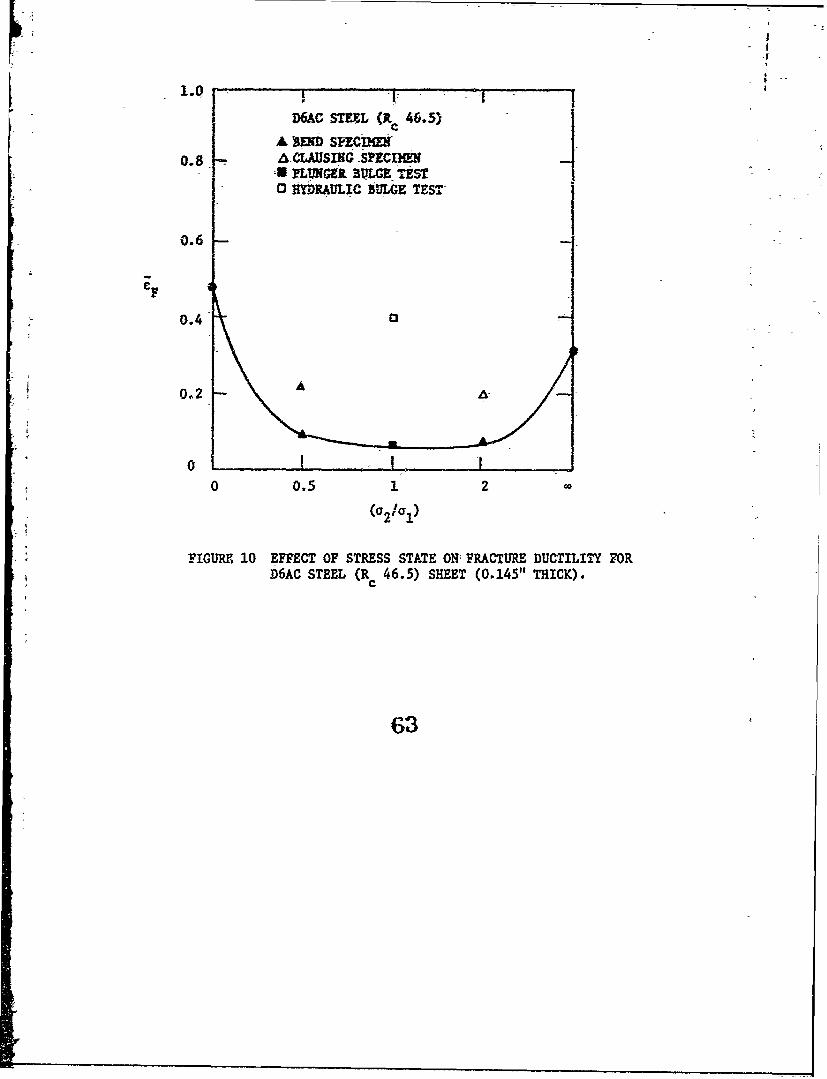
D6AC STEXI,(Ri 46.5)A MUD SflCLMEKW
0.8 FA-CLAUSING SpECIMolU0 PLUNGER BULGE TEST0 HYDRAULIC 3VLGE TESTj
0.6
6.40
04
0 0.5 1 2
(a 2r ar1)
FIGURE 10 EFFECT OF STRESS STATE OHFRACTURE DUCTILITY FORD6AC STEEL (R. 46.5) SHEET (0.145" THICK).
Page 73
V
; ~1.0 "-
D6AC STEE (K 42;.5)C
A -END SPECIMNA CLAUSIAG SPECIMEN
0.8 I, PLUNC-ER BULGE TEST3 YDiALIC 'BULGY TEST
0.6
0.4
0.2
0 0.5 1 2
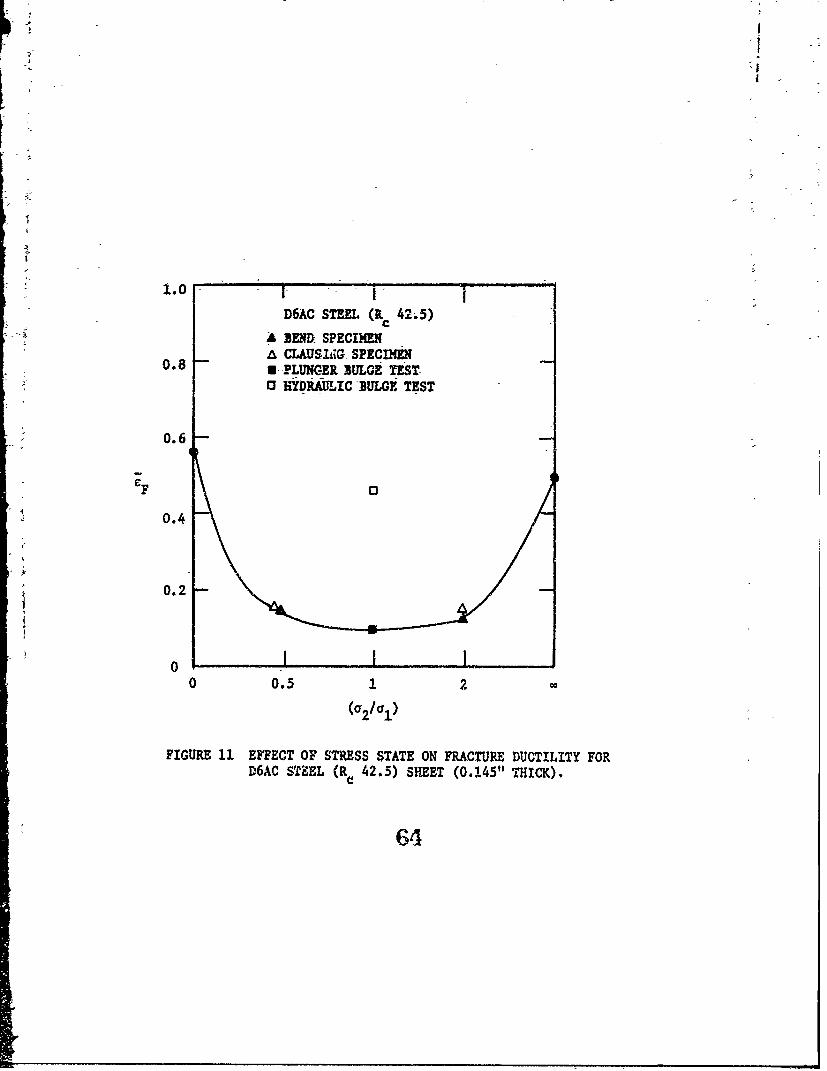
FIGURE 11 EFFECT OF STRESS STATE ON FRACTURE DUCTILITY FORD6AC STEEL (Rc 42.5) SHEET (0.145" THICK).
64
Page 74
1.0 1
300W STEEL (R, 51.5)
0.8, S END SPECIMA CLAXISING SPECIMENa PLUNGER BULGE TEST0b HYDRAULIC, BULGE TEST
-0.,6
0.4
0.2
00 0.5 1 2
(a2/al1)
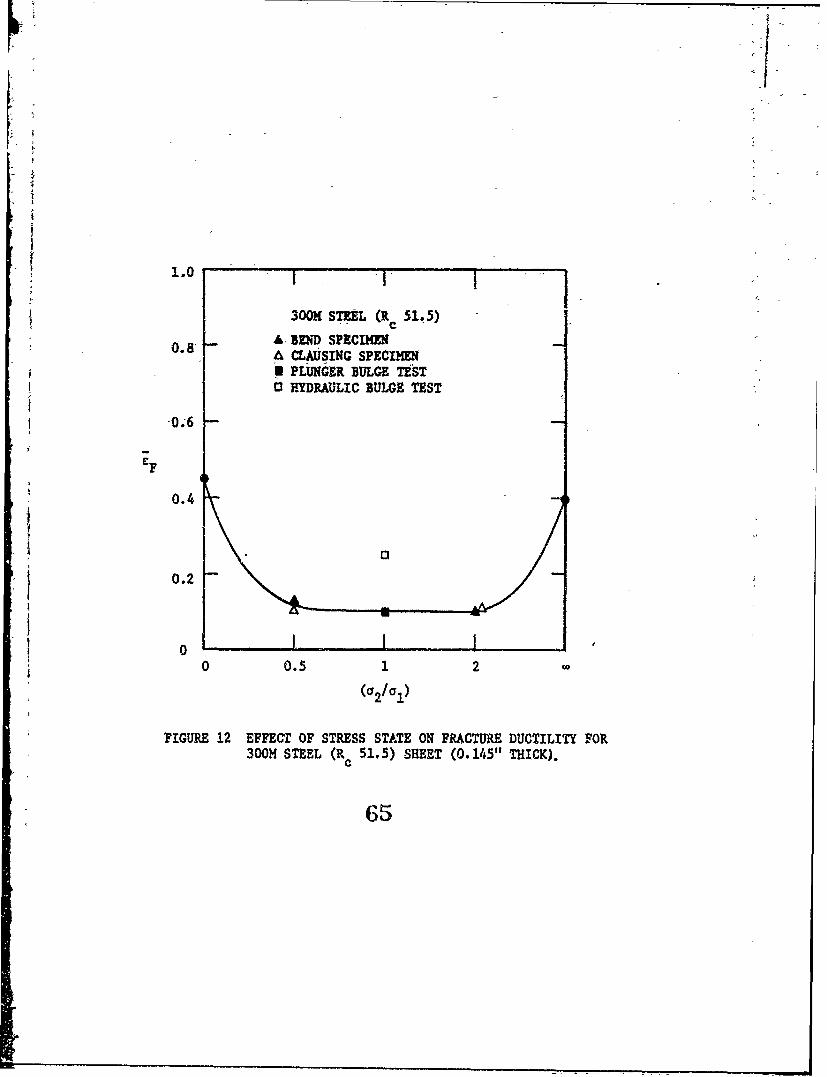
FIGURE 12 EFFECT OF STRESS STATE ON FRACTURE DUCTILITY FOR300H STEEL (R, 51.5) SHEET (0. 145" THICK).
65
Page 75
1.0300K STEEL (R 47.5)
C
A BE D SPE6f*N,A "CLAUSING SPECIMEN-
0.)8 U PLU GER BUI.G9 TE ST13 H:YDRAULIC BULGE TEST
F
0.4
0.2
0
0 0.5 1 2 G
0~2 /U1)
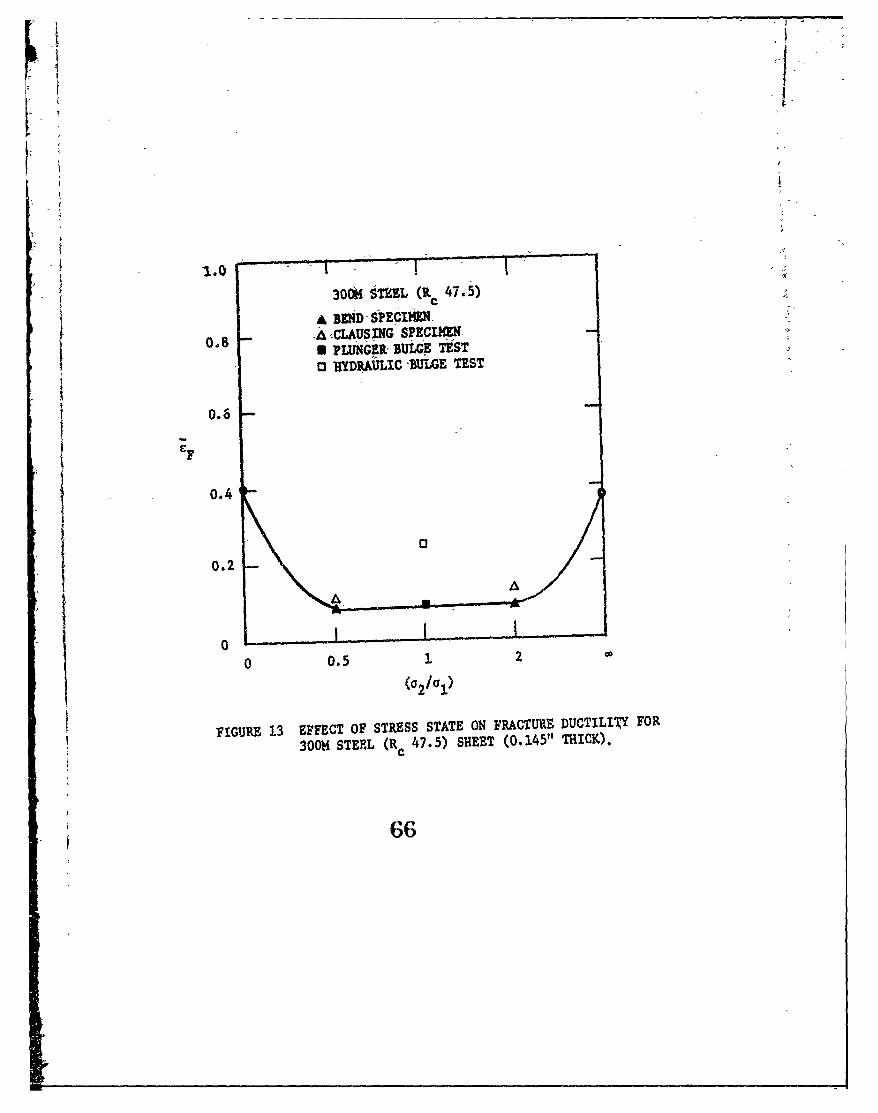
FIGURE 13 EFFECT OF STRESS STATE ON FRACTURE DUCTILI19Y FOR
300M STEEL (R. 47.5) SHEET (0.145" THICK).C
66
Page 76
1.0 I -
300M STEEL (R. 39)
A BEND SPECIMENA LAUSING SPECIMEN
0.8 PLUNGER BULGE TESTa HYDRAULIC -BULGE TEST (SMOOTH)X'HYDRAULIC BULGE TEST (ROUGH)
0.6
0.4
0.2
2
0 I I I0 0.5 1 2
(a2/a1 )
FIGURE 14 EFFECT OF STRESS STATE ON FRACTURE DUCTILITY FOR300M STEEL (Rc 39) SHEET (0.145" THICK),SMOOTH-RMS 10 V INCHES, ROUGH-RMS 50 V INCHES.
67
Page 77
0
0o 0 &.'
0 a., 9: +. - wF -H(fl 42
o4
w 0
-1.4 0.
0010
(fll 00J~WV * *1*4
Page 78
4,
0 44
w 0
N6 1) 0
'U]u U $O
_Cf. 0
0 00
69~
Page 79
0,-
4 u -
co 41AiI0I
44 0
0~ 00)sf
16,
070
Page 80
0.20I
MlAC STEft (1R 50),
THICKNESS~ 0 .15,9'+ 0.004"
1 0.10-
0o 1.0 .0 3.0 4.0
(k)t
FIGURE 18 EFFECT OF ROOT RADIUS TO THICKNESS RATIO (pit) ON THICKNESS
STRAIN-AT 'FRACTURE (c t) FOR D6AC STEEL (R c50).
71
Page 81
+0,.6W6C STEEL (R '46.5)'
o LONGITUDINAL STRAIN c'*THICKNESS STRAINf C
A WIDTH STRAIN c
+0.4
0
cw
1 2 4 6 8 1015 2 C
ELASTIC STRESS CONCENTRATION FACTOR (Kt)
FIGURE 19 FRACTURE STRAINS AS A FUNCTION OF ELASTIC STRESS CONCENTRATION FACTOR FORD6AC STEEL (R% 46.5); THICKNESS - 0.142"1 ± 0.010".
72
Page 82
D6AC STEEL (R. 46.5)iC
o.4
0.2
0.1
0__ ._1 __ _1 4 6 8 10 15 .20 30
ELASTIC STRESS CONCENTRATION FACTOR (K )
FIGUIE 20 EFFECT OF INITIAL STRESS CONCENTRATION FACTOR ON THE EFFECTIVE FRACTURESTRAIN FOR D6AC STEEL (R0 46.5); THICKNESS - 0.142" ± 0.010".
I
Page 83
400 D6AC STEEL (R. 46.5)
300-
200
K . 100 •-'lo
~80
60
4oI I .1 , I I ! I I
2 4 6 8 10 15 20 30 50 100
ELASTIC STRESS CONCENTRATION FACTOR (K )
FIGURE 21 EFFECT OF INITIAL STRESS CONCENTRATION FACTOR ON THE NOTCH STRENGTHFOR D6AC STEEL (Ec 46.5); THICKNESS - 0.142" - 0.010".
74
Page 84
0 . 4 -D6AC STEEL (R, 46.5)
THICKNESS 0.142" ± 0.010'!
ct
0.2
0.1 0
0 0 1.0 2.0 3.0 4,0(p/t)
FIGURE 22 EFFECT OF ROOT RADIUS TO THICKNESS RATIO (P/t) ON THICKNESSSTRAIN (c t ) AT FRACTURE FOR D6AC STEEL (R 46.5).
Page 85
+0.6(P 425
b6ACr STEEL(R425I0 LONIGITUDINAL STRAIN cL0 T~iCE(NESS STRAIN
+0*A WIDTH STRAIN p
+0.2
-0.2
-0. 10 \
1 2 4 6 8 10 15 20
ELASTIC STRESS CONCENTRATION FACTOR (K d
FIGURE 23 FRACTURE STRAINIS AS A FUNCTION OF ELASTIC STRESS CONCENTRATION FACTORFOR D6AC STEEL (R, 42.5); THICKNESS *0.145" ±0.010".
Page 86
0.5 .. .. ... ..
D6AC STUL (Rp 42.5)
C. 4
0.3 0.3F a- 1/2, 13 0
0.2 -cra 1, 0 n 0
0.1
-- o ... 1 , I Ii1 2 4 6 8 10 15 20 30
ELASTIC STRESS CONCENTRATION FACTOR (Kt)
FIGURE 24 EFFECT OF INITIAL STRESS , 0NCENTRATION FACTOR ON THZ EFFECTIVE FRACTURESTRAIN FOR D6AC STEEL (R. 42.5); THICKNESS - i.145 ± 0.010".
77
Page 87
4003
D6AC M~E11 (Rc 42.5)300
80
60
40 I I I1 2 4 6 8 10 15 20 30 50 100
ELASTIC STRESS CONCENTRATION FACTOR (K. d
FIGUJRE 25 EFFECT OF INITIAL STRESS CONCENTRATION FACTOR ON THE NOTCH STRENGTHFOR D6AC STEEL (R c42.5); THICKNESS - 0.145 t 0.010".
Page 88
0.4D6AC STEEL -(R 42.5)-
TH1CituESS 0.11)51t 0.010"
0
0.2
00 1.0. 2.0 3.0 4.0
FIGURE 26 EFFECr OF ROOT RADIUS TO THICKNESS RATIO (p/t) ON THICKNESSSTRAIN AT FRAC TURE dc FOR D6AC STEEL (R. 42.5).
79
Page 89
300H STEEL ( 51.5)
0 LON4GITUDINAL STRAIN kL0 THICKWESS STRAIN t
+o.4 A WIDTH STRAIN c
00
1. 2 4 6 8 10 15 20
ELASTIC STRESS CONCENTRATION FACTOR (K. d
FIGURE 27 FRACTURE STRAINS AS A FUNCTION OF ELASTIC STRESS CONCENTRATIONFACTOR FOR 300M STEEL (R c51.5); THICKNESS -~ 0.166"1 ± 0.006".
so
Page 90
K-----
~0.4
300K STEEL (R 51.5)
0.3
CF -
0.2
0.1
1 2 4 6 8 10 15 20 30
ELASTIC STRESS CONCENTRATION FACTOR (K )
FIGURE 28 EFFECT OF INITIAL STRESS CONCENTRATION FACTOR ON THlE EFFECTIVE FRACTURESTRAIN FOR 3001! STEEL (R. 51.5), THICKNESS - 0.166"1 ± 0.006".4
Page 91
I400
300M STEEL (R~ 51.5)
200
100
60
40 I I1 2 4 6 8 10 15 20 30 50 100
ELASTIC STTRESS CONCENTRATION FACTOR (K)t
FIGURE 29 EFFECT OF INITITA, STRESS CONCENTRATION FACTOR ON THE NOTCH STRENGTH FOR300M STEEL (R 51.5)t THICKNESS - 0.166"11 0.006".
C
Page 92
0.4 -
300I STEEL (Rc 51.5)
THICKNESS = 0.166" - 0.006"
0.3 -
c t 0
0.2
0.1
0 1.0 2.0 3.0 4.0
(pit)
FIGURE 30 EFFECT OF ROOT RAiJIUS TO THICKNESS RATIO (P/t) ON THICKNESSSTRAIN (c ) AT FRACTURE FOR 300M STEEL (Rc 51.5).
83
Page 93
+0.6 300H4 STEEL (R47.5)
0 LONGITUDINAL STRAIN CL
0 THICKNESS STRAIN
+o.4 A WIDTH STRAIN ew
+0.2L
E4 0
-0.42
-.1 2 4 6 8 10 15 20
ELASTIC STRESS CONCENTRATION FACTOR (K )d
FIGURE 31 FRACTURE STRAINS AS A FUNCTION OF ELASTIC STRESS CONCENTRATIONFACTOR FOR 300H4 STEEL (R 47.5), THICKNESS - 0.163" t 0.007".
C
84
Page 94
1*
0.4
300H STEEL (R, 47.5)
0.3
41 cF 1/2, 0 * 0
F .F 1, 00.2 0
0
0.1
0
0 I I I I I 11 2 4 6 8 10 15 20 30
ELASTIC STRESS CONCENTRATION FACTOR (Kt)
FIGURE 32 EFFECT OF INITIAL STRESS CONCENTRATION FACTOR ON THE EFFECTIVE FRACTURE STRAINFOR 300M STEEL (Re 47.5), THICKNESS - 0.163" ± 0.007".
fC
I8
Page 95
400
300 -300K STEEL (R 47.5)
200
100
80 - "
60
40 I I I I I I. I2 4 6 8 10 15 20 30 50 100
ELASTIC STRESS CONCENTRATION FACTOR (K )t
FIGURE 33 EFFECT OF INITIAL STRESS CONCENTRATION FACTOR ON THE NOTCH STRENGTHFOR 300M STEEL (Rc 47.5), THICKNESS - 0.163" - 0.007".
86
Page 96
300 300M STEEL (R 47.5)
800
60
401 I2 4 6 8 10 15 20 30 50 100
ELASTIC STRESS CONCENTRATION FACTOR (K)t
FIGURE 33 EFFECT OF INITIAL STRESS CONCENTRATION FACTOR ON THE NOTCH STRENGTHFOR 300M STEEL (R 47.5), THICKNESS - 0.163" +± 0.007".
Page 97
0.4
300M STEEL (R 47.5)c
THICKNESS - 0.163" -+,0.007"
0.3
0.2
00
0.10
0 J.01.0 2.0 3.0 4.0
(0/0)FIGURE 34 EFFECT OF ROOT RADIUS TO THICKNESS RATIO (pit) ON THICKNESS
STRAIN (et) AT FRACTURE FOR 300H~ STEEL (R 47.5).
87c
Page 98
+0. 6 300H STEEL (R 39.0)
O LONGITUDINAL STRAIN cL* THICKNESS STRAIN c
+0.4 - A WIDTH STRAIN c
0 CL
+0.2
0
-0.2
* £w
-0 .4 , I I I i I1 2 4 6 8 10 15 20
ELASTIC STRESS CONCENTRATION FACTOR (K )
FIGURE 35 FRACTURE STRAINS AS A FUNCTION OF ELASTIC STRESS CONCENTRATION FACTORFOR 300H STEEL (Rc 39.0), THICKNESS - 0.161" ± 0.005".
88
Page 99
0.5k
300M STEEL (R 39.0)c
0.4
0.3
~Fa 1/2 00- C ,~
F -
0.2
0.1
0
1 2 4 6 8 10 15 20 30
ELASTIC STRESS CONCENTRATION FACTOR (K d
FIGURE 36 EFFECT OF INITIAL STRESS CONCENTRATION FACTOR ON THE EFFECTIVE FRACTURESTRAIN FOR 300H STEEL (R c39.0), THICKNESS - 0.161" 1 0.005".
Page 100
300M STEEL (R 39.0)
800
2 4 6 8 10 15 20 30 50 100
ELASTIC STRESS CONCENTRATION FACTOR (K t
FIGURE 37 EFFECT OF INITIAL STRESS CONCENTRATION FACTOR ON THE NOTCH STRENGTHFOR 3(' STEEL (R c39.0), THICKNIESS -0.161" ±0.005".
90
Page 101
!g
0.4300M STEEL (Rc 39.0)
THICKNESS = 0.161" _ 0.005"
0.3
0
e t
0.2
0
0.1 "
0 1.0 2.0 3.0 4.0(p/t)
FIGURE 38 EFFECT OF ROOT RADIUS TO THICKNESS RATIO (p/t) ON THICKNESSSTRAIN (c ) AT FRACTURE FOR 300M STEEL (Rc 39.0).
9lC
Page 102
4-
I II ... i
120 OPEN SYMBOLS - D6AC STEELCLOSED SYMBOLS - 300M STEEL
100 -
80 -
Ic
IKSI V 'IN Ki 169 Fl
60
40
0
20
0/0 -... i I I . .. I ...,
0 0.10 0.20 0.30 0.40 0.50 0.60
HYDRAULIC BULGE DUCTILITY )
FIGURE 39 PLANE STRAIN FRACTURE TOUGHNESS OBTAINED ON I" THICK WOL SPECIMENSPLOTTED AGAINST HYDRAULIC BULGE DUCTILITY ON SMOOTHLY GROUNDSPECIMENS (RMS - 10; THICKNESS 0.050").
92
Page 103
II- I I
100 OPEN SYMBOLS - D6AC STEELCLOSED SYMBOLS - 300M STEEL
80 E
60I
S60 -Kc -e 622 e al20
A
40
0 0
20
00 0.03 0.06 0.09 0.12 0.15
BEND DUCTILITY - 1 ,
FIGURE 40 PLANE STRAIN FRACTURE TOUGHNESS (KIc) PLOTTED AGAINST BEND
DUCTILITY (iF ) ON COARSELY GROUND (RMS - 19)a-'1/2,00
SPECIMENS OF THICKNESS - 1.60".
93
Page 104
scQO-- OPEN SYMBOLS -D6AC STEELCLOSED SYMBOLS - 30M STEEL
*-K VALUE FOR IIY-80 STEEL,C
OBTAINED FROM LITERATUR2e 23 )
700
l)K -529 c Predicted K line (critical vol. strain)c a-1 ,0-0 c
for ultia. high strength steels
6002)K -434 c Predicted K~ line (maxim normal stress)
for ultra high strength steels
or 500 )K0-210 CFExperimental KQ line (0.145 inch
C thick) f or ultra high strength steels
Q/
400/'(K S I v'W
300/
2)
200/
100/
00 0.2 0.4 0.6 0.8 1.0
Hydraulic Bulge Ductility (i F)
FIGURE 41 APPARENT FRACTURE TOUGHINESS (KQ)AS A FUNCTION OFHYDIAULIC BULGE DUCTILITY CIA)
Page 105
I 'I iIOPEN SYMBOLS - D6AC STEEL
120 CiOSED SYMBOLS - 300K STEEL
100
-80
S I YIV"A
60
40 // . Z'l''OKQ =870 F,
40 -0
20
0 0.03 0.06 0.09 0.12 0.15
PLUNGER BULGE DUCTILITY (CF 1}F =O
FIGURE 42 APPARENT FRACTURE TOUGHNESS (K,) OBTAINED ON 0.145" THICK
WOL SPECIMEN VS. PLUNGER BULGE DUCTILITY (7 ) ONFa-l, s"0
COARSELY GROUND SPECIMENS (RMS - 19, THICKNESS - 0.150").
95
Page 106
- i I ' .. .II '
OPEN SYMBOLS D6AC STEELCLOSED SYMBOLS - 300H STEEL
120 -
100
8 0 -
KQ
KSIVIFN
60 -
K = 815 aF=/2,0 =°
40
20
0 0.03 0.06 0.09 0.12 0.15
BEND DUCTILITY' ( CF )
FIGURE 43 APPARENT FRACTURE TOUGHNESS (K Q) OBTAINED ON 0.145" THICKWOL SPECIMEN PLOTTED AGAINST BEND DUCTILITY ON COARSELYGROUND SPECIMENS (RMS f)", THICKNESS = 0.160").
96