15
AIR QUALITY MANAGEMENT & TRENDS Ministry of Environment, Forest & Climate Change Government of India
AIR QUALITY MANAGEMENT & TRENDS
Ministry of Environment, Forest & Climate Change
Government of India
Challenges
• Rapid industrialization(MSME Sector)
• Growing number of vehicles
• Construction activities
• Biomass & Stubble burning
• Dust storms & road dust
• DG-sets (Electricity generation)
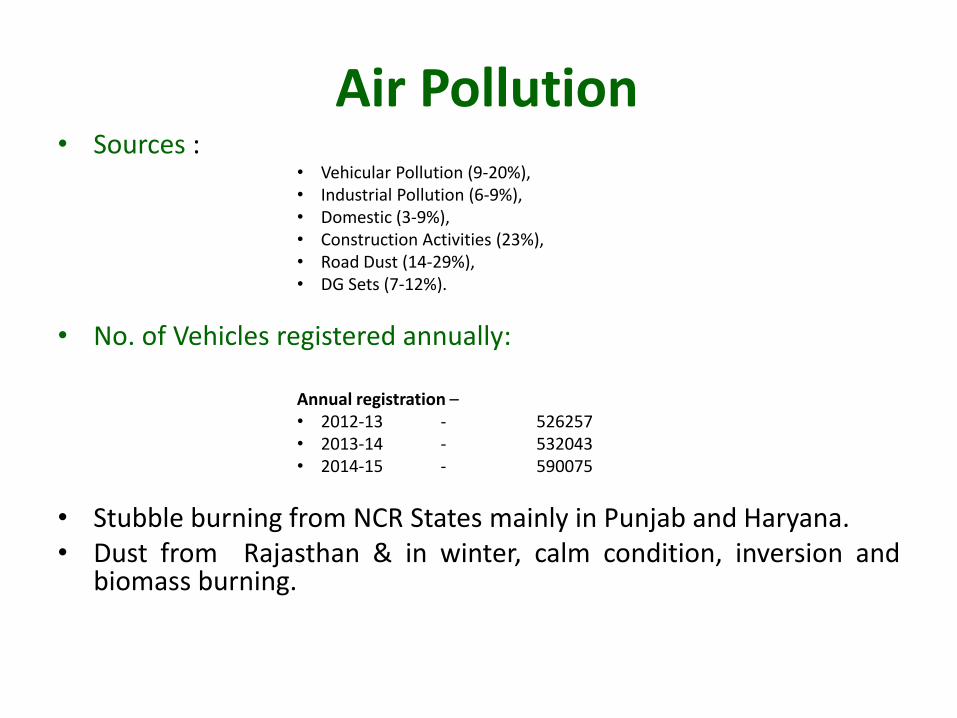
Air Pollution• Sources :
• Vehicular Pollution (9-20%),• Industrial Pollution (6-9%),• Domestic (3-9%),• Construction Activities (23%),• Road Dust (14-29%),• DG Sets (7-12%).
• No. of Vehicles registered annually:
Annual registration –• 2012-13 - 526257• 2013-14 - 532043• 2014-15 - 590075
• Stubble burning from NCR States mainly in Punjab and Haryana.• Dust from Rajasthan & in winter, calm condition, inversion and
biomass burning.

S. No.
PollutantsTime WeightedAverage
Concentration in Ambient Air
Methods of Measurement
Industrial, Residential, Rural and other Areas
Ecologically Sensitive Area (notified by
Central Government)
1 Sulphur Dioxide (SO2), µg/m3
Annual* 50 20 1. Improved West and Gaeke 2. Ultraviolet Fluorescence24 Hours** 80 80
2 Nitrogen Dioxide (NO2 ), µg/m3
Annual* 40 30 1. Modified Jacob & Hochheiser (Na-Arsenite) 2. Chemiluminescence
24 Hours** 80 80
3 Particulate Matter (Size <10µm) or PM10 µg/m3
Annual* 60 60 1. Gravimetric 2. TOEM 3. Beta attenuation
24 Hours** 100 100
4 Particulate Matter (Size <2.5 µm) or PM2.5 µg/m3
Annual* 40 40 1. Gravimetric 2. TOEM 3. Beta attenuation
24 Hours ** 60 60
5 Ozone (O3), µg/m3 8 hours** 100 100 1. UV photometric 2. Chemiluminescence 3. Chemical Method
1 hours ** 180 180
6 Lead (Pb), µg/m3 Annual * 0.50 0.50 1. AAS/ICP Method after sampling using EPM 2000 or equivalent filter paper2. ED-XRF using Teflon filter
24 Hour** 1.0 1.0
7 Carbon Monoxide (CO), mg/m3 8 Hours ** 02 02 Non dispersive Infra Red (NDIR) Spectroscopy1 Hour** 04 04
8 Ammonia (NH3), µg/m3 Annual* 100 100 1. Chemiluminescence 2. Indophernol blue method 24 Hour** 400 400
9 Benzene (C6H6) , µg/m3 Annual * 05 05 1. Gas chromatography based continuous analyzer
2. Adsorption and Desorption followed by GC analysis
10 Benzo(a)Pyrene (BaP)- particulate phase only, ng/m3
Annual* 01 01 Solvent extraction followed by HPLC/GC analysis
11 Arsenic (As), ng/m3 Annual* 06 06 AAS/ICP method after sampling on EPM 2000 or equivalent filter paper
12 Nickel (Ni), ng/m3 Annual* 20 20 AAS/ICP method after sampling on EPM 2000 or equivalent filter paper
* Annual Arithmetic mean of minimum 104 measurements in a year at a particular site taken twice a week 24 hourly at uniform interval.** 24 hourly 08 hourly or 01 hourly monitored values, as applicable shall be complied with 98% of the time in a year. 2% of the time, they may exceed the limits but not on two consecutive days of monitoring.NOTE: Whenever and wherever monitoring results on two consecutive days of monitoring exceed the limits specified above for the respective category, it shall be considered adequate reason to institute regular or continuous monitoring and further investigation
REVISED NATIONAL AMBIENT AIR QUALITY STANDARDS (NAAQS),Nov 2009
PM 10 LEVELS (Annual)
186
89
250
148
83
119
158
5947
220
168
105
260
125123
93 9790
171
152
104
201
105
134
169
139
64
0
107
9078
125
0
10299
188
83
220
0
89
117
87
145
0
110
61
0
50
100
150
200
250
300
Ag
ra
Ah
me
da
ba
d
Alla
hab
ad
Am
rits
ar
Au
ran
ga
ba
d
Ban
galo
re
Bh
op
al
Ch
en
na
i
Co
imb
ato
re
De
lhi
Dh
anb
ad
Far
idab
ad
Gh
azi
ab
ad
Gw
alio
r
Ho
wra
h
Hy
dra
ba
d
Ind
ore
Jab
alp
ur
Jaip
ur
Jod
hp
ur
Ka
lya
n D
om
biv
ali
Ka
np
ur
Ko
lka
ta
Ko
ta
Luck
no
w
Lud
hia
na
Ma
du
rai
Me
eru
t
Mu
mb
ai
Nag
pu
r
Nas
hik
Nav
i Mu
mb
ai
Pa
tna
Pim
pri
Ch
inch
wad
Pu
ne
Rai
pu
r
Raj
ko
t
Ran
chi
Sh
rin
aga
r
Su
rat
Th
an
e
Va
do
da
ra
Va
ran
asi
Va
sai-
vir
ar
Vija
yw
ad
a
Vis
hak
ha
pa
tna
m
Co
nce
ntr
atio
n i
n µ
g/m
3
Million Plus Cities
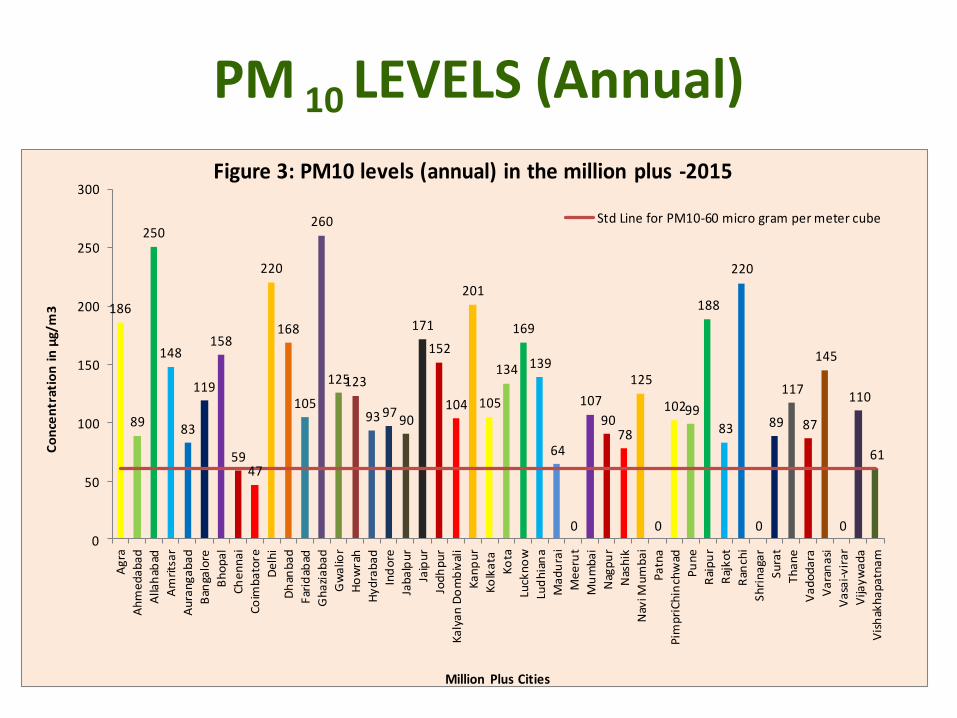
Figure 3: PM10 levels (annual) in the million plus -2015
Std Line for PM10-60 micro gram per meter cube
NO2 LEVELS (Annual)
2221
26
30
40
20
23
20
25
65
37
74
37
14
43
23
20
28
36
24
53
36
56
34
28 2725
0
25 25
23
42
0
52
62
36
19
36
0
20
58
20
33
0
37
19
0
10
20
30
40
50
60
70
80
Agr
a
Ahm
edab
ad
Alla
haba
d
Am
rits
ar
Aur
anga
bad
Bang
alor
e
Bhop
al
Chen
nai
Coim
bato
re
Del
hi
Dha
nbad
Farid
abad
Gha
ziab
ad
Gw
alio
r
How
rah
Hyd
raba
d
Indo
re
Jaba
lpur
Jaip
ur
Jodh
pur
Kaly
an D
ombi
vali
Kanp
ur
Kolk
ata
Kota
Luck
now
Ludh
iana
Mad
urai
Mee
rut
Mum
bai
Nag
pur
Nas
hik
Nav
i Mum
bai
Patn
a
Pim
priC
hinc
hwad
Pune
Raip
ur
Rajk
ot
Ranc
hi
Shri
naga
r
Sura
t
Than
e
Vad
odar
a
Var
anas
i
Vas
ai-v
irar
Vija
ywad
a
Vis
hakh
apat
nam
Conc
entr
atio
n in
µg/
m3
Million Plus Cities
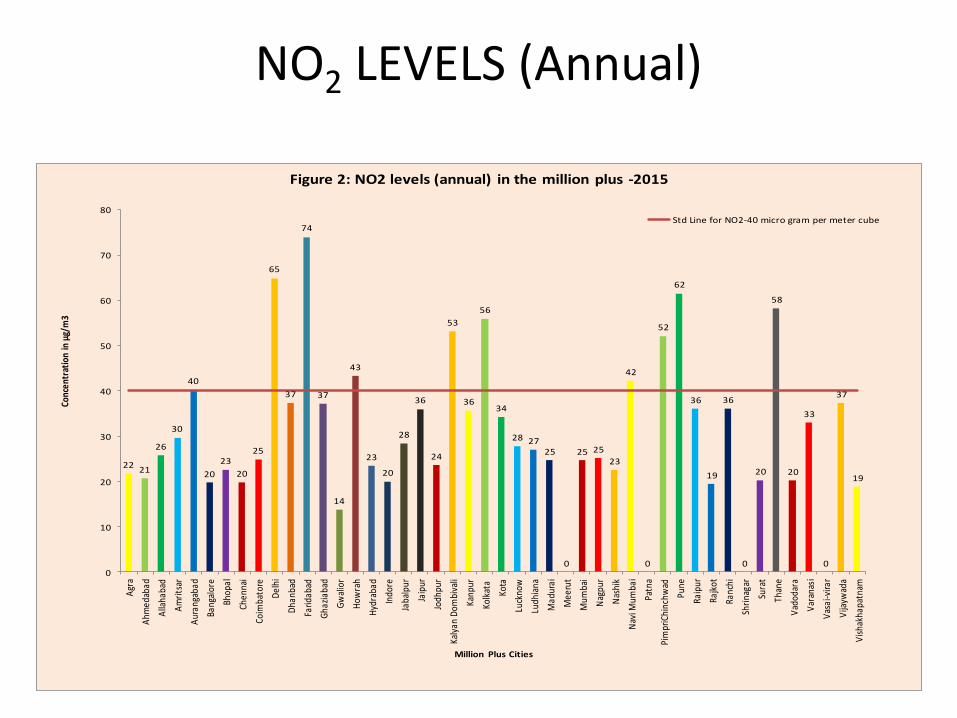
Figure 2: NO2 levels (annual) in the million plus -2015
Std Line for NO2-40 micro gram per meter cube
SO2 LEVELS (Annual)
4
13
4
1113
63
13
45
1215
23
10
15
4
119
7 6
20
6 7 68
1113
0
4
10
1518
0
2323
1313
19
0
14
28
14
19
0
6
9
0
10
20
30
40
50
60
Agr
a
Ah
me
dab
ad
Alla
hab
ad
Am
rits
ar
Au
rang
abad
Ban
galo
re
Bho
pal
Che
nnai
Coi
mb
ator
e
Del
hi
Dha
nba
d
Fari
dab
ad
Gha
ziab
ad
Gw
alio
r
How
rah
Hyd
rab
ad
Ind
ore
Jaba
lpu
r
Jaip
ur
Jod
hpur
Kal
yan
Dom
biva
li
Kan
pur
Kol
kata
Kot
a
Luck
no
w
Lud
hian
a
Mad
urai
Mee
rut
Mu
mb
ai
Nag
pur
Nas
hik
Nav
i Mum
bai
Pat
na
Pim
pri
Ch
inch
wad
Pun
e
Rai
pu
r
Raj
kot
Ran
chi
Shri
naga
r
Sura
t
Than
e
Vad
odar
a
Var
anas
i
Vas
ai-v
irar
Vija
ywad
a
Vis
hakh
apat
nam
Co
nce
ntr
atio
n i
n µ
g/m
3
Million Plus Cities
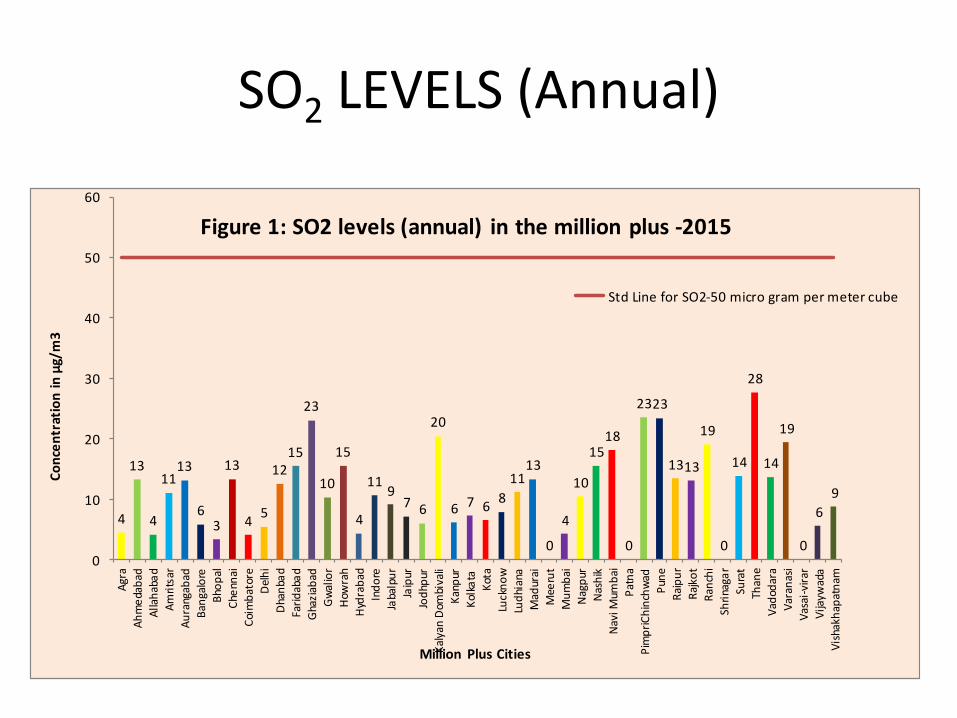
Figure 1: SO2 levels (annual) in the million plus -2015
Std Line for SO2-50 micro gram per meter cube
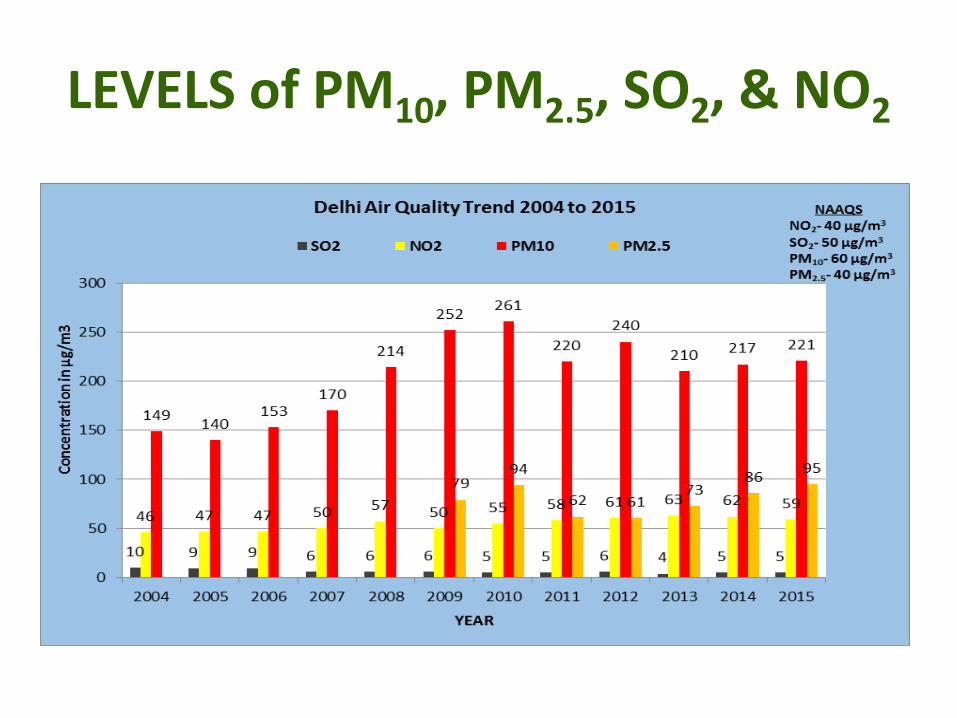
LEVELS of PM10, PM2.5, SO2, & NO2
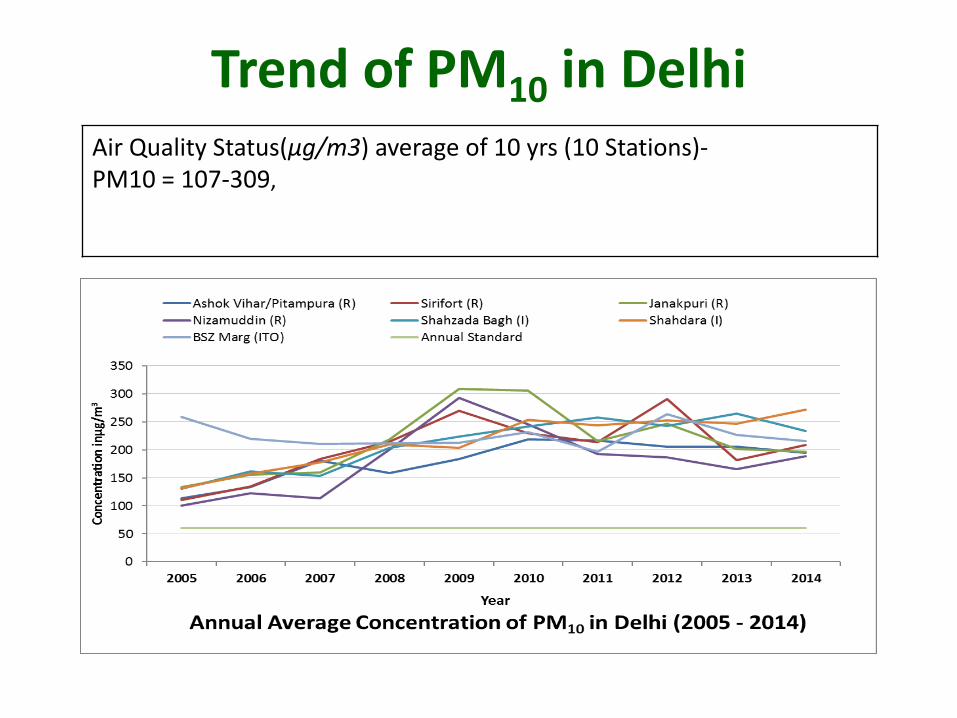
Trend of PM10 in DelhiAir Quality Status(µg/m3) average of 10 yrs (10 Stations)-PM10 = 107-309,
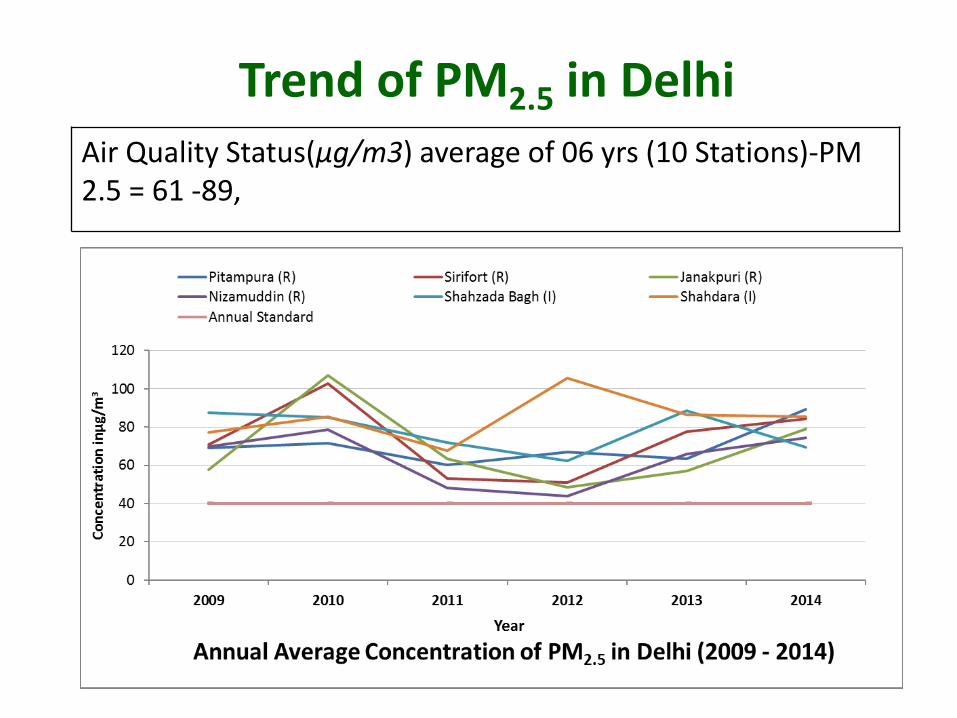
Trend of PM2.5 in DelhiAir Quality Status(µg/m3) average of 06 yrs (10 Stations)-PM 2.5 = 61 -89,

Trend of SO2 in DelhiAir Quality Status(µg/m3) average of 10 yrs (10 Stations)-NOx= 26-94,
The air quality scenario with respect to SO2, NO2 and PM10 in million plus cities is represented in figure 1, 2, and 3
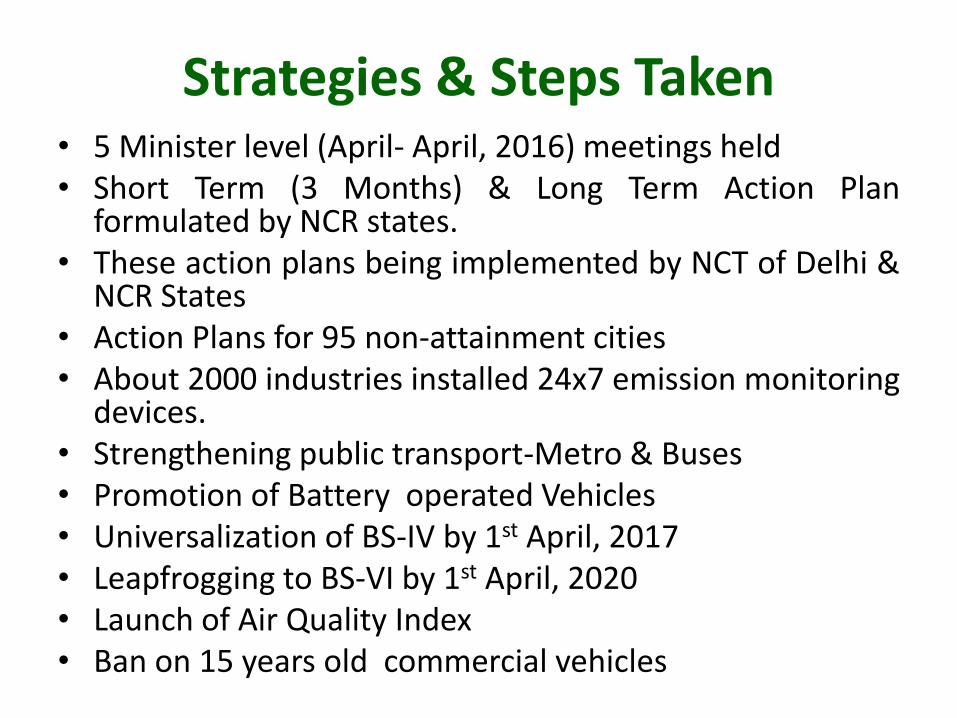
Strategies & Steps Taken• 5 Minister level (April- April, 2016) meetings held• Short Term (3 Months) & Long Term Action Plan
formulated by NCR states.• These action plans being implemented by NCT of Delhi &
NCR States• Action Plans for 95 non-attainment cities• About 2000 industries installed 24x7 emission monitoring
devices.• Strengthening public transport-Metro & Buses• Promotion of Battery operated Vehicles• Universalization of BS-IV by 1st April, 2017• Leapfrogging to BS-VI by 1st April, 2020• Launch of Air Quality Index• Ban on 15 years old commercial vehicles
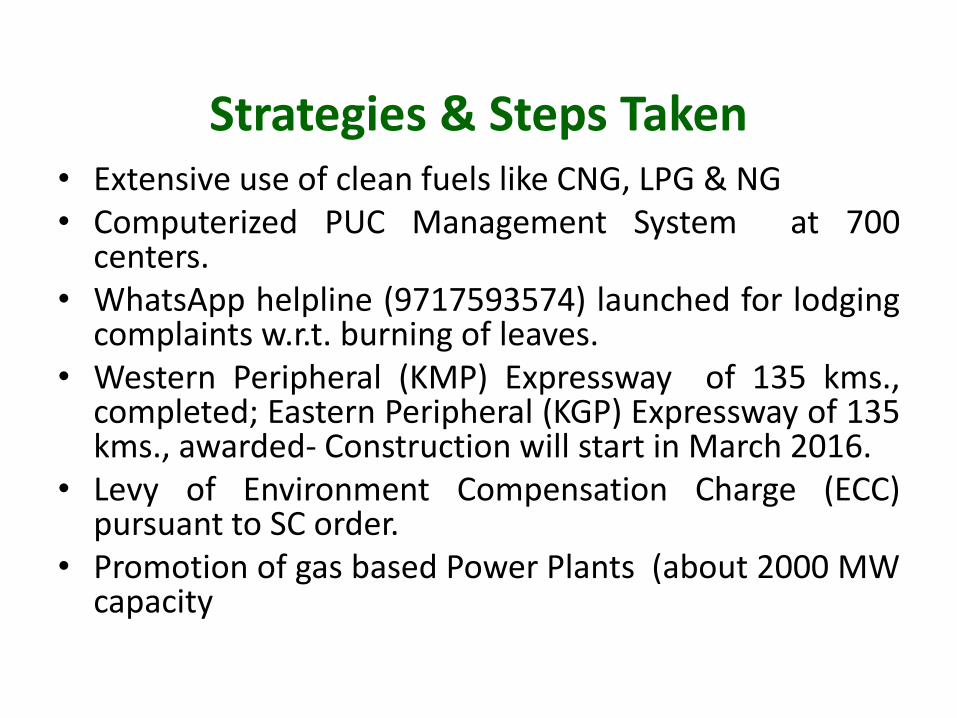
Strategies & Steps Taken• Extensive use of clean fuels like CNG, LPG & NG• Computerized PUC Management System at 700
centers.• WhatsApp helpline (9717593574) launched for lodging
complaints w.r.t. burning of leaves.• Western Peripheral (KMP) Expressway of 135 kms.,
completed; Eastern Peripheral (KGP) Expressway of 135kms., awarded- Construction will start in March 2016.
• Levy of Environment Compensation Charge (ECC)pursuant to SC order.
• Promotion of gas based Power Plants (about 2000 MWcapacity
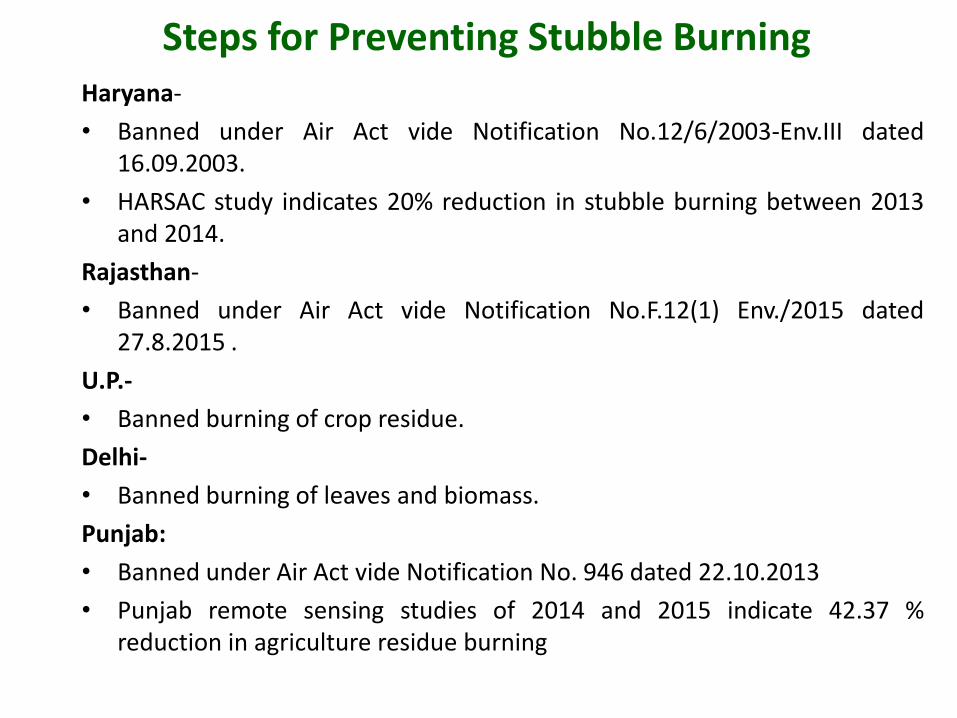
Steps for Preventing Stubble BurningHaryana-
• Banned under Air Act vide Notification No.12/6/2003-Env.III dated16.09.2003.
• HARSAC study indicates 20% reduction in stubble burning between 2013and 2014.
Rajasthan-
• Banned under Air Act vide Notification No.F.12(1) Env./2015 dated27.8.2015 .
U.P.-
• Banned burning of crop residue.
Delhi-
• Banned burning of leaves and biomass.
Punjab:
• Banned under Air Act vide Notification No. 946 dated 22.10.2013
• Punjab remote sensing studies of 2014 and 2015 indicate 42.37 %reduction in agriculture residue burning

THANKS


