62
Alachua County’s Economic, Demographic & Fiscal Trends December 3, 2013

Alachua County’s Economic, Demographic & Fiscal Trends
December 3, 2013

Topics
Part 1: A Demographic and Economic Overview
Part 2: An Independent Perspective on Economic Trends and Development
Part 3: Understanding the Fiscal History and Future Scenarios Concerning Alachua County Government
Overview

Part 1: A Demographic and Economic Overview
Presented by
Edgar Campa-Palafox, Economic Development and Steve Lachnicht, Growth Management

County population: 248,002; by 2040: 305,387
Annual growth rate will be lower than in previous decades.
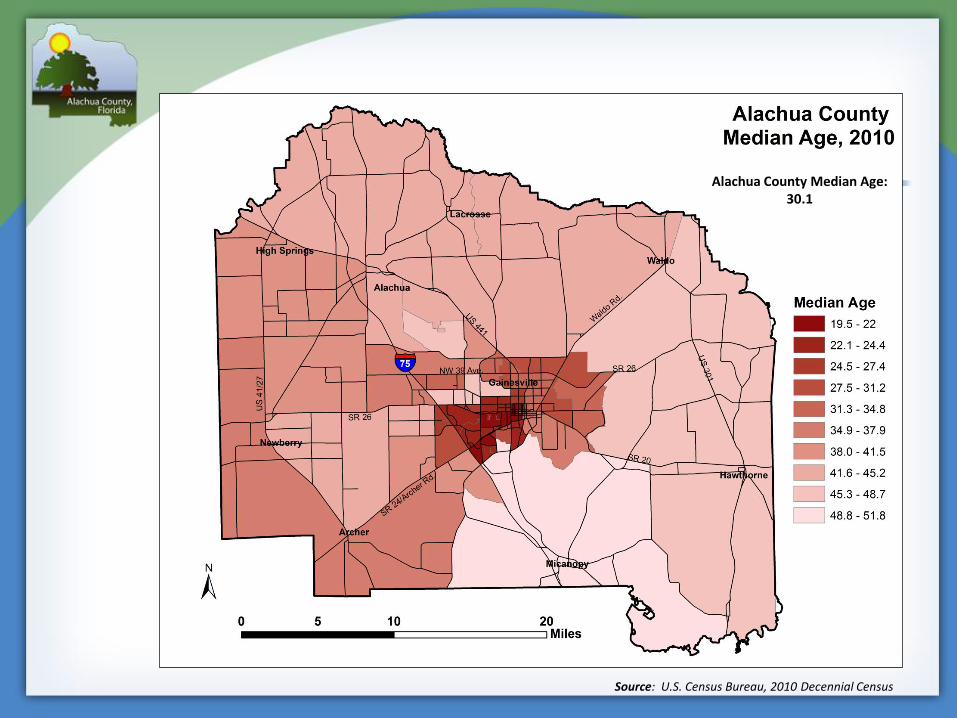
Population is relatively young but is projected to get older.
Household size is lower than the state average, and is decreasing.
Poverty Rate: About 57,000 people are in poverty (about 37,000 when college students are not included).
Unemployment rates have been lower than state and national rates.
Employment is concentrated in relatively few industries, with almost half in the education & health services and government sectors.
Building Permits: Recent trends show signs of recovery from the recession.
Key Points

Current Population
Unincorporated Area, 40.0%
Alachua, 3.7%
Archer, 0.5%
Gainesville, 50.2%
Hawthorne, 0.6%
High Springs, 2.2%
LaCrosse, 0.1% Micanopy, 0.2%
Newberry, 2.1%
Waldo, 0.4%
Other Cities, 9.8%
Share of Alachua County Population by Jurisdiction, 2013
Source: State of Florida Office of Economic and Demographic Research Florida Population Estimates for Counties and Municipalities: April 1, 2013
Population
Alachua County Total 248,002
Unincorporated Area 99,282
Alachua 9,300
Archer 1,123
Gainesville 124,391
Hawthorne 1,389
High Springs 5,440
LaCrosse 360
Micanopy 600
Newberry 5,148
Waldo 969
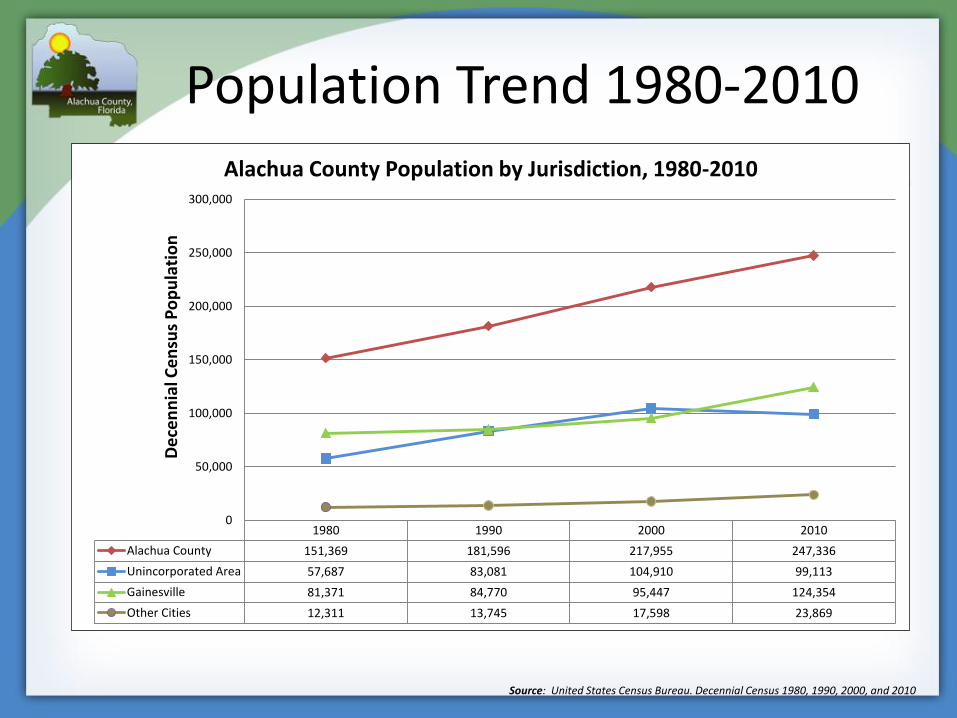
Population Trend 1980-2010
1980 1990 2000 2010
Alachua County 151,369 181,596 217,955 247,336
Unincorporated Area 57,687 83,081 104,910 99,113
Gainesville 81,371 84,770 95,447 124,354
Other Cities 12,311 13,745 17,598 23,869
0
50,000
100,000
150,000
200,000
250,000
300,000
De
cen
nia
l Ce
nsu
s P
op
ula
tio
n
Alachua County Population by Jurisdiction, 1980-2010
Source: United States Census Bureau. Decennial Census 1980, 1990, 2000, and 2010
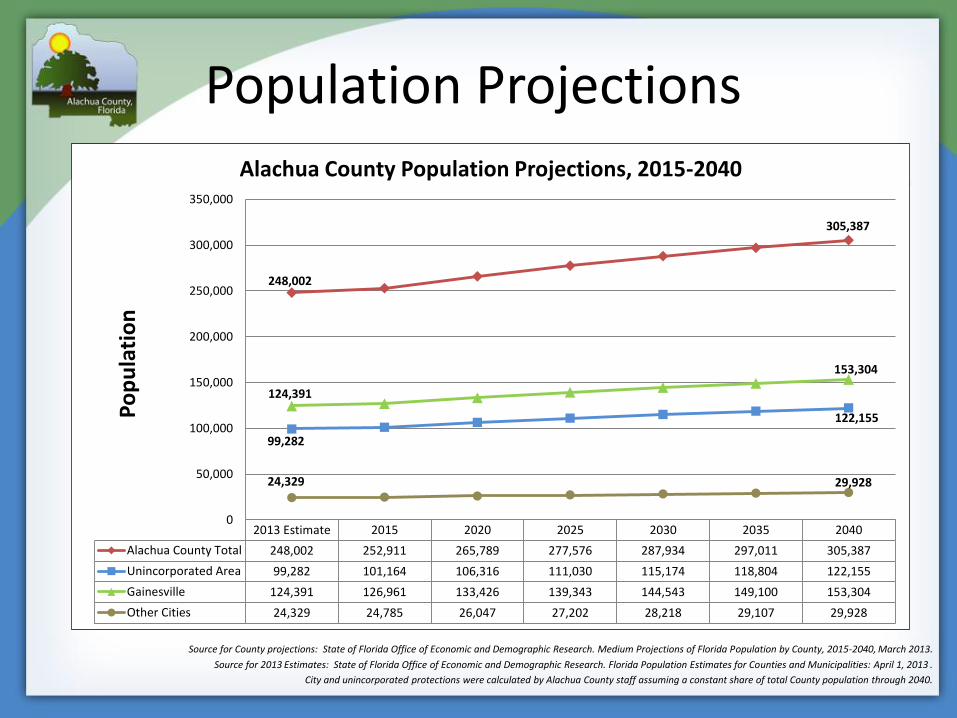
Population Projections
2013 Estimate 2015 2020 2025 2030 2035 2040
Alachua County Total 248,002 252,911 265,789 277,576 287,934 297,011 305,387
Unincorporated Area 99,282 101,164 106,316 111,030 115,174 118,804 122,155
Gainesville 124,391 126,961 133,426 139,343 144,543 149,100 153,304
Other Cities 24,329 24,785 26,047 27,202 28,218 29,107 29,928
248,002
305,387
99,282
122,155
124,391
153,304
24,329 29,928
0
50,000
100,000
150,000
200,000
250,000
300,000
350,000
Po
pu
lati
on
Alachua County Population Projections, 2015-2040
Source for County projections: State of Florida Office of Economic and Demographic Research. Medium Projections of Florida Population by County, 2015-2040, March 2013.
Source for 2013 Estimates: State of Florida Office of Economic and Demographic Research. Florida Population Estimates for Counties and Municipalities: April 1, 2013 .
City and unincorporated protections were calculated by Alachua County staff assuming a constant share of total County population through 2040.

Age Distribution, 2000
10.0 8.0 6.0 4.0 2.0 0.0 2.0 4.0 6.0 8.0 10.0
Under 5
5 to 9
10 to 14
15 to 19
20 to 24
25 to 29
30 to 34
35 to 39
40 to 44
45 to 49
50 to 54
55 to 59
60 to 64
65 to 69
70 to 74
75 to 79
80 to 84
85 and over
Percent of Total State Population
Florida Population by Age Range - 2000
Female
Male
Source: U.S. Census Bureau, 2000 Decennial Census
Total Population: 15,982,378
Median Age: 38.7
10.0 8.0 6.0 4.0 2.0 0.0 2.0 4.0 6.0 8.0 10.0
Under 5
5 to 9
10 to 14
15 to 19
20 to 24
25 to 29
30 to 34
35 to 39
40 to 44
45 to 49
50 to 54
55 to 59
60 to 64
65 to 69
70 to 74
75 to 79
80 to 84
85 and over
Percent of Total County Population
Alachua County Population by Age Range - 2000
Female
Male
Total Population: 217,955
Median Age: 29.0
Source: U.S. Census Bureau, 2000 Decennial Census

Age Distribution, 2010
10.0 8.0 6.0 4.0 2.0 0.0 2.0 4.0 6.0 8.0 10.0
Under 5
5 to 9
10 to 14
15 to 19
20 to 24
25 to 29
30 to 34
35 to 39
40 to 44
45 to 49
50 to 54
55 to 59
60 to 64
65 to 69
70 to 74
75 to 79
80 to 84
85 and over
Percent of Total State Population
Florida Population by Age Range - 2010
Female
Male
Source: U.S. Census Bureau, 2010 Decennial Census
Total Population: 18,801,332
Median Age: 40.7
10.0 8.0 6.0 4.0 2.0 0.0 2.0 4.0 6.0 8.0 10.0
Under 5
5 to 9
10 to 14
15 to 19
20 to 24
25 to 29
30 to 34
35 to 39
40 to 44
45 to 49
50 to 54
55 to 59
60 to 64
65 to 69
70 to 74
75 to 79
80 to 84
85 and over
Percent of Total County Population
Alachua County Population by Age Range - 2010
Female
Male
Total Population: 247,336
Median Age: 30.1
Source: U.S. Census Bureau, 2010 Decennial Census

Age Distribution, 2040
10.00 8.00 6.00 4.00 2.00 0.00 2.00 4.00 6.00 8.00 10.00
Under 5
5 to 9
10 to 14
15 to 19
20 to 24
25 to 29
30 to 34
35 to 39
40 to 44
45 to 49
50 to 54
55 to 59
60 to 64
65 to 69
70 to 74
75 to 79
80 to 84
85 and over
Percent of Total County Population
Alachua County Population by Age Range - 2040 Projections Female
MaleProjected County Population, 2040: 305,387
Source: University of Florida Bureau of Economic and Business Research
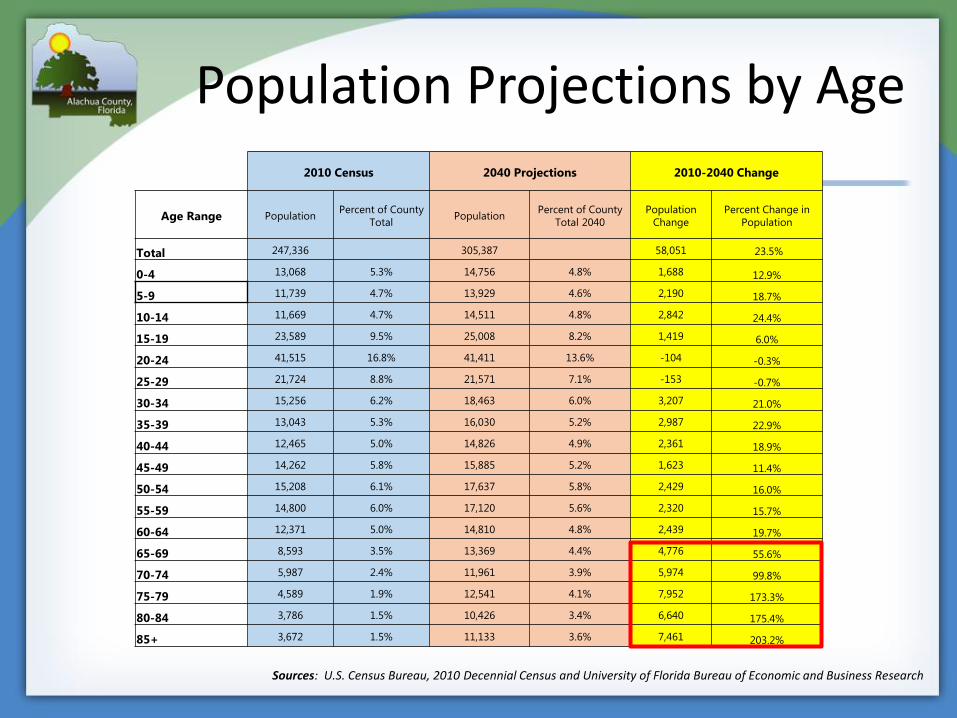
Population Projections by Age
2010 Census 2040 Projections 2010-2040 Change
Age Range Population Percent of County
Total Population
Percent of County
Total 2040
Population
Change
Percent Change in
Population
Total 247,336 305,387 58,051 23.5%
0-4 13,068 5.3% 14,756 4.8% 1,688 12.9%
5-9 11,739 4.7% 13,929 4.6% 2,190 18.7%
10-14 11,669 4.7% 14,511 4.8% 2,842 24.4%
15-19 23,589 9.5% 25,008 8.2% 1,419 6.0%
20-24 41,515 16.8% 41,411 13.6% -104 -0.3%
25-29 21,724 8.8% 21,571 7.1% -153 -0.7%
30-34 15,256 6.2% 18,463 6.0% 3,207 21.0%
35-39 13,043 5.3% 16,030 5.2% 2,987 22.9%
40-44 12,465 5.0% 14,826 4.9% 2,361 18.9%
45-49 14,262 5.8% 15,885 5.2% 1,623 11.4%
50-54 15,208 6.1% 17,637 5.8% 2,429 16.0%
55-59 14,800 6.0% 17,120 5.6% 2,320 15.7%
60-64 12,371 5.0% 14,810 4.8% 2,439 19.7%
65-69 8,593 3.5% 13,369 4.4% 4,776 55.6%
70-74 5,987 2.4% 11,961 3.9% 5,974 99.8%
75-79 4,589 1.9% 12,541 4.1% 7,952 173.3%
80-84 3,786 1.5% 10,426 3.4% 6,640 175.4%
85+ 3,672 1.5% 11,133 3.6% 7,461 203.2%
Sources: U.S. Census Bureau, 2010 Decennial Census and University of Florida Bureau of Economic and Business Research
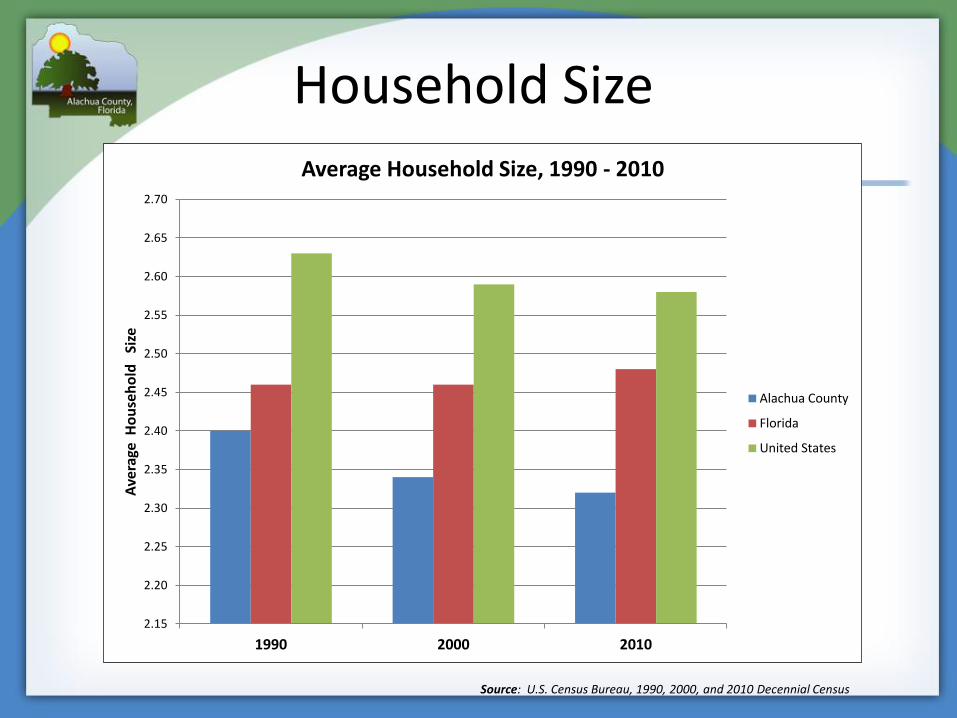
Household Size
2.15
2.20
2.25
2.30
2.35
2.40
2.45
2.50
2.55
2.60
2.65
2.70
1990 2000 2010
Ave
rage
Ho
use
ho
ld
Size
Average Household Size, 1990 - 2010
Alachua County
Florida
United States
Source: U.S. Census Bureau, 1990, 2000, and 2010 Decennial Census
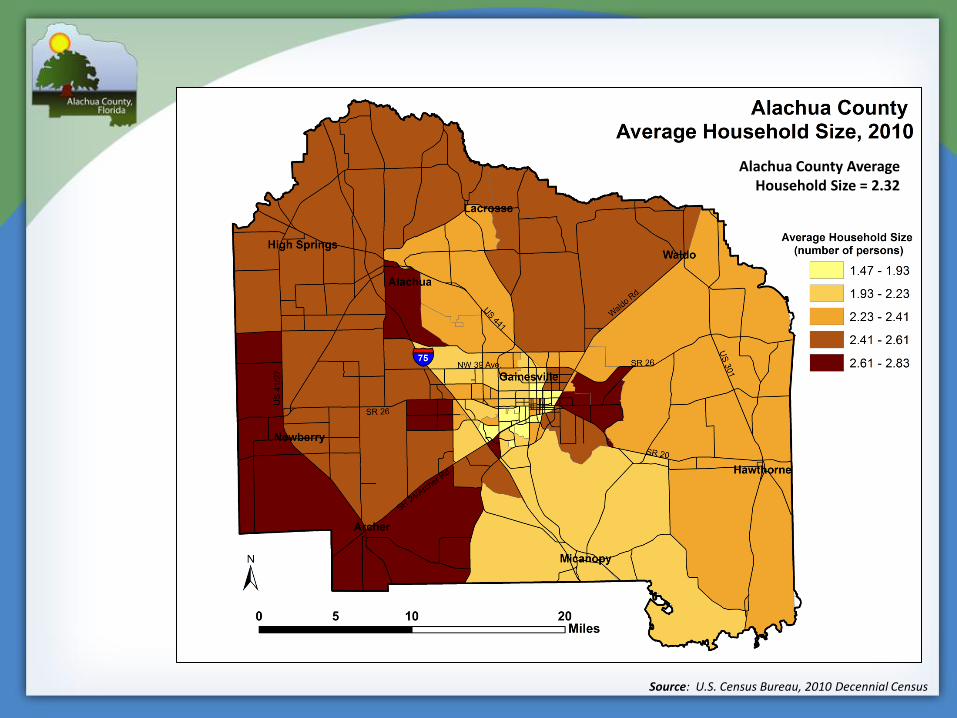
Source: U.S. Census Bureau, 2010 Decennial Census
Alachua County Average Household Size = 2.32
Source: U.S. Census Bureau, 2010 Decennial Census
Alachua County Median Age: 30.1

Population Summary
• County population is projected to grow about 57,000 to 305,387 by 2040.
• Annual growth rate through 2020 is projected to be about 2,500 people per year, and then decline to about 1,700 per year toward the latter part of this period. This compares to growth rate of about 3,000 people per year in previous decades.
• The population is relatively young, with the college age population comprising more than 20% of the County’s population, and children under 17 making up about 18% of the population. The population in these age groups is expected to grow modestly through 2040.
• The population is getting older. Population aged 65 and older in 2010 (26,627, or about 11% of the total) is projected to increase by more than 50% (to 41,497 in 2020); this older age group is projected to increase to 59,430 people by 2040 and make up 24% of the population.
• Household size is lower than the state average, and decreasing due in part to more single-person households, households without children, and other non-traditional households.
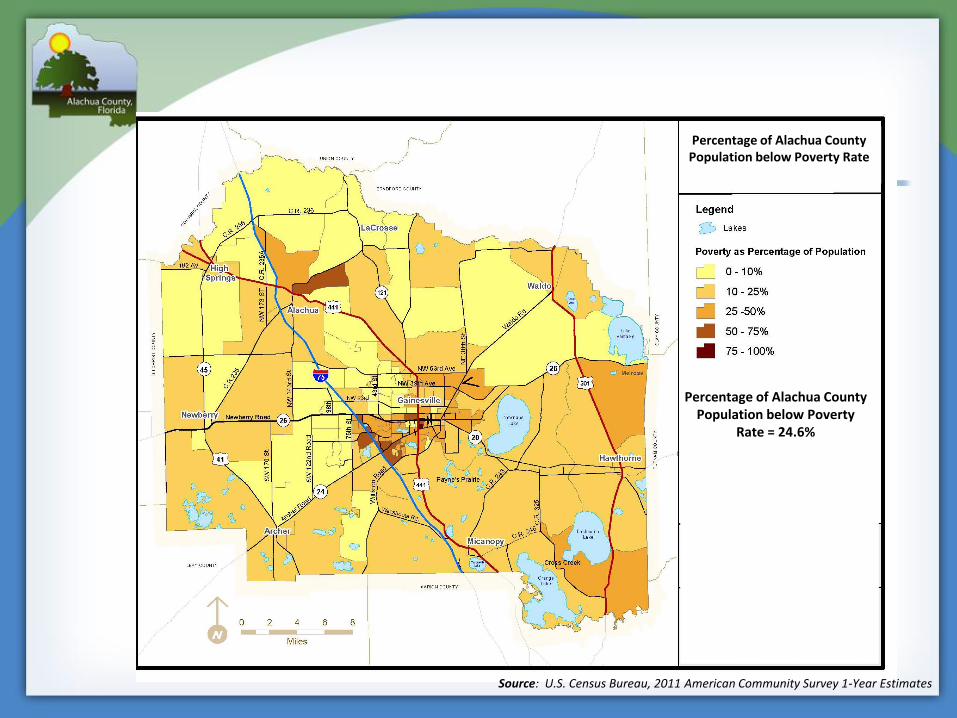
Percentage of Alachua County Population below Poverty
Rate = 24.6%
Percentage of Alachua County Population below Poverty Rate
Source: U.S. Census Bureau, 2011 American Community Survey 1-Year Estimates
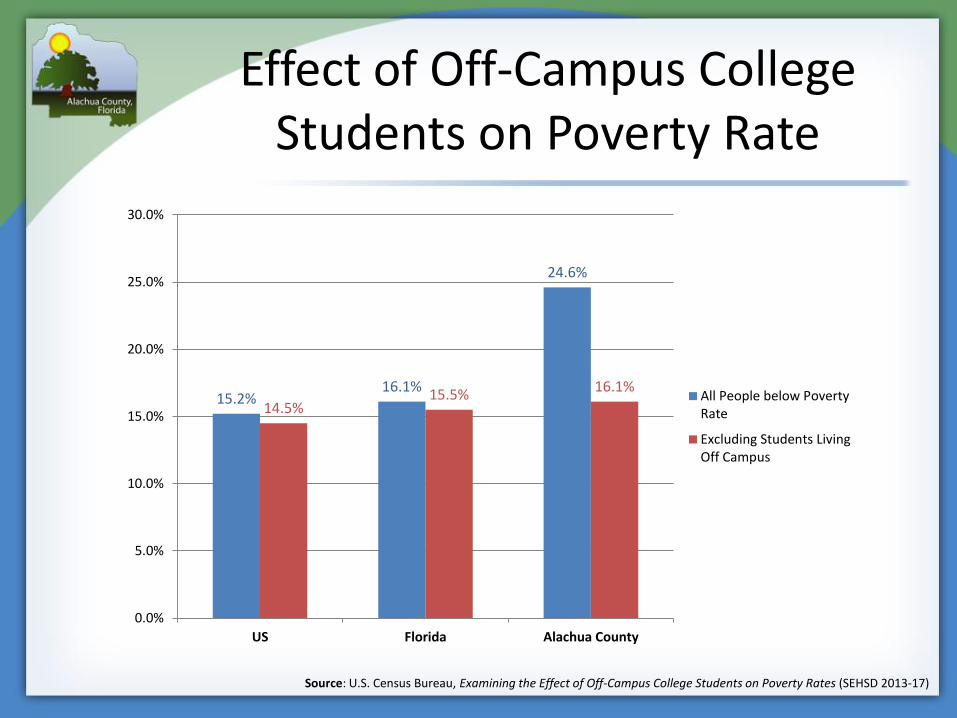
Effect of Off-Campus College Students on Poverty Rate
Source: U.S. Census Bureau, Examining the Effect of Off-Campus College Students on Poverty Rates (SEHSD 2013-17)
15.2% 16.1%
24.6%
14.5% 15.5%
16.1%
0.0%
5.0%
10.0%
15.0%
20.0%
25.0%
30.0%
US Florida Alachua County
All People below PovertyRate
Excluding Students LivingOff Campus

Sources: University of Florida Bureau of Economic and Business Research http://www.bebr.ufl.edu/data/county/Alachua/HumanResources Florida Department of Health, Division of Public Health Statistics & Performance Management (FloridaCHARTS.com)
Social Service Indicators
Persons Receiving Food Stamp Benefits in Alachua County, 2012 53,826
As Percentage of Total County Population, 2012 21.8%
Persons Receiving Medicaid Benefits in Alachua County 2012 38,332
As Percentage of Total County Population, 2012 15.5%
Persons 60+ Years of Age Living in Poverty in Alachua County, 2011 3,248
As Percentage of Total County Population 60+ Years of Age, 2011 8.3%
Percentage of Grandparents Living in Household with One or More Own Grandchildren Under 18, Where Grandparent is Responsible for Grandchildren, 2010
Alachua County: 50% Florida: 38.3%
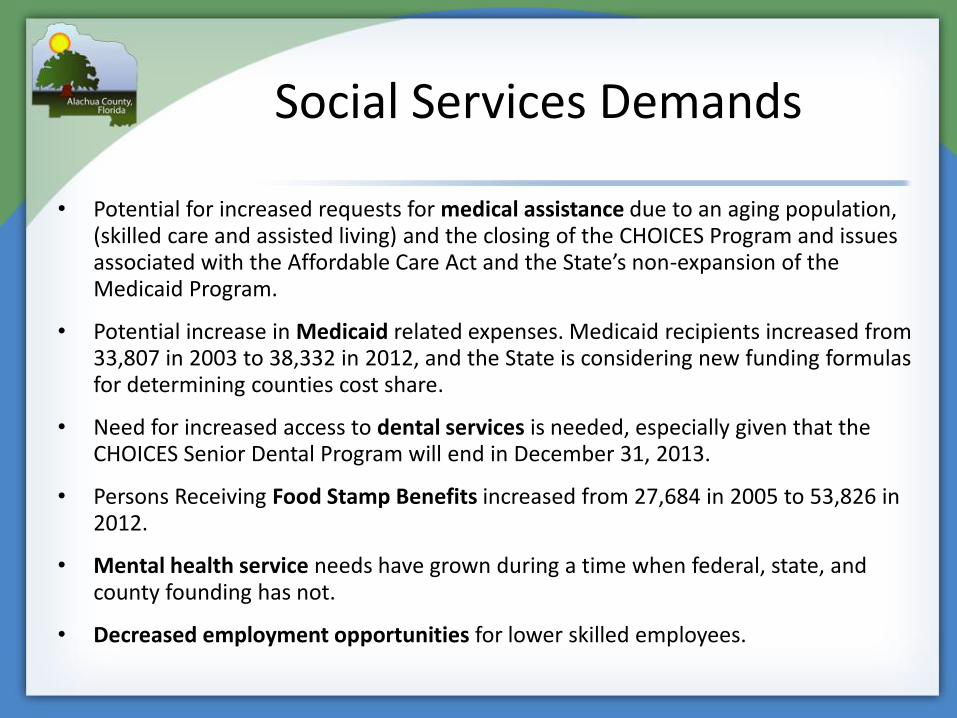
• Potential for increased requests for medical assistance due to an aging population, (skilled care and assisted living) and the closing of the CHOICES Program and issues associated with the Affordable Care Act and the State’s non-expansion of the Medicaid Program.
• Potential increase in Medicaid related expenses. Medicaid recipients increased from 33,807 in 2003 to 38,332 in 2012, and the State is considering new funding formulas for determining counties cost share.
• Need for increased access to dental services is needed, especially given that the CHOICES Senior Dental Program will end in December 31, 2013.
• Persons Receiving Food Stamp Benefits increased from 27,684 in 2005 to 53,826 in 2012.
• Mental health service needs have grown during a time when federal, state, and county founding has not.
• Decreased employment opportunities for lower skilled employees.
Social Services Demands

Household Income
Source: U.S. Census, 2013 American Community Survey 1-Year Estimates, Income and Benefits, in 2013 Inflation-Adjusted Dollars
0%
2%
4%
6%
8%
10%
12%
14%
16%
18%
20%
Alachua County
Florida
US

0%
2%
4%
6%
8%
10%
12%
14%
16%
18%
20%
22%
Less than$10,000
$10,000to
$14,999
$15,000to
$24,999
$25,000to
$34,999
$35,000to
$49,999
$50,000to
$74,999
$75,000to
$99,999
$100,000to
$149,999
$150,000to
$199,999
$200,000or more
Alachua County
Florida
US
Family Income Distribution
Source: U.S. Census, 2013 American Community Survey 1-Year Estimates, Income and Benefits, in 2013 Inflation-Adjusted Dollars

Median Household Income
Source: U.S. Census, 2005-2012 American Community Survey.
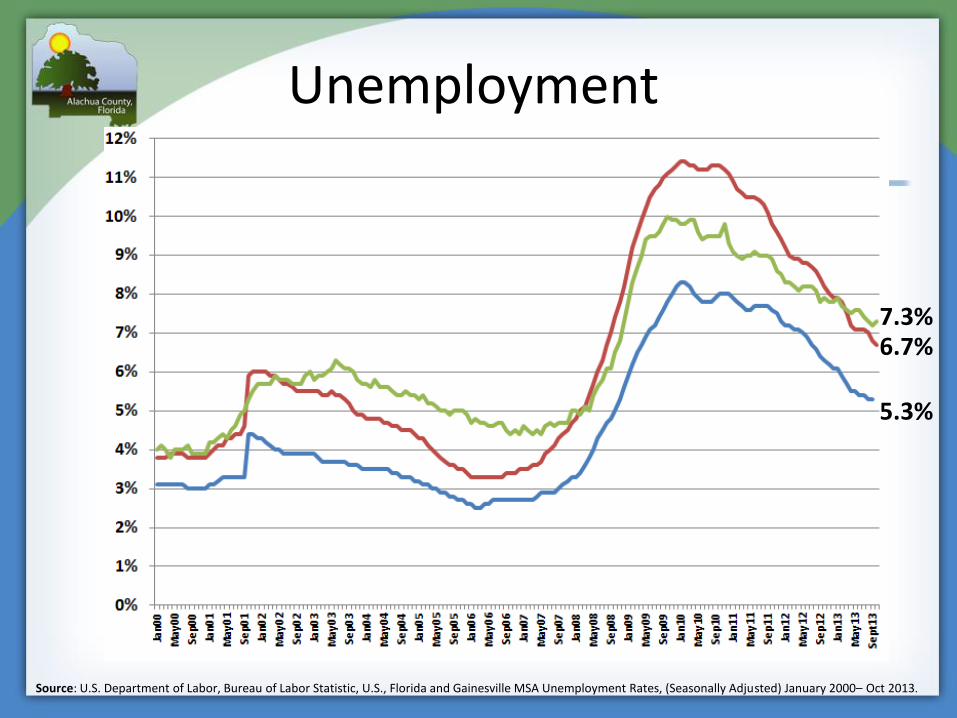
Unemployment
Source: U.S. Department of Labor, Bureau of Labor Statistic, U.S., Florida and Gainesville MSA Unemployment Rates, (Seasonally Adjusted) January 2000– Oct 2013.
7.3% 6.7%
5.3%

Employment Distribution by Industry
Source: U.S. Department of Labor, Bureau of Labor Statistic. Figures as of August 2013.
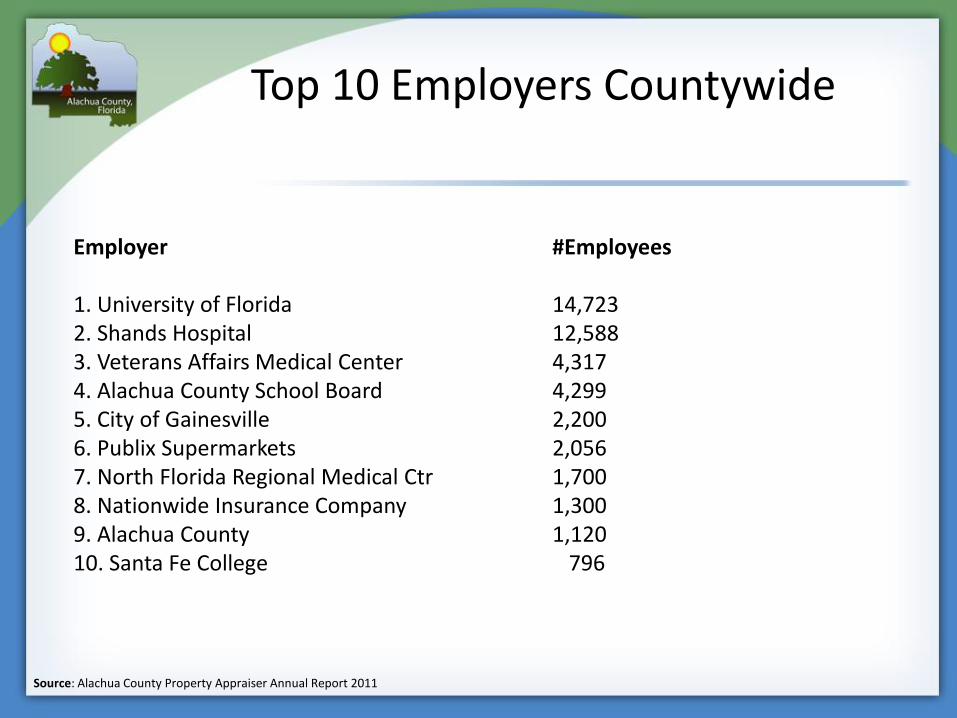
Top 10 Employers Countywide
Source: Alachua County Property Appraiser Annual Report 2011
Employer #Employees 1. University of Florida 14,723 2. Shands Hospital 12,588 3. Veterans Affairs Medical Center 4,317 4. Alachua County School Board 4,299 5. City of Gainesville 2,200 6. Publix Supermarkets 2,056 7. North Florida Regional Medical Ctr 1,700 8. Nationwide Insurance Company 1,300 9. Alachua County 1,120 10. Santa Fe College 796

Alachua County Industry Cluster Analysis Emerging Trends
Source: Data from Preliminary Alachua County Industry Cluster Analysis, Avalanche Consulting using data from EMSI .
1. Strong/Advancing • Healthcare, Biomedical Supplies & Labs
2. Strong/Declining • Government, Non-Profits, Culture & Entertainment
3. Weak/Emerging • Research, Private Education, Professional Services, Software/Info. Tech,
Transportation & Logistics, Materials, Energy
4. Weak/Declining • Building & Construction, Telecom Services, Engineering Design & Content,
Back Office, Retail Furniture, Electronics, Industrial Machinery, Agribusiness & Food, Industrial Machinery, Metalworking, Retail, Consumer Good Manufacturing and Finance.
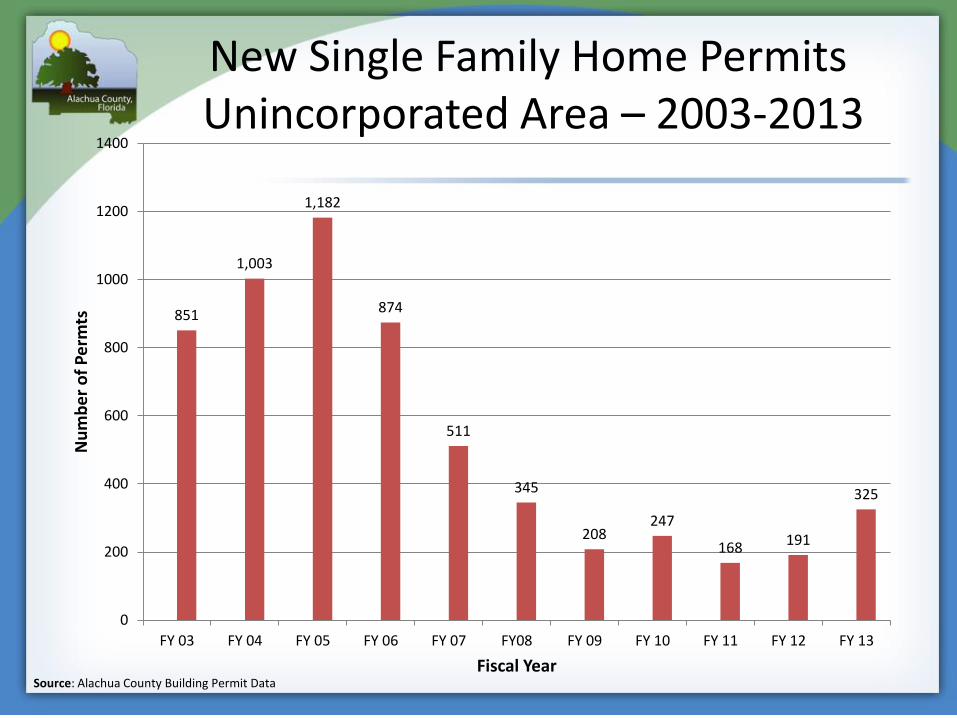
New Single Family Home Permits Unincorporated Area – 2003-2013
Source: Alachua County Building Permit Data
851
1,003
1,182
874
511
345
208 247
168 191
325
0
200
400
600
800
1000
1200
1400
FY 03 FY 04 FY 05 FY 06 FY 07 FY08 FY 09 FY 10 FY 11 FY 12 FY 13
Nu
mb
er
of
Pe
rmts
Fiscal Year
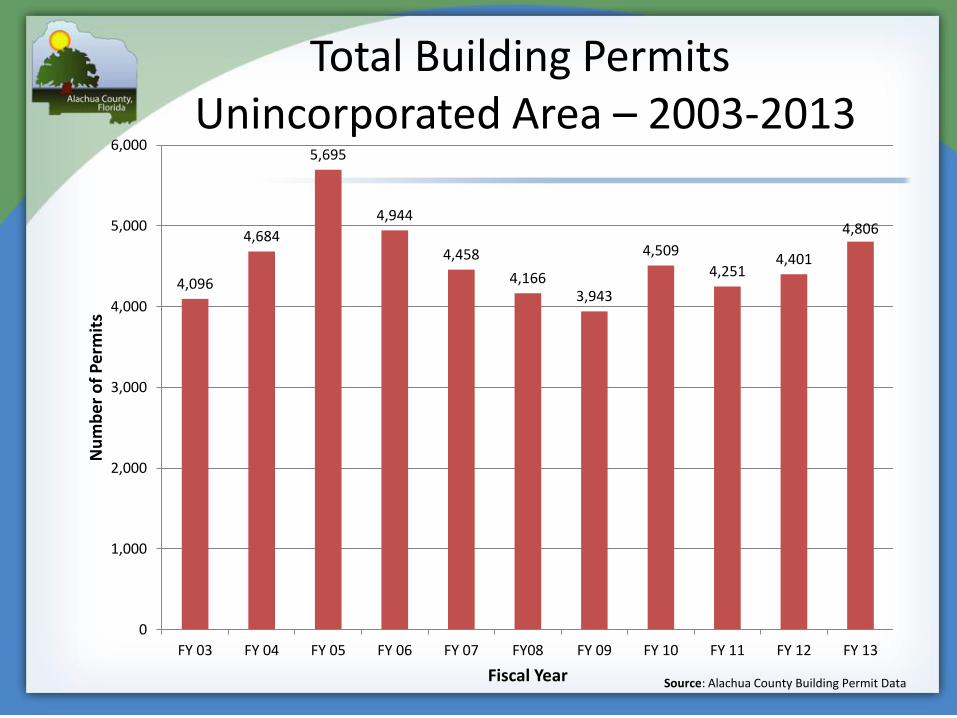
Total Building Permits Unincorporated Area – 2003-2013
Source: Alachua County Building Permit Data
4,096
4,684
5,695
4,944
4,458
4,166 3,943
4,509
4,251 4,401
4,806
0
1,000
2,000
3,000
4,000
5,000
6,000
FY 03 FY 04 FY 05 FY 06 FY 07 FY08 FY 09 FY 10 FY 11 FY 12 FY 13
Nu
mb
er
of
Pe
rmit
s
Fiscal Year

Single-Family Lot Inventory for Unincorporated Alachua County*
Inside Urban Cluster:
4,593 (1,206 Platted)
Outside Urban Cluster:
1,019
Total: 5,612
SF permits/year average
230 (2010-2012)
* Figures do not include land without development approvals.
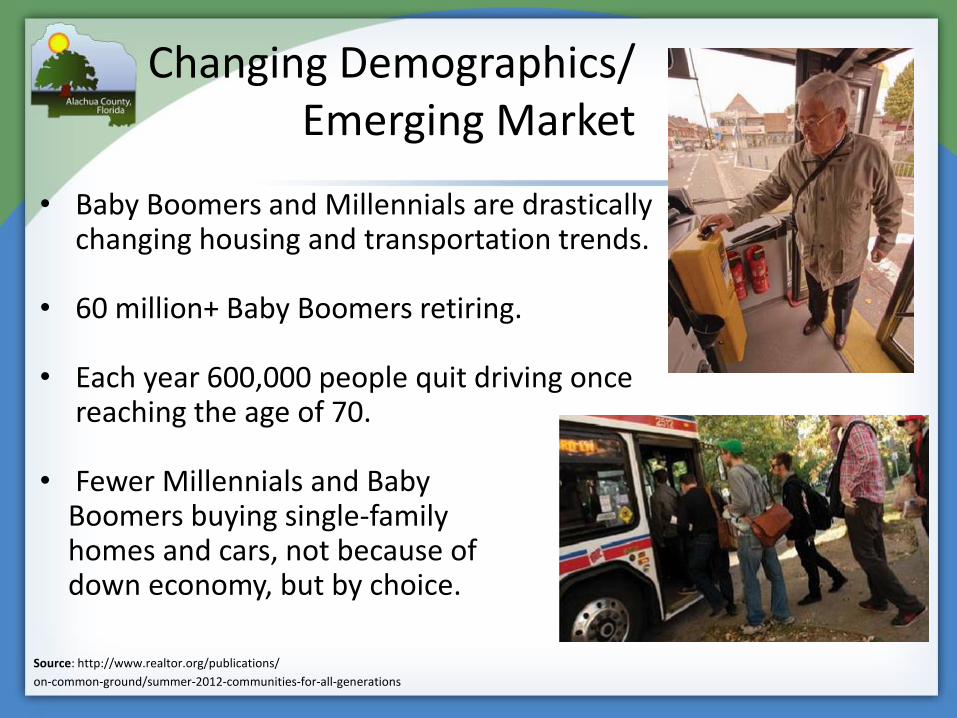
Changing Demographics/ Emerging Market
• Baby Boomers and Millennials are drastically changing housing and transportation trends.
• 60 million+ Baby Boomers retiring.
• Each year 600,000 people quit driving once reaching the age of 70.
• Fewer Millennials and Baby Boomers buying single-family homes and cars, not because of down economy, but by choice.
Source: http://www.realtor.org/publications/
on-common-ground/summer-2012-communities-for-all-generations

Changing Demographics/ Emerging Market
• Significant rise in “non-traditional” homes projected for Florida’s future.
• Between 2000 and 2025 largest changes are for homes without children and single-person households.

$374,184
$486,427
$616,636
$662,613
$2,435,860
$9,115,559
$5,200,000
$0 $2,000,000 $4,000,000 $6,000,000 $8,000,000 $10,000,000
Low Density Residential
Community Retail
Regional Retail
Low Rise Mixed Use
Mid-Intensity Mixed Use
Higher Intensity Mixed Use
County TOD
LAND USE AND FISCAL EFFICIENCY
Assessed Value per Acre
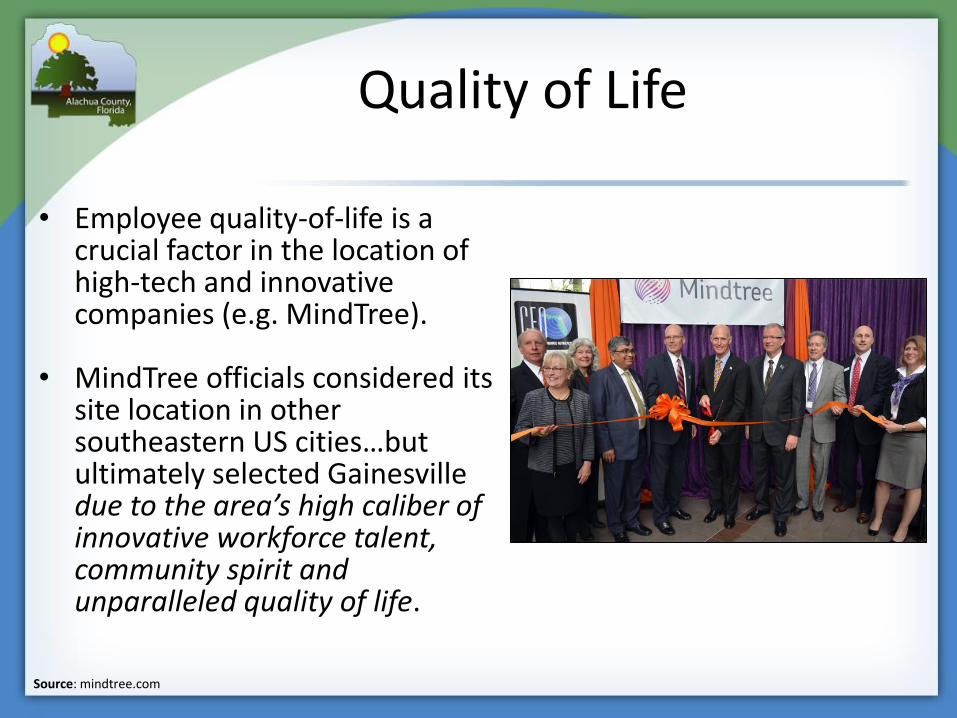
Quality of Life
• Employee quality-of-life is a crucial factor in the location of high-tech and innovative companies (e.g. MindTree).
• MindTree officials considered its site location in other southeastern US cities…but ultimately selected Gainesville due to the area’s high caliber of innovative workforce talent, community spirit and unparalleled quality of life.
Source: mindtree.com

Source: Dr. Tim Chapin, Florida’s Demographic Destiny, 2013 presentation
Quality Growth’s Demographic Opportunity
• Aging population and smaller households will result in more demand for smaller residential units on smaller lots in mixed use areas.
• These households will likely desire a different package of amenities and local land uses than households with larger families.
• Emerging development opportunities may exist for mixed use development with a range of housing types and access to public transportation.
• Fiscal efficiency in service provision is generally greater for compact, higher density, mixed use areas.
• Social service demands, such as access to affordable medical care, dental care, food, mental health services to serve current and future populations in need, including seniors, lower-income households, and smaller non-traditional households.
• For social service providers, there will be new challenges to serve smaller households with less in-home support.
Summing Up

Part 2: An Independent Perspective on Economic Trends and Development
Presented by
Mike Warren, AMJ Inc. of Gainesville
(Special thanks to Beau Beery, Coldwell Banker for specific lease and sale data)

Overall Economic Growth
• Tepid growth in Alachua County • Local economy did not see the ravages of other
communities and is not seeing a rapid uptake • Business is uncertain about future of the economy,
monetary policy and investment • Economic projections based on interest rate models
show no appreciable growth over next three years

Single Family Residential
• Bright spot in the market • Starts are back to a lower, new normal • Lack of recent development and pent up demand
pushing up prices • Likely to see a dearth of desirable residential lots in 3-
5 years without new development • Increasing market in land sales by investors looking for
tracts in the path of future development but used in agriculture or silvaculture now
• Lack of funding for construction and mortgages is keeping the market in check

Multi-Family
• Hot sector of the residential market, except in our area, where a glut of apartments and condos is slowly being absorbed
• Vacancies are around 7% overall, and rents have increased slightly after years of discounting and incentives
• New sales are few and far between and focused on troubled assets in the UF area
• New development restricted to high density, high income markets

Retail
• Over-retailed as a country, Alachua County is no exception, with continued rent compression
• Small suites (under 1,000 sf) on high traffic corridors lease well, with a fall-off as suite size increases. Of 42 retail leases in 2013, only 3 were for spaces over 5,000 sf
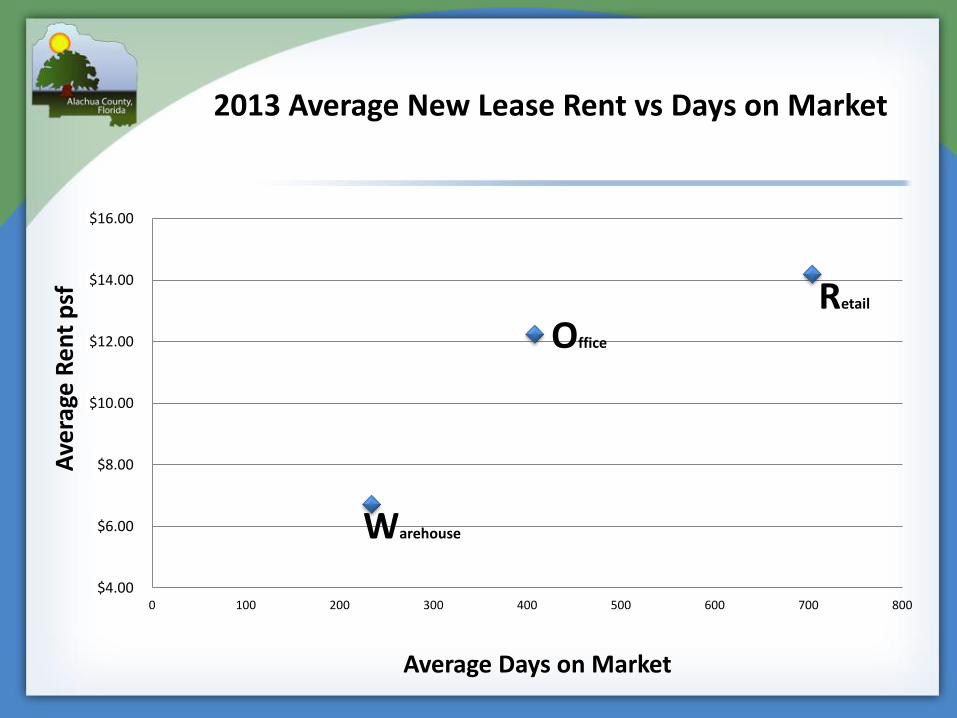
• Average rental rate for 2013 leases is $14.20 psf NNN, and the average retail listing is active for almost 2 years

Retail cont’d
• Too many major retail developments planned – not all will succeed given our demographics and the economics
• Retail jobs typically pay low wages, and are highly impacted by costs of ACA and minimum wage increases
• Utility costs will be a continuing headwind for retail and other business

Office
• Stagnant or compressed rents with an average rate for 2013 leases at $12.25 psf gross
• Low demand, with high vacancy factors and only 51 leases in 2013 with an average of over 400 days on the market
• Over 80% of 2013 office leasing activity occurred west of 34th Street
• Average footprint of leased offices is decreasing, likely due to technology

Office cont’d
• Office sales are up modestly, with 23 transactions in 2013, with an average price of ~ $100 to $110 psf. All sales are below replacement cost
• Medical offices are a particularly depressed sub-market and not likely to improve, with many doctors retiring, leaving private practice, or downsizing due to frustration

Warehouse/Industrial
• Not a major factor in Alachua County, but showing small signs of recovery
• Small warehouses (~1,000 sf) remain the most popular with recent rents averaging $6.72 psf gross
• Sales of industrial space are very weak, with only 23 in 2013.
• Average prices are below $40 psf, with larger spaces (20,000 sf +) averaging $23 psf, all far below replacement cost.
Warehouse
Office
Retail
$4.00
$6.00
$8.00
$10.00
$12.00
$14.00
$16.00
0 100 200 300 400 500 600 700 800
Ave
rage
Re
nt
psf
Average Days on Market
2013 Average New Lease Rent vs Days on Market

Banking
• Low commercial loan demand
• After period of regulatory restriction, loan growth in banks is anemic with lenders “stealing” from each other for good customers
• Community banks are shrinking or being absorbed by larger institutions
• Result is less capital for small business expansion
Bright Spots
• High-tech companies spawned by UF and nurtured in the community, i.e. Progress Center, Innovation Square
• Tech companies drawn by the emerging confluence of similar entities, i.e. SumTotal, MindTree
• Much of employee base is imported, but adds demand to the service sector to create local job opportunities

What Can Alachua County Do to Help?
• Marketing
– We have a great story – Climate, Quality of Life, Major University, Cultural Activities, Sports, Low Cost of Living – but not well told
– County can help get our story out, either by itself, or better, in conjunction with GACC, CEO, etc.
• Smart Incentives
– Need to keep our start-ups here as they grow, and offer incentives to valued out-of-town candidates to locate here
– Need to be seen as business friendly, particularly in manufacturing
• Infrastructure
– Need to have high-tech space ready for future prospects. This is very risky for the private developers, and may require government assistance
• Costs
– Need to make our community stack up well against other Florida cities with which we compete
– High real estate taxes, utility costs are headwinds we need to understand
What Can Alachua County Do to Help?

Part 3: Understanding the Fiscal History and Future Scenarios Concerning Alachua County Government
Presented by
Todd Hutchinson, F&A and Kevin Smith, OMB
Fiscal History and Future Scenarios
•Overview of financial picture •Broad discussion of the County’s historical revenues and expenditures •Broad discussion of the County’s financial future •Special attention paid to fund balance •Salary adjustments not part of the projection model

Assumptions for Scenarios
The County’s future financial picture as presented includes a number of assumptions including:
•Taxable Property Values increasing 1% in FY15, 2% in FY16, and 3% each of the following years •Health insurance increase of 7% per year •FRS contributions remain constant •Inflation beginning at 1.75% in FY14 and slowly increasing to 3% by FY17 based on market projections •CIP expenditures remain constant •Expenditures are based on historical levels of actual spending •Revenues are based on a flat millage and offset by fund balance

(20,000,000)
(5,000,000)
10,000,000
25,000,000
40,000,000
55,000,000
70,000,000
85,000,000
100,000,000
115,000,000
130,000,000
145,000,000
2003 2004 2005 2006 2007 2008 2009 2010 2011 2012 2013 2014 2015 2016 2017 2018 2019
ALACHUA COUNTY BOARD OF COUNTY COMMISSIONERS GENERAL FUND ACTUAL REVENUES AND EXPENDITURES
FY2003-2013; Projected FY2014-2019
Property Taxes Other Revenues Expenditures Net Change in Fund Balance
$61.8
$97.2 $92.9 $96.4
$105.3
$24.6 or 28.52%
$24.1 or 19.90%
$24.1 or 20.61%
$24.1 or 20.01%
$24.9 or 19.09%
$86.8
$118.7
$127.5
$118.6
$127.8
$140.4

(30,000,000)
(20,000,000)
(10,000,000)
0
10,000,000
20,000,000
30,000,000
40,000,000
2003 2004 2005 2006 2007 2008 2009 2010 2011 2012 2013 2014 2015 2016 2017 2018 2019
GENERAL FUND Ending Fund Balance
Actual FY03-FY13; Projected FY14-FY19
Ending Fund Balance Recommended Fund Balance

(2,500,000)
-
2,500,000
5,000,000
7,500,000
10,000,000
12,500,000
15,000,000
17,500,000
20,000,000
2003 2004 2005 2006 2007 2008 2009 2010 2011 2012 2013 2014 2015 2016 2017 2018 2019
ALACHUA COUNTY BOARD OF COUNTY COMMISSIONERS MSTU-LAW FUND ACTUAL REVENUES AND EXPENDITURES
FY2003-2013; Projected FY2014-2019
Property Taxes Other Revenues Expenditures Net Change in Fund Balance
$11.9
$17.5
$16.6 $16.5
$17.8
$19.5
$5.5
$8.8 $8.5 $8.2
$10.4
$11.7 $5.6 or 50.54%
$8.2 or 48.22%
$8.5 or 49.90%
$7.2 or 47.00%
$7.1 or 40.76%
$7.5 or 39.11%

(1,000,000)
(500,000)
-
500,000
1,000,000
1,500,000
2,000,000
2,500,000
2003 2004 2005 2006 2007 2008 2009 2010 2011 2012 2013 2014 2015 2016 2017 2018 2019
MSTU-LAW FUND Ending Fund Balance
Actual FY03-FY13; Projected FY14-FY19
Ending Fund Balance Recommended Fund Balance
(4,000,000)
(2,000,000)
-
2,000,000
4,000,000
6,000,000
8,000,000
10,000,000
12,000,000
14,000,000
16,000,000
2007 2008 2009 2010 2011 2012 2013 2014 2015 2016 2017 2018 2019
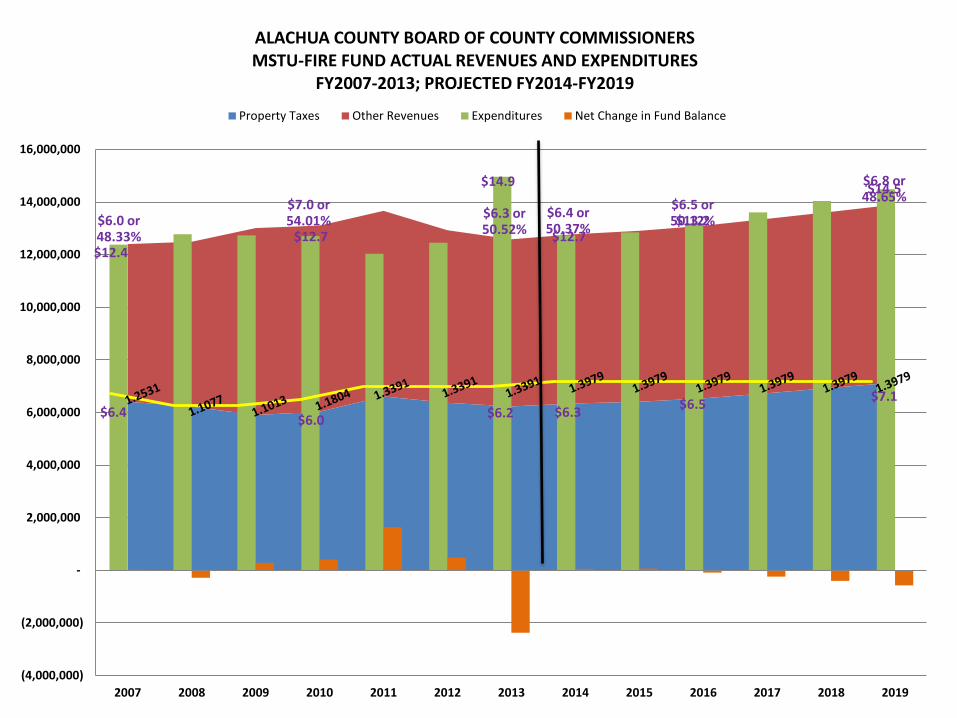
ALACHUA COUNTY BOARD OF COUNTY COMMISSIONERS MSTU-FIRE FUND ACTUAL REVENUES AND EXPENDITURES
FY2007-2013; PROJECTED FY2014-FY2019
Property Taxes Other Revenues Expenditures Net Change in Fund Balance
$12.4 $12.7
$14.9
$12.7 $13.2
$14.5
$6.4 $6.0
$6.2 $6.3 $6.5
$7.1
$6.0 or 48.33%
$7.0 or 54.01%
$6.3 or 50.52%
$6.4 or 50.37%
$6.5 or 50.12%
$6.8 or 48.65%
-
500,000
1,000,000
1,500,000
2,000,000
2,500,000
3,000,000
3,500,000
4,000,000
2007 2008 2009 2010 2011 2012 2013 2014 2015 2016 2017 2018 2019
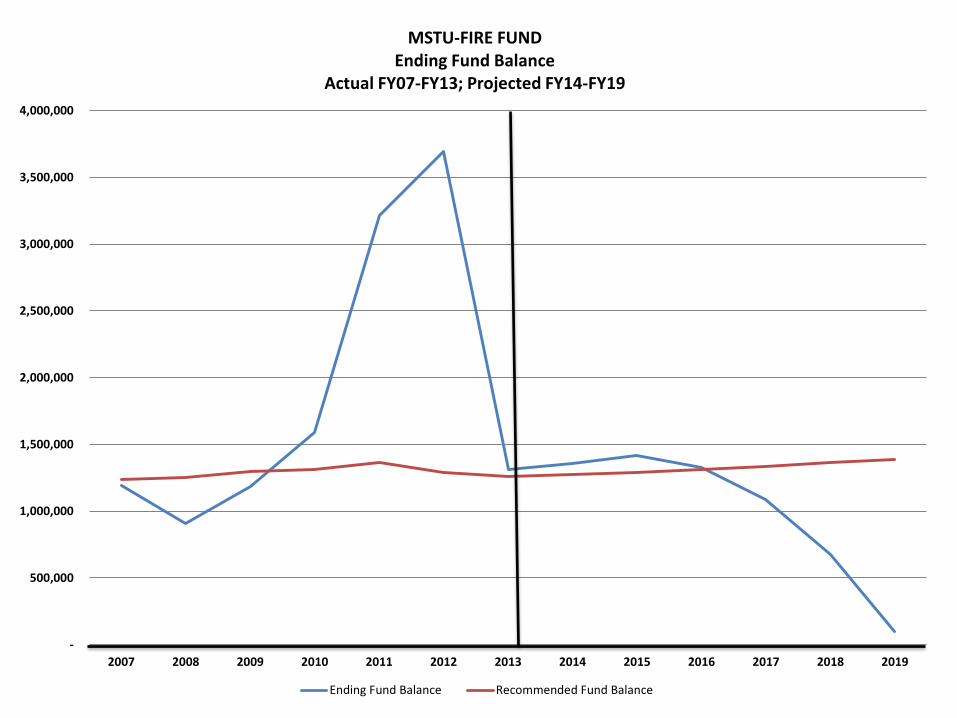
MSTU-FIRE FUND Ending Fund Balance
Actual FY07-FY13; Projected FY14-FY19
Ending Fund Balance Recommended Fund Balance

(1,000,000)
-
1,000,000
2,000,000
3,000,000
4,000,000
5,000,000
6,000,000
7,000,000
2007 2008 2009 2010 2011 2012 2013 2014 2015 2016 2017 2018 2019
ALACHUA COUNTY BOARD OF COUNTY COMMISSIONERS MSTU-UNINCORP ACTUAL REVENUES & EXPENDITURES
FY2007-2013; PROJECTED FY2014-2019
Property Taxes Other Revenues Expenditures Net Change in Fund Balance
$2.3 $2.0
$1.9 $2.2
$2.3
$2.5
$3.4 or 59.66% $3.2 or
60.54% $3.0 or 61.93%
$3.3 or 59.76%
$3.4 or 59.52%
$3.5 or 58.10%
$4.9
$5.6
$5.3 $5.3 $5.6
$6.2
-
200,000
400,000
600,000
800,000
1,000,000
1,200,000
1,400,000
2007 2008 2009 2010 2011 2012 2013 2014 2015 2016 2017 2018 2019
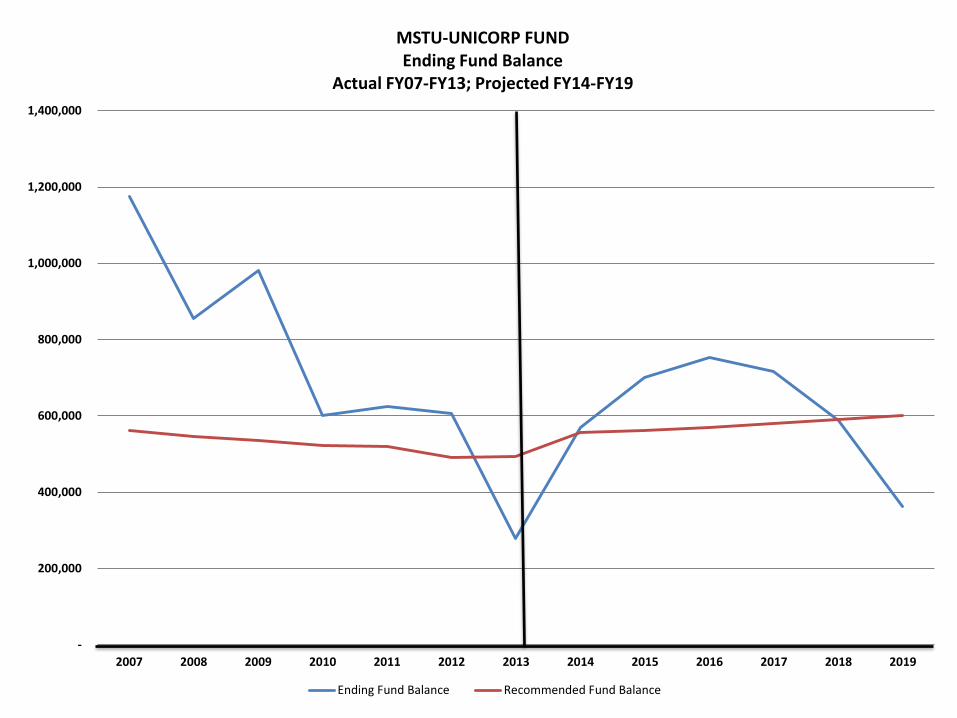
MSTU-UNICORP FUND Ending Fund Balance
Actual FY07-FY13; Projected FY14-FY19
Ending Fund Balance Recommended Fund Balance

Questions?
Understanding the Fiscal History and Future Scenarios Concerning Alachua County Government

Thank you


