ALCPG, Cornell University July 14-16 th. 2003 Scintillator Readout w/ Scintillator Readout w/ Geiger Avalanche Photodiodes Geiger Avalanche Photodiodes - update since Arlington - update since Arlington David Warner, Robert J. Wilson Department of Physics Colorado State University Stefan Vasile aPeak 63 Albert Road, Newton, MA 02466-1303
David Warner, Robert J. Wilson Department of PhysicsColorado State University
Stefan VasileaPeak63 Albert Road, Newton, MA 02466-1303
R.J.Wilson, Colorado State University
MotivationMotivation
Scintillating fiber, or WLS readout of scintillator strips basic component of several existing detectors (MINOS, CMS-HCAL); option for LCD
Standard photodetector – photomultiplier tubes, great devices but…– “Expensive” (including electronics etc.),
– Bulky, magnetic field sensitive…
– Multi-anode PMTs a great step forward.
Geiger-mode Avalanche photodiodes (GPDs)– Large pulse (~volt); high quantum efficiency; relatively fast; small pixels (10-150
microns); Con: high dark count rate.
– Compact; low mass; low voltage operation (~10s volts) – modest physical plant; magnetic field insensitive; compatible with CMOS - cheap?
New funds available to the developer, aPeak (Newton, Mass.)– Small p.o. from SLAC/CSU
– A Phase I DoE SBIR recently approved w/ subcontract to CSU
R.J.Wilson, Colorado State University
Status at Arlington (01/10/03)Status at Arlington (01/10/03)
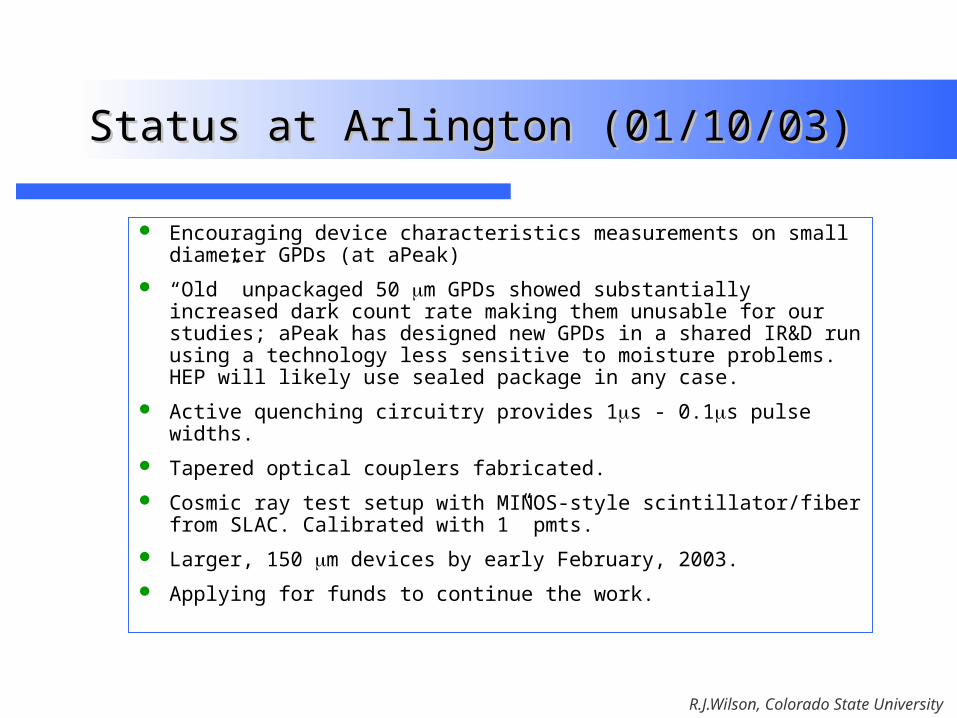
Encouraging device characteristics measurements on small diameter GPDs (at aPeak)
“Old” unpackaged 50 m GPDs showed substantially increased dark count rate making them unusable for our studies; aPeak has designed new GPDs in a shared IR&D run using a technology less sensitive to moisture problems. HEP will likely use sealed package in any case.
Active quenching circuitry provides 1s - 0.1s pulse widths.
Tapered optical couplers fabricated.
Cosmic ray test setup with MINOS-style scintillator/fiber from SLAC. Calibrated with 1” pmts.
Larger, 150 m devices by early February, 2003.
Applying for funds to continue the work.
R.J.Wilson, Colorado State University
Since ArlingtonSince Arlington
New 50 and 150 m GPDs received by aPeak February, 2003; characterized with a pulsed, green LED source by aPeak. Only available for our studies for a short time.
CSU cosmics apparatus taken to aPeak (Warner); data taken by Warner & Vasile over few days.
aPeak received SBIR Phase I award with sub-contract to CSU; includes funds for devices at CSU (finally!)
R.J.Wilson, Colorado State University
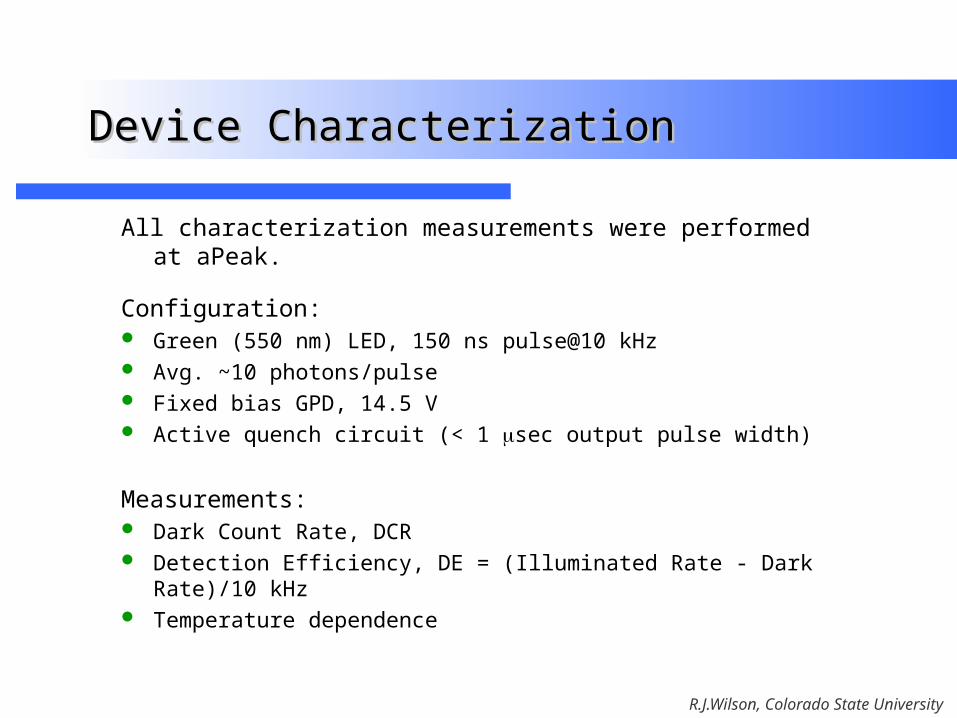
All characterization measurements were performed at aPeak.
Configuration: Green (550 nm) LED, 150 ns pulse@10 kHz Avg. ~10 photons/pulse Fixed bias GPD, 14.5 V Active quench circuit (< 1 sec output pulse width)
Measurements: Dark Count Rate, DCR Detection Efficiency, DE = (Illuminated Rate - Dark Rate)/10 kHz Temperature dependence
Device CharacterizationDevice Characterization
R.J.Wilson, Colorado State University
0
5000
10000
15000
20000
25000
30000
-30 -20 -10 0 10 20
Temperature (C)
DC
R @
14.
5 V
0.0
0.2
0.4
0.6
0.8
1.0
1.2
DE and DCR, 50 micron dia GPD @ 11 photons/pulse Active Quenching
DE
DCR DEPoly. (DE)
0
25000
50000
75000
100000
125000
150000
-30 -20 -10 0 10 20
Temperature (C)
DC
R @
14.
5 V
0.0
0.1
0.2
0.3
0.4
0.5
0.6
0.7
0.8
0.9
1.0
DE and DCR, 150 micron dia GPD @ 10 photons/pulse Active Quenching
DE
@14
.5V
DCR DEPoly. (DE)
50 m 150 m DEDCR DEDCR
DEDCRDEDCR
Temperature Dependence
New devices characteristics (1)New devices characteristics (1)
where N is the number photons incident on the photodetector and
QE*A is an effective single photon detection efficiency.
From Poisson statistics, the probability for nd to fluctuate to 0 is
given by:
So the we define a Detection Efficiency,
For 150 micron GPD at 20oC, DE~0.50 for < N >~10
=> QE*A ~ 0.069
dnd enP );0(
)1()1( ** NAQEn eeDE d
R.J.Wilson, Colorado State University
0.0E+00
5.0E+03
1.0E+04
1.5E+04
2.0E+04
2.5E+04
3.0E+04
0 0.1 0.2 0.3 0.4 0.5 0.6 0.7 0.8
Vr-Vbr (V)
DC
R
T(C) = -38.75
T = -26
T = -18.55
T = 0.15
T = 11.6
T = 20
0.E+00
1.E+04
2.E+04
3.E+04
4.E+04
5.E+04
6.E+04
7.E+04
8.E+04
0 0.05 0.1 0.15 0.2 0.25 0.3 0.35 0.4 0.45 0.5
Vr-Vbr (V)
DC
R
T (C) = -52.2
T = -41.5
T = -35.9
T = -28.95
T = -23.95
T = -20
T = -15.5
T = -10
T = -3
T = 3.05
T = 7.3
Dark Count Rate: Breakdown voltage, temperature
New devices characteristics (2)New devices characteristics (2)
50 m 150 m
Volts above breakdown Volts above breakdown
DC
R
DC
R
• GPDs with passive quenching used for these measurements• Range doesn’t extend to operating region of the cosmic ray test configuration (solid lines shouldn’t be used for extrapolation)
R.J.Wilson, Colorado State University
y = 0.0130x + 13.4429
R2 = 0.9978
12.7
12.8
12.9
13
13.1
13.2
13.3
13.4
13.5
13.6
-60 -50 -40 -30 -20 -10 0 10 20 30
Temperature (C)
Vbr
(V
)
GPD 50 m diameter @ T = 20 C. Passive Quenching.
0.00
0.10
0.20
0.30
0.40
0.50
0.60
0.70
0.80
0.90
1.00
13.65 13.7 13.75 13.8 13.85 13.9 13.95
Vr (volt)
De
tec
tio
n E
ffic
ien
cy
New devices characteristics (3)New devices characteristics (3)
Breakdown voltage; Detection Efficiency
150 m 50 m
slope = 13 mV/C
Temperature, C
Bre
akdo
wn,
V
Bias voltage, VR
1.00
0.50
11 photons/pulse average~room temp.
Det
ecti
on E
ffic
ienc
y
Breakdown voltage vs. Temp. Detection Eff. vs. Bias voltage
13.65 13.70 13.75 13.80 13.85 13.90
• Breakdown voltage relatively insensitive to temperature
• Detection efficiency plateaus well (need to see behavior for higher values of VR)
R.J.Wilson, Colorado State University
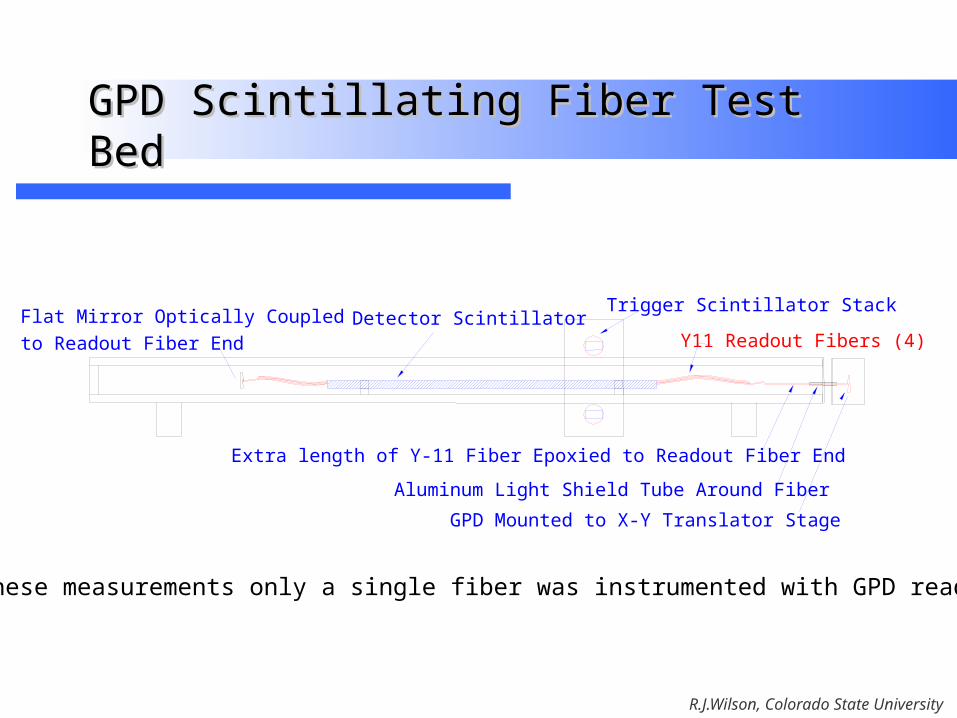
GPD Scintillating Fiber Test BedGPD Scintillating Fiber Test Bed
Extra length of Y-11 Fiber Epoxied to Readout Fiber End
Aluminum Light Shield Tube Around Fiber
GPD Mounted to X-Y Translator Stage
For these measurements only a single fiber was instrumented with GPD readout.
R.J.Wilson, Colorado State University
GPD Scintillating Fiber Test BedGPD Scintillating Fiber Test Bed
Disc.Ch. T
Disc.Ch. B
2-FoldCoinc.
Cosmic Ray Trigger(To Scalar Ch. 1 andGPD Coincidence)
Disc.
Y-11 Readout
Coinc.2-Fold
GPD/PMT Coincidence
GPD Noise RateMonitor
From GPD ActiveQuench Amp.
Scope
Trigger Scintillators
Test Bar
HV
(From PMT)
MINOS-style scintillator bar w/ Y11 WLS readout
– courtesy of SLAC
R.J.Wilson, Colorado State University
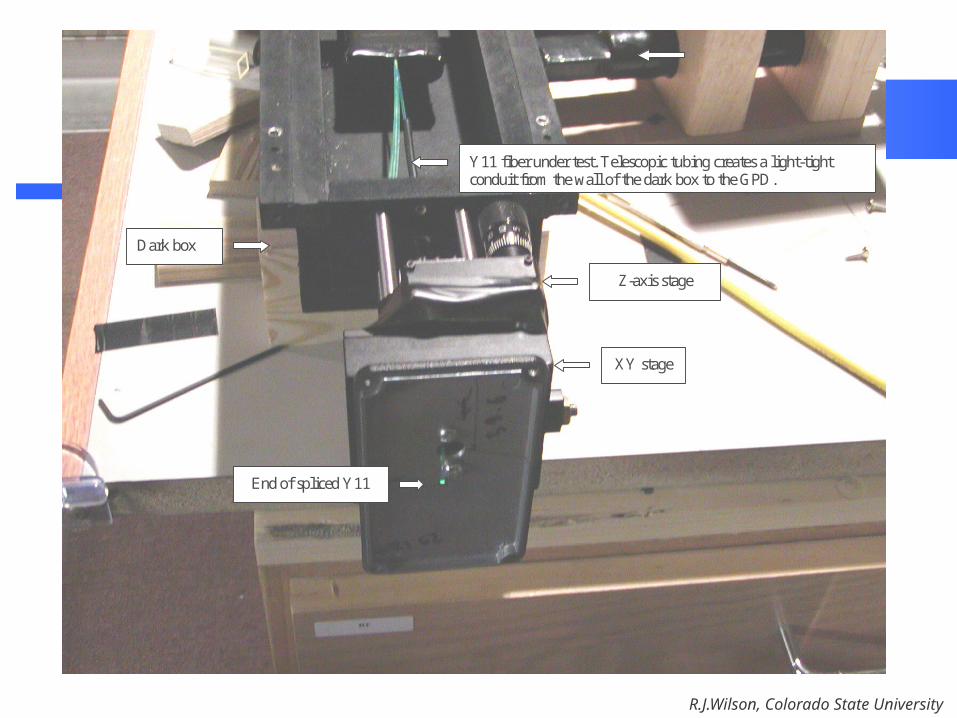
XY stage
Z-axis stage
End of spliced Y11
Y11 fiber under test. Telescopic tubing creates a light-tight conduit from the wall of the dark box to the GPD.
Dark box Please find attached the quote to develop custom layout GPD arrays and interfacing electronic modules. Since our last discussion on active quenching circuitry I have progressed on designing active
Estimate average number of photons/event at the end of spliced Y11 fiber using digital scope traces from the reference pmt (average pulse height and pulse width into 50-ohm load). For 1 mm diameter Y11 cores and 0.15 mm GPDs:
Using QE*A=0.069 estimated for 150 micron GPD at 20oC, predict
DE = (1-exp(-0.069*4) = 0.24
This neglects additional losses, such as Fresnel reflection at the Y11-GPD interface.
R.J.Wilson, Colorado State University
GPD Efficiency ProcedureGPD Efficiency Procedure
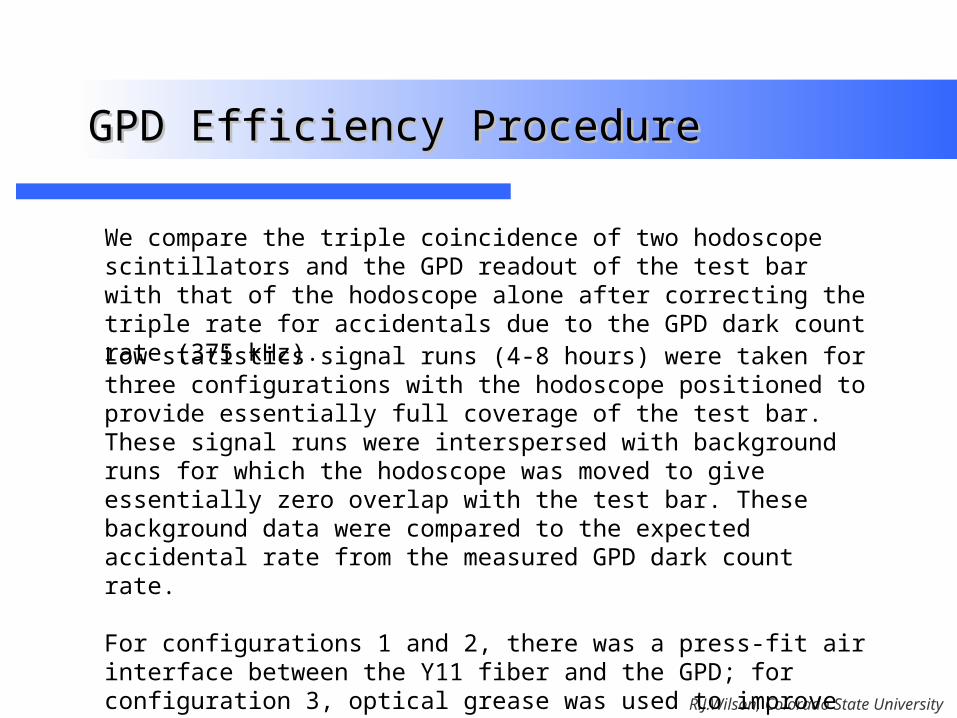
We compare the triple coincidence of two hodoscope scintillators and the GPD readout of the test bar with that of the hodoscope alone after correcting the triple rate for accidentals due to the GPD dark count rate (375 kHz).
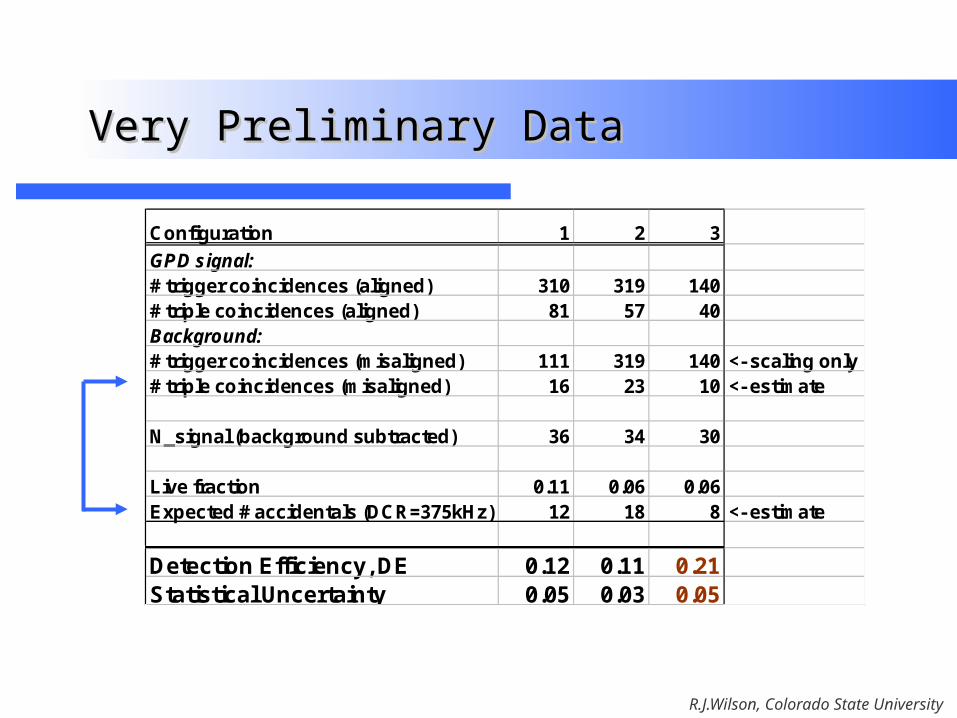
Low statistics signal runs (4-8 hours) were taken for three configurations with the hodoscope positioned to provide essentially full coverage of the test bar. These signal runs were interspersed with background runs for which the hodoscope was moved to give essentially zero overlap with the test bar. These background data were compared to the expected accidental rate from the measured GPD dark count rate.
For configurations 1 and 2, there was a press-fit air interface between the Y11 fiber and the GPD; for configuration 3, optical grease was used to improve the coupling. For configurations 2 and 3, the GPD discriminator output and trigger gate widths were reduced, halving the probability for accidental coincidences.
Detection Efficiency, DE 0.12 0.11 0.21Statistical Uncertainty 0.05 0.03 0.05
R.J.Wilson, Colorado State University
CommentsComments
These preliminary data were taken under less than ideal circumstances, so one should beware of drawing firm quantitative conclusions. With that caveat… It is the first demonstration of WLS fiber readout with the aPeak GPDs
The measured detection efficiency with the Y11 readout of 21±5(stat.)±??(sys.)% is consistent with that predicted using the LED measurements
Doubling the number of incident photons (perhaps with a tapered optical coupling) should roughly double the detection efficiency
Lowering the GPD operating temperature to –30ºC potentially will more than double the detection efficiency as well as reduce the dark count rate
R.J.Wilson, Colorado State University
Future PlansFuture Plans
aPeak SBIR Work plan: Fabricate 2 runs of GPD arrays using two layout design concepts Development of active quenching circuits for hybrid integration Electro-optical evaluation of the GPD array and active quenching circuitry
array performance, including reliability testing Continue to improve the layout design for increased detection efficiency,
lower dark count rate and GPD array re-configuration on-the-fly Evaluation of GPD prototypes for detection efficiency, false counts, and
timing performance on a cosmic ray setup – at CSU
Investigate potential for use in LCD Muon/Calorimeter readout. Review multi-pixel/fiber readout scheme