Page 1
r DA-73 401 OPERATION EVEREST 11: ALVEOLAR AND ARTERIAL BLOOD GASES1/AT EXTRENE RLTITUDE(U) ARMY RESEARCH INST OFENVIRONNENTAL NEDICINE NATICK NA M K NALCONIM ET R.
UNCLRSSIFIED JUL 86 USRRIEN-N44/86 F/6 6/19 ML
EEEEEEEEEEEEEElflflflfl......l
Page 2
L. L4.0'
*14-62
MI R C P R S L TO T S H RN A I N L B R A f T N A D 9 3
#4%
Page 3
V.SC~UNCLASSIFIED TSSECURITY CLASSIFICATION OF THIS PACE (Whiw Does Entered) ,
0, REPORT DOCUMENTATION PAGE REA C F.ORBEFORE cOMIV G FORM .1. REPORT NUMBER 2GOVT ACCESSION NO 3. RECIPIENT'S CATALOG NUMBER2. O .ACESIO*N.~~44/86:-,
4. TITLE (and Subtitle) S. TYPE OF REPORT & PERIOO COVERED
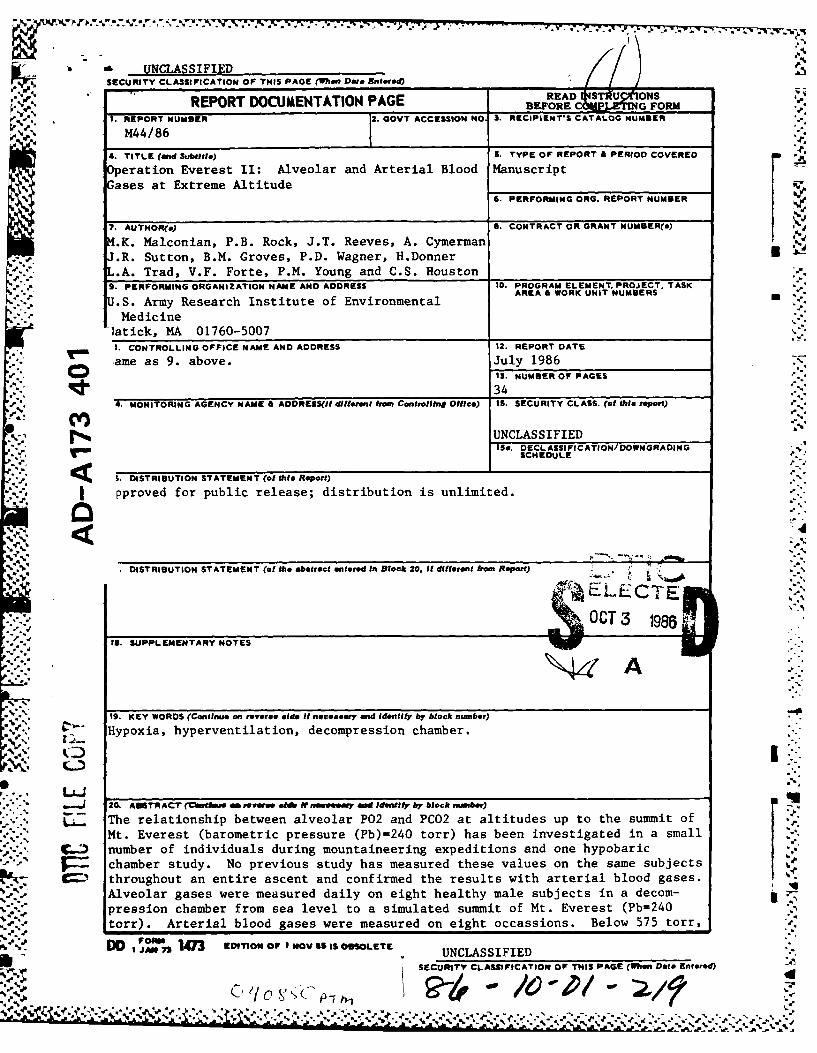
Operation Everest II: Alveolar and Arterial Blood ManuscriptGases at Extreme Altitude
6. PERFORMING ORG. REPORT NUMBER
7. AUTHOR(g) 8. CONTRACT OR GRANT NUMBER(a)
M.K. Malconian, P.B. Rock, J.T. Reeves, A. Cymerman-~ J.R. Sutton, B.M. Groves, P.D. Wagner, H.Donner
L.A. Trad, V.F. Forte, P.M. Young and C.S. Houston S
9. PERFORMING ORGANIZATION NAME AND ADDRESS 10. PROGRAM ELEMENT, PROJECT, TASK
U.S. Army Research Institute of Environmental AREA & WORK UNIT NUMBERS
Medicinelatick, MA 01760-5007 __."
__ . CONTROLLING OFFICE NAME AND ADDRESS 12. REPORT DATE
'ame as 9. above. July 1986IS. NUMBER OF PAGES
q~j. 344. MONITORING AGENCY NAME A ADDRESS(i/ dilferent from Controlling Offce) 1S. SECURITY CLASS. (of this report)
-V) UNCLASSIFIED
I5a, ISoECLASSIFICATION/DOWNGRADINGd" SCHEDULE
.3 , .P . DISTRIBUTION STATEMENT (of thle Report)
, | pproved for public release; distribution is unlimited.
-l. . DISTRIBUTION STATEMENT (of the abstract eitered In Block 20. If dfferent from Report) .. "CTE
IS. SUPPLEMENTARY NOTES U
%' 19. KEY WORDS (Continue on roverse aide it necessary ind Identify by block number)
S0'" " Hypoxia, hyperventilation, decompression chamber.
.. ".-'4 20. ASY ACT (r-mua tm s-ieae stib N neoeemy, ad ideriti by block mmber)
p.... The relationship between alveolar P02 and PCO2 at altitudes up to the summit of
Mt. Everest (barometric pressure (Pb)=240 torr) has been investigated in a small
- number of individuals during mountaineering expeditions and one hypobaric
chamber study. No previous study has measured these values on the same subjects-= throughout an entire ascent and confirmed the results with arterial blood gases.
Alveolar gases were measured daily on eight healthy male subjects in a decom-
pression chamber from sea level to a simulated summit of Mt. Everest (Pb=240
%-- torr). Arterial blood gases were measured on eight occassions. Below 575 torr,DDOe* 1403 EDITION OF 9 NOV GS IS OBSOLETE" "JA 73 UNCLASSIFIED":
SECURITY CLASSIFICATION OF TIS1 PAGE (Wm D.e Entered)
.-- 6 P -1 o r)
-. . . % • - . -.
Page 4
UNCLASSIFIEDSECURITY CLASSIFICATION OF 1THIS PAGEI(Whaft balta SMnt00
a linear relation was observed between P02 and PCO2 in both arterial and
alveolar samples. A linear relation was also observed for P02 and Pb, and PCO2
and Pb for both arterial and alveolar samples. Summit mean alveolar P02-29.8±66
3.4 and PCO2-12.4±1.9. Summit mean arterial P02=29.3±2.4 and PCO2-11.7±1.5.
This study describes for the first time the relation between P02, PCO2, and Pbr
from sea level to extreme hypoxia (PB-240 torr) in a large group of subjects
-~~~ with both arterial and alveolar gases. ',4
a.4
... %
UNCLASSIFIE
SECURITY ~ ~ ~ ~ ~ ~ ~ ~ ~ a CLSIIAINOFTI AEbn aaEtrd
Page 5
. -
OPERATION EVEREST II: ALVEOLAR AND ARTERIAL BLOOD"S. ~%
GASES AT EXTREME ALTITUDE
Mark K. Malconian, D.O., Paul B. Rock, D.O., Ph.D.John T. Reeves, M.D., Allen Cymerman, Ph.D., John R. Sutton, M.D.,Bertron M. Groves, M.D., Peter D. Wagner, M.D., Howard Donner, M.D.,Laurie Trad, B.S., Vincent Forte, M.A.T., Patricia M. Young, Ph.D.,
Charles S. Houston, M.D.
Altitude Research Division, United States Army Research Institute .
Of Environmental Medicine, Natick, MA. 01760 and the '4Arctic Institute of North America, Wash., D.C.,20007.
1 1p
- . . . . .
Address correspondence to: 1
Mark K. Malconian, D.O.Altitude Research DivisionU.S. Army Research Institute of Environmental MedicineNatick, MA 01760 ..
,-..-.km. -4,
1"--"'
Page 6
Abstract -
'he relationship between alveolar P02 and PCO2 at altitudes up
to the summit of Mt. Everest (barometric pressure (Pb)-240 torr)
has been investigated in a small number of individuals during
mountaineering expeditions and one hypobaric chamber study. No
previous study has measured these values on the same subjects
throughout an entire ascent and confirmed their results with
arterial blood gases. Alveolar gases were measured daily on eight I.'
healthy male subjects In a decompression chamber from sea level
to a simulated summit of Mt. Everest (Pb-240torr). Arterial
blood gases were measured on eight occasions. Below 575
torr, a linear relation was observed between P02 and PC02 in
both arterial and alveolar samples. A linear relation was
also observed for P02 and Pb, and PCO2 and Pb for both
arteriaLan4 alveolar sa Summit mean alveolar
P02-29.8-.4 and PC02-12. Summit mean arterial
P02-29 M and PC02-.7Vl.5. This study describes for the
first time the relation between P02,PCO2,and Pb from sea
level to extreme hypoxia (Pb.240 torr) in a large group of
subjects with both arterial and alveolar gases. C)2 Wo PAN
N. i
Index Terms- Hypoxa, Hyperventilation# Decompression Chamber
Oxygen, High Altitude \
2
- ~ !e:
Page 7
le 1
OPERATION EVEREST II: ALVEOLAR AND ARTERIAL BLOOD GASES AT
EXTREME ALTITUDE
Increased pulmonary ventilation is a crucial adaptation to
chronic hypoxemia no matter whether the hypoxemia results from
disease or from residence at high altitude. The limits of this
adaptive process are not clearly known. For example, persons with
emphysema and chronic bronchitis may suffer from severe
hypoxemia, but the ability to increase ventilation may be limited
- by mechanical factors, or in the case of chronic bronchitis,
by impaired chemosensitivity. Healthy persons who ascend to
the highest possible terrestrial elevation provide a unique . e
approach to the pzoblem, but measurements in such persons are
few, and those that have been made are not In close
agreement. In a previous chamber study of simulated altitude, '-.% .
2 of 4 subjects tolerated decompression over 4 weeks to a
? barometric pressure (Pb) of 235 torr (14). In that study -"
.-; alveolar carbon dioxide tension, an index of ventilatory
adaptation fell to 13 torr. In 1957 Pugh measured alveolar
gases during a mountain expedition at Pb 347, 337, and 308
torr. He found an alveolar P02 of 34 and PC02 of 17 torr at
Pb 308 torr. During the Silver Hut Expedition In 1962 Gill
Measured at Pb 288 torr an alveolar P02 32.8 and PC02 14.3
torr. The next report of alveolar gases at extreme altitude
"' was from the 1981 American Medical Research Expedition to Mt.
Everest (ANREE), where alveolar P02 of 37.6 and PC02 of 7.5
torr were measured in one subject who had climbed to the
summit (8848 m, 253 torr)(19). Calculated arterial pH (7.75
,..f, f ..*f . ~ .. . . .. 3 . .. . -. . . . . . . . . . . . . . .ftL.. . -.. - - .-. '__..-._.- -f-.t,-.-: .. _ . *- f'. ..'_ :- -.. =.---...-: .- -' - ft:'.-.-..-.. - ft _-.. . " '* -'::
Page 8
L~. .+
units) from this alveolar sample Indicated severe alkalosis.
Needed were repeated measurements of the respiratory gases in
blood and alveolar air from the same individuals ascending A
from sea level to the near limit of human tolerance to
hypoxia.
An approach to these problems was made possible by
Operation Everest II, where eight healthy young men volunteered
to be confined for 6 weeks of decompression in a hypobaric
chamber to the simulated summit of Mt. Everest. The utilization
of a chamber provided a safe, controlled environment where--
careful and repeated measurements could be made. Apart from
hypoxia, the chamber experiment was intended to eliminate the
rigorous conditions on the mountain, while providing an
opportunity for comparison of ventilatory adaptation withpreviously published data. It was expected that the results would
provide unique and important information on respiratory 4
adaptation to severe chronic hypoxia.
METHODS
The studies were conducted on 8 healthy males at sea level
during a 40 day gradual decompression in a hypobaric chamber to.4-
the equivalent summit of Mt. Everest (PI02=43 torr) and then upon
* return to sea level. One subject was removed from the study at
." Pb 380 and another at Pb 280 torr because of transient hypoxic
cerebral episodes. Alveolar and end tidal gases were sampled
twice nearly every day throughout the ascent and for 72 hours
after return to sea level. Arterial blood gases were sampled on .,%,.
eight occasions. Arterial blood gases at Pb 760,482,428, and
4; 4 v-4-4
- +--u , + + • % °l e •° ". " ". l k i i- + w~l.+ + + " ° I~e '°-
-" ++ -" " - ."" e ." +" " °. '++ " + m - ' - ' - '
" -- - • -* '°
Page 9
349 torr were sampled within several hours from the alveolar
samples reported on that day. Arterial blood gases at Pb
308,282,252, and 240 torr were sampled immediately before the
alveolar samples reported on that day.
Immediately after rising each morning alveolar and end tidal
gas sampling on each subject was performed. The subjects sat in a
comfortable position on a chair and breathed through an 8 by 3
centimeter cylindrical disposable mouthpiece with a mass
spectrometer sampling capillary tube inserted into the mouth
piece 4 centimeters from the subjects mouth. Noseclips were worn
by the subjects to insure all expired gases were measured in the -*-4,.
mouthpiece. The mass spectrometer was calibrated with
standardized gases before each set of samples. -
After several minutes of quiet breathing, sampling of
expired gases (dry) was begun by a Perkin Elmer 1100 B mass
spectrometer (Perkin Elmer, Burlington HA) and recorded on a DEC
HINC II (Digital Electronics Corporation , Haynard HA) computer ,.
every 0.1 seconds for 30 seconds. After several tidal breaths
during the sampling period, when ventilation appeared stable the
subject was instructed to expire at end inspiration as completely
and rapidly as possible following the method of Haldane and
Priestly (11). W..
The recorded values of C02 and 02 percent were then plotted -. "-
by the computer against time. The resultant curve was examined
to insure that tidal breathing was stable and expiration had been C.
as complete as possible (reflected by a plateau of C02 and 02
values). The end tidal values were defined as the lowest value
5
Page 10
'% . "*
7,P-
of 02 and highest values of C02 averaged from at least two tidal
breaths. The alveolar values were defined as the lowest value of
02 and the highest value of C02 during the forced expiration.
The mass spectrometer measured the gases as a percent of a dry
gas. The percent values obtained were then multiplied by <
barometric pressure - water vapor pressure (47 torr)> to achieve a.
the partial pressure of C02 and 02.
Arterial blood gases were collected on eight occasions, via
an Indwelling brachial or radial arterial catheter. After
withdrawing 5 cc of blood to clear the catheter, arterial
samples were collected in heparinized glass syringes and analyzed
in duplicate immediately using a Radiometer ABL 3 (Woburn, MA)
automated blood gas analyzer. Before each set of arterial
samples, the ABL 3 was calibrated within expected ranges for "'
arterial PCO2 and P02 with both dry gases and tonomotored blood.
Inspired oxygen pressure In the trachea, when saturated with
water vapor at body temperature Is 43 mm of mercury-calculated on
the basis of 253 torr barometric pressure on the summit of mt. ..
Everest (19). This assumes an oxygen concentration of 20.93%.
In the present study at the extreme altitude Inspired oxygen
increased to 22.00% due to the oxygen exhaled by 6 scientists
who were breathing oxygen-enriched air. This necessitated
decompressing the chamber to the barometric pressure of 240 torr in
order to ensure a P102 of 43 mm of mercury.
The 6 subjects who tolerated the lowest barometric pressure
were initially decompressed to the summit on day 34 and
then returned to the summit individually and In groups on
days 35-40. Values reported from days 35-40 represent a
• %. ".%6
. . . . . . . . . ° ° . -
Page 11
compilation of results from individual ascents to the
summit for testing. .
RESULTS po teal
With decompression of the chamber over 40 days from sea level
to a barometric pressure of 240 tort, the alveolar,end tidal and -- '
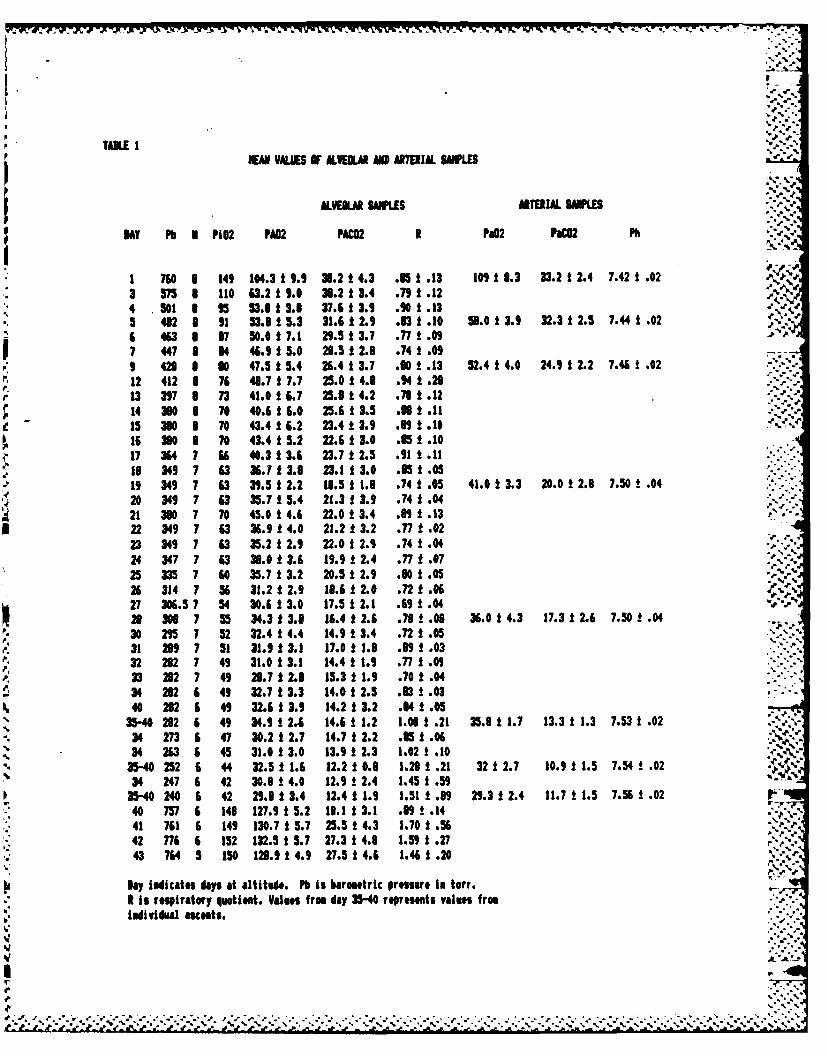
arterial oxygen and carbon dioxide tensions decreased (Tables 1 and 3)
Table 1 shows the mean values of expired and arterial gases on
each day samples were taken. Altitude is reported in barometric
pressure. Values represent the means of eight subjects until 21
Oct., seven subjects until 7 Nov., and six subjects from 8 Nov.
on. Six subjects were taken to the summit on 8 Nov. From Nov. 9-• .%
14, subjects were taken to the summit Individually and in small
groups for various studies. Values reported during these dates
represent the results for the six subjects during their
individual testing. Summit mean alveolar P02 - 29.8 + 3.4 and
PC02 = 12.41 + 1.9 torr. Summit mean arterial P02 - 29.33 +
2.37 and PC02 a 11.68 + 1.5 torr. Table 3 shows the individual ..-.
results of arterial blood gases from sea level to the summit.
Arterial pH reached a maximum of 7.56 +.02 units.
The mean PaC02 of 33.17 at sea level probably reflects
hyperventilation due to anxiety as this sample was taken during
the first invasive procedure on each subject.
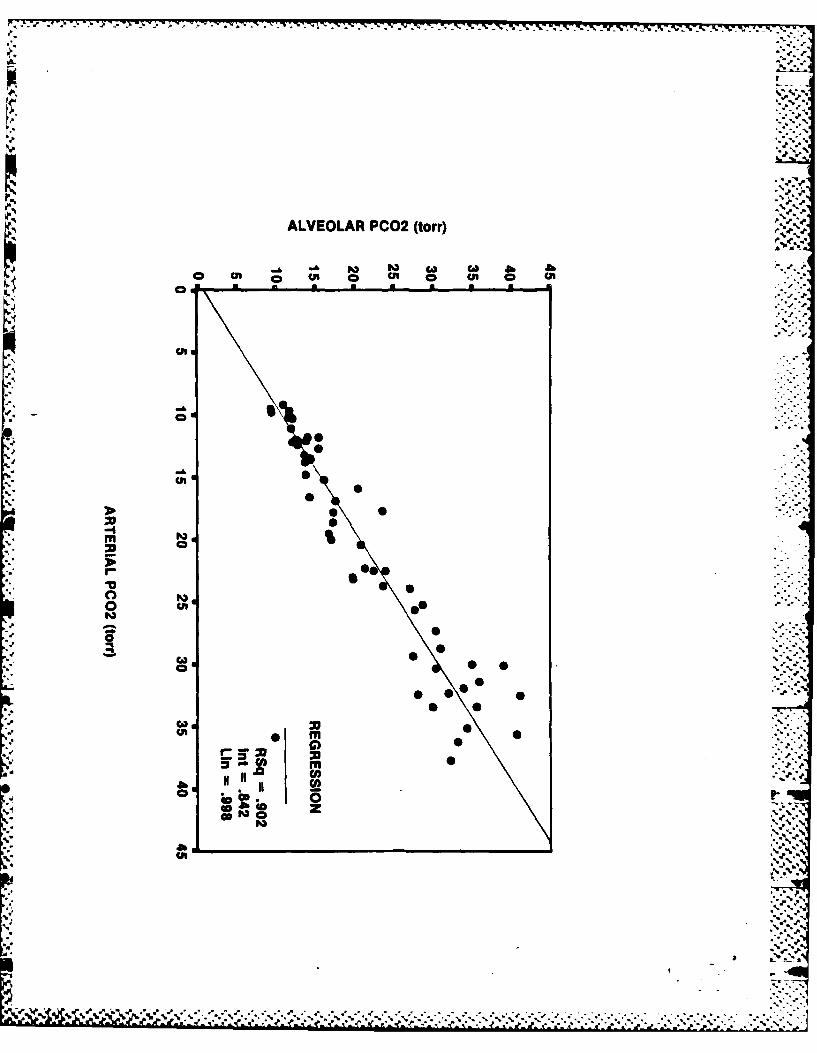
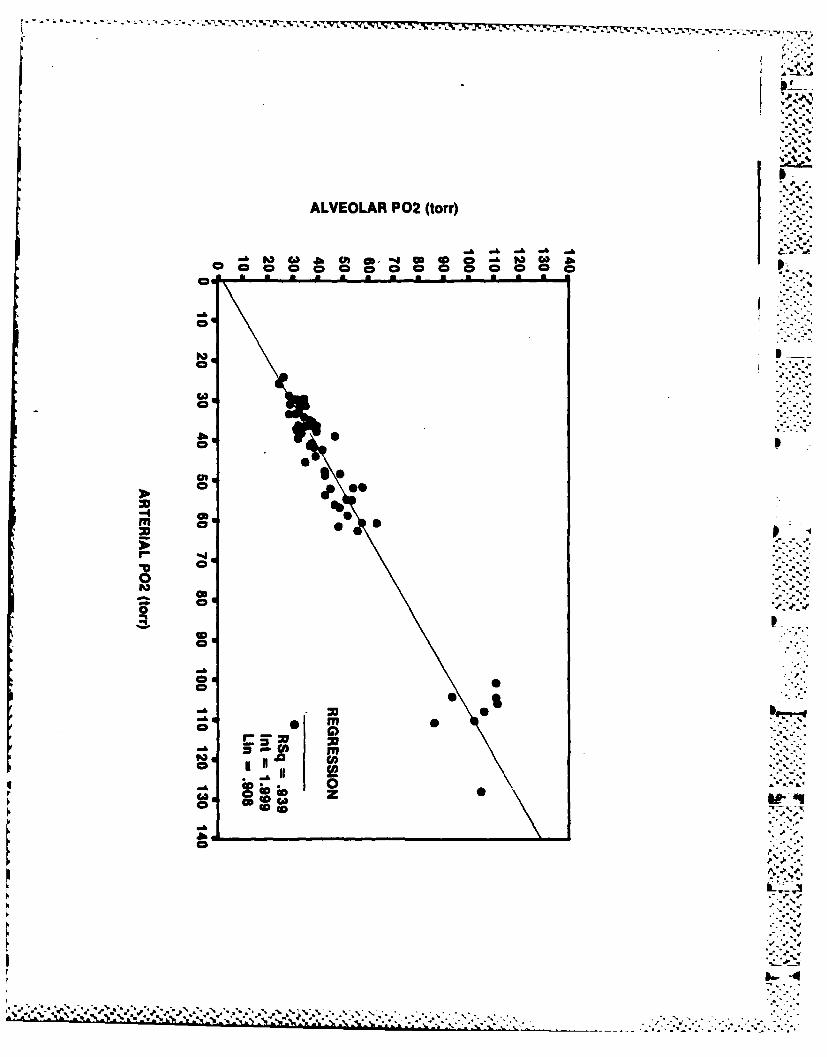
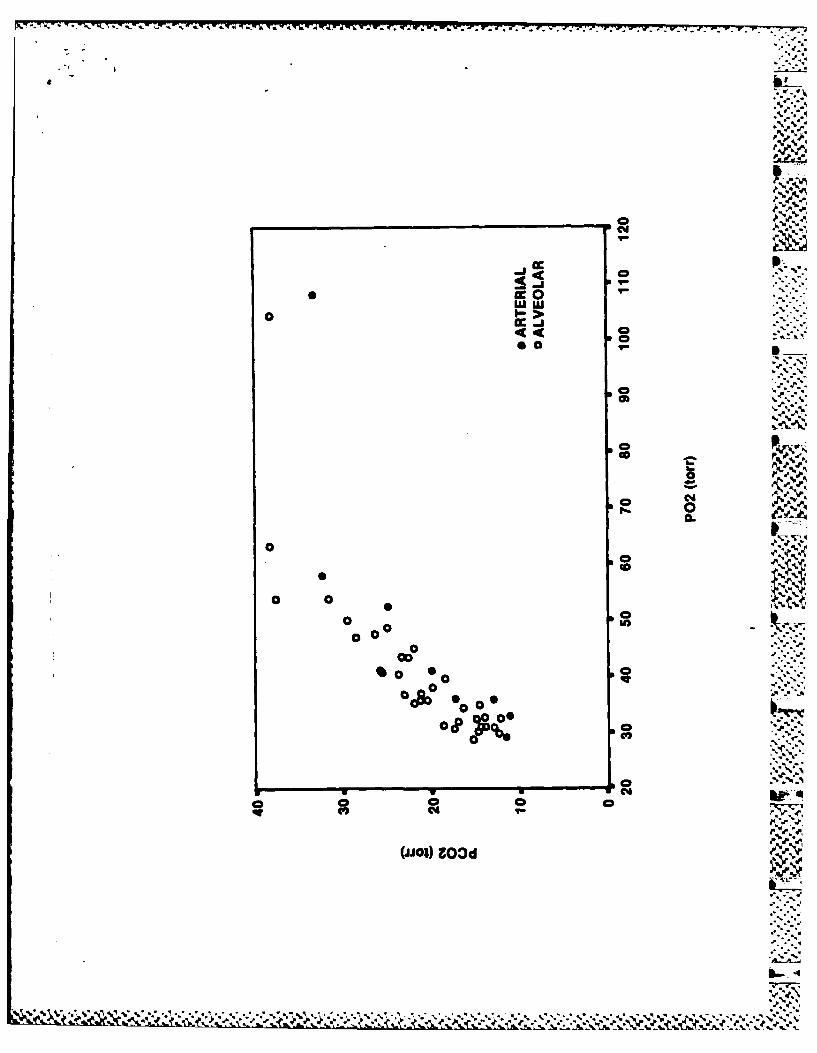
Figures 1A and 1B show close correlation between individual
arterial and alveolar samples. On close examination of the data
it becomes apparent that the alveolar P02 values are several torr
lower than the arterial P02. Figures 2A and 2B show close
correlation between mean values of alveolar and end tidal samples .
" .7
Page 12
as would be expected.
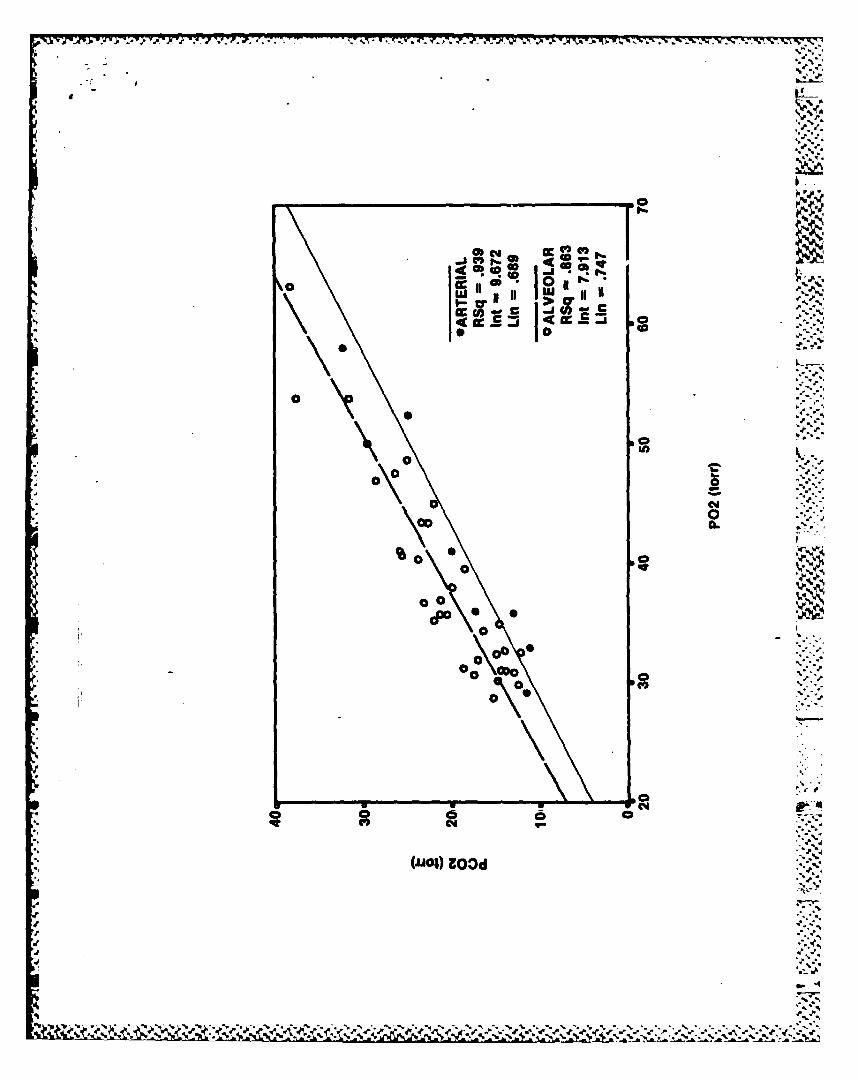
Figure 3A shows the relationship between PC02 and P02 forboth alveolar and arterial samples from sea level to a barometric -
pressure of 240 torr. The subjects were decompressed from sea
level to a barometric pressure of 575 torr during the first twenty
four hours of decompression. Although the mean alveolar P02
dropped from 104.3 torr (+9.9) to 63.2 torr (+9.0), the PC02
did not change (38.1 + 4.3 and 38.3 +3.4 ). Below a barometric
pressure of 575 torr, decreases in barometric pressure were less
drastic to allow for acclimatization and to simulate an actual
mountain ascent. Figure 3B shows the PC02 P02 relation below .
Pb=575 torr, which was linear.
The relationship between P02 and barometric pressure and PC02 and
barometric pressure for both arterial and alveolar samples below
a barometric pressure of 575 torr is shown in Figure 4. Linear
relationships are observed between P02 and Pb, and PC02 and Pb
for both arterial and alveolar samples.
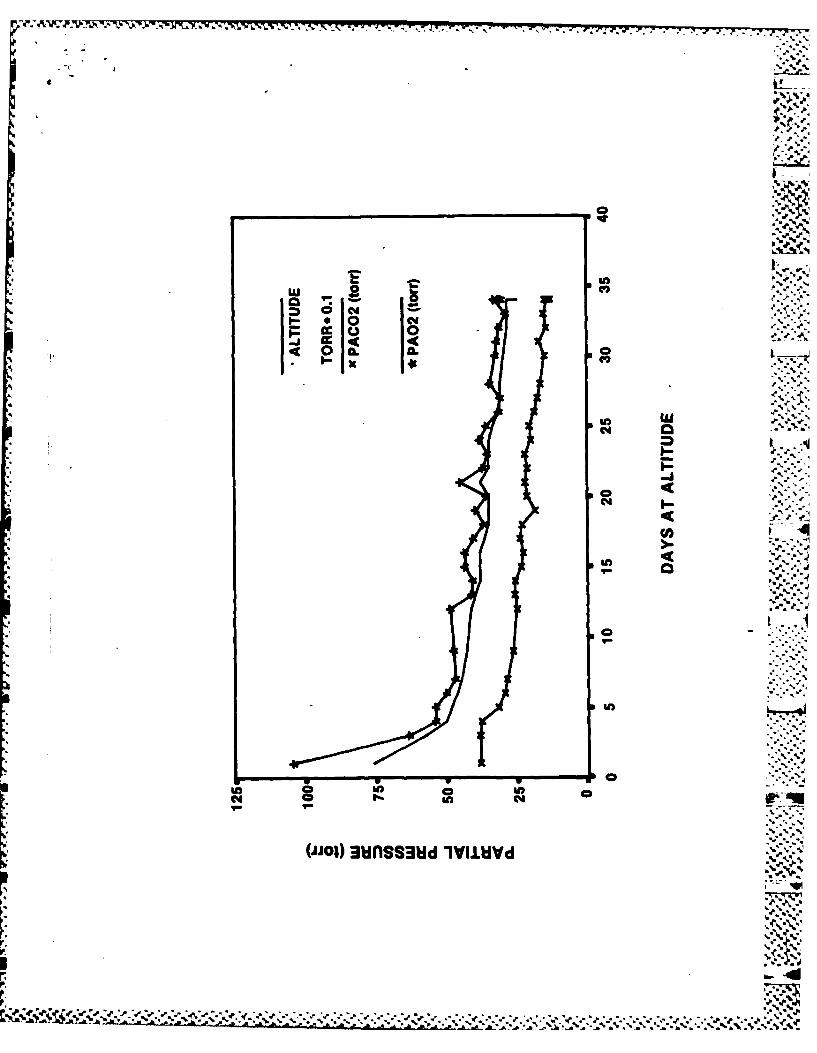
From Table 1 and Figure 5 it Is evident that alveolar samples
taken at the same barometric pressure at different times can be "•" '
compared. There were no statistically significant changes in
alveolar P02 and PCO2 over time at the same barometric pressure.
Table 2A and Figure 6 include the results of alveolar gas samples
upon returning to sea level for the six subjects who successfully
made the summit. At 72 hours, the subjects were still
hyperventilating. The subject who was removed at 25,000 feet had ., "t
sea level alveolar gases and arterial gases up to 10 days after
v return to sea level. Results shown in Table 2A and Figure 6
- showed significant hyperventilation in this subject for 9 days
8 1. . . . . . . ... . % .*
Page 13
after return sea level.
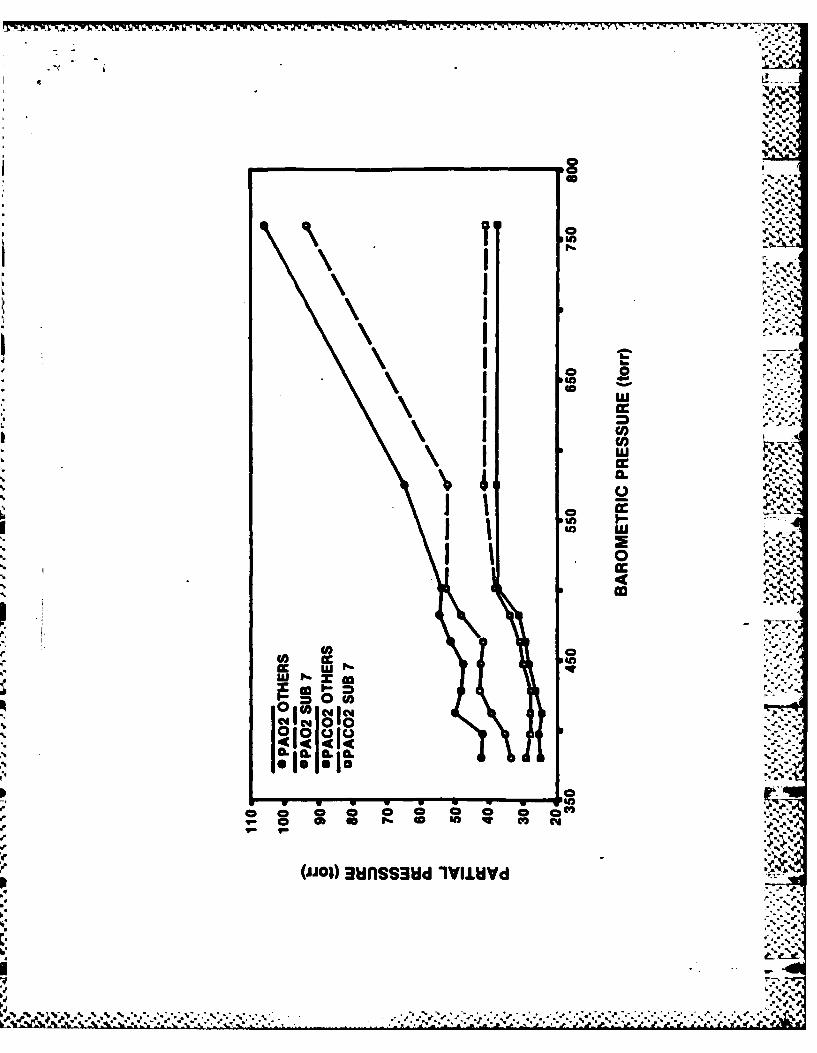
Figure 7 compares the mean alveolar gases of the seven
subjects who were decompressed to 282 torr with the subject who
had to be removed at 380 torr. Despite being a competitive endurance
athlete he did not show as great a ventilatory response to
hypobaric hypoxia as the other subjects.
DISCUSSION
This study describes the resting ventilatory response to
progressive hypobaric hypoxia at rest at Increasing altitudes.
It demonstrates a linear relationship between P02 and
PCO2, between PC02 and barometric pressure and P02 and barometric
pressure below 575 torr. Although ventilation Increases as the
partial pressure of ambient oxygen decreases, it Is not
sufficient to prevent P02 from decreasing, eventually to a level
where life cannot be sustained.
Hypobaric chamber measurements allow for maximum data
aruracy and reliability unlike measurements made on the
mountain. Frequent calibration and standardization of measuring
-? instruments were performed. Before measuring each set of
-" alveolar samples the mass spectrometer was calibrated with gases
of known concentration. Below Pb 288 torr, before each set of
alveolar samples, bag samples of three different subject's
a', alveolar air were measured on the mass spectrometer, a second
p.. mass spectrometer and on the ABL blood gas machine and showed
.. nearly identical results. Before each set of arterial blood
a.. samples the ABL 3 blood gas machine was calibrated with
tonometered blood that came from gas measured on the Schollander
d. 9
Page 14
.* .o,
apparatus. Arterial blood gas analysis was done promptly.
Alveolar gases appear reliable in that they closely agree with -. 'j
the arterial blood gases, (especially at the lower barometric
pressures when the arterial samples were taken in juxtaposition
* with the alveolar samples) although for 5 out of 8 measurements
* the alveolar P02 is several torr lower than the arterial P02.
During steady state conditions the opposite would be expected.
Although the arterial samples were taken under steady state
" conditions, the forced expiratory maneuver performed to collect
alveolar samples preclude a steady state. During the forced
expiratory maneuver, it is likely that 02 was constantly removed
from the alveolus. Also alveolar air composition is not uniform
throughout the lung and the gas collected from the forced
*" expiratory maneuver is effected by regional variations in
*2 alveolar air composition. Thus the A-a gradient calculated from
the alveolar gas equation is not likely to be obtained from near
simultaneous arterial and alveolar samples. This has been shown
previously (14). From Figure 8 it is apparent that at the
moderate altitudes the data closely agrees with previous studies.
All measurements were made on at least six individuals even at
-: the extreme altitudes.
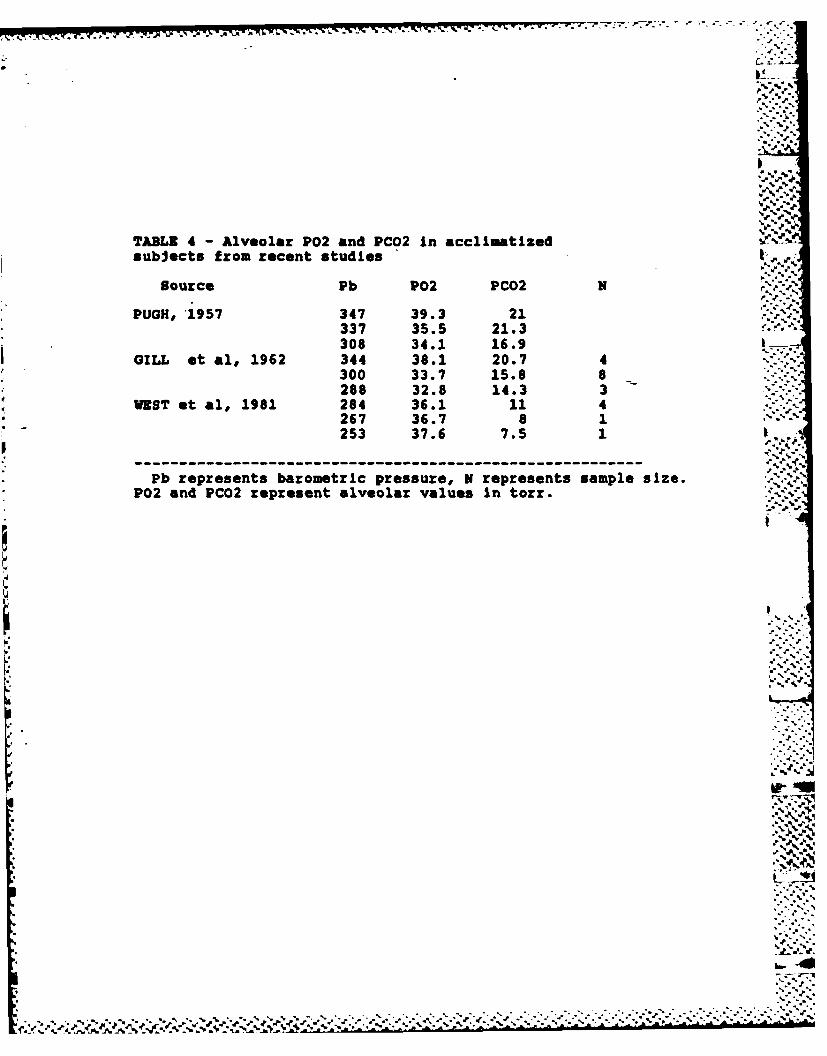
Figure 8 compares the results of the data presented in this
- paper with previous studies of alveolar gases at altitude. In
general the data presented in this paper agrees with that of
previous studies. It is apparent that in the first few days of
* this study the subjects were not acclimatized accounting for the
lack of increased ventilation to hypoxia, described by Fitzgerald
1 10. .-
Page 15
r%
who studied permanent residents at moderate altitude (8). The
present study was limited by the constraints of having subjects
confined In a decompression chamber and thus the initial ascentI%
was made rapidly, followed by a much more gradual ascent profile
allowing for acclimatization. One of the difficulties with most
previous studies is they provide data on only a few points on the
figure shown. Rahn and Otis (17) attempted to group 12 studies
(16 data points) together to describe the P02 PCO2 relation from
sea level to 310 torr. The limitation with describing the P02
PCO2 relationship with compiling different studies is that they
are non homogeneous groups , with different durations at
altitude. At the more extreme hypoxic ranges data is from only
one or two individuals, and thus it is difficult to know
how representative they may be. Pugh in 1957 provided data at
Pb 347,337,and 308 torr and Gill in 1962 provided data at Pb 344,300
and 288 torr and in general agree with the findings of the
present study (9,16) (Tables 1,4). The data from West in 1981
on one subject on the summit of Mt. Everest differed %
significant (Tables 1,4). He reported a PA02 of 37.6 and
PCO2 of 7.5 mm mercury (mean of four samples) The subject
reported great difficulty in delivering the alveolar samples,
which may explain the range for PAC02 of 5.1-9.0 for the four
samples. The arterial pH data reveal the subjects to be
less alkalemic than previously theoretically calculated (19).
The pH values show a modest rise and suggest that over time
despite the fall in PCO2 there was a considerable compensatory
metabolic acidosis with bicarbonate excretion and appeared to .
stabilize at a pH of approximately 7.55. This is considerably *5
--47%11
Page 16
-a t~~l - d . ' q. .' -. .... - - - . --. '.w- ..-. . . . . . . . . . . . . . . . . .
less alkalemic than the value of 7.75 reported by West et al. of
an estimated value of pH for the summit of Mt. Everest (19). The '.,
discrepancy may be related to inadequate acclimatization in our
subjects. However, it is not likely that the lack of metabolic
compensation reported by West et al is consistent with
acclimatization. Another possibility is that the assumptions used
in their calculated pH would not be correct for these
experimentAl conditions.K'. - 4"
This study showed continued hyperventilation at 72 hours
after return to sea level in the six successful "summitees". OfK'-.
particular note, is the persistent hyperventilation 9 days later
In the one subject removed at barometric pressure of 280 Torr.
Hyperventilation upon return to sea level for this period of time
implies an altered ventilatory drive that persists. Arterial
blood gas analysis on return to sea level showed continued
primary respiratory alkalosis as opposed to compensatory
respiratory alkalosis from the metabolic acidemia developed at
altitude.
It Is interesting to note the different ventilatory response
from the subject who collapsed early in the study. This subject
demonstrated a lesser ventilatory response to hypoxia than the
other subjects up to the day he collapsed (Figure 7).
What Is the significance of the data presented? The alveolar
P02 PC02 relation from sea level to extreme hypoxia was
determined and in general confirmed previous data but with a Vhomogeneous group from normoxia to severe hypoxia. The alveolar
gases were confirmed with arterial gases, verifying this
.112 -
Page 17
1.
technique at extreme hypoxia. The linear relationships described for
P02 PC02, and P02, PC02 and barometric pressure argue against an
.'-, increased ventilatory response at severe hypoxia to maintain a
a' minimum P02 as has been postulated (19). Inspite of marked
increase In alveolar ventilation and a very low PC02 this is
insufficient to prevent a further decrease in P02 at increasing
altitude. Nevertheless despite the extreme hypoxia at extreme
_ altitude reported in this study six subjects were able to
exercise vigorously at the summit. The arterial pH data indicate
- that man at extreme altitude is less alkalemic than previously
calculated. This study also demonstrated hyperventilation after
a. return to sea level that persists for a prolonged period.
In conclusion, this study demonstrated a linear relation
. between PCO2 and P02 and a linear relation between P02, PC02 and
- barometric pressure (for both alveolar and arterial samples) for
grauual decompression to extreme altitude in an hypobaric chamber.
Thus, it would seem that there must be a critical altitude where
the ventilatory response to hypoxia would be inadequate in provi-
ding a P02 necessary to sustain life. This altitude must be
higher than a barometric pressure of 240 torr. The fact that our
subjects were able to reach 240 torr on several occasions and
exercise vigorously for sustained periods supports this
conclusion.
1..
*13.-".
Page 18
W. VF '7. V_
ACKNOWLEDGEMENTS
Laurie Trad and Vincent Forte provided invaluable technical
assistance. This paper is one of a series titled "Operation
Everest II" describing a project sponsored by the Arctic
Institute of North America and the U.S. Army Research Institute
of Environmental Medicine, and funded by the U.S. Army Medical
Research and Development Command (Contract No. DAMD 17-85-C-
5026). Principal Investigators were Charles S. Houston, John
R. Sutton and Allen Cymerman.
Participating scientists were James Alexander, Maureen Andrew,
James Anholm, Louis Bandaret, Dick Burse, Jonathan Carter, Howard
Green, Geoff Coates, Howard Donner, Ulrich Duncan, Charles Fulco,
.4 Scott Garner, Bertron Groves, Harriet Gustaffson, Herb Hultgren,
Peter Hackett, Duncan MacDougall, Mark Malconian, Hugh
O'Brodovich, Richard Meehan, Peter Powles, Jack Reeves, Rob
Roach, Paul Rock, Madeline Rose, Robert Schoene, Jose Suarez,
Brenda Townes, Darlene Tyler, Peter Wagner, and Patricia Young.
To Jim Devine, Joe Gardella, Ed Powers among others we express
our gratitude, but especially to the subjects who prefer to remain
anonymous; their patience and sufferance made the project
possible. -4
The views, opinions, and/or findings contained in this
report are those of the authors and should not be
construed as an official Department of the Army position,
* policy, and or decision, unless so designated by other
official documentation.
144P.
Page 19
* V
BIBLIOGRAPHY
1. Barcroft. J., C.A. Binger, A.V. Bock, J.H. Doggart, H.S.
Forbes, G.A. Harrop., J.C. Meakins, and A.C. Redfield.
Observations upon the effect of high altitude on the
physiological processes of the human body Trans.
Roy. Soc. London, B. 211: 351, 1923.
2. Boothby, W.M. Handbook of Respire. Data in Aviation. Essay.
1944. Wash., D.C.
3. Chiodi, H. Respiratory adaptations to chronic high altitude
Hypoxia. J. Appl. Physiol. 10: 81-87, 1957.
4. Dill D.B., H.T. Edwards, A. Foiling, S.A. Oberg, A.M.
Pappenheimer, Jr. and J.H. Talbott. J. Physiol. 96: 34 P,4
1939. ..-
5. Dill D.B., E.H. Christenson and H.T. Edwards. Gas equilibria
in the lungs at high altitude. Am. J. Physiol.
115: 530, 1936.
6. Douglas, C.G., J.S. Haldane, Y. Henderson and E. Schneider. .. *-.
Physiological observations made on Pikes Peak .Trans Royal
Society London, B. 203: 185,1913.
7. Fenn,W.O., Rahn and A.B.Otis. A theoretical study of the
composition of alveolar air at altitude. Am. J. Physiology
146: 637, 1946. "
, 8. Fitzgerald,M.P. The changes in the breathing and the blood at
various altitudes. Trans. Roy. Soc. London, B. 203: 351,1913.
9. Gill, M.B., 3.S. Mllledge, L.G.C.E. Pugh, and J.B. West. ,-
Alveolar gas composition at 21000 to 25700 FT. J. Physiol.
15 . .... . .<
Page 20
163: 373-3771, 1962. -•-
10. Greene, R. Observations on the composition of alveolar air ;..
on Everest. J. Physiol• 150 : 142, 1947... .
11. Haldane G.S•, and J•G. Priestly. The regulation of lung --
ventilation. J. Physiology. London 32: 225-266,1905
12. Hall, F.G. and J.W. Wilson. A.S.T.C. ENG. DIV. HEM. REP. EN" -.
/...
G 49-696-42-F. September 1944..
13. Helmholz, H.F., Jr. and W.M. Boothby. CAM Report no 129. .. ..
14. Houston, C.S., and R.L• Riley. Respiratory and circulatory .i.
~~changes during acclimitization to high altitude. Am. J. ,
°..'%
Physiol. 149: 565-588, 1947.
15. McFarland, R.M. The effects of oxygen deprivation on the
human organsm. Cvil. Aer. Auth. Report No. . 1938..
e16. Pugh LaGiC.E. Physiological and medical aspects of the
1.Himalayan scientific and mountaineering expedition, 1960-.•E.
1919 6it -ed. e 2:621-62 , 1962....
17. Rahn, H, and A.B. Otis. Rans respiratory response during
and after acclimitization to h hgh altitude Am. J. PhysLol 157:
445-462, 1949. 555814.
18. Warren, C.B.M. Alveolar air on Mt. Everest i J. Physiol. 96:
34 P, 1939. f.>"
19. West, J.B., P. .Hackett, K.H. MaRert, R.M. Peters, r., J.S...
.'S." *•
M1lledge, C. J. PLzzo, and Ra M. Winslow. Pulmonary gas exchange
an the summit of Mount Everest. an Appe r Physol. RespLrat
1 nvWron. Exercise Physiol. 54:1188-1194, 1983.Pyso.9:
16 "''%-
Page 21
is - -4 - . .A * - , - . .* - . S. . ., .p .. .,' ~ ~~ T ,
13,A,
LEGENDS
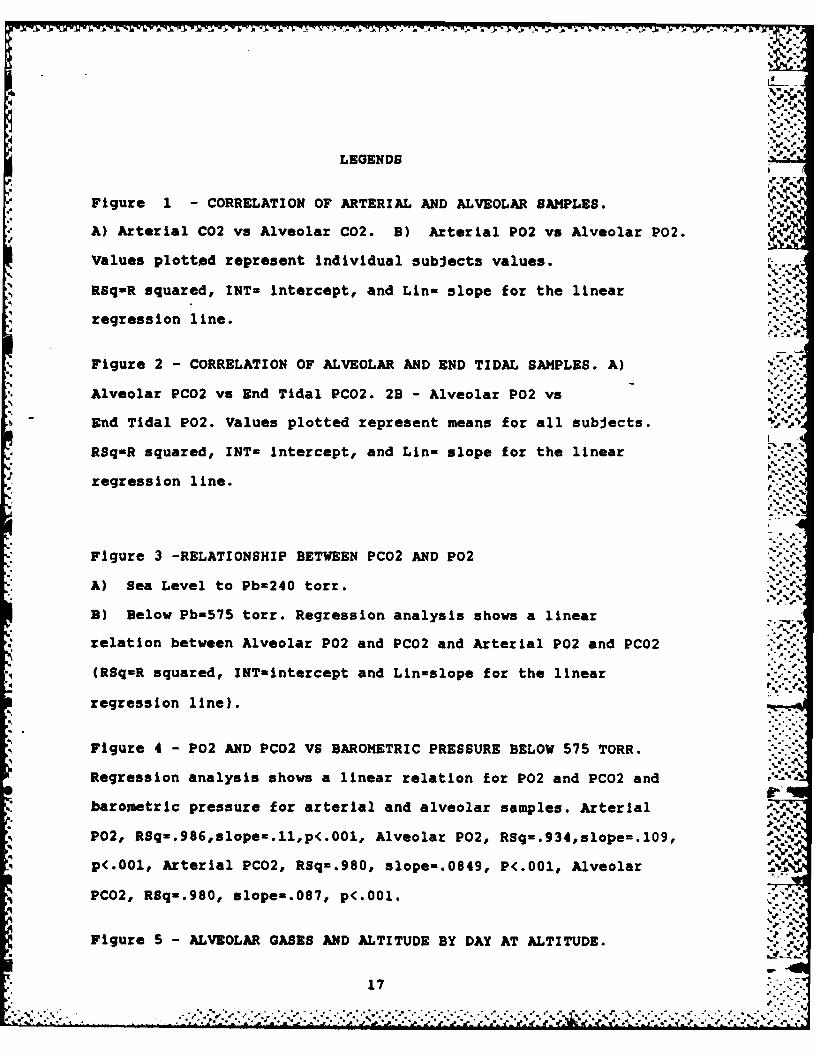
Figure 1 - CORRELATION OF ARTERIAL AND ALVEOLAR SAMPLES.
A) Arterial C02 vs Alveolar C02. B) Arterial P02 vs Alveolar P02.
Values plotted represent individual subjects values.
RSq-R squared, INT- Intercept, and Lin- slope for the linear
regression line.
Figure 2 - CORRELATION OF ALVEOLAR AND END TIDAL SAMPLES. A)
* Alveolar PCO2 vs End Tidal PC02. 2B - Alveolar P02 vs
End Tidal P02. Values plotted represent means for all subjects.
RSq-R squared, INT- intercept, and Lin- slope for the linear
regression line.
Figure 3 -RELATIONSHIP BETWEEN PC02 AND P02 "5"
A) Sea Level to Pb-240 torr.
B) Below Pb=575 torr. Regression analysis shows a linear
relation between Alveolar P02 and PC02 and Arterial P02 and PC02
(RSq-R squared, INT-intercept and Lin-slope for the linear
regression line).
Figure 4 - P02 AND PC02 VS BAROMETRIC PRESSURE BELOW 575 TORR. '
Regression analysis shows a linear relation for P02 and PCO2 and
barometric pressure for arterial and alveolar samples. Arterial
P02, RSq-.986,slope=.ll,p<.00l, Alveolar P02, RSq-.934,slope=.109,
p(.001, Arterial PC02, RSq-.980, slope-.0849, P<.001, Alveolar
PCO2, Rgq-.980, slope-.087, p<.001. .. 5..
Figure 5 - ALVEOLAR GASES AND ALTITUDE BY DAY AT ALTITUDE.
17
Page 22
- .- ,.,a' ,,
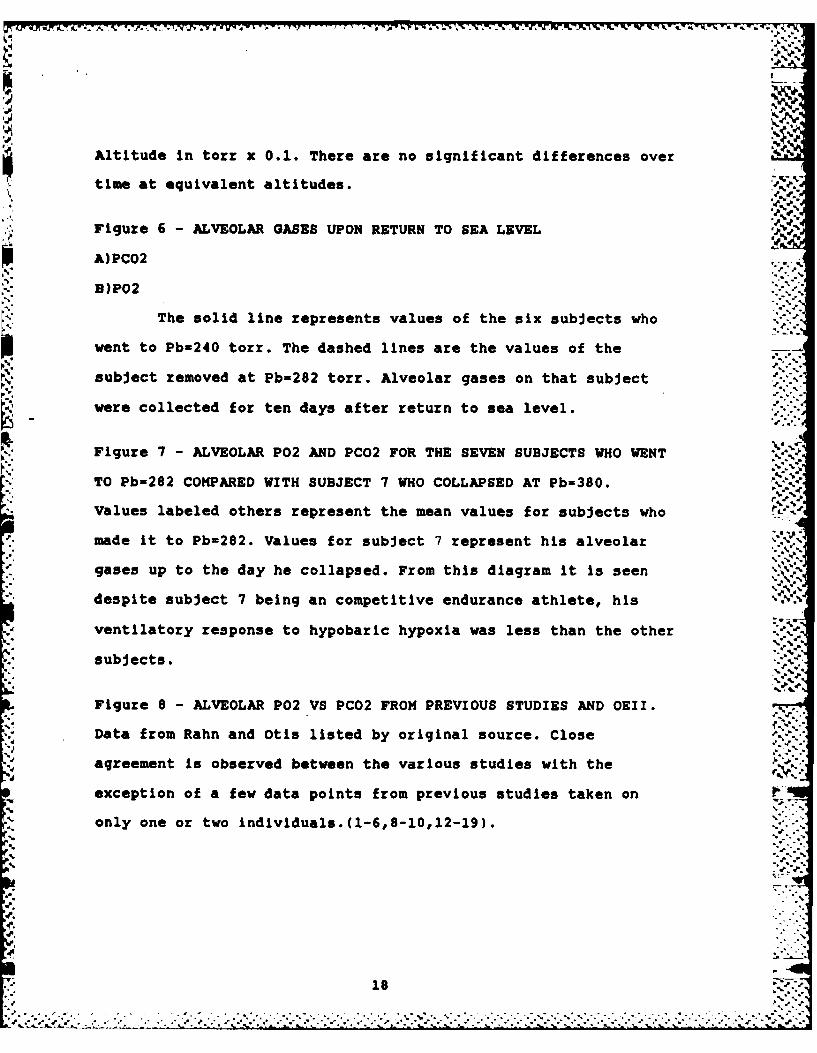
Altitude in toir x 0.1. There are no significant differences over
time at equivalent altitudes. Ke.Figure 6 - ALVEOLAR GASES UPON RETURN TO SEA LEVEL '-b
A)PC02
B)P02
The solid line represents values of the six subjects who
went to Pb-240 torr. The dashed lines are the values of the
subject removed at Pb-282 torr. Alveolar gases on that subject
- were collected for ten days after return to sea level.
Figure 7 - ALVEOLAR P02 AND PCO2 FOR THE SEVEN SUBJECTS WHO WENT .41_
TO Pb=282 COMPARED WITH SUBJECT 7 WHO COLLAPSED AT Pb-380.
-_ Values labeled others represent the mean values for subjects who
made it to Pb=282. Values for subject 7 represent his alveolar
A. gases up to the day he collapsed. From this diagram it is seen
despite subject 7 being an competitive endurance athlete, his
ventilatory response to hypobaric hypoxia was less than the other
subjects. -
Figure 8 - ALVEOLAR P02 VS PC02 FROM PREVIOUS STUDIES AND OEII.
Data from Rahn and Otis listed by original source. Close
'S agreement is observed between the various studies with the
exception of a few data points from previous studies taken on
only one or two individuals.(1-6,8-10,12-19).
.4:
-z
5'...-
'5...
.',.., ... . .. . .. . . . .... ,_~~~~~ ~~... .,.. .. ... .. . .. .. . ... . .. . .. ...-........ ... .-.... ._--. .--. . -. ,,-.--
Page 23
MUA YAME W ALVEDLAR AND ARTEIAL SAMS
. . % 'D
ALVEOLAR SANULS ARTERIAL SMS
II
DAY ft N PiO2 PA02 PAC02 R PaD2 Film2 Ph
1 760 8 149 104.3 1 9.9 36.2 t 4.3 .15 t .13 109 183.3 33.2 t 2.4 7.42 1 .023 575 1 110 63.2 19.0 3.2*t3.4 .79 1.124 501 U 95 53.83*3.0 37.61t3.9 .90 t.135 482 8 91 53.8 1 5.3 31.6*t2.9 .3 t1.10 53.0 1 3.9 32.3 12.5 7.44 1 .026 463 3 37 50.0*t7.1 29.5*13.7 .77 1.7 447 8 34 46.9*15.0 20.5 f2.8 .741t09
* 42 8 30 47.5*15.4 26.4*t3.7 .90t13 52.4 t4.0 24.9*12.2 7.46 1.02
15 301- 43.4*6 f.2 23.4*13.9 A3t1.1016 380 8 70 43.4*15.2 22.6*t3.0 .851t.1017 364 7 66 0.3 13.6 23.7*t2.5 .911t.1118 349 7 63 3M.1*t3.8 23.1*t3.0 .851t.0519 349 7 63 39.5*12.2 11.5*11.8 .741t.05 41.0 t3.3 20.0*t2.0 7.50 t.0420 349 7 63 35.7*15.4 21.3 t3.9 .74 t.0421 380 7 70 45.0*t4.6 22.0*t3.4 t39.1322 349 7 63 3X.9*t4.0 21.2*f3.2 .771f.0223 349 7 63 35.2*t2.9 22.0*t2.9 .741t.0424 347 7 63 3.0*t3.6 19.9 1 2.4 .77 f.07
.4% .4
25 335 7 60 35.7*13.2 20.5 12.9 .301t.0526 314 7 56 31.2 t2.9 18.6*12.0 .721 .0627 306.5 7 54 30.6*13.0 17.5*t2.1 .691f.0423 306 7 55 34.3*f3.8 16.4*t2.6 .7831.03 3.0*14.3 17.3*12.6 7.50 1.04
30 2 7 52 32.414.4 14.9*3.4 .721 t.05
31 B9 31 31.9* 3.1 17.0 t3 A t1:03
33 23 7 49 2.7*12.3 15.3*t1.9 .70 1.0434 2M 6 49 32.7*t3.3 14.0*t2.5 .331.03
I40 232 6 49 32.6*13.9 14.2*t3.2 .84 1.0535-40 282 6 49 34.9*12.6 14.6*t 1.2 1.06 1 .21 35.9* t1. 7 13.3 1 1.3 7.53 1 .02
34 273 6i 47 30.2*t2.7 14.7*t2.2 .351t.0634 263 6 45 31.0*t3.0 13.9*t2.3 1.021t,10
35-40 252 6i 44 32.5*t 1.6 12.2*t0.3 1.28 1.21 321t2.7 10.9*t1.5 7.54 t.0234 247 6 42 30.8 t 4.0 12.9*12.4 1.45 t .59
*35-40 240 6 42 29.83*3.4 12.4*t1.9 1.51*.t 29.3*t2.4 11.7*t1.5 7.561t.0240 757 6 148 127.9 t 5.2 19.1 t 3.1 t3 .1441 761 6 149 130.7 1 5.7 25.5 t 4.3 1. 70 1 .5642 776 6 152 132.51t 5.7 27.3 t 4.8 1.59 t .2743 764 5 150 128.9*t 4.9 27.5 1 4.6 1.46 1 .20
ki Say iulicates days at altitude. ft is barometric pressure in torr.It is respiratory quotiet. Valu.e from day 35-40 represents values from
61 individuaal asceets.
I...
.t•d." 5tt.. -
Page 24
7.~~S W7777-
TMLE 2AALEOLA WUON KTIU TO SEA LEVEL
PA02 (TOUR) PAMC2 (TOUR)on I s.d. am t s.d.
PI 22 TORR 32.5613.9 14.2413.2IDIATE S.L. 127.98 t 5.2 11.1 t 3.118 HOURS S.L. 130.71 t 5.7 25.48 t 4.342 HOURS .L. 132.45 t 5.7 27.30 t 4.372 NOURS S.L. 129.95 1 4.9 27.50 f 4.6
TAILE 23
ALVEOLAR A ARTERIAL BASES UPON RETURN TO SEA LEVEL FOR SlINJECT REOYED AT 2 TOR"
TINE P PA02 PAC02 PaO2 PaC02 pH BE NC03
292 23.3 16.74 HOURS IL 119.6 12.3 7.45 -9.8 12.320 HOURS IL 137.3 23.1 122.5 23.3 7.42 -8.6 14.7 '5.
53 HOURS SL 127.5 26.4 111.8 25 7.43 -6.3 16.67 DAYS L 124.4 20.02I DAYS IL 130.8 31.49 DAYS IL 129.9 32.610 DAYS IL 120.24 35.5
~-.-+,
A) Alveolar gases for the successful sumiters. Samples at Pb 292 Vere takenimmediately before descent.1) Alveolar and arterial lases for the subject vho was removed from the study atPb 292 torr. K is base excess.
,' . ,
°.. °
,.41
" -,-
Page 25
,., .,(
TABL 2 DIVIIML ALVELAR MID ARTERIAL. OOD BASES
ft 760, P102 149 ft 306, P102 55Sm PA2 PAC2 PA02 PaMD2 PH SU1 PA02 PAC02 PAM PaC02 PH1 110.0 32.3 100.0 27.70 7.39 1 34.5 17.1 31.40 20.80 7.47
12.2 42.0 110.30 32.40 7.42 3 21.3 20.5 0.90 20.40 7.494 111.5 32.0 106.00 32.30 7.42 4 39.3 14.3 7.0 16.5 7.40
5 111.0 35.6 104.35 33.40 7.42 5 3.7 13.1 41.40 13.80 7.596 5.3 41.2 110.30 20.10 7.42 6 32.1 17.4 3.20 17.80 7.457 593.5 41.1 104.30 32.50 7.43 1 31.0 17.1 33.40 16.50 7.491 105.0 39.5 128.00 31.40 7.43 9 37.5 13.5 40.60 14.60 7.509 106.2 40.7 107.90 25.60 7.46
MEAN 34.3 16.4 35.59 17.30 7.50 s- -
KN 103.21 31.05 10.0O 33.17 7.42 a3 3.8 2.6 4.27 2.62 .04 ,-s 91.02 4.13 3.33 2.42 .02 .
ft 292, P102 49Pb 482, P102 51 SUB PA02 PAC02 P.02 PaC02 PH
SUB P02 P2 P02 PC2 PH 1 37.8 13.7 35.40 13.22 7.531 54.1 30.0 54.90 35.10 7.46 3 3.5 14.2 3.30 13.60 7.533 53.2 33.2 0.70 30.30 7.44 4 37.8 12.6 36.50 12.00 7.554 35.3 27.5 11.70 31.5 7.43 4 34.4 14.1 4.20 11.80 7.575 63.3 28.1 56.20 30.00 7.44 6 33.0 15.5 39.60 11.30 7.506 46.6 35.0 60.90 32.40 7.47 8 31.4 15.5 33.60 14.40 7.537 48.2 33.9 62.70 29.30 7.45 9 3.7 16.2 35.00 15.20 7.518 57.4 30.5 55.10 36.20 7.43 5 35.80 14.00 7.539 51.3 34.4 52.00 33.40 7.42
NEAN 35.4 14.5 5.90 13.25 7.53NE 53.74 31.57 58.01 32.33 7.44 SD 2.5 1.3 1.33 1.25 .02
S5.31 2.93 3.93 2.47 .02
Pb 252, P102 44ft 429, P102 0 SUB PA02 PAC02 P&02 PaC02 PH
SLD PA02 PAC02 Pa02 PaC02 PH 1 32.5 12.7 31.20 12.00 7.5357.7 19.6 51.80 23.00 7.47 3 32.3 11.7 33.00 10.20 7.52 P. .N42.5 31.0 47.00 28.70 7.44 4 34.7 11.0 36.60 9.20 7.5848.6 21.4 57.00 22.30 7.46 6 31.5 11.9 32.60 1.17 7.53
3 48.7 30.4 48.50 27.30 7.44 9 30.9 12.2 2.60 12.20 7.M3,....6 42.8 27.1 380 23.90 7.4 9 20.9 12.9 29.80 12.40 7.M3.-*,,.
7 42.7 27.7 4B.90 25.U0 7.45 - .. w
1 44.9 29.7 52.20 25.20 7.46 MEAN 31.8 12.0 32.13 10.96 7.549 51.3 23.7 56.90 23.70 7.50 SD 1.9 .7 2.59 1.52 .02
KA 47.46 26.22 52.36 24.5 7.45a0 5.37 4.14 4.04 2.19 .02 Pb 240, P102 43ft 240, P102o4
SUB PA02 PAC02 P&02 P4C02 PH1 32.6 5.5 31.70 5.80 7.57
ft 349, P102 63 1 29.0 11.70 7.513 PA02 PAC02 P&02 PaC02 PH 3 30.7 12.0 25.80 11.10 7.571 46.7 17.3 44.00 15.50 7.57 3 26.2 13.9 26.10 13.80 7.57 "3 39.4 19.5 26.20 22.50 7.46 4 X.50 12.30 7.574 41.7 16.3 45.50 17.70 7.50 4 33.0 9.8 31.50 9.50 7.615 31.4 22.5 41.0 22.50 7.48 6 28.5 12.1 32.40 10.30 7.54G 34.1 23.1 42.45 15.50 7.49 8 24.4 14.4 28.60 13.60 7.53I 33.4 24.0 3.40 23.15 7.48 9 29.9 12.5 27.30 12.60 7.549 U.9 20.5 39.00 18.0 7.52 9 26.60 12.10 7.55
l 39.0 20.7 41.05 15.59 7.50 HEAN 29.2 12.1 25.33 11.68 7.56a 4.4 2.5 3.25 2.79 .04 3 3.2 1.9 2.37 1.50 .02
lbu's jectPbaretric preswe in torrPl02ai.pirod oxygen pressure in torr.Arterial ad alveolar samples fro 760-349 torr wr, mot simltamnus.
Page 26
W.. P.-
.%*
TABLE 4 - Alveolar P02 and PCO2 In acclimatizedsubjects from recent studies %
source Pb P02 PC02 N
PUGH, '1957 347 39.3 21337 35.5 21.3308 34.1 16.9
GILL et al, 1962 344 38.1 20.7 4300 33.7 15.8 8 ,288 32.8 14.3 3
VEST et al, 1981 284 36.1 11 4267 36.7 8 1253 37.6 7.5 1 I
Pb represents barometric pressure, N represents sample size.P02 and PC02 represent alveolar values in torr.
* .- *.!
** .p
W ..
1: V
... *'
* *'-*.* .-.-*-...,..*.*.*,
Page 27
ALEOA PC. (tor. -.
.8..2
cn (n cn c
N.4
..03..
a
-c *m:.
..m4
a p.CA .'N
/~LA
Page 28
.* %°t'
I
ALVEOLAR P02 (torr)
000o)0000 -400 00 00
I a
0
m
S0 0.
0 O O
oo
00
-& = 0 14...t.
0 0* ",.
_ 0 at. *4
() 0@Q Z
%- % ,,,,V, , 'J . . . .,, ,. % .%,". % % ., % ,0 ".
... . . . . -- ,.,,- ; ;, , ,., .,..,., . , .- ,• ,-,. ... . . .- ,:,', - .-.0....,-. .- .
Page 29
4..
0IL
CM c2L
(JJ()&2 Zgdwa N3%
41
CLAQ
Page 30
C14
06
0L0 C
ccl* cc,1
C w P
ccI
0
o~ %*
e,7110 .0
.4~
02 0 p ; q
702
(ijo) co iva aN
Page 31
W.-.,&- 1>
.%
00
00 0
coo0* 0a
II-
WO 000d
0, t.v
o0 0 0.0o.'0I' *
a-1
ge l g,'
I- m-....
*F, A
'' ' %* ''V *'~:~ ~ *v~~ ",'"'* .- "
Page 32
" *s" %t*
-.
C I0-0
So
of)
00
00
CMC0 0.0 900d
- m -.. :
'+ I(o;) = O"d
o.1. .
! o° ° • ,-4
°o, ..i*'.*";-"***-
Page 33
0 o
o oS.
I
a aO0 0LuIE~
0i.\J. **~ ow6
(0
0 a. 0 C0 V wV C
-I
Page 34
K7_17,K77~~~ -J7- 7 -77 7
cc 0 . . .
X~ 49
01
WP
In,
In L;V
_______________ _____________
Page 35
S *0
AL *0
IL
So 0'120
0,
I'I
'e - zl
Page 36
% 4
r 4%LU~
I * z
w &I* I Q0
1;e
I C.-- V- V - 9- 9
o
Jb1
EZ 4%' 0WOO Z~dUV103AI
Page 37
M~. *~ b~~ .' ~ ~ ~ ~ * ~'~ ~ ~ ~ -.- ,
ca ,
a -I-
0Ic
I L I L
INI
d a 0 0 -
e~~~UU _-o ctoq o
(ijoi aunsud I~iUw
% % %
Page 38
A FAIno 0 01
0 I-zu~~w
I010
ml04
a. 00A0.
Cd.9
xa
x4 x
xxaK .
ce-- --
Of LP~
(ijol goodE
Page 39
.......... ....
1-v
/.............. .....................