162
ANNUAL REPORT 2011
ANNUAL REPORT 2011
CONTENTS
2 2011 Financial performance overview
3 Group profile
7 Chairman’s Statement
11 Chief executive’s Review
13 Strategy
15 operations Review
23 Finance Review
33 Sustainability
36 Board of Directors
38 Corporate Governance Statement
49 Directors’ Report
52 Remuneration Report
61 Statement of Directors’ Responsibilities
62 Independent Auditors’ Report
64 Group Income Statement
65 Group Statement of Comprehensive Income
66 Group Balance Sheet
68 Company Balance Sheet
69 Group Statement of Changes in equity
71 Company Statement of Changes in equity
72 Group Cash Flow Statement
74 Company Cash Flow Statement
75 notes to the Consolidated Financial Statements
160 Shareholder Information

wE CrEaTEiNNOvaTivEpaCkagiNgSOluTiONS
Smurfit Kappa prides itself on its ability to work closely with its customers, both large and small, to develop innovative packaging solutions that enable our customers to be successful in their respective markets by ensuring that our products are cost competitive, fit for purpose, sustainable and offer effective presentation of our customers’ goods.
the Group’s Research and Development Centre in Hoogeveen, the netherlands, deploys state of the art design and testing facilities to enable our significant expertise to be used in developing the most suitable solution for any packaging challenge. As a result, our extensive product portfolio ranges from basic corrugated containers through to high-end packaging using high quality printing techniques. As part of the drive towards a more sustainable world, we continually promote the use of paper-based alternatives to plastics and other non-recyclable materials. one of our key product offerings is striking point-of-sale and shelf-ready displays which offer key advantages in terms of minimal use of resources combined with efficient transportation and excellent promotional opportunities for our customers’ products.
In this Annual Report, we show just a small sample of the types of packaging solutions that we have successfully developed in close cooperation with our extensive customer base, both local and multinational.
2011 FiNaNCial pErFOrmaNCE OvErviEw
2011€m
2010€m
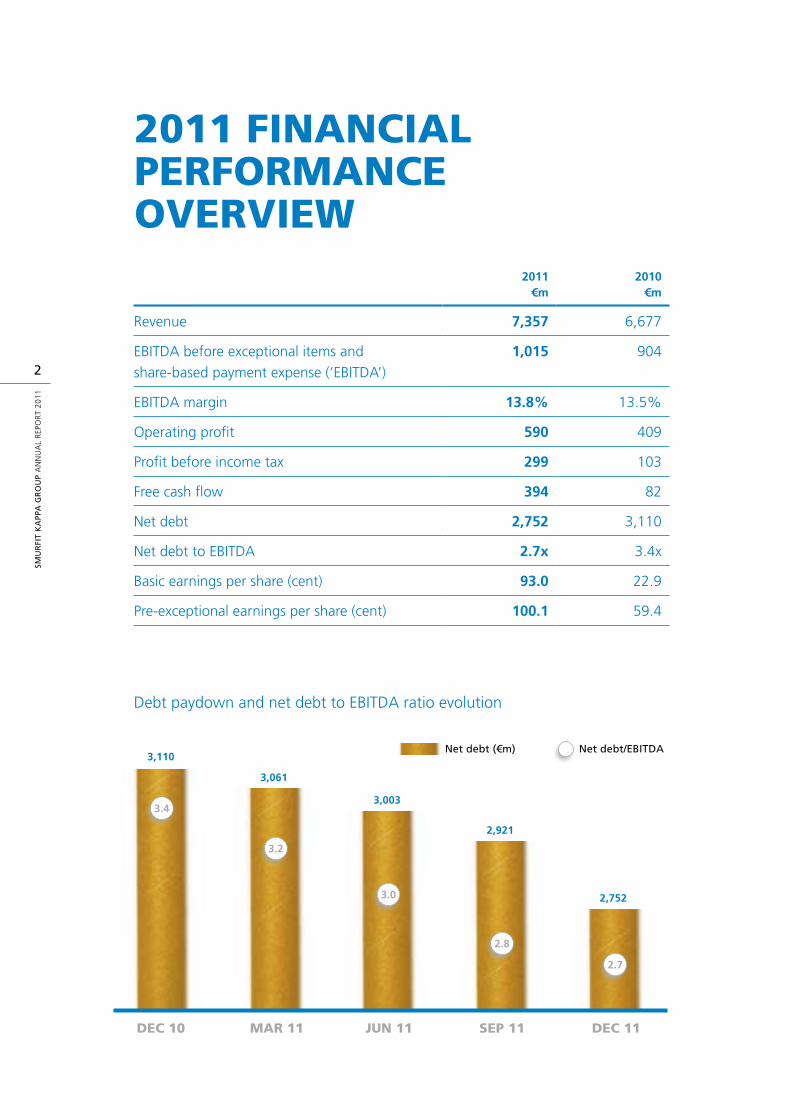
Revenue 7,357 6,677
eBItDA before exceptional items andshare-based payment expense (‘eBItDA’)
1,015 904
eBItDA margin 13.8% 13.5%
operating profit 590 409
profit before income tax 299 103
Free cash flow 394 82
net debt 2,752 3,110
net debt to eBItDA 2.7x 3.4x
Basic earnings per share (cent) 93.0 22.9
pre-exceptional earnings per share (cent) 100.1 59.4
Debt paydown and net debt to eBItDA ratio evolution
DEC 10
3,110
mar 11
3,061
juN 11
3,003
SEp 11
2,921
DEC 11
2,752
3.4
3.2
3.0
2.8
2.7
Net debt/EBITDANet debt (€m)
SMU
RFI
T K
APP
A G
RO
UP
An
nu
Al
Rep
oR
t 2
01
1
2
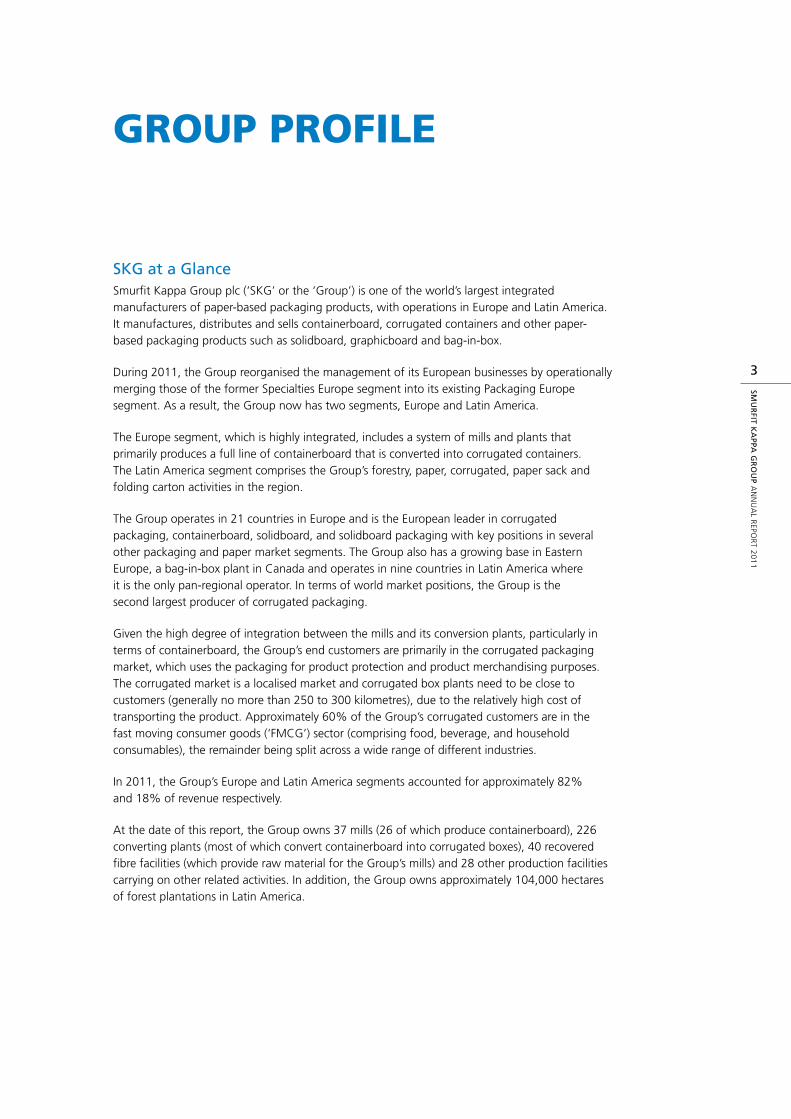
SKG at a GlanceSmurfit Kappa Group plc (‘SKG’ or the ‘Group’) is one of the world’s largest integrated manufacturers of paper-based packaging products, with operations in europe and latin America. It manufactures, distributes and sells containerboard, corrugated containers and other paper-based packaging products such as solidboard, graphicboard and bag-in-box.
During 2011, the Group reorganised the management of its european businesses by operationally merging those of the former Specialties europe segment into its existing packaging europe segment. As a result, the Group now has two segments, europe and latin America.
the europe segment, which is highly integrated, includes a system of mills and plants that primarily produces a full line of containerboard that is converted into corrugated containers. the latin America segment comprises the Group’s forestry, paper, corrugated, paper sack and folding carton activities in the region.
the Group operates in 21 countries in europe and is the european leader in corrugated packaging, containerboard, solidboard, and solidboard packaging with key positions in several other packaging and paper market segments. the Group also has a growing base in eastern europe, a bag-in-box plant in Canada and operates in nine countries in latin America where it is the only pan-regional operator. In terms of world market positions, the Group is the second largest producer of corrugated packaging.
Given the high degree of integration between the mills and its conversion plants, particularly in terms of containerboard, the Group’s end customers are primarily in the corrugated packaging market, which uses the packaging for product protection and product merchandising purposes. the corrugated market is a localised market and corrugated box plants need to be close to customers (generally no more than 250 to 300 kilometres), due to the relatively high cost of transporting the product. Approximately 60% of the Group’s corrugated customers are in the fast moving consumer goods (‘FMCG’) sector (comprising food, beverage, and household consumables), the remainder being split across a wide range of different industries.
In 2011, the Group’s europe and latin America segments accounted for approximately 82% and 18% of revenue respectively.
At the date of this report, the Group owns 37 mills (26 of which produce containerboard), 226 converting plants (most of which convert containerboard into corrugated boxes), 40 recovered fibre facilities (which provide raw material for the Group’s mills) and 28 other production facilities carrying on other related activities. In addition, the Group owns approximately 104,000 hectares of forest plantations in latin America.
grOup prOFilE
SMU
RFIT K
APPA
GR
OU
P An
nu
Al R
epoR
t 20
11
3
SMU
RFI
T K
APP
A G
RO
UP
An
nu
Al
Rep
oR
t 2
01
1
4
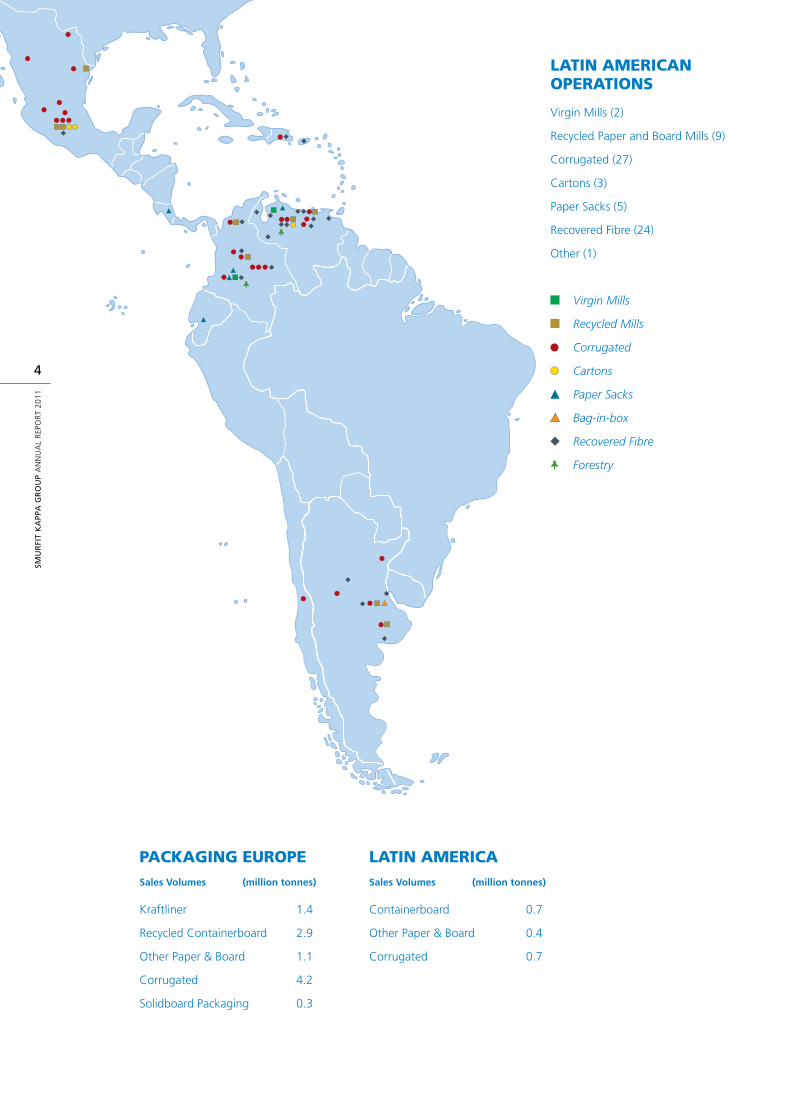
Latin american OperatiOns
Virgin Mills (2)
Recycled paper and Board Mills (9)
Corrugated (27)
Cartons (3)
paper Sacks (5)
Recovered Fibre (24)
other (1)
Virgin Mills
Recycled Mills
Corrugated
Cartons
Paper Sacks
Bag-in-box
Recovered Fibre
Forestry
packaging eurOpeSales Volumes (million tonnes)
Kraftliner 1.4
Recycled Containerboard 2.9
other paper & Board 1.1
Corrugated 4.2
Solidboard packaging 0.3
Latin americaSales Volumes (million tonnes)
Containerboard 0.7
other paper & Board 0.4
Corrugated 0.7
SMU
RFIT K
APPA
GR
OU
P An
nu
Al R
epoR
t 20
11
5
Latin american OperatiOns
Virgin Mills (2)
Recycled paper and Board Mills (9)
Corrugated (27)
Cartons (3)
paper Sacks (5)
Recovered Fibre (24)
other (1)
Virgin Mills
Recycled Mills
Corrugated
Cartons
Paper Sacks
Bag-in-box
Recovered Fibre
Forestry
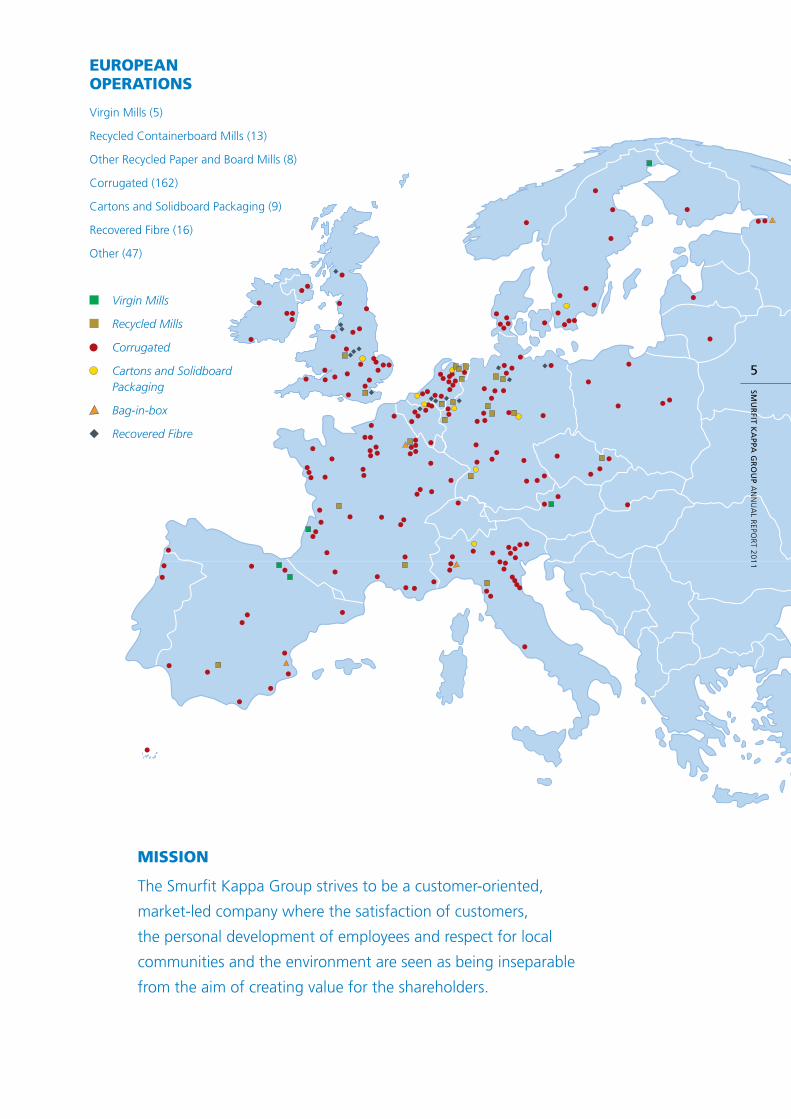
missiOn
the Smurfit Kappa Group strives to be a customer-oriented,
market-led company where the satisfaction of customers,
the personal development of employees and respect for local
communities and the environment are seen as being inseparable
from the aim of creating value for the shareholders.
eurOpean OperatiOns
Virgin Mills (5)
Recycled Containerboard Mills (13)
other Recycled paper and Board Mills (8)
Corrugated (162)
Cartons and Solidboard packaging (9)
Recovered Fibre (16)
other (47)
Virgin Mills
Recycled Mills
Corrugated
Cartons and Solidboard Packaging
Bag-in-box
Recovered Fibre
CuSTOmEr FOCuSED iNNOvaTiON
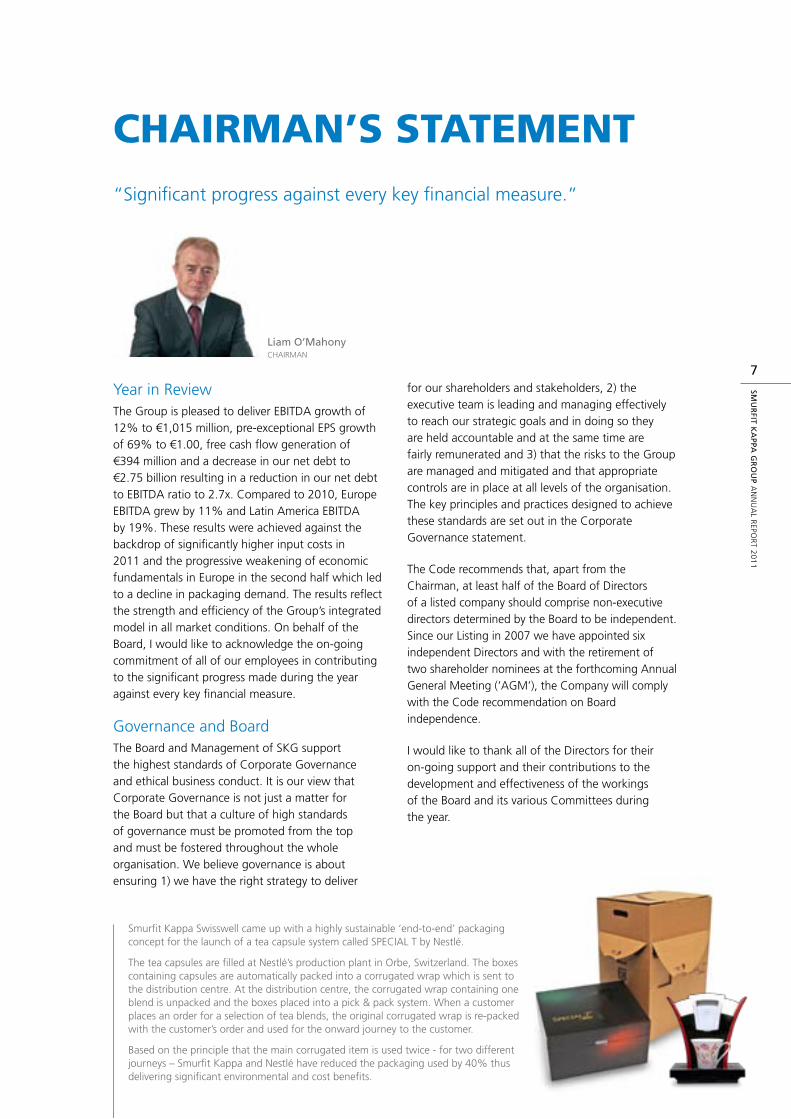
Smurfit Kappa Swisswell came up with a highly sustainable ‘end-to-end’ packaging concept for the launch of a tea capsule system called SpeCIAl t by nestlé.
the tea capsules are filled at nestlé’s production plant in orbe, Switzerland. the boxes containing capsules are automatically packed into a corrugated wrap which is sent to the distribution centre. At the distribution centre, the corrugated wrap containing one blend is unpacked and the boxes placed into a pick & pack system. When a customer places an order for a selection of tea blends, the original corrugated wrap is re-packed with the customer’s order and used for the onward journey to the customer.
Based on the principle that the main corrugated item is used twice - for two different journeys – Smurfit Kappa and nestlé have reduced the packaging used by 40% thus delivering significant environmental and cost benefits.
Year in Reviewthe Group is pleased to deliver eBItDA growth of 12% to €1,015 million, pre-exceptional epS growth of 69% to €1.00, free cash flow generation of €394 million and a decrease in our net debt to €2.75 billion resulting in a reduction in our net debt to eBItDA ratio to 2.7x. Compared to 2010, europe eBItDA grew by 11% and latin America eBItDA by 19%. these results were achieved against the backdrop of significantly higher input costs in 2011 and the progressive weakening of economic fundamentals in europe in the second half which led to a decline in packaging demand. the results reflect the strength and efficiency of the Group’s integrated model in all market conditions. on behalf of the Board, I would like to acknowledge the on-going commitment of all of our employees in contributing to the significant progress made during the year against every key financial measure.
Governance and Boardthe Board and Management of SKG support the highest standards of Corporate Governance and ethical business conduct. It is our view that Corporate Governance is not just a matter for the Board but that a culture of high standards of governance must be promoted from the top and must be fostered throughout the whole organisation. We believe governance is about ensuring 1) we have the right strategy to deliver
for our shareholders and stakeholders, 2) the executive team is leading and managing effectively to reach our strategic goals and in doing so they are held accountable and at the same time are fairly remunerated and 3) that the risks to the Group are managed and mitigated and that appropriate controls are in place at all levels of the organisation. the key principles and practices designed to achieve these standards are set out in the Corporate Governance statement.
the Code recommends that, apart from the Chairman, at least half of the Board of Directors of a listed company should comprise non-executive directors determined by the Board to be independent. Since our listing in 2007 we have appointed six independent Directors and with the retirement of two shareholder nominees at the forthcoming Annual General Meeting (‘AGM’), the Company will comply with the Code recommendation on Board independence.
I would like to thank all of the Directors for their on-going support and their contributions to the development and effectiveness of the workings of the Board and its various Committees during the year.
SMU
RFIT K
APPA
GR
OU
P An
nu
Al R
epoR
t 20
11
7
ChairmaN’S STaTEmENT“Significant progress against every key financial measure.”
Liam O’Mahony CHAIRMAn
DirectorsIn February 2012 we were delighted to announce that Mr Irial Finan, an Irish citizen based in the uSA, was co-opted to the Board as an independent, non-executive Director. He is currently executive Vice president of the Coca-Cola Company and president of the Bottling Investments Group. His extensive experience across international markets with one of the world’s leading companies will meaningfully contribute to the Board and the continued development of SKG.
Mr Gordon Moore will retire from the Board at the forthcoming AGM following six years on the SKG Board. Mr Rolly van Rappard will also retire from the Board at the AGM following seven years on the Board prior to which he had spent seven years on the Kappa Group Board. the Board would like to sincerely thank them for their support and contribution during their directorships and to offer our best wishes for the future.
operational VisitsIn August the Board travelled to France and visited the Facture kraftliner mill and the Saint Seurin corrugated facility both in the region close to Bordeaux. At the Facture facility, as well as viewing the impressive paper mill facilities, we inspected the biomass boiler commissioned in late 2010 which reduces the Co2 emissions as a result of a significant increase in non-fossil fuel usage at the facility. We also visited a specially commissioned wood storage facility close to Facture which was created to preserve the trees which fell as a result of the severe storms in the south west region in previous years.
these visits are extremely valuable in giving a deeper first-hand understanding of the strength and extent of our local businesses, their strategic positioning, and the dedication and enterprise of our teams at all levels throughout the organisation.
During 2011, I personally made additional visits with the senior european management team to facilities in Austria, the Czech Republic, Germany, the uK, Italy, the netherlands, Belgium and Ireland covering mills, corrugated plants and other operations.
AcquisitionsConsistent with our strategy of expanding our packaging business in higher growth markets, in the fourth quarter of 2011 and in January 2012 the Group concluded two bolt-on acquisitions, in Russia and Argentina respectively.
In Russia, the Group acquired a box plant in St. petersburg for €8 million thereby increasing its presence in the region.
the Argentinean acquisition represents a further expansion and internationalisation of the Group’s growing bag-in-box business. the consideration for the deal was uS$15 million. this transaction was facilitated by SKG’s presence and experience in Argentina and represents an exciting opportunity to expand our business in this relatively high margin product and geographic area.
these acquisitions will help SKG to deepen its relationship with its customers on a wider geographic basis, while also accessing attractive local business.
SustainabilitySKG is fundamentally committed to sustainability and social responsibility in its interaction with its customers, suppliers, employees, the communities in which it is privileged to do business and in relation to its impact on the broader environment. I am delighted to note the third party recognition for our work in this area and especially the awards which we have received from key customers, details of which are set out in our fourth Sustainable Development Report which was produced in July 2011. A summary of this report is contained on pages 33 to 35 of this Annual Report.
SMU
RFI
T K
APP
A G
RO
UP
An
nu
Al
Rep
oR
t 2
01
1
8
Dividends and Dividend policyentering 2012, as a consequence of our increased financial flexibility and sustained confidence in the long-term outlook for our business, the Board is satisfied that it is appropriate and timely for SKG to reinstate a sustainable dividend stream. In that context, the Board is recommending a final dividend of 15 cent per share for 2011 payable on 11 May 2012.
the Directors intention is that interim and final dividends will be paid in october and May in each year in the approximate proportions of one third and two thirds.
outlookthe sustained strength of our operating performance together with our market-facing integrated model and our enhanced capital structure provide us with an expanded range of strategic and financial options and give us confidence in the long-term future of the Group. our options for the use of cash include continued debt paydown, increased presence in higher growth markets through value enhancing acquisitions and a progressive dividend stream. opportunities will be prioritised to maximise shareholder returns, with a clear objective of maintaining a net debt to eBItDA ratio of below 3.0x through the cycle.
While macro-economic risks remain in 2012 and beyond, we expect to continue delivering strong free cash flow through the cycle.
Liam O’Mahony CHAIRMAn
SMU
RFIT K
APPA
GR
OU
P An
nu
Al R
epoR
t 20
11
9

DElivEriNg a SupEriOr SErviCE
2011 overviewthe Group generated eBItDA of €1,015 million in 2011 compared to €904 million in 2010. this strong financial performance demonstrates the benefits of our continued cost take-out programme, our efficiency improvements and our market-leading integrated business model, which delivered material growth in our pan-european business. A number of significant development investments were carried out in 2011, reinforcing our position as the leading integrated business in our industry, in both europe and latin America. We are continuing our unrelenting focus on customer service, product innovation and operating efficiency.
Despite significantly higher input costs in 2011, the Group delivered a relatively strong and improved eBItDA margin of 13.8% for the full year, leading to an enhanced return on capital employed of 12.5%. this outcome primarily highlights the benefits of SKG’s efficient integrated model, together with a continuing focus on cost efficiency and fair pricing of our total offering. At the end of 2011, the Group’s stated target of a 24% box price recovery from the 2009 low point was successfully achieved.
the progressively weakening economic fundamentals that prevailed in europe in the second half of 2011 clearly impacted consumption and output in the region, which led to a decline in packaging demand. Following a 2% underlying demand growth in the first half, SKG’s box volumes grew by 1% in quarter three, and declined by 2% in quarter four.
the somewhat softer demand environment that prevailed since the third quarter led to a rise in european recycled containerboard inventories, which combined with reducing raw material costs, generated a significant decline in paper prices. From the peak in quarter two to the year end, recycled containerboard prices reduced by €115 per tonne, while oCC costs only reduced by approximately €50 per tonne, thereby creating significant margin compression for non-integrated containerboard producers. lower margins led to significant market-related downtime being taken at the year end.
early in 2012, a generally stable demand environment combined with renewed upward pressure on oCC costs led to widespread recycled containerboard price increase announcements for implementation in the first quarter, combined with additional downtime plans. the Group announced price increases of €100 per tonne for recycled containerboard from 1 February, and €60 per tonne for kraftliner with effect from 1 March.
Senior Credit Facility Amendment RequestWithin the past 18 months, we have materially improved the financial profile and flexibility of SKG, by reducing net debt by approximately €540 million, while maintaining a strong liquidity position and diverse funding sources.
SMU
RFIT K
APPA
GR
OU
P An
nu
Al R
epoR
t 20
11
11
ChiEF ExECuTivE’S rEviEw“Substantial improvement in the Group’s financial profile and flexibility.”
Gary McGann GRoup CHIeF exeCutIVe oFFICeR
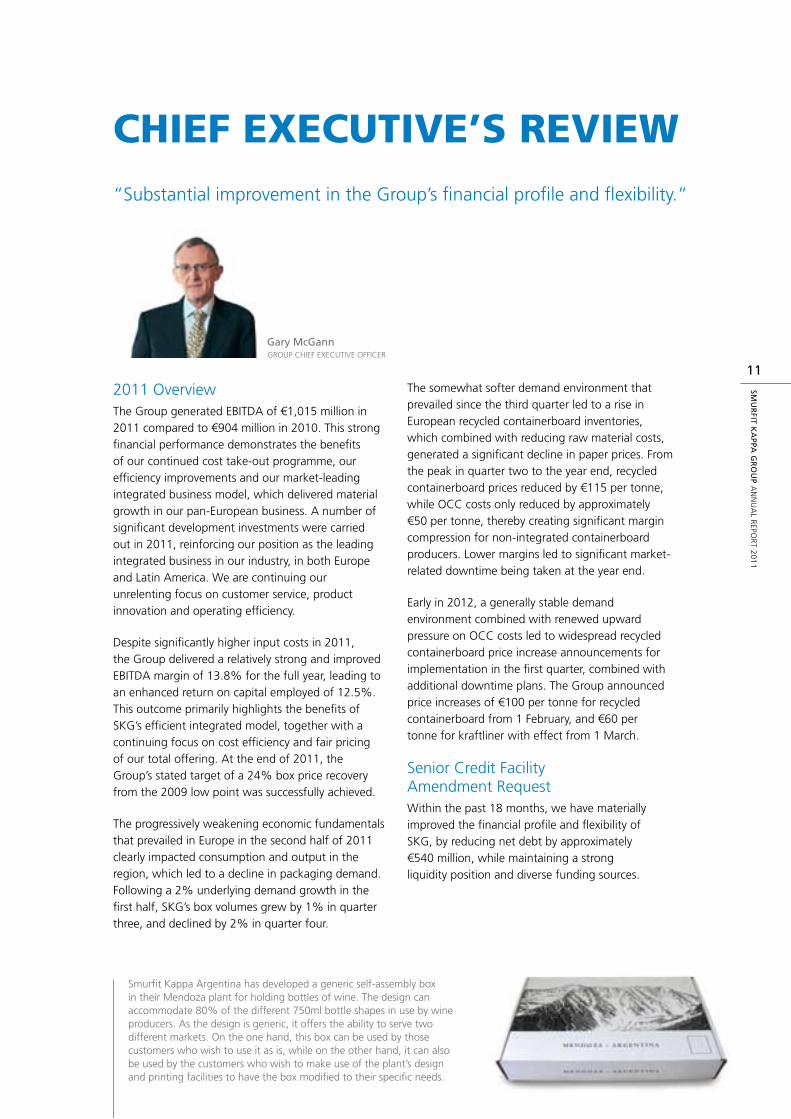
Smurfit Kappa Argentina has developed a generic self-assembly box in their Mendoza plant for holding bottles of wine. the design can accommodate 80% of the different 750ml bottle shapes in use by wine producers. As the design is generic, it offers the ability to serve two different markets. on the one hand, this box can be used by those customers who wish to use it as is, while on the other hand, it can also be used by the customers who wish to make use of the plant’s design and printing facilities to have the box modified to their specific needs.
notwithstanding the absence of material debt maturities until December 2013, the Group announced on 8 February 2012 that it was seeking the consent of its lenders to amend its Senior Credit Facility Agreement, in order to further extend its debt maturity profile and enhance its overall financial flexibility.
the key amendment requests were to 1) extend the maturity of the Group’s term loans B and C to 2016 and 2017 respectively, 2) extend the maturity of the Revolving Credit Facility (‘RCF’) to 2016, and 3) seek flexibility to raise longer dated secured bonds, as and when market conditions are considered optimal, in order to refinance its existing facilities.
the Group received a very positive response to its consent request with lenders comprising 98% of the Facility consenting to the proposed amendments – the minimum required level of consents was 662/3%. lenders holding 90% of term loans B and C and 77% of the Revolving Credit Facilities elected to extend their commitments. the amendments became effective on 1 March 2012.
CustomersWith our unique market presence in both europe and latin America, we seek to provide customers with innovative, sustainable and cost efficient paper-based packaging solutions. the Group seeks to differentiate itself in the market through superior service, quality, innovation and customer relationships. While we continue to build long-term sustainable partnerships with our pan-european customers, we also consider it a high priority to extend the skills and experience acquired in serving these companies to our local customers in the many markets in which we operate.
I would like to sincerely thank our customers on both continents for their continued confidence and trust. We will continue to invest to meet and exceed their requirements and we look forward to working with them to enhance the security and marketability of their products, thereby helping them to face the challenges of an increasingly competitive retail market.
our peopleour key competitive advantage and point of differentiation is our people, both individually but in particular working in cohesive teams. our continued focus is on recruiting, developing, motivating and retaining skilled employees dedicated to working as a team in the service of our diverse customer base. I would therefore like to acknowledge the effort and commitment of our over 38,000 employees in the 31 countries in which we operate for their significant contribution to the results achieved in 2011. We look forward to facing the challenges of 2012 together and to continuing our efforts to make SKG the safest company to work for in our industry.
Corporate Social ResponsibilityIn its fourth annual Sustainable Development Report, released in July 2011, SKG highlighted its continued progress and commitment to social and environmental best practices and cited tangible evidence of this. this continues to be a high priority for the Group in fulfilling its obligation to its customers, its employees, the communities in which we are privileged to operate and the environment from which we draw our natural resources.
Gary McGann GRoup CHIeF exeCutIVe oFFICeR
SMU
RFI
T K
APP
A G
RO
UP
An
nu
Al
Rep
oR
t 2
01
1
12
Having made significant strides towards achieving our de-leveraging objectives with the repayment of approximately €540 million in the past 18 months we can refocus on the long-term strategy for the Group which was outlined on the Initial public offering (‘Ipo’) in 2007.
the Group’s objective is to deliver superior performance in terms of profitability and returns on capital through the cycle, thereby enhancing shareholder value, and to be the market leader in paper-based packaging in its chosen markets. this objective is underpinned by a focus on delivering superior customer satisfaction, a relentless pursuit of cost and operating efficiency, proactive environmental awareness, and a commitment to continuous improvement in the areas of health and safety and corporate social responsibility.
the Group’s objectives and strategies are:
n to profitably build on its market positions in Western and eastern europe and in latin America through selective focused growth, including:
n organic growth from increased market share through consolidating, and where possible, extending its leadership position in Western europe. this will be achieved by leveraging the Group’s relationships with its customers across its broad product range and enhancing its profitability by maximising synergies and optimising the cost base; and
n acquisition and merger based growth in areas where market share and/or coverage facilitates it, particularly in the higher growth markets.
this dual approach of organic growth and acquisition will be pursued in each of Western europe, eastern europe and latin America with acquisitions mostly focused on the higher growth markets of eastern europe and latin America.
n to focus on enhancing its operational excellence, thereby continuing to improve its customer offering, by continuously upgrading its products, processes, services, quality and delivery in all markets by:
n leveraging the Group’s increasingly high quality asset base through continuous improvement programmes, transfer of best practice, industrial engineering, innovation and targeted capital investment;
n increasing the proportion of added-value converting products in the overall portfolio through the use of the Group’s development and technology centres, its pan-european network in high-value areas such as high quality printing, display and litho lamination; and
n ensuring that its operations, whether in the converting or mill divisions, continue to be close to the customers and have a clear market focus rather than being production-driven.
n to focus on cash flow and appropriate returns on investment in order to maximise shareholder value.
n to secure and retain the optimal balance between debt and equity capital to facilitate the Group’s growth strategy in a cyclical industry while striking the appropriate balance between risk and return.
STraTEgY
SMU
RFIT K
APPA
GR
OU
P An
nu
Al R
epoR
t 20
11
13

iDE
aS
Th
aT
EN
ga
gE
SMU
RFIT K
APPA
GR
OU
P An
nu
Al R
epoR
t 20
11
15
OpEraTiONS rEviEw
SKG’s objective remains one of generating consistently strong margins and returns through the cycle, underpinned by a superior commercial offering, and disciplined capital allocation decisions. In 2011 we significantly enhanced the efficiency of our integrated system, through judicious investments in our european market-facing packaging operations, a major boiler re-build in our piteå kraftliner mill in Sweden, significant rebuilds in our Hoya and Wrexen recycled mills in Germany, the closure of our high cost recycled mill in nanterre, France and the start-up of a greenfield box plant in Mexico.
Furthermore, consistent with its stated objective of expanding its packaging business in higher growth markets, the Group recently concluded two bolt-on acquisitions, in Russia and Argentina respectively.
In the fourth quarter of 2011, we acquired a box plant in St petersburg for €8 million, thereby further increasing our presence in this region. the acquisition in Argentina, completed in early 2012, represents a further expansion and internationalisation of the Group’s growing bag-in-box business. the consideration for the deal was uS$15 million.
europethe europe segment is the larger of the Group’s two segments, accounting for 82% of its revenue in 2011. It comprises primarily our integrated containerboard mills and corrugated operations.
With effect from 1 September 2011, the Group operationally merged its specialties businesses into its existing packaging europe segment (now referred to as “europe”). this reorganisation increases the focus of the Group’s commercial offering, and creates a platform for SKG to become a “one-stop-shop” for paper-based packaging solutions. this initiative will also enhance the Group’s overall cost efficiency, and is expected to contribute to improving the margins of its solid, graphic and carton board businesses.
the Group has facilities in 21 countries, in both Western and eastern europe. the operations consist of 26 mills, 17 of which produce containerboard, and 216 plants, the majority of which produce corrugated packaging products. the mills are supported by a number of recovered fibre collection facilities and some wood procurement operations.
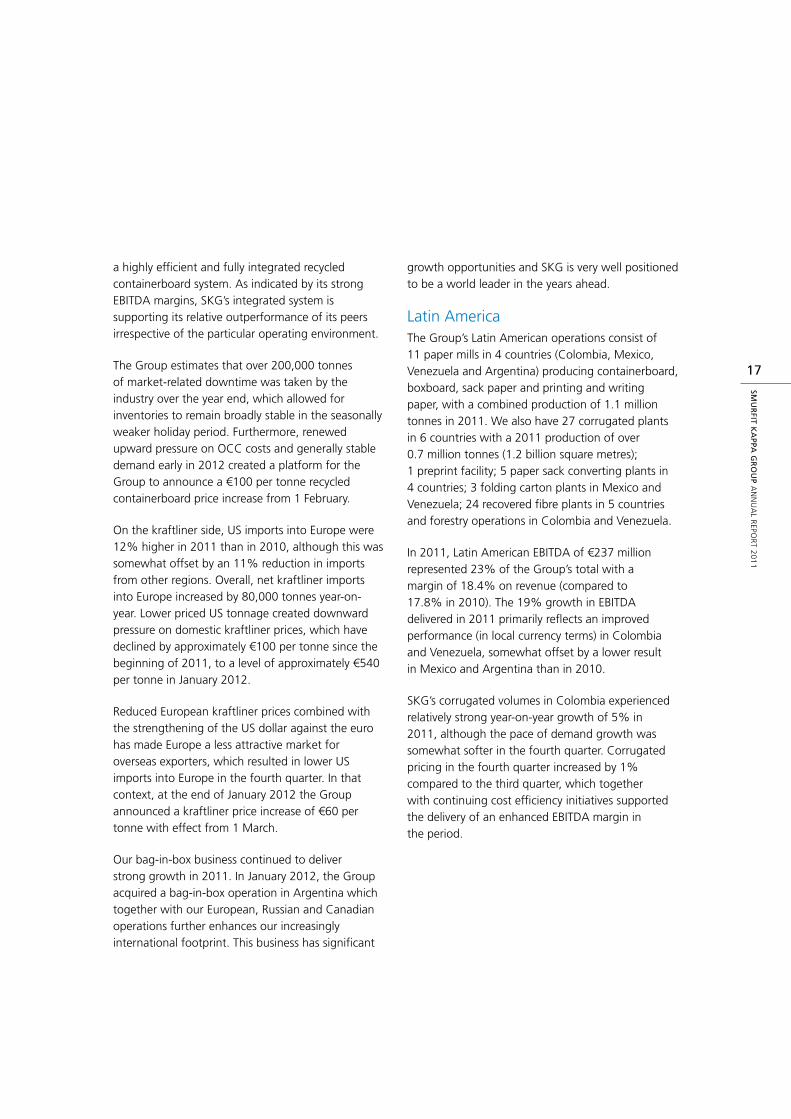
Smurfit Kappa onwell in Sweden was commissioned by the biscuit manufacturers Göteborgs Kex to make a specially-designed package for a large 2.3 kilo pack of Ballerina biscuits, one of Sweden’s favourite biscuit brands. Another Swedish company, Smurfit Kappa lithopac provided the offset lamination.
this giant pack is a prize in a promotion at the liseberg Amusement park in Gothenburg.
the final package is a 22-sided corrugated tube, 80 cm long and 20 cm in diameter, complete with carrying handle, which is easy to open and reseal.
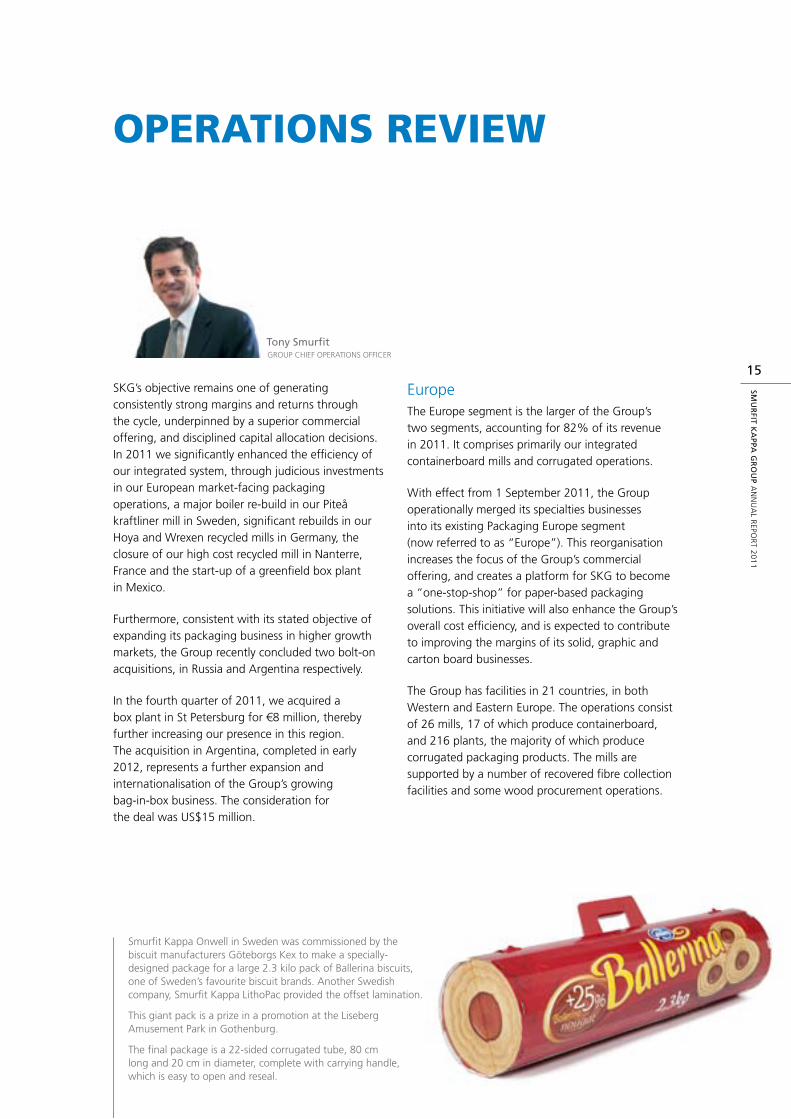
Tony Smurfit GRoup CHIeF opeRAtIonS oFFICeR
our european containerboard mill system consists of three kraftliner mills, in Sweden, France and Austria, which between them produced over 1.4 million tonnes of brown and white kraftliner in 2011, 13 recycled containerboard mills which produced over 2.9 million tonnes of paper and a relatively small mill in Spain which produces both virgin-based machine-glazed paper and recycled containerboard. In addition, we have eight other recycled mills, which together produced approximately 700,000 tonnes of solidboard and boxboard and 200,000 tonnes of graphicboard in 2011. We also have a sack kraft mill in Spain, which produced over 100,000 tonnes of sack kraft paper.
on the conversion side, the operations comprise 109 corrugated plants, which produced approximately 4.2 million tonnes (7.8 billion square metres) in 2011 and 53 sheet plants. In addition, we have 35 plants which produce high end packaging differentiation products such as litho laminated corrugated products, preprint or display units, solidboard-based packaging and bag-in-box – demonstrating the range of potential packaging solutions within our portfolio. We also have a number of other small plants producing paper tubes, pallets, fulfilment activities and other packaging support products.
Revenue for the europe segment in 2011 was €6.1 billion compared to €5.6 billion (as restated to include the former specialties businesses) in 2010. Segmental eBItDA was €812 million, an increase of 11% on 2010’s €731 million.
When including the volumes from acquired operations, the Group’s total corrugated volumes in the full year 2011 were 2% higher than in 2010. on a like-for-like basis however, following the 2% demand growth in the first half, demand for SKG’s corrugated packaging solutions grew by 1% in quarter three, and declined by 2% in quarter four.
As is usual within the Group’s business, it takes three to six months to fully recover higher paper prices in the box prices. As a result, SKG’s box prices were on average 2% higher in the third quarter compared with the second quarter, and remained generally stable through the fourth quarter. For the full year 2011, SKG’s european box prices were on average 11% higher than in 2010.
the recovery of box prices, together with the Group’s strong focus on cost efficiency contributed to deliver a european eBItDA margin of 13.4% in the full year 2011, slightly higher than 2010 levels despite a much tougher operating environment. In 2011 SKG’s european raw material and energy costs were approximately €350 million (or 16%) higher than in 2010.
At industry level, recycled containerboard inventories rose in the third quarter, as most paper producers continued to run at full capacity despite softening demand, in both domestic and export markets. Higher inventory levels led to a €115 per tonne reduction in european recycled containerboard prices during the second half of the year, reaching an absolute level of approximately €380 per tonne in January 2012.
on the raw materials side, downward pressure from european buyers combined with lower Chinese demand, led to a €50 per tonne reduction in oCC prices during the second half of 2011. Although somewhat mitigating the impact of lower paper prices, the reduction in oCC costs was not sufficient to avoid significant margin reduction for non-integrated recycled containerboard producers.
In the case of SKG, following the permanent closure of 10 less efficient containerboard mills since 2005, including the closure of its nanterre mill in France, together with significant investments in its “champion” mills, the Group is equipped with
SMU
RFI
T K
APP
A G
RO
UP
An
nu
Al
Rep
oR
t 2
01
1
16
OpEraTiONS rEviEw[continued]
a highly efficient and fully integrated recycled containerboard system. As indicated by its strong eBItDA margins, SKG’s integrated system is supporting its relative outperformance of its peers irrespective of the particular operating environment.
the Group estimates that over 200,000 tonnes of market-related downtime was taken by the industry over the year end, which allowed for inventories to remain broadly stable in the seasonally weaker holiday period. Furthermore, renewed upward pressure on oCC costs and generally stable demand early in 2012 created a platform for the Group to announce a €100 per tonne recycled containerboard price increase from 1 February.
on the kraftliner side, uS imports into europe were 12% higher in 2011 than in 2010, although this was somewhat offset by an 11% reduction in imports from other regions. overall, net kraftliner imports into europe increased by 80,000 tonnes year-on-year. lower priced uS tonnage created downward pressure on domestic kraftliner prices, which have declined by approximately €100 per tonne since the beginning of 2011, to a level of approximately €540 per tonne in January 2012.
Reduced european kraftliner prices combined with the strengthening of the uS dollar against the euro has made europe a less attractive market for overseas exporters, which resulted in lower uS imports into europe in the fourth quarter. In that context, at the end of January 2012 the Group announced a kraftliner price increase of €60 per tonne with effect from 1 March.
our bag-in-box business continued to deliver strong growth in 2011. In January 2012, the Group acquired a bag-in-box operation in Argentina which together with our european, Russian and Canadian operations further enhances our increasingly international footprint. this business has significant
growth opportunities and SKG is very well positioned to be a world leader in the years ahead.
latin Americathe Group’s latin American operations consist of 11 paper mills in 4 countries (Colombia, Mexico, Venezuela and Argentina) producing containerboard, boxboard, sack paper and printing and writing paper, with a combined production of 1.1 million tonnes in 2011. We also have 27 corrugated plants in 6 countries with a 2011 production of over 0.7 million tonnes (1.2 billion square metres); 1 preprint facility; 5 paper sack converting plants in 4 countries; 3 folding carton plants in Mexico and Venezuela; 24 recovered fibre plants in 5 countries and forestry operations in Colombia and Venezuela.
In 2011, latin American eBItDA of €237 million represented 23% of the Group’s total with a margin of 18.4% on revenue (compared to 17.8% in 2010). the 19% growth in eBItDA delivered in 2011 primarily reflects an improved performance (in local currency terms) in Colombia and Venezuela, somewhat offset by a lower result in Mexico and Argentina than in 2010.
SKG’s corrugated volumes in Colombia experienced relatively strong year-on-year growth of 5% in 2011, although the pace of demand growth was somewhat softer in the fourth quarter. Corrugated pricing in the fourth quarter increased by 1% compared to the third quarter, which together with continuing cost efficiency initiatives supported the delivery of an enhanced eBItDA margin in the period.
SMU
RFIT K
APPA
GR
OU
P An
nu
Al R
epoR
t 20
11
17

FrE
Sh
Th
iNk
iNg
SKG’s corrugated volumes in Venezuela were flat year-on-year in 2011. Continuing high inflation was more than offset by the Group’s operating efficiency actions, as well as necessary price recovery. In July, the Venezuelan authorities issued precautionary measures over a further 7,253 hectares of the Group’s forestry land, with a view to acquiring it and converting its use to food production and related activities. Since the announcement the Venezuelan management team is working hard to find an accommodation that will ensure an optimal outcome for SKG, its customers, its employees and the communities.
Despite a 5% increase in box prices and a continuing focus on operating efficiency, in 2011 SKG’s Mexican eBItDA in local currency terms was lower than in 2010. this primarily reflected significant inflationary pressure and a 1% box volume decline year-on-year. to further improve the efficiency of its Mexican integrated system, SKG is planning a re-build of its main Mexican containerboard machine in Mexico City in the first quarter of 2012.
High inflation continues to prevail in Argentina. As a result, and despite a material increase in SKG’s corrugated prices in 2011, eBItDA margins in the country contracted compared to 2010 levels. Consumer spending power was also affected by rising inflation, as outlined through the 2% reduction in the Group’s corrugated volumes in 2011, a trend that was sustained in the fourth quarter.
Despite some country-specific challenges from time to time, the Group believes that the geographic diversity of its business in the latin American region, together with the proven ability of its local management to drive the business, will continue
to deliver a strong performance through the cycle. latin America remains a target region for SKG’s future growth.
Commercial offering and InnovationIn 2011, SKG secured significant incremental business from key pan-european customers. overall, from 2006 to 2011, the Group’s pan-european business grew by approximately 20% in a broadly stable market, thereby clearly demonstrating the differentiated nature and compatibility of its offering with the needs of globally expanding customers. With approximately 80% of its pan-european business contracted from one to six years, SKG is clearly building long-term sustainable partnerships with its customers.
using the skills and experience acquired in servicing the most demanding of international customers, we have continued to pay special attention to the recruitment and retention of local customers who benefit from best international standards from our businesses.
the Group’s strong commercial success is underpinned by its unique “one-stop-shop” offering, characterised by a broad and expanding geographic footprint, a diversified product range, and unrivalled design and innovation capabilities. on the design side, in 2011 SKG launched an improved version of its “paper-to-box” tool, a major breakthrough in the industry, allowing the definition of fit-for-purpose packaging at an optimised cost for our customers.
SMU
RFIT K
APPA
GR
OU
P An
nu
Al R
epoR
t 20
11
19
SMU
RFIT K
APPA
GR
OU
P An
nu
Al R
epoR
t 20
11
OpEraTiONS rEviEw[continued]
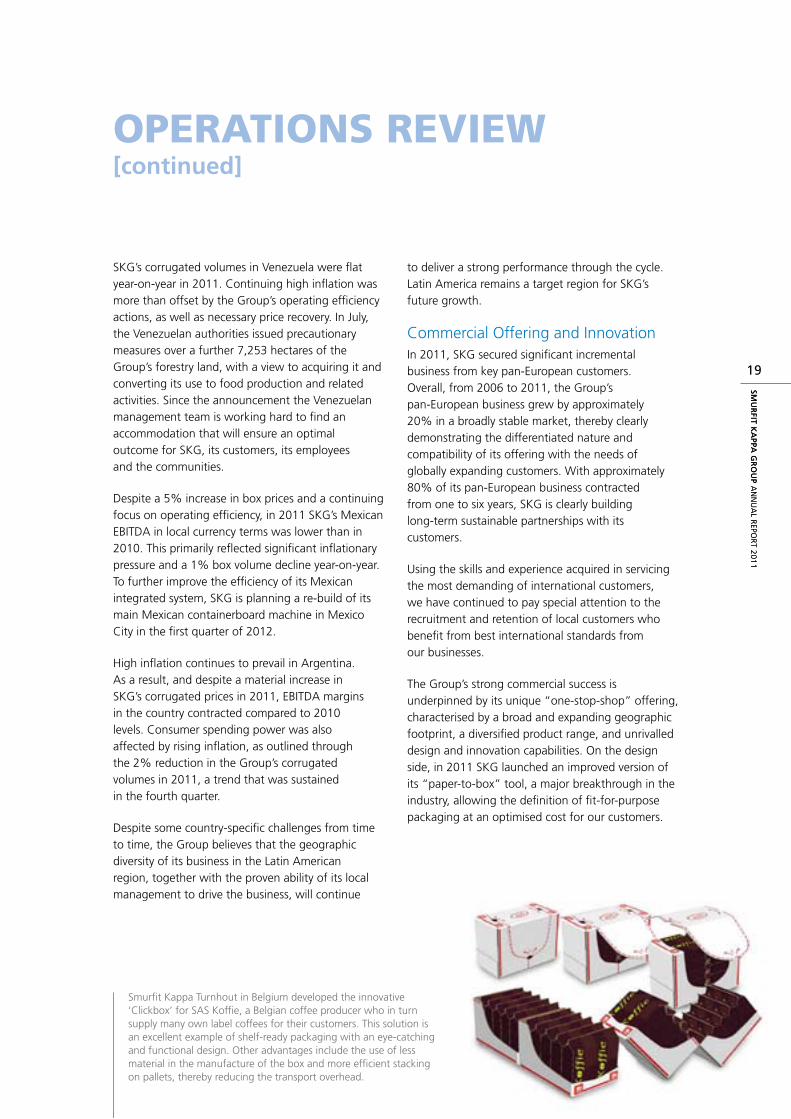
Smurfit Kappa turnhout in Belgium developed the innovative ‘Clickbox’ for SAS Koffie, a Belgian coffee producer who in turn supply many own label coffees for their customers. this solution is an excellent example of shelf-ready packaging with an eye-catching and functional design. other advantages include the use of less material in the manufacture of the box and more efficient stacking on pallets, thereby reducing the transport overhead.
the tool is based on in-depth studies and is calibrated using a benchmark of over fifteen billion packages across all market segments.
on the innovation side, in 2011 SKG introduced a new range of “hybrid packages”, mixing corrugated and solidboard. these unique SKG packaging solutions offer the superior supply chain performance of corrugated combined with the attractive shelf appearance of solidboard. Various FMCG projects have already shown the growth potential of this innovation.
Furthermore, using our extensive expertise in the retail sector, we have developed a patented box perforation called “Sharkline”, which optimises retail ready packaging solutions. this innovation guarantees optimal protection in the supply chain while significantly lowering material costs, thereby offering better value to our customers.
Another of SKG’s unique competitive advantages is its strong drive to support our customers to meet their sustainability agenda, underpinned by an objective to be the first european company able to guarantee that all of its packaging solutions are coming from sustainable sources. As of today, approximately 90% of our mills and 50% of our corrugated operations are already “Chain of Custody” certified under the programme for the endorsement of the Forest Certification (‘peFC’) or the Forest Stewardship Council (‘FSC’), with a target to get to 90% by 2015.
the Group’s initiatives to enhance its innovation and service offering are being recognised by a number of stakeholders. Amongst the awards received were two from the German print association in September 2011, in a competition that included over 300 packaging designs from 90 different companies. During 2011, SKG also received sustainability-related awards from both Coca-Cola enterprises and unilever.
Within our paper operations, we continue to make significant investments in improving our substrates, optimising our raw materials and improving the basic product which assists our packaging innovation and sustainability initiatives. Amongst the new outputs this year have been our “Royal 2000” white top kraftliner offering from our French and Swedish mills. In addition, we commenced production of higher margin recycled white top liners in our Wrexen mill (Germany).
our objective is to have the best integrated paper and board system in europe. Significant investments in 2011 in our piteå, Hoya, Wrexen, nervión and other mill systems have further improved the quality of our products and the efficiency of our production. this relentless focus on sustainability will continue to differentiate our products in the end market.
Similar programmes are in progress in our latin American operations with the objective to achieve international best in class standards in our products, service and systems. In that context, as well as continuing to upgrade our latin American packaging plants, we invested in a greenfield box plant outside Mexico City in response to strong market opportunities. the investment in our Cerro Gordo mill in Mexico City in 2012 will further enhance the quality of our paper in the country.
As in europe, we also continued our programme of progressing our sustainability and efficiency performance with significant investments in our mill systems in Cali, Colombia and in Buenos Aires, Argentina.
our initiatives to enhance our mill system in europe and latin America resulted in SKG being one of only two companies to win two awards at the 2011 ppI (“pulp & paper Industry”) Global awards.
SMU
RFI
T K
APP
A G
RO
UP
An
nu
Al
Rep
oR
t 2
01
1
20
OpEraTiONS rEviEw[continued]
Synergy/Cost take-out programmeAs part of its ongoing commitment to cost take-out and efficiency improvements, SKG commenced a new two-year cost take-out initiative in 2011, with a target to generate a further €150 million of savings by the end of 2012. this programme is based on a detailed bottom-up approach and is subject to a formal reporting system.
SKG generated €100 million of cost take-out benefits in 2011 (including €25 million in quarter four). this strong outcome partially mitigated the impact of materially higher input costs year-on-year, and contributed to the delivery of the Group’s relatively strong eBItDA margin of 13.8% in 2011.
Having exceeded its first year target, SKG is confident that it can improve on its two-year target of €150 million, and is now engaged in re-assessing its areas of opportunity on a bottom-up basis.
SMU
RFIT K
APPA
GR
OU
P An
nu
Al R
epoR
t 20
11
21
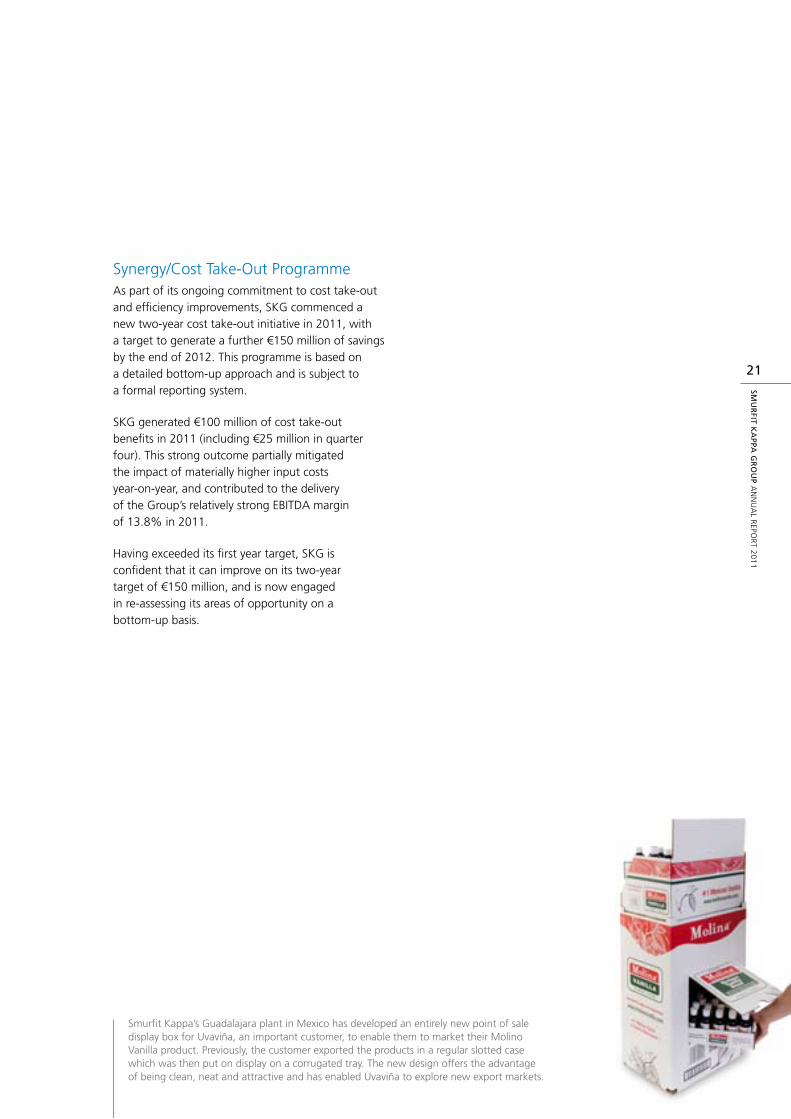
Smurfit Kappa’s Guadalajara plant in Mexico has developed an entirely new point of sale display box for uvaviña, an important customer, to enable them to market their Molino Vanilla product. previously, the customer exported the products in a regular slotted case which was then put on display on a corrugated tray. the new design offers the advantage of being clean, neat and attractive and has enabled uvaviña to explore new export markets.

ma
DE
-TO
-m
Ea
Su
rE
ResultsWith the benefit of volume growth and higher average selling prices, revenue increased by 10% to €7.4 billion in 2011 from €6.7 billion in 2010. the net impact of currency, hyperinflation accounting, acquisitions and disposals was negligible, resulting in a comparable year-on-year increase of over €680 million, the equivalent again of over 10%.
Reflecting the growth achieved in our pan-european business and the increasing contribution from our latin American operations, the Group’s eBItDA of €1,015 million for 2011 was €111 million higher than 2010’s €904 million, representing a year-on-year increase of 12%. In addition, the Group continued to actively manage its cost base with the on-going benefit of cost savings offsetting some of the input cost increases, primarily in respect of raw materials and energy. Currency movements and hyperinflation accounting increased comparable eBItDA by a net €12 million while acquisitions and the absence of certain loss-making operations, which were sold during 2010, added a further €8 million. As a result, comparable eBItDA was €91 million, or 10%, higher year-on-year.
Year-on-year growth in revenue and eBItDA was achieved in both our europe and latin America segments. Although the rate of growth was stronger in latin America, the larger absolute increase was achieved in europe, mainly within the integrated containerboard and corrugated operations.
With the negative impact of higher input costs more than offset by the benefit of corrugated volume growth and higher average selling prices, our margin to revenue in europe increased to 13.4% from 13.2% in 2010. In addition, our bag-in-box business continued to deliver strong growth in 2011 in terms of volume, revenue and earnings.
our latin America segment continued to perform strongly in 2011, achieving growth in both revenue and eBItDA and a margin to revenue of 18.4% compared to 17.8% in 2010. Allowing for the net positive impact of currency moves and hyperinflation accounting, the underlying year-on-year increase in eBItDA was almost 16%.
While the depreciation charge was broadly unchanged year-on-year, the charges for depletion and amortisation were lower in 2011. Reflecting a strong increase in the fair value of our biological assets in Venezuela, the depletion charge was €21 million lower year-on-year while the charge for the amortisation of intangible assets was €16 million lower as certain of the assets were fully amortised. With the benefit of these lower charges in 2011 partly offset by an increase in share-based payments, the year-on-year increase of €111 million in eBItDA was increased to €134 million at the level of pre-exceptional operating profit. Consequently, our pre-exceptional operating profit (eBItDA less depreciation, amortisation and share-based payment expense) was €624 million in 2011 compared to €490 million in 2010.
SMU
RFIT K
APPA
GR
OU
P An
nu
Al R
epoR
t 20
11
23
FiNaNCE rEviEw
Ian Curley GRoup CHIeF FInAnCIAl oFFICeR
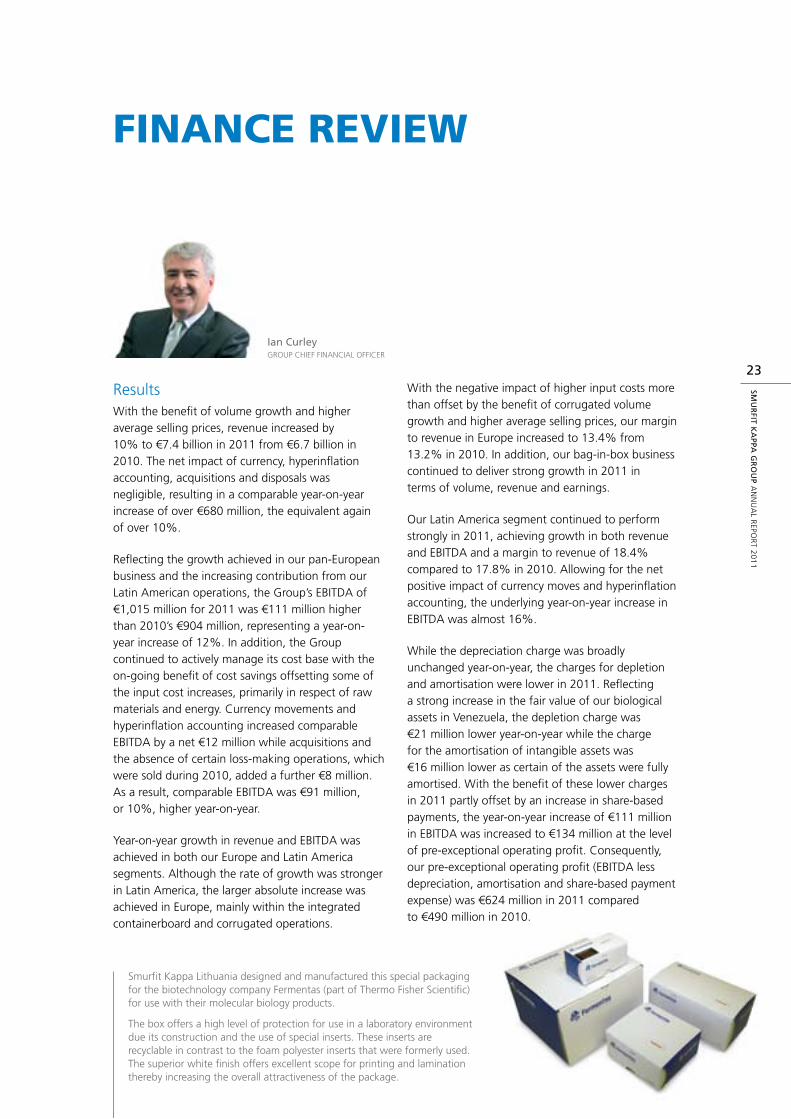
Smurfit Kappa lithuania designed and manufactured this special packaging for the biotechnology company Fermentas (part of thermo Fisher Scientific) for use with their molecular biology products.
the box offers a high level of protection for use in a laboratory environment due its construction and the use of special inserts. these inserts are recyclable in contrast to the foam polyester inserts that were formerly used. the superior white finish offers excellent scope for printing and lamination thereby increasing the overall attractiveness of the package.
our pre-exceptional net finance costs amounted to €301 million (costs of €405 million less income of €104 million) in 2011, compared to €308 million in 2010. the year-on-year decrease of €7 million resulted from the combination of lower cash interest costs and higher non-cash costs (foreign exchange losses and fair value movements on derivatives).
Cash interest amounted to €245 million in 2011 compared to €259 million in 2010. the larger part of the €14 million saving reflected the absence of interest rate swaps, which matured in June 2010 and were no longer required following the €1 billion bond issue in late 2009. We use swaps to reduce the volatility of our cash interest expense by fixing the rates on portions of our floating rate debt. In 2011, we benefited from lower margins on the Senior Credit Facility as a result of our improving leverage as well as from a lower average level of net debt. At €56 million, non-cash interest costs were €7 million higher in 2011 as a result of a negative move in the fair value of derivatives (from a gain in 2010 to a loss in 2011) and a higher hyperinflationary net monetary loss.
Including a profit of €2 million on the disposal of an investment in an associate and the net profit of €2 million from our share of associates’ earnings, the Group’s pre-exceptional profit before income tax was €327 million in 2011 compared to €184 million in 2010.
exceptional Itemsexceptional items charged within operating profit in 2011 amounted to €34 million and primarily related to the closure of the nanterre containerboard mill in France. the charge comprised restructuring costs of €19 million and an impairment loss of €15 million in relation to property, plant and equipment.
the exceptional finance income of €6 million related to the receipt of monies from the liquidator of a former associate company in Spain.
exceptional items, which in total resulted in an operating loss of €81 million in 2010, comprised losses of €17 million on the devaluation of the Venezuelan Bolivar and €64 million relating primarily
to the disposal of loss-making businesses. these losses related to the Mondi asset swap and to the subsequent disposal of our polish paper sack plant and Rol pin, a wood products operation in France. As a result of the asset swap we acquired Mondi’s uK corrugated operations and disposed of our Western european paper sack plants.
profit before Income taxAfter exceptional items, our total profit before income tax amounted to €299 million in 2011, comprising the pre-exceptional profit of €327 million and net exceptional costs of €28 million. the year-on-year increase of €196 million reflected the benefit of both a higher pre-exceptional profit and lower exceptional costs. In 2010, the total profit was €103 million comprising the pre-exceptional profit of €184 million and net exceptional costs of €81 million.
Income tax expensethe accounting tax expense for 2011 was €81 million (comprising a current tax charge of €109 million net of a deferred tax credit of €28 million) compared to €45 million (comprising a current tax charge of €64 million net of a deferred tax credit of €19 million) in 2010. the year-on-year increase reflects a number of factors including an improved earnings performance, the geographical mix of earnings and the impact of additional minimum taxes. In addition, the current tax expense includes €23 million in respect of an equity tax introduced in Colombia. Although this tax is payable over four years, under IFRS it is required to be fully expensed in 2011.
earnings per Sharethe basic earnings per share amounted to 93.0 cent in 2011 compared to 22.9 cent in 2010. on a diluted basis, our earnings per share in 2011 amounted to 91.1 cent compared to 22.5 cent in 2010.
on a pre-exceptional basis, our earnings per share in 2011 amounted to 100.1 cent compared to 59.4 cent in 2010.
SMU
RFI
T K
APP
A G
RO
UP
An
nu
Al
Rep
oR
t 2
01
1
24
FiNaNCE rEviEw[continued]
the earnings per share figures are calculated on the basis of the weighted average number of ordinary shares in issue during the year, which was
221,543,000 in 2011 compared to 218,655,000 in 2010. ordinary shares in issue at 31 December 2011 amounted to 221,863,000 (2010: 220,064,000).
SMU
RFIT K
APPA
GR
OU
P An
nu
Al R
epoR
t 20
11
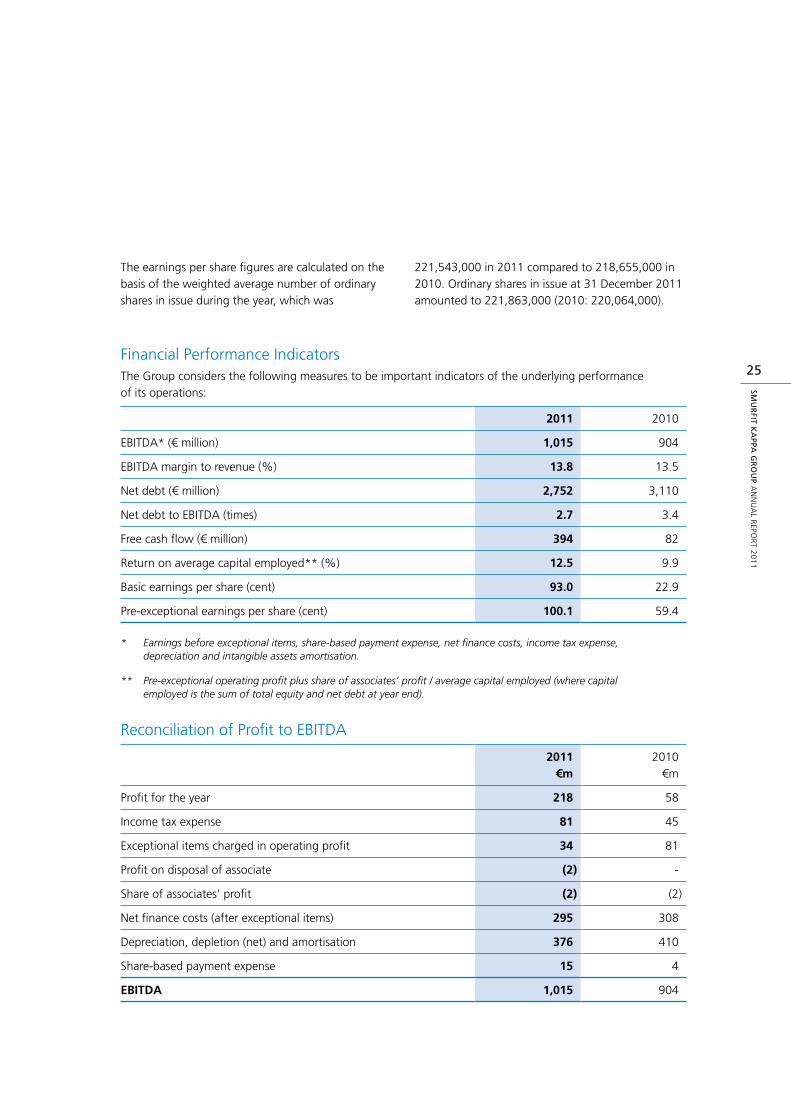
25Financial performance Indicatorsthe Group considers the following measures to be important indicators of the underlying performance of its operations:
2011 2010
eBItDA* (€ million) 1,015 904
eBItDA margin to revenue (%) 13.8 13.5
net debt (€ million) 2,752 3,110
net debt to eBItDA (times) 2.7 3.4
Free cash flow (€ million) 394 82
Return on average capital employed** (%) 12.5 9.9
Basic earnings per share (cent) 93.0 22.9
pre-exceptional earnings per share (cent) 100.1 59.4
* Earnings before exceptional items, share-based payment expense, net finance costs, income tax expense, depreciation and intangible assets amortisation.
** Pre-exceptional operating profit plus share of associates’ profit / average capital employed (where capital employed is the sum of total equity and net debt at year end).
Reconciliation of profit to eBItDA
2011€m
2010€m
profit for the year 218 58
Income tax expense 81 45
exceptional items charged in operating profit 34 81
profit on disposal of associate (2) -
Share of associates’ profit (2) (2)
net finance costs (after exceptional items) 295 308
Depreciation, depletion (net) and amortisation 376 410
Share-based payment expense 15 4
EBITDA 1,015 904
n EBITDA and EBITDA Margin
the Group uses eBItDA as a measure of the relative performance of its operations both over time and in comparison to its peer group. In addition, we believe that eBItDA provides useful information to investors because it is frequently used by securities analysts, lenders and others in their evaluation of companies. In addition, management believes that eBItDA provides a transparent measure of our recurring performance and allows management to readily view operating trends, perform analytical comparisons and identify strategies to improve operating performance.
eBItDA increased by 12% to €1,015 million in 2011 from €904 million in 2010. Allowing for the impact of currency, hyperinflation accounting, acquisitions and disposals, the underlying year-on-year increase in eBItDA was 10%. eBItDA represented a margin of 13.8% of revenue in 2011 compared to 13.5% in 2010.
n Net Debt to EBITDA
leverage is an important measure of our overall financial performance. net debt amounted to €2,752 million at December 2011 compared to €3,110 million at December 2010.
With the combination of lower debt and eBItDA growth, our leverage decreased from 3.4x at December 2010 to 2.7x at December 2011.
n Free Cash Flow
Free cash flow (‘FCF’) is shown in our summary cash flow, the format of which was developed in order to show the cash generated by our operations and the overall change in our net borrowings. Free cash flow is the result of the cash inflows and outflows from our operating activities, and is before those arising from acquisition and disposal activities. We use free cash flow to assess and understand the total operating performance of the business and to identify underlying trends.
the Group’s free cash flow performance of €394 million in 2011 clearly demonstrates its cash flow generation capability through the cycle. Compared to €82 million in 2010, our improved cash flow performance in 2011 reflects eBItDA growth of €111 million combined with a significant reduction in working capital and a lower cash interest expense.
n Return on Capital Employed
With the benefit of an increase of 27% in our pre-exceptional operating earnings, the Group’s return on capital employed (‘RoCe’) rose to 12.5% in 2011 from 9.9% in 2010.
our average net debt was lower in 2011 than in 2010, while total equity was higher as a result of the strong earnings growth in the two years. As a result, our average level of capital employed was slightly higher in 2011 than in 2010.
n Basic Earnings per Share
earnings per share (‘epS’) serves as an indicator of a company’s profitability and, in conjunction with other metrics such as return on capital employed, of a company’s financial strength. Given the reduction in the Group’s net debt level and, consequently, its leverage, epS becomes an increasingly important measure for the Group.
the Group’s basic epS increased to 93.0 cent in 2011 from 22.9 cent in 2010. In 2009, we reported a loss per share of 55.8 cent.
Cash Generationthe Group generated free cash flow of €394 million in 2011 compared to €82 million in 2010. the year-on-year increase of €312 million reflected primarily a combination of strong eBItDA growth, a working capital inflow rather than an outflow, lower cash interest and a lower outflow for capital expenditure (including the move in capital creditors).
SMU
RFI
T K
APP
A G
RO
UP
An
nu
Al
Rep
oR
t 2
01
1
26
FiNaNCE rEviEw[continued]
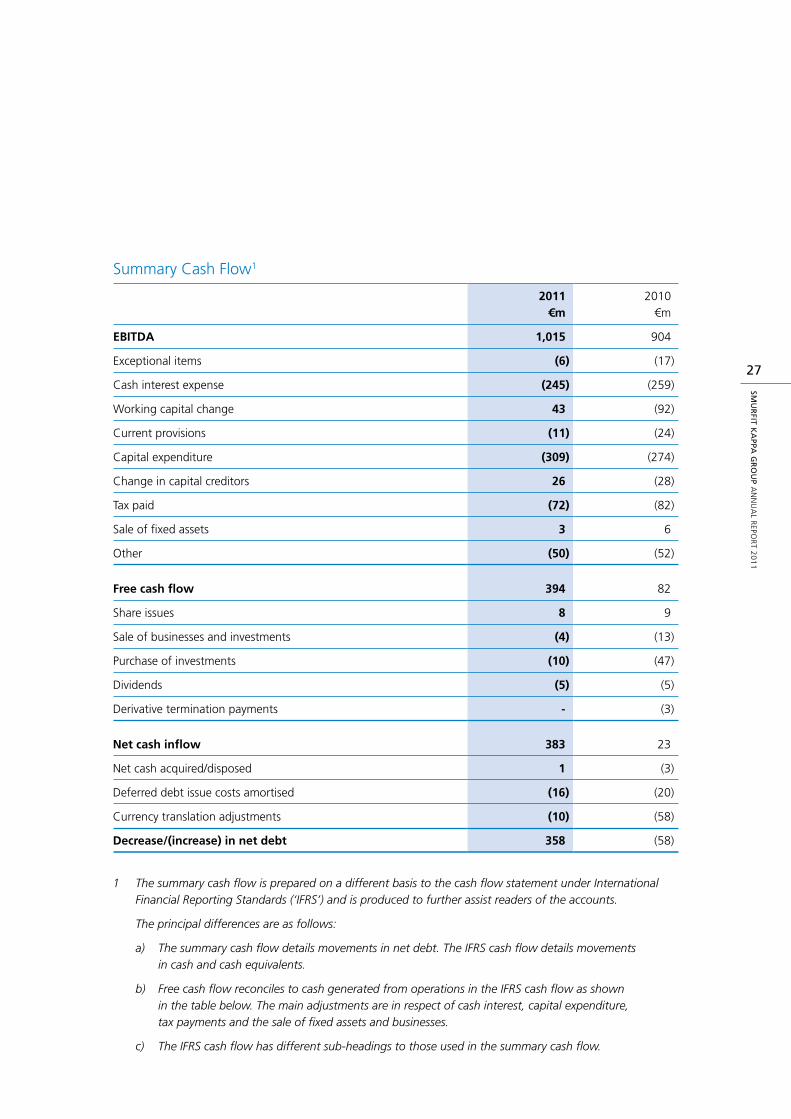
Summary Cash Flow1
2011€m
2010€m
EBITDA 1,015 904
exceptional items (6) (17)
Cash interest expense (245) (259)
Working capital change 43 (92)
Current provisions (11) (24)
Capital expenditure (309) (274)
Change in capital creditors 26 (28)
tax paid (72) (82)
Sale of fixed assets 3 6
other (50) (52)
Free cash flow 394 82
Share issues 8 9
Sale of businesses and investments (4) (13)
purchase of investments (10) (47)
Dividends (5) (5)
Derivative termination payments - (3)
Net cash inflow 383 23
net cash acquired/disposed 1 (3)
Deferred debt issue costs amortised (16) (20)
Currency translation adjustments (10) (58)
Decrease/(increase) in net debt 358 (58)
1 The summary cash flow is prepared on a different basis to the cash flow statement under International Financial Reporting Standards (‘IFRS’) and is produced to further assist readers of the accounts.
The principal differences are as follows:
a) The summary cash flow details movements in net debt. The IFRS cash flow details movements in cash and cash equivalents.
b) Free cash flow reconciles to cash generated from operations in the IFRS cash flow as shown in the table below. The main adjustments are in respect of cash interest, capital expenditure, tax payments and the sale of fixed assets and businesses.
c) The IFRS cash flow has different sub-headings to those used in the summary cash flow.
SMU
RFIT K
APPA
GR
OU
P An
nu
Al R
epoR
t 20
11
27
the working capital move in 2011 was an inflow of €43 million, compared to an outflow of €92 million in 2010. the positive swing of €135 million largely reflected the different market conditions pertaining in the two years and the benefit of improved creditor terms. While market conditions weakened over the course of 2011 resulting in downward pressure on paper prices, 2010 was characterised by a combination of strengthening demand, higher prices and raw material costs. Working capital amounted to €517 million at December 2011, representing 7.1% of annualised revenue. Working capital of €584 million at December 2010 represented 8.4% of annualised revenue.
At €309 million in 2011, capital expenditure was €35 million higher than 2010’s €274 million and equated to 89% of depreciation compared to 75% in 2010. Although expenditure in terms of fixed
asset additions was higher in 2011 than in 2010, this was more than offset by a positive swing of €54 million in the move in capital creditors from an outflow in 2010 to an inflow in 2011. As a result, capital outflows in total were €19 million lower year-on-year.
Cash interest amounted to €245 million in 2011 compared to €259 million in 2010, with the saving reflecting a significant reduction in the level of interest rate swaps, lower margins on the Senior Credit Facility as a result of our improving leverage and the benefit of a lower average level of net debt.
the outflow of €11 million in respect of current provisions relates to amounts charged in prior years and includes the payment of reorganisation and restructuring costs.
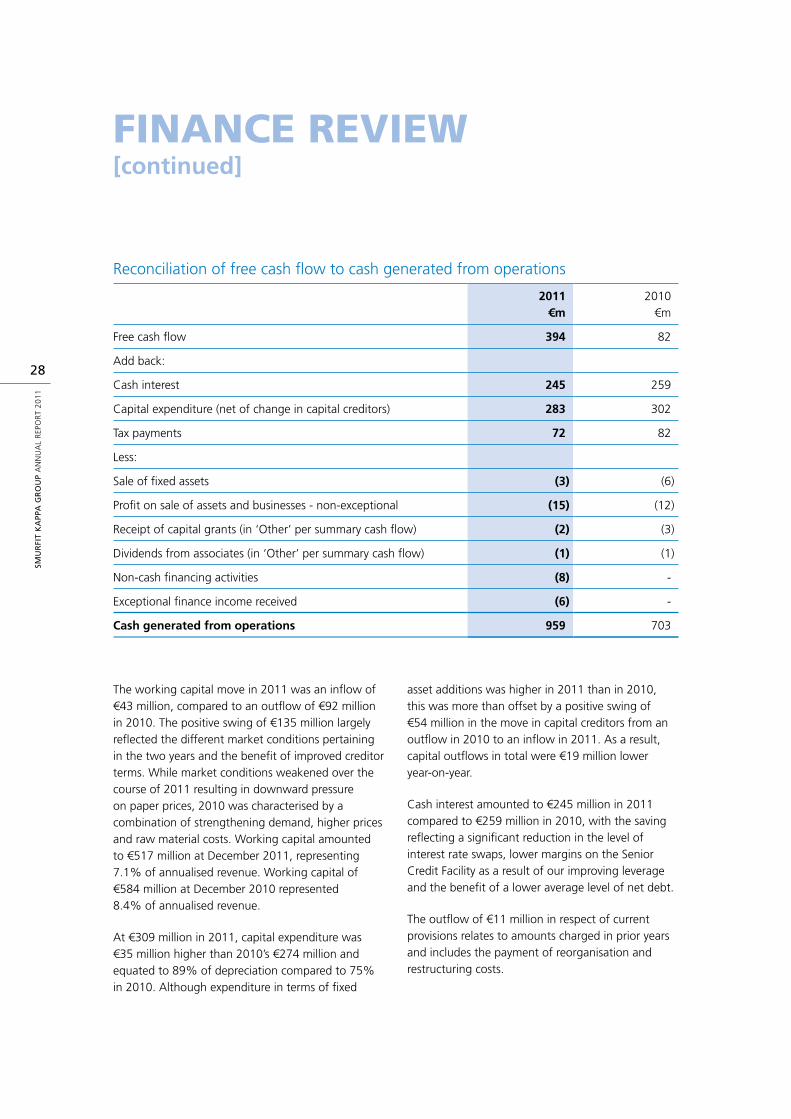
Reconciliation of free cash flow to cash generated from operations
2011€m
2010€m
Free cash flow 394 82
Add back:
Cash interest 245 259
Capital expenditure (net of change in capital creditors) 283 302
tax payments 72 82
less:
Sale of fixed assets (3) (6)
profit on sale of assets and businesses - non-exceptional (15) (12)
Receipt of capital grants (in ‘other’ per summary cash flow) (2) (3)
Dividends from associates (in ‘other’ per summary cash flow) (1) (1)
non-cash financing activities (8) -
exceptional finance income received (6) -
Cash generated from operations 959 703
SMU
RFI
T K
APP
A G
RO
UP
An
nu
Al
Rep
oR
t 2
01
1
28
FiNaNCE rEviEw[continued]
At €72 million in 2011, our tax payments were €10 million lower year-on-year, partly reflecting the absence of approximately €5 million of non-recurring items which arose in 2010, somewhat offset by the impact of higher underlying payments in 2011 as a result of improved earnings. other net outflows at €50 million, which related mainly to employee benefits, were €2 million lower than in 2010.
At €11 million in 2011, the net investment and financing outflow was modest compared to 2010’s €59 million, which related primarily to the asset swap. the cash outflows in 2011 included €10 million in respect of the purchase of investments, primarily the St. petersburg box plant acquired in the fourth quarter, and €4 million in respect of the sale of businesses and investments. this net outflow included a deferred payment in respect of Rol pin, our French wood products business sold in late 2010, and the proceeds from the sale of our shareholding in a Dutch recycling business. this sale generated a profit of €2 million, which is shown on the Group Income Statement as “profit on disposal of associate”.
the outflows in 2010 related primarily to the Mondi asset swap and to the disposal of our polish paper sack and Rol pin businesses. the outflow of €13 million in respect of disposals comprised the payment to Mondi to take on the loss-making paper sack plants and the initial amount paid under the agreement with the buyers of Rol pin, the remainder being deferred to 2011. the outflow of €47 million in respect of purchases represented (together with transaction costs) primarily the amount paid to Mondi for the corrugated plants acquired under the asset swap agreement.
After investment and financing cash movements, the net cash inflow for 2011 was €383 million compared to €23 million in 2010. the strong year-on-year increase reflects the combination of a significantly
higher free cash flow and a lower net outflow for investment and financing activities.
the reconciliation of the net cash inflow to the decrease in net debt includes certain non-cash items. For 2011, these comprise €16 million in respect of the amortisation of debt issue costs and negative currency translation adjustments on net debt of €10 million. In addition, we took on cash of €1 million as part of the acquisition of the St. petersburg plant.
the negative currency translation adjustments of €10 million related mainly to our uS dollar denominated debt. In 2010, in addition to reflecting the impact of the relative weakness of the euro, the negative translation adjustments of €58 million included a loss of approximately €26 million on our Bolivar denominated net cash balances as a result of January’s devaluation.
In total, the Group’s net debt decreased by €358 million in 2011 to €2,752 million compared to €3,110 million at the start of the year. In 2010, with a lower free cash flow, a higher net outflow from investment and financing activities and a larger negative currency move, net debt increased by €58 million.
Capital Resources and liquidityAt December 2011, committed facilities (excluding short-term sundry bank loans and overdrafts) amounted to €4,148 million, of which €3,579 million was utilised at December 2011. the weighted average period until maturity of the undrawn element of these facilities was 1.8 years. our debt portfolio is well structured and has a relatively long-term maturity profile. As at December 2011, our nearest significant debt maturity was towards the end of 2013, when tranche B of the Senior Credit Facility matures.
SMU
RFIT K
APPA
GR
OU
P An
nu
Al R
epoR
t 20
11
29
notwithstanding the absence of any material short-term debt maturities, the Group announced on 8 February 2012 that it was seeking the consent of its lenders to amend its Senior Credit Facility Agreement, in order to further extend its debt maturity profile and enhance its overall financial flexibility. the key amendment requests were to 1) extend the maturity of the Group’s term loans B and C to 2016 and 2017 respectively, 2) extend the maturity of the Revolving Credit Facility (‘RCF’) to 2016, and 3) seek flexibility to raise longer dated secured bonds, as and when market conditions are considered optimal, in order to refinance its existing facilities.
the Group offered to pay each consenting and extending term loan B and C lender an upfront fee of 50 basis points (‘bps’), and a margin increase of 50bps at current leverage levels. extending lenders were also offered a 20% cash prepayment to be funded from existing cash balances. Consenting and extending RCF lenders were offered an upfront fee of 65bps, an increased commitment fee and a margin increase on drawn amounts.
the Group received a very positive response to its consent request with lenders comprising 98% of the Facility consenting to the proposed amendments – the minimum required level of consents was 662/3%. lenders holding 90% of term loans B and C and 77% of the Revolving Credit Facilities elected to extend their commitments. the amendments became effective on 1 March 2012.
In november 2010, the Group successfully completed a €250 million five year trade receivables securitisation programme, further extending the Group’s maturity profile and contributing to its diversity of funding sources. proceeds were primarily used to refinance the Group’s existing €210 million securitisation programme which had a September 2011 maturity.
the weighted average interest rate on our gross debt was 6.56% at December 2011, compared to 6.54% at December 2010. the marginal year-on-year increase reflects the impact of higher interest rates on our floating rate debt offset by the effect of a reduction in margin on tranche A of the Senior Credit Facility in early 2011 arising from improved leverage.
the Group’s primary sources of liquidity are cash flow from operations and borrowings under the RCF. the Group’s primary uses of cash are for debt service and capital expenditure.
Market Risk and Risk Management policiesthe Board of Directors sets the Group’s treasury policies and objectives, which include controls over the procedures used to manage financial market risks. these are set out in detail in note 26 to the Consolidated Financial Statements.
the Group is exposed to the impact of interest rate changes and foreign currency fluctuations due to its investing and funding activities and its operations in different foreign currencies. Interest rate risk exposure is managed by achieving an appropriate balance of fixed and variable rate funding. At 31 December 2011, the Group had fixed an average of 75% of the interest cost on its borrowings over the following twelve months.
our fixed rate debt comprised mainly €500 million 7.25% senior secured notes due 2017, €500 million 7.75% senior secured notes due 2019, €217.5 million 7.75% senior subordinated notes due 2015, uS$200 million 7.75% senior subordinated notes due 2015 and uS$292.3 million 7.50% senior debentures due 2025. In addition, the Group also has €1,110 million in interest rate swaps with maturity dates ranging from April 2012 to July 2014.
SMU
RFI
T K
APP
A G
RO
UP
An
nu
Al
Rep
oR
t 2
01
1
30
FiNaNCE rEviEw[continued]
our earnings are affected by changes in short-term interest rates as a result of our floating rate borrowings. If lIBoR interest rates for these borrowings increase by one percent, our interest expense would increase, and profit before income tax would decrease, by approximately €10 million over the following twelve months. Interest income on our cash balances would increase by approximately €9 million assuming a one percent increase in interest rates earned on such balances over the following twelve months.
the Group uses foreign currency borrowings, currency swaps, options and forward contracts in the management of its foreign currency exposures.
SMU
RFIT K
APPA
GR
OU
P An
nu
Al R
epoR
t 20
11
31
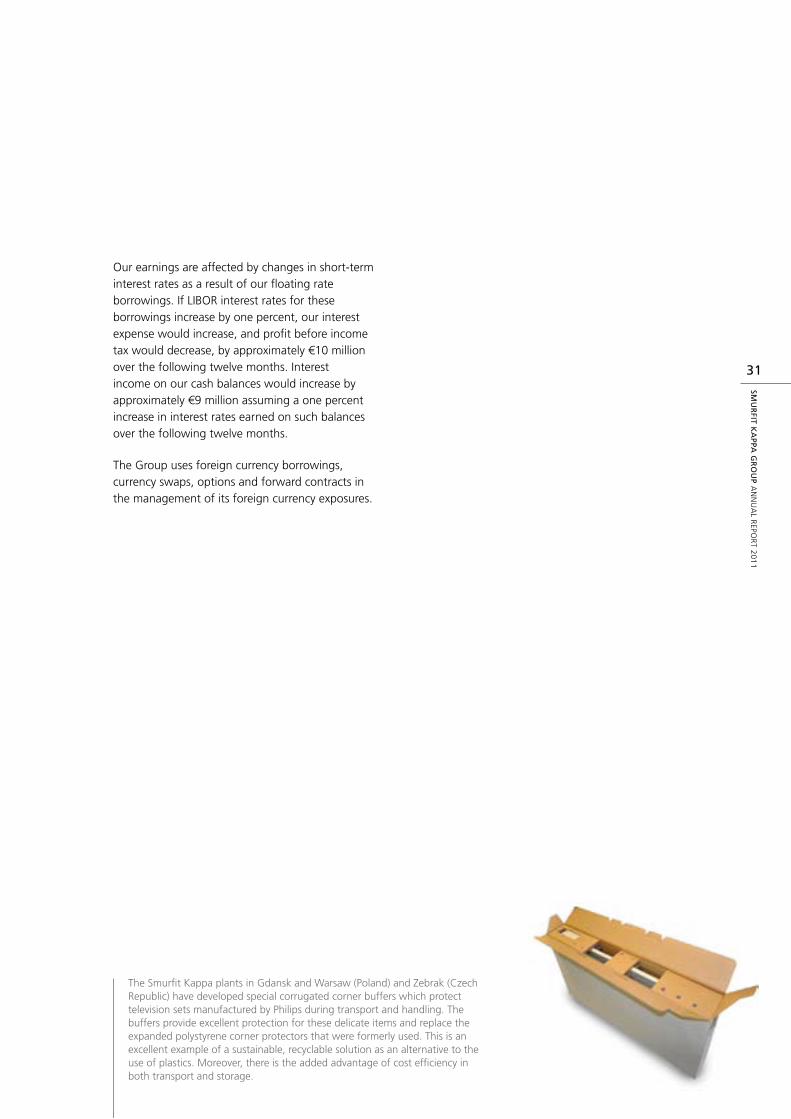
the Smurfit Kappa plants in Gdansk and Warsaw (poland) and Zebrak (Czech Republic) have developed special corrugated corner buffers which protect television sets manufactured by philips during transport and handling. the buffers provide excellent protection for these delicate items and replace the expanded polystyrene corner protectors that were formerly used. this is an excellent example of a sustainable, recyclable solution as an alternative to the use of plastics. Moreover, there is the added advantage of cost efficiency in both transport and storage.

EY
E-C
aTC
hiN
g
SO
luTi
ON
S
SMU
RFIT K
APPA
GR
OU
P AN
NU
AL R
EPOR
T 20
11
33
Sustainable Development ReportSKG regards sustainability as a central part of its business strategy. SKG’s mission is to be a customer oriented, market-led company where the satisfaction of customers, the personal development of employees and respect for local communities and the environment are seen as being inseparable from the aim of optimising value for the shareholders.
Sustainability is concerned with ensuring that the human and natural environment with which SKG interacts are protected both today and into the future as it continues to use a wide range of such resources in meeting its business objectives. SKG is determined to manage its business in a way which recognises its responsibilities in all aspects of corporate social responsibility and the wider environment.
SKG published its fourth annual Sustainable Development Report in June 2011 and it is available on the Group’s website at www.smurfitkappa.com. It includes details of the principles by which the Group abides in its interaction with key areas of the environment, social development (including health and safety) and business development. An overview of our performance in 2010 was included in the report. Also an overview of SKG’s long-term sustainability commitments was included outlining our commitment to continued progress and performance improvement in the areas which we have identified as specifically underpinning the concept of sustainability. Using the guidelines issued by the Global Reporting Initiative (‘GRI’) we improved
transparency of our reporting by increasing the application level of our reporting to GRI A+. We also engaged KPMG for the second consecutive year to undertake external assurance on a number of key environmental indicators. SKG will continue to drive the sustainability agenda and its objective is to improve its performance every year. A further Sustainable Development Report will be issued later this year, which will advance SKG’s commitments in this area.
We have created specific policy statements on key areas of sustainability and they are integral in the drive to improve SKG’s performance going forward. These policy statements cover the Environment, Sustainable Forestry, Social Citizenship and Health and Safety. These policies have been added to those already in place covering Good Faith Reporting, a Code of Business Conduct, a Code of Ethics for Senior Financial Officers, a Group Financial Reporting Guide, a Group Treasury Policy, a Financial Monitoring Policy, a Treasury Compliance Programme, and a Competition Compliance Programme.
A report on Corporate Governance is detailed on pages 38 to 48 of this Annual Report and a short overview on SKG’s performance in the other key areas now follows.
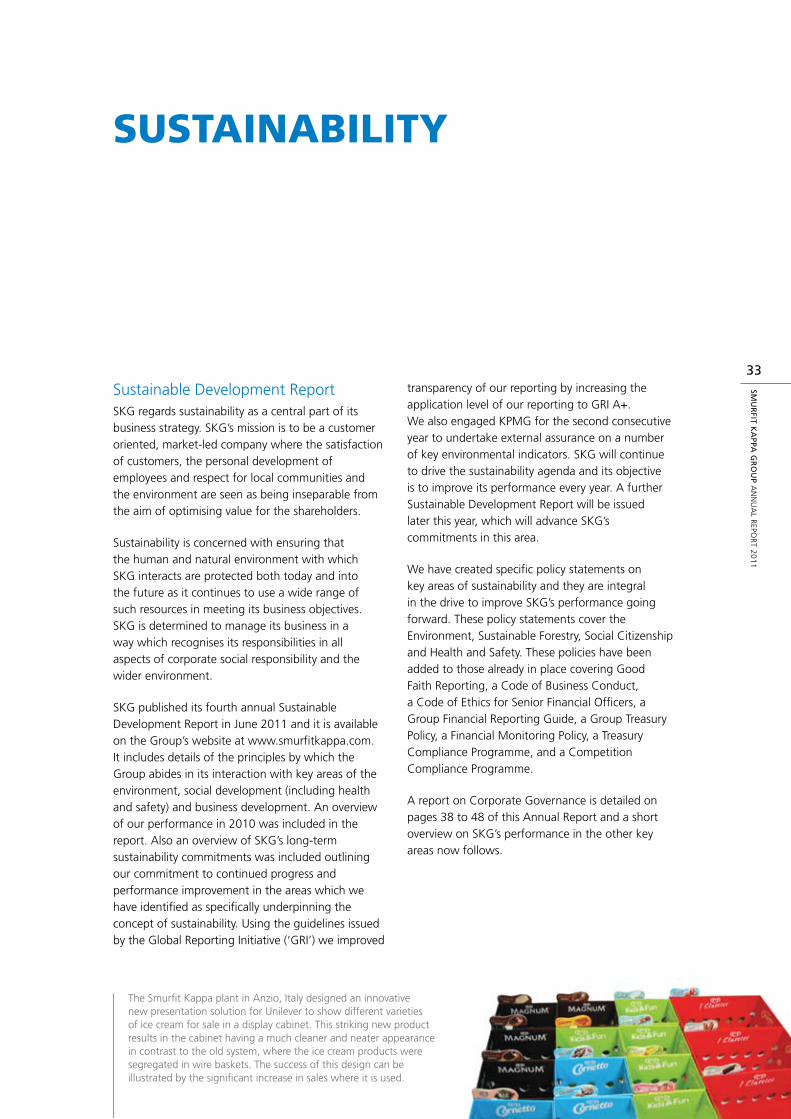
SUSTAINABILITY
The Smurfit Kappa plant in Anzio, Italy designed an innovative new presentation solution for Unilever to show different varieties of ice cream for sale in a display cabinet. This striking new product results in the cabinet having a much cleaner and neater appearance in contrast to the old system, where the ice cream products were segregated in wire baskets. The success of this design can be illustrated by the significant increase in sales where it is used.
Social CitizenshipSKG conducts a large part of its commitment to corporate social responsibility under the heading of Social Citizenship. SKG is committed to managing its business in accordance with its declared values which recognise that good social citizenship, reflected in the manner in which it interacts with its employees, business partners and local communities, is an essential ingredient in creating and maintaining a sustainable future.
SKG applies the principles of respect for human rights, freedom of association, fair compensation, and diversity regardless of age, gender, sexual orientation, ethnic origin, disability or nationality. Merit is the key determinant in recruitment and promotion.
SKG values open, constructive, regular and timely dialogue with its employees and their representatives, particularly in all matters affecting the business including safety, working conditions, profitability, business outlook, investment decisions or the terms and conditions of employment.
Implementing SKG’s Social Citizenship policy is the responsibility of line management who are supported by the Human Resource Managers at country, segment and Group level.
SKG trains and develops its employees through various programmes that vary from language skills training to horizontal knowledge sharing and from sales training to advanced management development programmes.
the european Works Council (‘eWC’), which was created to assist in the development of an open two way communication process for all employees on all such matters, had one meeting during the year, with the Select Committee of the eWC meeting on four
occasions. Matters typically discussed at the eWC include employment opportunities, financial status, projected developments, business conditions, relocation, curtailment or business closures and health and safety.
Community participation is encouraged by SKG and this very important element of social citizenship is practiced at local plant level where managers are best positioned to positively contribute and support worthy local causes. In Ireland the Group supports the Ceo in his role as Chairman of the Barnardos “leaving poverty through learning” Campaign for seriously disadvantaged children.
Health and Safetythe SKG policy states that:
“Smurfit Kappa Group will conduct its activities in a responsible manner, taking care of the health, safety and welfare of everyone affected by its activities and minimising the impact of the business on the environment. It will be an integral part of the business activities and will promote adherence to the highest standards of safety in the operation of our facilities.”
SKG maintains management systems that help to protect employees, visitors to its sites, contractors and the public at large from injury.
All performance reviews at plant, country, division and regional level include safety performance as a key part of the reviews. A report and update on health and safety is given to the Board each quarter.
the Group has drawn up a written document covering an extensive list of Health and Safety Standards which together with the policy document has been issued to every SKG site and made available to every employee via notice boards, intranet and other appropriate media.
SMU
RFI
T K
APP
A G
RO
UP
An
nu
Al
Rep
oR
t 2
01
1
34
SuSTaiNaBiliTY[continued]
the implementation of these standards is audited on a continuous basis and health and safety committees exist at all operating sites with broad-based representation of individuals and employees.
environmentthe principles SKG applies in terms of the environment include:
n Complying with national and international environmental legislation and seeking to achieve best practice through benchmarking and the promotion of continuous improvement programmes.
n Developing appropriate environmental management systems that continue to question the status quo thereby helping to reduce any negative impacts on the environment.
n Continuing focus on the efficient use of natural resources.
n Meeting reasonable stakeholder expectations on environmental performance in forestry, product manufacture, distribution and end use.
noteworthy highlights were:
n In europe, 100% of our mill system is now Chain of Custody certified under the Forestry Stewardship Council or the programme for the endorsement of Forest Certification.
n Significant progress was made in the Chain of Custody certification process of our converting operations in europe and is now at 46%.
n In latin America, our three paper mills in Mexico were certified under the ISo 14001 (environmental Management Systems) and as a consequence 55% of our mill system is now certified under ISo 14001.
n In 2011 SKG’s work, support and partnership with customers in the area of sustainability was recognised by some of our largest brand name customers notably Coca-Cola enterprises and unilever.
the Sustainable Development Report also discusses what we consider to be the key environmental challenges and risks for our Group and our industry. these concerns focus on the subjects of water, fibre availability and energy. All three areas are fundamental to our processes/products and we strongly support the sustainable deployment of these scarce resources provided a resource hierarchy and a global level playing field are guaranteed.
SMU
RFIT K
APPA
GR
OU
P An
nu
Al R
epoR
t 20
11
35
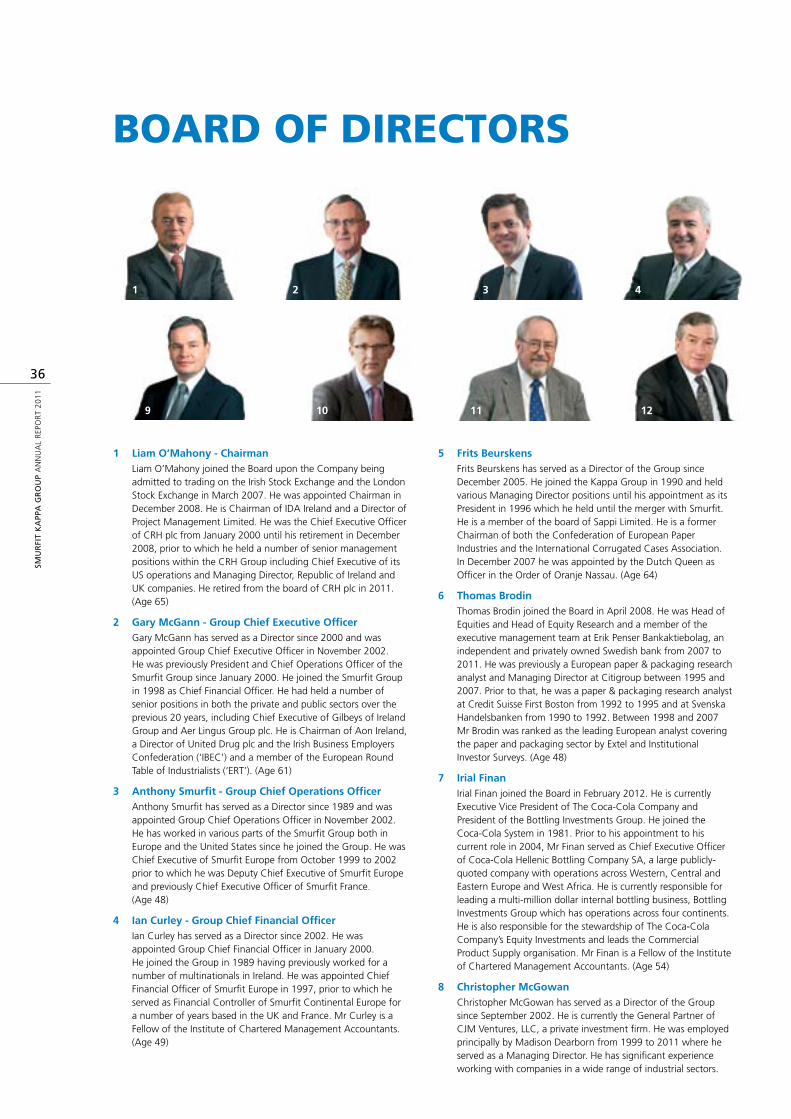
BOarD OF DirECTOrS
SMU
RFI
T K
APP
A G
RO
UP
An
nu
Al
Rep
oR
t 2
01
1
36
1 Liam O’Mahony - Chairman liam o’Mahony joined the Board upon the Company being
admitted to trading on the Irish Stock exchange and the london Stock exchange in March 2007. He was appointed Chairman in December 2008. He is Chairman of IDA Ireland and a Director of project Management limited. He was the Chief executive officer of CRH plc from January 2000 until his retirement in December 2008, prior to which he held a number of senior management positions within the CRH Group including Chief executive of its uS operations and Managing Director, Republic of Ireland and uK companies. He retired from the board of CRH plc in 2011. (Age 65)
2 Gary McGann - Group Chief Executive Officer Gary McGann has served as a Director since 2000 and was
appointed Group Chief executive officer in november 2002. He was previously president and Chief operations officer of the Smurfit Group since January 2000. He joined the Smurfit Group in 1998 as Chief Financial officer. He had held a number of senior positions in both the private and public sectors over the previous 20 years, including Chief executive of Gilbeys of Ireland Group and Aer lingus Group plc. He is Chairman of Aon Ireland, a Director of united Drug plc and the Irish Business employers Confederation (‘IBeC’) and a member of the european Round table of Industrialists (‘eRt’). (Age 61)
3 Anthony Smurfit - Group Chief Operations Officer Anthony Smurfit has served as a Director since 1989 and was
appointed Group Chief operations officer in november 2002. He has worked in various parts of the Smurfit Group both in europe and the united States since he joined the Group. He was Chief executive of Smurfit europe from october 1999 to 2002 prior to which he was Deputy Chief executive of Smurfit europe and previously Chief executive officer of Smurfit France. (Age 48)
4 Ian Curley - Group Chief Financial Officer Ian Curley has served as a Director since 2002. He was
appointed Group Chief Financial officer in January 2000. He joined the Group in 1989 having previously worked for a number of multinationals in Ireland. He was appointed Chief Financial officer of Smurfit europe in 1997, prior to which he served as Financial Controller of Smurfit Continental europe for a number of years based in the uK and France. Mr Curley is a Fellow of the Institute of Chartered Management Accountants. (Age 49)
5 Frits Beurskens Frits Beurskens has served as a Director of the Group since
December 2005. He joined the Kappa Group in 1990 and held various Managing Director positions until his appointment as its president in 1996 which he held until the merger with Smurfit. He is a member of the board of Sappi limited. He is a former Chairman of both the Confederation of european paper Industries and the International Corrugated Cases Association. In December 2007 he was appointed by the Dutch Queen as officer in the order of oranje nassau. (Age 64)
6 Thomas Brodin thomas Brodin joined the Board in April 2008. He was Head of
equities and Head of equity Research and a member of the executive management team at erik penser Bankaktiebolag, an independent and privately owned Swedish bank from 2007 to 2011. He was previously a european paper & packaging research analyst and Managing Director at Citigroup between 1995 and 2007. prior to that, he was a paper & packaging research analyst at Credit Suisse First Boston from 1992 to 1995 and at Svenska Handelsbanken from 1990 to 1992. Between 1998 and 2007 Mr Brodin was ranked as the leading european analyst covering the paper and packaging sector by extel and Institutional Investor Surveys. (Age 48)
7 Irial Finan Irial Finan joined the Board in February 2012. He is currently
executive Vice president of the Coca-Cola Company and president of the Bottling Investments Group. He joined the Coca-Cola System in 1981. prior to his appointment to his current role in 2004, Mr Finan served as Chief executive officer of Coca-Cola Hellenic Bottling Company SA, a large publicly-quoted company with operations across Western, Central and eastern europe and West Africa. He is currently responsible for leading a multi-million dollar internal bottling business, Bottling Investments Group which has operations across four continents. He is also responsible for the stewardship of the Coca-Cola Company’s equity Investments and leads the Commercial product Supply organisation. Mr Finan is a Fellow of the Institute of Chartered Management Accountants. (Age 54)
8 Christopher McGowan Christopher McGowan has served as a Director of the Group
since September 2002. He is currently the General partner of CJM Ventures, llC, a private investment firm. He was employed principally by Madison Dearborn from 1999 to 2011 where he served as a Managing Director. He has significant experience working with companies in a wide range of industrial sectors.
1 2 3 4
9 10 11 12
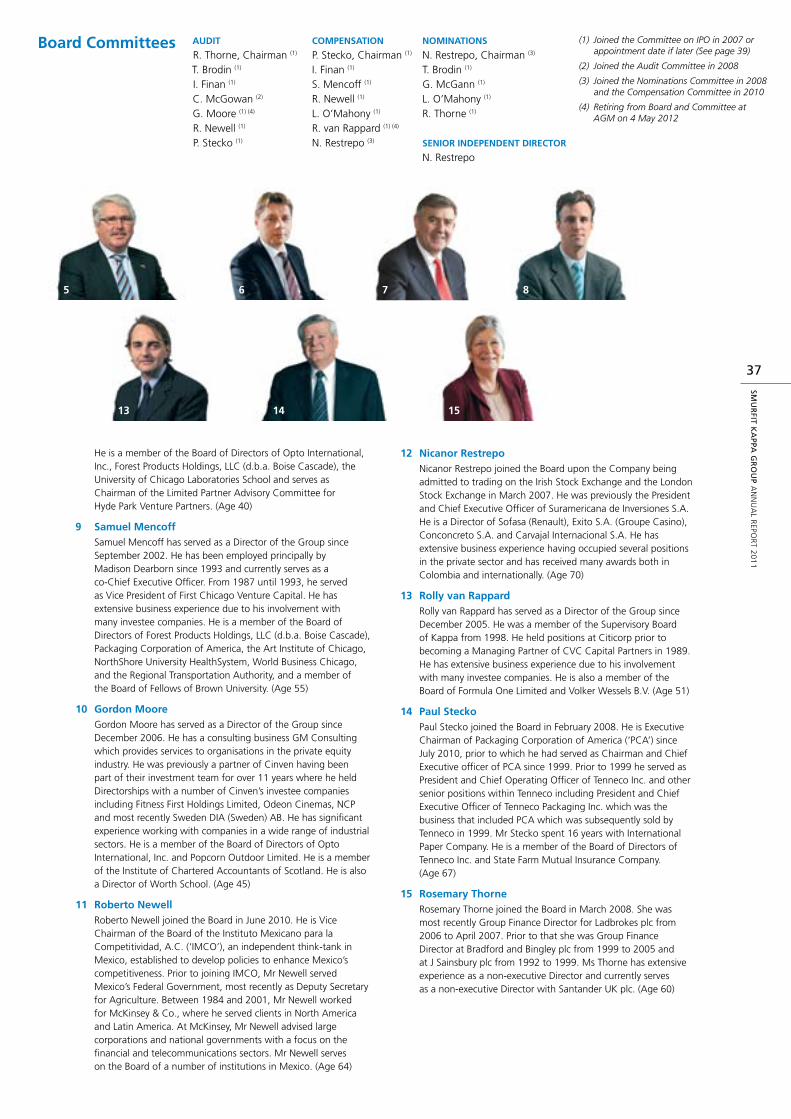
SMU
RFIT K
APPA
GR
OU
P An
nu
Al R
epoR
t 20
11
37
He is a member of the Board of Directors of opto International, Inc., Forest products Holdings, llC (d.b.a. Boise Cascade), the university of Chicago laboratories School and serves as Chairman of the limited partner Advisory Committee for Hyde park Venture partners. (Age 40)
9 Samuel Mencoff Samuel Mencoff has served as a Director of the Group since
September 2002. He has been employed principally by Madison Dearborn since 1993 and currently serves as a co-Chief executive officer. From 1987 until 1993, he served as Vice president of First Chicago Venture Capital. He has extensive business experience due to his involvement with many investee companies. He is a member of the Board of Directors of Forest products Holdings, llC (d.b.a. Boise Cascade), packaging Corporation of America, the Art Institute of Chicago, northShore university HealthSystem, World Business Chicago, and the Regional transportation Authority, and a member of the Board of Fellows of Brown university. (Age 55)
10 Gordon Moore Gordon Moore has served as a Director of the Group since
December 2006. He has a consulting business GM Consulting which provides services to organisations in the private equity industry. He was previously a partner of Cinven having been part of their investment team for over 11 years where he held Directorships with a number of Cinven’s investee companies including Fitness First Holdings limited, odeon Cinemas, nCp and most recently Sweden DIA (Sweden) AB. He has significant experience working with companies in a wide range of industrial sectors. He is a member of the Board of Directors of opto International, Inc. and popcorn outdoor limited. He is a member of the Institute of Chartered Accountants of Scotland. He is also a Director of Worth School. (Age 45)
11 Roberto Newell Roberto newell joined the Board in June 2010. He is Vice
Chairman of the Board of the Instituto Mexicano para la Competitividad, A.C. (‘IMCo’), an independent think-tank in Mexico, established to develop policies to enhance Mexico’s competitiveness. prior to joining IMCo, Mr newell served Mexico’s Federal Government, most recently as Deputy Secretary for Agriculture. Between 1984 and 2001, Mr newell worked for McKinsey & Co., where he served clients in north America and latin America. At McKinsey, Mr newell advised large corporations and national governments with a focus on the financial and telecommunications sectors. Mr newell serves on the Board of a number of institutions in Mexico. (Age 64)
12 Nicanor Restrepo nicanor Restrepo joined the Board upon the Company being
admitted to trading on the Irish Stock exchange and the london Stock exchange in March 2007. He was previously the president and Chief executive officer of Suramericana de Inversiones S.A. He is a Director of Sofasa (Renault), exito S.A. (Groupe Casino), Conconcreto S.A. and Carvajal Internacional S.A. He has extensive business experience having occupied several positions in the private sector and has received many awards both in Colombia and internationally. (Age 70)
13 Rolly van Rappard Rolly van Rappard has served as a Director of the Group since
December 2005. He was a member of the Supervisory Board of Kappa from 1998. He held positions at Citicorp prior to becoming a Managing partner of CVC Capital partners in 1989. He has extensive business experience due to his involvement with many investee companies. He is also a member of the Board of Formula one limited and Volker Wessels B.V. (Age 51)
14 Paul Stecko paul Stecko joined the Board in February 2008. He is executive
Chairman of packaging Corporation of America (‘pCA’) since July 2010, prior to which he had served as Chairman and Chief executive officer of pCA since 1999. prior to 1999 he served as president and Chief operating officer of tenneco Inc. and other senior positions within tenneco including president and Chief executive officer of tenneco packaging Inc. which was the business that included pCA which was subsequently sold by tenneco in 1999. Mr Stecko spent 16 years with International paper Company. He is a member of the Board of Directors of tenneco Inc. and State Farm Mutual Insurance Company. (Age 67)
15 Rosemary Thorne Rosemary thorne joined the Board in March 2008. She was
most recently Group Finance Director for ladbrokes plc from 2006 to April 2007. prior to that she was Group Finance Director at Bradford and Bingley plc from 1999 to 2005 and at J Sainsbury plc from 1992 to 1999. Ms thorne has extensive experience as a non-executive Director and currently serves as a non-executive Director with Santander uK plc. (Age 60)
Board Committees AuDIT COMPENSATION NOMINATIONS
R. thorne, Chairman (1) p. Stecko, Chairman (1) n. Restrepo, Chairman (3)
t. Brodin (1) I. Finan (1) t. Brodin (1)
I. Finan (1) S. Mencoff (1) G. McGann (1)
C. McGowan (2) R. newell (1) l. o’Mahony (1)
G. Moore (1) (4) l. o’Mahony (1) R. thorne (1)
R. newell (1) R. van Rappard (1) (4) p. Stecko (1) n. Restrepo (3) SENIOR INDEPENDENT DIRECTOR
n. Restrepo
(1) Joined the Committee on IPO in 2007 or appointment date if later (See page 39)
(2) Joined the Audit Committee in 2008
(3) Joined the Nominations Committee in 2008 and the Compensation Committee in 2010
(4) Retiring from Board and Committee at AGM on 4 May 2012
5 6 7 8
13 14 15
SMU
RFI
T K
APP
A G
RO
UP
AN
NU
AL
REP
OR
T 2
01
1
38
The Directors are committed to maintaining the highest standards of corporate governance. This Corporate Governance Statement describes how Smurfit Kappa Group applied the principles of the 2010 UK Corporate Governance Code (‘the Code’) published in June 2010 as adopted by the Irish Stock Exchange (‘ISE’) and London Stock Exchange (‘LSE’) throughout the financial year ended 31 December 2011. The Directors note the ISE introduced the Irish Corporate Governance Annex (‘the Annex’) to apply to companies listed on the ISE and which supplements the Code with additional corporate governance provisions. Except where otherwise stated, the Directors believe that the Group has complied with the provisions of the Code and the Annex throughout the year under review.
A copy of the Code (June 2010) can be obtained from the Financial Reporting Council’s (‘FRC’) website: www.frc.org.uk. A copy of the Annex can be obtained from the ISE’s website: www.ise.ie.
Board of DirectorsThe Board is primarily responsible for the long-term success of the Company, for setting the Group’s strategic aims, for the leadership and control of the Company and for reviewing the Group’s system of internal control and risk management. There is a clear division of responsibilities within the Group between the Board and executive management, with the Board retaining control of strategic and other major decisions under a formal schedule of matters reserved to it which includes:
Approval of the Group’s strategy which is set out ■■
on page 13
Board appointments including those of the ■■
Chairman and Group Chief Executive
Agreement of terms of appointment of the ■■
Chairman, Group Chief Executive and other executive Directors
Agreement of any fundamental changes to the ■■
Group management and control structure
Approval of the annual financial budgets■■
Approval of capital expenditure above fixed limits■■
Approval of material acquisitions and disposals ■■
of businesses
Approval of the Interim Reports, the Annual ■■
Report and accounts and all Press Releases
Establishment and review of corporate governance ■■
policy and practice
Monitoring of the Group’s risk management and ■■
internal control systems.
As recommended by the Code, the roles of Chairman and Group Chief Executive Officer are held by separate individuals and the division of responsibilities between them is clearly established and has been set out in writing and approved by the Board. The Board has delegated responsibility for the day-to-day management of the Group, through the Group Chief Executive Officer, to executive management. The Group Chief Executive Officer is responsible for implementing strategy and policy as approved by the Board. As discussed below, the Board has also delegated some of its responsibilities to Committees of the Board. The powers of Directors are determined by Irish legislation and the Articles of Association of the Company. The Directors have access to independent professional advice at the Group’s expense, if and when required. No such advice was sought by any Director during the year. The Board Committees are provided with sufficient resources to undertake their duties.
Membership, Board Size and IndependenceAt present there are fifteen Directors on the Board, comprising: a non-executive Chairman, three executive Directors and eleven non-executive Directors. A list of Directors is set out below and biographical details are set out on pages 36 and 37. The Board considers that the Board comprising fifteen Directors is not so large as to be unwieldy and that the Directors with a broad spread of nationalities bring the breadth and depth of skills, knowledge and experience that are required to lead the Group.
Corporate GovernanCe Statement
39
SMU
RFIT K
APPA
GR
OU
P A
NN
UA
L REPO
RT 2
01
1
The Code recommends that, apart from the Chairman, at least half of the Board of Directors of a listed company should comprise non-executive Directors determined by the Board to be independent in character and judgement and free from relationships or circumstances which may affect, or could appear to affect, the Director’s judgement.
The composition of the SKG Board reflects, in part, the entitlement of two of SKG’s shareholders, under the Company’s Articles of Association, to appoint up to four Directors to the Board. The Articles of Association allow MDCP III, MDCP IV and MDSE III jointly (together ‘MDP’) and Smurfit Kappa Feeder G.P. Limited (‘SKF’) the right to nominate up to two persons each as Directors to the Board. This right is based on them maintaining a shareholding of, or in excess of, 15% in the Group. Should MDP or SKF’s holding fall below 15% but remain above 10%, they retain the right to appoint one Director to the Board. The right to appoint a Director falls away if a shareholding falls below 10%. The SKF shareholding reduced to 8.2% on 2 March 2012. Mr Gordon Moore and Mr Rolly van
Rappard, the SKF shareholder nominees, will retire at the AGM on 4 May 2012.
While the two remaining shareholder nominated Directors are deemed “affiliated” Directors (and, therefore, non-independent), SKG does not believe this compromises either their independence of judgement, their contribution to the Board or the quality of their oversight. The Group has an effective Board to provide governance for an internationally diverse business whose interests span two continents and 31 individual countries. Each of the Group’s non-executive Directors has broad-based business expertise and many have gained significant and relevant industry specific expertise over a number of years. The composition of the Board reflects the need, as outlined by the Code, for an effective Board to maintain a balance of “skills, knowledge and experience”. The experience of each Director is set out in their biographies which are detailed on pages 36 and 37.
Director Role IndependentAppointment
Date *
Liam O’Mahony Non-executive Chairman ** 2007
Gary McGann Group Chief Executive Officer No 2000
Anthony Smurfit Group Chief Operating Officer No 1989
Ian Curley Group Chief Financial Officer No 2002
Frits Beurskens Non-executive Director – former Executive No 2005
Thomas Brodin Non-executive Director Yes 2008
Irial Finan Non-executive Director Yes 2012
Christopher McGowan Non-executive Director – Shareholder nominee No 2002
Samuel Mencoff Non-executive Director – Shareholder nominee No 2002
Gordon Moore*** Non-executive Director – Shareholder nominee No 2006
Roberto Newell Non-executive Director Yes 2010
Nicanor Restrepo Non-executive Director Yes 2007
Rolly van Rappard*** Non-executive Director – Shareholder nominee No 2005
Paul Stecko Non-executive Director Yes 2008
Rosemary Thorne Non-executive Director Yes 2008
* For Smurfit Kappa Group plc and predecessor companies. SKG returned to the ISE and LSE in March 2007.
** On his appointment as Chairman in December 2008 Mr O’Mahony was independent.
*** Retiring at AGM on 4 May 2012.
SMU
RFI
T K
APP
A G
RO
UP
AN
NU
AL
REP
OR
T 2
01
1
40
Corporate GovernanCe Statement [continued]
The Board through the Nominations Committee reviews the composition of the Board on an annual basis. This review includes a review of refreshment and renewal, Board diversity including gender diversity, and the skills, knowledge and experience of the Directors.
Since 2007, and recognising the recommendations of the Code, the Group has appointed six independent Directors to its Board: Mr Thomas Brodin, Mr Irial Finan, Mr Roberto Newell, Mr Nicanor Restrepo, Mr Paul Stecko, and Ms Rosemary Thorne. With the retirement of two shareholder nominees at the forthcoming AGM, the Group will meet the Code recommendations on Board independence.
The Board reviewed the composition of the Board and determined that Mr Brodin, Mr Finan, Mr Newell, Mr Restrepo, Mr Stecko and Ms Thorne are independent. In reaching that conclusion the Board took into account the principles relating to independence contained in the Code and specifically whether any non-executive Director:
has been an employee of the Group;■■
has or had within the last three years, a material ■■
business relationship with the Group;
receives remuneration from the Group other ■■
than a Director’s fee;
has close family ties with any of the Group’s ■■
advisers, Directors or senior employees;
holds cross-directorships or has significant links ■■
with other Directors through involvement in other companies or bodies;
represents a significant shareholder; or■■
has served on the Board for more than nine years ■■
from the date of their first election.
The Board is satisfied that the independence of the relevant Directors is not compromised by these or any other factors.
Experience and SkillsEach of the executive Directors has extensive experience of the paper-based packaging industry. Their knowledge is backed up by the general business skills of the individuals involved and by the broadly based skills and knowledge of the non-executive Directors, seven of whom have the additional benefit of many years exposure to paper-based packaging companies either as employees, directors or investors.
The non-executive Directors are expected to use their skills and their individual business experiences and their international backgrounds in reviewing and assessing any opportunities or challenges facing the Group and to play an important role in helping to develop the Group’s strategy and scrutinising the performance of management in meeting the Group’s goals and objectives.
Appointments, Retirement and Re-election to the BoardAny Director co-opted to the Board by the Directors is subject to election by the shareholders at the first AGM after their appointment and all Directors are subject to re-election at intervals of no more than three years. However, as indicated by the Board last year in compliance with the Code, all Directors are required to retire at each AGM and submit themselves for re-election.
The procedures governing the appointment and replacement of Directors are contained in the Company’s Articles of Association. Changes to the Articles of Association must be approved by the shareholders in accordance with the legislation in force from time to time.
The standard letter of appointment of non-executive Directors will be available for inspection at the AGM and is available on request, from the Company Secretary.
As noted above, pursuant to the Articles of Association of the Company, MDP has the right to nominate up to two persons for appointment as Directors and has nominated Mr Samuel Mencoff and Mr Christopher McGowan. These rights do not comply with the recommendations of the Code that the Nominations Committee should lead the process for Board appointments and make recommendations to the Board.
Each of the Directors, other than Mr Gordon Moore and Mr Rolly van Rappard, are offering themselves for re-election at the 2012 AGM and their details are set out on page 49.
41
SMU
RFIT K
APPA
GR
OU
P A
NN
UA
L REPO
RT 2
01
1
External DirectorshipsThe Board believes that there is benefit for the Group if executive Directors hold non-executive directorships with other companies as it enhances their overall business experience. Consequently, the executive Directors are encouraged to accept a small number of external appointments as non-executive Directors or on industry associations. Directors are permitted to retain any payments received in respect of such appointments.
RemunerationDetails of remuneration paid to Directors (executive and non-executive) are set out in the Remuneration Report on pages 52 to 60. Non-executive Directors are paid fees for their services. None of their remuneration is performance related and they are not eligible to participate in the Group’s annual bonus scheme or long-term incentive plans. Non-executive directors’ fees are not pensionable. The Remuneration Report will be presented to shareholders for the purposes of a non-binding advisory vote at the AGM on 4 May 2012.
ChairmanMr Liam O’Mahony who joined the Board upon the Company being admitted to trading on the ISE and the LSE in March 2007 was appointed Chairman in December 2008. As recommended by the Code, the Chairman was independent at his time of appointment. The Chairman is responsible for the leadership of the Board and the efficient and effective working of the Board. He sets and manages the Board agenda in order that at appropriate times it addresses all matters reserved to the Board and ensures that adequate time is available for discussion on strategy and the strategic issues facing the Group. He ensures that the members of the Board receive accurate, timely and clear information, and that the members of the Board are updated periodically on the views or concerns of the major investors. He also ensures that a culture of openness and debate is fostered to facilitate the effective contribution of the non-executive Directors to the Board.
Senior Independent DirectorMr Nicanor Restrepo was appointed the Group’s Senior Independent Director in December 2008. His duties include being available to shareholders if they have concerns which cannot be resolved through the Chairman or Group Chief Executive Officer. He is available to serve as an intermediary for other Directors where necessary. The Senior Independent Director also conducts an annual evaluation of corporate governance compliance, the operation and performance of the Board, the Directors, its Committees and the Chairman’s performance in conjunction with the other non-executive Directors on an annual basis.
Group SecretaryThe Directors have access to the advice and services of the Group Secretary who is responsible to the Board for ensuring that Board procedures are followed and applicable rules and regulations are complied with. The Group Secretary also acts as secretary to all of the Board Committees. The Group Secretary is responsible for ensuring Board procedures are followed including formal minuting of any unresolved concerns that any Director may have with the operation of the Company. During the year there were no such unresolved issues.
MeetingsThe Board meets at least five times each year with additional meetings as required. The Board met five times in 2011. Details of the meetings held during the period, both of the Board and of the Board Committees, are contained in the schedule on page 48, which also includes information on individual attendance. The Board holds at least one of its meetings each year at a Group operation to give the Directors an opportunity to meet with a wider range of management and to see and remain familiar with the Group’s operating activities. In 2011 the August Board meeting was held at the Facture Mill in France. The Board is supplied on a timely basis in advance of Board meetings with a Board Book comprising strategic updates, operational, financial and investor relations information together with Board papers on key issues in a form and of a quality to enable it to discharge its duties effectively. The Board papers also include the minutes of all Board Committee meetings and at each Board meeting the Chairman of each Committee gives a report on major agenda items discussed at Committee meetings held since the last Board meeting.
SMU
RFI
T K
APP
A G
RO
UP
AN
NU
AL
REP
OR
T 2
01
1
42
Corporate GovernanCe Statement [continued]
When Directors are unable to attend a meeting having been advised of the matters to be discussed they are given an opportunity to make their views known to the Chairman or the Group Chief Executive Officer prior to the meeting.
Induction and DevelopmentOn appointment, all non-executive Directors receive comprehensive briefing documents on the Group, its operations, their duties as a Director, are given presentations by the senior management team and are given the opportunity to visit sites and meet with the local management. During the year Directors meet with senior management at Board meetings, on individual site visits and at the annual visit by the Board to a Group operation. Directors also receive regular briefings and presentations on a wide range of the Group’s activities together with all significant analyst and rating reports. All Directors are encouraged to go for training to ensure they are kept up to date on relevant legal developments or changes in best practice.
Performance EvaluationThe Senior Independent Director conducts an annual evaluation of corporate governance compliance, the operation and performance of the Board, the Directors, its Committees and the performance of the Chairman. The Chairman conducts an annual evaluation of the performance of the Senior Independent Director. This is achieved through the completion of a detailed questionnaire by each Director and separate discussions with each Director. The Committees undertake an annual evaluation of their performance and report back to the Board. At least once a year the Chairman meets with the non-executive Directors without the executive Directors to review the Board’s performance. The Board discusses the results of its evaluations in order to identify and address areas in which the effectiveness of the Board might be improved.
The Board as recommended by the Code is committed to undertake an externally facilitated evaluation at least once every three years. An assessment of external advisors who will be engaged to undertake an evaluation of the Board is in process.
Share Ownership and DealingDetails of Directors’ shareholdings are set out on page 58. The Group has a policy on dealing in shares that applies to all Directors and senior management. This policy adopts the terms of the Model Code as set out in the Listing Rules published by the UK Listing Authority and the ISE. Under this policy, Directors and senior management are required to obtain clearance from prescribed persons before dealing. Directors and senior management are prohibited from dealing in SKG plc shares during designated close periods and at any other time when the individual is in possession of Inside Information (as defined by the Market Abuse (Directive 2003/6/EC) Regulations 2005).
Board CommitteesAs recommended by the Code, the Board has established three Committees to assist in the execution of specific matters within its responsibility. These are the Audit Committee, the Nominations Committee and the Compensation Committee. The responsibilities of each of these Committees are set out clearly in written terms of reference, which have been approved by the Board and which are available on the Group’s website. The Chairman of each Committee reports to the Board on the major agenda items discussed since the last meeting and the minutes of all Committee meetings are circulated to all of the Directors.
The current membership of each Committee is set out on page 37. The Code recommends that all of the members of the Audit Committee and the Compensation Committee should be independent non-executive Directors and, while this is not currently the case, the Board is actively working to achieve this. The Chairman of each of the Audit and Compensation Committee is an independent non-executive Director and a majority of each of the Committees comprises independent non-executive Directors.
43
SMU
RFIT K
APPA
GR
OU
P A
NN
UA
L REPO
RT 2
01
1
Audit CommitteeThe Audit Committee, chaired by Ms Rosemary Thorne, currently comprises six non-executive Directors. Of these, Ms Thorne and Mr Gordon Moore have recent and relevant financial experience. Mr Moore will leave the Committee following his retirement from the Board at the AGM. The Committee met five times during the year under review. The Group Chief Executive Officer, the Group Chief Financial Officer, the Group Internal Auditor, the Group Compliance Manager, and senior members of the Group finance team normally attend meetings of the Committee. The external auditor also attends all meetings and together with the Group Internal Auditor have direct access to the Committee Chairman at all times. The external auditor also meets with the Committee in the absence of management. The Committee Chairman in advance of every meeting meets individually with the Group finance team, the Group Compliance Manager, the Group Internal Auditor and the external auditor. Throughout each year, the Committee has presentations from the key finance areas.
The role and responsibilities of the Committee are set out in written terms of reference and are available on the Company’s website. The terms of reference are reviewed each year by the Committee and were updated and approved at the February 2011 meeting to reflect the change required by the Committee’s increased responsibilities in relation to the monitoring of the Group’s risk management and internal control systems.
In order to discharge the responsibilities as set out in the terms of reference, the Committee in 2011:
Reviewed with management the Company’s 2010 ■■
preliminary results announcement, its 2010 Annual Report and accounts, the 2011 first quarter results, the interim report 2011, the 2011 third quarter results and management’s annual going concern report
Reviewed the external auditor’s year end audit ■■
report for December 2010, its limited procedures reports on the 2011 first and third quarter results, the interim report 2011 and their report on the hard-close audit 2011
Reviewed the external auditor’s plan for the ■■
audit of the Group’s 2011 accounts, which include considerations of the scope of the audit, key risks to the accounts, confirmation of auditor independence, the proposed audit fee and approval of the terms of engagement for the audit
Addressed the annual fraud enquires carried ■■
out by the external auditor as part of its year-end audit
Reviewed on a quarterly basis the external auditor ■■
services and fees
Reviewed tax and accounting services and fees for ■■
firms other than the external auditor
Reviewed the quarterly internal audit reports with ■■
the Group Internal Auditor and management and any consequent actions
Approved the internal audit plan and the related ■■
resourcing of the function required to meet that plan
Approved an updated Group Internal Audit ■■
Charter
Reviewed all reports submitted by the Group ■■
Compliance Manager which comprised an Internal Control effectiveness report, an Internal Control Questionnaire update for 2010, the Treasury compliance certifications, the Competition Law policy compliance certification results and various Whistleblower and Code of Conduct updates
Reviewed the control environment and ensured ■■
that the Code of Business Conduct, the Code of Ethics for Senior Financial Officers, the Good Faith Reporting Policy, the Group Financial Reporting Guide, the Group Treasury Policy, the Financial Monitoring Policy, the Treasury Compliance Programme and the Competition Compliance Programme are up to date and embedded in the Group’s processes
Had presentations from and discussions with the ■■
senior management of the key finance functions
Reviewed and approved the Group’s risk ■■
assessment framework (see Internal Control and Risk Management on pages 46 and 47)
Reviewed and approved each significant risk ■■
facing the Group together with the actions proposed by management to accept, avoid or mitigate risk
Reviewed the Group’s monitoring processes over ■■
internal control.
SMU
RFI
T K
APP
A G
RO
UP
AN
NU
AL
REP
OR
T 2
01
1
44
Corporate GovernanCe Statement [continued]
As noted above, one of the duties of the Committee is to make recommendations to the Board in relation to the appointment of the external auditor and for approving its remuneration and terms of engagement. The Committee also monitors the effectiveness of the audit process through regular contact with the auditors, review of the audit plan, the quality of the audit reports and their findings and the quality of the advice given. The Group external audit engagement partner rotates every five years and will rotate after the completion of the 2011 audit.
The Committee assesses annually the independence and objectivity of the external auditor taking into account relevant professional and regulatory requirements and the relationship with the external auditor as a whole, including the provision of any non-audit services.
The Group has a policy governing the conduct of non-audit work by the external auditor. The engagement of the external auditor to provide any non-audit services must be pre-approved by the Committee or entered into pursuant to pre-approval policies and procedures established by the Committee. The policy exists to ensure that the external auditor does not audit its own work, participate in activities that would normally be undertaken by management, have a mutuality of financial interest with the Group or act in an advocacy role for the Group. Details of the amounts paid to the external auditor during the year for audit and other services are set out in Note 5 to the Consolidated Financial Statements on page 95.
The Nominations CommitteeThe Nominations Committee chaired by Mr Nicanor Restrepo currently comprises three non-executive Directors and the Group Chief Executive Officer. The Committee met twice during the year under review.
The role and responsibilities of the Committee are set out in written terms of reference and are available on the Company’s website.
The Committee gives full consideration to succession planning for Directors and is responsible for proposing any new appointments to the Board. The Committee uses the services of an external advisor to facilitate the search for suitable candidates. The Committee evaluates the composition of the Board with respect to the balance of skills, knowledge, experience and diversity, including gender diversity, on the Board and prepares descriptions of the requirements for appointments. When prospective candidates have been identified some of the Committee members will meet with them and if appropriate, the Committee will then recommend them to the Board. All appointments to the Board are approved by the Board as a whole. Non-executive Directors are typically expected to serve two three-year terms although they may be invited to serve for a further period.
During the year under review the Committee instigated the search for a new Board member. The Committee used the services of an external advisor and following a process similar to that set out above, Mr Irial Finan was recommended for co-option to the Board in February 2012 based on his skills, knowledge and extensive experience across international markets with one of the world’s leading companies.
The Compensation CommitteeThe Compensation Committee chaired by Mr Paul Stecko currently comprises six non-executive Directors. Mr Rolly van Rappard will leave the Committee following his retirement from the Board at the AGM. The Directors’ biographical details on pages 36 and 37 demonstrate that the members of the Committee bring to it a wide range of experience in the area of senior executive remuneration in comparable companies and the majority have many years knowledge of the paper and packaging industry. The Committee receives advice from independent remuneration consultants to supplement their own knowledge and to keep the Committee updated on current trends and practices.
The Committee met three times during the year. The Group Chief Executive Officer normally attends the meetings and the Group V.P. Human Resources attends when appropriate.
45
SMU
RFIT K
APPA
GR
OU
P A
NN
UA
L REPO
RT 2
01
1
The Compensation Committee has responsibility for setting the Group’s overall remuneration policy and strategy, determining the level and structure of remuneration of all executive Directors, making recommendations in regard to the Chairman’s and Directors’ fees which are fixed by the Board on the authority of the shareholders, monitoring and approving the level and structure of remuneration for senior management and the succession planning for the senior management teams and administering the long-term incentive plans. The Committee as stated above seeks outside independent advice as appropriate.
The role and responsibilities of the Committee are set out in its written terms of reference and are available on the Company’s website.
During the period under review, the Committee reviewed and approved the awards under the annual bonus scheme of the executive Directors having measured the results of the performance metrics against the 2011 performance targets. The Committee reviewed the salaries of the executive Directors and the senior management team. The Committee conducted a review of the long-term incentive plans with the advice of outside consultants and concluded that a new long-term incentive arrangement should be introduced to replace the 2007 Share Incentive Plan (‘2007 SIP’) to better align the interests of the executive Directors and the senior management with those of the shareholders. The Committee having consulted with major shareholder representative bodies requested approval from shareholders at the 2011 AGM to introduce the new long-term incentive plan, the 2011 Deferred Annual Bonus Plan (‘the DABP’), to replace the 2007 SIP. The Committee selected Return on Capital Employed and Free Cash Flow targets for the first three-year period of the plan which they lodged with the external auditor. The Committee subsequent to the AGM made a conditional share award under the DABP to the executive Directors and the senior management team. The Committee reviewed and approved the performance targets for the 2012 annual bonus scheme in light of the Budget for 2012 and the macroeconomic environment and also approved the breakdown of the performance targets by division and local entity. The Committee reviewed the Group’s pension policy in light of changes in pension legislation and requirements in a number of jurisdictions. The Committee reviewed the succession plans for the senior management throughout the Group.
Communication with ShareholdersThe Board gives a high priority to effective communications with shareholders and recognises the need to understand the views of major investors. On a day-to-day basis, contact with institutional shareholders is the responsibility of the Group Chief Executive Officer, the Group Chief Financial Officer and the Investor Relations Manager. The Chairman, Senior Independent Director and any other member of the Board are available to meet major investors if required. Shareholder communications are given high priority and there is regular dialogue with individual shareholders, as well as general presentations, plant visits, attendance at relevant conferences and conference calls at the time of the release of the annual and quarterly results. The Group also hosted two institutional investor and analyst days in June 2011, in London and New York, which included presentations from four senior managers from the Group’s operations. The Group Chief Executive Officer and Chief Operations Officer also participated in these events.
The papers for each Board meeting include a comprehensive report prepared by the Group Chief Financial Officer summarising investor relations activity during the preceding period including contacts between executive management and current and prospective institutional shareholders. The views and issues highlighted by shareholders are also included in the report.
The Group issues its annual and quarterly results promptly to shareholders and also publishes them on the Group’s website, www.smurfitkappa.com. The Group operates an investor relations section on the website, which, in addition to the annual and quarterly reports, contains investor presentations and all press releases immediately after their release to the Stock Exchange.
The Company’s AGM affords each shareholder the opportunity to question the Chairman of the Board, the Chairmen of all Committees and all other Board members. The Notice of the Annual General Meeting and related papers together with the Annual Report and Financial Statements are sent to shareholders at least twenty working days before the meeting. In addition, the Company responds throughout the year to numerous queries from shareholders on a broad range of issues.
SMU
RFI
T K
APP
A G
RO
UP
AN
NU
AL
REP
OR
T 2
01
1
46
Corporate GovernanCe Statement [continued]
Shareholder Meetings and Shareholder RightsShareholders’ meetings are governed by the Articles of Association of the Company and the Companies Acts 1963-2009.
The Company must hold an AGM each year in addition to any other meeting in that year and must specify that meeting as such in the notices calling it. The Directors may convene general meetings. Extraordinary general meetings may also be convened as provided by the Companies Acts. Notice of a general meeting must be provided as required by the Companies Acts.
At its general meetings the Company proposes a separate resolution on each substantially separate issue and does not bundle resolutions together inappropriately. Resolutions on the receipt of the Annual Report and accounts and the approval of the Directors’ Remuneration Report are put to shareholders at the AGM.
The Chairman of the Board of Directors or, in his absence, another Director nominated by the Directors will preside as chairman of a general meeting. Ordinary Shares carry voting rights. Three members entitled to vote at the meeting present either in person or by proxy constitute a quorum. Votes may be given either personally or by proxy. On a show of hands, every member present in person and every proxy will have one vote and on a poll, every member shall have one vote for every share carrying voting rights of which he is the holder. The following persons may demand a poll: the Chairman of a general meeting, at least five members present in person or by proxy having the right to vote at the meeting, any member(s) present in person or by proxy representing at least one-tenth of the total voting rights of all the members having the right to vote at the meeting, or, a member(s) present in person or by proxy holding shares on which an aggregate sum has been paid up equal to not less than one-tenth of the total sum paid up on all the shares conferring that right.
The Companies Acts provide for a number of key powers of general meetings, including the right to elect or re-elect a Director, the right to give authority to the Company to disapply pre-emption rights, the right to give authority to the Company to buy back shares and the right to amend the Memorandum & Articles of Association of the Company.
The Companies Acts also provide for a number of shareholder rights in respect of the general meeting and the methods of exercising of those rights, which are set out in the notes to the Notice of the Annual General Meeting, including the right a) to table agenda items and resolutions for inclusion on the agenda of an annual general meeting b) to table a draft resolution in respect of an item already on the agenda of the general meeting c) to ask questions in relation to an item on the agenda of a general meeting and d) to appoint a proxy electronically.
SustainabilitySustainability is concerned with ensuring that the human and natural environment remains intact both today and into the future as we continue to use natural resources. SKG manages its business in a way which recognises its key responsibilities in all aspects of its corporate social responsibility especially in the areas of Environment, Sustainable Forestry, Social Citizenship and Health and Safety. The Group’s principles are summarised on pages 33 to 35 and are described in detail in the Sustainable Development Report for 2010 which is available on the Group’s website. The Sustainable Development Report for 2011 will be published later this year.
Internal Control and Risk ManagementThe Board has overall responsibility for the Group’s system of internal control and risk management and for reviewing its effectiveness, in order to safeguard shareholders’ investments and the Group’s assets. Such a system is designed to manage rather than eliminate the risk of failure to achieve business objectives and can therefore only provide reasonable and not absolute assurance against material misstatement or loss. The Directors confirm there is an on-going process for identifying, evaluating and managing the significant risks faced by the Group which is in accordance with the Turnbull Guidance (Internal Control: Revised Guidance for Directors on the Combined Code) on internal control. This process has been in place throughout the accounting period and up to the date of approval of the Annual Report and accounts and is subject to regular review by the Board.
47
SMU
RFIT K
APPA
GR
OU
P A
NN
UA
L REPO
RT 2
01
1
Group executive management is responsible for implementing strategy and for the continued development of the Group’s operations within parameters set down by the Board. Day-to-day management of the Group’s operations is devolved to operational management within clearly defined authority limits and subject to tight reporting of financial performance. Management at all levels is responsible for internal control over the respective operations that have been delegated to them. As such, the system of internal control throughout the Group’s operations ensures that the organisation is capable of responding quickly to evolving operational and business risks and that significant internal control issues should they arise are reported promptly to appropriate levels of management.
The Board is responsible for determining the nature and extent of the significant risks it is willing to take to achieve its strategic objectives. Risk assessment and evaluation is an integral part of the management process throughout the Group. Risks are identified, evaluated and appropriate risk management strategies are implemented at each level. The key business risks are identified by the senior management team. The Audit Committee and Board in conjunction with senior management reviews the major business risks faced by the Group and determines the appropriate course of action to manage these risks. The Internal Audit function monitors compliance and considers the effectiveness of internal control throughout the Group. The Audit Committee meets with the Group Compliance Manager and the Group Internal Auditor at least quarterly in order to satisfy itself on the adequacy of the Group’s internal control system. The Chairman of the Audit Committee reports to the Board on all significant issues considered by the Committee.
The Directors confirm that they have conducted an annual review of the effectiveness of the Group’s risk management and system of internal control up to and including the date of approval of the Financial Statements. This had regard to the material risks that could affect the Group’s business (as outlined in the Directors’ Report on pages 49 to 51), the methods of managing those risks, the controls that are in place to contain them and the procedures to monitor them.
Financial ReportingAs part of its overall system of internal control the Group has in place control and risk management systems to govern the Group’s financial reporting process and the process for the preparation of consolidated accounts. The requirements for producing the Group’s financial information are governed by the Group’s Financial Reporting Guide and Financial Monitoring Policy which gives guidance on the maintenance of records that accurately and fairly reflect transactions, provide reasonable assurance that transactions are recorded correctly to permit the preparation of financial statements in accordance with International Financial Reporting Standards (‘IFRS’) and that require reported data to be reviewed and reconciled. These systems include the following financial reporting controls: access controls, reconciliations, verification controls, asset security controls and segregation of duties. Segment management and the Group’s executive management team review the results of the operations on a monthly basis. The Group’s executive management team meet with the segment management at least on a quarterly basis to review the year to date results against budget and rolling forecasts enabling them to monitor and challenge any variance against the expected financial outcome for the period. Internal Audit review financial controls in different locations on a test basis each year and report quarterly to the Audit Committee. Each operation through to segment level is required to self-assess on the effectiveness of its financial control environment. This includes the completion of an Internal Control Questionnaire which is reviewed by the Group Financial Controller and audited on a test basis by Internal Audit. Senior management representations with respect to the Group accounts showing a true and fair view are also required and supplied at year end.
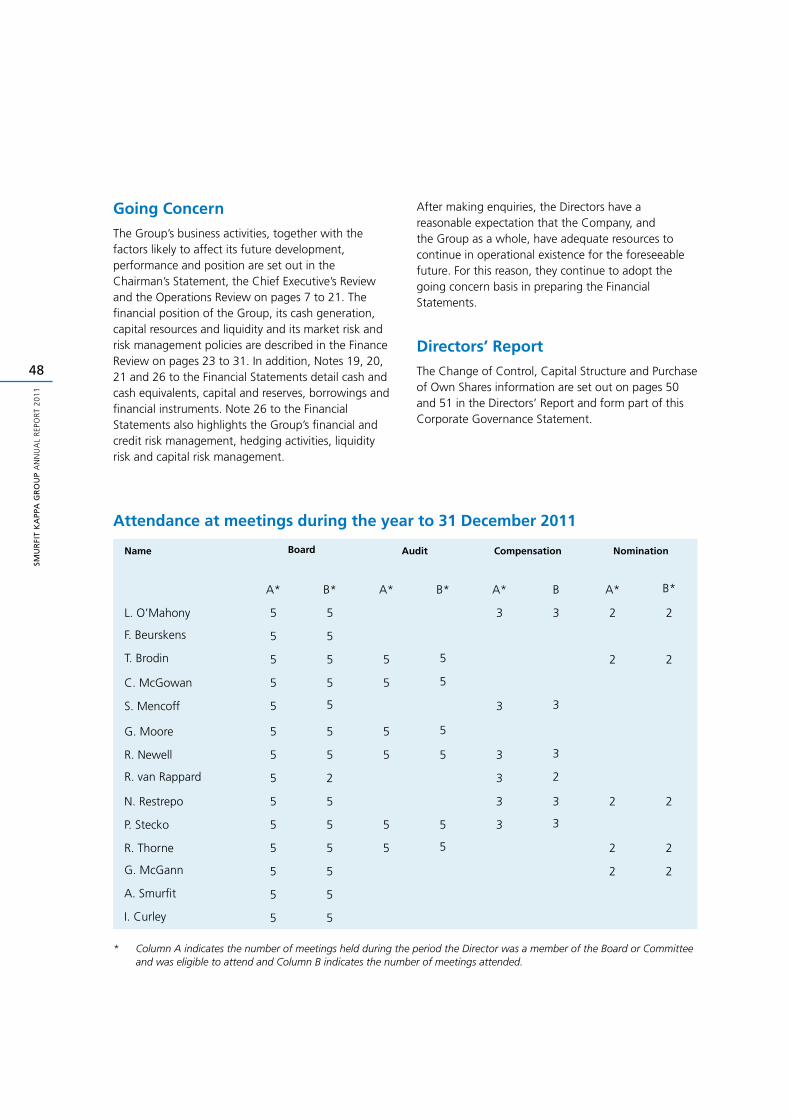
SMU
RFI
T K
APP
A G
RO
UP
AN
NU
AL
REP
OR
T 2
01
1
48
Going ConcernThe Group’s business activities, together with the factors likely to affect its future development, performance and position are set out in the Chairman’s Statement, the Chief Executive’s Review and the Operations Review on pages 7 to 21. The financial position of the Group, its cash generation, capital resources and liquidity and its market risk and risk management policies are described in the Finance Review on pages 23 to 31. In addition, Notes 19, 20, 21 and 26 to the Financial Statements detail cash and cash equivalents, capital and reserves, borrowings and financial instruments. Note 26 to the Financial Statements also highlights the Group’s financial and credit risk management, hedging activities, liquidity risk and capital risk management.
After making enquiries, the Directors have a reasonable expectation that the Company, and the Group as a whole, have adequate resources to continue in operational existence for the foreseeable future. For this reason, they continue to adopt the going concern basis in preparing the Financial Statements.
Directors’ ReportThe Change of Control, Capital Structure and Purchase of Own Shares information are set out on pages 50 and 51 in the Directors’ Report and form part of this Corporate Governance Statement.
Attendance at meetings during the year to 31 December 2011
Name Board Audit Compensation Nomination
A* B* A* B* A* B A* B*
L. O’Mahony 5 5 3 3 2 2
F. Beurskens 5 5
T. Brodin 5 5 5 5 2 2
C. McGowan 5 5 5 5
S. Mencoff 5 5 3 3
G. Moore 5 5 5 5
R. Newell 5 5 5 5 3 3
R. van Rappard 5 2 3 2
N. Restrepo 5 5 3 3 2 2
P. Stecko 5 5 5 5 3 3
R. Thorne 5 5 5 5 2 2
G. McGann 5 5 2 2
A. Smurfit 5 5
I. Curley 5 5
* Column A indicates the number of meetings held during the period the Director was a member of the Board or Committee and was eligible to attend and Column B indicates the number of meetings attended.
49
SMU
RFIT K
APPA
GR
OU
P A
NN
UA
L REPO
RT 2
01
1
DireCtorS’ report
Report of the DirectorsThe Directors submit their Report and Financial Statements for the year ended 31 December 2011.
Principal Activity and Business ReviewThe Group is an integrated paper and paperboard manufacturer and converter whose operations are divided into Europe and Latin America. Geographically, the major economic environments in which the Group conducts its business are Europe (principally Eurozone, Sweden and the UK) and Latin America (principally Argentina, Colombia, Mexico and Venezuela).
The Chairman’s Statement, the Chief Executive’s Review, the Operations Review and the Finance Review (including financial risk management policies) on pages 7 to 31 report on the performance of the Group during the year, and Note 31 on page 156 on events since 31 December 2011 and on future developments.
Results for the YearThe results for the year are set out in the Group Income Statement on page 64. The profit attributable to the owners of the Parent amounted to €206 million (2010: €50 million).
Key financial performance indicators are set out in the Finance Review on pages 25 and 26. The Financial Statements for the year ended 31 December 2011 are set out in detail on pages 64 to 159.
DividendsThe Board is recommending a final dividend of 15 cent per share for 2011. It is proposed to pay a final dividend on 11 May 2012 to all ordinary shareholders on the share register at the close of business on 13 April 2012.
Research and DevelopmentThe Company’s subsidiaries are engaged in ongoing research and development aimed at improving products and processes and expanding product ranges. Expenditure on research and development in the year amounted to €3 million.
Books and RecordsThe Directors are responsible for ensuring that proper books and accounting records, as outlined in Section 202 of the Companies Act, 1990, are kept by the Company. The Directors are also responsible for the preparation of the Annual Report. The Directors have appointed professionally qualified accounting personnel with appropriate expertise and have provided adequate resources to the finance function in order to ensure that those requirements are met. The books and accounting records of the Company are maintained at the Group’s principal executive offices located at Beech Hill, Clonskeagh, Dublin 4.
DirectorsThe members of the current Board of Directors are named on pages 36 and 37, together with a short biographical note on each Director.
Mr Irial Finan was appointed to the Board on 2 February 2012. In accordance with the provisions of Article 83.1 he retires at the AGM to be held on 4 May 2012 and, being eligible, offers himself for election.
Mr Gordon Moore and Mr Rolly van Rappard will retire from the Board at the AGM to be held on 4 May 2012.
Any Director co-opted to the Board by the Directors is subject to election by the shareholders at the first AGM after his appointment and all Directors are subject to re-election at intervals of no more than three years. However, as indicated by the Board last year in compliance with the Code all Directors will retire at the 2012 AGM and, excluding Mr Moore and Mr van Rappard, submit themselves for re-election.
To enable shareholders to make an informed decision, reference should be made to pages 36 and 37 which contains a biographical note on each Director offering themselves for re-election and to the Notice of the Annual General Meeting which explains why the Board believes the relevant Directors should be re-elected. The Directors intend to confirm at the AGM that the performance of each individual continues to be effective and demonstrates commitment to the role.
A description of the right held by certain shareholders to nominate individuals to the Board is included on pages 38 to 40 under the heading “Membership, Board Size and Independence” and that information forms part of this Directors’ Report.
SMU
RFI
T K
APP
A G
RO
UP
AN
NU
AL
REP
OR
T 2
01
1
50
DireCtorS’ report [continued]
Shareholders are referred to the information contained in the Corporate Governance Statement on pages 38 to 48 concerning the operation of the Board and the composition and functions of the Committees of the Board.
Directors’ and Secretary’s InterestsDetails of the Directors’ and Company Secretary’s interests in the share capital are set out in the Remuneration Report on pages 58 to 60 and are incorporated into this Directors’ Report.
Principal Risks and UncertaintiesUnder Irish company law (Regulation 37 of the European Communities (Companies: Group Accounts) Regulations 1992 (as amended)), the Group is required to give a description of the principal risks and uncertainties which it faces. These principal risks are set out below:
The cyclical nature of the packaging industry could ■■
result in overcapacity and consequently threaten the Group’s pricing structure
If the current economic climate were to ■■
deteriorate and result in an economic slowdown which was sustained over any significant length of time, or the sovereign debt crisis (including its impact on the euro) were to intensify, it could adversely affect the Group’s financial position and results of operations
If operations at any of the Group’s facilities (in ■■
particular its key mills) were interrupted for any significant length of time it could adversely affect the Group’s financial position and results of operations
Price fluctuations in raw materials and energy ■■
costs could adversely affect the Group’s manufacturing costs
The Group is exposed to currency exchange rate ■■
fluctuations
The Group may not be able to attract and retain ■■
suitably qualified employees as required for its business
The Group is subject to a growing number of ■■
environmental laws and regulations, and the cost of compliance or the failure to comply with current and future laws and regulations may negatively affect the Group’s business
The Group is exposed to potential risks in relation ■■
to its Venezuelan operations (see Note 3 to the Consolidated Financial Statements)
The Group is subject to anti-trust and similar ■■
legislation in the jurisdictions in which it operates
Substantial future sales of shares by the existing ■■
major shareholders may depress the share price.
The Board regularly monitors all of the above risks and appropriate actions are taken to mitigate those risks or address their potential adverse consequences.
Corporate GovernanceUnder Statutory Instrument 450/2009 European Communities (Directive 2006/46/EC) Regulations 2009, the Group is required to produce a Corporate Governance Statement. The Directors’ Statement on Corporate Governance is set out on pages 38 to 48 and forms part of this report. The Report on Directors’ Remuneration is set out on pages 52 to 60. The Directors note the ISE introduced the Annex to apply to accounting periods beginning on or after 18 December 2010 for companies listed on the ISE and which supplements the Code with additional corporate governance provisions. A copy of the Code (June 2010) can be obtained from the FRC’s website: www.frc.org.uk. A copy of the Annex can be obtained from the ISE’s website: www.ise.ie.
Purchase of Own SharesSpecial resolutions will be proposed at the AGM to renew the authority of the Company, or any of its subsidiaries, to purchase up to 10% of the Company’s ordinary shares in issue at the date of the AGM and in relation to the maximum and minimum prices at which treasury shares (effectively shares purchased and not cancelled) may be re-issued off-market by the Company. If granted, the authority will expire on the earlier of the date of the AGM in 2013 or 3 August 2013.
A similar authority was granted at the AGM in 2011, which is due to expire on the earlier of the date of the AGM in 2012 or 5 August 2012.
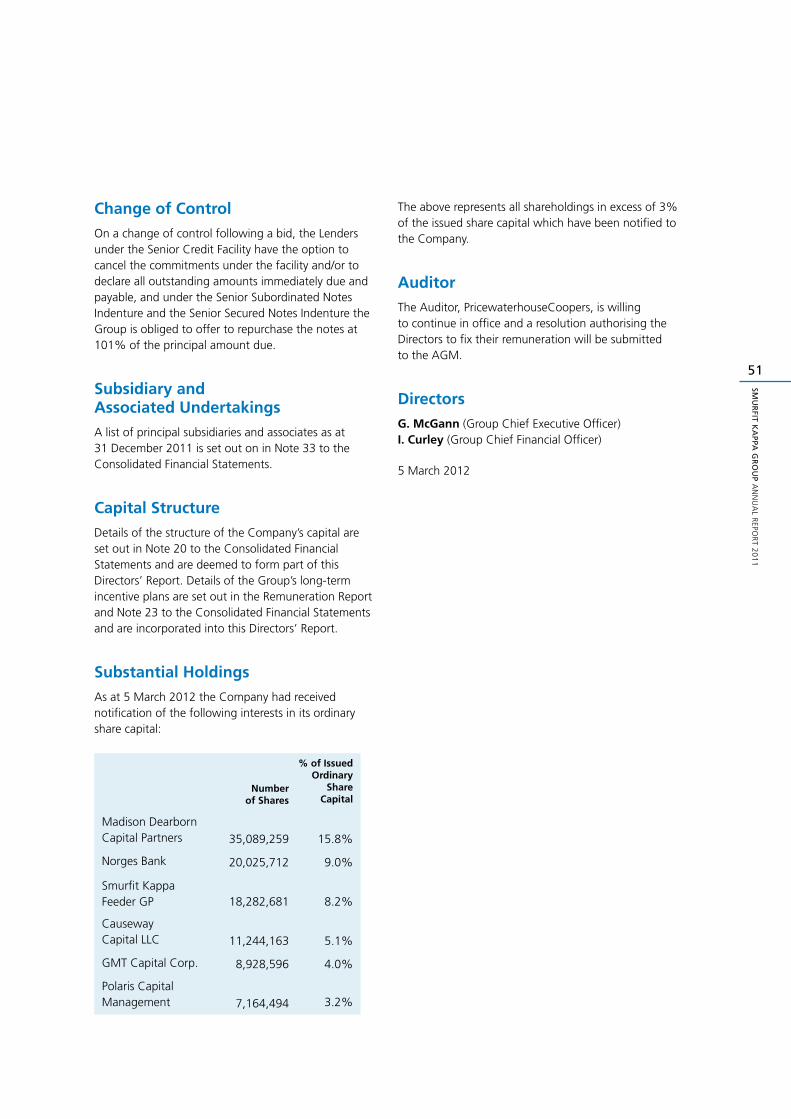
51
SMU
RFIT K
APPA
GR
OU
P A
NN
UA
L REPO
RT 2
01
1
Change of ControlOn a change of control following a bid, the Lenders under the Senior Credit Facility have the option to cancel the commitments under the facility and/or to declare all outstanding amounts immediately due and payable, and under the Senior Subordinated Notes Indenture and the Senior Secured Notes Indenture the Group is obliged to offer to repurchase the notes at 101% of the principal amount due.
Subsidiary and Associated UndertakingsA list of principal subsidiaries and associates as at 31 December 2011 is set out on in Note 33 to the Consolidated Financial Statements.
Capital StructureDetails of the structure of the Company’s capital are set out in Note 20 to the Consolidated Financial Statements and are deemed to form part of this Directors’ Report. Details of the Group’s long-term incentive plans are set out in the Remuneration Report and Note 23 to the Consolidated Financial Statements and are incorporated into this Directors’ Report.
Substantial HoldingsAs at 5 March 2012 the Company had received notification of the following interests in its ordinary share capital:
Numberof Shares
% of IssuedOrdinary
Share Capital
Madison Dearborn Capital Partners 35,089,259 15.8%
Norges Bank 20,025,712 9.0%
Smurfit Kappa Feeder GP 18,282,681 8.2%
Causeway Capital LLC 11,244,163 5.1%
GMT Capital Corp. 8,928,596 4.0%
Polaris Capital Management 7,164,494 3.2%
The above represents all shareholdings in excess of 3% of the issued share capital which have been notified to the Company.
AuditorThe Auditor, PricewaterhouseCoopers, is willing to continue in office and a resolution authorising the Directors to fix their remuneration will be submitted to the AGM.
DirectorsG. McGann (Group Chief Executive Officer) I. Curley (Group Chief Financial Officer)
5 March 2012
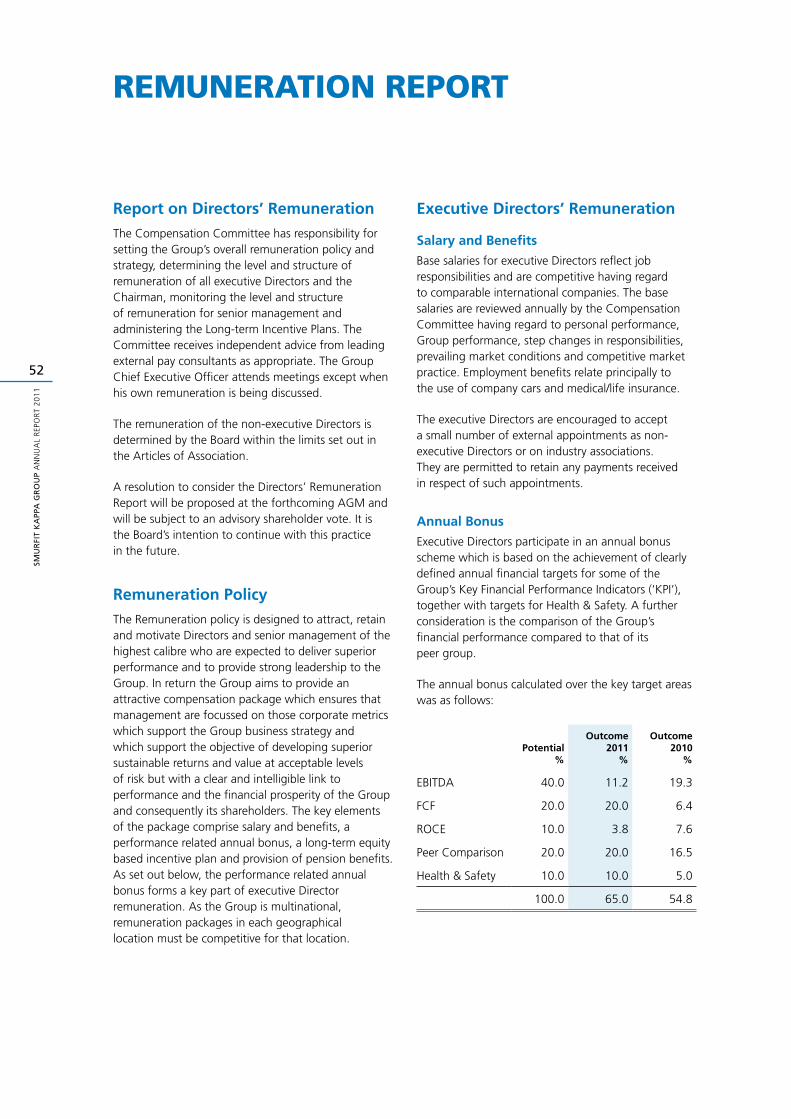
SMU
RFI
T K
APP
A G
RO
UP
AN
NU
AL
REP
OR
T 2
01
1
52
remuneration report
Report on Directors’ RemunerationThe Compensation Committee has responsibility for setting the Group’s overall remuneration policy and strategy, determining the level and structure of remuneration of all executive Directors and the Chairman, monitoring the level and structure of remuneration for senior management and administering the Long-term Incentive Plans. The Committee receives independent advice from leading external pay consultants as appropriate. The Group Chief Executive Officer attends meetings except when his own remuneration is being discussed.
The remuneration of the non-executive Directors is determined by the Board within the limits set out in the Articles of Association.
A resolution to consider the Directors’ Remuneration Report will be proposed at the forthcoming AGM and will be subject to an advisory shareholder vote. It is the Board’s intention to continue with this practice in the future.
Remuneration PolicyThe Remuneration policy is designed to attract, retain and motivate Directors and senior management of the highest calibre who are expected to deliver superior performance and to provide strong leadership to the Group. In return the Group aims to provide an attractive compensation package which ensures that management are focussed on those corporate metrics which support the Group business strategy and which support the objective of developing superior sustainable returns and value at acceptable levels of risk but with a clear and intelligible link to performance and the financial prosperity of the Group and consequently its shareholders. The key elements of the package comprise salary and benefits, a performance related annual bonus, a long-term equity based incentive plan and provision of pension benefits. As set out below, the performance related annual bonus forms a key part of executive Director remuneration. As the Group is multinational, remuneration packages in each geographical location must be competitive for that location.
Executive Directors’ Remuneration
Salary and Benefits
Base salaries for executive Directors reflect job responsibilities and are competitive having regard to comparable international companies. The base salaries are reviewed annually by the Compensation Committee having regard to personal performance, Group performance, step changes in responsibilities, prevailing market conditions and competitive market practice. Employment benefits relate principally to the use of company cars and medical/life insurance.
The executive Directors are encouraged to accept a small number of external appointments as non-executive Directors or on industry associations. They are permitted to retain any payments received in respect of such appointments.
Annual Bonus
Executive Directors participate in an annual bonus scheme which is based on the achievement of clearly defined annual financial targets for some of the Group’s Key Financial Performance Indicators (‘KPI’), together with targets for Health & Safety. A further consideration is the comparison of the Group’s financial performance compared to that of its peer group.
The annual bonus calculated over the key target areas was as follows:
Potential%
Outcome2011
%
Outcome2010
%
EBITDA 40.0 11.2 19.3
FCF 20.0 20.0 6.4
ROCE 10.0 3.8 7.6
Peer Comparison 20.0 20.0 16.5
Health & Safety 10.0 10.0 5.0
100.0 65.0 54.8
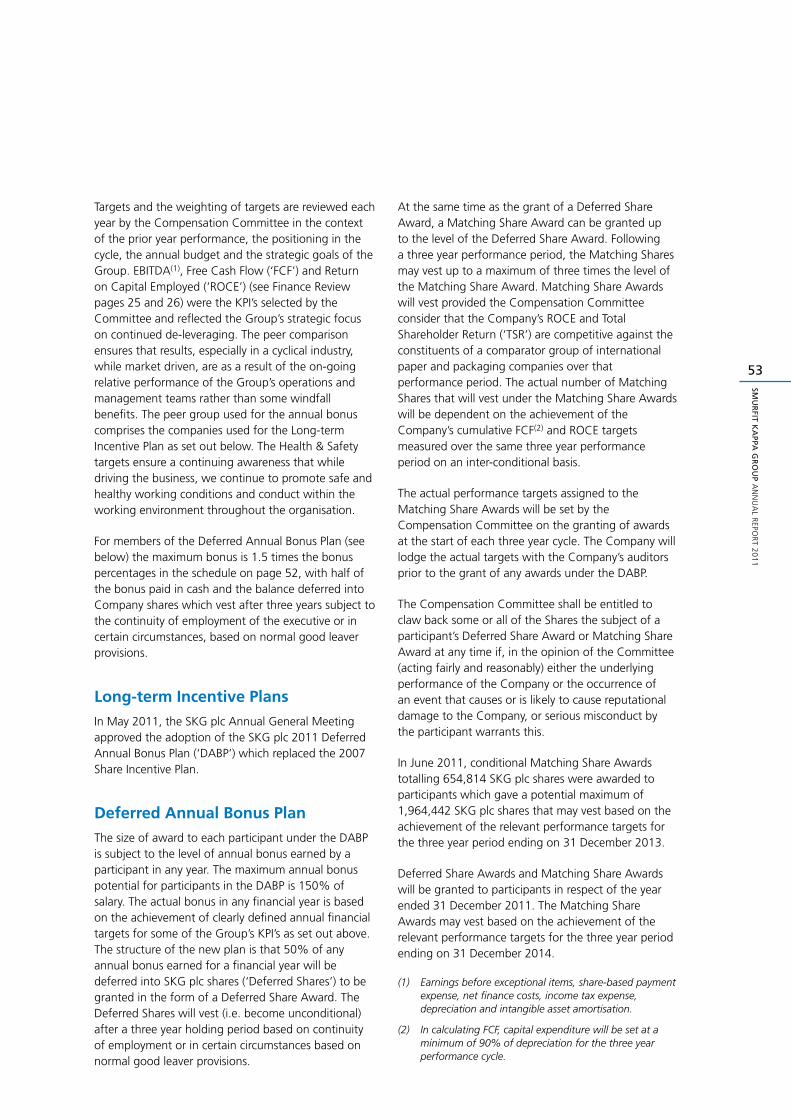
53
SMU
RFIT K
APPA
GR
OU
P A
NN
UA
L REPO
RT 2
01
1
Targets and the weighting of targets are reviewed each year by the Compensation Committee in the context of the prior year performance, the positioning in the cycle, the annual budget and the strategic goals of the Group. EBITDA(1), Free Cash Flow (‘FCF’) and Return on Capital Employed (‘ROCE’) (see Finance Review pages 25 and 26) were the KPI’s selected by the Committee and reflected the Group’s strategic focus on continued de-leveraging. The peer comparison ensures that results, especially in a cyclical industry, while market driven, are as a result of the on-going relative performance of the Group’s operations and management teams rather than some windfall benefits. The peer group used for the annual bonus comprises the companies used for the Long-term Incentive Plan as set out below. The Health & Safety targets ensure a continuing awareness that while driving the business, we continue to promote safe and healthy working conditions and conduct within the working environment throughout the organisation.
For members of the Deferred Annual Bonus Plan (see below) the maximum bonus is 1.5 times the bonus percentages in the schedule on page 52, with half of the bonus paid in cash and the balance deferred into Company shares which vest after three years subject to the continuity of employment of the executive or in certain circumstances, based on normal good leaver provisions.
Long-term Incentive PlansIn May 2011, the SKG plc Annual General Meeting approved the adoption of the SKG plc 2011 Deferred Annual Bonus Plan (‘DABP’) which replaced the 2007 Share Incentive Plan.
Deferred Annual Bonus PlanThe size of award to each participant under the DABP is subject to the level of annual bonus earned by a participant in any year. The maximum annual bonus potential for participants in the DABP is 150% of salary. The actual bonus in any financial year is based on the achievement of clearly defined annual financial targets for some of the Group’s KPI’s as set out above. The structure of the new plan is that 50% of any annual bonus earned for a financial year will be deferred into SKG plc shares (‘Deferred Shares’) to be granted in the form of a Deferred Share Award. The Deferred Shares will vest (i.e. become unconditional) after a three year holding period based on continuity of employment or in certain circumstances based on normal good leaver provisions.
At the same time as the grant of a Deferred Share Award, a Matching Share Award can be granted up to the level of the Deferred Share Award. Following a three year performance period, the Matching Shares may vest up to a maximum of three times the level of the Matching Share Award. Matching Share Awards will vest provided the Compensation Committee consider that the Company’s ROCE and Total Shareholder Return (‘TSR’) are competitive against the constituents of a comparator group of international paper and packaging companies over that performance period. The actual number of Matching Shares that will vest under the Matching Share Awards will be dependent on the achievement of the Company’s cumulative FCF(2) and ROCE targets measured over the same three year performance period on an inter-conditional basis.
The actual performance targets assigned to the Matching Share Awards will be set by the Compensation Committee on the granting of awards at the start of each three year cycle. The Company will lodge the actual targets with the Company’s auditors prior to the grant of any awards under the DABP.
The Compensation Committee shall be entitled to claw back some or all of the Shares the subject of a participant’s Deferred Share Award or Matching Share Award at any time if, in the opinion of the Committee (acting fairly and reasonably) either the underlying performance of the Company or the occurrence of an event that causes or is likely to cause reputational damage to the Company, or serious misconduct by the participant warrants this.
In June 2011, conditional Matching Share Awards totalling 654,814 SKG plc shares were awarded to participants which gave a potential maximum of 1,964,442 SKG plc shares that may vest based on the achievement of the relevant performance targets for the three year period ending on 31 December 2013.
Deferred Share Awards and Matching Share Awards will be granted to participants in respect of the year ended 31 December 2011. The Matching Share Awards may vest based on the achievement of the relevant performance targets for the three year period ending on 31 December 2014.
(1) Earnings before exceptional items, share-based payment expense, net finance costs, income tax expense, depreciation and intangible asset amortisation.
(2) In calculating FCF, capital expenditure will be set at a minimum of 90% of depreciation for the three year performance cycle.
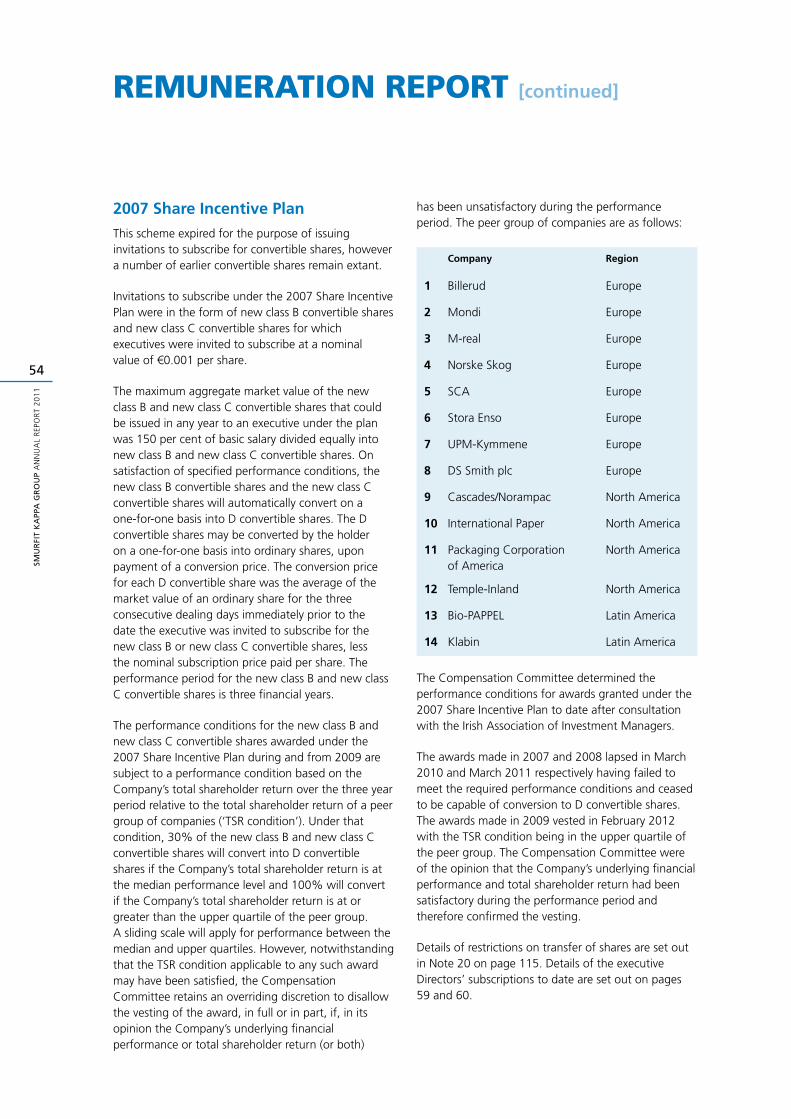
SMU
RFI
T K
APP
A G
RO
UP
AN
NU
AL
REP
OR
T 2
01
1
54
remuneration report [continued]
2007 Share Incentive PlanThis scheme expired for the purpose of issuing invitations to subscribe for convertible shares, however a number of earlier convertible shares remain extant.
Invitations to subscribe under the 2007 Share Incentive Plan were in the form of new class B convertible shares and new class C convertible shares for which executives were invited to subscribe at a nominal value of €0.001 per share.
The maximum aggregate market value of the new class B and new class C convertible shares that could be issued in any year to an executive under the plan was 150 per cent of basic salary divided equally into new class B and new class C convertible shares. On satisfaction of specified performance conditions, the new class B convertible shares and the new class C convertible shares will automatically convert on a one-for-one basis into D convertible shares. The D convertible shares may be converted by the holder on a one-for-one basis into ordinary shares, upon payment of a conversion price. The conversion price for each D convertible share was the average of the market value of an ordinary share for the three consecutive dealing days immediately prior to the date the executive was invited to subscribe for the new class B or new class C convertible shares, less the nominal subscription price paid per share. The performance period for the new class B and new class C convertible shares is three financial years.
The performance conditions for the new class B and new class C convertible shares awarded under the 2007 Share Incentive Plan during and from 2009 are subject to a performance condition based on the Company’s total shareholder return over the three year period relative to the total shareholder return of a peer group of companies (‘TSR condition’). Under that condition, 30% of the new class B and new class C convertible shares will convert into D convertible shares if the Company’s total shareholder return is at the median performance level and 100% will convert if the Company’s total shareholder return is at or greater than the upper quartile of the peer group. A sliding scale will apply for performance between the median and upper quartiles. However, notwithstanding that the TSR condition applicable to any such award may have been satisfied, the Compensation Committee retains an overriding discretion to disallow the vesting of the award, in full or in part, if, in its opinion the Company’s underlying financial performance or total shareholder return (or both)
has been unsatisfactory during the performance period. The peer group of companies are as follows:
Company Region
1 Billerud Europe
2 Mondi Europe
3 M-real Europe
4 Norske Skog Europe
5 SCA Europe
6 Stora Enso Europe
7 UPM-Kymmene Europe
8 DS Smith plc Europe
9 Cascades/Norampac North America
10 International Paper North America
11 Packaging Corporation of America
North America
12 Temple-Inland North America
13 Bio-PAPPEL Latin America
14 Klabin Latin America
The Compensation Committee determined the performance conditions for awards granted under the 2007 Share Incentive Plan to date after consultation with the Irish Association of Investment Managers.
The awards made in 2007 and 2008 lapsed in March 2010 and March 2011 respectively having failed to meet the required performance conditions and ceased to be capable of conversion to D convertible shares. The awards made in 2009 vested in February 2012 with the TSR condition being in the upper quartile of the peer group. The Compensation Committee were of the opinion that the Company’s underlying financial performance and total shareholder return had been satisfactory during the performance period and therefore confirmed the vesting.
Details of restrictions on transfer of shares are set out in Note 20 on page 115. Details of the executive Directors’ subscriptions to date are set out on pages 59 and 60.
55
SMU
RFIT K
APPA
GR
OU
P A
NN
UA
L REPO
RT 2
01
1
2002 Management Equity PlanThis scheme expired in 2007 for the purpose of issuing invitations to subscribe for convertible shares, however a number of earlier convertible shares remain extant. In March 2007 upon the IPO becoming effective, all of the then class A, E, F and H convertible shares and 80% of the class B convertible shares vested and were converted into D convertible shares. The class C, class G and 20% of the class B convertible shares did not vest and were re-designated as A1, A2 and A3 convertible shares. See Note 23 to the Consolidated Financial Statements on pages 129 and 130.
The A1, A2 and A3 convertible shares vested in March 2008, March 2009 and March 2010 respectively.
The D convertible shares which result from the conversion of A, B, C, E, F, G, A1, A2 and A3 convertible shares are themselves convertible on a one-for-one basis into ordinary shares upon the payment by the holder of a conversion price of €4.28 per share. The D convertible shares which result from the conversion of H convertible shares are convertible on a one-for-one basis into ordinary shares upon the payment by the holder of a conversion price of €5.6924 per share.
The ordinary shares resulting from the conversion of D convertible shares which resulted from the conversion of E, F, and H convertible shares were only transferable/saleable in equal tranches on 31 December 2008, 31 December 2009 and 31 December 2010.
Details of restrictions on transfer of shares are set out in Note 20 on page 115.
Details of the executive Directors’ holdings of convertible shares are set out on pages 59 and 60.
As recommended by the Code, non-executive Directors are not eligible to participate in the Long-term Incentive Plans.
PensionsMr Smurfit and Mr Curley participate in a Group contributory defined benefit pension plan based on an accrual rate of 1/60th of pensionable salary for each year of pensionable service and is designed to provide two thirds of salary at retirement for full service. Mr McGann is a member of a defined contribution pension plan.
All pension benefits are determined solely in relation to basic salary. Fees paid to non-executive Directors are not pensionable.
The Irish Finance Act 2006 effectively established a cap on pension provision by introducing a penalty tax charge on pension assets in excess of the higher of €5 million or the value of individual prospective pension entitlements as at 7 December 2005. As a result of these legislative changes, the Compensation Committee of SKG decided that Irish based executive Directors should have the option once they reached the cap of continuing to accrue pension benefits as previously, or of choosing an alternative arrangement with a similar overall cost to the Group.
Effective 1 January 2009 Messrs Smurfit and Curley who both exceeded the cap, chose the alternative arrangement which involves capping their individual pension in line with the provisions of the Finance Act and receiving a supplementary taxable non-pensionable cash allowance, in lieu of prospective pension foregone. This is calculated based on actuarial advice as the equivalent of the reduction in SKG’s liability to the individual and spread over the term to retirement as annual compensation allowances. Effective 1 January 2009, Mr McGann also chose the alternative arrangement and is receiving a proportion of his pension contribution as a supplementary taxable non-pensionable cash allowance.
Directors’ Service ContractsAs recommended by the Code, no executive Director has a service contract with a notice period in excess of twelve months.
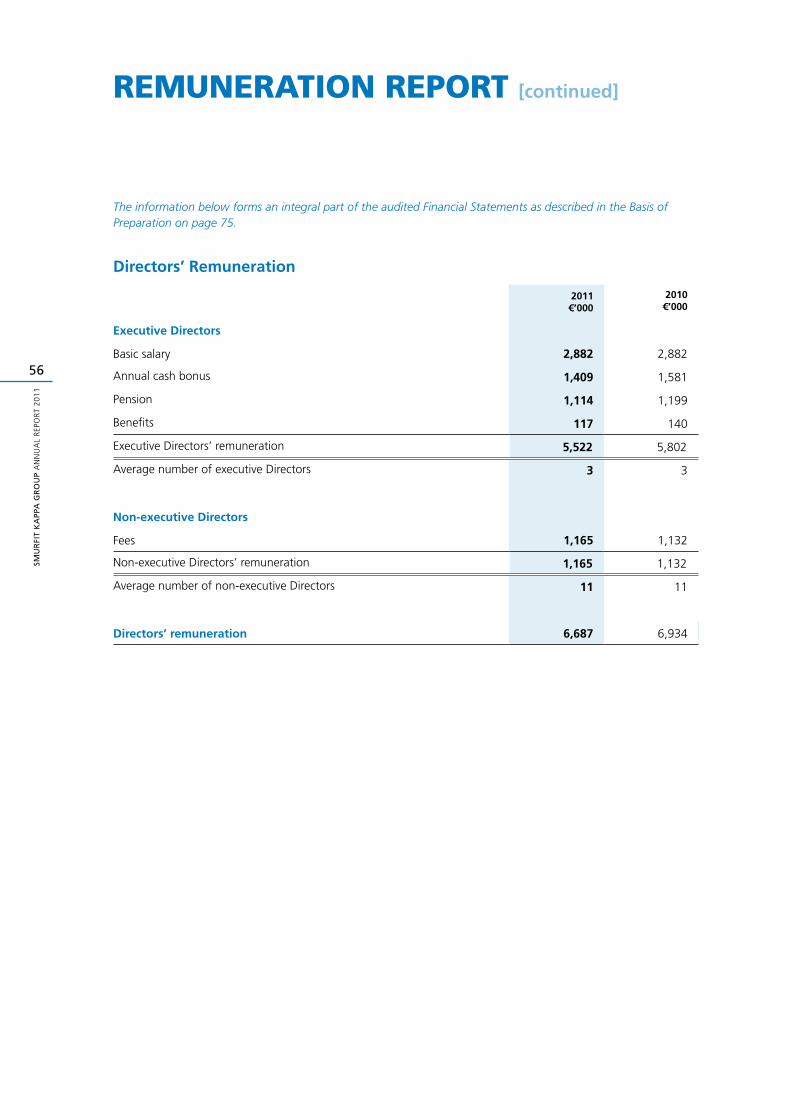
SMU
RFI
T K
APP
A G
RO
UP
AN
NU
AL
REP
OR
T 2
01
1
56
remuneration report [continued]
The information below forms an integral part of the audited Financial Statements as described in the Basis of Preparation on page 75.
Directors’ Remuneration
2011 €’000
2010 €’000
Executive Directors
Basic salary 2,882 2,882
Annual cash bonus 1,409 1,581
Pension 1,114 1,199
Benefits 117 140
Executive Directors’ remuneration 5,522 5,802
Average number of executive Directors 3 3
Non-executive Directors
Fees 1,165 1,132
Non-executive Directors’ remuneration 1,165 1,132
Average number of non-executive Directors 11 11
Directors’ remuneration 6,687 6,934
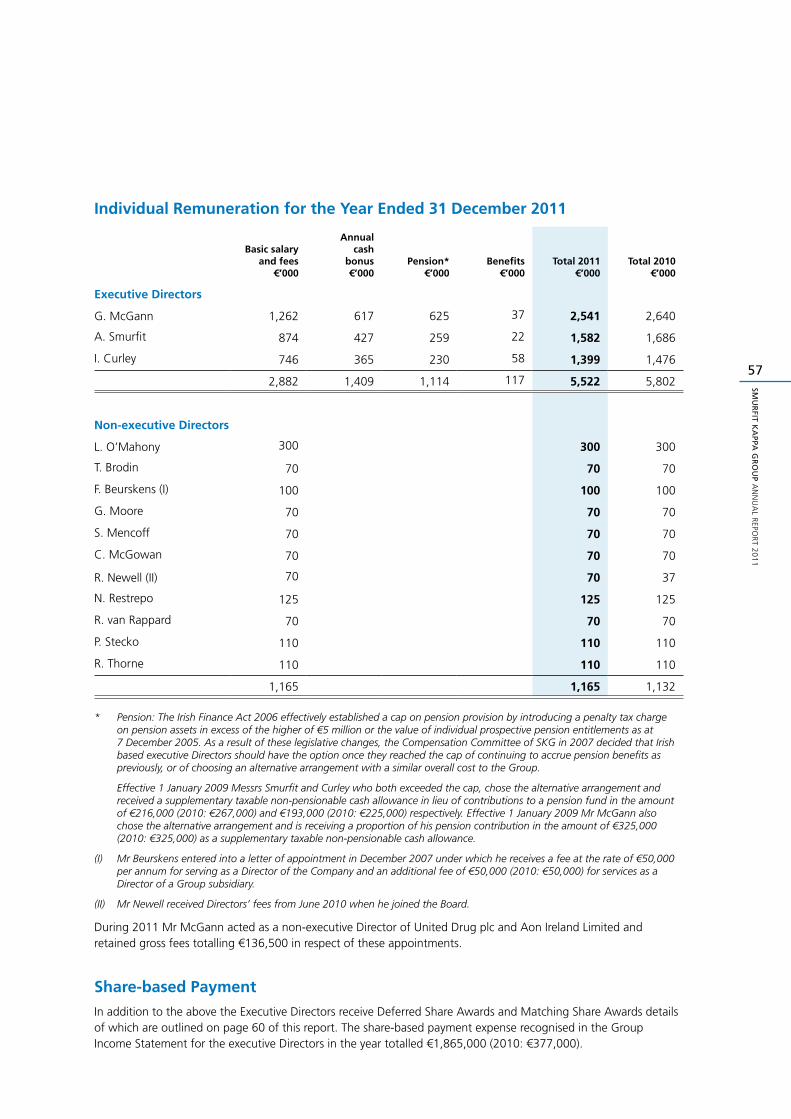
57
SMU
RFIT K
APPA
GR
OU
P A
NN
UA
L REPO
RT 2
01
1
Individual Remuneration for the Year Ended 31 December 2011
Basic salary and fees
€’000
Annual cash
bonus €’000
Pension* €’000
Benefits €’000
Total 2011 €’000
Total 2010 €’000
Executive Directors
G. McGann 1,262 617 625 37 2,541 2,640
A. Smurfit 874 427 259 22 1,582 1,686
I. Curley 746 365 230 58 1,399 1,476
2,882 1,409 1,114 117 5,522 5,802
Non-executive Directors
L. O’Mahony 300 300 300
T. Brodin 70 70 70
F. Beurskens (I) 100 100 100
G. Moore 70 70 70
S. Mencoff 70 70 70
C. McGowan 70 70 70
R. Newell (II) 70 70 37
N. Restrepo 125 125 125
R. van Rappard 70 70 70
P. Stecko 110 110 110
R. Thorne 110 110 110
1,165 1,165 1,132
* Pension: The Irish Finance Act 2006 effectively established a cap on pension provision by introducing a penalty tax charge on pension assets in excess of the higher of €5 million or the value of individual prospective pension entitlements as at 7 December 2005. As a result of these legislative changes, the Compensation Committee of SKG in 2007 decided that Irish based executive Directors should have the option once they reached the cap of continuing to accrue pension benefits as previously, or of choosing an alternative arrangement with a similar overall cost to the Group.
Effective 1 January 2009 Messrs Smurfit and Curley who both exceeded the cap, chose the alternative arrangement and received a supplementary taxable non-pensionable cash allowance in lieu of contributions to a pension fund in the amount of €216,000 (2010: €267,000) and €193,000 (2010: €225,000) respectively. Effective 1 January 2009 Mr McGann also chose the alternative arrangement and is receiving a proportion of his pension contribution in the amount of €325,000 (2010: €325,000) as a supplementary taxable non-pensionable cash allowance.
(I) Mr Beurskens entered into a letter of appointment in December 2007 under which he receives a fee at the rate of €50,000 per annum for serving as a Director of the Company and an additional fee of €50,000 (2010: €50,000) for services as a Director of a Group subsidiary.
(II) Mr Newell received Directors’ fees from June 2010 when he joined the Board.
During 2011 Mr McGann acted as a non-executive Director of United Drug plc and Aon Ireland Limited and retained gross fees totalling €136,500 in respect of these appointments.
Share-based PaymentIn addition to the above the Executive Directors receive Deferred Share Awards and Matching Share Awards details of which are outlined on page 60 of this report. The share-based payment expense recognised in the Group Income Statement for the executive Directors in the year totalled €1,865,000 (2010: €377,000).
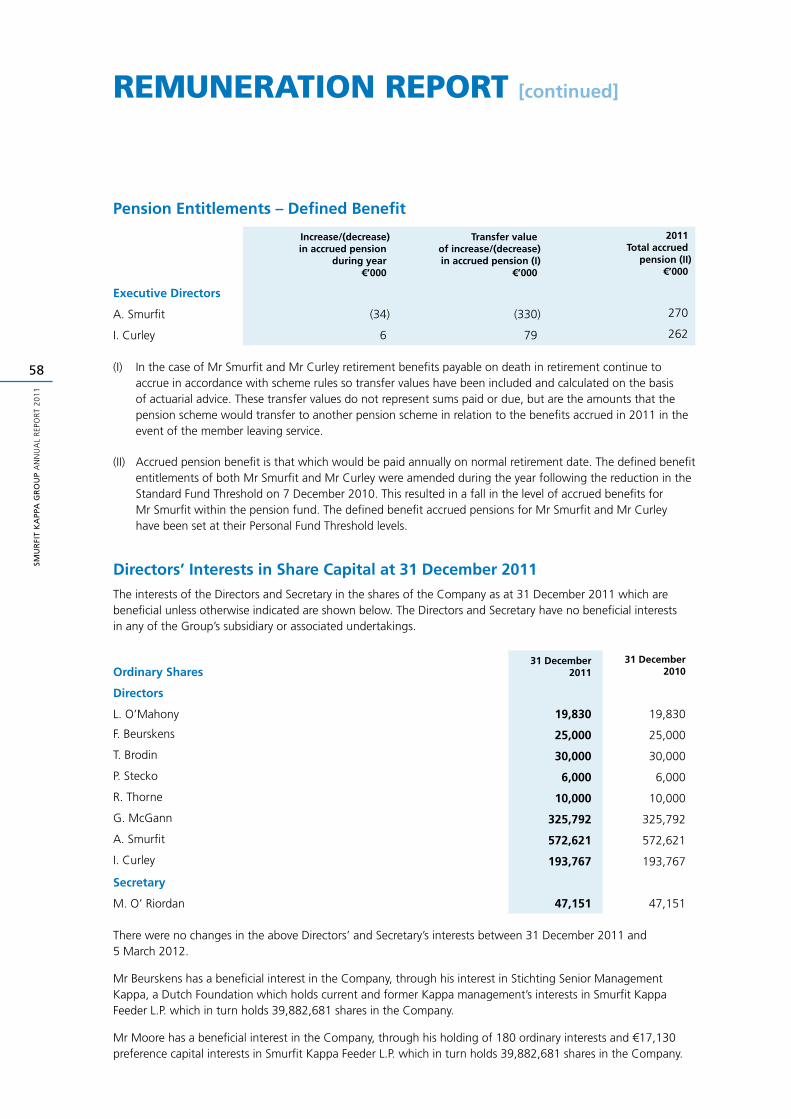
SMU
RFI
T K
APP
A G
RO
UP
AN
NU
AL
REP
OR
T 2
01
1
58
remuneration report [continued]
Pension Entitlements – Defined Benefit
Increase/(decrease)in accrued pension
during year€’000
Transfer valueof increase/(decrease)in accrued pension (I)
€’000
2011Total accrued
pension (II)€’000
Executive Directors
A. Smurfit (34) (330) 270
I. Curley 6 79 262
(I) In the case of Mr Smurfit and Mr Curley retirement benefits payable on death in retirement continue to accrue in accordance with scheme rules so transfer values have been included and calculated on the basis of actuarial advice. These transfer values do not represent sums paid or due, but are the amounts that the pension scheme would transfer to another pension scheme in relation to the benefits accrued in 2011 in the event of the member leaving service.
(II) Accrued pension benefit is that which would be paid annually on normal retirement date. The defined benefit entitlements of both Mr Smurfit and Mr Curley were amended during the year following the reduction in the Standard Fund Threshold on 7 December 2010. This resulted in a fall in the level of accrued benefits for Mr Smurfit within the pension fund. The defined benefit accrued pensions for Mr Smurfit and Mr Curley have been set at their Personal Fund Threshold levels.
Directors’ Interests in Share Capital at 31 December 2011The interests of the Directors and Secretary in the shares of the Company as at 31 December 2011 which are beneficial unless otherwise indicated are shown below. The Directors and Secretary have no beneficial interests in any of the Group’s subsidiary or associated undertakings.
Ordinary Shares 31 December
201131 December
2010
Directors
L. O’Mahony 19,830 19,830
F. Beurskens 25,000 25,000
T. Brodin 30,000 30,000
P. Stecko 6,000 6,000
R. Thorne 10,000 10,000
G. McGann 325,792 325,792
A. Smurfit 572,621 572,621
I. Curley 193,767 193,767
Secretary
M. O’ Riordan 47,151 47,151
There were no changes in the above Directors’ and Secretary’s interests between 31 December 2011 and 5 March 2012.
Mr Beurskens has a beneficial interest in the Company, through his interest in Stichting Senior Management Kappa, a Dutch Foundation which holds current and former Kappa management’s interests in Smurfit Kappa Feeder L.P. which in turn holds 39,882,681 shares in the Company.
Mr Moore has a beneficial interest in the Company, through his holding of 180 ordinary interests and €17,130 preference capital interests in Smurfit Kappa Feeder L.P. which in turn holds 39,882,681 shares in the Company.
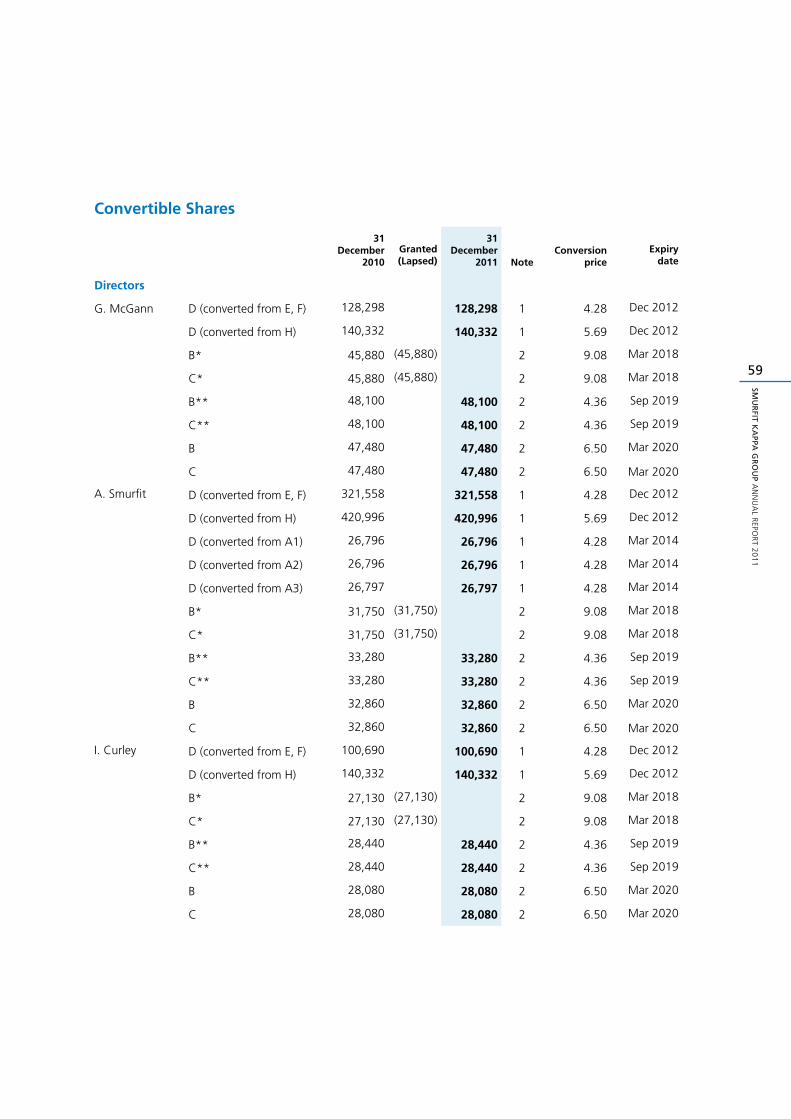
59
SMU
RFIT K
APPA
GR
OU
P A
NN
UA
L REPO
RT 2
01
1
Convertible Shares
31 December
2010Granted (Lapsed)
31 December
2011 Note Conversion
priceExpiry
date
Directors
G. McGann D (converted from E, F) 128,298 128,298 1 4.28 Dec 2012
D (converted from H) 140,332 140,332 1 5.69 Dec 2012
B* 45,880 (45,880) 2 9.08 Mar 2018
C* 45,880 (45,880) 2 9.08 Mar 2018
B** 48,100 48,100 2 4.36 Sep 2019
C** 48,100 48,100 2 4.36 Sep 2019
B 47,480 47,480 2 6.50 Mar 2020
C 47,480 47,480 2 6.50 Mar 2020
A. Smurfit D (converted from E, F) 321,558 321,558 1 4.28 Dec 2012
D (converted from H) 420,996 420,996 1 5.69 Dec 2012
D (converted from A1) 26,796 26,796 1 4.28 Mar 2014
D (converted from A2) 26,796 26,796 1 4.28 Mar 2014
D (converted from A3) 26,797 26,797 1 4.28 Mar 2014
B* 31,750 (31,750) 2 9.08 Mar 2018
C* 31,750 (31,750) 2 9.08 Mar 2018
B** 33,280 33,280 2 4.36 Sep 2019
C** 33,280 33,280 2 4.36 Sep 2019
B 32,860 32,860 2 6.50 Mar 2020
C 32,860 32,860 2 6.50 Mar 2020
I. Curley D (converted from E, F) 100,690 100,690 1 4.28 Dec 2012
D (converted from H) 140,332 140,332 1 5.69 Dec 2012
B* 27,130 (27,130) 2 9.08 Mar 2018
C* 27,130 (27,130) 2 9.08 Mar 2018
B** 28,440 28,440 2 4.36 Sep 2019
C** 28,440 28,440 2 4.36 Sep 2019
B 28,080 28,080 2 6.50 Mar 2020
C 28,080 28,080 2 6.50 Mar 2020
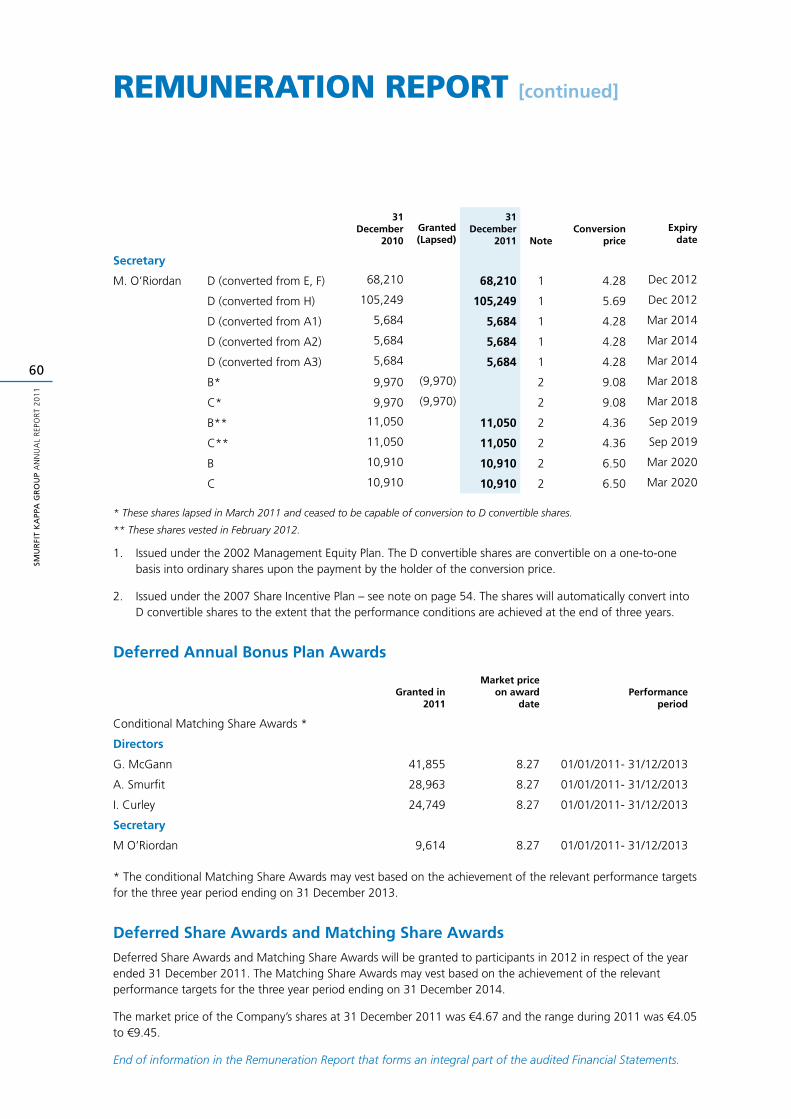
SMU
RFI
T K
APP
A G
RO
UP
AN
NU
AL
REP
OR
T 2
01
1
60
remuneration report [continued]
31 December
2010Granted (Lapsed)
31 December
2011 Note Conversion
priceExpiry
date
Secretary
M. O’Riordan D (converted from E, F) 68,210 68,210 1 4.28 Dec 2012
D (converted from H) 105,249 105,249 1 5.69 Dec 2012
D (converted from A1) 5,684 5,684 1 4.28 Mar 2014
D (converted from A2) 5,684 5,684 1 4.28 Mar 2014
D (converted from A3) 5,684 5,684 1 4.28 Mar 2014
B* 9,970 (9,970) 2 9.08 Mar 2018
C* 9,970 (9,970) 2 9.08 Mar 2018
B** 11,050 11,050 2 4.36 Sep 2019
C** 11,050 11,050 2 4.36 Sep 2019
B 10,910 10,910 2 6.50 Mar 2020
C 10,910 10,910 2 6.50 Mar 2020
* These shares lapsed in March 2011 and ceased to be capable of conversion to D convertible shares.
** These shares vested in February 2012.
1. Issued under the 2002 Management Equity Plan. The D convertible shares are convertible on a one-to-one basis into ordinary shares upon the payment by the holder of the conversion price.
2. Issued under the 2007 Share Incentive Plan – see note on page 54. The shares will automatically convert into D convertible shares to the extent that the performance conditions are achieved at the end of three years.
Deferred Annual Bonus Plan Awards
Granted in2011
Market priceon award
datePerformance
period
Conditional Matching Share Awards *
Directors
G. McGann 41,855 8.27 01/01/2011- 31/12/2013
A. Smurfit 28,963 8.27 01/01/2011- 31/12/2013
I. Curley 24,749 8.27 01/01/2011- 31/12/2013
Secretary
M O’Riordan 9,614 8.27 01/01/2011- 31/12/2013
* The conditional Matching Share Awards may vest based on the achievement of the relevant performance targets for the three year period ending on 31 December 2013.
Deferred Share Awards and Matching Share AwardsDeferred Share Awards and Matching Share Awards will be granted to participants in 2012 in respect of the year ended 31 December 2011. The Matching Share Awards may vest based on the achievement of the relevant performance targets for the three year period ending on 31 December 2014.
The market price of the Company’s shares at 31 December 2011 was €4.67 and the range during 2011 was €4.05 to €9.45.
End of information in the Remuneration Report that forms an integral part of the audited Financial Statements.
61
SMU
RFIT K
APPA
GR
OU
P A
NN
UA
L REPO
RT 2
01
1
Statement of DireCtorS’ reSponSibilitieS
The Directors are responsible for preparing the Annual Report and the Financial Statements in accordance with applicable law and regulations.
Irish company law requires the Directors to prepare financial statements for each financial year. Under that law the Directors have prepared the Group and Parent Company Financial Statements in accordance with IFRS as adopted by the European Union. The Financial Statements are required by law to give a true and fair view of the state of affairs of the Company and the Group and of the profit or loss of the Group for that period.
In preparing these Financial Statements the Directors are required to:
Select suitable accounting policies and then apply ■■
them consistently
Make judgments and estimates that are ■■
reasonable and prudent
State that the Financial Statements comply with ■■
IFRS as adopted by the European Union
Prepare the Financial Statements on the going ■■
concern basis, unless it is inappropriate to presume that the Group will continue in business.
The Directors confirm that they have complied with the above requirements in preparing the Financial Statements.
The Directors are also required by applicable law and the Listing Rules issued by the Irish Stock Exchange to prepare a Directors’ report and reports relating to Directors’ remuneration and corporate governance. In accordance with the Transparency (Directive 2004/109/EC) Regulations 2007 (the ‘Transparency Regulations’), the Directors are required to include a management report containing a fair review of the business and a description of the principal risks and uncertainties facing the Group.
The Directors are responsible for keeping proper books of account that disclose with reasonable accuracy at any time the financial position of the Company and the Group and to enable them to ensure that the Financial Statements comply with the Companies Acts 1963 to 2009 and, as regards the Consolidated Financial Statements, Article 4 of the International Accounting Standards (‘IAS’) Regulation. They are also responsible for safeguarding the assets of the Company and the Group and hence for taking reasonable steps for the prevention and detection of fraud and other irregularities.
The Directors are responsible for the maintenance and integrity of the corporate and financial information included on the Company’s website. Legislation in the Republic of Ireland concerning the preparation and dissemination of financial statements may differ from legislation in other jurisdictions.
Directors’ statement pursuant to the Transparency RegulationsEach of the Directors, whose names and functions are listed on pages 36 and 37, confirms that, to the best of each person’s knowledge and belief:
the Financial Statements, prepared in accordance ■■
with IFRS as adopted by the European Union, give a true and fair view of the assets, liabilities and financial position of the Company and the Group and of the profit of the Group; and
the Directors’ report contained in the Annual ■■
Report includes a fair review of the development and performance of the business and the position of the Company and the Group, together with a description of the principal risks and uncertainties that they face.
G. McGann I. Curley
Directors
5 March 2012
SMU
RFI
T K
APP
A G
RO
UP
AN
NU
AL
REP
OR
T 2
01
1
62
inDepenDent auDitorS’ reportto the Members of Smurfit Kappa Group plc
We have audited the Group and Parent Company financial statements (the “financial statements”) of Smurfit Kappa Group Plc for the year ended 31 December 2011 which comprise the Group Income Statement, the Group and Parent Company Balance Sheets, the Group and Parent Company Cash Flow Statements, the Group Statement of Comprehensive Income, the Group and Parent Company Statements of Changes in Equity and the related notes. These financial statements have been prepared under the accounting policies set out therein.
Respective responsibilities of directors and auditorsThe directors’ responsibilities for preparing the Annual Report and the financial statements, in accordance with applicable Irish law and International Financial Reporting Standards (IFRSs) as adopted by the European Union, are set out in the Statement of Directors’ Responsibilities.
Our responsibility is to audit the financial statements in accordance with relevant legal and regulatory requirements and International Standards on Auditing (UK and Ireland). This report, including the opinion, has been prepared for and only for the Parent Company’s members as a body in accordance with Section 193 of the Companies Act, 1990 and for no other purpose. We do not, in giving this opinion, accept or assume responsibility for any other purpose or to any other person to whom this report is shown or into whose hands it may come save where expressly agreed by our prior consent in writing.
We report to you our opinion as to whether the Group financial statements give a true and fair view, in accordance with IFRSs as adopted by the European Union. We report to you our opinion as to whether the Parent Company financial statements give a true and fair view, in accordance with IFRSs as adopted by the European Union as applied in accordance with the provisions of the Companies Acts 1963 to 2009. We also report to you whether the financial statements have been properly prepared in accordance with Irish statute comprising the Companies Acts, 1963 to 2009 and, as regards the Group financial statements, Article 4 of the IAS Regulation. We state whether we have obtained all the information and explanations we consider necessary for the purposes of our audit, and whether the Parent Company balance sheet is in agreement with the books of account. We also report to you our opinion as to:
whether the Parent Company has kept proper ■■
books of account;
whether the directors’ report is consistent with the ■■
financial statements; and
whether at the balance sheet date there existed a ■■
financial situation which may require the Parent Company to convene an extraordinary general meeting of the Parent Company; such a financial situation may exist if the net assets of the Parent Company, as stated in the Parent Company balance sheet, are not more than half of its called-up share capital.
We also report to you if, in our opinion, any information specified by law or the Listing Rules of the Irish Stock Exchange regarding directors’ remuneration and directors’ transactions is not disclosed and, where practicable, include such information in our report.
We are required by law to report to you our opinion as to whether the description in the Corporate Governance Statement set out in the directors’ report of the main features of the internal control and risk management systems in relation to the process for preparing the Group financial statements is consistent with the Group financial statements. In addition, we review whether the Corporate Governance Statement reflects the Parent Company’s compliance with the nine provisions of the UK Corporate Governance Code and the two provisions of the Irish Corporate Governance Annex specified for our review by the Listing Rules of the Irish Stock Exchange, and we report if it does not. We are not required to consider whether the board’s statements on internal control cover all risks and controls, or form an opinion on the effectiveness of the Group’s corporate governance procedures or its risk and control procedures.
We read the other information contained in the Annual Report and consider whether it is consistent with the audited financial statements. The other information comprises only the 2011 Financial Performance Overview, the Chairman’s Statement, the Chief Executive’s Review, the Operations Review, the Finance Review, the Corporate Governance Statement, the Directors’ Report, the unaudited part of the Remuneration Report and all other information listed on the contents page. We consider the implications for our report if we become aware of any apparent misstatements or material inconsistencies with the financial statements. Our responsibilities do not extend to any other information.
63
SMU
RFIT K
APPA
GR
OU
P A
NN
UA
L REPO
RT 2
01
1
Basis of audit opinionWe conducted our audit in accordance with International Standards on Auditing (UK and Ireland) issued by the Auditing Practices Board. An audit includes examination, on a test basis, of evidence relevant to the amounts and disclosures in the financial statements. It also includes an assessment of the significant estimates and judgements made by the directors in the preparation of the financial statements, and of whether the accounting policies are appropriate to the Group’s and Parent Company’s circumstances, consistently applied and adequately disclosed.
We planned and performed our audit so as to obtain all the information and explanations which we considered necessary in order to provide us with sufficient evidence to give reasonable assurance that the financial statements are free from material misstatement, whether caused by fraud or other irregularity or error. In forming our opinion we also evaluated the overall adequacy of the presentation of information in the financial statements.
OpinionIn our opinion:
the Group financial statements give a true and fair ■■
view, in accordance with IFRSs as adopted by the European Union, of the state of the Group’s affairs as at 31 December 2011 and of its profit and cash flows for the year then ended;
the Parent Company financial statements give a ■■
true and fair view, in accordance with IFRSs as adopted by the European Union as applied in accordance with the provisions of the Companies Acts 1963 to 2009, of the state of the Parent Company’s affairs as at 31 December 2011 and cash flows for the year then ended; and
the financial statements have been properly ■■
prepared in accordance with the Companies Acts, 1963 to 2009 and, as regards the Group financial statements, Article 4 of the IAS Regulation.
We have obtained all the information and explanations which we consider necessary for the purposes of our audit. In our opinion proper books of account have been kept by the Parent Company. The Parent Company balance sheet is in agreement with the books of account.
In our opinion the information given in the directors’ report is consistent with the financial statements and the description in the Corporate Governance Statement of the main features of the internal control and risk management systems in relation to the process for preparing the Group financial statements is consistent with the Group financial statements.
The net assets of the Parent Company, as stated in the Parent Company balance sheet are more than half of the amount of its called-up share capital and, in our opinion, on that basis there did not exist at 31 December 2011 a financial situation which under Section 40 (1) of the Companies (Amendment) Act, 1983 would require the convening of an extraordinary general meeting of the Parent Company.
John McDonnell for and on behalf of PricewaterhouseCoopers Chartered Accountants and Statutory Audit Firm Dublin, Ireland
5 March 2012
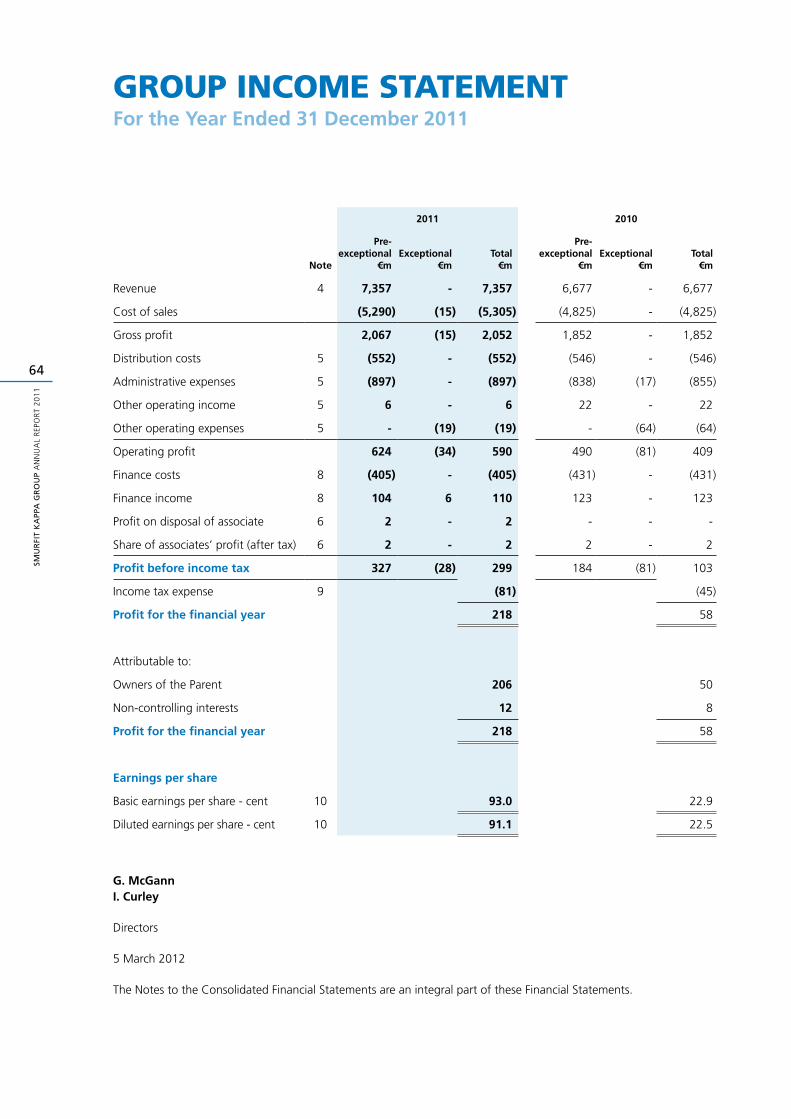
SMU
RFI
T K
APP
A G
RO
UP
AN
NU
AL
REP
OR
T 2
01
1
64
Group inCome StatementFor the Year Ended 31 December 2011
2011 2010
Note
Pre-exceptional
€mExceptional
€mTotal
€m
Pre-exceptional
€mExceptional
€mTotal
€m
Revenue 4 7,357 - 7,357 6,677 - 6,677
Cost of sales (5,290) (15) (5,305) (4,825) - (4,825)
Gross profit 2,067 (15) 2,052 1,852 - 1,852
Distribution costs 5 (552) - (552) (546) - (546)
Administrative expenses 5 (897) - (897) (838) (17) (855)
Other operating income 5 6 - 6 22 - 22
Other operating expenses 5 - (19) (19) - (64) (64)
Operating profit 624 (34) 590 490 (81) 409
Finance costs 8 (405) - (405) (431) - (431)
Finance income 8 104 6 110 123 - 123
Profit on disposal of associate 6 2 - 2 - - -
Share of associates’ profit (after tax) 6 2 - 2 2 - 2
Profit before income tax 327 (28) 299 184 (81) 103
Income tax expense 9 (81) (45)
Profit for the financial year 218 58
Attributable to:
Owners of the Parent 206 50
Non-controlling interests 12 8
Profit for the financial year 218 58
Earnings per share
Basic earnings per share - cent 10 93.0 22.9
Diluted earnings per share - cent 10 91.1 22.5
G. McGann I. Curley
Directors
5 March 2012
The Notes to the Consolidated Financial Statements are an integral part of these Financial Statements.
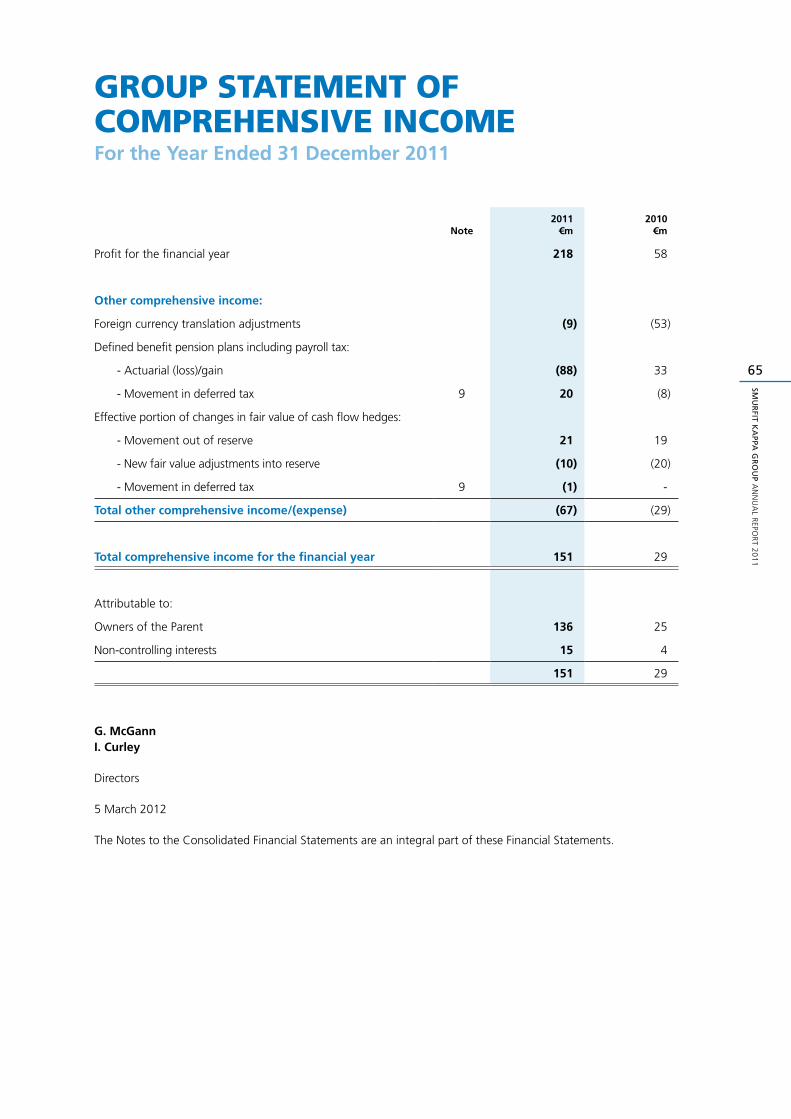
65
SMU
RFIT K
APPA
GR
OU
P A
NN
UA
L REPO
RT 2
01
1
Group Statement of ComprehenSive inComeFor the Year Ended 31 December 2011
Note2011
€m2010
€m
Profit for the financial year 218 58
Other comprehensive income:
Foreign currency translation adjustments (9) (53)
Defined benefit pension plans including payroll tax:
- Actuarial (loss)/gain (88) 33
- Movement in deferred tax 9 20 (8)
Effective portion of changes in fair value of cash flow hedges:
- Movement out of reserve 21 19
- New fair value adjustments into reserve (10) (20)
- Movement in deferred tax 9 (1) -
Total other comprehensive income/(expense) (67) (29)
Total comprehensive income for the financial year 151 29
Attributable to:
Owners of the Parent 136 25
Non-controlling interests 15 4
151 29
G. McGann I. Curley
Directors
5 March 2012
The Notes to the Consolidated Financial Statements are an integral part of these Financial Statements.
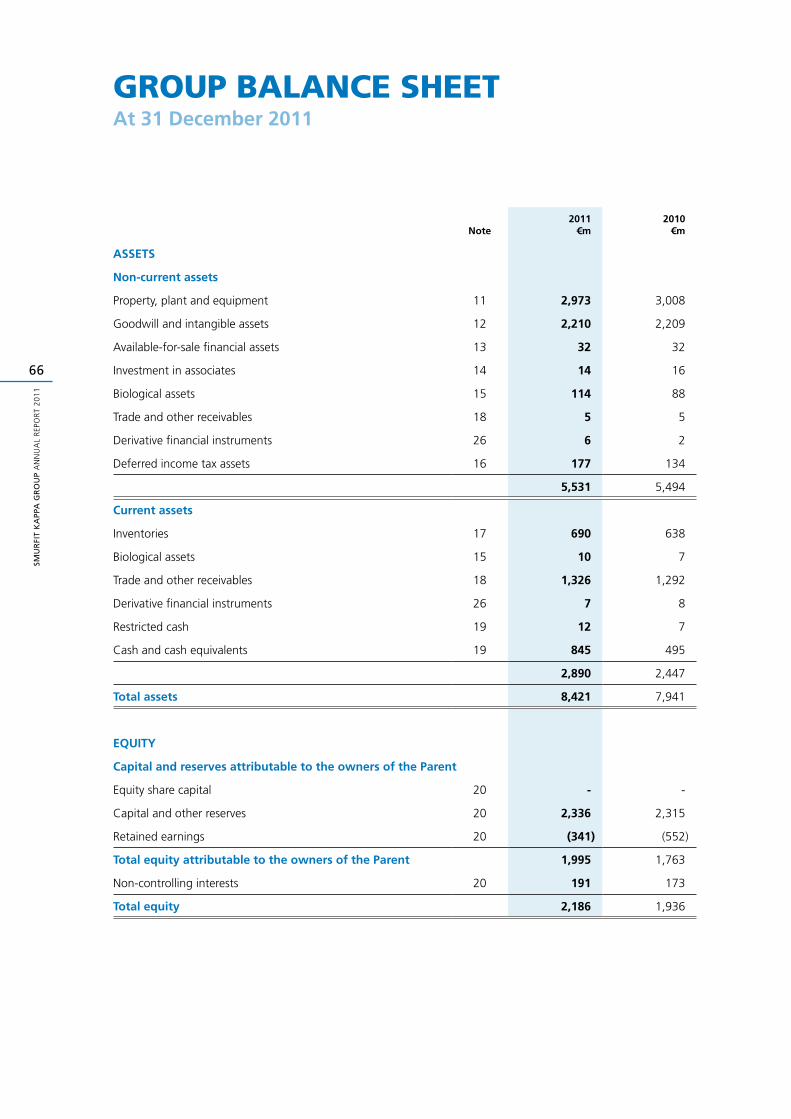
SMU
RFI
T K
APP
A G
RO
UP
AN
NU
AL
REP
OR
T 2
01
1
66
Group balanCe SheetAt 31 December 2011
Note2011
€m2010
€m
ASSETS
Non-current assets
Property, plant and equipment 11 2,973 3,008
Goodwill and intangible assets 12 2,210 2,209
Available-for-sale financial assets 13 32 32
Investment in associates 14 14 16
Biological assets 15 114 88
Trade and other receivables 18 5 5
Derivative financial instruments 26 6 2
Deferred income tax assets 16 177 134
5,531 5,494
Current assets
Inventories 17 690 638
Biological assets 15 10 7
Trade and other receivables 18 1,326 1,292
Derivative financial instruments 26 7 8
Restricted cash 19 12 7
Cash and cash equivalents 19 845 495
2,890 2,447
Total assets 8,421 7,941
EQUITY
Capital and reserves attributable to the owners of the Parent
Equity share capital 20 - -
Capital and other reserves 20 2,336 2,315
Retained earnings 20 (341) (552)
Total equity attributable to the owners of the Parent 1,995 1,763
Non-controlling interests 20 191 173
Total equity 2,186 1,936
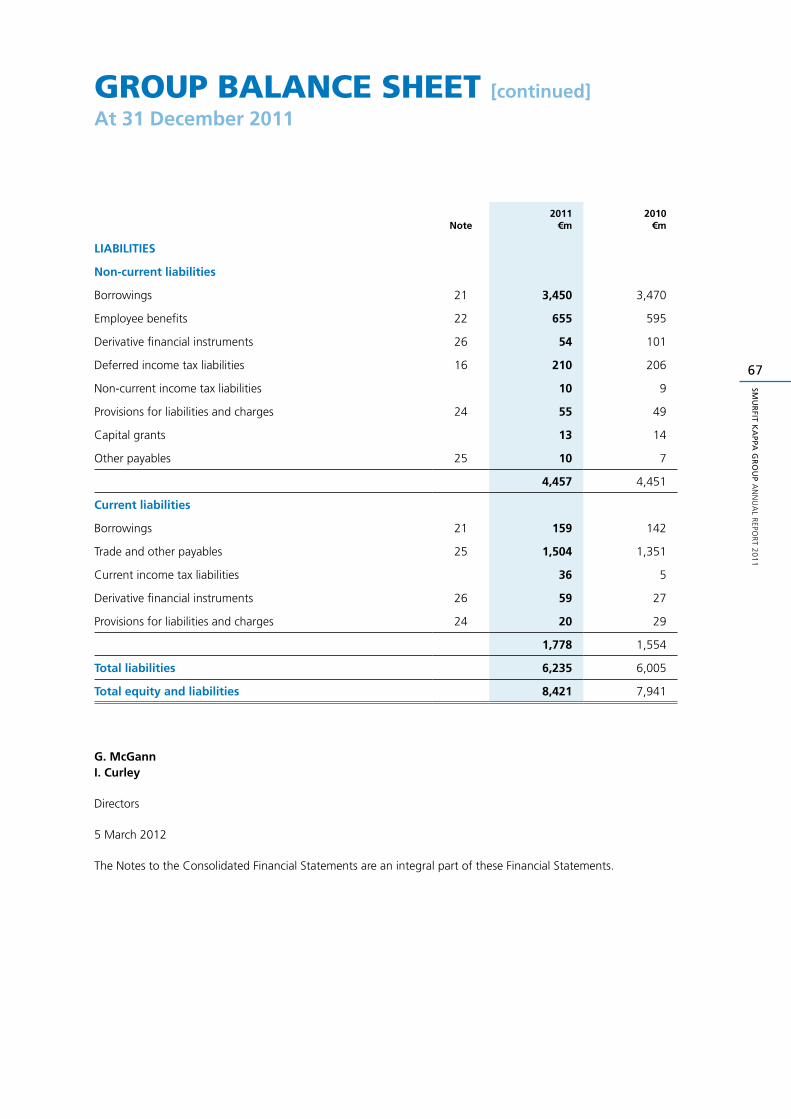
67
SMU
RFIT K
APPA
GR
OU
P A
NN
UA
L REPO
RT 2
01
1
Group balanCe Sheet [continued]
At 31 December 2011
Note2011
€m2010
€m
LIABILITIES
Non-current liabilities
Borrowings 21 3,450 3,470
Employee benefits 22 655 595
Derivative financial instruments 26 54 101
Deferred income tax liabilities 16 210 206
Non-current income tax liabilities 10 9
Provisions for liabilities and charges 24 55 49
Capital grants 13 14
Other payables 25 10 7
4,457 4,451
Current liabilities
Borrowings 21 159 142
Trade and other payables 25 1,504 1,351
Current income tax liabilities 36 5
Derivative financial instruments 26 59 27
Provisions for liabilities and charges 24 20 29
1,778 1,554
Total liabilities 6,235 6,005
Total equity and liabilities 8,421 7,941
G. McGann I. Curley
Directors
5 March 2012
The Notes to the Consolidated Financial Statements are an integral part of these Financial Statements.
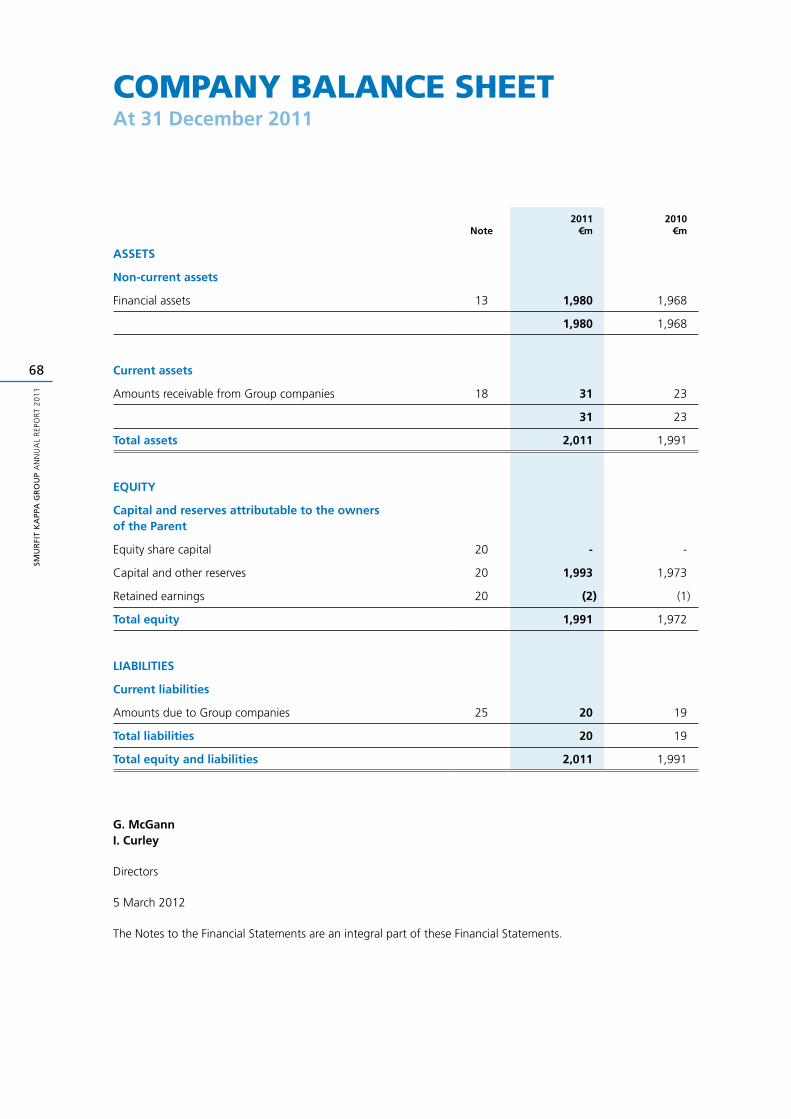
SMU
RFI
T K
APP
A G
RO
UP
AN
NU
AL
REP
OR
T 2
01
1
68
Company balanCe SheetAt 31 December 2011
Note2011
€m2010
€m
ASSETS
Non-current assets
Financial assets 13 1,980 1,968
1,980 1,968
Current assets
Amounts receivable from Group companies 18 31 23
31 23
Total assets 2,011 1,991
EQUITY
Capital and reserves attributable to the owners of the Parent
Equity share capital 20 - -
Capital and other reserves 20 1,993 1,973
Retained earnings 20 (2) (1)
Total equity 1,991 1,972
LIABILITIES
Current liabilities
Amounts due to Group companies 25 20 19
Total liabilities 20 19
Total equity and liabilities 2,011 1,991
G. McGann I. Curley
Directors
5 March 2012
The Notes to the Financial Statements are an integral part of these Financial Statements.
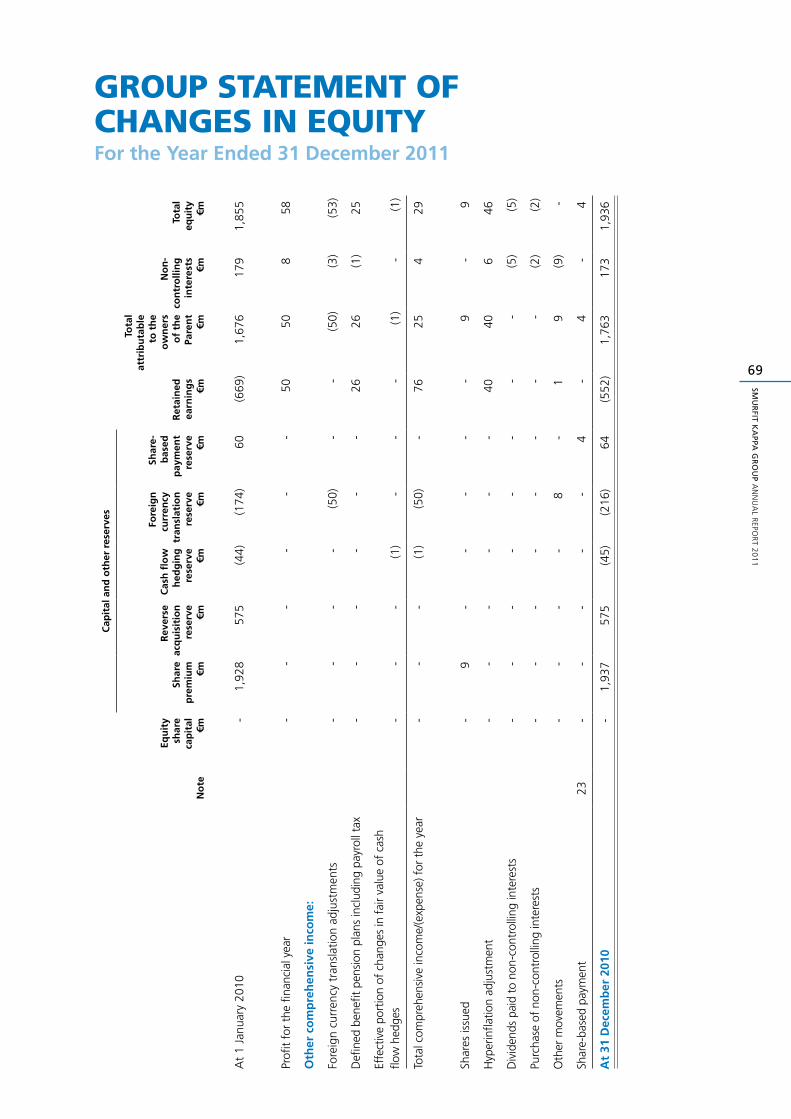
69
SMU
RFIT K
APPA
GR
OU
P A
NN
UA
L REPO
RT 2
01
1
Group Statement of ChanGeS in equity For the Year Ended 31 December 2011
Cap
ital
an
d o
ther
res
erve
s
No
te
Equ
ity
shar
eca
pit
al€m
Shar
ep
rem
ium €m
Rev
erse
acq
uis
itio
nre
serv
e€m
Cas
h fl
ow
hed
gin
gre
serv
e€m
Fore
ign
curr
ency
tran
slat
ion
rese
rve
€m
Shar
e-b
ased
pay
men
tre
serv
e€m
Ret
ain
edea
rnin
gs
€m
Tota
lat
trib
uta
ble
to
th
eo
wn
ers
of
the
Pare
nt
€m
No
n-
con
tro
llin
gin
tere
sts
€m
Tota
l eq
uit
y€m
At
1 Ja
nuar
y 20
10-
1,92
857
5(4
4)(1
74)
60(6
69)
1,67
617
91,
855
Profi
t fo
r th
e fin
anci
al y
ear
--
--
--
5050
858
Oth
er c
om
pre
hen
sive
inco
me:
Fore
ign
curr
ency
tra
nsla
tion
adju
stm
ents
--
--
(50)
--
(50)
(3)
(53)
Defi
ned
bene
fit p
ensi
on p
lans
incl
udin
g pa
yrol
l tax
--
--
--
2626
(1)
25
Effe
ctiv
e po
rtio
n of
cha
nges
in f
air
valu
e of
cas
h flo
w h
edge
s-
--
(1)
--
-(1
)-
(1)
Tota
l com
preh
ensi
ve in
com
e/(e
xpen
se) f
or t
he y
ear
--
-(1
)(5
0)-
7625
429
Shar
es is
sued
-9
--
--
-9
-9
Hyp
erin
flatio
n ad
just
men
t-
--
--
-40
406
46
Div
iden
ds p
aid
to n
on-c
ontr
ollin
g in
tere
sts
--
--
--
--
(5)
(5)
Purc
hase
of
non-
cont
rolli
ng in
tere
sts
--
--
--
--
(2)
(2)
Oth
er m
ovem
ents
--
--
8-
19
(9)
-
Shar
e-ba
sed
paym
ent
23-
--
--
4-
4-
4
At
31 D
ecem
ber
201
0-
1,93
757
5(4
5)(2
16)
64(5
52)
1,76
317
31,
936
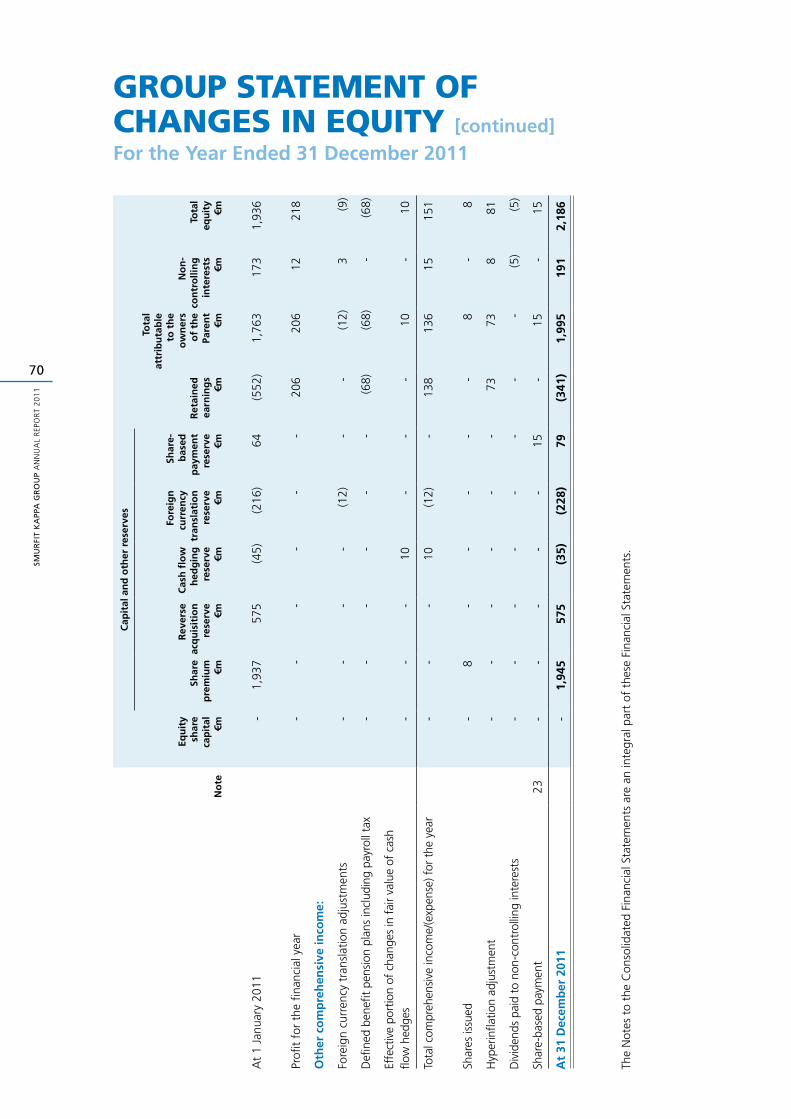
SMU
RFI
T K
APP
A G
RO
UP
AN
NU
AL
REP
OR
T 2
01
1
70
Group Statement of ChanGeS in equity [continued]
For the Year Ended 31 December 2011
Cap
ital
an
d o
ther
res
erve
s
No
te
Equ
ity
shar
eca
pit
al€m
Shar
ep
rem
ium €m
Rev
erse
acq
uis
itio
nre
serv
e€m
Cas
h fl
ow
hed
gin
gre
serv
e€m
Fore
ign
curr
ency
tran
slat
ion
rese
rve
€m
Shar
e-b
ased
pay
men
tre
serv
e€m
Ret
ain
edea
rnin
gs
€m
Tota
lat
trib
uta
ble
to
th
eo
wn
ers
of
the
Pare
nt
€m
No
n-
con
tro
llin
gin
tere
sts
€m
Tota
l eq
uit
y€m
At
1 Ja
nuar
y 20
11-
1,93
757
5(4
5)(2
16)
64(5
52)
1,76
317
31,
936
Profi
t fo
r th
e fin
anci
al y
ear
--
--
--
206
206
1221
8
Oth
er c
om
pre
hen
sive
inco
me:
Fore
ign
curr
ency
tra
nsla
tion
adju
stm
ents
--
--
(12)
--
(12)
3(9
)
Defi
ned
bene
fit p
ensi
on p
lans
incl
udin
g pa
yrol
l tax
--
--
--
(68)
(68)
-(6
8)
Effe
ctiv
e po
rtio
n of
cha
nges
in f
air
valu
e of
cas
h flo
w h
edge
s-
--
10-
--
10-
10
Tota
l com
preh
ensi
ve in
com
e/(e
xpen
se) f
or t
he y
ear
--
-10
(12)
-13
813
615
151
Shar
es is
sued
-8
--
--
-8
-8
Hyp
erin
flatio
n ad
just
men
t-
--
--
-73
738
81
Div
iden
ds p
aid
to n
on-c
ontr
ollin
g in
tere
sts
--
--
--
--
(5)
(5)
Shar
e-ba
sed
paym
ent
23-
--
--
15-
15-
15
At
31 D
ecem
ber
201
1-
1,94
557
5(3
5)(2
28)
79(3
41)
1,99
519
12,
186
The
Not
es t
o th
e C
onso
lidat
ed F
inan
cial
Sta
tem
ents
are
an
inte
gral
par
t of
the
se F
inan
cial
Sta
tem
ents
.
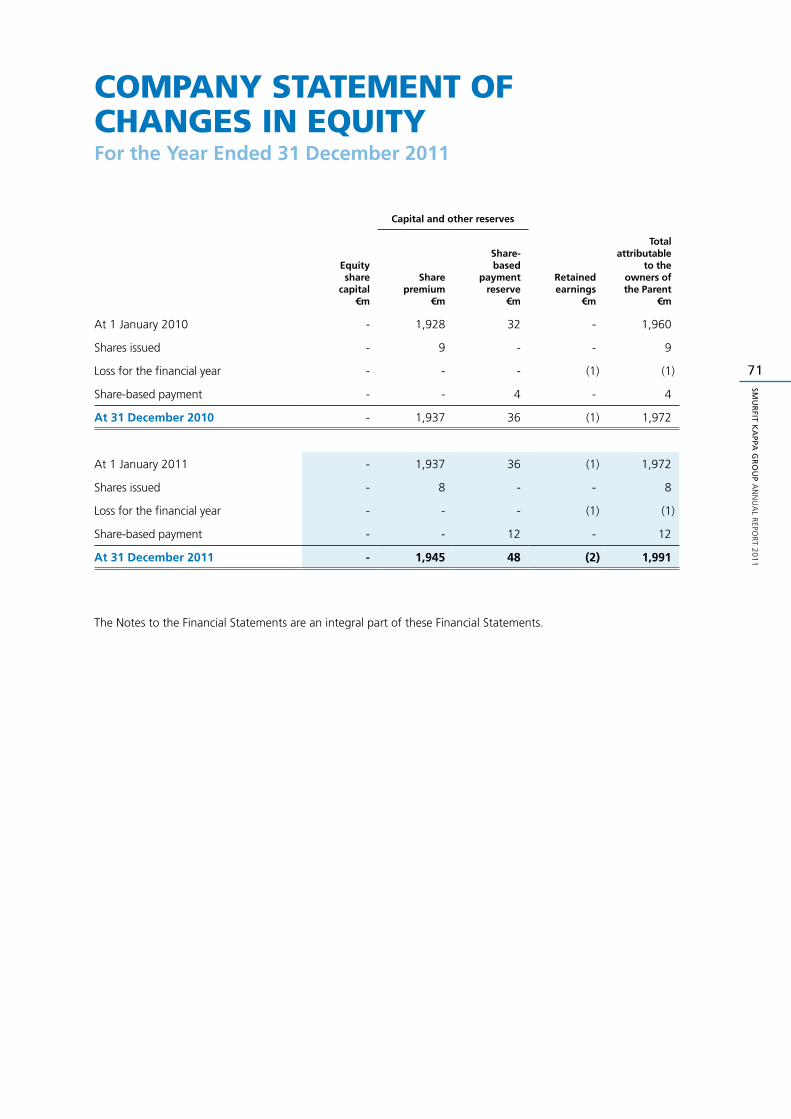
71
SMU
RFIT K
APPA
GR
OU
P A
NN
UA
L REPO
RT 2
01
1
Company Statement of ChanGeS in equityFor the Year Ended 31 December 2011
Capital and other reserves
Equityshare
capital€m
Share premium
€m
Share-based
paymentreserve
€m
Retainedearnings
€m
Totalattributable
to theowners of the Parent
€m
At 1 January 2010 - 1,928 32 - 1,960
Shares issued - 9 - - 9
Loss for the financial year - - - (1) (1)
Share-based payment - - 4 - 4
At 31 December 2010 - 1,937 36 (1) 1,972
At 1 January 2011 - 1,937 36 (1) 1,972
Shares issued - 8 - - 8
Loss for the financial year - - - (1) (1)
Share-based payment - - 12 - 12
At 31 December 2011 - 1,945 48 (2) 1,991
The Notes to the Financial Statements are an integral part of these Financial Statements.
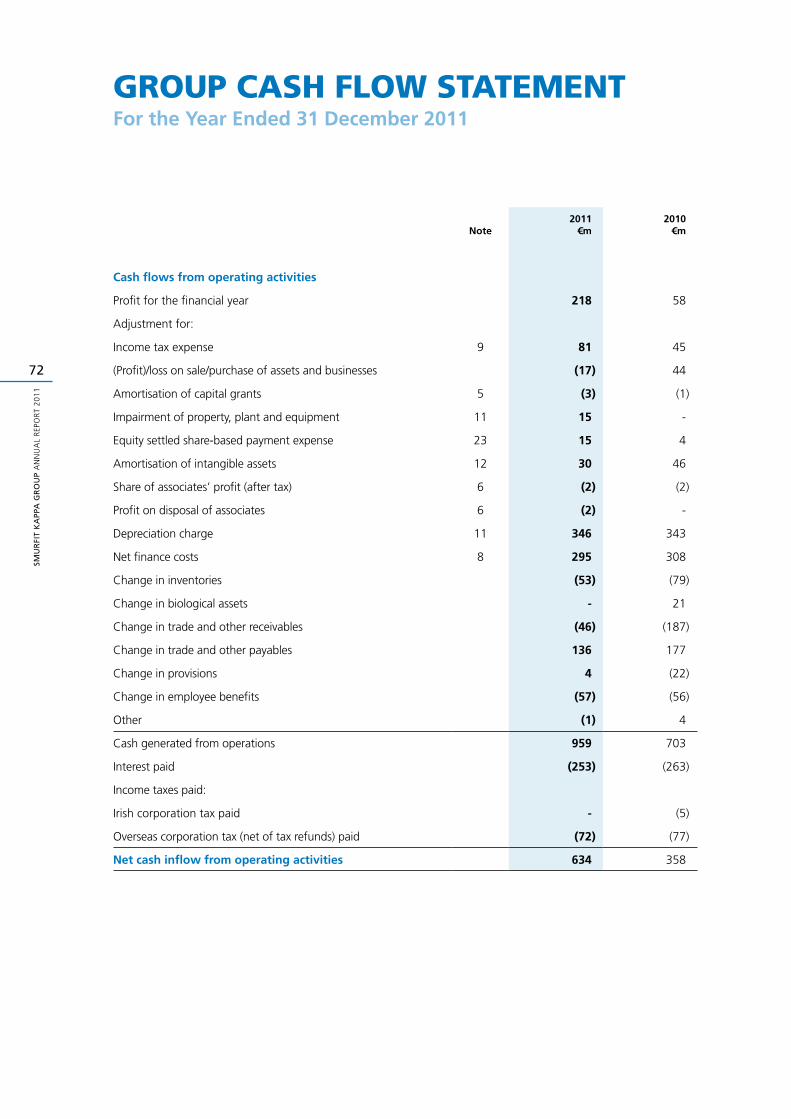
SMU
RFI
T K
APP
A G
RO
UP
AN
NU
AL
REP
OR
T 2
01
1
72
Group CaSh flow StatementFor the Year Ended 31 December 2011
Note2011
€m2010
€m
Cash flows from operating activities
Profit for the financial year 218 58
Adjustment for:
Income tax expense 9 81 45
(Profit)/loss on sale/purchase of assets and businesses (17) 44
Amortisation of capital grants 5 (3) (1)
Impairment of property, plant and equipment 11 15 -
Equity settled share-based payment expense 23 15 4
Amortisation of intangible assets 12 30 46
Share of associates’ profit (after tax) 6 (2) (2)
Profit on disposal of associates 6 (2) -
Depreciation charge 11 346 343
Net finance costs 8 295 308
Change in inventories (53) (79)
Change in biological assets - 21
Change in trade and other receivables (46) (187)
Change in trade and other payables 136 177
Change in provisions 4 (22)
Change in employee benefits (57) (56)
Other (1) 4
Cash generated from operations 959 703
Interest paid (253) (263)
Income taxes paid:
Irish corporation tax paid - (5)
Overseas corporation tax (net of tax refunds) paid (72) (77)
Net cash inflow from operating activities 634 358
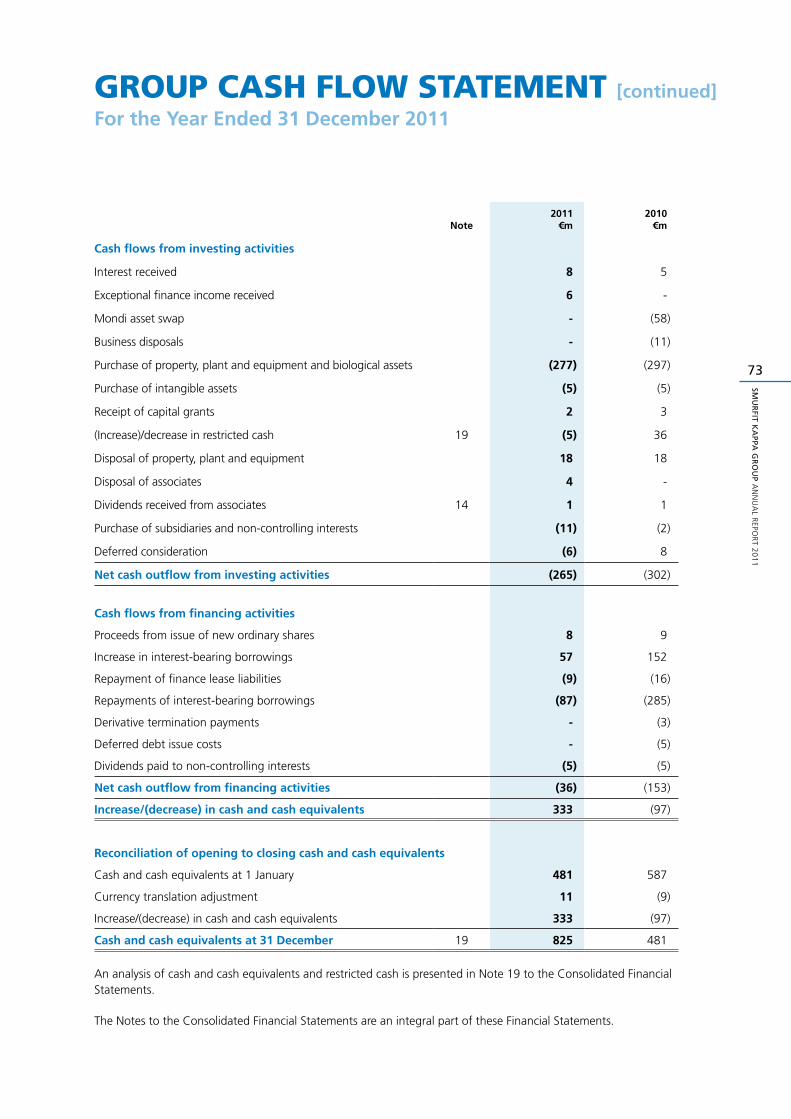
73
SMU
RFIT K
APPA
GR
OU
P A
NN
UA
L REPO
RT 2
01
1
Group CaSh flow Statement [continued]
For the Year Ended 31 December 2011
Note2011
€m2010
€m
Cash flows from investing activities
Interest received 8 5
Exceptional finance income received 6 -
Mondi asset swap - (58)
Business disposals - (11)
Purchase of property, plant and equipment and biological assets (277) (297)
Purchase of intangible assets (5) (5)
Receipt of capital grants 2 3
(Increase)/decrease in restricted cash 19 (5) 36
Disposal of property, plant and equipment 18 18
Disposal of associates 4 -
Dividends received from associates 14 1 1
Purchase of subsidiaries and non-controlling interests (11) (2)
Deferred consideration (6) 8
Net cash outflow from investing activities (265) (302)
Cash flows from financing activities
Proceeds from issue of new ordinary shares 8 9
Increase in interest-bearing borrowings 57 152
Repayment of finance lease liabilities (9) (16)
Repayments of interest-bearing borrowings (87) (285)
Derivative termination payments - (3)
Deferred debt issue costs - (5)
Dividends paid to non-controlling interests (5) (5)
Net cash outflow from financing activities (36) (153)
Increase/(decrease) in cash and cash equivalents 333 (97)
Reconciliation of opening to closing cash and cash equivalents
Cash and cash equivalents at 1 January 481 587
Currency translation adjustment 11 (9)
Increase/(decrease) in cash and cash equivalents 333 (97)
Cash and cash equivalents at 31 December 19 825 481
An analysis of cash and cash equivalents and restricted cash is presented in Note 19 to the Consolidated Financial Statements.
The Notes to the Consolidated Financial Statements are an integral part of these Financial Statements.
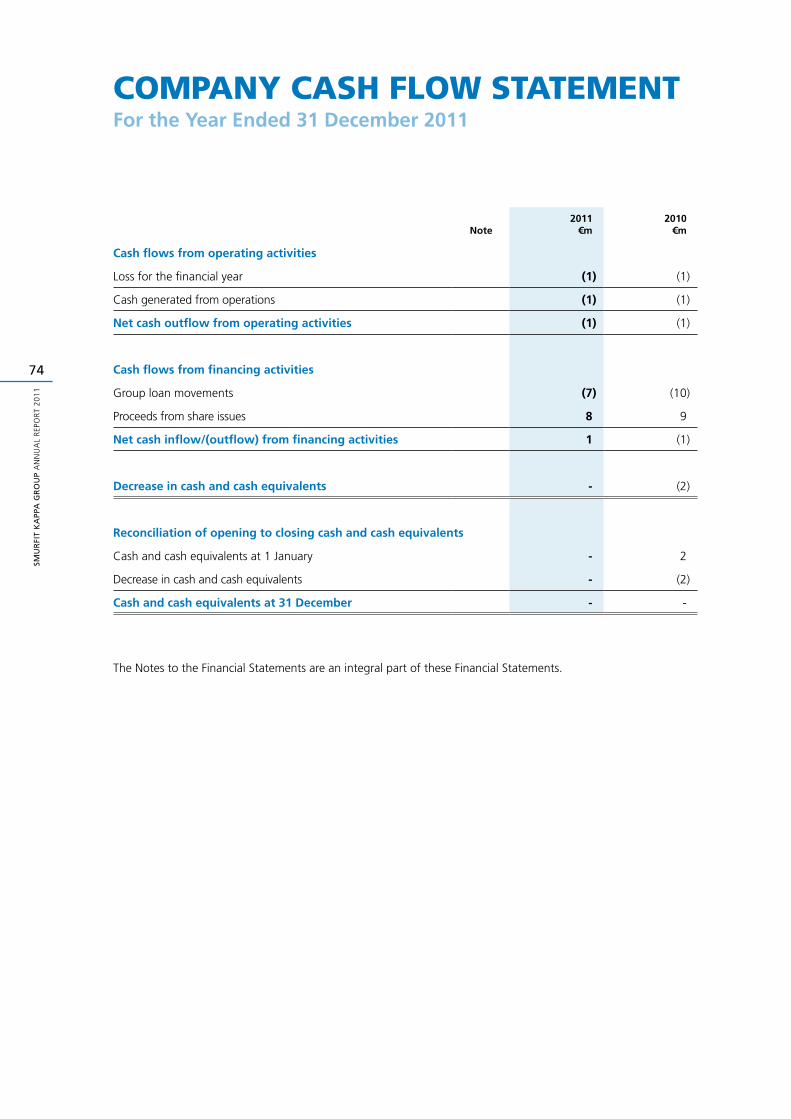
SMU
RFI
T K
APP
A G
RO
UP
AN
NU
AL
REP
OR
T 2
01
1
74
Company CaSh flow StatementFor the Year Ended 31 December 2011
Note2011
€m2010
€m
Cash flows from operating activities
Loss for the financial year (1) (1)
Cash generated from operations (1) (1)
Net cash outflow from operating activities (1) (1)
Cash flows from financing activities
Group loan movements (7) (10)
Proceeds from share issues 8 9
Net cash inflow/(outflow) from financing activities 1 (1)
Decrease in cash and cash equivalents - (2)
Reconciliation of opening to closing cash and cash equivalents
Cash and cash equivalents at 1 January - 2
Decrease in cash and cash equivalents - (2)
Cash and cash equivalents at 31 December - -
The Notes to the Financial Statements are an integral part of these Financial Statements.
75
SMU
RFIT K
APPA
GR
OU
P A
NN
UA
L REPO
RT 2
01
1
noteS to the ConSoliDateD finanCial StatementSFor the Year Ended 31 December 2011
1. General information
Smurfit Kappa Group plc (‘SKG plc’ or ‘the Company’) and its subsidiaries (together ‘the Group’) manufacture, distribute and sell containerboard, corrugated containers and other paper-based packaging products such as solidboard and graphicboard. The Company is a public limited company whose shares are publicly traded. It is incorporated and tax resident in Ireland. The address of its registered office is Beech Hill, Clonskeagh, Dublin 4, Ireland.
The principal companies within the Group during the year ended 31 December 2011 and 31 December 2010 are disclosed in the Principal subsidiaries note.
The Consolidated Financial Statements of the Group for the year ended 31 December 2011 were authorised for issue in accordance with a resolution of the directors on 5 March 2012.
2. Summary of significant accounting policies
Statement of Compliance
The Consolidated Financial Statements have been prepared in accordance with International Financial Reporting Standards (‘IFRS’) issued by the International Accounting Standards Board (‘IASB’) and adopted by the European Union (‘EU’); and, in accordance with Irish law. IFRS adopted by the EU differ in certain respects from IFRS issued by the IASB. References to IFRS hereafter refer to IFRS adopted by the EU.
Basis of Preparation
The financial statements are presented in euro rounded to the nearest million. They have been prepared under the historical cost convention except for the following which are recognised at fair value: derivative financial instruments; available-for-sale financial assets; biological assets; share-based payments, and pension assets. Pension obligations are measured at the present value of the future estimated cash flows of benefits earned. The financial statements of subsidiaries whose functional currency is the currency of a hyperinflationary economy are stated in terms of the measuring unit currency at the end of the reporting period. This is the case for the Group’s subsidiaries in Venezuela.
The preparation of financial statements in accordance with IFRS and Irish law requires the use of accounting judgements, estimates and assumptions that affect the reported amounts of assets, liabilities, income and expenses. The areas involving a higher degree of judgement and areas where assumptions and estimates are significant are discussed in the ‘Significant accounting judgements, estimates and assumptions’ note.
The notes to the Consolidated Financial Statements include the information in the Remuneration Report that is described as being an integral part of the Financial Statements.
New and Amended Standards Effective During 2011
The accounting policies adopted in these Consolidated Financial Statements are consistent with those of the previous financial year. The following new standards, amendments and interpretations became effective in 2011, however, they either do not have an effect on the Consolidated Financial Statements or they are not currently relevant for the Group:
Amendments to IFRIC 14, Prepayments of a Minimum Funding Requirement■■
Classification of Rights Issues (Amendment to IAS 32)■■
IAS 24, Related Party Disclosure (Revised)■■
IFRIC 19, Extinguishing Financial Liabilities with Equity Instruments■■
In addition, a number of annual improvements to IFRS are effective in 2011; however, none of these had or is expected to have a material effect on the Consolidated Financial Statements.
SMU
RFI
T K
APP
A G
RO
UP
AN
NU
AL
REP
OR
T 2
01
1
76
noteS to the ConSoliDateD finanCial StatementS [continued]
For the Year Ended 31 December 2011
2. Summary of significant accounting policies [continued]
Standards issued but not yet effective
IFRS 9 – Financial Instruments: Classification and MeasurementIFRS 9 is the standard to replace IAS 39. It is being completed in a number of phases. The first phase of the project, IFRS 9 (2009), addressed only financial assets. The second phase, IFRS 9 (2010), added the requirements for financial liabilities. EU endorsement of this standard has been postponed pending the issuance of the chapters on hedge accounting and impairment. The new standard is likely to affect the Group’s accounting for some financial instruments. In December 2011, the IASB decided to defer the mandatory effective date until 1 January 2015. Subject to EU endorsement, the Group will apply IFRS 9 from its effective date. The Group will quantify the effect of IFRS 9 in conjunction with the remaining phases, when issued.
IFRS 10 Consolidated Financial Statements, IFRS 11 Joint Arrangements, and IFRS 12 Disclosure of Interests in Other Entities.In May 2011, the IASB issued IFRS 10 Consolidated Financial Statements, IFRS 11 Joint Arrangements and IFRS 12 Disclosure of Interests in Other Entities. IFRS 10 provides a single consolidation model that identifies control as the basis for consolidation for all types of entities. IFRS 10 replaces IAS 27 Consolidated and Separate Financial Statements and SIC-12 Consolidation - Special Purpose Entities. IFRS 11 establishes principles for financial reporting by the parties to a joint arrangement. It supersedes IAS 31 Interests in Joint Ventures and SIC-13 Jointly Controlled Entities – Non-monetary Contributions by Venturers. IFRS 12 combines, enhances and replaces the disclosure requirements for subsidiaries, joint arrangements, associates and unconsolidated structured entities. As a consequence of these new IFRS, the IASB also issued amended and retitled IAS 27 Separate Financial Statements and IAS 28 Investments in Associates and Joint Ventures. The new requirements are effective for the Group for the 2013 financial year. The Group is assessing the impact of these new standards on the Consolidated Financial Statements but does not currently expect a material effect.
IFRS 13 Fair Value MeasurementIssued in May 2011, IFRS 13 Fair Value Measurement defines fair value, sets out a single framework for measuring fair value and requires disclosures about fair value measurements. IFRS 13 applies when other IFRS require or permit fair value measurements. It does not introduce new requirements to measure an asset or a liability at fair value, change what is measured at fair value in IFRS or address how to present changes in fair value. Subject to EU endorsement, the new requirements will be effective for the Group from 1 January 2013. The Group does not expect any material change to the Consolidated Financial Statements on adoption.
IAS 27 Separate Financial Statements and IAS 28 Investments in Associates and Joint VenturesAs a consequence of the issuance of IFRS 10 and IFRS 12, both IAS 27 and IAS 28 have been revised. IAS 27 (renamed as ‘Separate Financial Statements’), deals only with accounting for subsidiaries, joint arrangements and associates in separate financial statements. IAS 28 (renamed as ‘Investments in Associates and Joint Ventures’) describes the application of the equity method to investments in joint ventures and associates. The revised standards are effective for the Group from 1 January 2013. The Group does not expect any material change to the Consolidated Financial Statements to arise from their adoption.
Disclosures - Transfers of Financial Assets (Amendments to IFRS 7)These amendments extend the disclosure requirements relating to transfers of financial assets, particularly in securitisation transactions. The extended disclosures are intended to help evaluate the risk exposures relating to transfers of financial assets and the effect of those risks on an entity’s financial position. Subject to EU endorsement, the Group will adopt the amended standard for the 2012 financial year. It is not expected to have an effect on the Consolidated Financial Statements.
77
SMU
RFIT K
APPA
GR
OU
P A
NN
UA
L REPO
RT 2
01
1
2. Summary of significant accounting policies [continued]
Presentation of Items of Other Comprehensive IncomeThe amended IAS 1 requires the grouping of items that may be reclassified to profit or loss at a future point in time separately from items which will never be reclassified. The amendment affects presentation only and will have no impact on the Group’s financial position or performance. Subject to EU endorsement, the amendment becomes effective for the Group from 1 January 2013.
IAS 19 Employee Benefits (Amendments)The IASB has issued a number of amendments to IAS 19. The main changes are the removal of the corridor approach and the concept of expected returns on plan assets. The Group does not apply the corridor approach so no related adjustment is expected. The Group is currently assessing the full impact of the remaining amendments. Subject to EU endorsement, IAS 19 as amended will become effective for the Group from 1 January 2013.
The following new pronouncements have been issued but are not yet effective however, they either do not have an effect on the Consolidated Financial Statements or they are not currently relevant for the Group:
Amendments to IAS 32■■
Amendments to IFRS 7■■
IFRIC 20 Stripping Costs in the Production Phase of a Surface Mine■■
IAS 12 Income taxes – Recovery of Underlying Assets■■
Basis of ConsolidationThe Consolidated Financial Statements include the annual Financial Statements of the Company and all of its subsidiaries and associates, drawn up to 31 December. The Group does not have investments in joint ventures as defined in IFRS.
SubsidiariesThe Financial Statements of subsidiaries are included in the Consolidated Financial Statements from the date on which control over the operating and financial decisions is obtained; they cease to be consolidated from the date on which control is lost. Control exists when the Group has the power, directly or indirectly, to govern the financial and operating policies of an entity so as to obtain economic benefits from its activities. The existence and effect of potential voting rights that are currently exercisable or convertible are considered in determining whether control exists. All significant subsidiaries have coterminous financial year ends. Where necessary, the accounting policies of subsidiaries have been modified to ensure consistency with the policies adopted by the Group. Intragroup transactions, intragroup balances and any unrealised gains and losses arising from intragroup transactions are eliminated in preparing the Group Financial Statements except to the extent that such losses provide evidence of impairment. The Company’s investments in subsidiaries are carried at cost less impairment.
Non-controlling interests represent the portion of a subsidiary’s equity which is not attributable to the Group. They are presented separately in the Group Income Statement, Group Statement of Comprehensive Income and Group Balance Sheet. Changes in ownership of a subsidiary which do not result in a change of control are treated as equity transactions.
AssociatesAssociates are entities in which the Group has a participating interest and is in a position to exercise significant influence over their operating and financial policies. Investments in associates are initially recognised at cost and accounted for using the equity method. The Group’s investment in associates includes goodwill identified on acquisition, net of any accumulated impairment losses. Associates are included in the Consolidated Financial Statements from the date on which significant influence arises until the date on which such influence ceases to exist. When an associate reports losses the Group’s carrying value of the associate is not reduced below zero. Further losses are only recognised to the extent that the Group has incurred obligations in respect of the associate.
SMU
RFI
T K
APP
A G
RO
UP
AN
NU
AL
REP
OR
T 2
01
1
78
noteS to the ConSoliDateD finanCial StatementS [continued]
For the Year Ended 31 December 2011
2. Summary of significant accounting policies [continued]
Under the equity method, the Group profit or loss includes its share of each associate’s profit or loss after tax. The Group share of post-acquisition movements in the equity of each associate is recognised in the Group Statement of Comprehensive Income. Investments in associates are carried at cost adjusted for the Group share of post-acquisition changes in the associate’s net assets, less any impairment in value. Where indicators of impairment arise, the carrying amount of the associate is tested for impairment by comparing its recoverable amount with its carrying amount. Unrealised gains arising from transactions with associates are eliminated to the extent of the Group’s interest in the entity. Unrealised losses are similarly eliminated to the extent that they do not provide evidence of impairment. The financial statements of associates are modified to ensure consistency with Group policies.
Business combinationsThe Group uses the acquisition method in accounting for business combinations. Under the acquisition method, the assets and liabilities of an acquired business are initially recognised at their fair value at the date of acquisition. The cost of a business combination is measured as, the aggregate of the fair value at the date of exchange of assets transferred, liabilities incurred or assumed and equity instruments issued in exchange for control. To the extent that settlement of all or any part of a business combination is deferred, the fair value of the deferred component is determined by discounting the amounts payable to their present value at the date of exchange. The discount component is unwound as an interest expense in the Group Income Statement over the life of the obligation. Where a business combination agreement provides for an adjustment to the cost of the combination which is contingent on future events and the contingent consideration is measured at fair value. Any subsequent remeasurement of the contingent amount is recognised in profit or loss. When the initial accounting for a business combination is determined provisionally, any adjustments to the provisional values allocated to the identifiable assets and liabilities are made within twelve months of the acquisition date. On an acquisition by acquisition basis any non-controlling interest in an acquiree is measured at fair value or at the non-controlling interest’s proportionate share of the acquiree’s net identifiable assets. Acquisition related costs are expensed as incurred.
Foreign currencyItems included in the financial statements of each of the Group’s entities are measured using the currency of the primary economic environment in which the entity operates (‘the functional currency’).
Transactions in foreign currencies are translated into the functional currency of the entity at the exchange rate ruling at the date of the transaction. Non-monetary assets and liabilities carried at cost are not subsequently retranslated. Non-monetary assets carried at fair value are subsequently remeasured at the exchange rate at the date of valuation.
Monetary assets and liabilities denominated in foreign currencies are translated into functional currencies at the foreign exchange rate ruling at the balance sheet date. Foreign exchange differences arising on translation are recognised in profit or loss with the exception of differences on foreign currency borrowings that qualify as a hedge of the Group’s net investment in foreign operations. The portion of exchange gains or losses on foreign currency borrowing used to provide a hedge against a net investment in a foreign operation and that is determined to be an effective hedge is recognised in other comprehensive income. The ineffective portion is recognised immediately in profit or loss.
The assets and liabilities of entities that do not have the euro as their functional currency, including goodwill arising on consolidation, are translated to euro at the foreign exchange rates ruling at the balance sheet date. Their income, expenses and cash flows are translated to euro at average exchange rates during the year. However, if a Group entity’s functional currency is the currency of a hyperinflationary economy, that entity’s financial statements are first restated in accordance with IAS 29, Financial Reporting in Hyperinflationary Economies (see ‘Reporting in hyperinflationary economies’ below). Under IAS 29 income, costs and balance sheet amounts are translated at the exchange rates ruling at the balance sheet date.
79
SMU
RFIT K
APPA
GR
OU
P A
NN
UA
L REPO
RT 2
01
1
2. Summary of significant accounting policies [continued]
Foreign exchange differences arising on translation of net investments including those arising on long-term intragroup loans deemed to be quasi equity in nature are recognised in other comprehensive income.
On disposal of a foreign operation, accumulated currency translation differences are reclassified to profit or loss as part of the overall gain or loss on disposal.
Reporting in hyperinflationary economies
When the economy of a country in which we operate is deemed hyperinflationary and the functional currency of a Group entity is the currency of that hyperinflationary economy, the financial statements of such Group entities are adjusted so that they are stated in terms of the measuring unit current at the end of the reporting period. This involves restatement of income and expenses to reflect changes in the general price index from the start of the reporting period and, restatement of non-monetary items in the balance sheet, such as property, plant and equipment and inventories, to reflect current purchasing power as at the period end using a general price index from the date when they were first recognised. The gain or loss on the net monetary position for the year is included in finance costs or income. Comparative amounts are not restated. The restated income, expenses and balance sheets are translated to euro at the closing rate at the end of the reporting period. Differences arising on translation to euro are recognised in other comprehensive income.
Property, plant and equipment
Items of property, plant and equipment are stated at cost less accumulated depreciation and impairment charges. Cost includes expenditure that is directly attributable to the acquisition of the assets. Software that is integral to the functionality of the related equipment is capitalised as part of that equipment. Subsequent costs are included in the asset’s carrying amount or recognised as a separate asset, as appropriate, only when it is probable that future economic benefits associated with the item will flow to the Group and the cost of the item can be measured reliably. The carrying amount of the replaced part is derecognised. Other repair and maintenance expenditure that does not meet the asset recognition criteria is expensed to profit or loss as incurred. Land is not depreciated. Depreciation on other assets is calculated to write off the carrying amount of property, plant and equipment, other than freehold land, on a straight-line basis at the following annual rates:
Freehold and long leasehold buildings: 2-5%
Plant and equipment: 3-33%
Fixtures and fittings: 10-25%
Motor vehicles: 20-25%
The estimated residual value and the useful lives of assets are reviewed at each balance sheet date.
Goodwill and impairment
Goodwill is the excess of the cost of an acquisition over the Group share of the fair value of the identifiable assets and liabilities acquired. When the fair value of the identifiable assets and liabilities acquired exceeds the cost of a combination the values are reassessed and any remaining gain is recognised immediately in profit or loss. Goodwill is allocated to the groups of cash-generating units (‘CGUs’) that are expected to benefit from the synergies of the combination. This is the lowest level at which goodwill is monitored for internal management purposes. After initial recognition goodwill is measured at cost less any accumulated impairment losses.
Goodwill is subject to impairment testing on an annual basis, at a consistent time each year and, at any time an impairment indicator is considered to exist. Impairment is determined by comparing the carrying amount to the recoverable amount of the groups of CGUs to which the goodwill relates. The recoverable amount is the greater of; fair value less costs to sell, and value-in-use. When the recoverable amount of the groups of CGUs is less than the carrying amount, an impairment loss is recognised.
SMU
RFI
T K
APP
A G
RO
UP
AN
NU
AL
REP
OR
T 2
01
1
80
noteS to the ConSoliDateD finanCial StatementS [continued]
For the Year Ended 31 December 2011
2. Summary of significant accounting policies [continued]
Where goodwill forms part of a group of CGUs and part of the operation within that unit is disposed of, the goodwill associated with the operation disposed of is included in the carrying amount of the operation when determining the gain or loss on disposal of the operation. Goodwill disposed of in this circumstance is measured on the basis of the relative values of the operation disposed of and the portion of the group of cash-generating units retained.
In the year in which a business combination occurs, and the goodwill arising affects the goodwill allocation to CGUs, the groups of CGUs are tested for impairment prior to the end of that year. Impairment losses on goodwill are recognised in profit or loss and are not reversed following recognition.
Intangible assets (other than goodwill)
These include software development costs as well as marketing and customer related intangible assets arising from business combinations. They are initially recognised at cost which, for those arising in a business combination, is their fair value at the date of acquisition. Subsequently intangible assets are carried at cost less any accumulated amortisation and impairment. Cost is amortised on a straight-line basis over their estimated useful lives which vary from three to ten years. Carrying values are reviewed for indicators of impairment at each reporting date and are subject to impairment testing when events or changes in circumstances indicate that the carrying values may not be recoverable. Further information is provided in the Goodwill and intangible assets note.
Impairment of non-financial assets (other than goodwill)
Long-term tangible and intangible assets that are subject to amortisation or depreciation are tested for impairment whenever events or changes in circumstances indicate that the carrying amount may not be recoverable. An impairment loss is recognised for the amount by which the asset’s carrying amount exceeds its recoverable amount. The recoverable amount is the higher of an asset’s fair value less costs to sell and value in-use. When assessing impairment, assets are grouped at the lowest levels for which there are separately identifiable cash flows (CGUs). Non-financial assets other than goodwill that have suffered impairment losses are reviewed for possible reversal of the impairment at each reporting date.
Research and development
Expenditure on research and development activities is generally recognised in profit or loss as an expense when incurred. Costs incurred on development projects are recognised as intangible assets only if the criteria for capitalisation of internally generated intangible assets in IAS 38, Intangible Assets, are met. No expenditure has been capitalised to date on the basis that management do not regard those criteria as having been met.
Biological assets
The Group holds standing timber which is classified as a biological asset and is stated at fair value less estimated costs to sell. Changes in value are recognised in profit or loss. The fair value of standing timber is calculated using weighted average prices for similar transactions with third parties, where available. Where this is not practical, the Group uses the discounted cash flow method, based on a model which takes into account assumptions including the expected yield of the forests, timber selling price reduced by costs relating to harvest and transportation, plantation and maintenance costs and an appropriate discount rate. At the time of harvest, wood is recognised at fair value less estimated costs to sell and transferred to inventory.
Financial instruments
A financial instrument is recognised when the Group becomes a party to its contractual provisions. Financial assets are derecognised when the Group’s contractual rights to the cash flows from the financial assets expire, are extinguished or transferred to a third party. Financial liabilities are derecognised when the Group’s obligations specified in the contracts expire, are discharged or cancelled.
81
SMU
RFIT K
APPA
GR
OU
P A
NN
UA
L REPO
RT 2
01
1
2. Summary of significant accounting policies [continued]
Cash and cash equivalents comprise cash balances held for the purposes of meeting short-term cash commitments and investments which are readily convertible to a known amount of cash and are subject to an insignificant risk of changes in value. Where investments are categorised as cash equivalents, the related balances have a maturity of three months or less from the date of acquisition. Bank overdrafts that are repayable on demand and form an integral part of the Group’s cash management are included as a component of cash and cash equivalents for the purpose of the Group Cash Flow Statement. Cash and cash equivalents are carried at amortised cost.
Restricted cash comprises cash held by the Group but which is ring fenced or used as security for specific financing arrangements, and to which the Group does not have unfettered access. Restricted cash is measured at amortised cost.
Short-term bank deposits of greater than three months maturity which do not meet the definition of cash and cash equivalents are classified as financial assets within current assets and stated at amortised cost.
Equity and debt investments are classified as available-for-sale and are stated at fair value. Changes in fair value are recognised directly in other comprehensive income, however impairment losses are recognised in profit or loss. On disposal the cumulative gain or loss recognised in other comprehensive income is reclassified to profit or loss as part of the gain or loss arising. When applicable, interest is recognised in profit or loss using the effective interest method.
Borrowings are recognised initially at fair value, net of transaction costs and are subsequently stated at amortised cost; any difference between the proceeds (net of transaction costs) and the redemption value is recognised in profit or loss over the period of the borrowings using the effective interest method. Borrowings are classified as current liabilities unless the Group has an unconditional right to defer settlement of the liability for at least one year after the balance sheet date.
The Group has entered into a series of securitisation transactions involving certain of its trade receivables and the establishment of certain special purpose entities to effect these transactions. These special purpose entities are consolidated as they are considered to be controlled by the Group. The related securitised assets continue to be recognised on the Group Balance Sheet.
Trade and other receivables are recognised initially at fair value and are thereafter measured at amortised cost using the effective interest method, less any provision for impairment. A provision for impairment of trade receivables is recognised when there is objective evidence that the Group will not be able to collect all amounts due according to the original terms of the receivables. Impairments are recognised in profit or loss once identified.
Trade and other payables are recognised initially at fair value and subsequently measured at amortised cost using the effective interest method.
Derivative financial instruments and hedging activitiesThe Group uses derivative financial instruments to manage certain foreign currency, interest rate and commodity price exposures. All derivatives are recognised at fair value. The treatment of changes in fair value depends on whether the derivative is designated as a hedging instrument, the nature of the item being hedged and the effectiveness of the hedge. The Group designates certain derivatives as either:
(a) hedges of a particular risk associated with a recognised floating rate asset or liability or a highly probable forecast transaction (cash flow hedges) or
(b) hedges of net investments in foreign operations (net investment hedges).
SMU
RFI
T K
APP
A G
RO
UP
AN
NU
AL
REP
OR
T 2
01
1
82
noteS to the ConSoliDateD finanCial StatementS [continued]
For the Year Ended 31 December 2011
2. Summary of significant accounting policies [continued]
At inception the Group documents the relationship between the hedging instrument and hedged items, its risk management objectives and the strategy for undertaking the transaction. The Group also documents its assessment of whether the derivative is highly effective in offsetting changes in fair value or cash flows of hedged items, both at inception and in future periods.
The fair values of various derivative instruments used for hedging purposes are disclosed in the Financial instruments note. Movements on the cash flow hedging reserve in shareholders’ equity are shown in the Capital and reserves note. The full fair value of a hedging derivative is classified as a non-current asset or liability when the remaining maturity of the hedged item is more than one year; it is classified as a current asset or liability when the remaining maturity of the hedged item is less than one year. Non-hedging derivative assets and liabilities are classified as current or non-current based on expected realisation or settlement dates.
Cash flow hedgesChanges in the fair value of derivative hedging instruments designated as cash flow hedges are recognised in other comprehensive income to the extent that the hedge is effective. Amounts accumulated in other comprehensive income are reclassified to profit or loss in the same periods that the hedged items affect profit or loss. The reclassified gain or loss relating to the effective portion of interest rate swaps hedging variable rate borrowings is recognised in profit or loss within finance costs. The gain or loss relating to the ineffective portion is recognised in profit or loss within finance income or expense respectively. When the hedged item is a non-financial asset, the amount recognised in other comprehensive income is transferred to the carrying amount of the asset when it is recognised. In other cases, the amount recognised in other comprehensive income is transferred to profit or loss in the same period that the hedged item affects profit or loss. If the hedging instrument no longer meets the criteria for hedge accounting, expires or is sold, terminated or exercised, then hedge accounting is discontinued prospectively. The cumulative gain or loss previously recognised in other comprehensive income remains there until the forecast transaction occurs.
Net investment hedgesHedges of net investments in foreign operations are accounted for in a similar manner to cash flow hedges. Any gain or loss on the hedging instrument relating to the effective portion of the hedge is recognised in other comprehensive income. The gain or loss relating to the ineffective portion is recognised immediately in profit or loss within finance income or expense respectively. Gains and losses accumulated in other comprehensive income are reclassified to profit or loss when the foreign operation is sold.
Derivatives not designated as hedgesChanges in the fair value of derivatives which are not designated for hedge accounting are recognised in profit or loss.
Embedded derivativesDerivatives embedded in host contracts are treated as separate derivatives when their risks and characteristics are not closely related to those of host contracts and, the host contracts are not carried at fair value through profit or loss. Changes in the fair value of separable embedded derivatives are recognised immediately in profit or loss.
83
SMU
RFIT K
APPA
GR
OU
P A
NN
UA
L REPO
RT 2
01
1
2. Summary of significant accounting policies [continued]
Impairment of financial assets
A financial asset is considered to be impaired if objective evidence indicates that one or more events have had a negative effect on its estimated future cash flows, or for equity securities, there is a significant or prolonged decline in value below its carrying amount. Impairment of a financial asset measured at amortised cost is calculated as the difference between its carrying amount and the present value of its estimated future cash flows discounted at the original effective interest rate. An impairment loss in respect of an available-for-sale financial asset is calculated by reference to its current fair value. Individually significant financial assets are tested for impairment on an individual basis. The remaining financial assets are assessed collectively in groups that share similar credit risk characteristics. Impairment losses are recognised in profit or loss including any cumulative loss in respect of an available-for-sale financial asset previously recognised in other comprehensive income. An impairment loss is reversed if the reversal can be related objectively to an event occurring after the impairment loss was recognised. For available-for-sale financial assets that are equity securities the reversal is recognised directly in other comprehensive income. For other financial assets the reversal is recognised in profit or loss.
Inventories
Inventories are measured at the lower of cost and net realisable value. The cost of inventories is based on the first-in, first-out basis and includes expenditure incurred in acquiring the inventories and bringing them to their existing location and condition. Raw materials are valued on the basis of purchase cost on a first-in, first-out basis. For finished goods and work-in-progress, cost includes direct materials, direct labour and attributable overheads based on normal operating capacity and excludes borrowing costs. The cost of wood is its fair value less estimated costs to sell at the date of harvest, determined in accordance with the policy for biological assets. Any change in value at the date of harvest is recognised in the Group Income Statement. Net realisable value is the estimated proceeds of sale less costs to completion and any costs to be incurred in selling and distribution. Full provision is made for all damaged, deteriorated, obsolete and unusable materials.
Share capital
Ordinary shares are classified as equity. Incremental costs directly attributable to the issue of new shares or options are shown in equity as a deduction, net of tax, from the proceeds.
Provisions
A provision is recognised in the Group Balance Sheet when the Group has a present legal or constructive obligation as a result of a past event, and it is probable that an outflow of resources will be required to settle the obligation and the amount can be reliably estimated. If the effect is material, provisions are determined by discounting the expected future cash flows at a pre-tax rate that reflects current market assessments of the time value of money and, where appropriate, the risks specific to the obligation. The increase in the provision due to the passage of time is recognised as a finance expense.
Income taxes
The income tax expense recognised in each financial year comprises current and deferred tax and is recognised in profit or loss except to the extent that it relates to items recognised in other comprehensive income or directly in equity, in which case the related tax is similarly recognised in other comprehensive income or in equity.
Current taxCurrent tax consists mainly of the expected tax payable or recoverable on the taxable income for the year, using tax rates and laws that have been enacted or substantively enacted at the balance sheet date, and any adjustment to tax payable in respect of previous years.
SMU
RFI
T K
APP
A G
RO
UP
AN
NU
AL
REP
OR
T 2
01
1
84
noteS to the ConSoliDateD finanCial StatementS [continued]
For the Year Ended 31 December 2011
2. Summary of significant accounting policies [continued]
Deferred income taxDeferred income tax is provided using the balance sheet liability method, on temporary differences between the carrying amounts of assets and liabilities for financial reporting purposes and their tax bases. If the temporary difference arises from initial recognition of an asset or liability in a transaction other than a business combination that at the time of the transaction does not affect accounting nor taxable profit or loss, it is not recognised. Deferred tax is provided on temporary differences arising on investments in subsidiaries and associates, except where the timing of the reversal of the temporary difference is controlled by the Group and it is probable that the temporary difference will not reverse in the foreseeable future. The amount of deferred tax provided is based on the expected manner of realisation or settlement of the carrying amount of assets and liabilities, using tax rates enacted or substantively enacted at the balance sheet date. A deferred tax asset is recognised only to the extent that it is probable that future taxable profits will be available against which the asset can be utilised. Deferred tax assets are reduced to the extent that it is no longer probable that the related tax benefit will be realised.
Government grantsGovernment grants are recognised at their fair value when there is reasonable assurance that the grant will be received and the Group will comply with any related conditions. Grants that compensate the Group for expenses are offset against the related expense in profit or loss in the same accounting periods. Grants related to the cost of an asset are recognised in profit or loss as other operating income over the useful life of the asset.
LeasesArrangements which transfer substantially all of the risks and rewards of ownership of an asset to the Group are classified as finance leases. They are capitalised at inception at the lower of the fair value of the leased asset and the present value of the minimum lease payments. Lease obligations, net of finance costs, are included in borrowings. The interest element of lease payments is expensed in profit or loss over the lease period so as to produce a constant periodic rate of interest. Assets acquired under finance leases are depreciated over the shorter of the useful life of the asset and the lease term.
Arrangements in which substantially all of the risks and rewards of ownership of an asset are retained by the lessor are classified as operating leases. Operating lease rentals are expensed in profit or loss on a straight-line basis over the lease term.
Arrangements comprising transactions that do not take the legal form of a lease but convey the right to use an asset in return for payment, or a series of payments, are assessed to determine whether the arrangement contains a lease.
Retirement benefitsThe Group operates both defined benefit and defined contribution pension plans and other long-term benefit plans throughout its operations in accordance with local conditions and practice. The larger plans are generally of the defined benefit type and are funded by payments to separately administered funds or insurance companies. The majority of the defined benefit schemes are funded but in certain countries, in accordance with local practices, scheme liabilities are unfunded and recognised as liabilities in the Group Balance Sheet.
For defined contribution plans, once the contributions have been paid, the Group has no further payment obligations. The contributions are recognised as an employee benefit expense as service from employees is received. Prepaid contributions are recognised as an asset only to the extent that a cash refund or a reduction in future payments is available.
The defined benefit pension asset or liability in the Group Balance Sheet comprises the total for each plan of the present value of the defined benefit obligation at the balance sheet date less the fair value of plan assets from which the obligations are to be settled.
85
SMU
RFIT K
APPA
GR
OU
P A
NN
UA
L REPO
RT 2
01
1
2. Summary of significant accounting policies [continued]
The liabilities and costs associated with the Group’s defined benefit pension plans (both funded and unfunded) are assessed on the basis of the projected unit credit method by professionally qualified actuaries and are arrived at using actuarial assumptions based on market expectations at the balance sheet date. The discount rates employed in determining the present value of plan liabilities are determined by reference to market yields at the balance sheet date on high-quality corporate bonds of a currency and term consistent with those of the benefit obligations. The expected increase in the present value of plan liabilities arising from employee service in the current or prior periods is recognised in arriving at operating profit or loss. Plan assets are valued at their market value at the balance sheet date using bid values. The expected returns on plan assets and the increase during the period in the present value of plan liabilities arising from the passage of time are recognised as components of finance income and finance costs respectively. Differences between the expected and the actual return on plan assets, together with the effect of changes in the current or prior assumptions underlying the liabilities are recognised in other comprehensive income. Past service costs are recognised immediately as an expense in profit or loss, unless the changes to the pension plan are conditional on the employees remaining in service for a specified period of time (the vesting period). In this case the past service costs are amortised on a straight-line basis over the vesting period.
Settlements and curtailments trigger immediate recognition of the consequent change in obligations and related assets or liabilities in profit or loss.
The net surplus or deficit arising on the Group’s defined benefit pension plans, including the liabilities for the unfunded plans, is shown either within non-current assets or non-current liabilities. When recognising a surplus the Group considers the guidance in IFRIC 14 to determine the limit on the amount of any surplus which can be recognised as an asset. The deferred tax impact of pension plan surpluses and deficits is disclosed separately within deferred income tax assets or liabilities, as appropriate.
Share-based payment
The Group grants equity settled share-based payments to employees as part of their remuneration; there are no cash-settled share-based payments. The fair value of grants is determined on the date of grant and is expensed to profit or loss over the vesting period with a corresponding increase in equity. Fair value incorporates the effect of market-based conditions. Non-market-based vesting conditions are only taken into account when assessing the number of awards expected to vest such that the cumulative expense recognised equates to the number of grants that actually vest. The periodic expense recognised in profit or loss is calculated as the difference between the cumulative expense as estimated at the start and end of the period.
The cumulative expense is reversed when an employee in receipt of share options terminates service prior to completion of the vesting period or when a non-market based performance condition is not expected to be met. No reversal of the cumulative charge is made where awards do not vest due to a market-based vesting condition.
Where the Group receives a tax deduction for share-based payments, deferred tax is provided on the basis of the difference between the market price of the underlying equity at the date of the financial statements and the exercise price of the option. As a result, the deferred tax impact will not directly correlate with the expense reported.
Proceeds received from the exercise of options, net of any directly attributable transaction costs, are credited to the share capital and share premium accounts.
SMU
RFI
T K
APP
A G
RO
UP
AN
NU
AL
REP
OR
T 2
01
1
86
noteS to the ConSoliDateD finanCial StatementS [continued]
For the Year Ended 31 December 2011
2. Summary of significant accounting policies [continued]
Emissions rights and obligations
As a result of the European Union Emission Trading Scheme the Group receives free emission rights in certain countries. Rights are received annually and the Group is required to surrender rights equal to its actual emissions. A provision is only recognised when actual emissions exceed the emission rights granted. Any additional rights purchased are recognised at cost and they are not subsequently remeasured. Where excess certificates are sold to third parties the Group recognises the consideration receivable in profit or loss.
Revenue
Revenue comprises the fair value of the consideration receivable for sold goods and services supplied to third party customers in the ordinary course of business. It excludes sales based taxes and is net of allowances for discounts and rebates. Revenue is recognised when delivery to the customer has taken place according to the terms of the sale, at which point the significant risks and rewards of ownership of the goods have passed to the customer. Revenue is recognised to the extent that it is probable that economic benefits will flow to the Group.
Finance costs and income
Finance costs comprise interest expense on borrowings (including amortisation of deferred debt issue costs), certain foreign currency translation losses related to financing, unwinding of the discount on provisions, impairment losses recognised on certain financial assets, borrowing extinguishment costs and losses on derivative instruments that are not designated as hedging instruments and are recognised in profit or loss. Finance costs are recognised in profit or loss using the effective interest method. Borrowing costs that are directly attributable to the acquisition or construction of a qualifying asset are capitalised as part of the cost of that asset. All other borrowing costs are recognised as an expense.
Finance income comprises interest income on funds invested, certain foreign currency translation gains related to financing, gains on derivative instruments that are not designated as hedging instruments and are recognised in profit or loss, dividend income and gains on the disposal of available-for-sale financial assets. Interest income is recognised as it accrues using the effective interest method. Dividend income is recognised on the date that the Group’s right to receive payment is established.
Earnings per share
Earnings per share represents the profit or loss in cent attributable to the owners of the Parent. It is calculated by dividing the Group profit or loss attributable to the owners of the Parent by the weighted average number of equity shares in issue during the year. Diluted earnings per share is calculated by adjusting the weighted average number of ordinary shares outstanding assuming conversion of all dilutive potential ordinary shares.
Exceptional items
The Group has adopted an income statement format which seeks to highlight significant items within the Group results for the year. The Group believes this format is useful as it highlights one-off items, where significant, such as restructuring costs, profit or loss on disposal or termination of operations, major litigation costs and settlements, profit or loss on early extinguishment of debt and profit or loss on disposal of assets and impairment of assets. Judgement is used by the Group in assessing the particular items, which by virtue of their size and nature, are disclosed as exceptional items.
Dividend distributions
Dividend distributions to the Company’s shareholders are recognised as liabilities in the period in which the dividends are approved by the Company’s shareholders.
87
SMU
RFIT K
APPA
GR
OU
P A
NN
UA
L REPO
RT 2
01
1
3. Significant accounting judgements, estimates and assumptions
Preparation of financial statements requires management to make judgements, estimates and assumptions that affect the reported amounts of revenues, expenses, assets and liabilities. These judgements, estimates and assumptions are subject to continuing re-evaluation and are based on historical experience and other factors, including expectations of future events that are believed to be reasonable. Actual outcomes may differ significantly from those estimates. The areas involving a higher degree of judgement or complexity, or areas where assumptions and estimates are significant are set out below.
Consolidation of special purpose entities
The Group is a party to an arrangement involving securitisation of certain of its trade receivables. The arrangement required the establishment of certain special purpose entities (‘SPEs’) which are not owned by the Group. However the SPEs are consolidated as management consider them to be controlled by the Group. The securitised receivables and the borrowings of the SPEs are recognised on the Group Balance Sheet.
Estimated impairment of goodwill and other non-current assets
The Group tests annually whether goodwill has suffered any impairment. The recoverable amounts of groups of CGUs have been determined based on value-in-use calculations. The principal assumptions used to determine value-in-use relate to future cash flows and the time value of money. Further information is detailed in the Goodwill and intangible assets note. Impairment tests in respect of property, plant and equipment are also performed on a CGU basis. Further information is contained in the Property, plant and equipment note.
Income taxes
Provisions for taxes require judgement and estimation in interpreting tax legislation, current case law and the uncertain outcomes of tax audits and appeals. Where the final outcome of these matters differs from the amounts recognised, differences will impact the tax provisions once the outcome is known. In addition, the Group recognises deferred tax assets, mainly relating to unused tax losses, when it is probable that the assets will be recovered through future profitability and tax planning. The assessment of recoverability involves judgement.
Measurement of defined benefit obligations
The cost of defined benefit pension plans and the present value of pension obligations are determined using actuarial valuations. These valuations involve making various assumptions that may differ significantly from actual developments in the future. The assumptions include determination of appropriate discount rates, future salary increases, inflation, mortality rates and future pension increases. Due to the complex nature of the valuations the Group employs an international network of professional actuaries to perform these valuations. The critical assumptions and estimates applied along with sensitivity analysis are provided in the Employee benefits note.
Provisions
The amount recognised for a provision is management’s best estimate of the expenditure to be incurred. Provisions are remeasured at each balance sheet date based on the best estimate of the expected settlement amount. Changes to the best estimate of the settlement amount may result from changes in the amount or timing of the outflows or changes in discount rates (when applicable).
Establishing lives for depreciation of property, plant and equipment
The annual depreciation charge depends primarily on the estimated lives of each type of asset. Asset lives are reviewed annually and adjusted if necessary to reflect current thinking on remaining lives in light of technological change, prospective economic utilisation and the physical condition of the assets. Changes in asset lives could have a significant impact on depreciation charges.
SMU
RFI
T K
APP
A G
RO
UP
AN
NU
AL
REP
OR
T 2
01
1
88
noteS to the ConSoliDateD finanCial StatementS [continued]
For the Year Ended 31 December 2011
3. Significant accounting judgements, estimates and assumptions [continued]
Establishing lives for amortisation of intangible assets
The amortisation charge is dependent on the estimated lives of each intangible asset. These lives are regularly reviewed and changed if necessary to reflect the expected period of consumption of future economic benefits. Changes in asset lives could have a significant impact on amortisation charges. Further details are included in the Goodwill and intangible assets note.
Fair value of derivatives and other financial instruments
The fair value of financial instruments that are not traded in an active market (for example, over-the-counter derivatives) is determined using valuation techniques. The Group uses its judgement to select a variety of methods and makes assumptions that are mainly based on market conditions existing at each balance sheet date. The Group uses discounted cash flow analysis for various available-for-sale financial assets that are not traded in active markets. Fair value disclosures are set out in the Financial instruments note.
Venezuela
Exchange controlThe government of Venezuela operates exchange controls including a fixed official exchange rate against the US dollar with the purchase and sale of foreign currency regulated by CADIVI (the Venezuelan commission for the administration of foreign currencies). Approved transactions are completed at the official fixed rate of exchange of VEF 4.3 per US dollar. Since June 2010, SITME (the Venezuelan transaction system for foreign currency denominated securities) exchanges up to US$350,000 per month at VEF 5.3 per US dollar. The old parallel market of exchange became illegal at that date. These fixed rates applied at 31 December 2011 and 2010. At each balance sheet date the Group assesses which rate to use for translation of the results and net assets of its Venezuelan operations. The Group has concluded that the official rate is the appropriate rate to use as it believes it has the ability to access funds at that rate. On this basis, in accordance with IFRS, the financial statements of the Group’s operations in Venezuela were translated using the official rate of VEF 4.3 per US dollar and the closing euro/ US dollar rate of 1 euro = US$ 1.29.
ControlThe nationalisation of foreign owned companies by the Venezuelan government continues and would suggest that the risk of similar such action against the Group’s operations in Venezuela remains. In July, the Venezuelan authorities issued precautionary measures over a further 7,253 hectares of the Group’s forestry land, with a view to acquiring it and converting its use to food production and related activities. Market value compensation is either negotiated or arbitrated under applicable laws or treaties in these cases. However, the amount and timing of such compensation is necessarily uncertain.
The Group continues to control operations in Venezuela and, as a result, continues to consolidate all of the results and net assets of these operations at year end in accordance with the requirement of IAS 27.
In 2011, the Group’s operations in Venezuela represented approximately 6% (2010: 5%) of its total assets and 17% (2010: 15%) of its net assets. In addition, cumulative foreign translation losses arising on its net investment in these operations amounting to €190 million (2010: €199 million) are included in the foreign exchange translation reserve.
HyperinflationVenezuela was deemed hyperinflationary under IFRS in 2009. As a result, the Group has applied the hyperinflationary accounting requirements of IAS 29 to its Venezuelan operations with effect from 1 January 2009. To adjust income and expenses for the effects of hyperinflation, IAS 29 requires restatement (indexation) of income and expenses from the start of the reporting period. It also requires restatement of non-monetary assets, such as property, plant and equipment and inventories, from the date they were first recognised. The gain or loss on the net monetary position is included in finance costs or income. Comparative amounts are not restated. The restated financial statements are translated to euro at the closing rate, average rates are not used. Differences arising on translation to euro are recognised in other comprehensive income.
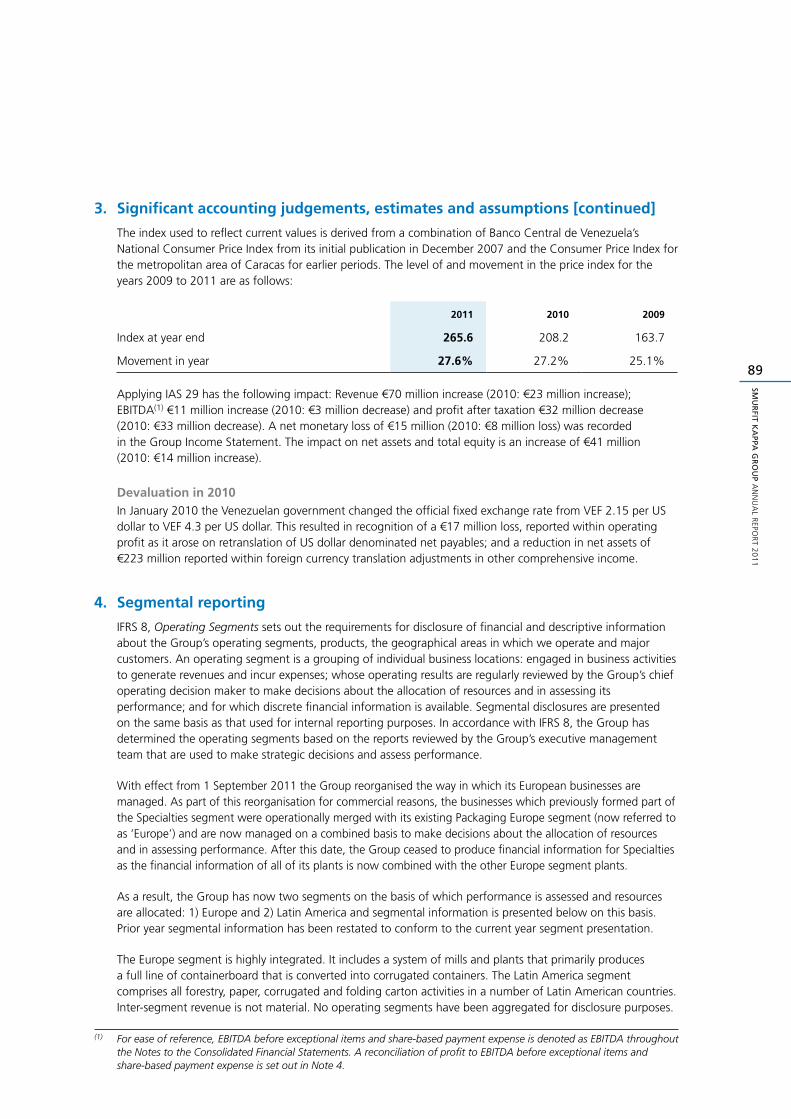
89
SMU
RFIT K
APPA
GR
OU
P A
NN
UA
L REPO
RT 2
01
1
3. Significant accounting judgements, estimates and assumptions [continued]
The index used to reflect current values is derived from a combination of Banco Central de Venezuela’s National Consumer Price Index from its initial publication in December 2007 and the Consumer Price Index for the metropolitan area of Caracas for earlier periods. The level of and movement in the price index for the years 2009 to 2011 are as follows:
2011 2010 2009
Index at year end 265.6 208.2 163.7
Movement in year 27.6% 27.2% 25.1%
Applying IAS 29 has the following impact: Revenue €70 million increase (2010: €23 million increase); EBITDA(1) €11 million increase (2010: €3 million decrease) and profit after taxation €32 million decrease (2010: €33 million decrease). A net monetary loss of €15 million (2010: €8 million loss) was recorded in the Group Income Statement. The impact on net assets and total equity is an increase of €41 million (2010: €14 million increase).
Devaluation in 2010In January 2010 the Venezuelan government changed the official fixed exchange rate from VEF 2.15 per US dollar to VEF 4.3 per US dollar. This resulted in recognition of a €17 million loss, reported within operating profit as it arose on retranslation of US dollar denominated net payables; and a reduction in net assets of €223 million reported within foreign currency translation adjustments in other comprehensive income.
4. Segmental reporting
IFRS 8, Operating Segments sets out the requirements for disclosure of financial and descriptive information about the Group’s operating segments, products, the geographical areas in which we operate and major customers. An operating segment is a grouping of individual business locations: engaged in business activities to generate revenues and incur expenses; whose operating results are regularly reviewed by the Group’s chief operating decision maker to make decisions about the allocation of resources and in assessing its performance; and for which discrete financial information is available. Segmental disclosures are presented on the same basis as that used for internal reporting purposes. In accordance with IFRS 8, the Group has determined the operating segments based on the reports reviewed by the Group’s executive management team that are used to make strategic decisions and assess performance.
With effect from 1 September 2011 the Group reorganised the way in which its European businesses are managed. As part of this reorganisation for commercial reasons, the businesses which previously formed part of the Specialties segment were operationally merged with its existing Packaging Europe segment (now referred to as ‘Europe’) and are now managed on a combined basis to make decisions about the allocation of resources and in assessing performance. After this date, the Group ceased to produce financial information for Specialties as the financial information of all of its plants is now combined with the other Europe segment plants.
As a result, the Group has now two segments on the basis of which performance is assessed and resources are allocated: 1) Europe and 2) Latin America and segmental information is presented below on this basis. Prior year segmental information has been restated to conform to the current year segment presentation.
The Europe segment is highly integrated. It includes a system of mills and plants that primarily produces a full line of containerboard that is converted into corrugated containers. The Latin America segment comprises all forestry, paper, corrugated and folding carton activities in a number of Latin American countries. Inter-segment revenue is not material. No operating segments have been aggregated for disclosure purposes.
(1) For ease of reference, EBITDA before exceptional items and share-based payment expense is denoted as EBITDA throughout the Notes to the Consolidated Financial Statements. A reconciliation of profit to EBITDA before exceptional items and share-based payment expense is set out in Note 4.
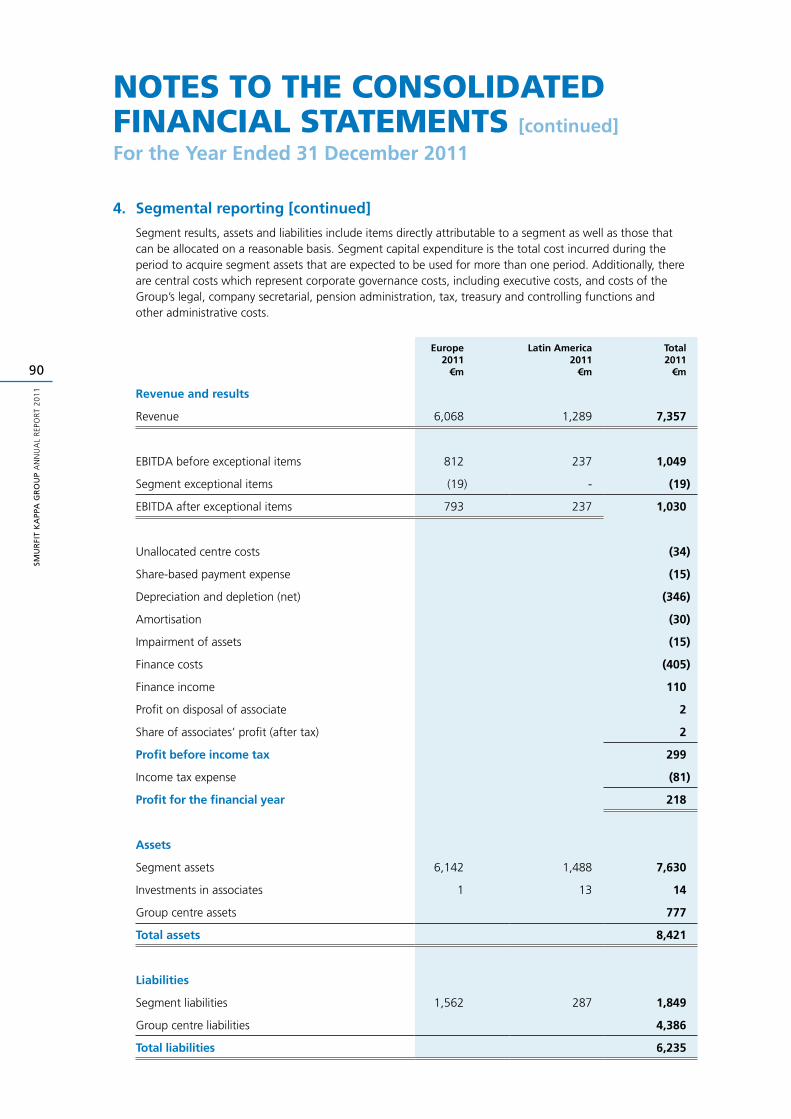
SMU
RFI
T K
APP
A G
RO
UP
AN
NU
AL
REP
OR
T 2
01
1
90
noteS to the ConSoliDateD finanCial StatementS [continued]
For the Year Ended 31 December 2011
4. Segmental reporting [continued]
Segment results, assets and liabilities include items directly attributable to a segment as well as those that can be allocated on a reasonable basis. Segment capital expenditure is the total cost incurred during the period to acquire segment assets that are expected to be used for more than one period. Additionally, there are central costs which represent corporate governance costs, including executive costs, and costs of the Group’s legal, company secretarial, pension administration, tax, treasury and controlling functions and other administrative costs.
Europe 2011
€m
Latin America2011
€m
Total2011
€m
Revenue and results
Revenue 6,068 1,289 7,357
EBITDA before exceptional items 812 237 1,049
Segment exceptional items (19) - (19)
EBITDA after exceptional items 793 237 1,030
Unallocated centre costs (34)
Share-based payment expense (15)
Depreciation and depletion (net) (346)
Amortisation (30)
Impairment of assets (15)
Finance costs (405)
Finance income 110
Profit on disposal of associate 2
Share of associates’ profit (after tax) 2
Profit before income tax 299
Income tax expense (81)
Profit for the financial year 218
Assets
Segment assets 6,142 1,488 7,630
Investments in associates 1 13 14
Group centre assets 777
Total assets 8,421
Liabilities
Segment liabilities 1,562 287 1,849
Group centre liabilities 4,386
Total liabilities 6,235
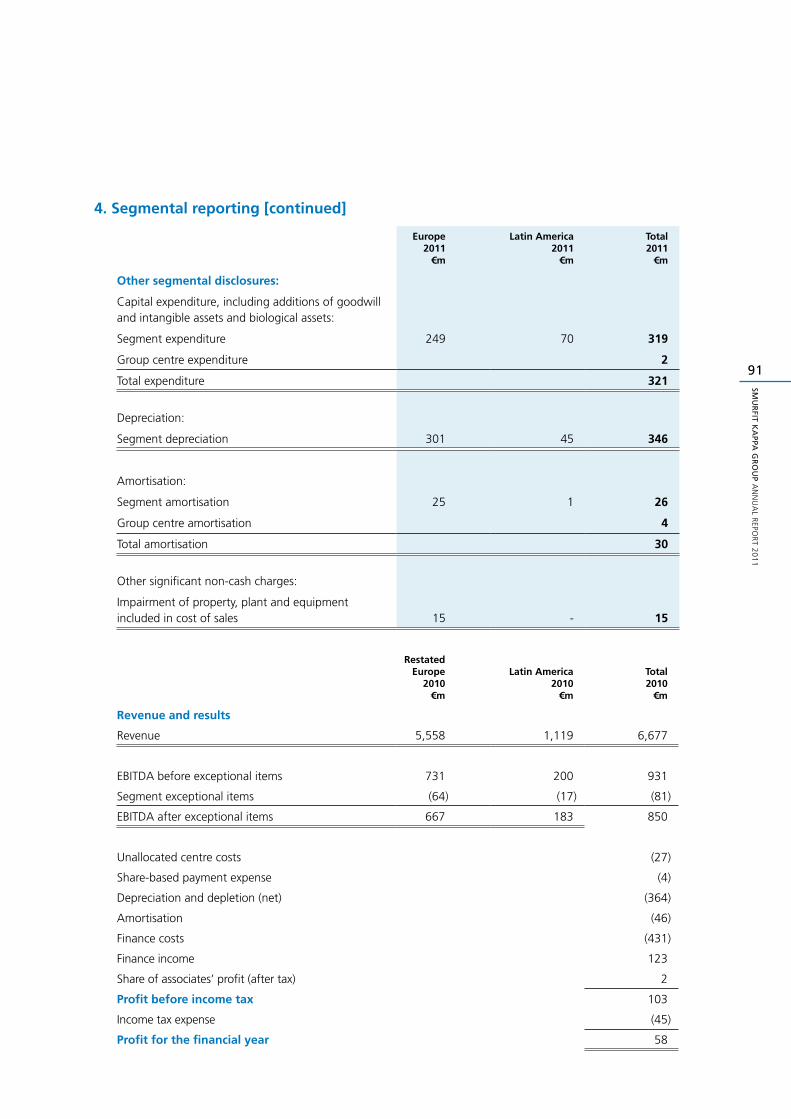
91
SMU
RFIT K
APPA
GR
OU
P A
NN
UA
L REPO
RT 2
01
1
4. Segmental reporting [continued]
Europe 2011
€m
Latin America2011
€m
Total2011
€m
Other segmental disclosures:
Capital expenditure, including additions of goodwill and intangible assets and biological assets:
Segment expenditure 249 70 319
Group centre expenditure 2
Total expenditure 321
Depreciation:
Segment depreciation 301 45 346
Amortisation:
Segment amortisation 25 1 26
Group centre amortisation 4
Total amortisation 30
Other significant non-cash charges:
Impairment of property, plant and equipment included in cost of sales 15 - 15
RestatedEurope
2010€m
Latin America2010
€m
Total2010
€m
Revenue and results
Revenue 5,558 1,119 6,677
EBITDA before exceptional items 731 200 931
Segment exceptional items (64) (17) (81)
EBITDA after exceptional items 667 183 850
Unallocated centre costs (27)
Share-based payment expense (4)
Depreciation and depletion (net) (364)
Amortisation (46)
Finance costs (431)
Finance income 123
Share of associates’ profit (after tax) 2
Profit before income tax 103
Income tax expense (45)
Profit for the financial year 58
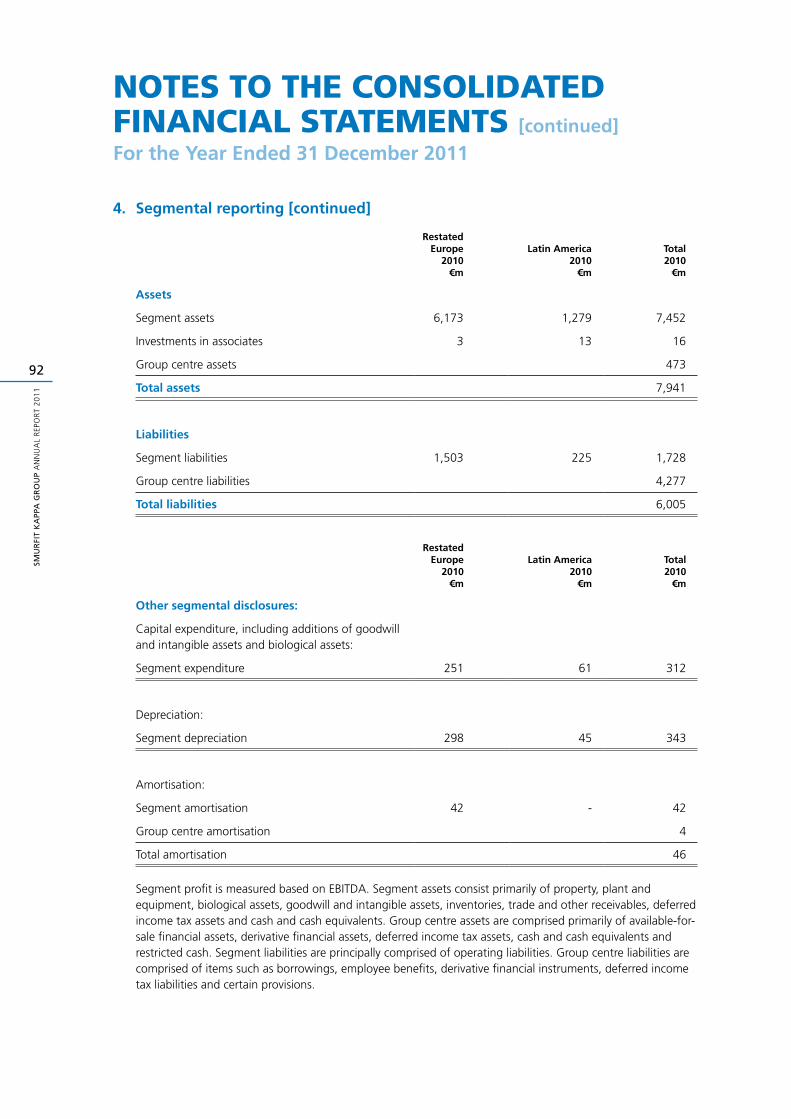
SMU
RFI
T K
APP
A G
RO
UP
AN
NU
AL
REP
OR
T 2
01
1
92
noteS to the ConSoliDateD finanCial StatementS [continued]
For the Year Ended 31 December 2011
4. Segmental reporting [continued]
RestatedEurope
2010€m
Latin America2010
€m
Total2010
€m
Assets
Segment assets 6,173 1,279 7,452
Investments in associates 3 13 16
Group centre assets 473
Total assets 7,941
Liabilities
Segment liabilities 1,503 225 1,728
Group centre liabilities 4,277
Total liabilities 6,005
RestatedEurope
2010€m
Latin America2010
€m
Total2010
€m
Other segmental disclosures:
Capital expenditure, including additions of goodwill and intangible assets and biological assets:
Segment expenditure 251 61 312
Depreciation:
Segment depreciation 298 45 343
Amortisation:
Segment amortisation 42 - 42
Group centre amortisation 4
Total amortisation 46
Segment profit is measured based on EBITDA. Segment assets consist primarily of property, plant and equipment, biological assets, goodwill and intangible assets, inventories, trade and other receivables, deferred income tax assets and cash and cash equivalents. Group centre assets are comprised primarily of available-for-sale financial assets, derivative financial assets, deferred income tax assets, cash and cash equivalents and restricted cash. Segment liabilities are principally comprised of operating liabilities. Group centre liabilities are comprised of items such as borrowings, employee benefits, derivative financial instruments, deferred income tax liabilities and certain provisions.
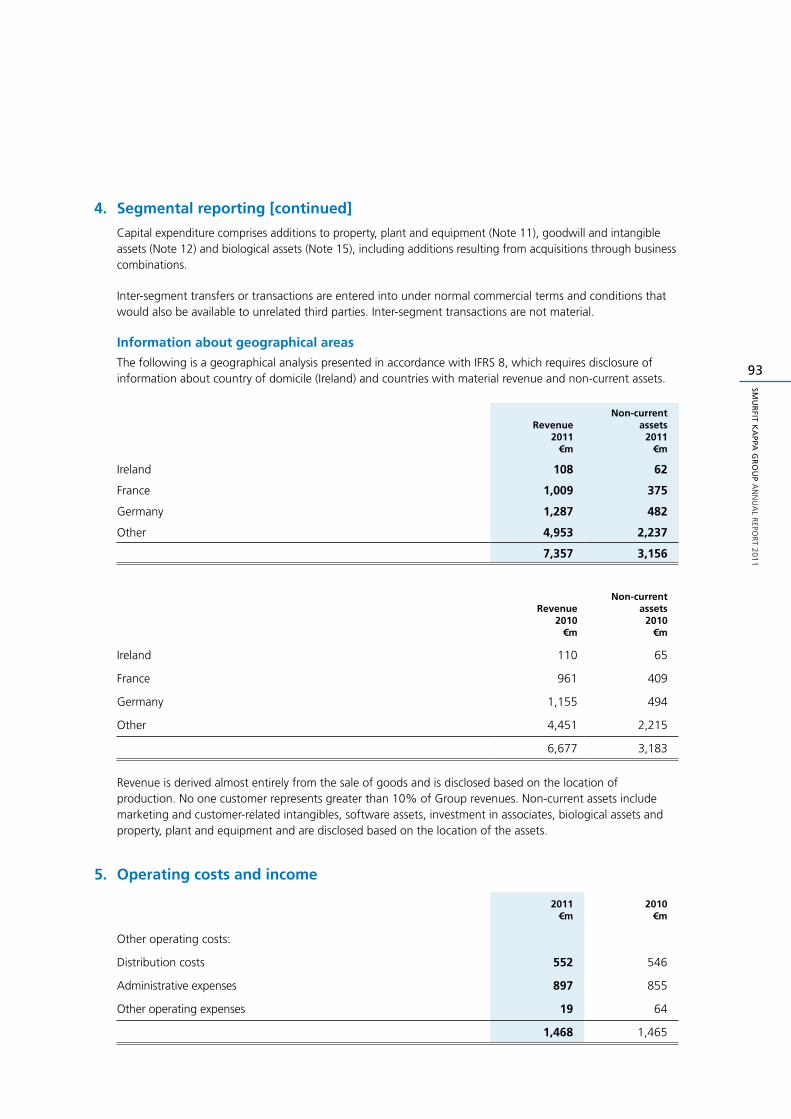
93
SMU
RFIT K
APPA
GR
OU
P A
NN
UA
L REPO
RT 2
01
1
4. Segmental reporting [continued]
Capital expenditure comprises additions to property, plant and equipment (Note 11), goodwill and intangible assets (Note 12) and biological assets (Note 15), including additions resulting from acquisitions through business combinations.
Inter-segment transfers or transactions are entered into under normal commercial terms and conditions that would also be available to unrelated third parties. Inter-segment transactions are not material.
Information about geographical areas
The following is a geographical analysis presented in accordance with IFRS 8, which requires disclosure of information about country of domicile (Ireland) and countries with material revenue and non-current assets.
Revenue2011
€m
Non-currentassets
2011€m
Ireland 108 62
France 1,009 375
Germany 1,287 482
Other 4,953 2,237
7,357 3,156
Revenue2010
€m
Non-currentassets
2010€m
Ireland 110 65
France 961 409
Germany 1,155 494
Other 4,451 2,215
6,677 3,183
Revenue is derived almost entirely from the sale of goods and is disclosed based on the location of production. No one customer represents greater than 10% of Group revenues. Non-current assets include marketing and customer-related intangibles, software assets, investment in associates, biological assets and property, plant and equipment and are disclosed based on the location of the assets.
5. Operating costs and income
2011€m
2010€m
Other operating costs:
Distribution costs 552 546
Administrative expenses 897 855
Other operating expenses 19 64
1,468 1,465
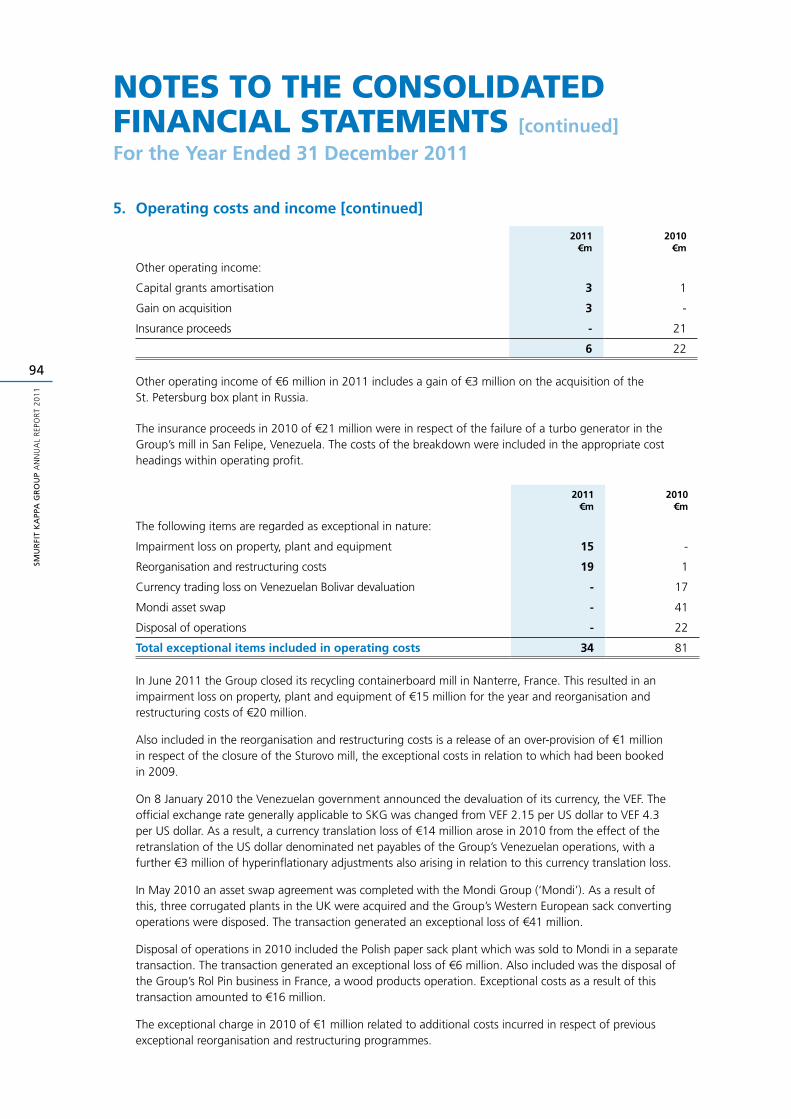
SMU
RFI
T K
APP
A G
RO
UP
AN
NU
AL
REP
OR
T 2
01
1
94
noteS to the ConSoliDateD finanCial StatementS [continued]
For the Year Ended 31 December 2011
5. Operating costs and income [continued]
2011€m
2010€m
Other operating income:
Capital grants amortisation 3 1
Gain on acquisition 3 -
Insurance proceeds - 21
6 22
Other operating income of €6 million in 2011 includes a gain of €3 million on the acquisition of the St. Petersburg box plant in Russia.
The insurance proceeds in 2010 of €21 million were in respect of the failure of a turbo generator in the Group’s mill in San Felipe, Venezuela. The costs of the breakdown were included in the appropriate cost headings within operating profit.
2011€m
2010€m
The following items are regarded as exceptional in nature:
Impairment loss on property, plant and equipment 15 -
Reorganisation and restructuring costs 19 1
Currency trading loss on Venezuelan Bolivar devaluation - 17
Mondi asset swap - 41
Disposal of operations - 22
Total exceptional items included in operating costs 34 81
In June 2011 the Group closed its recycling containerboard mill in Nanterre, France. This resulted in an impairment loss on property, plant and equipment of €15 million for the year and reorganisation and restructuring costs of €20 million.
Also included in the reorganisation and restructuring costs is a release of an over-provision of €1 million in respect of the closure of the Sturovo mill, the exceptional costs in relation to which had been booked in 2009.
On 8 January 2010 the Venezuelan government announced the devaluation of its currency, the VEF. The official exchange rate generally applicable to SKG was changed from VEF 2.15 per US dollar to VEF 4.3 per US dollar. As a result, a currency translation loss of €14 million arose in 2010 from the effect of the retranslation of the US dollar denominated net payables of the Group’s Venezuelan operations, with a further €3 million of hyperinflationary adjustments also arising in relation to this currency translation loss.
In May 2010 an asset swap agreement was completed with the Mondi Group (‘Mondi’). As a result of this, three corrugated plants in the UK were acquired and the Group’s Western European sack converting operations were disposed. The transaction generated an exceptional loss of €41 million.
Disposal of operations in 2010 included the Polish paper sack plant which was sold to Mondi in a separate transaction. The transaction generated an exceptional loss of €6 million. Also included was the disposal of the Group’s Rol Pin business in France, a wood products operation. Exceptional costs as a result of this transaction amounted to €16 million.
The exceptional charge in 2010 of €1 million related to additional costs incurred in respect of previous exceptional reorganisation and restructuring programmes.
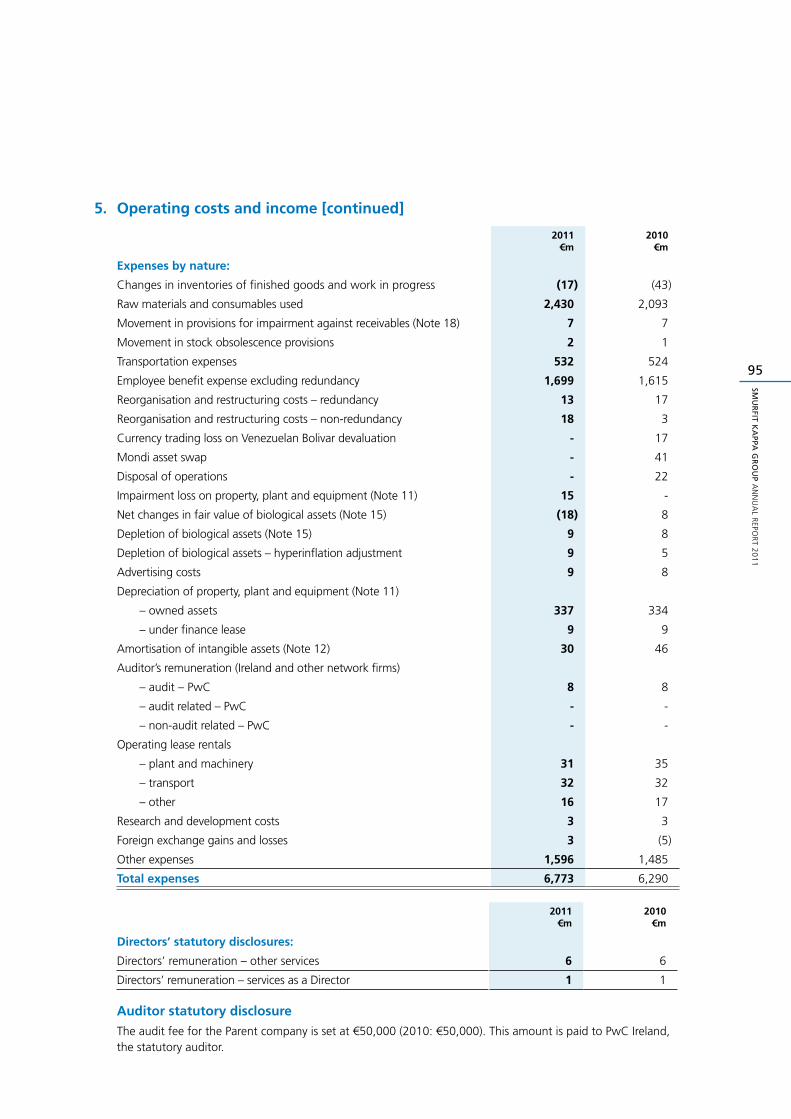
95
SMU
RFIT K
APPA
GR
OU
P A
NN
UA
L REPO
RT 2
01
1
5. Operating costs and income [continued]
2011€m
2010€m
Expenses by nature:
Changes in inventories of finished goods and work in progress (17) (43)
Raw materials and consumables used 2,430 2,093
Movement in provisions for impairment against receivables (Note 18) 7 7
Movement in stock obsolescence provisions 2 1
Transportation expenses 532 524
Employee benefit expense excluding redundancy 1,699 1,615
Reorganisation and restructuring costs – redundancy 13 17
Reorganisation and restructuring costs – non-redundancy 18 3
Currency trading loss on Venezuelan Bolivar devaluation - 17
Mondi asset swap - 41
Disposal of operations - 22
Impairment loss on property, plant and equipment (Note 11) 15 -
Net changes in fair value of biological assets (Note 15) (18) 8
Depletion of biological assets (Note 15) 9 8
Depletion of biological assets – hyperinflation adjustment 9 5
Advertising costs 9 8
Depreciation of property, plant and equipment (Note 11)
– owned assets 337 334
– under finance lease 9 9
Amortisation of intangible assets (Note 12) 30 46
Auditor’s remuneration (Ireland and other network firms)
– audit – PwC 8 8
– audit related – PwC - -
– non-audit related – PwC - -
Operating lease rentals
– plant and machinery 31 35
– transport 32 32
– other 16 17
Research and development costs 3 3
Foreign exchange gains and losses 3 (5)
Other expenses 1,596 1,485
Total expenses 6,773 6,290
2011€m
2010€m
Directors’ statutory disclosures:
Directors’ remuneration – other services 6 6
Directors’ remuneration – services as a Director 1 1
Auditor statutory disclosure
The audit fee for the Parent company is set at €50,000 (2010: €50,000). This amount is paid to PwC Ireland, the statutory auditor.
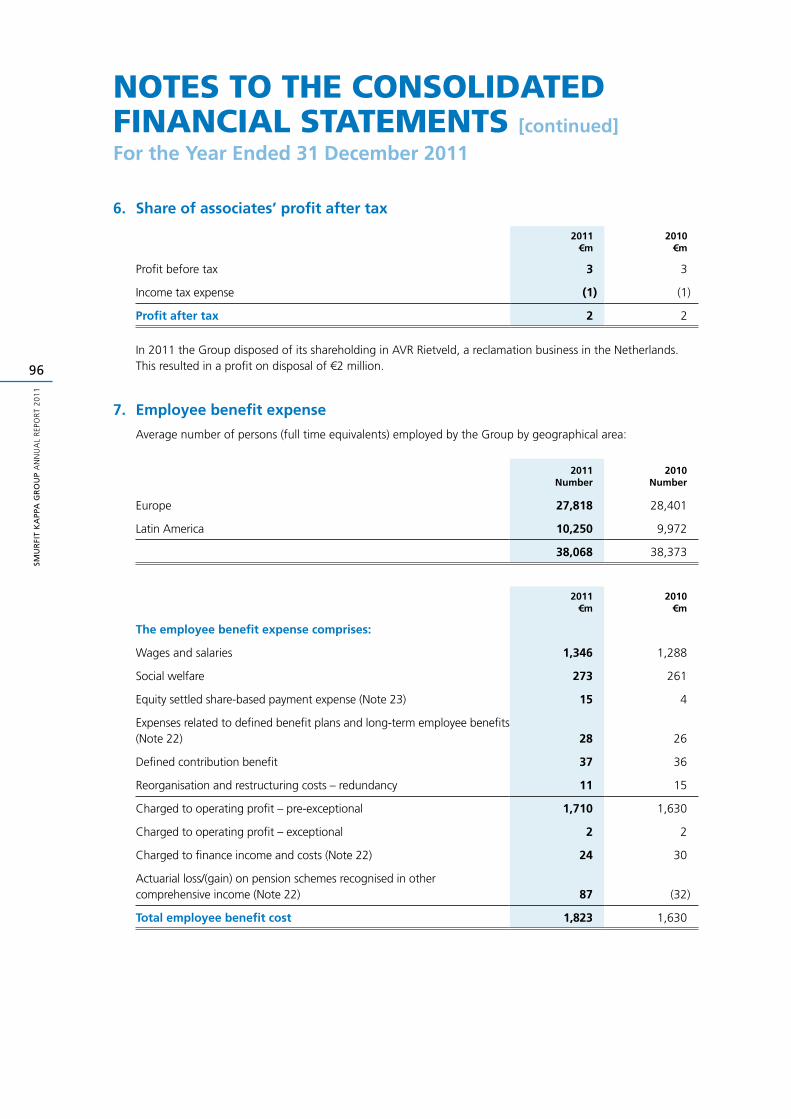
SMU
RFI
T K
APP
A G
RO
UP
AN
NU
AL
REP
OR
T 2
01
1
96
noteS to the ConSoliDateD finanCial StatementS [continued]
For the Year Ended 31 December 2011
6. Share of associates’ profit after tax
2011€m
2010€m
Profit before tax 3 3
Income tax expense (1) (1)
Profit after tax 2 2
In 2011 the Group disposed of its shareholding in AVR Rietveld, a reclamation business in the Netherlands. This resulted in a profit on disposal of €2 million.
7. Employee benefit expense
Average number of persons (full time equivalents) employed by the Group by geographical area:
2011Number
2010Number
Europe 27,818 28,401
Latin America 10,250 9,972
38,068 38,373
2011€m
2010€m
The employee benefit expense comprises:
Wages and salaries 1,346 1,288
Social welfare 273 261
Equity settled share-based payment expense (Note 23) 15 4
Expenses related to defined benefit plans and long-term employee benefits (Note 22) 28 26
Defined contribution benefit 37 36
Reorganisation and restructuring costs – redundancy 11 15
Charged to operating profit – pre-exceptional 1,710 1,630
Charged to operating profit – exceptional 2 2
Charged to finance income and costs (Note 22) 24 30
Actuarial loss/(gain) on pension schemes recognised in other comprehensive income (Note 22) 87 (32)
Total employee benefit cost 1,823 1,630
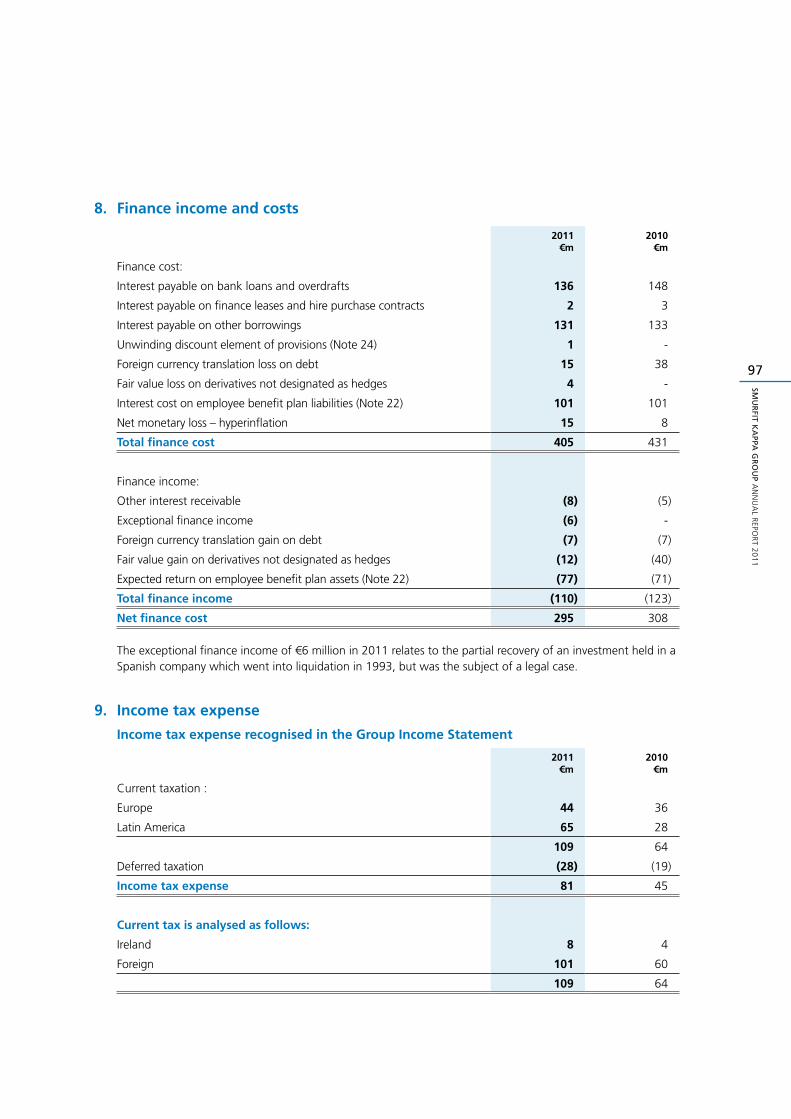
97
SMU
RFIT K
APPA
GR
OU
P A
NN
UA
L REPO
RT 2
01
1
8. Finance income and costs
2011€m
2010€m
Finance cost:
Interest payable on bank loans and overdrafts 136 148
Interest payable on finance leases and hire purchase contracts 2 3
Interest payable on other borrowings 131 133
Unwinding discount element of provisions (Note 24) 1 -
Foreign currency translation loss on debt 15 38
Fair value loss on derivatives not designated as hedges 4 -
Interest cost on employee benefit plan liabilities (Note 22) 101 101
Net monetary loss – hyperinflation 15 8
Total finance cost 405 431
Finance income:
Other interest receivable (8) (5)
Exceptional finance income (6) -
Foreign currency translation gain on debt (7) (7)
Fair value gain on derivatives not designated as hedges (12) (40)
Expected return on employee benefit plan assets (Note 22) (77) (71)
Total finance income (110) (123)
Net finance cost 295 308
The exceptional finance income of €6 million in 2011 relates to the partial recovery of an investment held in a Spanish company which went into liquidation in 1993, but was the subject of a legal case.
9. Income tax expense
Income tax expense recognised in the Group Income Statement
2011€m
2010€m
Current taxation :
Europe 44 36
Latin America 65 28
109 64
Deferred taxation (28) (19)
Income tax expense 81 45
Current tax is analysed as follows:
Ireland 8 4
Foreign 101 60
109 64
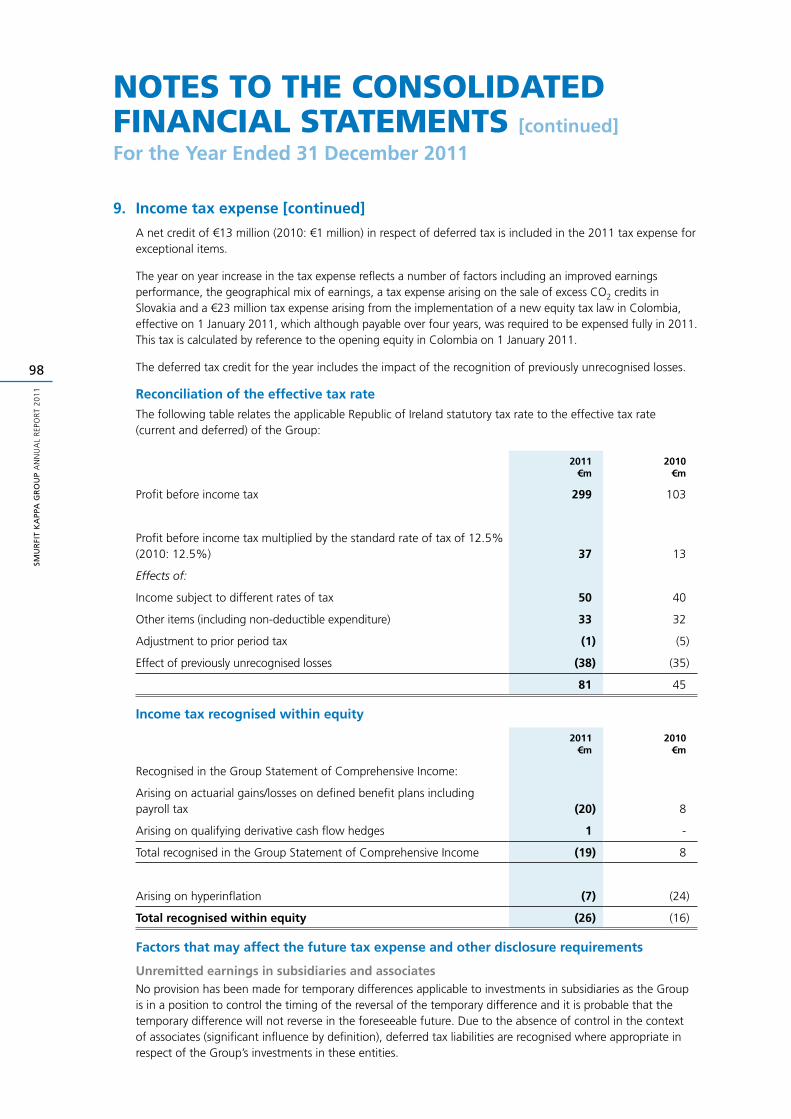
SMU
RFI
T K
APP
A G
RO
UP
AN
NU
AL
REP
OR
T 2
01
1
98
noteS to the ConSoliDateD finanCial StatementS [continued]
For the Year Ended 31 December 2011
9. Income tax expense [continued]
A net credit of €13 million (2010: €1 million) in respect of deferred tax is included in the 2011 tax expense for exceptional items.
The year on year increase in the tax expense reflects a number of factors including an improved earnings performance, the geographical mix of earnings, a tax expense arising on the sale of excess CO2 credits in Slovakia and a €23 million tax expense arising from the implementation of a new equity tax law in Colombia, effective on 1 January 2011, which although payable over four years, was required to be expensed fully in 2011. This tax is calculated by reference to the opening equity in Colombia on 1 January 2011.
The deferred tax credit for the year includes the impact of the recognition of previously unrecognised losses.
Reconciliation of the effective tax rate
The following table relates the applicable Republic of Ireland statutory tax rate to the effective tax rate (current and deferred) of the Group:
2011€m
2010€m
Profit before income tax 299 103
Profit before income tax multiplied by the standard rate of tax of 12.5% (2010: 12.5%) 37 13
Effects of:
Income subject to different rates of tax 50 40
Other items (including non-deductible expenditure) 33 32
Adjustment to prior period tax (1) (5)
Effect of previously unrecognised losses (38) (35)
81 45
Income tax recognised within equity
2011€m
2010€m
Recognised in the Group Statement of Comprehensive Income:
Arising on actuarial gains/losses on defined benefit plans including payroll tax (20) 8
Arising on qualifying derivative cash flow hedges 1 -
Total recognised in the Group Statement of Comprehensive Income (19) 8
Arising on hyperinflation (7) (24)
Total recognised within equity (26) (16)
Factors that may affect the future tax expense and other disclosure requirements
Unremitted earnings in subsidiaries and associatesNo provision has been made for temporary differences applicable to investments in subsidiaries as the Group is in a position to control the timing of the reversal of the temporary difference and it is probable that the temporary difference will not reverse in the foreseeable future. Due to the absence of control in the context of associates (significant influence by definition), deferred tax liabilities are recognised where appropriate in respect of the Group’s investments in these entities.
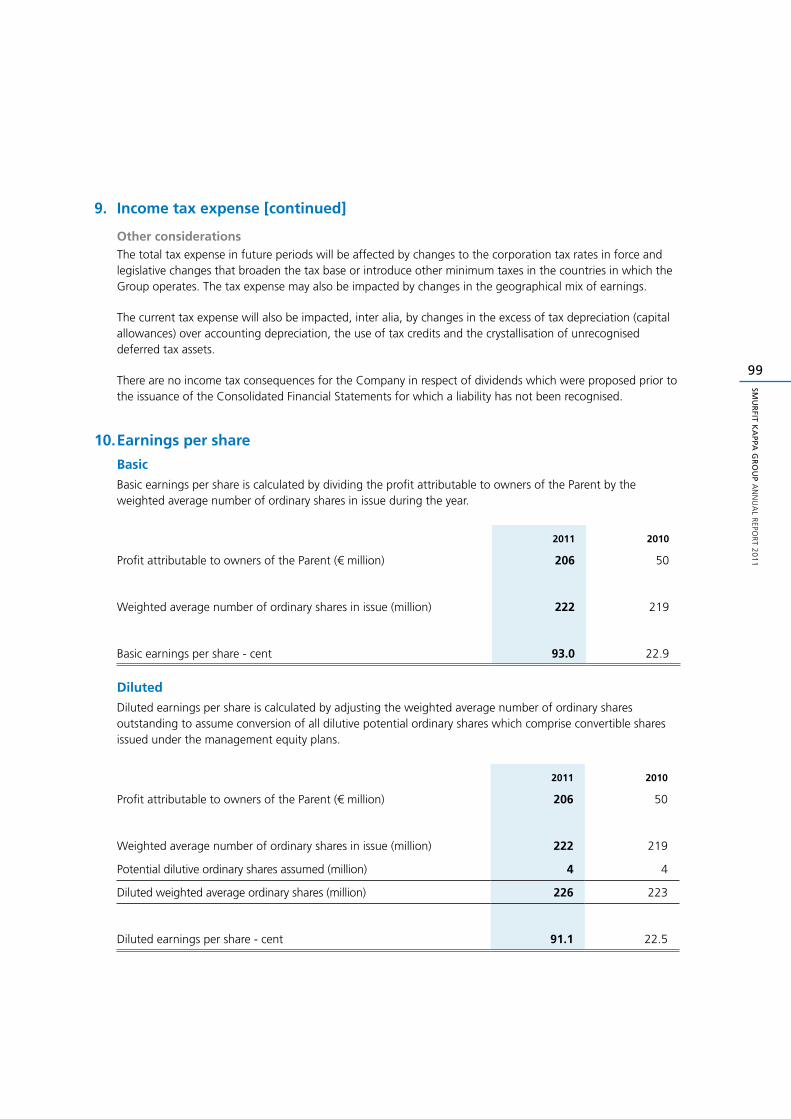
99
SMU
RFIT K
APPA
GR
OU
P A
NN
UA
L REPO
RT 2
01
1
9. Income tax expense [continued]
Other considerationsThe total tax expense in future periods will be affected by changes to the corporation tax rates in force and legislative changes that broaden the tax base or introduce other minimum taxes in the countries in which the Group operates. The tax expense may also be impacted by changes in the geographical mix of earnings.
The current tax expense will also be impacted, inter alia, by changes in the excess of tax depreciation (capital allowances) over accounting depreciation, the use of tax credits and the crystallisation of unrecognised deferred tax assets.
There are no income tax consequences for the Company in respect of dividends which were proposed prior to the issuance of the Consolidated Financial Statements for which a liability has not been recognised.
10. Earnings per share
Basic
Basic earnings per share is calculated by dividing the profit attributable to owners of the Parent by the weighted average number of ordinary shares in issue during the year.
2011 2010
Profit attributable to owners of the Parent (€ million) 206 50
Weighted average number of ordinary shares in issue (million) 222 219
Basic earnings per share - cent 93.0 22.9
Diluted
Diluted earnings per share is calculated by adjusting the weighted average number of ordinary shares outstanding to assume conversion of all dilutive potential ordinary shares which comprise convertible shares issued under the management equity plans.
2011 2010
Profit attributable to owners of the Parent (€ million) 206 50
Weighted average number of ordinary shares in issue (million) 222 219
Potential dilutive ordinary shares assumed (million) 4 4
Diluted weighted average ordinary shares (million) 226 223
Diluted earnings per share - cent 91.1 22.5
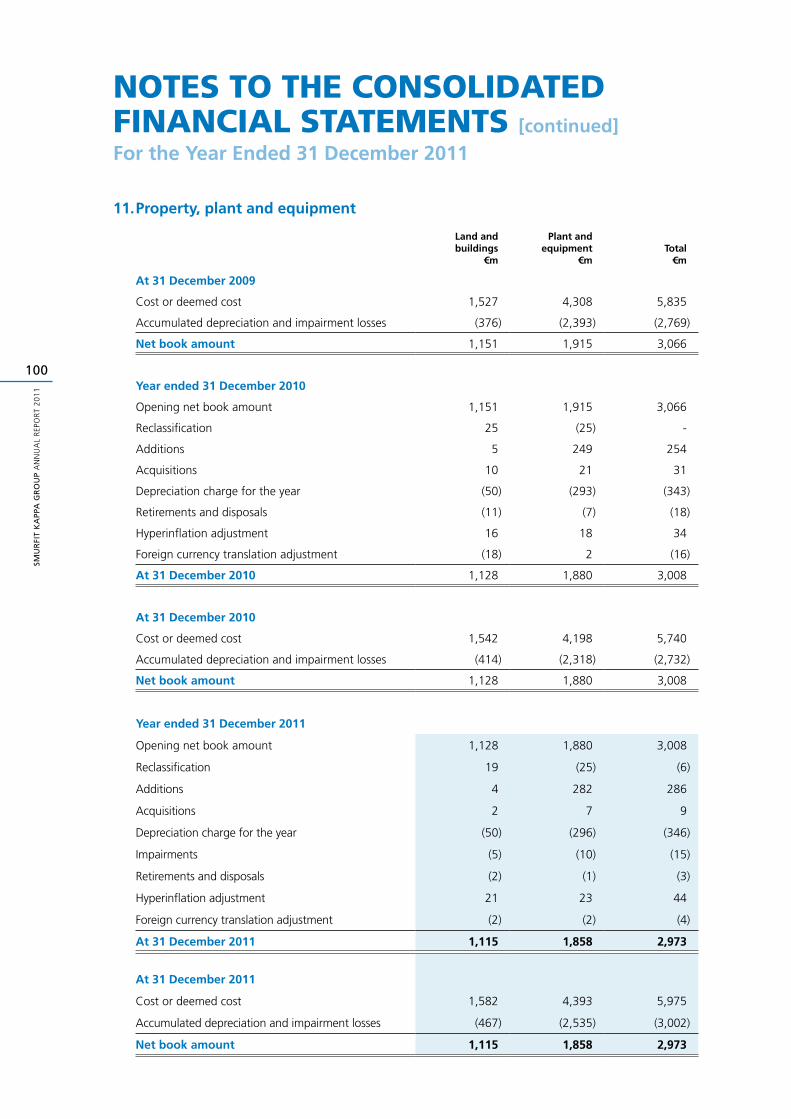
SMU
RFI
T K
APP
A G
RO
UP
AN
NU
AL
REP
OR
T 2
01
1
100
noteS to the ConSoliDateD finanCial StatementS [continued]
For the Year Ended 31 December 2011
11. Property, plant and equipment
Land and buildings
€m
Plant andequipment
€mTotal
€m
At 31 December 2009
Cost or deemed cost 1,527 4,308 5,835
Accumulated depreciation and impairment losses (376) (2,393) (2,769)
Net book amount 1,151 1,915 3,066
Year ended 31 December 2010
Opening net book amount 1,151 1,915 3,066
Reclassification 25 (25) -
Additions 5 249 254
Acquisitions 10 21 31
Depreciation charge for the year (50) (293) (343)
Retirements and disposals (11) (7) (18)
Hyperinflation adjustment 16 18 34
Foreign currency translation adjustment (18) 2 (16)
At 31 December 2010 1,128 1,880 3,008
At 31 December 2010
Cost or deemed cost 1,542 4,198 5,740
Accumulated depreciation and impairment losses (414) (2,318) (2,732)
Net book amount 1,128 1,880 3,008
Year ended 31 December 2011
Opening net book amount 1,128 1,880 3,008
Reclassification 19 (25) (6)
Additions 4 282 286
Acquisitions 2 7 9
Depreciation charge for the year (50) (296) (346)
Impairments (5) (10) (15)
Retirements and disposals (2) (1) (3)
Hyperinflation adjustment 21 23 44
Foreign currency translation adjustment (2) (2) (4)
At 31 December 2011 1,115 1,858 2,973
At 31 December 2011
Cost or deemed cost 1,582 4,393 5,975
Accumulated depreciation and impairment losses (467) (2,535) (3,002)
Net book amount 1,115 1,858 2,973
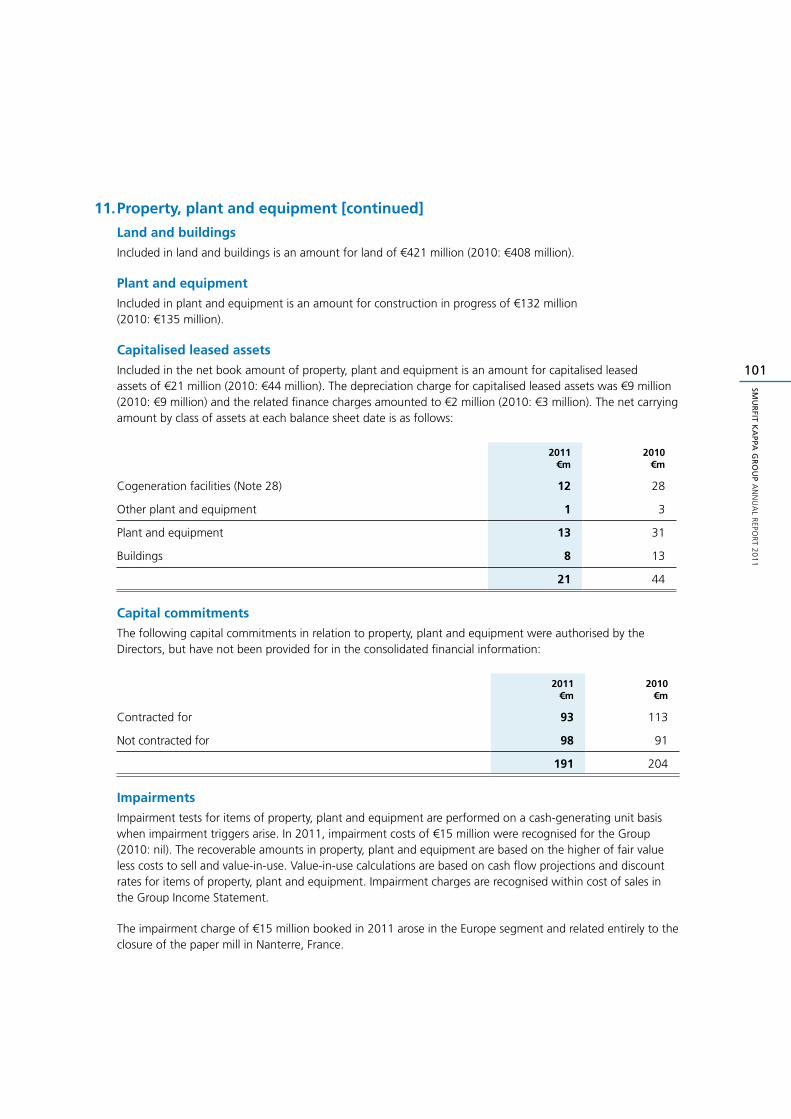
101
SMU
RFIT K
APPA
GR
OU
P A
NN
UA
L REPO
RT 2
01
1
11. Property, plant and equipment [continued]
Land and buildings
Included in land and buildings is an amount for land of €421 million (2010: €408 million).
Plant and equipment
Included in plant and equipment is an amount for construction in progress of €132 million (2010: €135 million).
Capitalised leased assets
Included in the net book amount of property, plant and equipment is an amount for capitalised leased assets of €21 million (2010: €44 million). The depreciation charge for capitalised leased assets was €9 million (2010: €9 million) and the related finance charges amounted to €2 million (2010: €3 million). The net carrying amount by class of assets at each balance sheet date is as follows:
2011€m
2010€m
Cogeneration facilities (Note 28) 12 28
Other plant and equipment 1 3
Plant and equipment 13 31
Buildings 8 13
21 44
Capital commitments
The following capital commitments in relation to property, plant and equipment were authorised by the Directors, but have not been provided for in the consolidated financial information:
2011€m
2010€m
Contracted for 93 113
Not contracted for 98 91
191 204
Impairments
Impairment tests for items of property, plant and equipment are performed on a cash-generating unit basis when impairment triggers arise. In 2011, impairment costs of €15 million were recognised for the Group (2010: nil). The recoverable amounts in property, plant and equipment are based on the higher of fair value less costs to sell and value-in-use. Value-in-use calculations are based on cash flow projections and discount rates for items of property, plant and equipment. Impairment charges are recognised within cost of sales in the Group Income Statement.
The impairment charge of €15 million booked in 2011 arose in the Europe segment and related entirely to the closure of the paper mill in Nanterre, France.
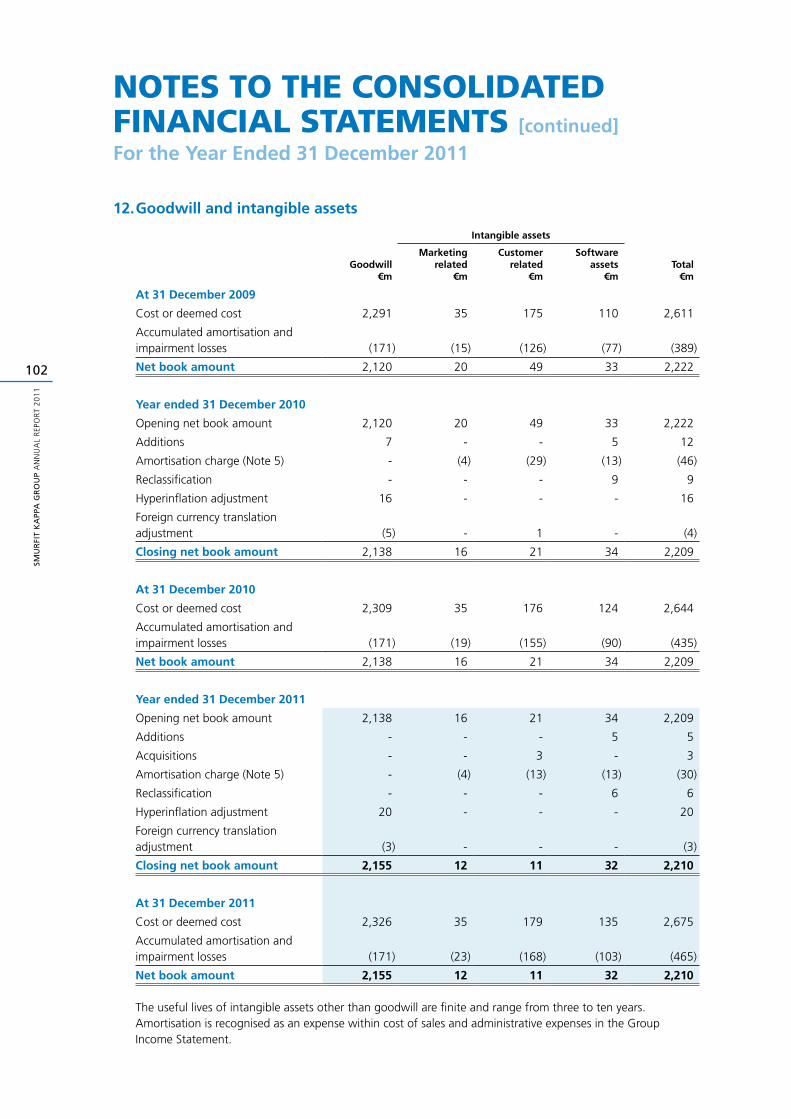
SMU
RFI
T K
APP
A G
RO
UP
AN
NU
AL
REP
OR
T 2
01
1
102
noteS to the ConSoliDateD finanCial StatementS [continued]
For the Year Ended 31 December 2011
12. Goodwill and intangible assets
Intangible assets
Goodwill€m
Marketingrelated
€m
Customerrelated
€m
Software assets
€mTotal
€m
At 31 December 2009
Cost or deemed cost 2,291 35 175 110 2,611
Accumulated amortisation and impairment losses (171) (15) (126) (77) (389)
Net book amount 2,120 20 49 33 2,222
Year ended 31 December 2010
Opening net book amount 2,120 20 49 33 2,222
Additions 7 - - 5 12
Amortisation charge (Note 5) - (4) (29) (13) (46)
Reclassification - - - 9 9
Hyperinflation adjustment 16 - - - 16
Foreign currency translation adjustment (5) - 1 - (4)
Closing net book amount 2,138 16 21 34 2,209
At 31 December 2010
Cost or deemed cost 2,309 35 176 124 2,644
Accumulated amortisation and impairment losses (171) (19) (155) (90) (435)
Net book amount 2,138 16 21 34 2,209
Year ended 31 December 2011
Opening net book amount 2,138 16 21 34 2,209
Additions - - - 5 5
Acquisitions - - 3 - 3
Amortisation charge (Note 5) - (4) (13) (13) (30)
Reclassification - - - 6 6
Hyperinflation adjustment 20 - - - 20
Foreign currency translation adjustment (3) - - - (3)
Closing net book amount 2,155 12 11 32 2,210
At 31 December 2011
Cost or deemed cost 2,326 35 179 135 2,675
Accumulated amortisation and impairment losses (171) (23) (168) (103) (465)
Net book amount 2,155 12 11 32 2,210
The useful lives of intangible assets other than goodwill are finite and range from three to ten years. Amortisation is recognised as an expense within cost of sales and administrative expenses in the Group Income Statement.
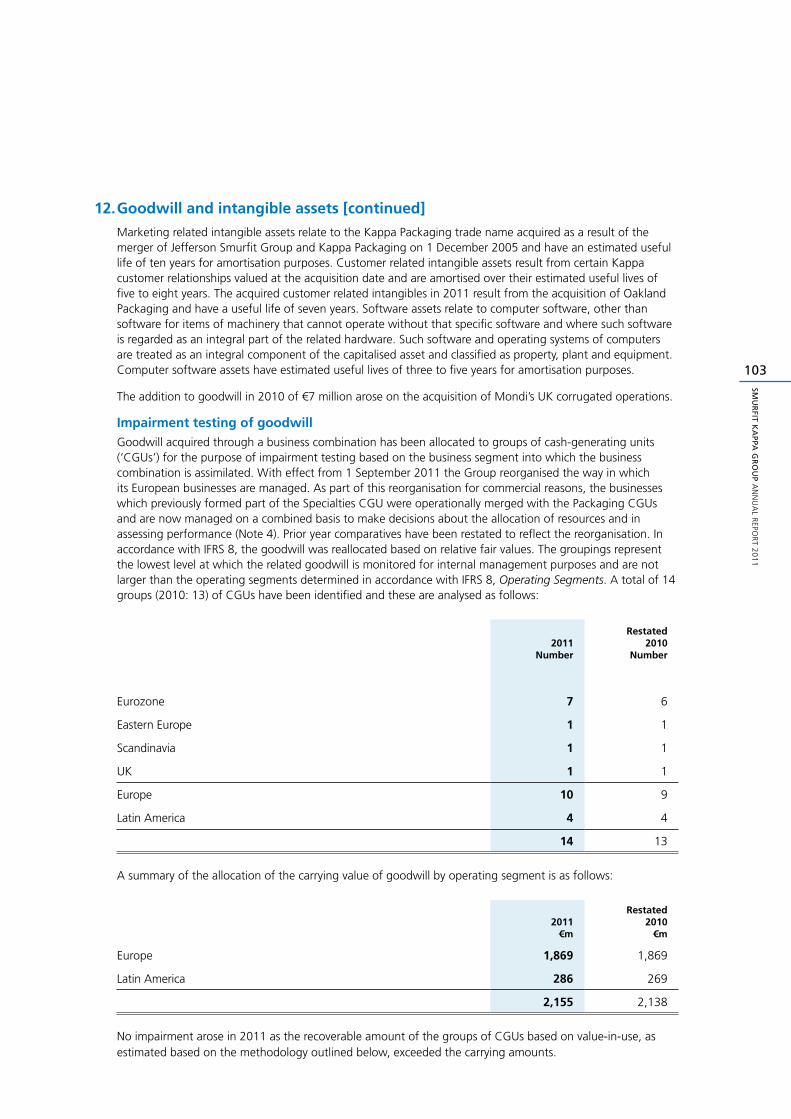
103
SMU
RFIT K
APPA
GR
OU
P A
NN
UA
L REPO
RT 2
01
1
12. Goodwill and intangible assets [continued]
Marketing related intangible assets relate to the Kappa Packaging trade name acquired as a result of the merger of Jefferson Smurfit Group and Kappa Packaging on 1 December 2005 and have an estimated useful life of ten years for amortisation purposes. Customer related intangible assets result from certain Kappa customer relationships valued at the acquisition date and are amortised over their estimated useful lives of five to eight years. The acquired customer related intangibles in 2011 result from the acquisition of Oakland Packaging and have a useful life of seven years. Software assets relate to computer software, other than software for items of machinery that cannot operate without that specific software and where such software is regarded as an integral part of the related hardware. Such software and operating systems of computers are treated as an integral component of the capitalised asset and classified as property, plant and equipment. Computer software assets have estimated useful lives of three to five years for amortisation purposes.
The addition to goodwill in 2010 of €7 million arose on the acquisition of Mondi’s UK corrugated operations.
Impairment testing of goodwillGoodwill acquired through a business combination has been allocated to groups of cash-generating units (‘CGUs’) for the purpose of impairment testing based on the business segment into which the business combination is assimilated. With effect from 1 September 2011 the Group reorganised the way in which its European businesses are managed. As part of this reorganisation for commercial reasons, the businesses which previously formed part of the Specialties CGU were operationally merged with the Packaging CGUs and are now managed on a combined basis to make decisions about the allocation of resources and in assessing performance (Note 4). Prior year comparatives have been restated to reflect the reorganisation. In accordance with IFRS 8, the goodwill was reallocated based on relative fair values. The groupings represent the lowest level at which the related goodwill is monitored for internal management purposes and are not larger than the operating segments determined in accordance with IFRS 8, Operating Segments. A total of 14 groups (2010: 13) of CGUs have been identified and these are analysed as follows:
2011Number
Restated2010
Number
Eurozone 7 6
Eastern Europe 1 1
Scandinavia 1 1
UK 1 1
Europe 10 9
Latin America 4 4
14 13
A summary of the allocation of the carrying value of goodwill by operating segment is as follows:
2011€m
Restated2010
€m
Europe 1,869 1,869
Latin America 286 269
2,155 2,138
No impairment arose in 2011 as the recoverable amount of the groups of CGUs based on value-in-use, as estimated based on the methodology outlined below, exceeded the carrying amounts.
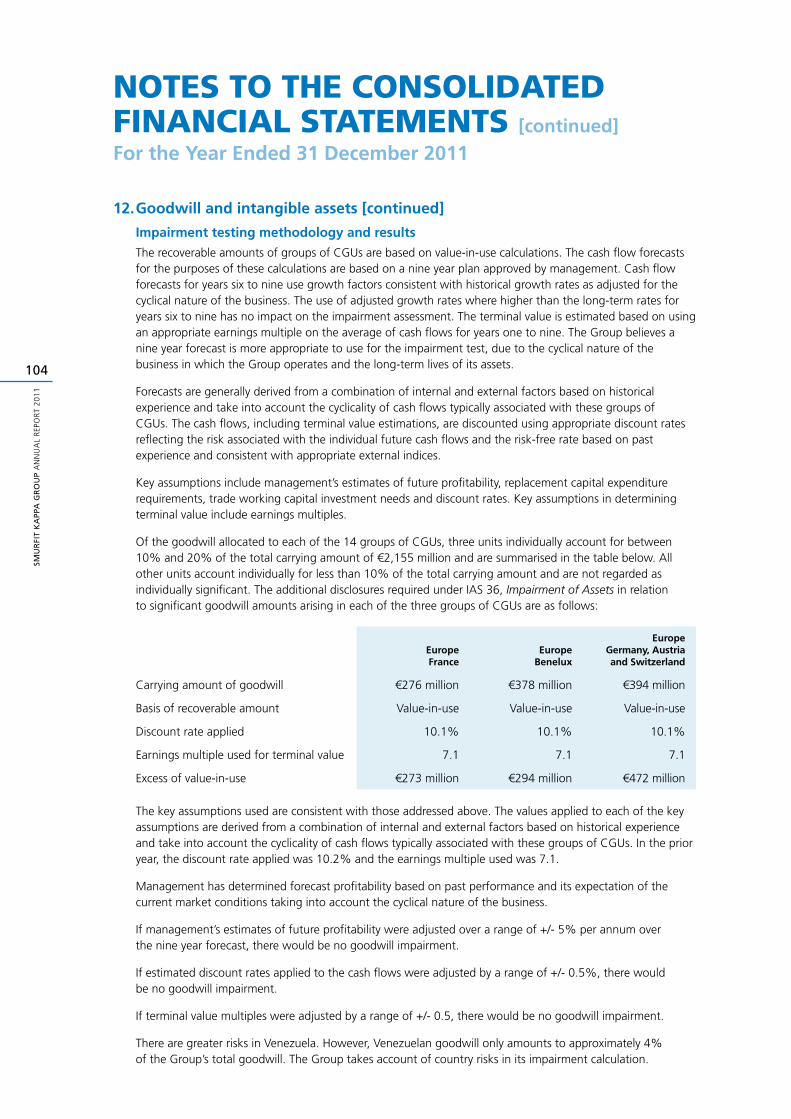
SMU
RFI
T K
APP
A G
RO
UP
AN
NU
AL
REP
OR
T 2
01
1
104
noteS to the ConSoliDateD finanCial StatementS [continued]
For the Year Ended 31 December 2011
12. Goodwill and intangible assets [continued]
Impairment testing methodology and results
The recoverable amounts of groups of CGUs are based on value-in-use calculations. The cash flow forecasts for the purposes of these calculations are based on a nine year plan approved by management. Cash flow forecasts for years six to nine use growth factors consistent with historical growth rates as adjusted for the cyclical nature of the business. The use of adjusted growth rates where higher than the long-term rates for years six to nine has no impact on the impairment assessment. The terminal value is estimated based on using an appropriate earnings multiple on the average of cash flows for years one to nine. The Group believes a nine year forecast is more appropriate to use for the impairment test, due to the cyclical nature of the business in which the Group operates and the long-term lives of its assets.
Forecasts are generally derived from a combination of internal and external factors based on historical experience and take into account the cyclicality of cash flows typically associated with these groups of CGUs. The cash flows, including terminal value estimations, are discounted using appropriate discount rates reflecting the risk associated with the individual future cash flows and the risk-free rate based on past experience and consistent with appropriate external indices.
Key assumptions include management’s estimates of future profitability, replacement capital expenditure requirements, trade working capital investment needs and discount rates. Key assumptions in determining terminal value include earnings multiples.
Of the goodwill allocated to each of the 14 groups of CGUs, three units individually account for between 10% and 20% of the total carrying amount of €2,155 million and are summarised in the table below. All other units account individually for less than 10% of the total carrying amount and are not regarded as individually significant. The additional disclosures required under IAS 36, Impairment of Assets in relation to significant goodwill amounts arising in each of the three groups of CGUs are as follows:
EuropeFrance
EuropeBenelux
EuropeGermany, Austria and Switzerland
Carrying amount of goodwill €276 million €378 million €394 million
Basis of recoverable amount Value-in-use Value-in-use Value-in-use
Discount rate applied 10.1% 10.1% 10.1%
Earnings multiple used for terminal value 7.1 7.1 7.1
Excess of value-in-use €273 million €294 million €472 million
The key assumptions used are consistent with those addressed above. The values applied to each of the key assumptions are derived from a combination of internal and external factors based on historical experience and take into account the cyclicality of cash flows typically associated with these groups of CGUs. In the prior year, the discount rate applied was 10.2% and the earnings multiple used was 7.1.
Management has determined forecast profitability based on past performance and its expectation of the current market conditions taking into account the cyclical nature of the business.
If management’s estimates of future profitability were adjusted over a range of +/- 5% per annum over the nine year forecast, there would be no goodwill impairment.
If estimated discount rates applied to the cash flows were adjusted by a range of +/- 0.5%, there would be no goodwill impairment.
If terminal value multiples were adjusted by a range of +/- 0.5, there would be no goodwill impairment.
There are greater risks in Venezuela. However, Venezuelan goodwill only amounts to approximately 4% of the Group’s total goodwill. The Group takes account of country risks in its impairment calculation.
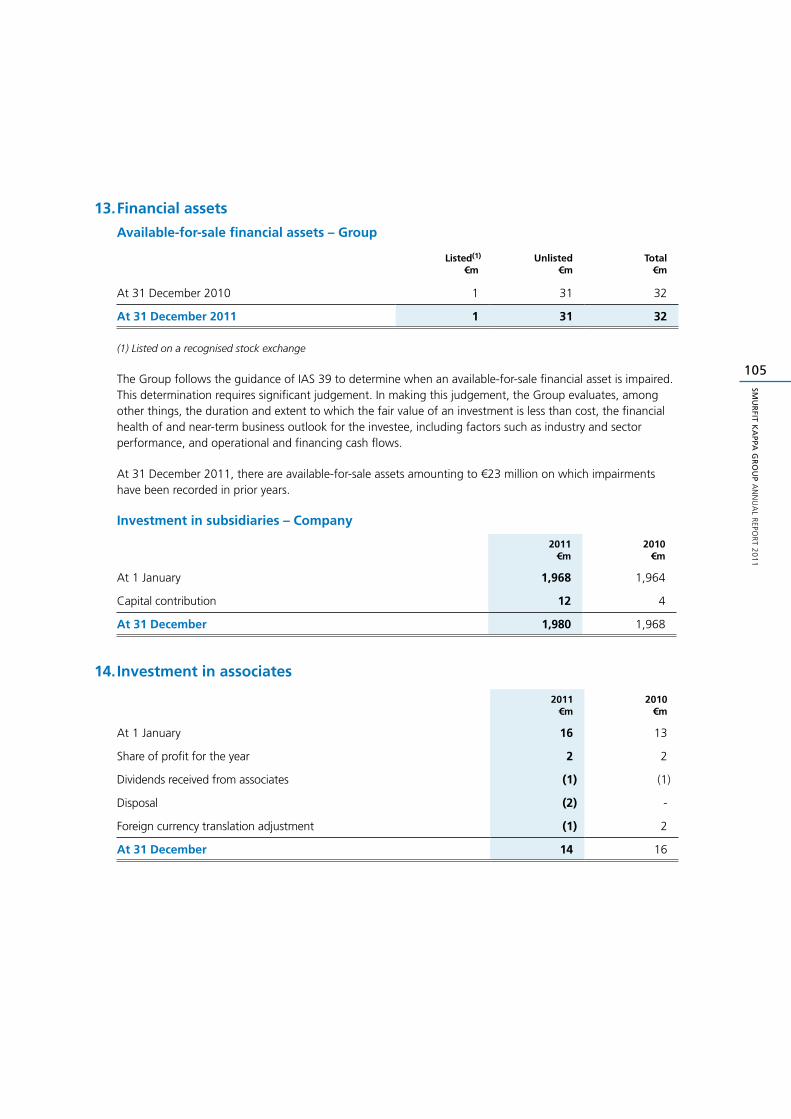
105
SMU
RFIT K
APPA
GR
OU
P A
NN
UA
L REPO
RT 2
01
1
13. Financial assets
Available-for-sale financial assets – Group
Listed(1)
€mUnlisted
€mTotal
€m
At 31 December 2010 1 31 32
At 31 December 2011 1 31 32
(1) Listed on a recognised stock exchange
The Group follows the guidance of IAS 39 to determine when an available-for-sale financial asset is impaired. This determination requires significant judgement. In making this judgement, the Group evaluates, among other things, the duration and extent to which the fair value of an investment is less than cost, the financial health of and near-term business outlook for the investee, including factors such as industry and sector performance, and operational and financing cash flows.
At 31 December 2011, there are available-for-sale assets amounting to €23 million on which impairments have been recorded in prior years.
Investment in subsidiaries – Company
2011€m
2010€m
At 1 January 1,968 1,964
Capital contribution 12 4
At 31 December 1,980 1,968
14. Investment in associates
2011€m
2010€m
At 1 January 16 13
Share of profit for the year 2 2
Dividends received from associates (1) (1)
Disposal (2) -
Foreign currency translation adjustment (1) 2
At 31 December 14 16
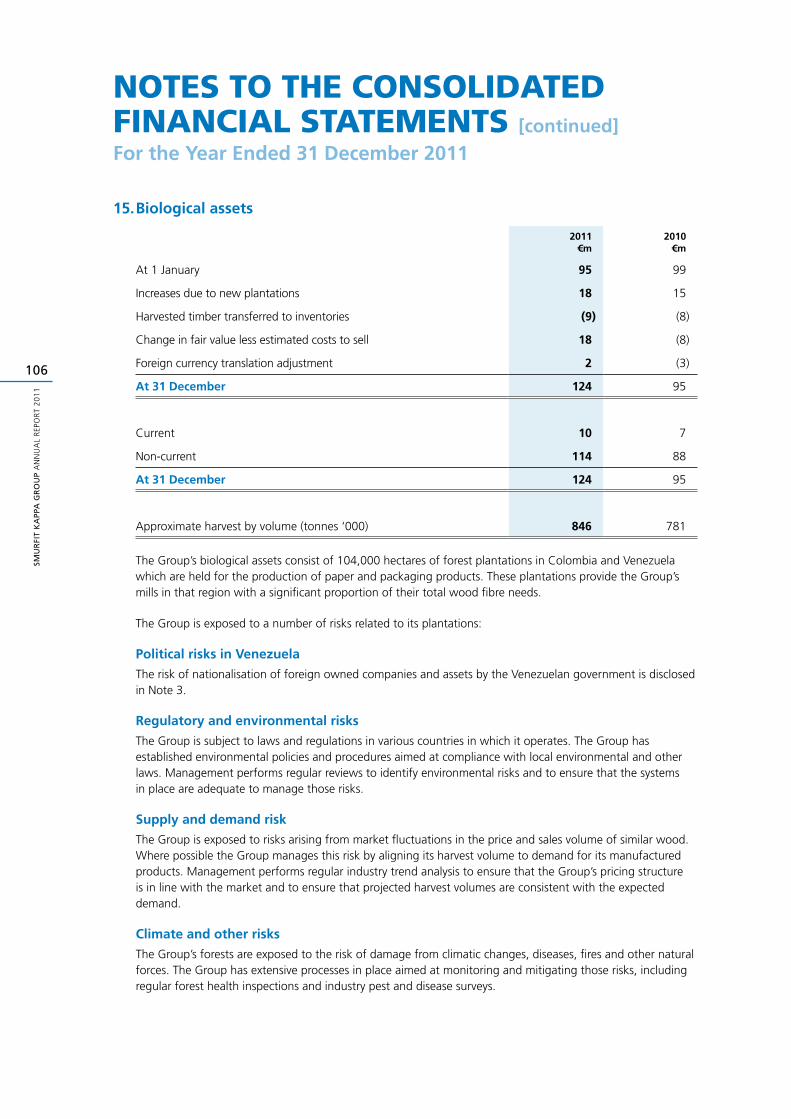
SMU
RFI
T K
APP
A G
RO
UP
AN
NU
AL
REP
OR
T 2
01
1
106
noteS to the ConSoliDateD finanCial StatementS [continued]
For the Year Ended 31 December 2011
15. Biological assets
2011€m
2010€m
At 1 January 95 99
Increases due to new plantations 18 15
Harvested timber transferred to inventories (9) (8)
Change in fair value less estimated costs to sell 18 (8)
Foreign currency translation adjustment 2 (3)
At 31 December 124 95
Current 10 7
Non-current 114 88
At 31 December 124 95
Approximate harvest by volume (tonnes ‘000) 846 781
The Group’s biological assets consist of 104,000 hectares of forest plantations in Colombia and Venezuela which are held for the production of paper and packaging products. These plantations provide the Group’s mills in that region with a significant proportion of their total wood fibre needs.
The Group is exposed to a number of risks related to its plantations:
Political risks in Venezuela
The risk of nationalisation of foreign owned companies and assets by the Venezuelan government is disclosed in Note 3.
Regulatory and environmental risks
The Group is subject to laws and regulations in various countries in which it operates. The Group has established environmental policies and procedures aimed at compliance with local environmental and other laws. Management performs regular reviews to identify environmental risks and to ensure that the systems in place are adequate to manage those risks.
Supply and demand risk
The Group is exposed to risks arising from market fluctuations in the price and sales volume of similar wood. Where possible the Group manages this risk by aligning its harvest volume to demand for its manufactured products. Management performs regular industry trend analysis to ensure that the Group’s pricing structure is in line with the market and to ensure that projected harvest volumes are consistent with the expected demand.
Climate and other risks
The Group’s forests are exposed to the risk of damage from climatic changes, diseases, fires and other natural forces. The Group has extensive processes in place aimed at monitoring and mitigating those risks, including regular forest health inspections and industry pest and disease surveys.
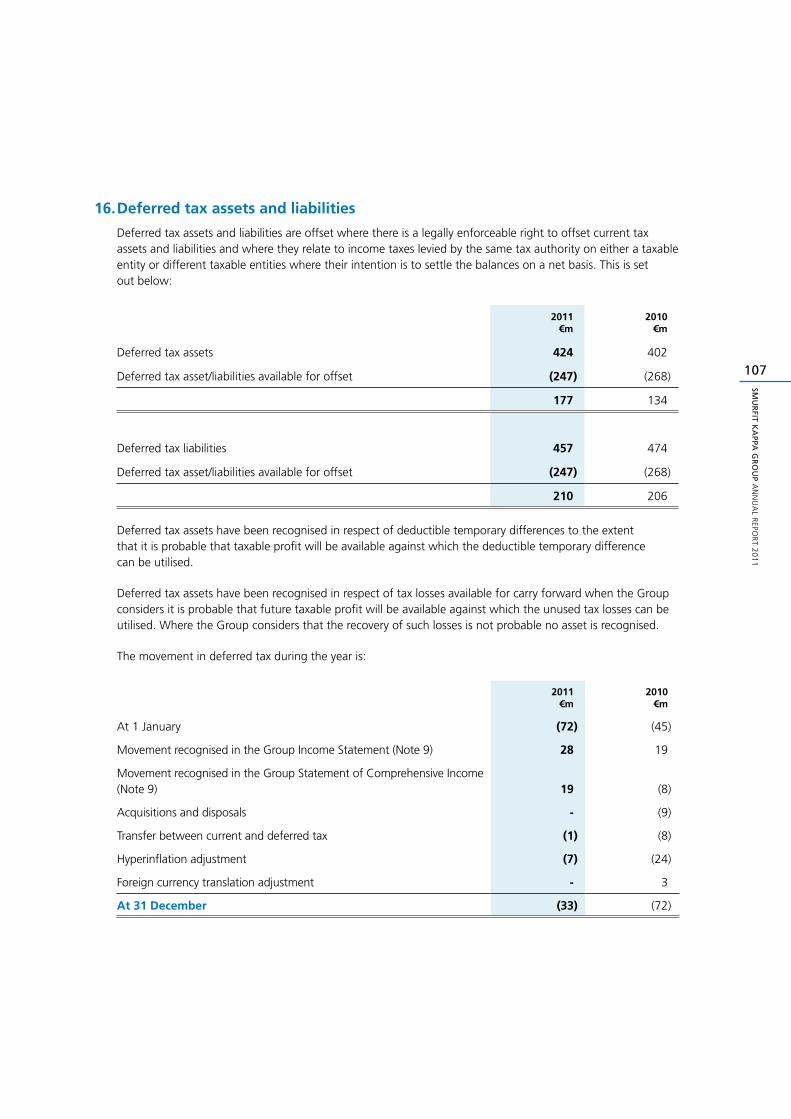
107
SMU
RFIT K
APPA
GR
OU
P A
NN
UA
L REPO
RT 2
01
1
16. Deferred tax assets and liabilities
Deferred tax assets and liabilities are offset where there is a legally enforceable right to offset current tax assets and liabilities and where they relate to income taxes levied by the same tax authority on either a taxable entity or different taxable entities where their intention is to settle the balances on a net basis. This is set out below:
2011€m
2010€m
Deferred tax assets 424 402
Deferred tax asset/liabilities available for offset (247) (268)
177 134
Deferred tax liabilities 457 474
Deferred tax asset/liabilities available for offset (247) (268)
210 206
Deferred tax assets have been recognised in respect of deductible temporary differences to the extent that it is probable that taxable profit will be available against which the deductible temporary difference can be utilised.
Deferred tax assets have been recognised in respect of tax losses available for carry forward when the Group considers it is probable that future taxable profit will be available against which the unused tax losses can be utilised. Where the Group considers that the recovery of such losses is not probable no asset is recognised.
The movement in deferred tax during the year is:
2011€m
2010€m
At 1 January (72) (45)
Movement recognised in the Group Income Statement (Note 9) 28 19
Movement recognised in the Group Statement of Comprehensive Income (Note 9) 19 (8)
Acquisitions and disposals - (9)
Transfer between current and deferred tax (1) (8)
Hyperinflation adjustment (7) (24)
Foreign currency translation adjustment - 3
At 31 December (33) (72)
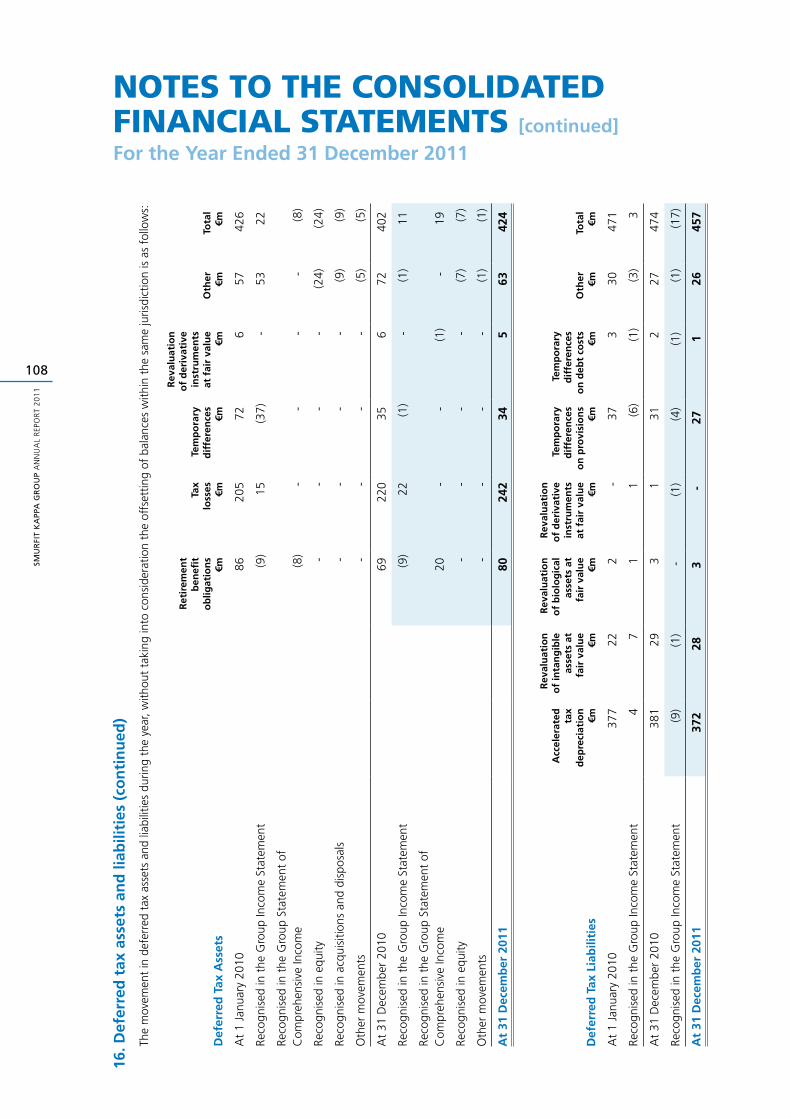
SMU
RFI
T K
APP
A G
RO
UP
AN
NU
AL
REP
OR
T 2
01
1
108
noteS to the ConSoliDateD finanCial StatementS [continued]
For the Year Ended 31 December 2011
16. D
efer
red
tax
ass
ets
and
liab
iliti
es (
con
tin
ued
)
The
mov
emen
t in
def
erre
d ta
x as
sets
and
liab
ilitie
s du
ring
the
year
, with
out
taki
ng in
to c
onsi
dera
tion
the
offs
ettin
g of
bal
ance
s w
ithin
the
sam
e ju
risdi
ctio
n is
as
follo
ws:
Def
erre
d T
ax A
sset
s
Ret
irem
ent
ben
efit
ob
ligat
ion
s€m
Tax
loss
es €m
Tem
po
rary
dif
fere
nce
s€m
Rev
alu
atio
n
of
der
ivat
ive
inst
rum
ents
at
fai
r va
lue
€mO
ther €m
Tota
l€m
At
1 Ja
nuar
y 20
1086
205
726
5742
6
Reco
gnis
ed in
the
Gro
up In
com
e St
atem
ent
(9)
15(3
7)-
5322
Reco
gnis
ed in
the
Gro
up S
tate
men
t of
C
ompr
ehen
sive
Inco
me
(8)
--
--
(8)
Reco
gnis
ed in
equ
ity-
--
-(2
4)(2
4)
Reco
gnis
ed in
acq
uisi
tions
and
dis
posa
ls-
--
-(9
)(9
)
Oth
er m
ovem
ents
- -
- -
(5)
(5)
At
31 D
ecem
ber
2010
6922
035
672
402
Reco
gnis
ed in
the
Gro
up In
com
e St
atem
ent
(9)
22(1
)-
(1)
11
Reco
gnis
ed in
the
Gro
up S
tate
men
t of
C
ompr
ehen
sive
Inco
me
20-
-(1
)-
19
Reco
gnis
ed in
equ
ity-
--
-(7
)(7
)
Oth
er m
ovem
ents
- -
- -
(1)
(1)
At
31 D
ecem
ber
201
1
80
242
345
6342
4
Def
erre
d T
ax L
iab
iliti
es
Acc
eler
ated
ta
x d
epre
ciat
ion
€m
Rev
alu
atio
n
of
inta
ng
ible
as
sets
at
fair
val
ue
€m
Rev
alu
atio
n
of
bio
log
ical
as
sets
at
fair
val
ue
€m
Rev
alu
atio
n
of
der
ivat
ive
inst
rum
ents
at
fai
r va
lue
€m
Tem
po
rary
dif
fere
nce
s o
n p
rovi
sio
ns
€m
Tem
po
rary
d
iffe
ren
ces
on
deb
t co
sts
€mO
ther €m
Tota
l€m
At
1 Ja
nuar
y 20
1037
722
2-
373
3047
1
Reco
gnis
ed in
the
Gro
up In
com
e St
atem
ent
47
11
(6)
(1)
(3)
3
At
31 D
ecem
ber
2010
381
293
131
227
474
Reco
gnis
ed in
the
Gro
up In
com
e St
atem
ent
(9)
(1)
-(1
)(4
)(1
)(1
)(1
7)
At
31 D
ecem
ber
201
137
228
3-
271
2645
7
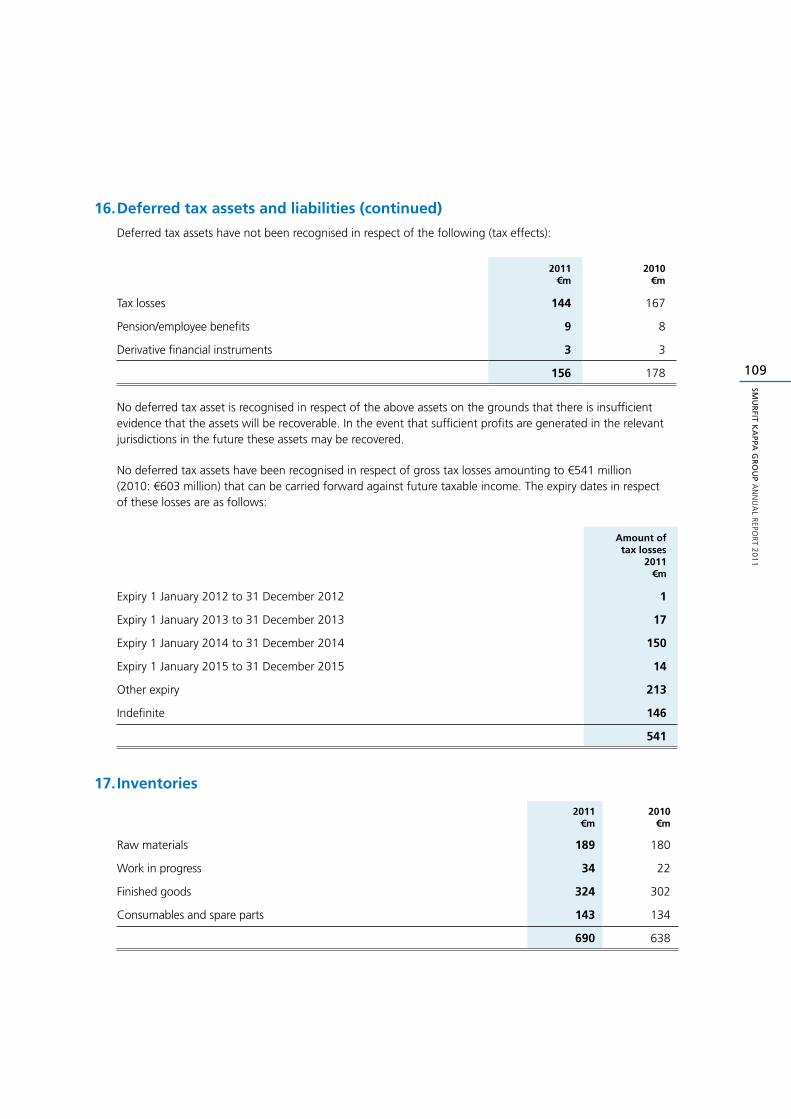
109
SMU
RFIT K
APPA
GR
OU
P A
NN
UA
L REPO
RT 2
01
1
16. Deferred tax assets and liabilities (continued)
Deferred tax assets have not been recognised in respect of the following (tax effects):
2011€m
2010€m
Tax losses 144 167
Pension/employee benefits 9 8
Derivative financial instruments 3 3
156 178
No deferred tax asset is recognised in respect of the above assets on the grounds that there is insufficient evidence that the assets will be recoverable. In the event that sufficient profits are generated in the relevant jurisdictions in the future these assets may be recovered.
No deferred tax assets have been recognised in respect of gross tax losses amounting to €541 million (2010: €603 million) that can be carried forward against future taxable income. The expiry dates in respect of these losses are as follows:
Amount of tax losses
2011€m
Expiry 1 January 2012 to 31 December 2012 1
Expiry 1 January 2013 to 31 December 2013 17
Expiry 1 January 2014 to 31 December 2014 150
Expiry 1 January 2015 to 31 December 2015 14
Other expiry 213
Indefinite 146
541
17. Inventories
2011€m
2010€m
Raw materials 189 180
Work in progress 34 22
Finished goods 324 302
Consumables and spare parts 143 134
690 638
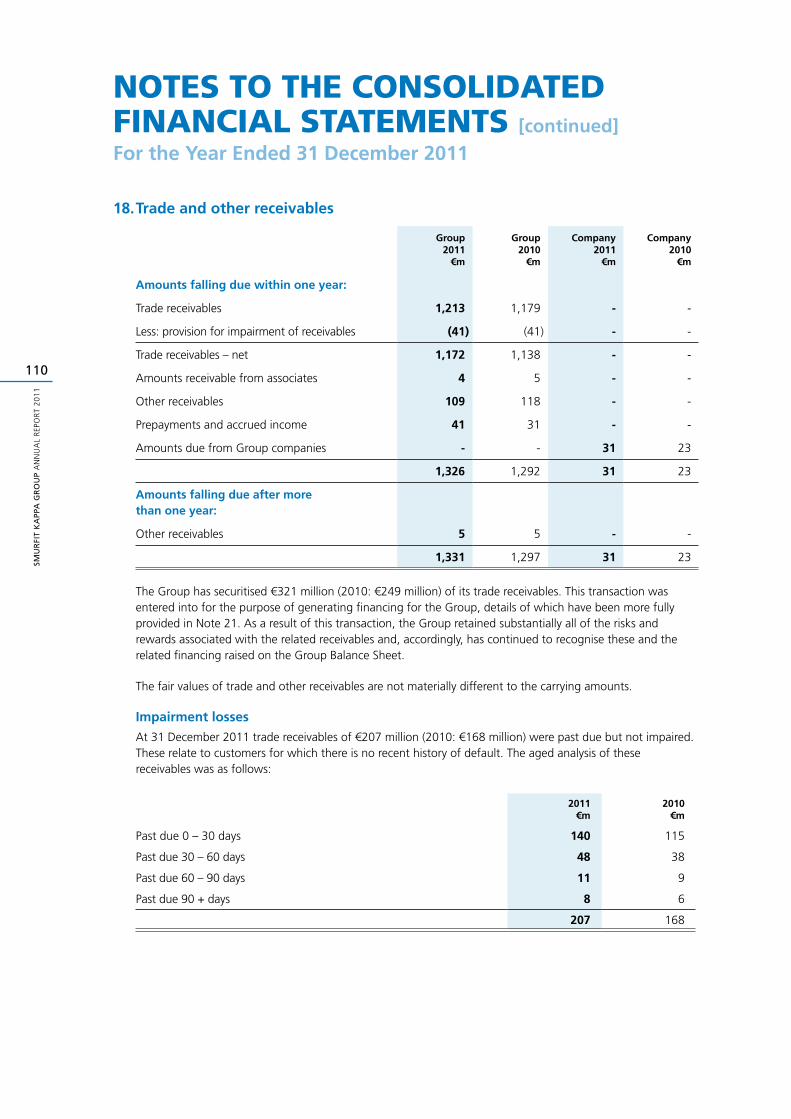
SMU
RFI
T K
APP
A G
RO
UP
AN
NU
AL
REP
OR
T 2
01
1
110
noteS to the ConSoliDateD finanCial StatementS [continued]
For the Year Ended 31 December 2011
18. Trade and other receivables
Group2011
€m
Group2010
€m
Company2011
€m
Company2010
€m
Amounts falling due within one year:
Trade receivables 1,213 1,179 - -
Less: provision for impairment of receivables (41) (41) - -
Trade receivables – net 1,172 1,138 - -
Amounts receivable from associates 4 5 - -
Other receivables 109 118 - -
Prepayments and accrued income 41 31 - -
Amounts due from Group companies - - 31 23
1,326 1,292 31 23
Amounts falling due after more than one year:
Other receivables 5 5 - -
1,331 1,297 31 23
The Group has securitised €321 million (2010: €249 million) of its trade receivables. This transaction was entered into for the purpose of generating financing for the Group, details of which have been more fully provided in Note 21. As a result of this transaction, the Group retained substantially all of the risks and rewards associated with the related receivables and, accordingly, has continued to recognise these and the related financing raised on the Group Balance Sheet.
The fair values of trade and other receivables are not materially different to the carrying amounts.
Impairment losses
At 31 December 2011 trade receivables of €207 million (2010: €168 million) were past due but not impaired. These relate to customers for which there is no recent history of default. The aged analysis of these receivables was as follows:
2011€m
2010€m
Past due 0 – 30 days 140 115
Past due 30 – 60 days 48 38
Past due 60 – 90 days 11 9
Past due 90 + days 8 6
207 168
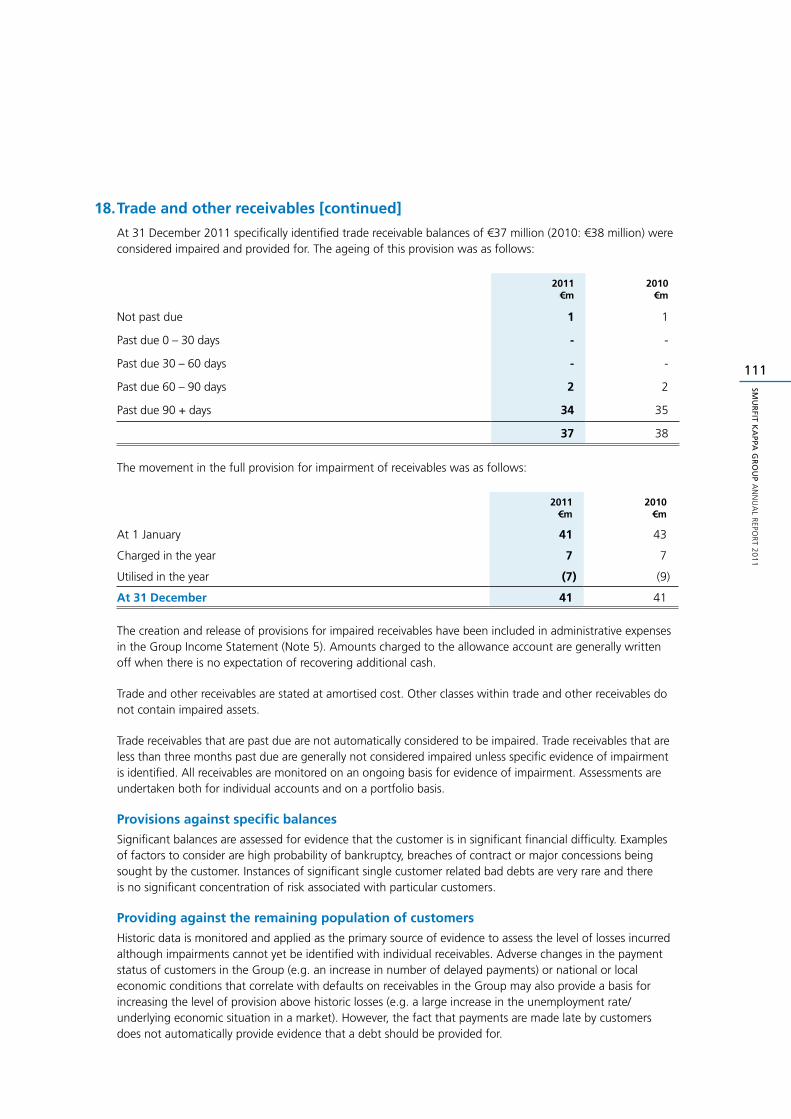
111
SMU
RFIT K
APPA
GR
OU
P A
NN
UA
L REPO
RT 2
01
1
18. Trade and other receivables [continued]
At 31 December 2011 specifically identified trade receivable balances of €37 million (2010: €38 million) were considered impaired and provided for. The ageing of this provision was as follows:
2011€m
2010€m
Not past due 1 1
Past due 0 – 30 days - -
Past due 30 – 60 days - -
Past due 60 – 90 days 2 2
Past due 90 + days 34 35
37 38
The movement in the full provision for impairment of receivables was as follows:
2011€m
2010€m
At 1 January 41 43
Charged in the year 7 7
Utilised in the year (7) (9)
At 31 December 41 41
The creation and release of provisions for impaired receivables have been included in administrative expenses in the Group Income Statement (Note 5). Amounts charged to the allowance account are generally written off when there is no expectation of recovering additional cash.
Trade and other receivables are stated at amortised cost. Other classes within trade and other receivables do not contain impaired assets.
Trade receivables that are past due are not automatically considered to be impaired. Trade receivables that are less than three months past due are generally not considered impaired unless specific evidence of impairment is identified. All receivables are monitored on an ongoing basis for evidence of impairment. Assessments are undertaken both for individual accounts and on a portfolio basis.
Provisions against specific balances
Significant balances are assessed for evidence that the customer is in significant financial difficulty. Examples of factors to consider are high probability of bankruptcy, breaches of contract or major concessions being sought by the customer. Instances of significant single customer related bad debts are very rare and there is no significant concentration of risk associated with particular customers.
Providing against the remaining population of customers
Historic data is monitored and applied as the primary source of evidence to assess the level of losses incurred although impairments cannot yet be identified with individual receivables. Adverse changes in the payment status of customers in the Group (e.g. an increase in number of delayed payments) or national or local economic conditions that correlate with defaults on receivables in the Group may also provide a basis for increasing the level of provision above historic losses (e.g. a large increase in the unemployment rate/underlying economic situation in a market). However, the fact that payments are made late by customers does not automatically provide evidence that a debt should be provided for.
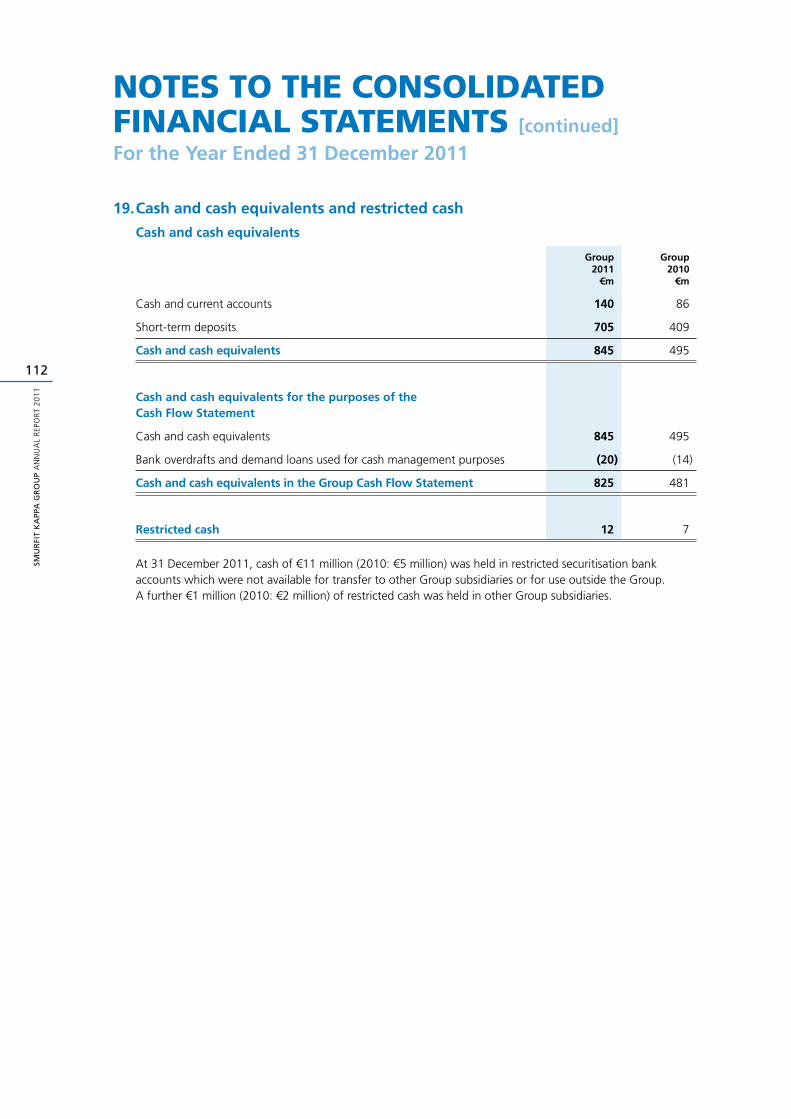
SMU
RFI
T K
APP
A G
RO
UP
AN
NU
AL
REP
OR
T 2
01
1
112
noteS to the ConSoliDateD finanCial StatementS [continued]
For the Year Ended 31 December 2011
19. Cash and cash equivalents and restricted cash
Cash and cash equivalents
Group2011
€m
Group2010
€m
Cash and current accounts 140 86
Short-term deposits 705 409
Cash and cash equivalents 845 495
Cash and cash equivalents for the purposes of the Cash Flow Statement
Cash and cash equivalents 845 495
Bank overdrafts and demand loans used for cash management purposes (20) (14)
Cash and cash equivalents in the Group Cash Flow Statement 825 481
Restricted cash 12 7
At 31 December 2011, cash of €11 million (2010: €5 million) was held in restricted securitisation bank accounts which were not available for transfer to other Group subsidiaries or for use outside the Group. A further €1 million (2010: €2 million) of restricted cash was held in other Group subsidiaries.
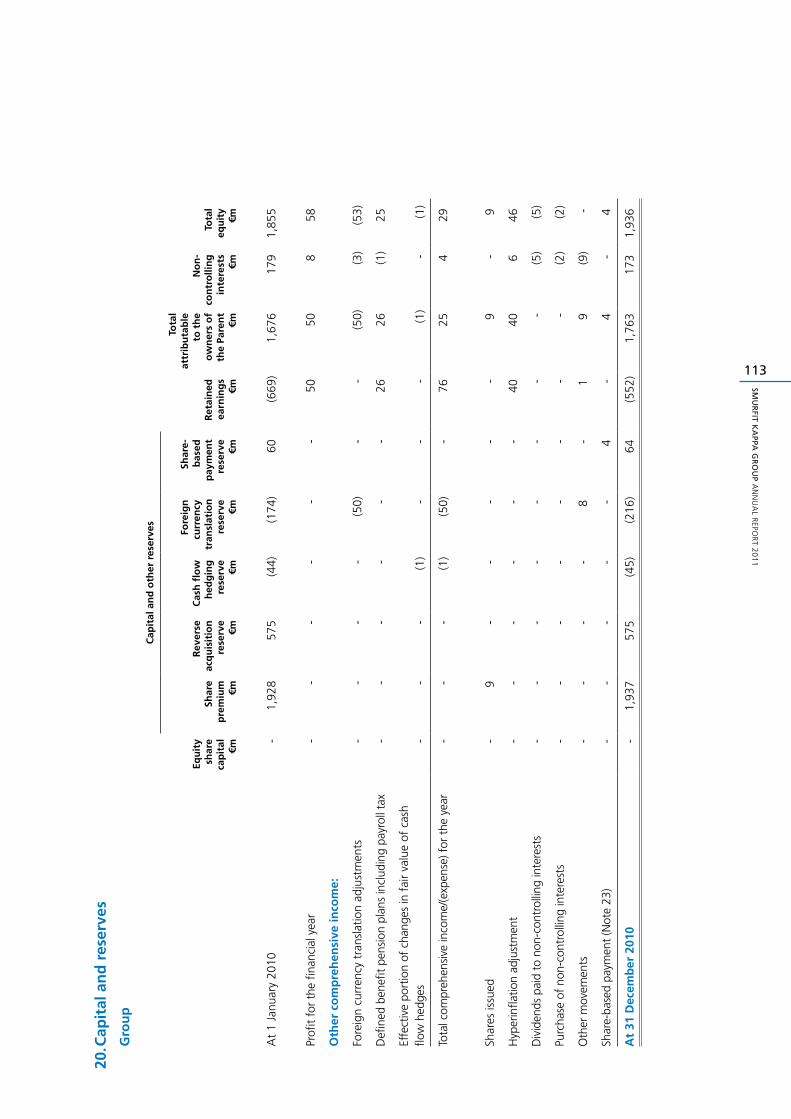
113
SMU
RFIT K
APPA
GR
OU
P A
NN
UA
L REPO
RT 2
01
1
20. C
apit
al a
nd
res
erve
s
Gro
up
Cap
ital
an
d o
ther
res
erve
s
Equ
ity
sh
are
cap
ital
€m
Shar
e p
rem
ium €m
Rev
erse
acq
uis
itio
nre
serv
e€m
Cas
h fl
ow
hed
gin
g r
eser
ve €m
Fore
ign
cu
rren
cy t
ran
slat
ion
res
erve €m
Shar
e-b
ased
pay
men
tre
serv
e€m
Ret
ain
ed e
arn
ing
s€m
Tota
lat
trib
uta
ble
to
th
e o
wn
ers
of
th
e Pa
ren
t€m
No
n-
con
tro
llin
g in
tere
sts
€m
Tota
l eq
uit
y€m
At
1 Ja
nuar
y 20
10-
1,92
857
5(4
4)(1
74)
60(6
69)
1,67
617
91,
855
Profi
t fo
r th
e fin
anci
al y
ear
--
--
--
5050
858
Oth
er c
om
pre
hen
sive
inco
me:
Fore
ign
curr
ency
tra
nsla
tion
adju
stm
ents
--
--
(50)
--
(50)
(3)
(53)
Defi
ned
bene
fit p
ensi
on p
lans
incl
udin
g pa
yrol
l tax
--
--
--
2626
(1)
25
Effe
ctiv
e po
rtio
n of
cha
nges
in f
air
valu
e of
cas
h
flow
hed
ges
--
-(1
)-
--
(1)
-(1
)
Tota
l com
preh
ensi
ve in
com
e/(e
xpen
se) f
or t
he y
ear
--
-(1
)(5
0)-
7625
429
Shar
es is
sued
-9
--
--
-9
-9
Hyp
erin
flatio
n ad
just
men
t-
--
--
-40
406
46
Div
iden
ds p
aid
to n
on-c
ontr
ollin
g in
tere
sts
--
--
--
--
(5)
(5)
Purc
hase
of
non-
cont
rolli
ng in
tere
sts
--
--
--
--
(2)
(2)
Oth
er m
ovem
ents
--
--
8-
19
(9)
-
Shar
e-ba
sed
paym
ent
(Not
e 23
)-
--
--
4-
4-
4
At
31 D
ecem
ber
201
0-
1,93
757
5(4
5)(2
16)
64(5
52)
1,76
317
31,
936
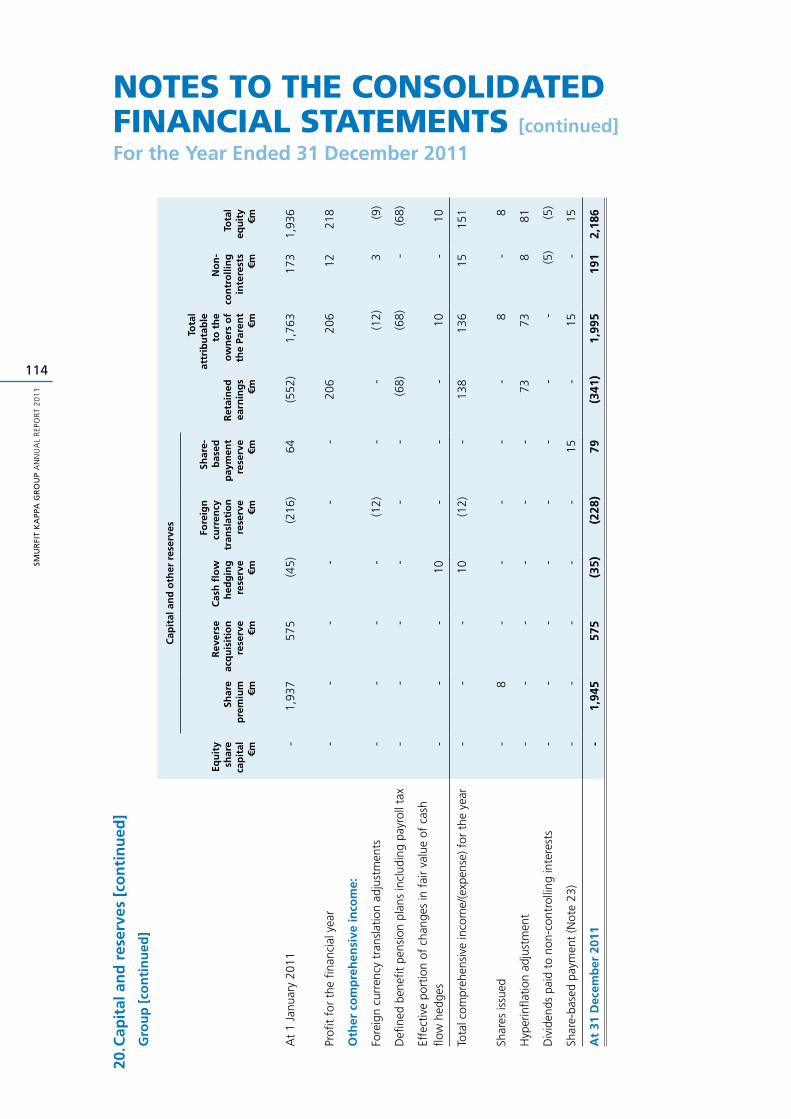
SMU
RFI
T K
APP
A G
RO
UP
AN
NU
AL
REP
OR
T 2
01
1
114
noteS to the ConSoliDateD finanCial StatementS [continued]
For the Year Ended 31 December 2011
20. C
apit
al a
nd
res
erve
s [c
on
tin
ued
]
Gro
up
[co
nti
nu
ed]
Cap
ital
an
d o
ther
res
erve
s
Equ
ity
sh
are
cap
ital
€m
Shar
e p
rem
ium €m
Rev
erse
acq
uis
itio
nre
serv
e€m
Cas
h fl
ow
hed
gin
g r
eser
ve €m
Fore
ign
cu
rren
cy t
ran
slat
ion
res
erve €m
Shar
e-b
ased
pay
men
tre
serv
e€m
Ret
ain
ed e
arn
ing
s€m
Tota
lat
trib
uta
ble
to
th
e o
wn
ers
of
th
e Pa
ren
t€m
No
n-
con
tro
llin
g in
tere
sts
€m
Tota
l eq
uit
y€m
At
1 Ja
nuar
y 20
11-
1,93
757
5(4
5)(2
16)
64(5
52)
1,76
317
31,
936
Profi
t fo
r th
e fin
anci
al y
ear
--
--
--
206
206
1221
8
Oth
er c
om
pre
hen
sive
inco
me:
Fore
ign
curr
ency
tra
nsla
tion
adju
stm
ents
--
--
(12)
--
(12)
3(9
)
Defi
ned
bene
fit p
ensi
on p
lans
incl
udin
g pa
yrol
l tax
--
--
--
(68)
(68)
-(6
8)
Effe
ctiv
e po
rtio
n of
cha
nges
in f
air
valu
e of
cas
h flo
w h
edge
s-
--
10-
--
10-
10
Tota
l com
preh
ensi
ve in
com
e/(e
xpen
se) f
or t
he y
ear
--
-10
(12)
-13
813
615
151
Shar
es is
sued
-8
--
--
-8
-8
Hyp
erin
flatio
n ad
just
men
t-
--
--
-73
738
81
Div
iden
ds p
aid
to n
on-c
ontr
ollin
g in
tere
sts
--
--
--
--
(5)
(5)
Shar
e-ba
sed
paym
ent
(Not
e 23
)-
--
--
15-
15-
15
At
31 D
ecem
ber
201
1-
1,94
557
5(3
5)(2
28)
79(3
41)
1,99
519
12,
186
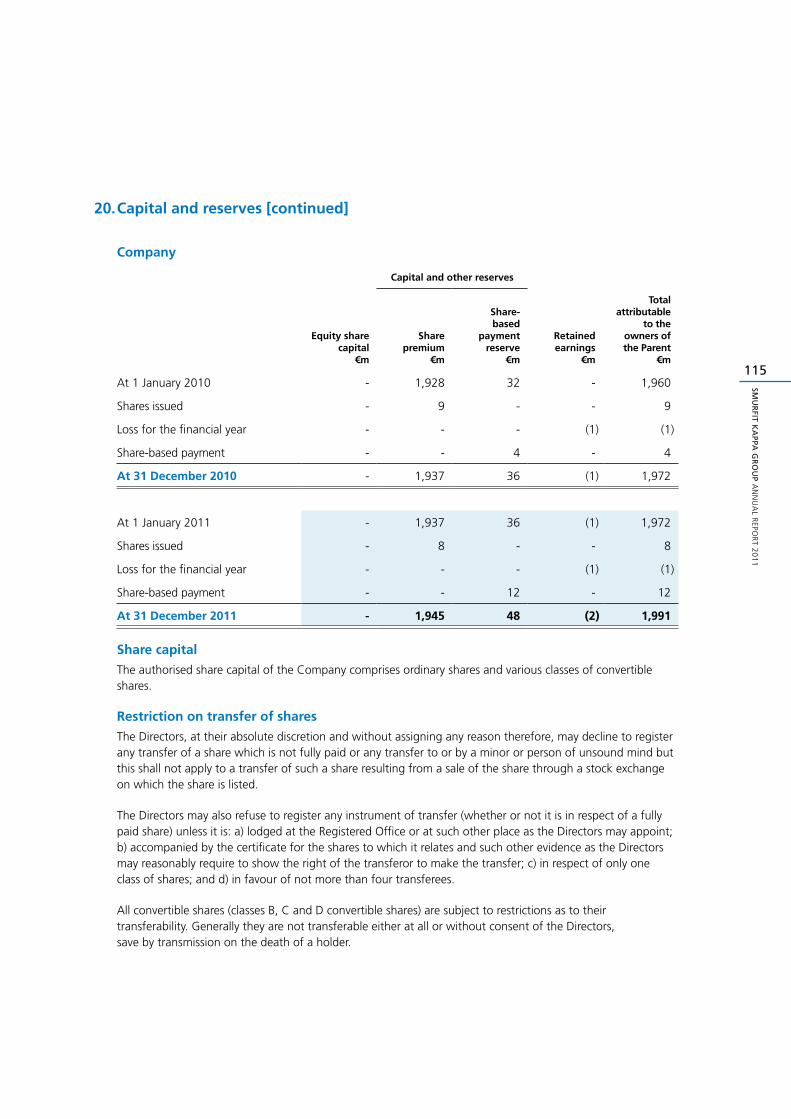
115
SMU
RFIT K
APPA
GR
OU
P A
NN
UA
L REPO
RT 2
01
1
20. Capital and reserves [continued]
Company
Capital and other reserves
Equity sharecapital
€m
Share premium
€m
Share-based
paymentreserve
€m
Retainedearnings
€m
Totalattributable
to the owners of the Parent
€m
At 1 January 2010 - 1,928 32 - 1,960
Shares issued - 9 - - 9
Loss for the financial year - - - (1) (1)
Share-based payment - - 4 - 4
At 31 December 2010 - 1,937 36 (1) 1,972
At 1 January 2011 - 1,937 36 (1) 1,972
Shares issued - 8 - - 8
Loss for the financial year - - - (1) (1)
Share-based payment - - 12 - 12
At 31 December 2011 - 1,945 48 (2) 1,991
Share capital
The authorised share capital of the Company comprises ordinary shares and various classes of convertible shares.
Restriction on transfer of shares
The Directors, at their absolute discretion and without assigning any reason therefore, may decline to register any transfer of a share which is not fully paid or any transfer to or by a minor or person of unsound mind but this shall not apply to a transfer of such a share resulting from a sale of the share through a stock exchange on which the share is listed.
The Directors may also refuse to register any instrument of transfer (whether or not it is in respect of a fully paid share) unless it is: a) lodged at the Registered Office or at such other place as the Directors may appoint; b) accompanied by the certificate for the shares to which it relates and such other evidence as the Directors may reasonably require to show the right of the transferor to make the transfer; c) in respect of only one class of shares; and d) in favour of not more than four transferees.
All convertible shares (classes B, C and D convertible shares) are subject to restrictions as to their transferability. Generally they are not transferable either at all or without consent of the Directors, save by transmission on the death of a holder.
SMU
RFI
T K
APP
A G
RO
UP
AN
NU
AL
REP
OR
T 2
01
1
116
noteS to the ConSoliDateD finanCial StatementS [continued]
For the Year Ended 31 December 2011
20. Capital and reserves [continued]
Share rights
Ordinary sharesSubject to the Articles of Association of SKG plc, the holders of ordinary shares are entitled to share in any dividends in proportion to the number of shares held by them and are entitled to one vote for every share held by them at a general meeting. On a return of capital (whether on repayment of capital, liquidation or otherwise) the assets and/or capital legally available to be distributed shall firstly be distributed amongst the holders of ordinary shares, in proportion to the numbers of ordinary shares held by them, of the nominal value of their ordinary shares, secondly (to the extent available) distributed amongst the holders of convertible shares, in proportion to the numbers of convertible shares held by them, of the nominal value of their convertible shares and the balance (if any) shall be distributed amongst the holders of ordinary shares in proportion to the number of ordinary shares held by them.
Convertible sharesThe holders of convertible shares have no right to participate in the profits of SKG plc and are not entitled to receive notice of, attend or vote at general meetings or to vote on any members’ resolution (save for any resolution with regard to the rights of convertible shares). On return of capital (whether on repayment of capital, liquidation or otherwise) the assets and/or capital legally available to be distributed shall, subject first to the rights of the holders of ordinary shares be distributed amongst the holders of convertible shares, in proportion to the numbers of convertible shares held by them, of the nominal value of their convertible shares.
Restriction of rightsIf the Directors determine that a Specified Event as defined in the Articles of Association of SKG plc has occurred in relation to any share or shares, the Directors may serve a notice to such effect on the holder or holders thereof. Upon the expiry of fourteen days from the service of any such notice, for so long as such notice shall remain in force no holder or holders of the share or shares specified in such notice shall, in relation to such specified shares, be entitled to attend, speak or vote either personally, by representative or by proxy at any general meeting of the Company or at any separate general meeting of the class of shares concerned or to exercise any other right conferred by membership in relation to any such meeting.
The Directors shall, where the shares specified in such notice represent not less than 0.25 per cent of the class of shares concerned, be entitled: to withhold payment of any dividend or other amount payable (including shares issuable in lieu of dividend) in respect of the shares specified in such notice; and/or to refuse to register any transfer of the shares specified in such notice or any renunciation of any allotment of new shares or debentures made in respect thereof unless such transfer or renunciation is shown to the satisfaction of the Directors to be a bona fide transfer or renunciation to another beneficial owner unconnected with the holder or holders or any person appearing to have an interest in respect of which a notice has been served.
The instruments governing the Group’s indebtedness, including the senior credit facility and the indentures governing the senior and senior subordinated notes, contain financial and other covenants that restrict, among other things, the ability of the Group to pay dividends.
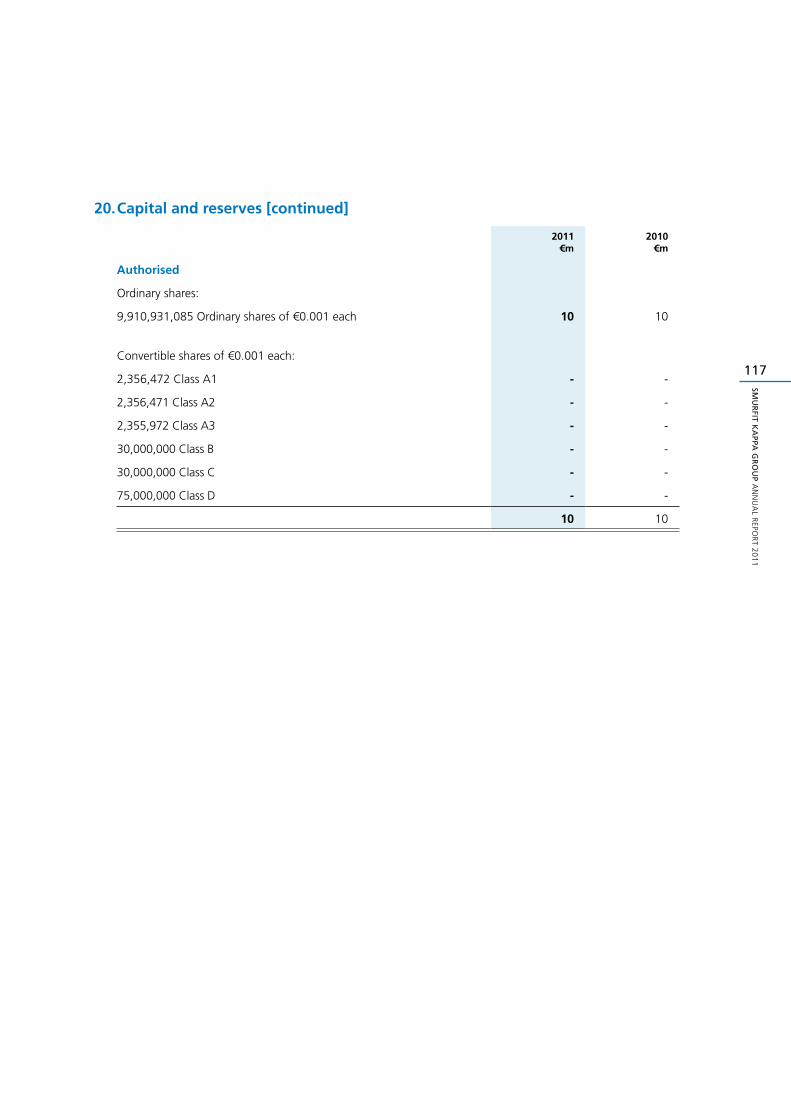
117
SMU
RFIT K
APPA
GR
OU
P A
NN
UA
L REPO
RT 2
01
1
20. Capital and reserves [continued]
2011€m
2010€m
Authorised
Ordinary shares:
9,910,931,085 Ordinary shares of €0.001 each 10 10
Convertible shares of €0.001 each:
2,356,472 Class A1 - -
2,356,471 Class A2 - -
2,355,972 Class A3 - -
30,000,000 Class B - -
30,000,000 Class C - -
75,000,000 Class D - -
10 10
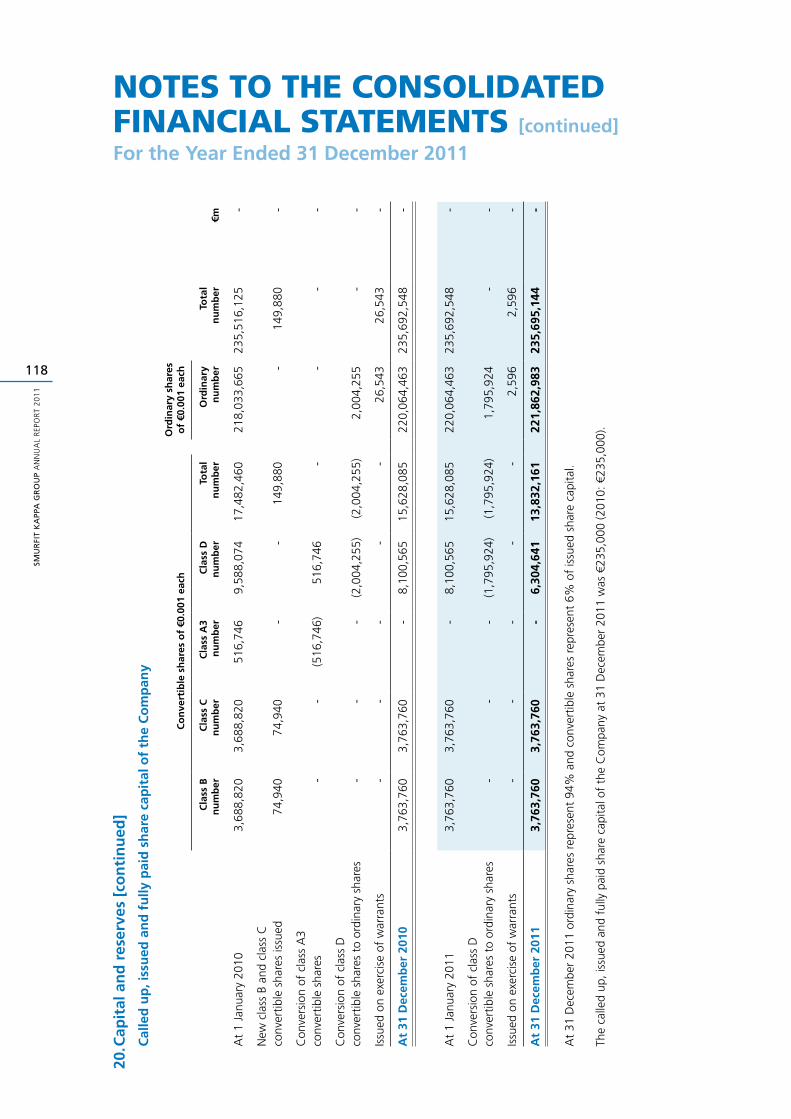
SMU
RFI
T K
APP
A G
RO
UP
AN
NU
AL
REP
OR
T 2
01
1
118
noteS to the ConSoliDateD finanCial StatementS [continued]
For the Year Ended 31 December 2011
20. C
apit
al a
nd
res
erve
s [c
on
tin
ued
]
Cal
led
up
, iss
ued
an
d f
ully
pai
d s
har
e ca
pit
al o
f th
e C
om
pan
y
Co
nve
rtib
le s
har
es o
f €0
.001
eac
hO
rdin
ary
shar
es
of
€0.0
01 e
ach
Cla
ss B
nu
mb
erC
lass
Cn
um
ber
Cla
ss A
3 n
um
ber
Cla
ss D
n
um
ber
Tota
l n
um
ber
Ord
inar
yn
um
ber
Tota
ln
um
ber
€m
At
1 Ja
nuar
y 20
103,
688,
820
3,68
8,82
051
6,74
69,
588,
074
17,4
82,4
6021
8,03
3,66
523
5,51
6,12
5-
New
cla
ss B
and
cla
ss C
conv
ertib
le s
hare
s is
sued
74,9
4074
,940
--
149,
880
-14
9,88
0-
Con
vers
ion
of c
lass
A3
conv
ertib
le s
hare
s-
-(5
16,7
46)
516,
746
--
--
Con
vers
ion
of c
lass
Dco
nver
tible
sha
res
to o
rdin
ary
shar
es-
--
(2,0
04,2
55)
(2,0
04,2
55)
2,00
4,25
5-
-
Issu
ed o
n ex
erci
se o
f w
arra
nts
--
--
-26
,543
26,5
43-
At
31 D
ecem
ber
201
03,
763,
760
3,76
3,76
0-
8,10
0,56
515
,628
,085
220,
064,
463
235,
692,
548
-
At
1 Ja
nuar
y 20
113,
763,
760
3,76
3,76
0-
8,10
0,56
515
,628
,085
220,
064,
463
235,
692,
548
-
Con
vers
ion
of c
lass
Dco
nver
tible
sha
res
to o
rdin
ary
shar
es-
--
(1,7
95,9
24)
(1,7
95,9
24)
1,79
5,92
4-
-
Issu
ed o
n ex
erci
se o
f w
arra
nts
--
--
-2,
596
2,59
6-
At
31 D
ecem
ber
201
13,
763,
760
3,76
3,76
0-
6,30
4,64
113
,832
,161
221,
862,
983
235,
695,
144
-
At
31 D
ecem
ber
2011
ord
inar
y sh
ares
rep
rese
nt 9
4% a
nd c
onve
rtib
le s
hare
s re
pres
ent
6% o
f is
sued
sha
re c
apita
l.
The
calle
d up
, iss
ued
and
fully
pai
d sh
are
capi
tal o
f th
e C
ompa
ny a
t 31
Dec
embe
r 20
11 w
as €
235,
000
(201
0: €
235,
000)
.
119
SMU
RFIT K
APPA
GR
OU
P A
NN
UA
L REPO
RT 2
01
1
20. Capital and reserves [continued]
Share premium
The share premium of €1,945 million relates to the share premium arising on share issues.
Reverse acquisition reserve
This reserve arose on the creation of a new parent of the Group which was accounted for as a reverse acquisition.
Cash flow hedging reserve
The cash flow hedging reserve comprises the effective portion of the cumulative net change in the fair value of cash flow hedging instruments (net of tax) related principally to floating rate debt which has been swapped into fixed interest using interest rate swaps.
Foreign currency translation reserve
The foreign currency translation reserve comprises all foreign currency translation adjustments arising from the translation of the Group’s net investment in foreign operations including the translation of the profits of such operations from the average exchange rate for the year to the exchange rate at the balance sheet date, as well as from the translation of liabilities that hedge those net assets.
Share-based payment reserve
This reserve comprises amounts expensed in the Group Income Statement in connection with awards made under the equity settled share-based payment plans.
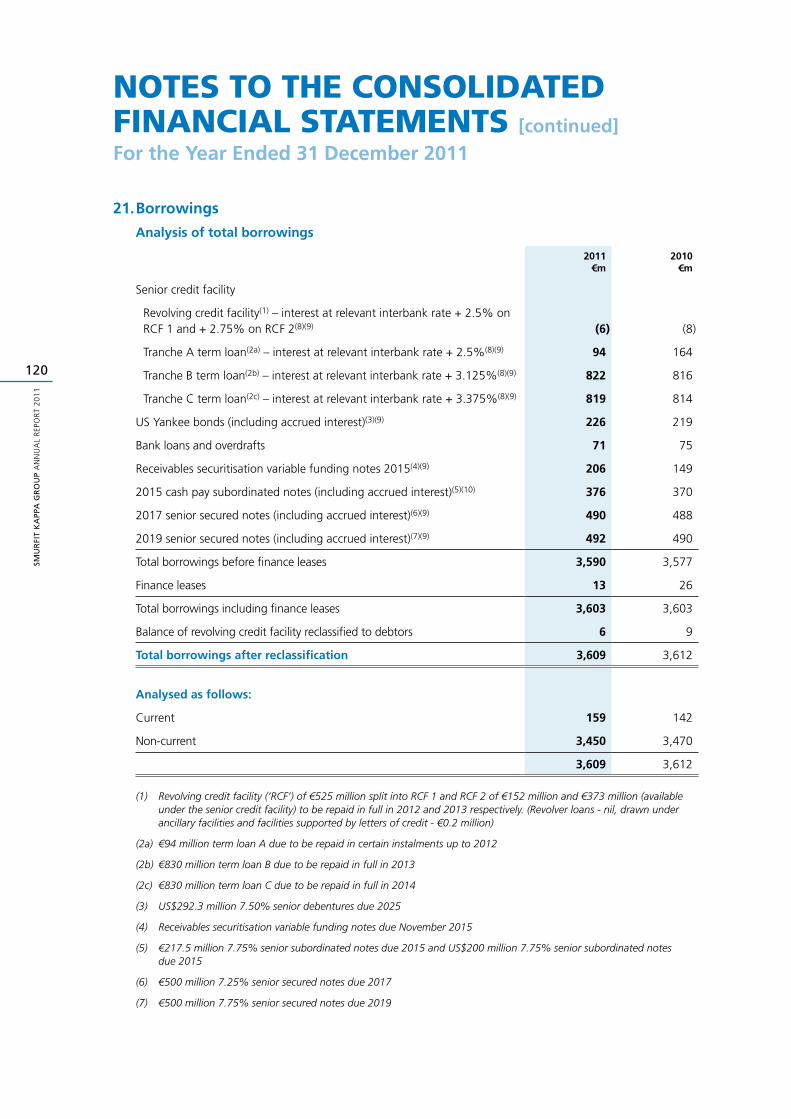
SMU
RFI
T K
APP
A G
RO
UP
AN
NU
AL
REP
OR
T 2
01
1
120
noteS to the ConSoliDateD finanCial StatementS [continued]
For the Year Ended 31 December 2011
21. Borrowings
Analysis of total borrowings
2011€m
2010€m
Senior credit facility
Revolving credit facility(1) – interest at relevant interbank rate + 2.5% on RCF 1 and + 2.75% on RCF 2(8)(9) (6) (8)
Tranche A term loan(2a) – interest at relevant interbank rate + 2.5%(8)(9) 94 164
Tranche B term loan(2b) – interest at relevant interbank rate + 3.125%(8)(9) 822 816
Tranche C term loan(2c) – interest at relevant interbank rate + 3.375%(8)(9) 819 814
US Yankee bonds (including accrued interest)(3)(9) 226 219
Bank loans and overdrafts 71 75
Receivables securitisation variable funding notes 2015(4)(9) 206 149
2015 cash pay subordinated notes (including accrued interest)(5)(10) 376 370
2017 senior secured notes (including accrued interest)(6)(9) 490 488
2019 senior secured notes (including accrued interest)(7)(9) 492 490
Total borrowings before finance leases 3,590 3,577
Finance leases 13 26
Total borrowings including finance leases 3,603 3,603
Balance of revolving credit facility reclassified to debtors 6 9
Total borrowings after reclassification 3,609 3,612
Analysed as follows:
Current 159 142
Non-current 3,450 3,470
3,609 3,612
(1) Revolving credit facility (‘RCF’) of €525 million split into RCF 1 and RCF 2 of €152 million and €373 million (available under the senior credit facility) to be repaid in full in 2012 and 2013 respectively. (Revolver loans - nil, drawn under ancillary facilities and facilities supported by letters of credit - €0.2 million)
(2a) €94 million term loan A due to be repaid in certain instalments up to 2012
(2b) €830 million term loan B due to be repaid in full in 2013
(2c) €830 million term loan C due to be repaid in full in 2014
(3) US$292.3 million 7.50% senior debentures due 2025
(4) Receivables securitisation variable funding notes due November 2015
(5) €217.5 million 7.75% senior subordinated notes due 2015 and US$200 million 7.75% senior subordinated notes due 2015
(6) €500 million 7.25% senior secured notes due 2017
(7) €500 million 7.75% senior secured notes due 2019
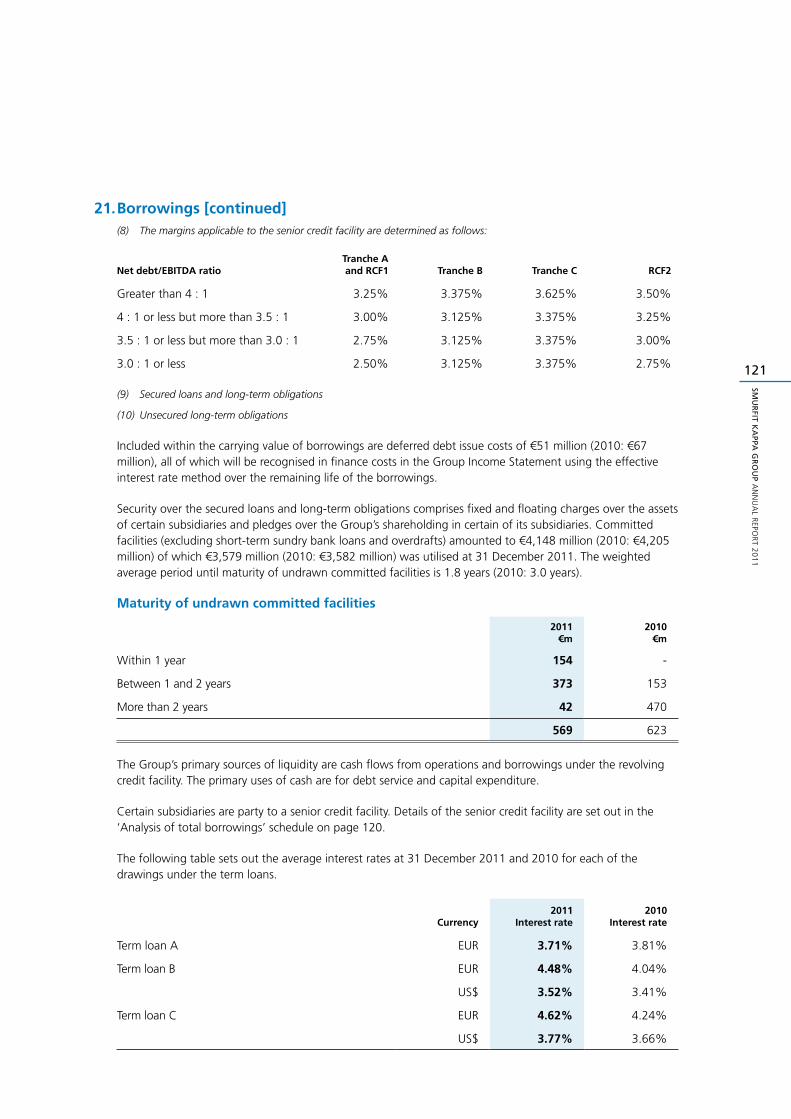
121
SMU
RFIT K
APPA
GR
OU
P A
NN
UA
L REPO
RT 2
01
1
21. Borrowings [continued](8) The margins applicable to the senior credit facility are determined as follows:
Net debt/EBITDA ratioTranche A and RCF1 Tranche B Tranche C RCF2
Greater than 4 : 1 3.25% 3.375% 3.625% 3.50%
4 : 1 or less but more than 3.5 : 1 3.00% 3.125% 3.375% 3.25%
3.5 : 1 or less but more than 3.0 : 1 2.75% 3.125% 3.375% 3.00%
3.0 : 1 or less 2.50% 3.125% 3.375% 2.75%
(9) Secured loans and long-term obligations
(10) Unsecured long-term obligations
Included within the carrying value of borrowings are deferred debt issue costs of €51 million (2010: €67 million), all of which will be recognised in finance costs in the Group Income Statement using the effective interest rate method over the remaining life of the borrowings.
Security over the secured loans and long-term obligations comprises fixed and floating charges over the assets of certain subsidiaries and pledges over the Group’s shareholding in certain of its subsidiaries. Committed facilities (excluding short-term sundry bank loans and overdrafts) amounted to €4,148 million (2010: €4,205 million) of which €3,579 million (2010: €3,582 million) was utilised at 31 December 2011. The weighted average period until maturity of undrawn committed facilities is 1.8 years (2010: 3.0 years).
Maturity of undrawn committed facilities
2011€m
2010€m
Within 1 year 154 -
Between 1 and 2 years 373 153
More than 2 years 42 470
569 623
The Group’s primary sources of liquidity are cash flows from operations and borrowings under the revolving credit facility. The primary uses of cash are for debt service and capital expenditure.
Certain subsidiaries are party to a senior credit facility. Details of the senior credit facility are set out in the ‘Analysis of total borrowings’ schedule on page 120.
The following table sets out the average interest rates at 31 December 2011 and 2010 for each of the drawings under the term loans.
Currency2011
Interest rate2010
Interest rate
Term loan A EUR 3.71% 3.81%
Term loan B EUR 4.48% 4.04%
US$ 3.52% 3.41%
Term loan C EUR 4.62% 4.24%
US$ 3.77% 3.66%
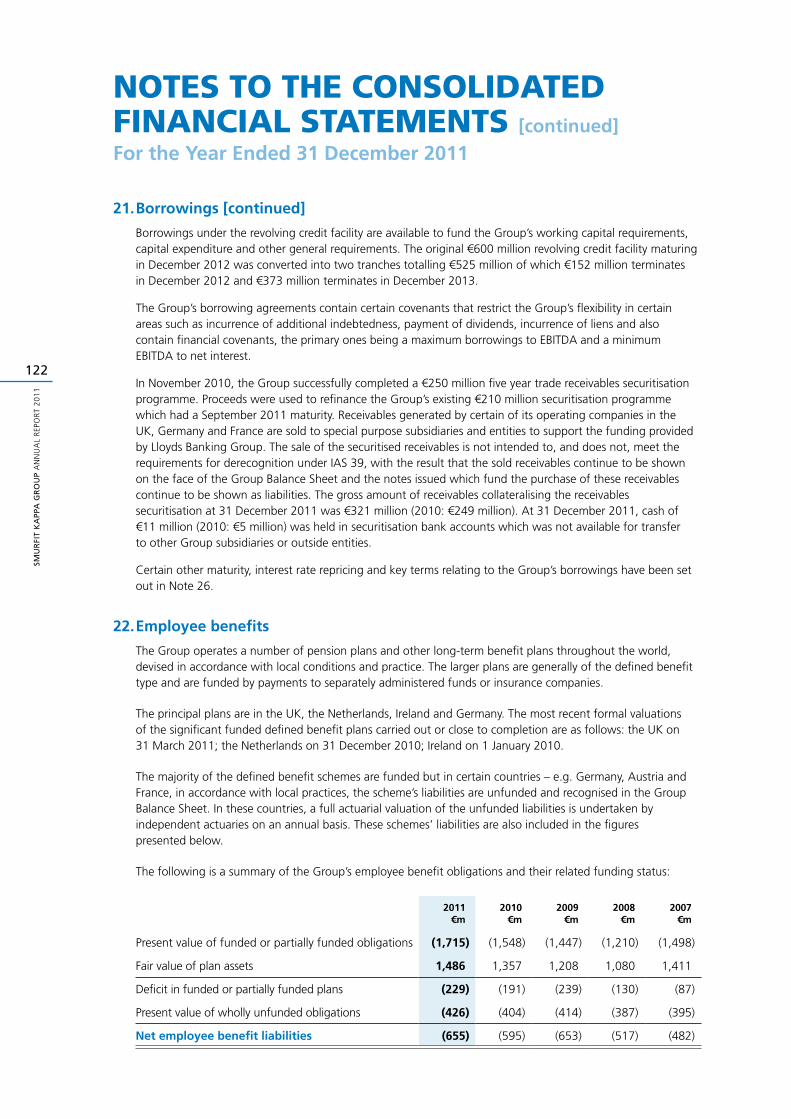
SMU
RFI
T K
APP
A G
RO
UP
AN
NU
AL
REP
OR
T 2
01
1
122
noteS to the ConSoliDateD finanCial StatementS [continued]
For the Year Ended 31 December 2011
21. Borrowings [continued]
Borrowings under the revolving credit facility are available to fund the Group’s working capital requirements, capital expenditure and other general requirements. The original €600 million revolving credit facility maturing in December 2012 was converted into two tranches totalling €525 million of which €152 million terminates in December 2012 and €373 million terminates in December 2013.
The Group’s borrowing agreements contain certain covenants that restrict the Group’s flexibility in certain areas such as incurrence of additional indebtedness, payment of dividends, incurrence of liens and also contain financial covenants, the primary ones being a maximum borrowings to EBITDA and a minimum EBITDA to net interest.
In November 2010, the Group successfully completed a €250 million five year trade receivables securitisation programme. Proceeds were used to refinance the Group’s existing €210 million securitisation programme which had a September 2011 maturity. Receivables generated by certain of its operating companies in the UK, Germany and France are sold to special purpose subsidiaries and entities to support the funding provided by Lloyds Banking Group. The sale of the securitised receivables is not intended to, and does not, meet the requirements for derecognition under IAS 39, with the result that the sold receivables continue to be shown on the face of the Group Balance Sheet and the notes issued which fund the purchase of these receivables continue to be shown as liabilities. The gross amount of receivables collateralising the receivables securitisation at 31 December 2011 was €321 million (2010: €249 million). At 31 December 2011, cash of €11 million (2010: €5 million) was held in securitisation bank accounts which was not available for transfer to other Group subsidiaries or outside entities.
Certain other maturity, interest rate repricing and key terms relating to the Group’s borrowings have been set out in Note 26.
22. Employee benefits
The Group operates a number of pension plans and other long-term benefit plans throughout the world, devised in accordance with local conditions and practice. The larger plans are generally of the defined benefit type and are funded by payments to separately administered funds or insurance companies.
The principal plans are in the UK, the Netherlands, Ireland and Germany. The most recent formal valuations of the significant funded defined benefit plans carried out or close to completion are as follows: the UK on 31 March 2011; the Netherlands on 31 December 2010; Ireland on 1 January 2010.
The majority of the defined benefit schemes are funded but in certain countries – e.g. Germany, Austria and France, in accordance with local practices, the scheme’s liabilities are unfunded and recognised in the Group Balance Sheet. In these countries, a full actuarial valuation of the unfunded liabilities is undertaken by independent actuaries on an annual basis. These schemes’ liabilities are also included in the figures presented below.
The following is a summary of the Group’s employee benefit obligations and their related funding status:
2011€m
2010€m
2009€m
2008€m
2007€m
Present value of funded or partially funded obligations (1,715) (1,548) (1,447) (1,210) (1,498)
Fair value of plan assets 1,486 1,357 1,208 1,080 1,411
Deficit in funded or partially funded plans (229) (191) (239) (130) (87)
Present value of wholly unfunded obligations (426) (404) (414) (387) (395)
Net employee benefit liabilities (655) (595) (653) (517) (482)
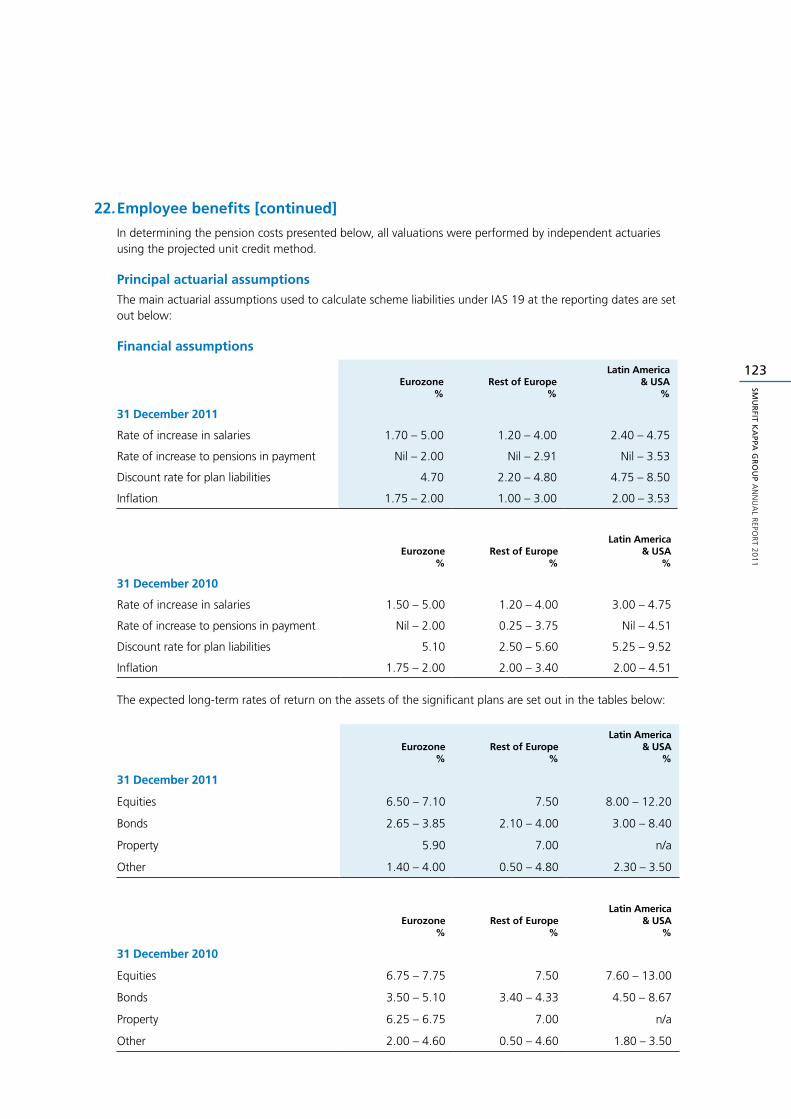
123
SMU
RFIT K
APPA
GR
OU
P A
NN
UA
L REPO
RT 2
01
1
22. Employee benefits [continued]
In determining the pension costs presented below, all valuations were performed by independent actuaries using the projected unit credit method.
Principal actuarial assumptions
The main actuarial assumptions used to calculate scheme liabilities under IAS 19 at the reporting dates are set out below:
Financial assumptions
Eurozone%
Rest of Europe%
Latin America & USA
%
31 December 2011
Rate of increase in salaries 1.70 – 5.00 1.20 – 4.00 2.40 – 4.75
Rate of increase to pensions in payment Nil – 2.00 Nil – 2.91 Nil – 3.53
Discount rate for plan liabilities 4.70 2.20 – 4.80 4.75 – 8.50
Inflation 1.75 – 2.00 1.00 – 3.00 2.00 – 3.53
Eurozone%
Rest of Europe%
Latin America & USA
%
31 December 2010
Rate of increase in salaries 1.50 – 5.00 1.20 – 4.00 3.00 – 4.75
Rate of increase to pensions in payment Nil – 2.00 0.25 – 3.75 Nil – 4.51
Discount rate for plan liabilities 5.10 2.50 – 5.60 5.25 – 9.52
Inflation 1.75 – 2.00 2.00 – 3.40 2.00 – 4.51
The expected long-term rates of return on the assets of the significant plans are set out in the tables below:
Eurozone%
Rest of Europe%
Latin America & USA
%
31 December 2011
Equities 6.50 – 7.10 7.50 8.00 – 12.20
Bonds 2.65 – 3.85 2.10 – 4.00 3.00 – 8.40
Property 5.90 7.00 n/a
Other 1.40 – 4.00 0.50 – 4.80 2.30 – 3.50
Eurozone%
Rest of Europe%
Latin America & USA
%
31 December 2010
Equities 6.75 – 7.75 7.50 7.60 – 13.00
Bonds 3.50 – 5.10 3.40 – 4.33 4.50 – 8.67
Property 6.25 – 6.75 7.00 n/a
Other 2.00 – 4.60 0.50 – 4.60 1.80 – 3.50
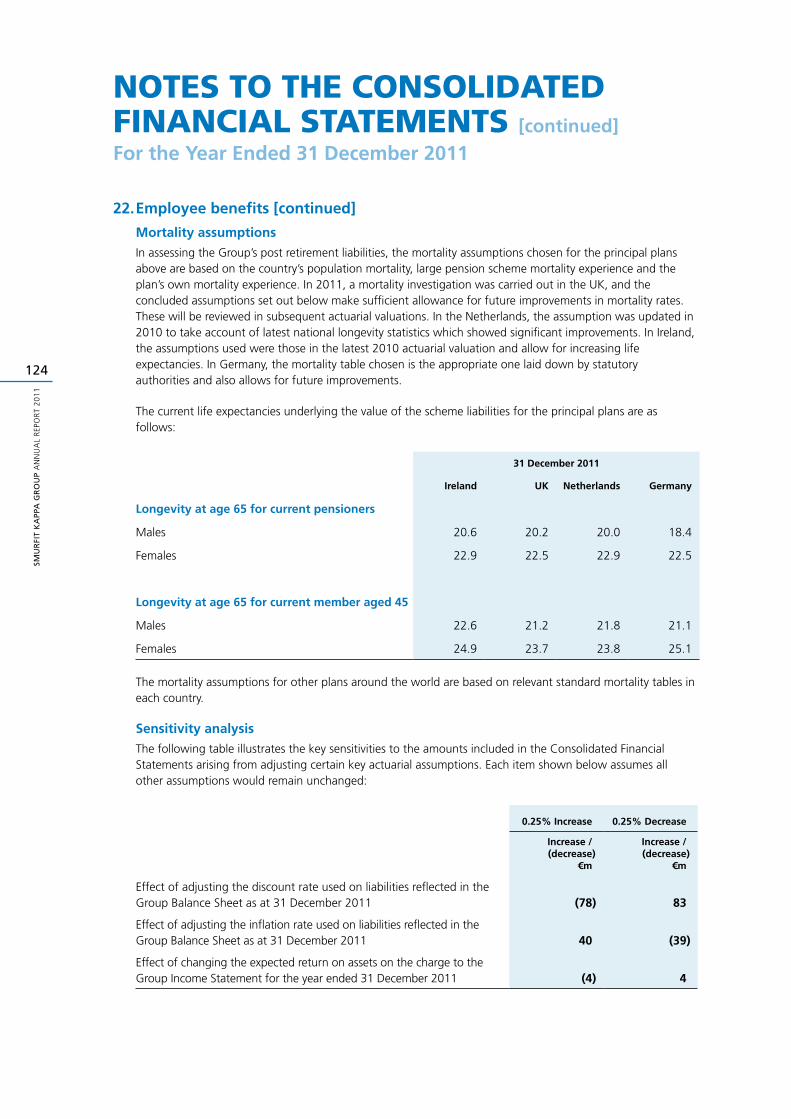
SMU
RFI
T K
APP
A G
RO
UP
AN
NU
AL
REP
OR
T 2
01
1
124
noteS to the ConSoliDateD finanCial StatementS [continued]
For the Year Ended 31 December 2011
22. Employee benefits [continued]
Mortality assumptions
In assessing the Group’s post retirement liabilities, the mortality assumptions chosen for the principal plans above are based on the country’s population mortality, large pension scheme mortality experience and the plan’s own mortality experience. In 2011, a mortality investigation was carried out in the UK, and the concluded assumptions set out below make sufficient allowance for future improvements in mortality rates. These will be reviewed in subsequent actuarial valuations. In the Netherlands, the assumption was updated in 2010 to take account of latest national longevity statistics which showed significant improvements. In Ireland, the assumptions used were those in the latest 2010 actuarial valuation and allow for increasing life expectancies. In Germany, the mortality table chosen is the appropriate one laid down by statutory authorities and also allows for future improvements.
The current life expectancies underlying the value of the scheme liabilities for the principal plans are as follows:
31 December 2011
Ireland UK Netherlands Germany
Longevity at age 65 for current pensioners
Males 20.6 20.2 20.0 18.4
Females 22.9 22.5 22.9 22.5
Longevity at age 65 for current member aged 45
Males 22.6 21.2 21.8 21.1
Females 24.9 23.7 23.8 25.1
The mortality assumptions for other plans around the world are based on relevant standard mortality tables in each country.
Sensitivity analysis
The following table illustrates the key sensitivities to the amounts included in the Consolidated Financial Statements arising from adjusting certain key actuarial assumptions. Each item shown below assumes all other assumptions would remain unchanged:
0.25% Increase 0.25% Decrease
Increase /(decrease)
€m
Increase /(decrease)
€m
Effect of adjusting the discount rate used on liabilities reflected in the Group Balance Sheet as at 31 December 2011 (78) 83
Effect of adjusting the inflation rate used on liabilities reflected in the Group Balance Sheet as at 31 December 2011 40 (39)
Effect of changing the expected return on assets on the charge to the Group Income Statement for the year ended 31 December 2011 (4) 4
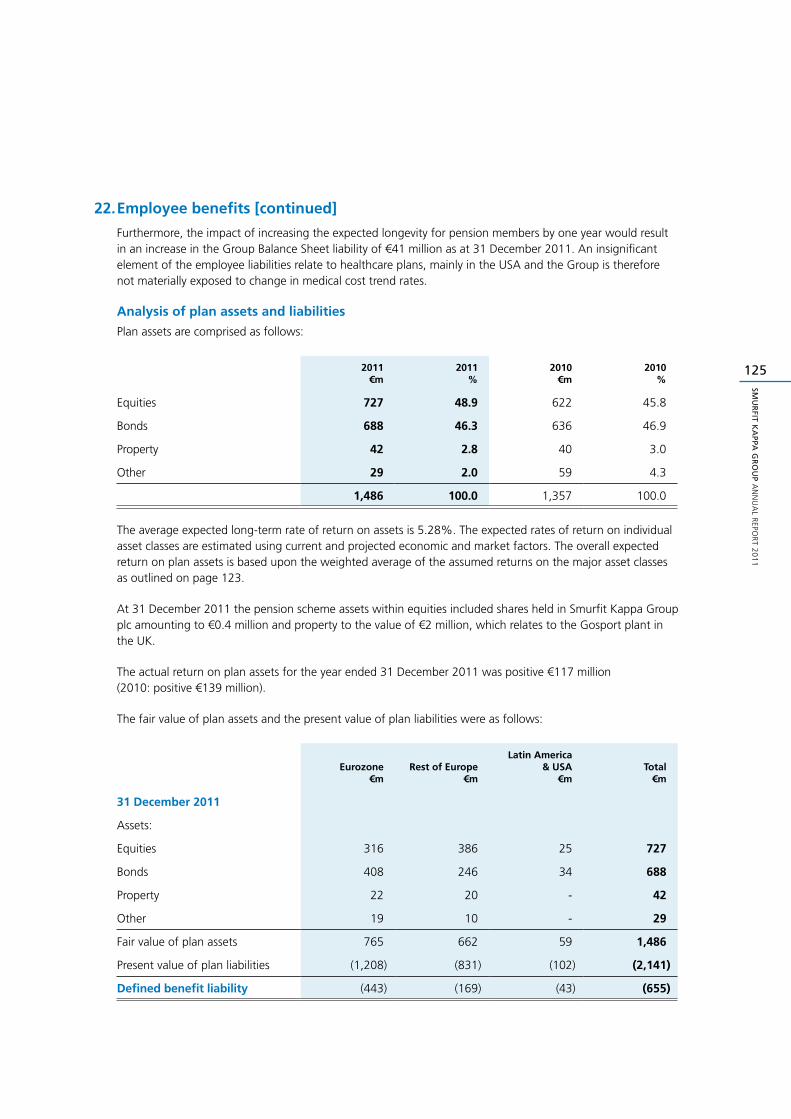
125
SMU
RFIT K
APPA
GR
OU
P A
NN
UA
L REPO
RT 2
01
1
22. Employee benefits [continued]
Furthermore, the impact of increasing the expected longevity for pension members by one year would result in an increase in the Group Balance Sheet liability of €41 million as at 31 December 2011. An insignificant element of the employee liabilities relate to healthcare plans, mainly in the USA and the Group is therefore not materially exposed to change in medical cost trend rates.
Analysis of plan assets and liabilities
Plan assets are comprised as follows:
2011€m
2011%
2010€m
2010%
Equities 727 48.9 622 45.8
Bonds 688 46.3 636 46.9
Property 42 2.8 40 3.0
Other 29 2.0 59 4.3
1,486 100.0 1,357 100.0
The average expected long-term rate of return on assets is 5.28%. The expected rates of return on individual asset classes are estimated using current and projected economic and market factors. The overall expected return on plan assets is based upon the weighted average of the assumed returns on the major asset classes as outlined on page 123.
At 31 December 2011 the pension scheme assets within equities included shares held in Smurfit Kappa Group plc amounting to €0.4 million and property to the value of €2 million, which relates to the Gosport plant in the UK.
The actual return on plan assets for the year ended 31 December 2011 was positive €117 million (2010: positive €139 million).
The fair value of plan assets and the present value of plan liabilities were as follows:
Eurozone€m
Rest of Europe€m
Latin America & USA
€mTotal
€m
31 December 2011
Assets:
Equities 316 386 25 727
Bonds 408 246 34 688
Property 22 20 - 42
Other 19 10 - 29
Fair value of plan assets 765 662 59 1,486
Present value of plan liabilities (1,208) (831) (102) (2,141)
Defined benefit liability (443) (169) (43) (655)
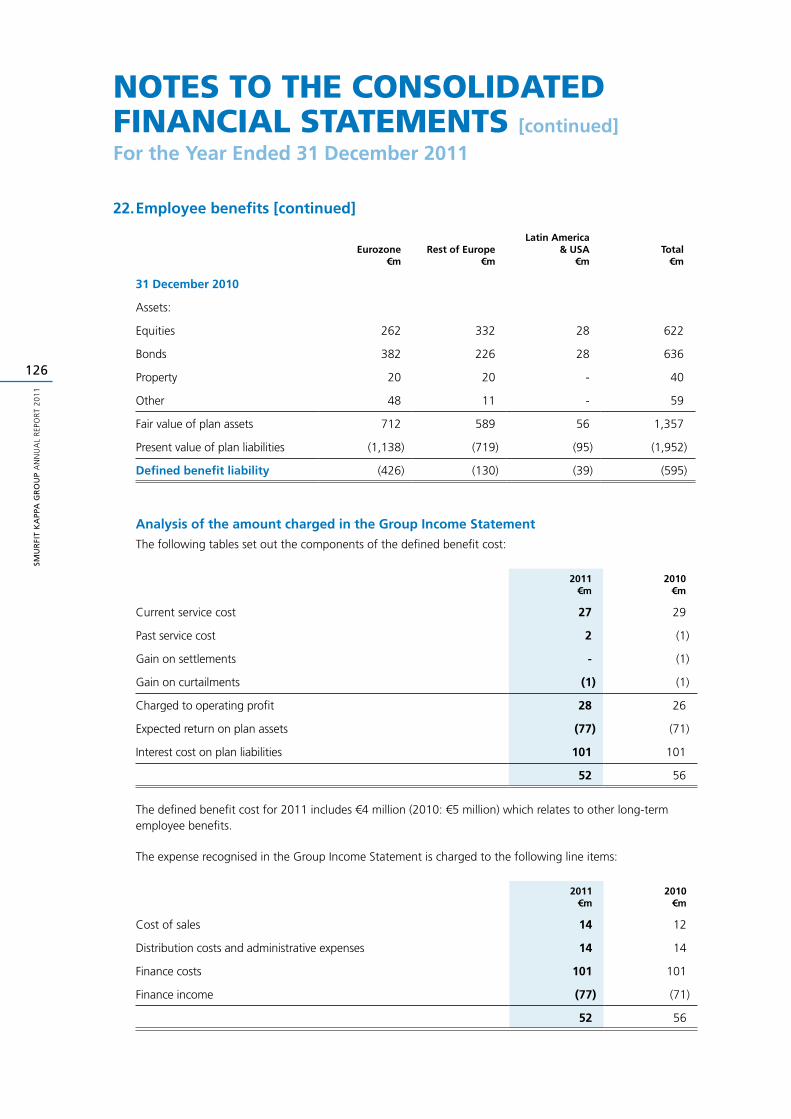
SMU
RFI
T K
APP
A G
RO
UP
AN
NU
AL
REP
OR
T 2
01
1
126
noteS to the ConSoliDateD finanCial StatementS [continued]
For the Year Ended 31 December 2011
22. Employee benefits [continued]
Eurozone€m
Rest of Europe€m
Latin America & USA
€mTotal
€m
31 December 2010
Assets:
Equities 262 332 28 622
Bonds 382 226 28 636
Property 20 20 - 40
Other 48 11 - 59
Fair value of plan assets 712 589 56 1,357
Present value of plan liabilities (1,138) (719) (95) (1,952)
Defined benefit liability (426) (130) (39) (595)
Analysis of the amount charged in the Group Income Statement
The following tables set out the components of the defined benefit cost:
2011€m
2010€m
Current service cost 27 29
Past service cost 2 (1)
Gain on settlements - (1)
Gain on curtailments (1) (1)
Charged to operating profit 28 26
Expected return on plan assets (77) (71)
Interest cost on plan liabilities 101 101
52 56
The defined benefit cost for 2011 includes €4 million (2010: €5 million) which relates to other long-term employee benefits.
The expense recognised in the Group Income Statement is charged to the following line items:
2011€m
2010€m
Cost of sales 14 12
Distribution costs and administrative expenses 14 14
Finance costs 101 101
Finance income (77) (71)
52 56
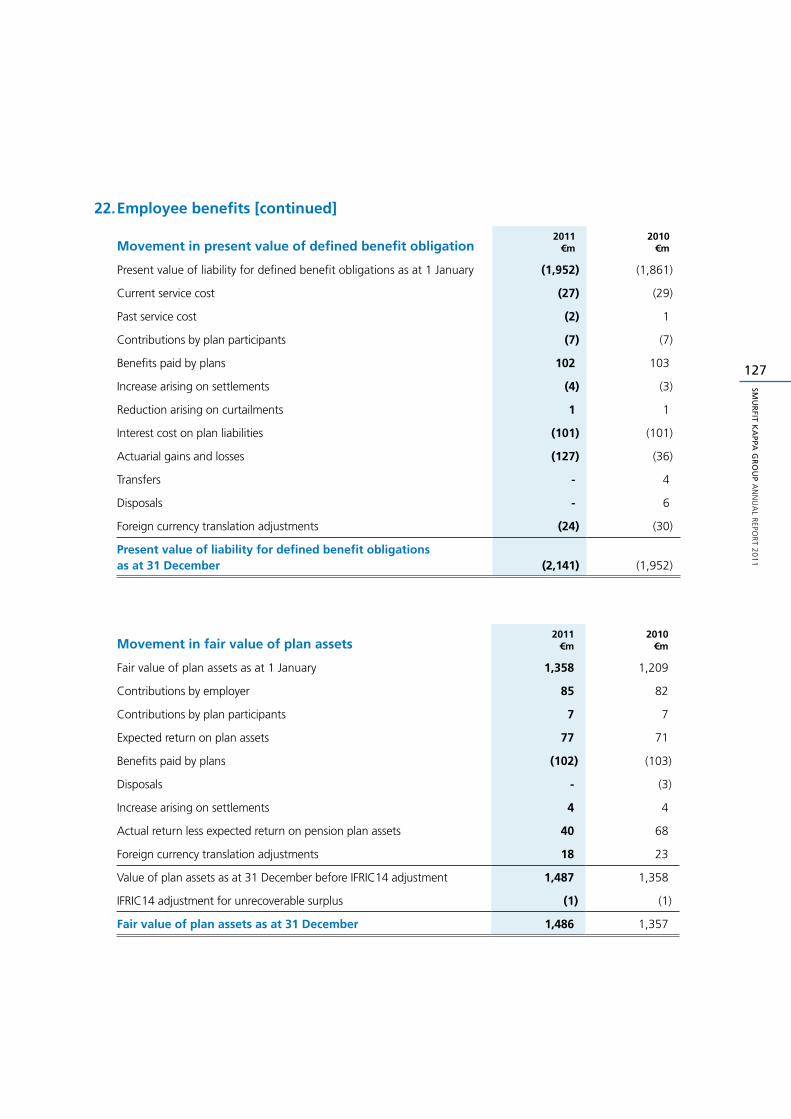
127
SMU
RFIT K
APPA
GR
OU
P A
NN
UA
L REPO
RT 2
01
1
22. Employee benefits [continued]
Movement in present value of defined benefit obligation2011
€m2010
€m
Present value of liability for defined benefit obligations as at 1 January (1,952) (1,861)
Current service cost (27) (29)
Past service cost (2) 1
Contributions by plan participants (7) (7)
Benefits paid by plans 102 103
Increase arising on settlements (4) (3)
Reduction arising on curtailments 1 1
Interest cost on plan liabilities (101) (101)
Actuarial gains and losses (127) (36)
Transfers - 4
Disposals - 6
Foreign currency translation adjustments (24) (30)
Present value of liability for defined benefit obligations as at 31 December (2,141) (1,952)
Movement in fair value of plan assets2011
€m2010
€m
Fair value of plan assets as at 1 January 1,358 1,209
Contributions by employer 85 82
Contributions by plan participants 7 7
Expected return on plan assets 77 71
Benefits paid by plans (102) (103)
Disposals - (3)
Increase arising on settlements 4 4
Actual return less expected return on pension plan assets 40 68
Foreign currency translation adjustments 18 23
Value of plan assets as at 31 December before IFRIC14 adjustment 1,487 1,358
IFRIC14 adjustment for unrecoverable surplus (1) (1)
Fair value of plan assets as at 31 December 1,486 1,357
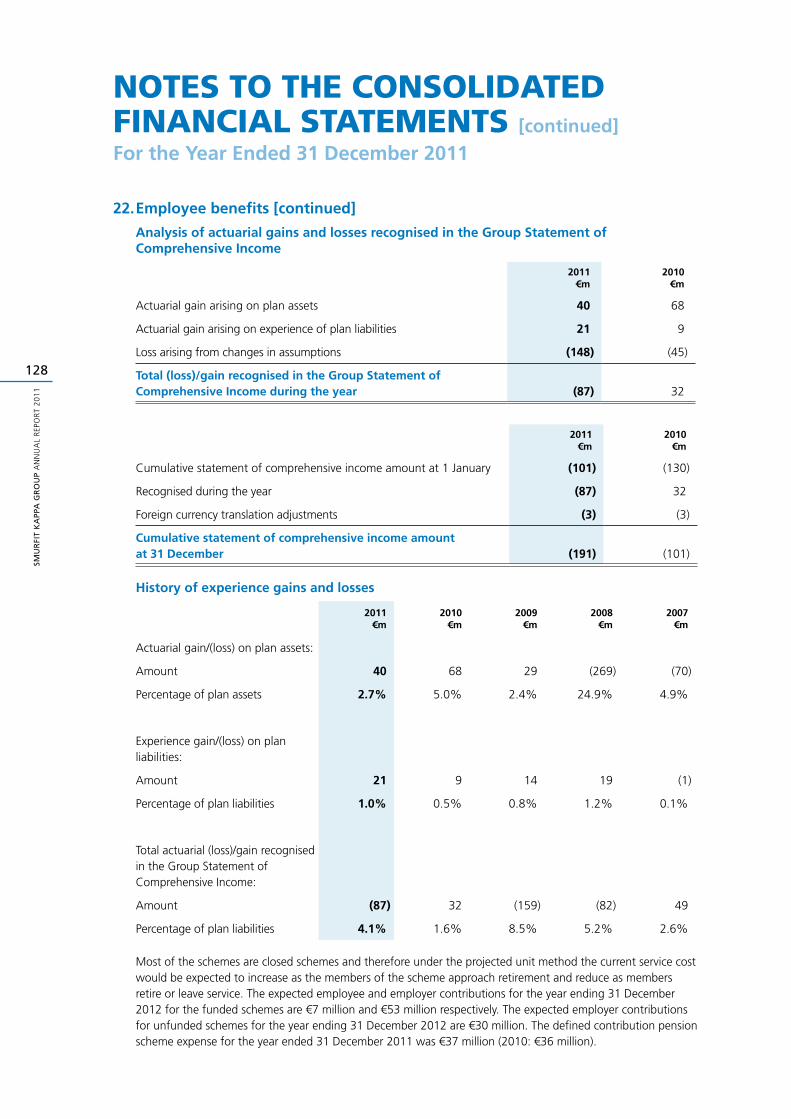
SMU
RFI
T K
APP
A G
RO
UP
AN
NU
AL
REP
OR
T 2
01
1
128
noteS to the ConSoliDateD finanCial StatementS [continued]
For the Year Ended 31 December 2011
22. Employee benefits [continued]
Analysis of actuarial gains and losses recognised in the Group Statement of Comprehensive Income
2011€m
2010€m
Actuarial gain arising on plan assets 40 68
Actuarial gain arising on experience of plan liabilities 21 9
Loss arising from changes in assumptions (148) (45)
Total (loss)/gain recognised in the Group Statement of Comprehensive Income during the year (87) 32
2011€m
2010€m
Cumulative statement of comprehensive income amount at 1 January (101) (130)
Recognised during the year (87) 32
Foreign currency translation adjustments (3) (3)
Cumulative statement of comprehensive income amount at 31 December (191) (101)
History of experience gains and losses
2011€m
2010€m
2009€m
2008€m
2007€m
Actuarial gain/(loss) on plan assets:
Amount 40 68 29 (269) (70)
Percentage of plan assets 2.7% 5.0% 2.4% 24.9% 4.9%
Experience gain/(loss) on plan liabilities:
Amount 21 9 14 19 (1)
Percentage of plan liabilities 1.0% 0.5% 0.8% 1.2% 0.1%
Total actuarial (loss)/gain recognised in the Group Statement of Comprehensive Income:
Amount (87) 32 (159) (82) 49
Percentage of plan liabilities 4.1% 1.6% 8.5% 5.2% 2.6%
Most of the schemes are closed schemes and therefore under the projected unit method the current service cost would be expected to increase as the members of the scheme approach retirement and reduce as members retire or leave service. The expected employee and employer contributions for the year ending 31 December 2012 for the funded schemes are €7 million and €53 million respectively. The expected employer contributions for unfunded schemes for the year ending 31 December 2012 are €30 million. The defined contribution pension scheme expense for the year ended 31 December 2011 was €37 million (2010: €36 million).
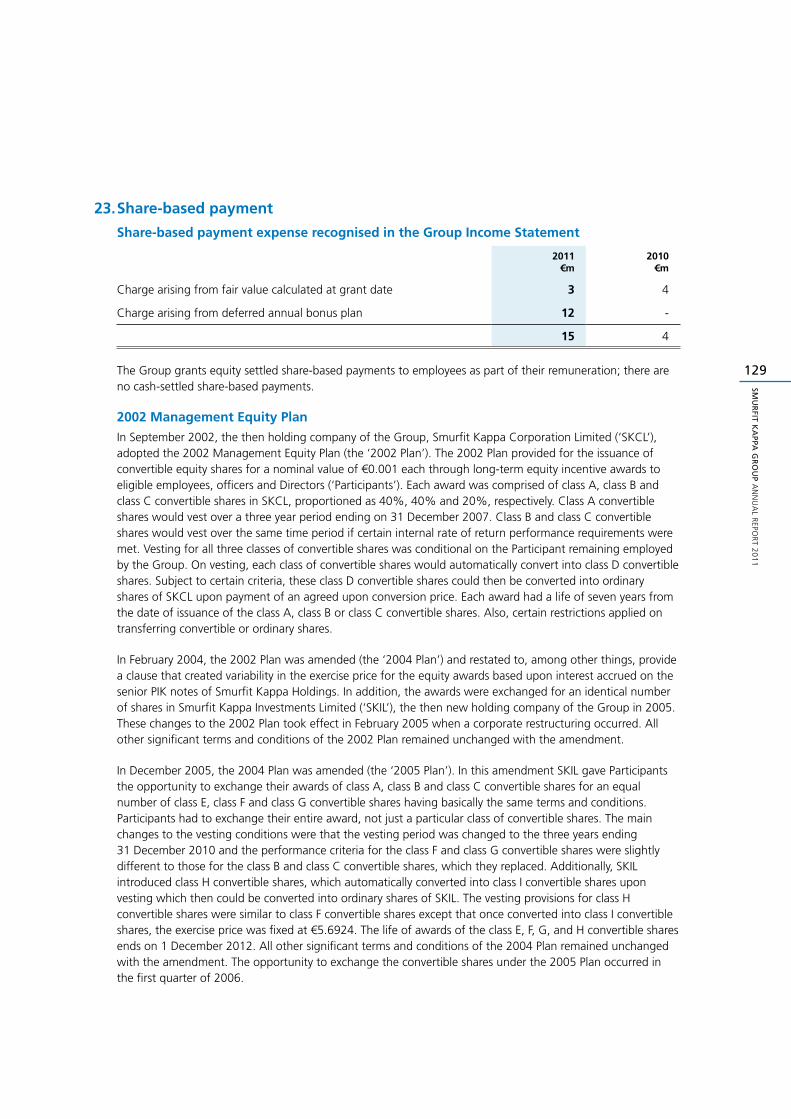
129
SMU
RFIT K
APPA
GR
OU
P A
NN
UA
L REPO
RT 2
01
1
23. Share-based payment
Share-based payment expense recognised in the Group Income Statement
2011€m
2010€m
Charge arising from fair value calculated at grant date 3 4
Charge arising from deferred annual bonus plan 12 -
15 4
The Group grants equity settled share-based payments to employees as part of their remuneration; there are no cash-settled share-based payments.
2002 Management Equity Plan
In September 2002, the then holding company of the Group, Smurfit Kappa Corporation Limited (‘SKCL’), adopted the 2002 Management Equity Plan (the ‘2002 Plan’). The 2002 Plan provided for the issuance of convertible equity shares for a nominal value of €0.001 each through long-term equity incentive awards to eligible employees, officers and Directors (‘Participants’). Each award was comprised of class A, class B and class C convertible shares in SKCL, proportioned as 40%, 40% and 20%, respectively. Class A convertible shares would vest over a three year period ending on 31 December 2007. Class B and class C convertible shares would vest over the same time period if certain internal rate of return performance requirements were met. Vesting for all three classes of convertible shares was conditional on the Participant remaining employed by the Group. On vesting, each class of convertible shares would automatically convert into class D convertible shares. Subject to certain criteria, these class D convertible shares could then be converted into ordinary shares of SKCL upon payment of an agreed upon conversion price. Each award had a life of seven years from the date of issuance of the class A, class B or class C convertible shares. Also, certain restrictions applied on transferring convertible or ordinary shares.
In February 2004, the 2002 Plan was amended (the ‘2004 Plan’) and restated to, among other things, provide a clause that created variability in the exercise price for the equity awards based upon interest accrued on the senior PIK notes of Smurfit Kappa Holdings. In addition, the awards were exchanged for an identical number of shares in Smurfit Kappa Investments Limited (‘SKIL’), the then new holding company of the Group in 2005. These changes to the 2002 Plan took effect in February 2005 when a corporate restructuring occurred. All other significant terms and conditions of the 2002 Plan remained unchanged with the amendment.
In December 2005, the 2004 Plan was amended (the ‘2005 Plan’). In this amendment SKIL gave Participants the opportunity to exchange their awards of class A, class B and class C convertible shares for an equal number of class E, class F and class G convertible shares having basically the same terms and conditions. Participants had to exchange their entire award, not just a particular class of convertible shares. The main changes to the vesting conditions were that the vesting period was changed to the three years ending 31 December 2010 and the performance criteria for the class F and class G convertible shares were slightly different to those for the class B and class C convertible shares, which they replaced. Additionally, SKIL introduced class H convertible shares, which automatically converted into class I convertible shares upon vesting which then could be converted into ordinary shares of SKIL. The vesting provisions for class H convertible shares were similar to class F convertible shares except that once converted into class I convertible shares, the exercise price was fixed at €5.6924. The life of awards of the class E, F, G, and H convertible shares ends on 1 December 2012. All other significant terms and conditions of the 2004 Plan remained unchanged with the amendment. The opportunity to exchange the convertible shares under the 2005 Plan occurred in the first quarter of 2006.
SMU
RFI
T K
APP
A G
RO
UP
AN
NU
AL
REP
OR
T 2
01
1
130
noteS to the ConSoliDateD finanCial StatementS [continued]
For the Year Ended 31 December 2011
23. Share-based payment [continued]
Modification in 2007In February 2007, the awards were exchanged for an identical number of shares in SKG plc, the new holding company of the Group. In March 2007, prior to the IPO of SKG plc, the 2005 Plan was amended (the ‘2007 Plan’), whereby, upon the IPO taking effect, all of the B, C, F, G and H convertible shares that were not converted to D or I convertible shares would be re-designated as A1, A2 and A3 convertible shares (as to one-third of each aggregate holding in respect of each class). The A1, A2 and A3 convertible shares vested on the first, second and third anniversaries respectively of the IPO. The D convertible shares resulting from these conversions are convertible on a one-to-one basis into ordinary shares, at the instance of the holder, upon the payment by the holder of the agreed conversion price. The life of the D convertible shares arising from the vesting of these new classes of convertible share ends on 20 March 2014.
Acceleration in 2007Upon the IPO becoming effective, all of the class A, E, F and H convertible shares and 80% of the class B convertible shares vested and were converted into D convertible shares. The class C, class G and 20% of the class B convertible shares did not vest and were re-designated as A1, A2 and A3 convertible shares as explained above.
2007 Share Incentive Plan
In March 2007, SKG plc adopted the 2007 Share Incentive Plan (the ‘2007 SIP’). The 2007 SIP was amended in May 2009. Incentive awards under the 2007 SIP are in the form of new class B and new class C convertible shares issued in equal proportions to Participants at a nominal value of €0.001 per share. On satisfaction of specified performance criteria the new class B and new class C convertible shares will automatically convert on a one-to-one basis into D convertible shares. The D convertible shares may be converted by the holder into ordinary shares upon payment of the agreed conversion price. The conversion price for each D convertible share is the average market value of an ordinary share for the three dealing days immediately prior to the date that the Participant was invited to subscribe less the nominal subscription price. Each award has a life of ten years from the date of issuance of the new class B and new class C convertible shares. The performance period for the new class B and new class C convertible shares is three financial years.
The performance conditions for the new class B and new class C convertible shares awarded under the 2007 SIP prior to 2009 are as follows. The new class B convertible shares automatically convert into D convertible shares if the growth in the Company’s earnings per share over the performance period is a percentage equal to at least five per cent per annum plus the annual percentage increase in the Consumer Price Index of Ireland, compounded. The new class C convertible shares are subject to that same performance condition. In addition, the new class C convertible shares are subject to a performance condition based on the Company’s total shareholder return over the three year period relative to the total shareholder return of a peer group of companies (‘TSR condition’). Under that condition, 30% of the new class C convertible shares convert into D convertible shares if the Company’s total shareholder return is at the median performance level and 100% convert if the Company’s total shareholder return is at or greater than the upper quartile of the peer group. A sliding scale applies for performance between the median and upper quartiles.
For new class B and new class C convertible shares awarded from 2009, the new class B and new class C convertible shares will convert into D convertible shares if the TSR condition is satisfied. However, notwithstanding that the TSR condition applicable to any such award may have been satisfied, the Compensation Committee retains an overriding discretion to disallow the vesting of the award, in full or in part, if, in its opinion the Company’s underlying financial performance or total shareholder return (or both) has been unsatisfactory during the performance period.
The Compensation Committee determined the performance conditions for awards granted under the 2007 SIP to date after consultation with the Irish Association of Investment Managers.
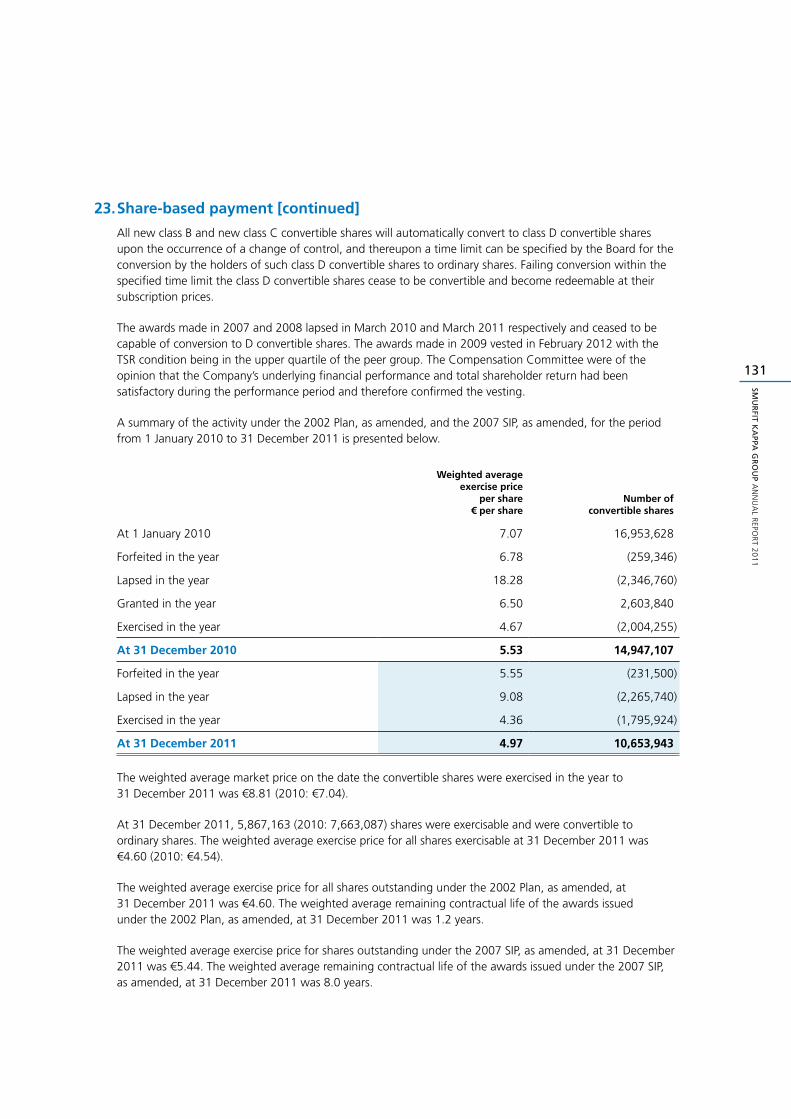
131
SMU
RFIT K
APPA
GR
OU
P A
NN
UA
L REPO
RT 2
01
1
23. Share-based payment [continued]
All new class B and new class C convertible shares will automatically convert to class D convertible shares upon the occurrence of a change of control, and thereupon a time limit can be specified by the Board for the conversion by the holders of such class D convertible shares to ordinary shares. Failing conversion within the specified time limit the class D convertible shares cease to be convertible and become redeemable at their subscription prices.
The awards made in 2007 and 2008 lapsed in March 2010 and March 2011 respectively and ceased to be capable of conversion to D convertible shares. The awards made in 2009 vested in February 2012 with the TSR condition being in the upper quartile of the peer group. The Compensation Committee were of the opinion that the Company’s underlying financial performance and total shareholder return had been satisfactory during the performance period and therefore confirmed the vesting.
A summary of the activity under the 2002 Plan, as amended, and the 2007 SIP, as amended, for the period from 1 January 2010 to 31 December 2011 is presented below.
Weighted average exercise price
per share€ per share
Number of convertible shares
At 1 January 2010 7.07 16,953,628
Forfeited in the year 6.78 (259,346)
Lapsed in the year 18.28 (2,346,760)
Granted in the year 6.50 2,603,840
Exercised in the year 4.67 (2,004,255)
At 31 December 2010 5.53 14,947,107
Forfeited in the year 5.55 (231,500)
Lapsed in the year 9.08 (2,265,740)
Exercised in the year 4.36 (1,795,924)
At 31 December 2011 4.97 10,653,943
The weighted average market price on the date the convertible shares were exercised in the year to 31 December 2011 was €8.81 (2010: €7.04).
At 31 December 2011, 5,867,163 (2010: 7,663,087) shares were exercisable and were convertible to ordinary shares. The weighted average exercise price for all shares exercisable at 31 December 2011 was €4.60 (2010: €4.54).
The weighted average exercise price for all shares outstanding under the 2002 Plan, as amended, at 31 December 2011 was €4.60. The weighted average remaining contractual life of the awards issued under the 2002 Plan, as amended, at 31 December 2011 was 1.2 years.
The weighted average exercise price for shares outstanding under the 2007 SIP, as amended, at 31 December 2011 was €5.44. The weighted average remaining contractual life of the awards issued under the 2007 SIP, as amended, at 31 December 2011 was 8.0 years.
SMU
RFI
T K
APP
A G
RO
UP
AN
NU
AL
REP
OR
T 2
01
1
132
noteS to the ConSoliDateD finanCial StatementS [continued]
For the Year Ended 31 December 2011
23. Share-based payment [continued]
A binomial lattice approach was used to calculate the value of convertible shares awarded prior to 2009, other than new class C, at each grant date and any subsequent modification dates. The Monte Carlo simulation approach was used to calculate the value of new class B convertible shares awarded from 2009 and all new class C convertible shares at grant date. The expected volatility rates applied were based upon the weighted average historical volatility of the Group’s business sector for a period equivalent to the expected life of the grants. The risk-free interest rates used were based upon euro-denominated government bonds with similar lives. The fair value of the convertible shares at the valuation dates was determined based upon the market price at that date.
The following is a summary of the key assumptions used in calculating the fair value of awards under the 2007 SIP, as amended:
Expectedvolatility
Vesting periods
(months)Risk-free
rateDividend
yieldFair
value
Granted 25 March 2010:
New B convertible59.67% -
45.85% 363.308% -
0.613% 2.97%€1.62 -
€1.86
New C convertible59.67% -
45.85% 363.308% -
0.613% 2.97%€1.62 -
€1.86
Deferred Annual Bonus Plan
In May 2011, the SKG plc Annual General Meeting approved the adoption of the SKG plc 2011 Deferred Annual Bonus Plan (‘DABP’) which replaces the existing long-term incentive plan, the 2007 SIP.
The size of award to each participant under the DABP is subject to the level of annual bonus earned by a participant in any year. The maximum annual bonus potential for participants in the DABP is 150% of salary. The actual bonus paid in any financial year is based on the achievement of clearly defined annual financial targets for some of the Group’s Key Performance Indicators (‘KPI’) being EBITDA, Return on Capital Employed (‘ROCE’) and Free Cash Flow (‘FCF’), together with targets for health and safety and a comparison of the Group’s financial performance compared to that of a peer group.
The structure of the new plan is that 50% of any annual bonus earned for a financial year will be deferred into SKG plc shares (‘Deferred Shares’) to be granted in the form of a Deferred Share Award. The Deferred Shares will vest (i.e. become unconditional) after a three year holding period based on continuity of employment or in certain circumstances, based on normal good leaver provisions.
At the same time as the grant of a Deferred Share Award, a Matching Share Award can be granted up to the level of the Deferred Share Award. Following a three year performance period, the Matching Shares may vest up to a maximum of three times the level of the Matching Share Award. Matching Share Awards will vest provided the Committee consider that the Company’s ROCE and Total Shareholder Return (‘TSR’) are competitive against the constituents of a comparator group of international paper and packaging companies over that performance period. The actual number of Matching Shares that will vest under the Matching Share Awards will be dependent on the achievement of the Company’s cumulative FCF(1) and ROCE targets measured over the same three year performance period on an inter-conditional basis.
The accounting for a deferred bonus payable in shares falls under IFRS 2 Share-based Payments. Under IFRS 2 when share awards are subject to vesting conditions the charge to be recognised in respect of such awards is recognised over the vesting period.
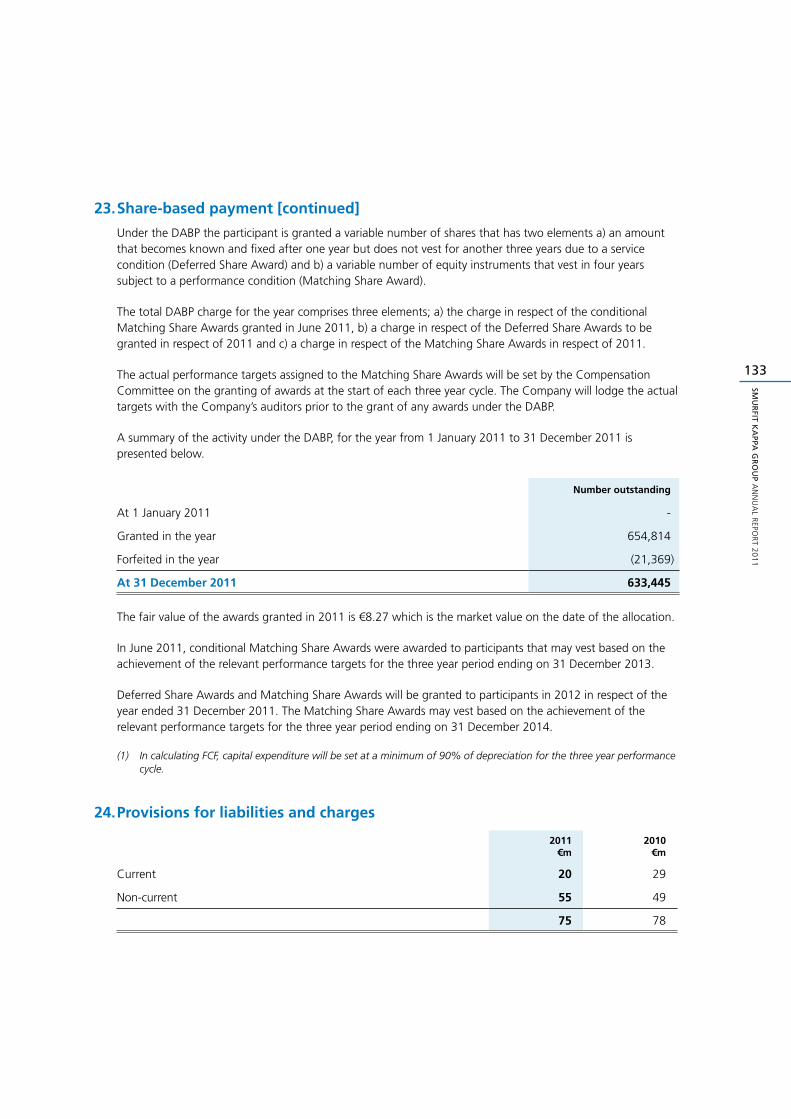
133
SMU
RFIT K
APPA
GR
OU
P A
NN
UA
L REPO
RT 2
01
1
23. Share-based payment [continued]
Under the DABP the participant is granted a variable number of shares that has two elements a) an amount that becomes known and fixed after one year but does not vest for another three years due to a service condition (Deferred Share Award) and b) a variable number of equity instruments that vest in four years subject to a performance condition (Matching Share Award).
The total DABP charge for the year comprises three elements; a) the charge in respect of the conditional Matching Share Awards granted in June 2011, b) a charge in respect of the Deferred Share Awards to be granted in respect of 2011 and c) a charge in respect of the Matching Share Awards in respect of 2011.
The actual performance targets assigned to the Matching Share Awards will be set by the Compensation Committee on the granting of awards at the start of each three year cycle. The Company will lodge the actual targets with the Company’s auditors prior to the grant of any awards under the DABP.
A summary of the activity under the DABP, for the year from 1 January 2011 to 31 December 2011 is presented below.
Number outstanding
At 1 January 2011 -
Granted in the year 654,814
Forfeited in the year (21,369)
At 31 December 2011 633,445
The fair value of the awards granted in 2011 is €8.27 which is the market value on the date of the allocation.
In June 2011, conditional Matching Share Awards were awarded to participants that may vest based on the achievement of the relevant performance targets for the three year period ending on 31 December 2013.
Deferred Share Awards and Matching Share Awards will be granted to participants in 2012 in respect of the year ended 31 December 2011. The Matching Share Awards may vest based on the achievement of the relevant performance targets for the three year period ending on 31 December 2014.
(1) In calculating FCF, capital expenditure will be set at a minimum of 90% of depreciation for the three year performance cycle.
24. Provisions for liabilities and charges
2011€m
2010€m
Current 20 29
Non-current 55 49
75 78
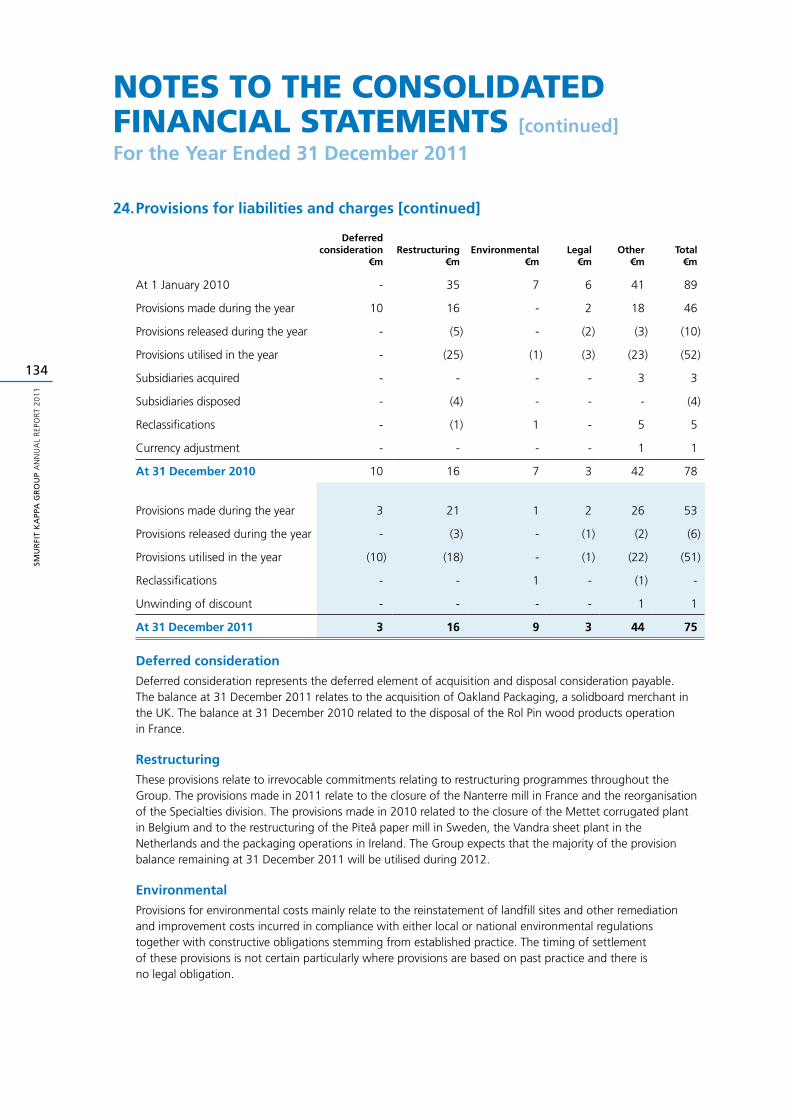
SMU
RFI
T K
APP
A G
RO
UP
AN
NU
AL
REP
OR
T 2
01
1
134
noteS to the ConSoliDateD finanCial StatementS [continued]
For the Year Ended 31 December 2011
24. Provisions for liabilities and charges [continued]
Deferredconsideration
€mRestructuring
€mEnvironmental
€mLegal
€mOther
€mTotal
€m
At 1 January 2010 - 35 7 6 41 89
Provisions made during the year 10 16 - 2 18 46
Provisions released during the year - (5) - (2) (3) (10)
Provisions utilised in the year - (25) (1) (3) (23) (52)
Subsidiaries acquired - - - - 3 3
Subsidiaries disposed - (4) - - - (4)
Reclassifications - (1) 1 - 5 5
Currency adjustment - - - - 1 1
At 31 December 2010 10 16 7 3 42 78
Provisions made during the year 3 21 1 2 26 53
Provisions released during the year - (3) - (1) (2) (6)
Provisions utilised in the year (10) (18) - (1) (22) (51)
Reclassifications - - 1 - (1) -
Unwinding of discount - - - - 1 1
At 31 December 2011 3 16 9 3 44 75
Deferred consideration
Deferred consideration represents the deferred element of acquisition and disposal consideration payable. The balance at 31 December 2011 relates to the acquisition of Oakland Packaging, a solidboard merchant in the UK. The balance at 31 December 2010 related to the disposal of the Rol Pin wood products operation in France.
Restructuring
These provisions relate to irrevocable commitments relating to restructuring programmes throughout the Group. The provisions made in 2011 relate to the closure of the Nanterre mill in France and the reorganisation of the Specialties division. The provisions made in 2010 related to the closure of the Mettet corrugated plant in Belgium and to the restructuring of the Piteå paper mill in Sweden, the Vandra sheet plant in the Netherlands and the packaging operations in Ireland. The Group expects that the majority of the provision balance remaining at 31 December 2011 will be utilised during 2012.
Environmental
Provisions for environmental costs mainly relate to the reinstatement of landfill sites and other remediation and improvement costs incurred in compliance with either local or national environmental regulations together with constructive obligations stemming from established practice. The timing of settlement of these provisions is not certain particularly where provisions are based on past practice and there is no legal obligation.
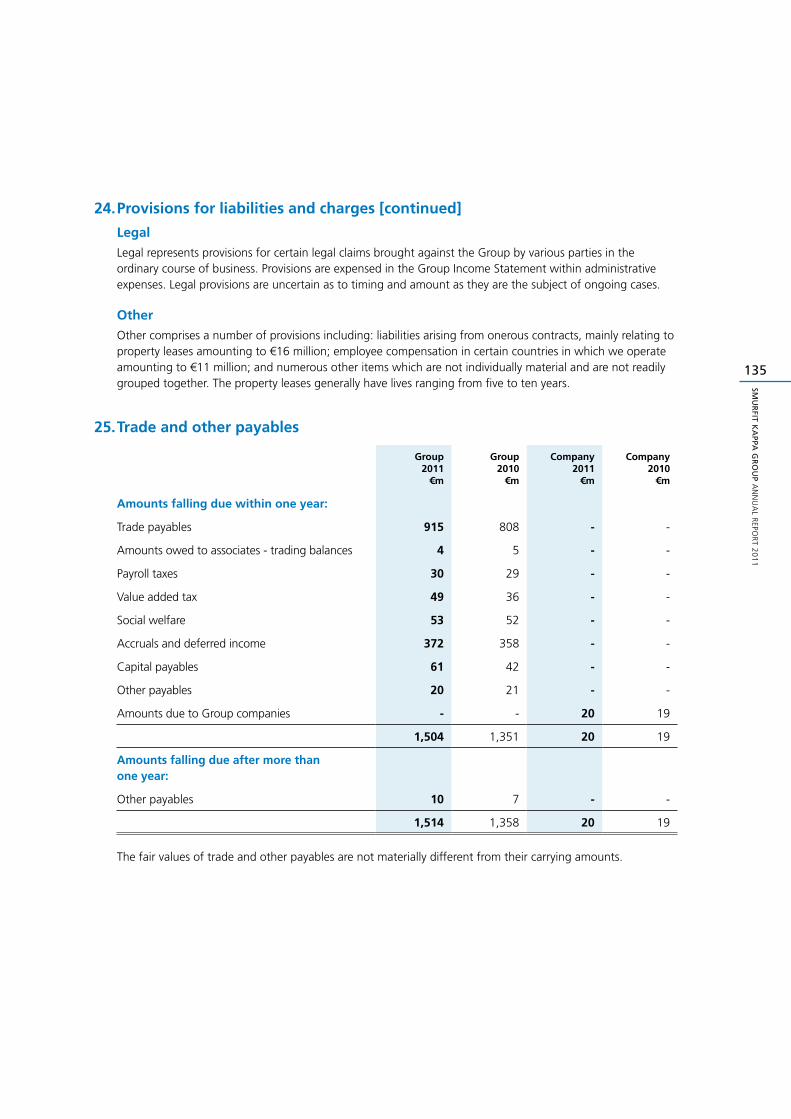
135
SMU
RFIT K
APPA
GR
OU
P A
NN
UA
L REPO
RT 2
01
1
24. Provisions for liabilities and charges [continued]
Legal
Legal represents provisions for certain legal claims brought against the Group by various parties in the ordinary course of business. Provisions are expensed in the Group Income Statement within administrative expenses. Legal provisions are uncertain as to timing and amount as they are the subject of ongoing cases.
Other
Other comprises a number of provisions including: liabilities arising from onerous contracts, mainly relating to property leases amounting to €16 million; employee compensation in certain countries in which we operate amounting to €11 million; and numerous other items which are not individually material and are not readily grouped together. The property leases generally have lives ranging from five to ten years.
25. Trade and other payables
Group2011
€m
Group2010
€m
Company2011
€m
Company2010
€m
Amounts falling due within one year:
Trade payables 915 808 - -
Amounts owed to associates - trading balances 4 5 - -
Payroll taxes 30 29 - -
Value added tax 49 36 - -
Social welfare 53 52 - -
Accruals and deferred income 372 358 - -
Capital payables 61 42 - -
Other payables 20 21 - -
Amounts due to Group companies - - 20 19
1,504 1,351 20 19
Amounts falling due after more than one year:
Other payables 10 7 - -
1,514 1,358 20 19
The fair values of trade and other payables are not materially different from their carrying amounts.
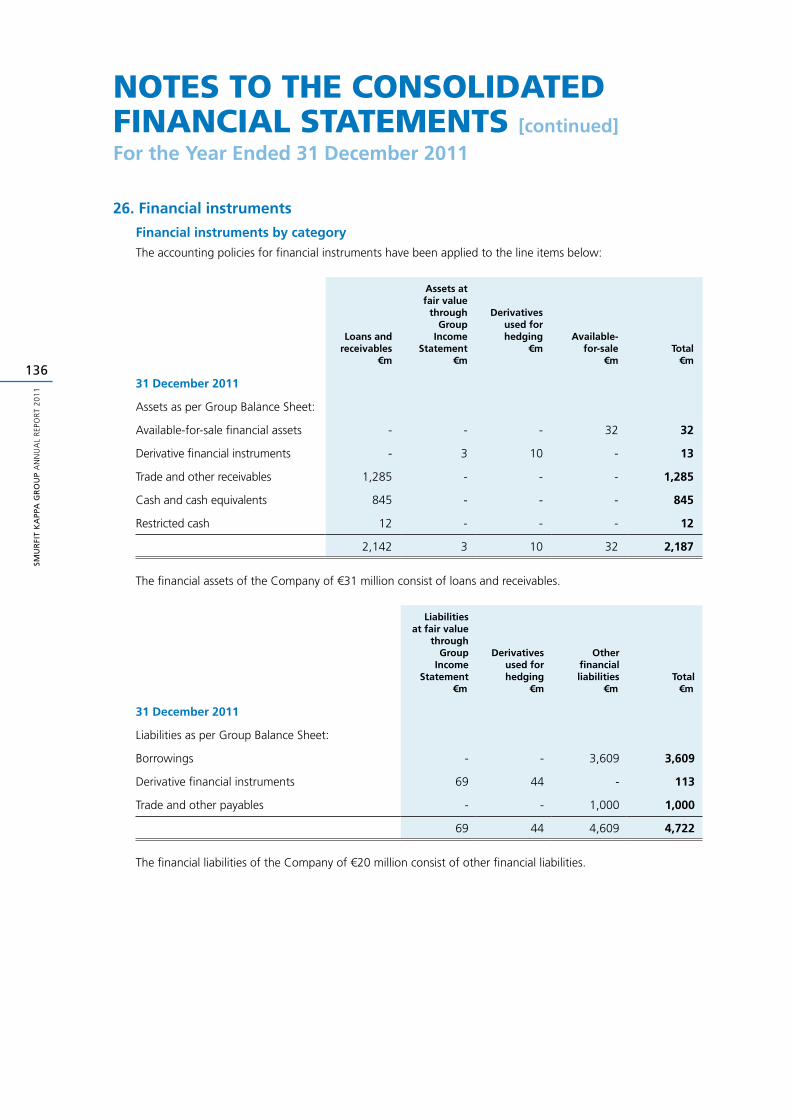
SMU
RFI
T K
APP
A G
RO
UP
AN
NU
AL
REP
OR
T 2
01
1
136
noteS to the ConSoliDateD finanCial StatementS [continued]
For the Year Ended 31 December 2011
26. Financial instruments
Financial instruments by category
The accounting policies for financial instruments have been applied to the line items below:
Loans andreceivables
€m
Assets at fair value
throughGroup
IncomeStatement
€m
Derivativesused forhedging
€mAvailable-
for-sale€m
Total€m
31 December 2011
Assets as per Group Balance Sheet:
Available-for-sale financial assets - - - 32 32
Derivative financial instruments - 3 10 - 13
Trade and other receivables 1,285 - - - 1,285
Cash and cash equivalents 845 - - - 845
Restricted cash 12 - - - 12
2,142 3 10 32 2,187
The financial assets of the Company of €31 million consist of loans and receivables.
Liabilities at fair value
through Group
IncomeStatement
€m
Derivativesused forhedging
€m
Other financialliabilities
€mTotal
€m
31 December 2011
Liabilities as per Group Balance Sheet:
Borrowings - - 3,609 3,609
Derivative financial instruments 69 44 - 113
Trade and other payables - - 1,000 1,000
69 44 4,609 4,722
The financial liabilities of the Company of €20 million consist of other financial liabilities.
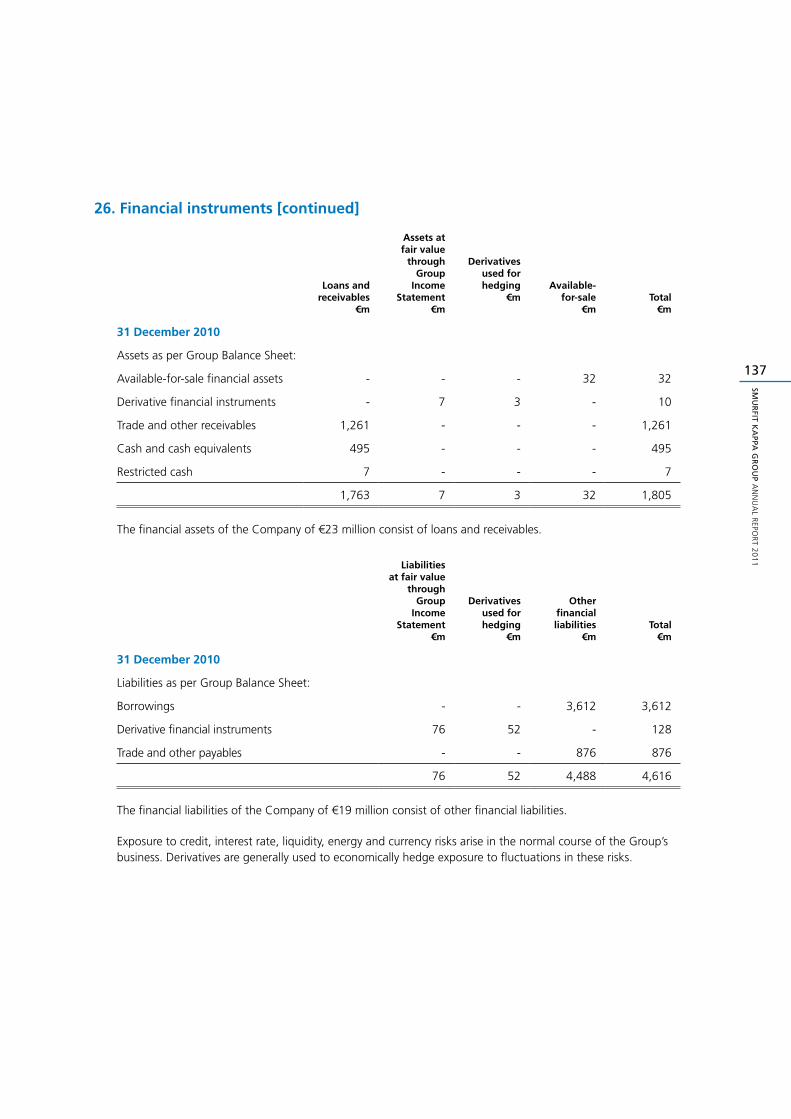
137
SMU
RFIT K
APPA
GR
OU
P A
NN
UA
L REPO
RT 2
01
1
26. Financial instruments [continued]
Loans andreceivables
€m
Assets at fair value
throughGroup
IncomeStatement
€m
Derivativesused forhedging
€mAvailable-
for-sale€m
Total€m
31 December 2010
Assets as per Group Balance Sheet:
Available-for-sale financial assets - - - 32 32
Derivative financial instruments - 7 3 - 10
Trade and other receivables 1,261 - - - 1,261
Cash and cash equivalents 495 - - - 495
Restricted cash 7 - - - 7
1,763 7 3 32 1,805
The financial assets of the Company of €23 million consist of loans and receivables.
Liabilities at fair value
through Group
IncomeStatement
€m
Derivativesused forhedging
€m
Other financialliabilities
€mTotal
€m
31 December 2010
Liabilities as per Group Balance Sheet:
Borrowings - - 3,612 3,612
Derivative financial instruments 76 52 - 128
Trade and other payables - - 876 876
76 52 4,488 4,616
The financial liabilities of the Company of €19 million consist of other financial liabilities.
Exposure to credit, interest rate, liquidity, energy and currency risks arise in the normal course of the Group’s business. Derivatives are generally used to economically hedge exposure to fluctuations in these risks.
SMU
RFI
T K
APP
A G
RO
UP
AN
NU
AL
REP
OR
T 2
01
1
138
noteS to the ConSoliDateD finanCial StatementS [continued]
For the Year Ended 31 December 2011
26. Financial instruments [continued]
Key financial risks and financial risk management resulting from the use of financial instruments and related sensitivity analysis
Financial and credit risk managementThe operating parameters and policies of the Group’s treasury management function are established under formal Board authority. The formal treasury policy covers the areas of funding, counterparty risk, foreign exchange, controls and derivatives. Risk arising on counterparty default is controlled within a framework of dealing with high quality institutions and, by policy, limiting the amount of credit exposure to any one bank or institution. The Group uses financial instruments, including fixed and variable rate debt to finance operations, for capital spending programs and for general corporate purposes. Additionally, financial instruments, including derivative instruments are used to hedge exposure to interest rate, commodity and foreign currency risks. The Group does not use financial instruments for trading purposes. The Group mitigates the risk that counterparties to derivatives will fail to perform by contracting with major financial institutions having high credit ratings and considers the likelihood of counterparty failure to be low. Trade debtors arise from a wide and varied customer base. There is no significant concentration of credit risk amongst any of the Group’s most significant financial assets. The Group also holds no collateral in respect of its principal credit exposures.
The successful management of the Group’s currency and interest rate exposure depends on a variety of factors, some of which are outside its control. The Group is exposed to the impact of interest rate changes and foreign currency fluctuations due to its investing and funding activities and its operations in foreign currencies. The Group manages interest rate exposure to achieve what management consider to be an appropriate balance of fixed and variable rate funding. To achieve this objective the Group enters into interest rate swaps, options and forward rate agreements. Interest rate swap agreements are primarily used to change the interest payable on its underlying borrowings from variable to fixed rate. The impact of any such swaps on the Group’s financial instruments has been set out in the table below.
The Group manages its Balance Sheet having regard to the currency exposures arising from its assets being denominated in a wide range of currencies. To this end, where foreign currency assets are funded by local borrowing, such borrowing is generally sourced in the currency of the related assets. The Group also hedges currency exposure through the use of currency swaps, options and forward contracts. The impact of these derivatives on the currency profile of the Group’s financial instruments has been set out in the tables below.
Further details on certain specific financial risks encountered have been set out below.
Interest rate riskThe Group is exposed to changes in interest rates, primarily changes in Euribor. The senior credit facility is variable rate debt, as is the Group’s securitisation facility. Interest rate changes therefore generally do not affect the market value of such debt but do impact the amount of the Group’s interest payments and, therefore, its future earnings and cash flows, assuming other factors are held constant. At 31 December 2011, the Group had fixed an average of 75% (2010: 76%) of its interest cost on borrowings over the following 12 months. Holding all other variables constant, including levels of indebtedness, at 31 December 2011 a one percentage point increase in variable interest rates would have had an estimated impact on pre-tax interest expense of approximately €1 million (including the effect of interest rate swaps) over the following 12 months.
The Group has entered into one or more interest rate protection agreements (principally interest rate swaps and cross currency interest rate swaps), which establish a fixed interest rate with respect to certain of its borrowings. A table setting out the fixed and variable rate debt together with the impact of the related interest and cross currency swaps has been set out below.
139
SMU
RFIT K
APPA
GR
OU
P A
NN
UA
L REPO
RT 2
01
1
26. Financial instruments [continued]
Currency sensitivityThe Group operates in the following principal currency areas (other than euro): Swedish Krona, Sterling, Latin America (comprising mainly Mexican Peso, Colombian Peso and Venezuelan Bolivar Fuerte) and Eastern Europe (comprising mainly the Polish Zloty and the Czech Koruna). At the end of 2011 approximately 94% (2010: 93%) of its non euro denominated net assets consisted of the Swedish Krona 26% (2010: 26%), Sterling 9% (2010: 9%), Latin American currencies 49% (2010: 47%) and Eastern European currencies 10% (2010: 11%). The Group believes that a strengthening of the euro exchange rate by 1% against all other foreign currencies from the 31 December 2011 rate would reduce shareholders’ equity by approximately €26 million (2010: €24 million).
Commodity price riskContainerboardThe Group is exposed to commodity price risks through its dependence on recovered paper, the principal raw material used in the manufacture of recycled containerboard. The price of recovered paper is dependent on both demand and supply conditions. Demand conditions include the production of recycled containerboard in Europe and the demand for recovered paper for the production of recycled containerboard outside of Europe, principally in Asia. Supply conditions include the rate of recovery of recovered paper, itself dependant on historic pricing related to the cost of recovery, and some slight seasonal variations.
Just over 1.05 metric tonnes of recovered paper are required to manufacture 1.0 metric tonne of recycled containerboard. Consequently, an increase in the price of recovered paper of, for example, €20 per tonne would increase the cost of production of recycled containerboard by approximately €21 per tonne. Historically, increases in the cost of recovered paper, if sustained, have led to a rise in the price of recycled containerboard, with a lag of one to two months.
The price of recovered paper can fluctuate significantly within a given year, affecting the operating results of the Group’s paper processing facilities. The Group seeks to manage this risk operationally rather than by entering into financial risk management derivatives. Accordingly, at each of 31 December 2011 and 2010 there were no derivatives held to mitigate such risks.
In addition, developing policy changes in the EU with regard to renewable energy sources have created an additional demand for wood, the principal raw material used in the manufacture of kraftliner. This has the effect of potentially increasing the price of wood and consequently the cost of the Group’s raw materials.
EnergyThe cost of producing the Group’s products is also sensitive to the price of energy. The Group’s main energy exposure is to the cost of gas and electricity. These energy costs have experienced significant price volatility in recent years, with a corresponding effect on Group production costs. Oil prices started the year at US$95 per barrel, peaked at US$127 in April and ended the year at US$107 per barrel. The Group has entered into a limited level of energy derivative contracts to economically hedge a portion of its energy costs in Sweden. The Group has also fixed a certain level of its energy costs through contractual arrangements directly with its energy suppliers.
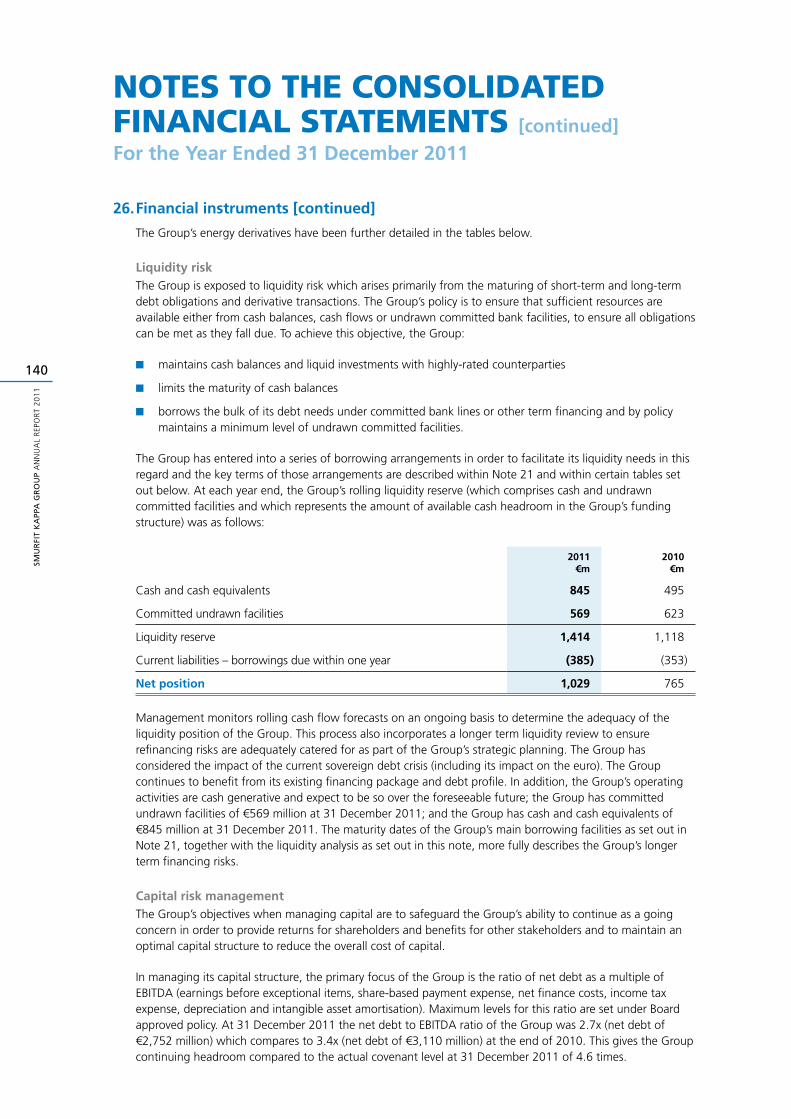
SMU
RFI
T K
APP
A G
RO
UP
AN
NU
AL
REP
OR
T 2
01
1
140
noteS to the ConSoliDateD finanCial StatementS [continued]
For the Year Ended 31 December 2011
26. Financial instruments [continued]
The Group’s energy derivatives have been further detailed in the tables below.
Liquidity riskThe Group is exposed to liquidity risk which arises primarily from the maturing of short-term and long-term debt obligations and derivative transactions. The Group’s policy is to ensure that sufficient resources are available either from cash balances, cash flows or undrawn committed bank facilities, to ensure all obligations can be met as they fall due. To achieve this objective, the Group:
maintains cash balances and liquid investments with highly-rated counterparties■■
limits the maturity of cash balances■■
borrows the bulk of its debt needs under committed bank lines or other term financing and by policy ■■
maintains a minimum level of undrawn committed facilities.
The Group has entered into a series of borrowing arrangements in order to facilitate its liquidity needs in this regard and the key terms of those arrangements are described within Note 21 and within certain tables set out below. At each year end, the Group’s rolling liquidity reserve (which comprises cash and undrawn committed facilities and which represents the amount of available cash headroom in the Group’s funding structure) was as follows:
2011€m
2010€m
Cash and cash equivalents 845 495
Committed undrawn facilities 569 623
Liquidity reserve 1,414 1,118
Current liabilities – borrowings due within one year (385) (353)
Net position 1,029 765
Management monitors rolling cash flow forecasts on an ongoing basis to determine the adequacy of the liquidity position of the Group. This process also incorporates a longer term liquidity review to ensure refinancing risks are adequately catered for as part of the Group’s strategic planning. The Group has considered the impact of the current sovereign debt crisis (including its impact on the euro). The Group continues to benefit from its existing financing package and debt profile. In addition, the Group’s operating activities are cash generative and expect to be so over the foreseeable future; the Group has committed undrawn facilities of €569 million at 31 December 2011; and the Group has cash and cash equivalents of €845 million at 31 December 2011. The maturity dates of the Group’s main borrowing facilities as set out in Note 21, together with the liquidity analysis as set out in this note, more fully describes the Group’s longer term financing risks.
Capital risk managementThe Group’s objectives when managing capital are to safeguard the Group’s ability to continue as a going concern in order to provide returns for shareholders and benefits for other stakeholders and to maintain an optimal capital structure to reduce the overall cost of capital.
In managing its capital structure, the primary focus of the Group is the ratio of net debt as a multiple of EBITDA (earnings before exceptional items, share-based payment expense, net finance costs, income tax expense, depreciation and intangible asset amortisation). Maximum levels for this ratio are set under Board approved policy. At 31 December 2011 the net debt to EBITDA ratio of the Group was 2.7x (net debt of €2,752 million) which compares to 3.4x (net debt of €3,110 million) at the end of 2010. This gives the Group continuing headroom compared to the actual covenant level at 31 December 2011 of 4.6 times.
141
SMU
RFIT K
APPA
GR
OU
P A
NN
UA
L REPO
RT 2
01
1
26. Financial instruments [continued]
On the basis of pre-exceptional operating profit, the Group’s return on capital employed was 12.5% compared to 9.9% in 2010, reflecting an increase of 27% in its pre-exceptional operating profit. The return on capital employed comprises pre-exceptional operating profit plus share of associates’ profit as a percentage of average capital employed (where capital employed is the sum of total equity and net debt at year end; 2011: €4,938 million, (2010: €5,046 million)). The post-exceptional return on capital employed was 11.8% in 2011 (2010: 8.3%).
The capital employed of the Company at 31 December 2011 was €1,980 million (2010: €1,968 million).
Credit riskCredit risk arises from credit exposure to trade debtors, cash and cash equivalents including deposits with banks and financial institutions, derivative financial instruments and investments. The Group has no sovereign exposures and no material debtors with Government agencies.
Trade debtors arise from a wide and varied customer base spread throughout the Group’s operations and as such there is no significant concentration of credit risk. Credit evaluations are performed on all customers over certain thresholds and all customers are subject to continued monitoring at operating company level.
Risk of counterparty default arising on cash and cash equivalents and derivative financial instruments is controlled within a framework of dealing with high quality institutions and, by policy, limiting the amount of credit exposure to any one bank or institution. Of the Group’s total cash and cash equivalents (including restricted cash) at 31 December 2011 of €857 million, 30% was with financial institutions in the A rating category of Standard and Poor’s or Moody’s and 58% was with financial institutions in the AA/Aa rating category. The remaining 12% was represented mainly by cash held with banks in Latin America which fell outside the A and AA/Aa ratings categories. At 31 December 2011 derivative transactions were with counterparties with ratings ranging from BB to AA with Standard & Poor’s or Ba2 to Aaa with Moody’s.
At each reporting date, there were no significant concentrations of credit risk which individually represented more than 10% of the Group’s financial assets. A geographical analysis of the Group’s segment assets has been provided in Note 4.
Market risk – available-for-sale securitiesThe Group’s available-for-sale securities principally comprise an investment in an unlisted entity which operates in a similar paper processing market to the Group in Europe and which has a similar underlying risk profile to the general operational risks encountered by the Group in this market. This investment is being carried at its estimated fair value and the Group’s maximum exposure to risk associated with this investment is represented by its carrying amount.
Investments are occasionally made in listed and unlisted entities of strategic importance to the Group and the policy for assessing impairment thereon is set out in Note 13.
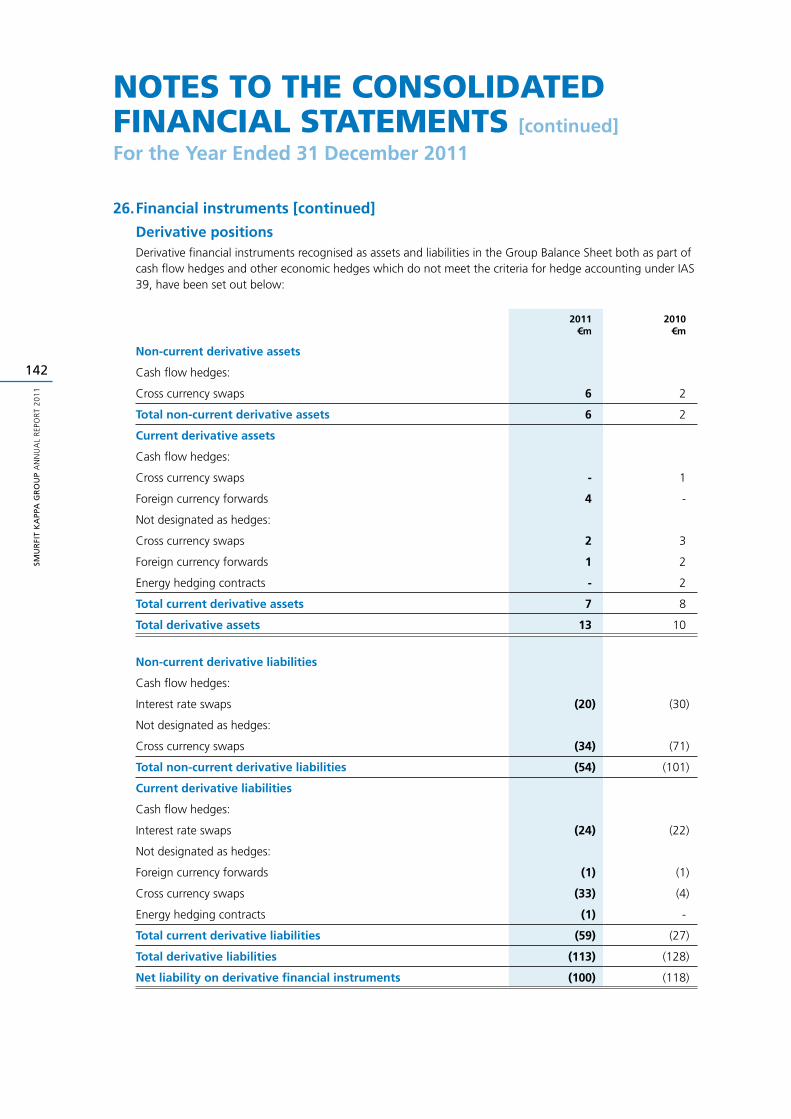
SMU
RFI
T K
APP
A G
RO
UP
AN
NU
AL
REP
OR
T 2
01
1
142
noteS to the ConSoliDateD finanCial StatementS [continued]
For the Year Ended 31 December 2011
26. Financial instruments [continued]
Derivative positionsDerivative financial instruments recognised as assets and liabilities in the Group Balance Sheet both as part of cash flow hedges and other economic hedges which do not meet the criteria for hedge accounting under IAS 39, have been set out below:
2011€m
2010€m
Non-current derivative assets
Cash flow hedges:
Cross currency swaps 6 2
Total non-current derivative assets 6 2
Current derivative assets
Cash flow hedges:
Cross currency swaps - 1
Foreign currency forwards 4 -
Not designated as hedges:
Cross currency swaps 2 3
Foreign currency forwards 1 2
Energy hedging contracts - 2
Total current derivative assets 7 8
Total derivative assets 13 10
Non-current derivative liabilities
Cash flow hedges:
Interest rate swaps (20) (30)
Not designated as hedges:
Cross currency swaps (34) (71)
Total non-current derivative liabilities (54) (101)
Current derivative liabilities
Cash flow hedges:
Interest rate swaps (24) (22)
Not designated as hedges:
Foreign currency forwards (1) (1)
Cross currency swaps (33) (4)
Energy hedging contracts (1) -
Total current derivative liabilities (59) (27)
Total derivative liabilities (113) (128)
Net liability on derivative financial instruments (100) (118)
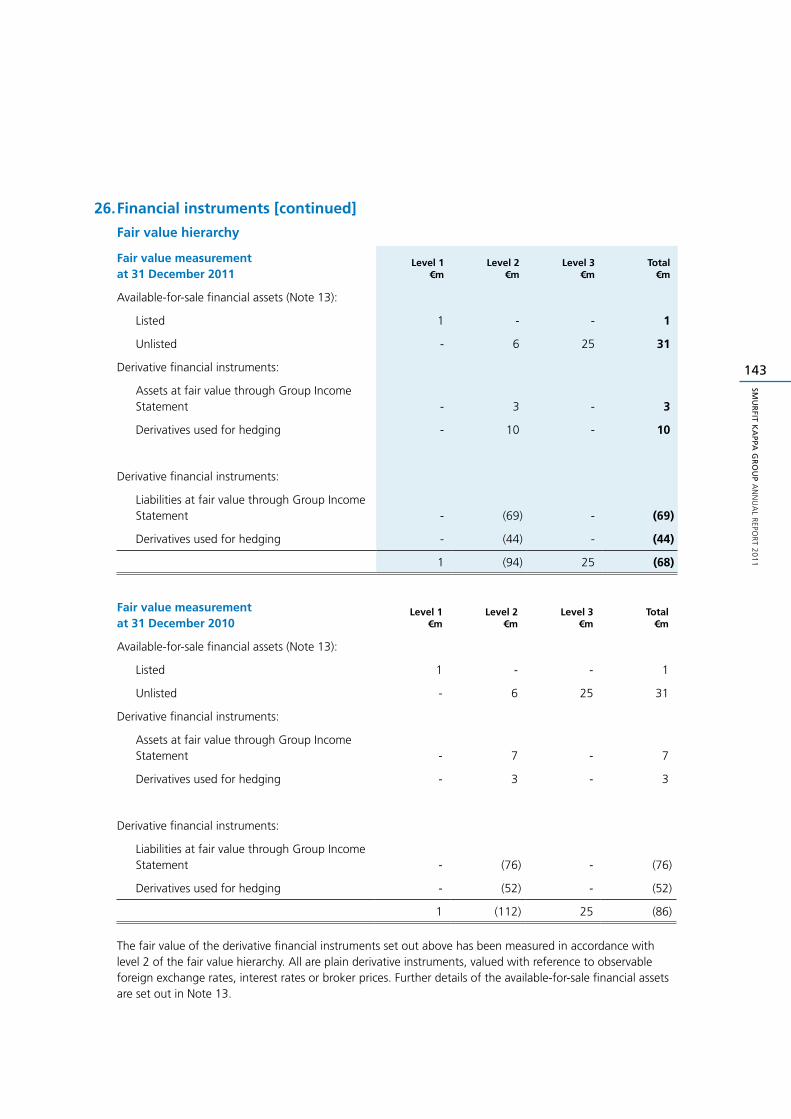
143
SMU
RFIT K
APPA
GR
OU
P A
NN
UA
L REPO
RT 2
01
1
26. Financial instruments [continued]
Fair value hierarchy
Fair value measurement at 31 December 2011
Level 1€m
Level 2€m
Level 3€m
Total€m
Available-for-sale financial assets (Note 13):
Listed 1 - - 1
Unlisted - 6 25 31
Derivative financial instruments:
Assets at fair value through Group Income Statement - 3 - 3
Derivatives used for hedging - 10 - 10
Derivative financial instruments:
Liabilities at fair value through Group Income Statement - (69) - (69)
Derivatives used for hedging - (44) - (44)
1 (94) 25 (68)
Fair value measurement at 31 December 2010
Level 1€m
Level 2€m
Level 3€m
Total€m
Available-for-sale financial assets (Note 13):
Listed 1 - - 1
Unlisted - 6 25 31
Derivative financial instruments:
Assets at fair value through Group Income Statement - 7 - 7
Derivatives used for hedging - 3 - 3
Derivative financial instruments:
Liabilities at fair value through Group Income Statement - (76) - (76)
Derivatives used for hedging - (52) - (52)
1 (112) 25 (86)
The fair value of the derivative financial instruments set out above has been measured in accordance with level 2 of the fair value hierarchy. All are plain derivative instruments, valued with reference to observable foreign exchange rates, interest rates or broker prices. Further details of the available-for-sale financial assets are set out in Note 13.
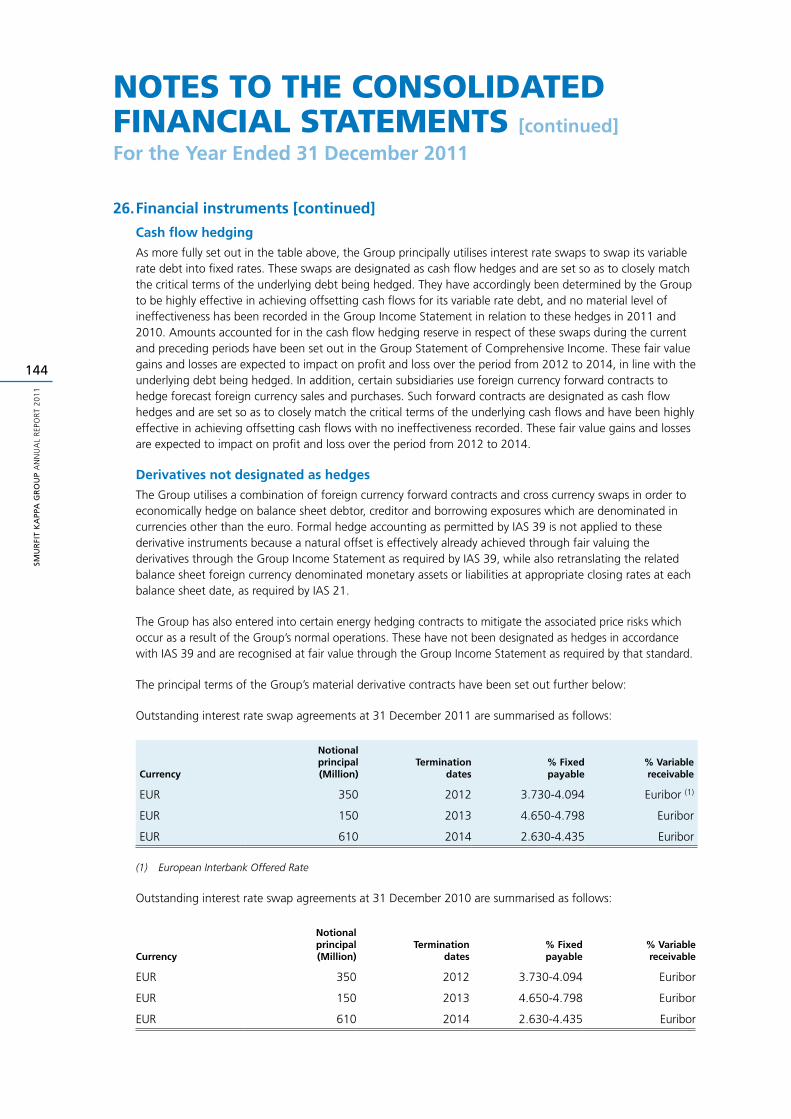
SMU
RFI
T K
APP
A G
RO
UP
AN
NU
AL
REP
OR
T 2
01
1
144
noteS to the ConSoliDateD finanCial StatementS [continued]
For the Year Ended 31 December 2011
26. Financial instruments [continued]
Cash flow hedging
As more fully set out in the table above, the Group principally utilises interest rate swaps to swap its variable rate debt into fixed rates. These swaps are designated as cash flow hedges and are set so as to closely match the critical terms of the underlying debt being hedged. They have accordingly been determined by the Group to be highly effective in achieving offsetting cash flows for its variable rate debt, and no material level of ineffectiveness has been recorded in the Group Income Statement in relation to these hedges in 2011 and 2010. Amounts accounted for in the cash flow hedging reserve in respect of these swaps during the current and preceding periods have been set out in the Group Statement of Comprehensive Income. These fair value gains and losses are expected to impact on profit and loss over the period from 2012 to 2014, in line with the underlying debt being hedged. In addition, certain subsidiaries use foreign currency forward contracts to hedge forecast foreign currency sales and purchases. Such forward contracts are designated as cash flow hedges and are set so as to closely match the critical terms of the underlying cash flows and have been highly effective in achieving offsetting cash flows with no ineffectiveness recorded. These fair value gains and losses are expected to impact on profit and loss over the period from 2012 to 2014.
Derivatives not designated as hedges
The Group utilises a combination of foreign currency forward contracts and cross currency swaps in order to economically hedge on balance sheet debtor, creditor and borrowing exposures which are denominated in currencies other than the euro. Formal hedge accounting as permitted by IAS 39 is not applied to these derivative instruments because a natural offset is effectively already achieved through fair valuing the derivatives through the Group Income Statement as required by IAS 39, while also retranslating the related balance sheet foreign currency denominated monetary assets or liabilities at appropriate closing rates at each balance sheet date, as required by IAS 21.
The Group has also entered into certain energy hedging contracts to mitigate the associated price risks which occur as a result of the Group’s normal operations. These have not been designated as hedges in accordance with IAS 39 and are recognised at fair value through the Group Income Statement as required by that standard.
The principal terms of the Group’s material derivative contracts have been set out further below:
Outstanding interest rate swap agreements at 31 December 2011 are summarised as follows:
Currency
Notional principal (Million)
Termination dates
% Fixed payable
% Variable receivable
EUR 350 2012 3.730-4.094 Euribor (1)
EUR 150 2013 4.650-4.798 Euribor
EUR 610 2014 2.630-4.435 Euribor
(1) European Interbank Offered Rate
Outstanding interest rate swap agreements at 31 December 2010 are summarised as follows:
Currency
Notional principal (Million)
Termination dates
% Fixed payable
% Variable receivable
EUR 350 2012 3.730-4.094 Euribor
EUR 150 2013 4.650-4.798 Euribor
EUR 610 2014 2.630-4.435 Euribor
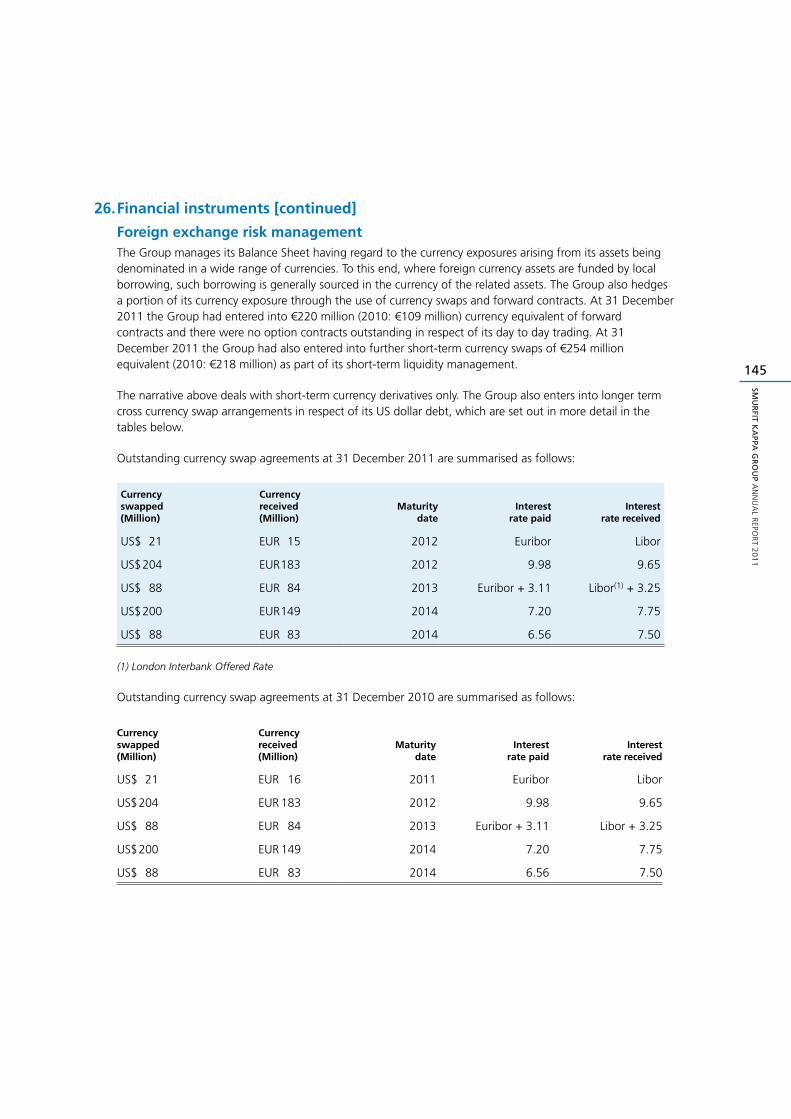
145
SMU
RFIT K
APPA
GR
OU
P A
NN
UA
L REPO
RT 2
01
1
26. Financial instruments [continued]
Foreign exchange risk managementThe Group manages its Balance Sheet having regard to the currency exposures arising from its assets being denominated in a wide range of currencies. To this end, where foreign currency assets are funded by local borrowing, such borrowing is generally sourced in the currency of the related assets. The Group also hedges a portion of its currency exposure through the use of currency swaps and forward contracts. At 31 December 2011 the Group had entered into €220 million (2010: €109 million) currency equivalent of forward contracts and there were no option contracts outstanding in respect of its day to day trading. At 31 December 2011 the Group had also entered into further short-term currency swaps of €254 million equivalent (2010: €218 million) as part of its short-term liquidity management.
The narrative above deals with short-term currency derivatives only. The Group also enters into longer term cross currency swap arrangements in respect of its US dollar debt, which are set out in more detail in the tables below.
Outstanding currency swap agreements at 31 December 2011 are summarised as follows:
Currency swapped(Million)
Currency received(Million)
Maturity date
Interest rate paid
Interest rate received
US$ 21 EUR 15 2012 Euribor Libor
US$ 204 EUR 183 2012 9.98 9.65
US$ 88 EUR 84 2013 Euribor + 3.11 Libor(1) + 3.25
US$ 200 EUR 149 2014 7.20 7.75
US$ 88 EUR 83 2014 6.56 7.50
(1) London Interbank Offered Rate
Outstanding currency swap agreements at 31 December 2010 are summarised as follows:
Currency swapped(Million)
Currency received(Million)
Maturity date
Interest rate paid
Interest rate received
US$ 21 EUR 16 2011 Euribor Libor
US$ 204 EUR 183 2012 9.98 9.65
US$ 88 EUR 84 2013 Euribor + 3.11 Libor + 3.25
US$ 200 EUR 149 2014 7.20 7.75
US$ 88 EUR 83 2014 6.56 7.50
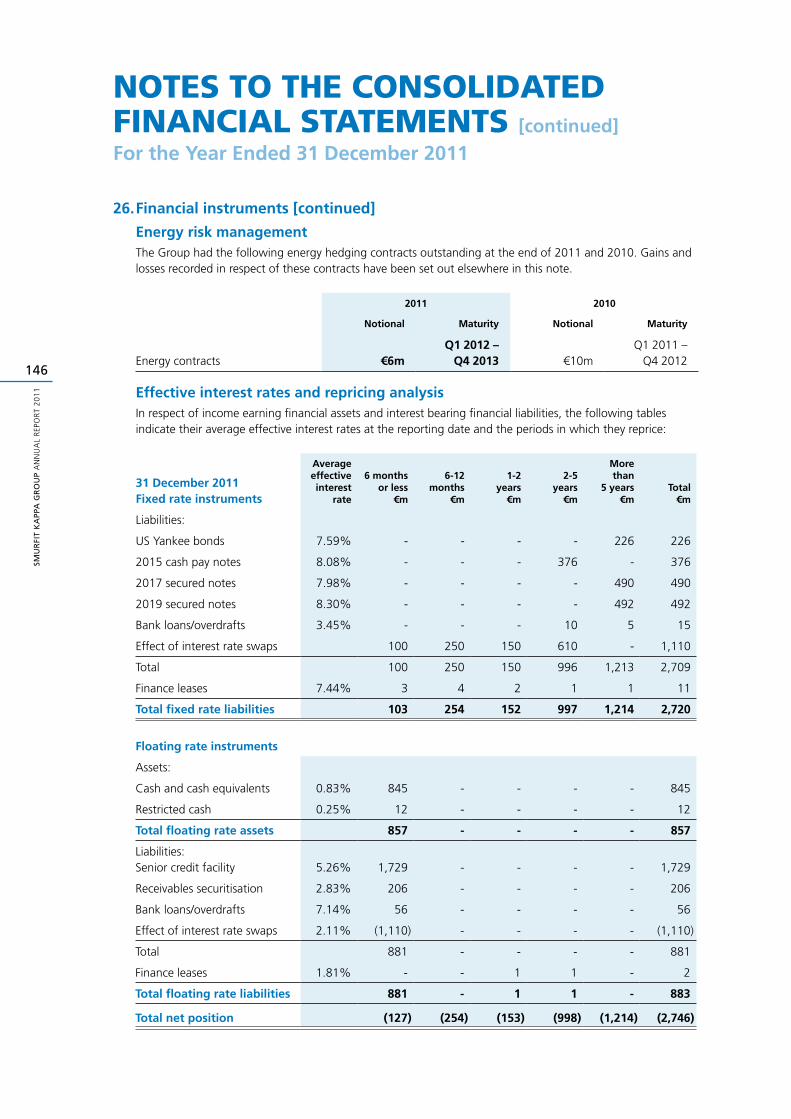
SMU
RFI
T K
APP
A G
RO
UP
AN
NU
AL
REP
OR
T 2
01
1
146
noteS to the ConSoliDateD finanCial StatementS [continued]
For the Year Ended 31 December 2011
26. Financial instruments [continued]
Energy risk managementThe Group had the following energy hedging contracts outstanding at the end of 2011 and 2010. Gains and losses recorded in respect of these contracts have been set out elsewhere in this note.
2011 2010
Notional Maturity Notional Maturity
Energy contracts €6mQ1 2012 –
Q4 2013 €10mQ1 2011 –
Q4 2012
Effective interest rates and repricing analysisIn respect of income earning financial assets and interest bearing financial liabilities, the following tables indicate their average effective interest rates at the reporting date and the periods in which they reprice:
31 December 2011Fixed rate instruments
Averageeffectiveinterest
rate
6 months or less
€m
6-12months
€m
1-2 years
€m
2-5 years
€m
Morethan
5 years€m
Total€m
Liabilities:
US Yankee bonds 7.59% - - - - 226 226
2015 cash pay notes 8.08% - - - 376 - 376
2017 secured notes 7.98% - - - - 490 490
2019 secured notes 8.30% - - - - 492 492
Bank loans/overdrafts 3.45% - - - 10 5 15
Effect of interest rate swaps 100 250 150 610 - 1,110
Total 100 250 150 996 1,213 2,709
Finance leases 7.44% 3 4 2 1 1 11
Total fixed rate liabilities 103 254 152 997 1,214 2,720
Floating rate instruments
Assets:
Cash and cash equivalents 0.83% 845 - - - - 845
Restricted cash 0.25% 12 - - - - 12
Total floating rate assets 857 - - - - 857
Liabilities:Senior credit facility 5.26% 1,729 - - - - 1,729
Receivables securitisation 2.83% 206 - - - - 206
Bank loans/overdrafts 7.14% 56 - - - - 56
Effect of interest rate swaps 2.11% (1,110) - - - - (1,110)
Total 881 - - - - 881
Finance leases 1.81% - - 1 1 - 2
Total floating rate liabilities 881 - 1 1 - 883
Total net position (127) (254) (153) (998) (1,214) (2,746)
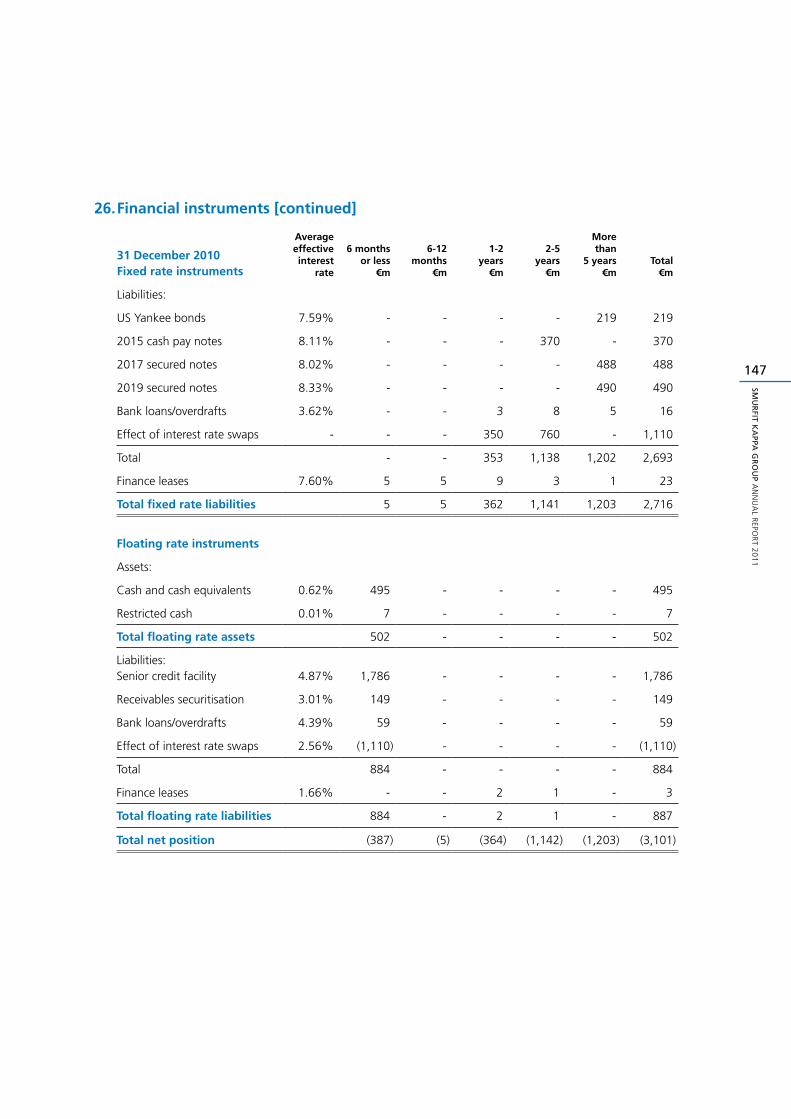
147
SMU
RFIT K
APPA
GR
OU
P A
NN
UA
L REPO
RT 2
01
1
26. Financial instruments [continued]
31 December 2010Fixed rate instruments
Averageeffectiveinterest
rate
6 months or less
€m
6-12months
€m
1-2 years
€m
2-5 years
€m
Morethan
5 years€m
Total€m
Liabilities:
US Yankee bonds 7.59% - - - - 219 219
2015 cash pay notes 8.11% - - - 370 - 370
2017 secured notes 8.02% - - - - 488 488
2019 secured notes 8.33% - - - - 490 490
Bank loans/overdrafts 3.62% - - 3 8 5 16
Effect of interest rate swaps - - - 350 760 - 1,110
Total - - 353 1,138 1,202 2,693
Finance leases 7.60% 5 5 9 3 1 23
Total fixed rate liabilities 5 5 362 1,141 1,203 2,716
Floating rate instruments
Assets:
Cash and cash equivalents 0.62% 495 - - - - 495
Restricted cash 0.01% 7 - - - - 7
Total floating rate assets 502 - - - - 502
Liabilities:Senior credit facility 4.87% 1,786 - - - - 1,786
Receivables securitisation 3.01% 149 - - - - 149
Bank loans/overdrafts 4.39% 59 - - - - 59
Effect of interest rate swaps 2.56% (1,110) - - - - (1,110)
Total 884 - - - - 884
Finance leases 1.66% - - 2 1 - 3
Total floating rate liabilities 884 - 2 1 - 887
Total net position (387) (5) (364) (1,142) (1,203) (3,101)
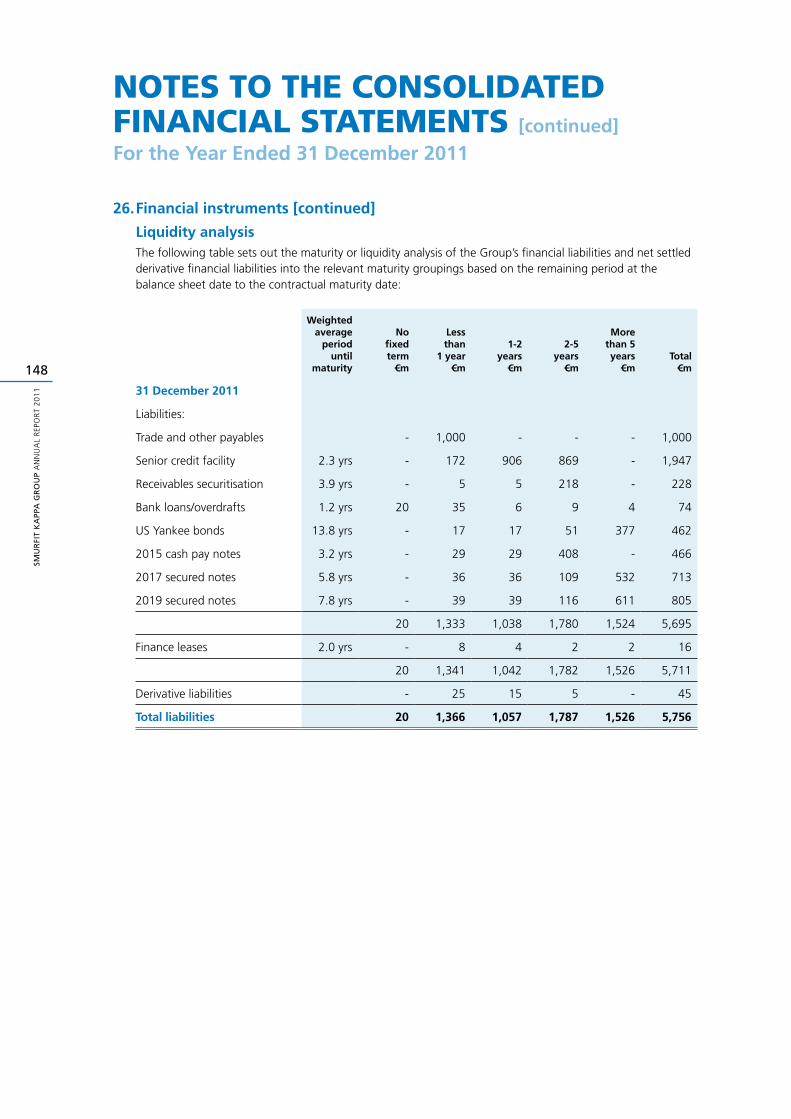
SMU
RFI
T K
APP
A G
RO
UP
AN
NU
AL
REP
OR
T 2
01
1
148
noteS to the ConSoliDateD finanCial StatementS [continued]
For the Year Ended 31 December 2011
26. Financial instruments [continued]
Liquidity analysisThe following table sets out the maturity or liquidity analysis of the Group’s financial liabilities and net settled derivative financial liabilities into the relevant maturity groupings based on the remaining period at the balance sheet date to the contractual maturity date:
Weighted average
period until
maturity
No fixed term
€m
Less than
1 year€m
1-2 years
€m
2-5 years
€m
More than 5 years
€mTotal
€m
31 December 2011
Liabilities:
Trade and other payables - 1,000 - - - 1,000
Senior credit facility 2.3 yrs - 172 906 869 - 1,947
Receivables securitisation 3.9 yrs - 5 5 218 - 228
Bank loans/overdrafts 1.2 yrs 20 35 6 9 4 74
US Yankee bonds 13.8 yrs - 17 17 51 377 462
2015 cash pay notes 3.2 yrs - 29 29 408 - 466
2017 secured notes 5.8 yrs - 36 36 109 532 713
2019 secured notes 7.8 yrs - 39 39 116 611 805
20 1,333 1,038 1,780 1,524 5,695
Finance leases 2.0 yrs - 8 4 2 2 16
20 1,341 1,042 1,782 1,526 5,711
Derivative liabilities - 25 15 5 - 45
Total liabilities 20 1,366 1,057 1,787 1,526 5,756
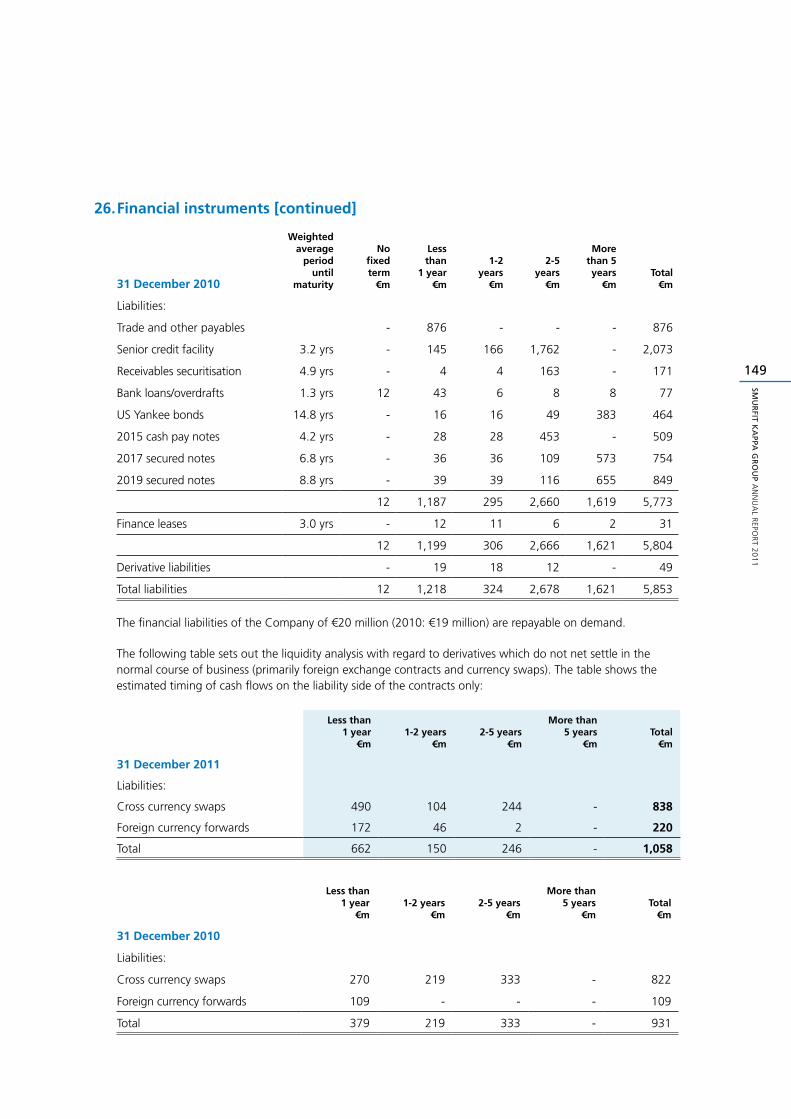
149
SMU
RFIT K
APPA
GR
OU
P A
NN
UA
L REPO
RT 2
01
1
26. Financial instruments [continued]
31 December 2010
Weighted average
period until
maturity
No fixed term
€m
Less than
1 year€m
1-2 years
€m
2-5 years
€m
More than 5 years
€mTotal
€m
Liabilities:
Trade and other payables - 876 - - - 876
Senior credit facility 3.2 yrs - 145 166 1,762 - 2,073
Receivables securitisation 4.9 yrs - 4 4 163 - 171
Bank loans/overdrafts 1.3 yrs 12 43 6 8 8 77
US Yankee bonds 14.8 yrs - 16 16 49 383 464
2015 cash pay notes 4.2 yrs - 28 28 453 - 509
2017 secured notes 6.8 yrs - 36 36 109 573 754
2019 secured notes 8.8 yrs - 39 39 116 655 849
12 1,187 295 2,660 1,619 5,773
Finance leases 3.0 yrs - 12 11 6 2 31
12 1,199 306 2,666 1,621 5,804
Derivative liabilities - 19 18 12 - 49
Total liabilities 12 1,218 324 2,678 1,621 5,853
The financial liabilities of the Company of €20 million (2010: €19 million) are repayable on demand.
The following table sets out the liquidity analysis with regard to derivatives which do not net settle in the normal course of business (primarily foreign exchange contracts and currency swaps). The table shows the estimated timing of cash flows on the liability side of the contracts only:
Less than1 year
€m1-2 years
€m2-5 years
€m
More than 5 years
€mTotal
€m
31 December 2011
Liabilities:
Cross currency swaps 490 104 244 - 838
Foreign currency forwards 172 46 2 - 220
Total 662 150 246 - 1,058
Less than1 year
€m1-2 years
€m2-5 years
€m
More than 5 years
€mTotal
€m
31 December 2010
Liabilities:
Cross currency swaps 270 219 333 - 822
Foreign currency forwards 109 - - - 109
Total 379 219 333 - 931
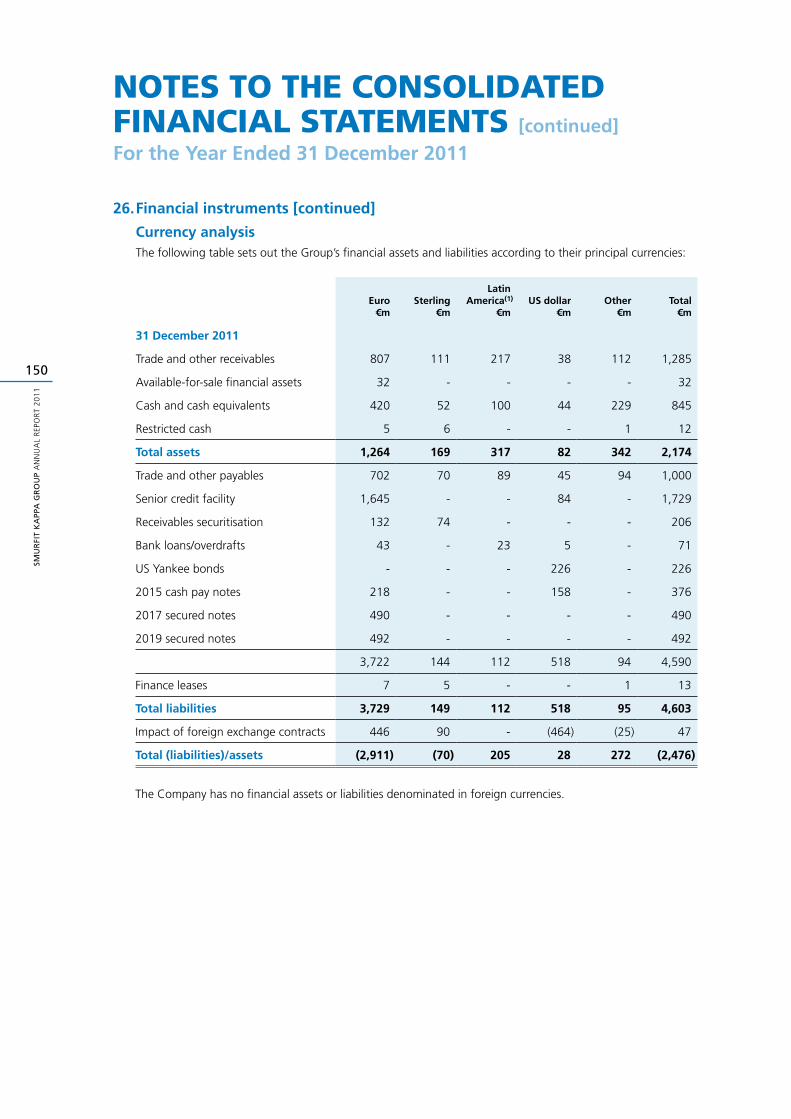
SMU
RFI
T K
APP
A G
RO
UP
AN
NU
AL
REP
OR
T 2
01
1
150
noteS to the ConSoliDateD finanCial StatementS [continued]
For the Year Ended 31 December 2011
26. Financial instruments [continued]
Currency analysisThe following table sets out the Group’s financial assets and liabilities according to their principal currencies:
Euro€m
Sterling€m
Latin America(1)
€mUS dollar
€mOther
€mTotal
€m
31 December 2011
Trade and other receivables 807 111 217 38 112 1,285
Available-for-sale financial assets 32 - - - - 32
Cash and cash equivalents 420 52 100 44 229 845
Restricted cash 5 6 - - 1 12
Total assets 1,264 169 317 82 342 2,174
Trade and other payables 702 70 89 45 94 1,000
Senior credit facility 1,645 - - 84 - 1,729
Receivables securitisation 132 74 - - - 206
Bank loans/overdrafts 43 - 23 5 - 71
US Yankee bonds - - - 226 - 226
2015 cash pay notes 218 - - 158 - 376
2017 secured notes 490 - - - - 490
2019 secured notes 492 - - - - 492
3,722 144 112 518 94 4,590
Finance leases 7 5 - - 1 13
Total liabilities 3,729 149 112 518 95 4,603
Impact of foreign exchange contracts 446 90 - (464) (25) 47
Total (liabilities)/assets (2,911) (70) 205 28 272 (2,476)
The Company has no financial assets or liabilities denominated in foreign currencies.
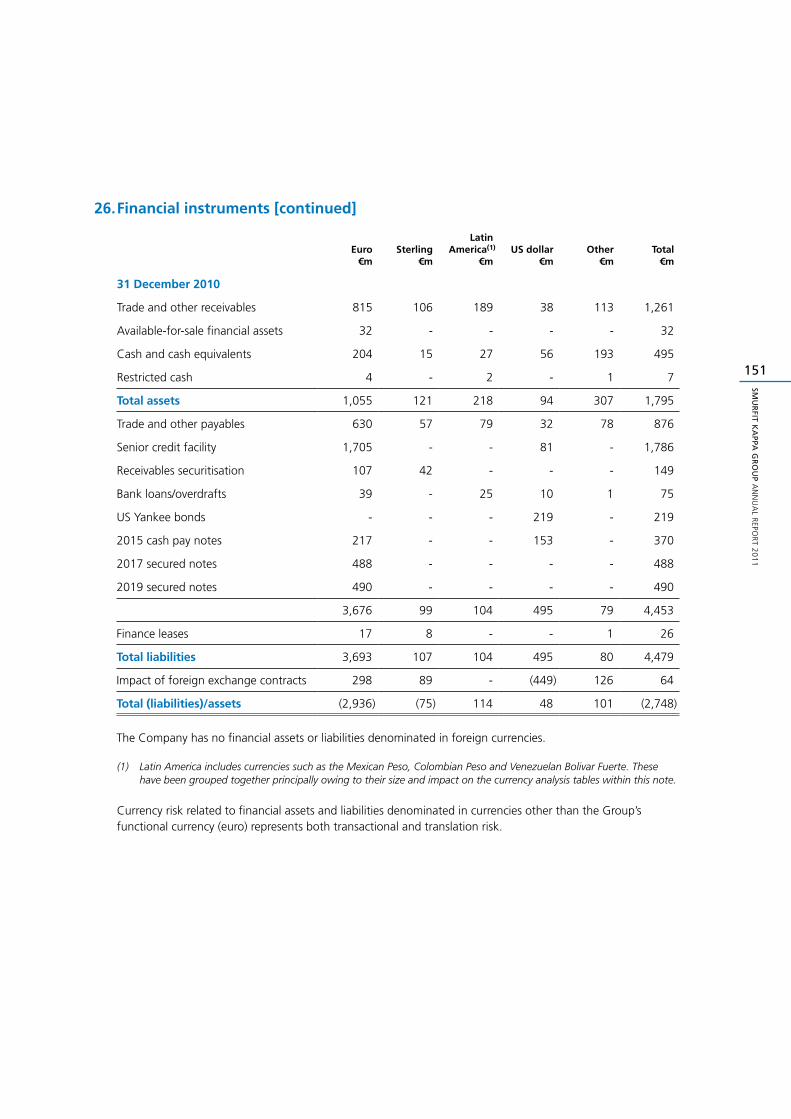
151
SMU
RFIT K
APPA
GR
OU
P A
NN
UA
L REPO
RT 2
01
1
26. Financial instruments [continued]
Euro€m
Sterling€m
Latin America(1)
€mUS dollar
€mOther
€mTotal
€m
31 December 2010
Trade and other receivables 815 106 189 38 113 1,261
Available-for-sale financial assets 32 - - - - 32
Cash and cash equivalents 204 15 27 56 193 495
Restricted cash 4 - 2 - 1 7
Total assets 1,055 121 218 94 307 1,795
Trade and other payables 630 57 79 32 78 876
Senior credit facility 1,705 - - 81 - 1,786
Receivables securitisation 107 42 - - - 149
Bank loans/overdrafts 39 - 25 10 1 75
US Yankee bonds - - - 219 - 219
2015 cash pay notes 217 - - 153 - 370
2017 secured notes 488 - - - - 488
2019 secured notes 490 - - - - 490
3,676 99 104 495 79 4,453
Finance leases 17 8 - - 1 26
Total liabilities 3,693 107 104 495 80 4,479
Impact of foreign exchange contracts 298 89 - (449) 126 64
Total (liabilities)/assets (2,936) (75) 114 48 101 (2,748)
The Company has no financial assets or liabilities denominated in foreign currencies.
(1) Latin America includes currencies such as the Mexican Peso, Colombian Peso and Venezuelan Bolivar Fuerte. These have been grouped together principally owing to their size and impact on the currency analysis tables within this note.
Currency risk related to financial assets and liabilities denominated in currencies other than the Group’s functional currency (euro) represents both transactional and translation risk.
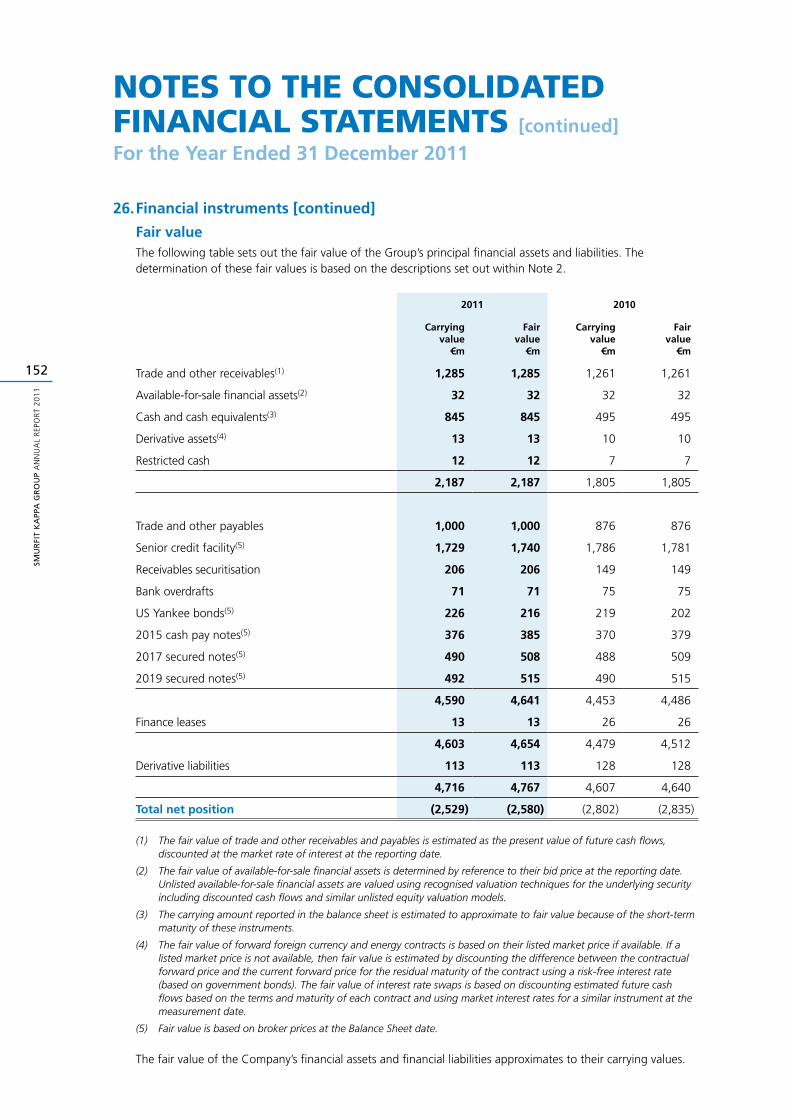
SMU
RFI
T K
APP
A G
RO
UP
AN
NU
AL
REP
OR
T 2
01
1
152
noteS to the ConSoliDateD finanCial StatementS [continued]
For the Year Ended 31 December 2011
26. Financial instruments [continued]
Fair valueThe following table sets out the fair value of the Group’s principal financial assets and liabilities. The determination of these fair values is based on the descriptions set out within Note 2.
2011 2010
Carrying value
€m
Fair value
€m
Carrying value
€m
Fair value
€m
Trade and other receivables(1) 1,285 1,285 1,261 1,261
Available-for-sale financial assets(2) 32 32 32 32
Cash and cash equivalents(3) 845 845 495 495
Derivative assets(4) 13 13 10 10
Restricted cash 12 12 7 7
2,187 2,187 1,805 1,805
Trade and other payables 1,000 1,000 876 876
Senior credit facility(5) 1,729 1,740 1,786 1,781
Receivables securitisation 206 206 149 149
Bank overdrafts 71 71 75 75
US Yankee bonds(5) 226 216 219 202
2015 cash pay notes(5) 376 385 370 379
2017 secured notes(5) 490 508 488 509
2019 secured notes(5) 492 515 490 515
4,590 4,641 4,453 4,486
Finance leases 13 13 26 26
4,603 4,654 4,479 4,512
Derivative liabilities 113 113 128 128
4,716 4,767 4,607 4,640
Total net position (2,529) (2,580) (2,802) (2,835)
(1) The fair value of trade and other receivables and payables is estimated as the present value of future cash flows, discounted at the market rate of interest at the reporting date.
(2) The fair value of available-for-sale financial assets is determined by reference to their bid price at the reporting date. Unlisted available-for-sale financial assets are valued using recognised valuation techniques for the underlying security including discounted cash flows and similar unlisted equity valuation models.
(3) The carrying amount reported in the balance sheet is estimated to approximate to fair value because of the short-term maturity of these instruments.
(4) The fair value of forward foreign currency and energy contracts is based on their listed market price if available. If a listed market price is not available, then fair value is estimated by discounting the difference between the contractual forward price and the current forward price for the residual maturity of the contract using a risk-free interest rate (based on government bonds). The fair value of interest rate swaps is based on discounting estimated future cash flows based on the terms and maturity of each contract and using market interest rates for a similar instrument at the measurement date.
(5) Fair value is based on broker prices at the Balance Sheet date.
The fair value of the Company’s financial assets and financial liabilities approximates to their carrying values.
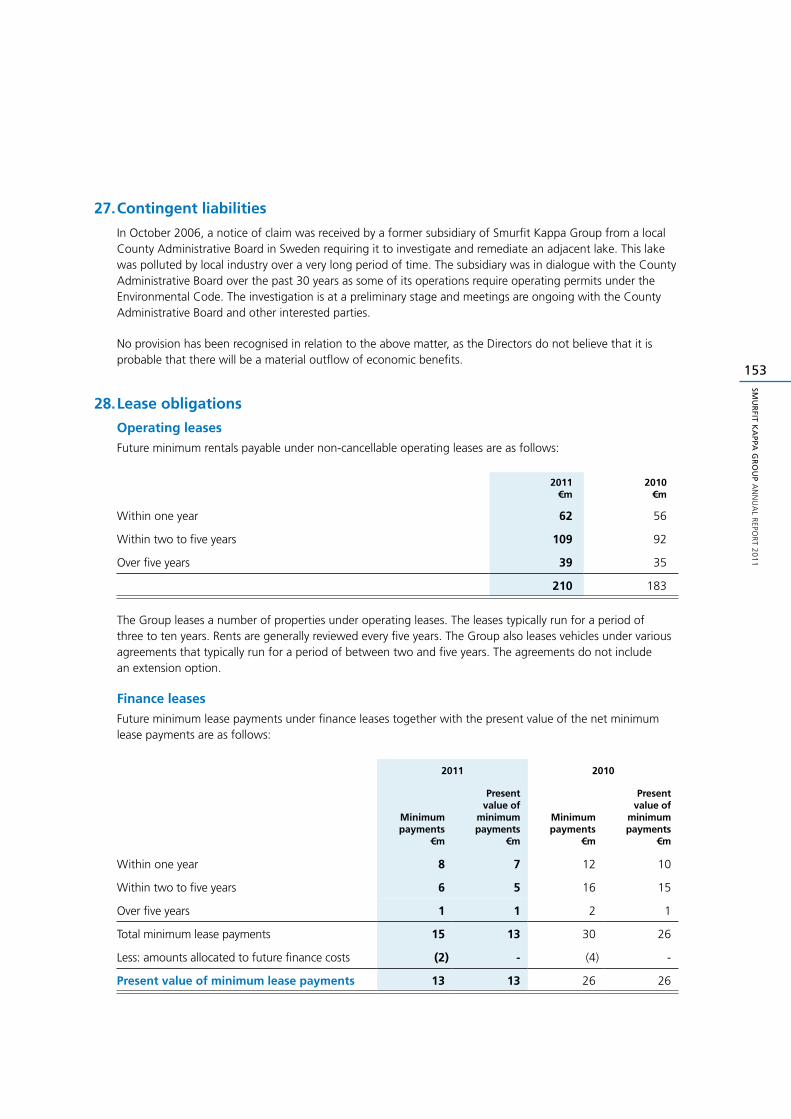
153
SMU
RFIT K
APPA
GR
OU
P A
NN
UA
L REPO
RT 2
01
1
27. Contingent liabilities
In October 2006, a notice of claim was received by a former subsidiary of Smurfit Kappa Group from a local County Administrative Board in Sweden requiring it to investigate and remediate an adjacent lake. This lake was polluted by local industry over a very long period of time. The subsidiary was in dialogue with the County Administrative Board over the past 30 years as some of its operations require operating permits under the Environmental Code. The investigation is at a preliminary stage and meetings are ongoing with the County Administrative Board and other interested parties.
No provision has been recognised in relation to the above matter, as the Directors do not believe that it is probable that there will be a material outflow of economic benefits.
28. Lease obligations
Operating leases
Future minimum rentals payable under non-cancellable operating leases are as follows:
2011€m
2010€m
Within one year 62 56
Within two to five years 109 92
Over five years 39 35
210 183
The Group leases a number of properties under operating leases. The leases typically run for a period of three to ten years. Rents are generally reviewed every five years. The Group also leases vehicles under various agreements that typically run for a period of between two and five years. The agreements do not include an extension option.
Finance leases
Future minimum lease payments under finance leases together with the present value of the net minimum lease payments are as follows:
2011 2010
Minimumpayments
€m
Present value of
minimum payments
€m
Minimum payments
€m
Present value of
minimum payments
€m
Within one year 8 7 12 10
Within two to five years 6 5 16 15
Over five years 1 1 2 1
Total minimum lease payments 15 13 30 26
Less: amounts allocated to future finance costs (2) - (4) -
Present value of minimum lease payments 13 13 26 26
SMU
RFI
T K
APP
A G
RO
UP
AN
NU
AL
REP
OR
T 2
01
1
154
noteS to the ConSoliDateD finanCial StatementS [continued]
For the Year Ended 31 December 2011
28. Lease obligations [continued]
The Group has a number of arrangements in place in relation to cogeneration facilities that do not take the legal form of leases but convey the right to use the underlying assets in return for a series of payments. These arrangements have been assessed as having the substance of finance lease arrangements. See Note 11 for the capitalised values of these finance leases.
The cogeneration plants consist of gas turbines, steam turbines and boilers for the recuperation of exhaust fumes. In exchange for a third party vendor constructing such a plant on, or near, a Group paper mill, the Group generally commits to purchasing the recouped steam output and a minimum amount of electricity produced by the plant. Payment terms generally include both fixed elements and variable elements determined on output consumed by Group and certain market indices. The terms of these arrangements cover minimum periods ranging from 6 to 20 years, and generally include a bargain purchase option and renewal provisions at end of term.
29. Related party transactions
The principal related party relationships requiring disclosure under IAS 24, Related Party Disclosures pertain to the existence of subsidiaries and associates and transactions with these entities entered into by the Group and the identification and compensation of key management personnel as addressed in greater detail below.
Transactions with subsidiaries
The Consolidated Financial Statements include the Financial Statements of the Company and its subsidiaries and associates as documented in the accounting policies on pages 77 and 78. A listing of the principal subsidiaries is provided on pages 157 to 159 of this document.
Sales to and purchases from, together with outstanding payables and receivables to and from, subsidiaries are eliminated in the preparation of the consolidated financial information in accordance with IAS 27, Consolidated and Separate Financial Statements.
Transactions with associates
The Group conducts certain transactions with associates in the normal course of business which are summarised as follows:
Sales and purchase of goods and services
2011€m
2010€m
Sale of goods 12 13
Purchase of goods (10) (12)
Receiving of services (3) (6)
These transactions are undertaken and settled on an arms length basis. No guarantees are given or received by either party.
The receivables from related parties arise mainly from sale transactions and are due two months after the date of sale. The receivables are unsecured in nature and bear no interest.
The payables to related parties arise mainly from purchase transactions and are due two months after the date of purchase. The payables bear no interest.
No provision has been made in 2011 and 2010 relating to balances with related parties.
155
SMU
RFIT K
APPA
GR
OU
P A
NN
UA
L REPO
RT 2
01
1
29. Related party transactions [continued]
Transactions with other related parties
In 2011, the Group purchased, in the normal course of business, approximately 35,000 metric tonnes (2010: 39,000 metric tonnes) of paper amounting to approximately €18 million (2010: €17 million) from Savon Sellu, a company controlled by Dermot Smurfit together with his brothers Dr. Michael Smurfit, former Chairman of the Group and Alan Smurfit. An amount of €5 million (2010: €4 million) was owed by the Group to Savon Sellu at 31 December 2011.
Transactions with key management personnel
For the purposes of the disclosure requirements of IAS 24, the term ‘key management personnel’ (i.e. those persons having authority and responsibility for planning, directing and controlling the activities of the Company) comprises the Board of Directors and Secretary who manage the business and affairs of the Company.
2011€m
2010€m
Short-term employee benefits 7 7
Post employment benefits 1 1
Share-based payment expense 2 -
10 8
Parent Company
The Parent Company is an investment holding company and as a result, holds investments in the Group subsidiaries as financial assets. The Parent Company also has receivables and payables with its subsidiaries entered into in the normal course of business. These balances are repayable on demand. The notes to the Parent Company Balance Sheet disclose these various balances. The Parent Company loss for the year was €1 million (2010: loss for the year of €1 million).
30. Business combinations
The two acquisitions completed by the Group during the year, together with percentages acquired and completion dates were as follows:
St. Petersburg (100%, 11 November 2011), a box plant in Russia;■■
Oakland Packaging (100%, 11 April 2011), a solid board merchant based in the UK.■■
Fair value amounts equate to net book values acquired with the exception of non-current assets, with the book value of land and buildings being increased by €2 million and customer intangibles by €3 million following a fair value exercise. The book values of other assets and liabilities were deemed to be valid based on due diligence carried out prior to the transaction.
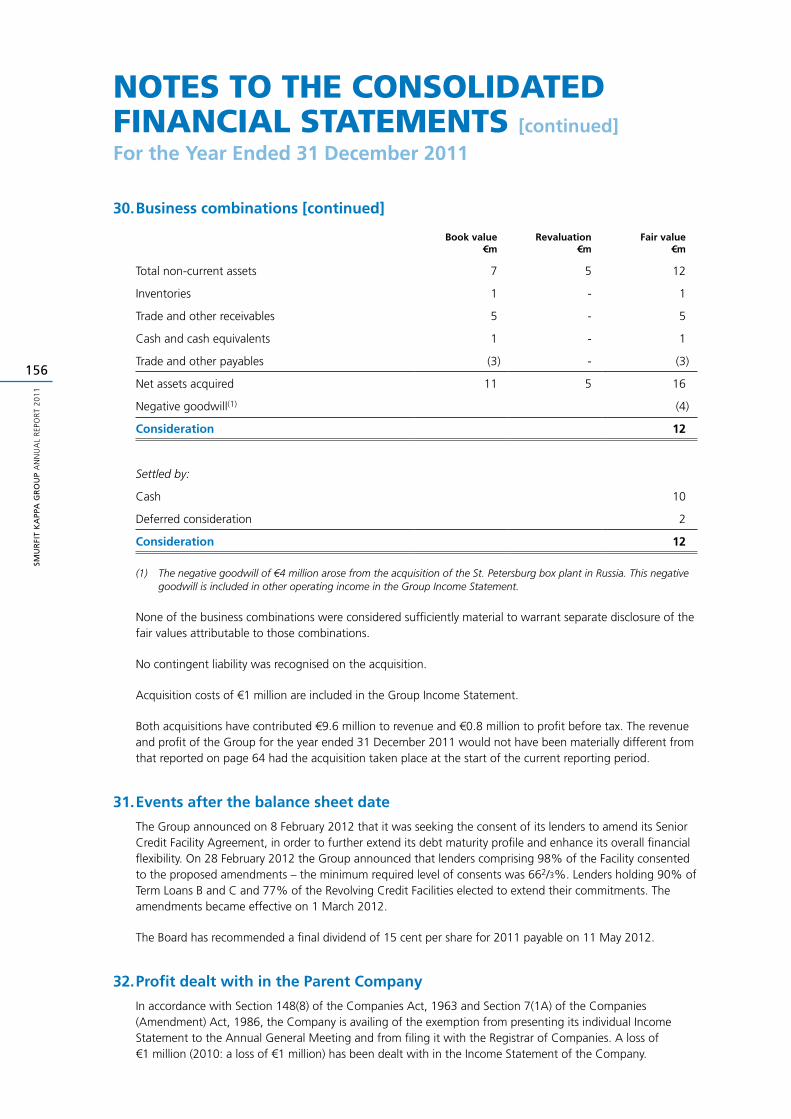
SMU
RFI
T K
APP
A G
RO
UP
AN
NU
AL
REP
OR
T 2
01
1
156
noteS to the ConSoliDateD finanCial StatementS [continued]
For the Year Ended 31 December 2011
30. Business combinations [continued]
Book value€m
Revaluation €m
Fair value€m
Total non-current assets 7 5 12
Inventories 1 - 1
Trade and other receivables 5 - 5
Cash and cash equivalents 1 - 1
Trade and other payables (3) - (3)
Net assets acquired 11 5 16
Negative goodwill(1) (4)
Consideration 12
Settled by:
Cash 10
Deferred consideration 2
Consideration 12
(1) The negative goodwill of €4 million arose from the acquisition of the St. Petersburg box plant in Russia. This negative goodwill is included in other operating income in the Group Income Statement.
None of the business combinations were considered sufficiently material to warrant separate disclosure of the fair values attributable to those combinations.
No contingent liability was recognised on the acquisition.
Acquisition costs of €1 million are included in the Group Income Statement.
Both acquisitions have contributed €9.6 million to revenue and €0.8 million to profit before tax. The revenue and profit of the Group for the year ended 31 December 2011 would not have been materially different from that reported on page 64 had the acquisition taken place at the start of the current reporting period.
31. Events after the balance sheet date
The Group announced on 8 February 2012 that it was seeking the consent of its lenders to amend its Senior Credit Facility Agreement, in order to further extend its debt maturity profile and enhance its overall financial flexibility. On 28 February 2012 the Group announced that lenders comprising 98% of the Facility consented to the proposed amendments – the minimum required level of consents was 662/3%. Lenders holding 90% of Term Loans B and C and 77% of the Revolving Credit Facilities elected to extend their commitments. The amendments became effective on 1 March 2012.
The Board has recommended a final dividend of 15 cent per share for 2011 payable on 11 May 2012.
32. Profit dealt with in the Parent Company
In accordance with Section 148(8) of the Companies Act, 1963 and Section 7(1A) of the Companies (Amendment) Act, 1986, the Company is availing of the exemption from presenting its individual Income Statement to the Annual General Meeting and from filing it with the Registrar of Companies. A loss of €1 million (2010: a loss of €1 million) has been dealt with in the Income Statement of the Company.
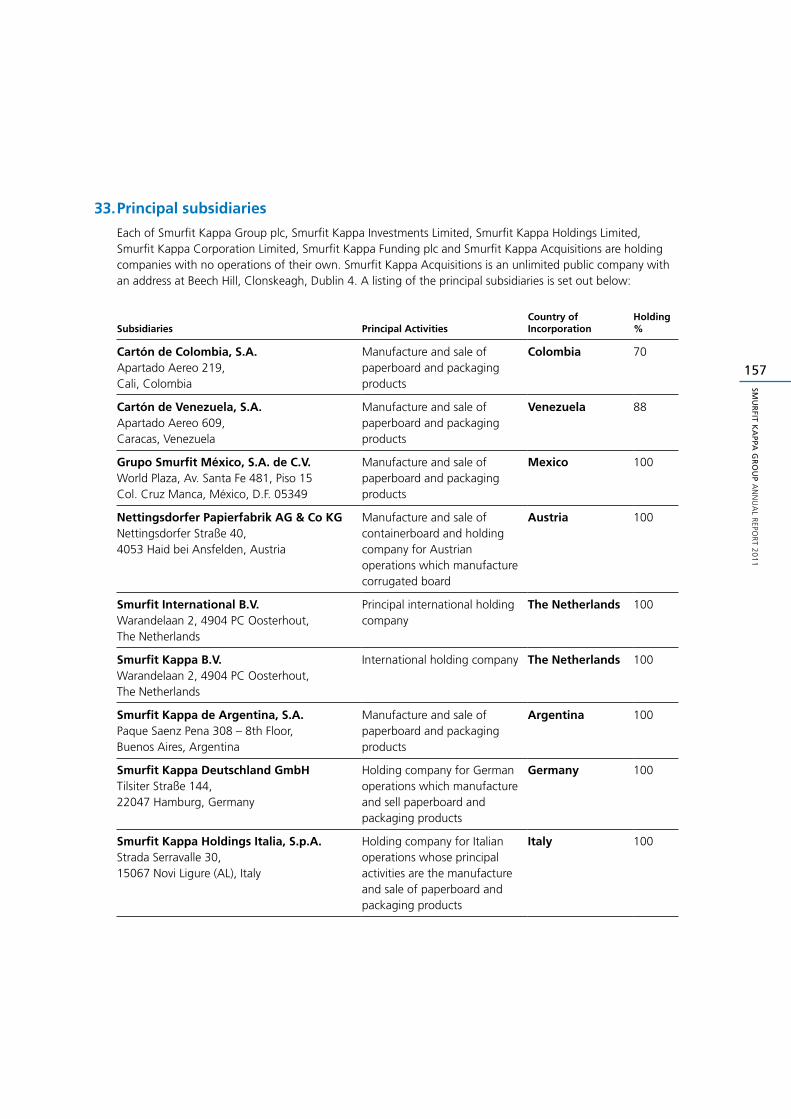
157
SMU
RFIT K
APPA
GR
OU
P A
NN
UA
L REPO
RT 2
01
1
33. Principal subsidiaries
Each of Smurfit Kappa Group plc, Smurfit Kappa Investments Limited, Smurfit Kappa Holdings Limited, Smurfit Kappa Corporation Limited, Smurfit Kappa Funding plc and Smurfit Kappa Acquisitions are holding companies with no operations of their own. Smurfit Kappa Acquisitions is an unlimited public company with an address at Beech Hill, Clonskeagh, Dublin 4. A listing of the principal subsidiaries is set out below:
Subsidiaries Principal ActivitiesCountry of Incorporation
Holding %
Cartón de Colombia, S.A.Apartado Aereo 219,Cali, Colombia
Manufacture and sale of paperboard and packaging products
Colombia 70
Cartón de Venezuela, S.A.Apartado Aereo 609,Caracas, Venezuela
Manufacture and sale of paperboard and packaging products
Venezuela 88
Grupo Smurfit México, S.A. de C.V.World Plaza, Av. Santa Fe 481, Piso 15Col. Cruz Manca, México, D.F. 05349
Manufacture and sale of paperboard and packaging products
Mexico 100
Nettingsdorfer Papierfabrik AG & Co KGNettingsdorfer Straße 40,4053 Haid bei Ansfelden, Austria
Manufacture and sale of containerboard and holding company for Austrian operations which manufacture corrugated board
Austria 100
Smurfit International B.V.Warandelaan 2, 4904 PC Oosterhout, The Netherlands
Principal international holding company
The Netherlands 100
Smurfit Kappa B.V.Warandelaan 2, 4904 PC Oosterhout, The Netherlands
International holding company The Netherlands 100
Smurfit Kappa de Argentina, S.A.Paque Saenz Pena 308 – 8th Floor,Buenos Aires, Argentina
Manufacture and sale of paperboard and packaging products
Argentina 100
Smurfit Kappa Deutschland GmbHTilsiter Straße 144,22047 Hamburg, Germany
Holding company for German operations which manufacture and sell paperboard and packaging products
Germany 100
Smurfit Kappa Holdings Italia, S.p.A.Strada Serravalle 30,15067 Novi Ligure (AL), Italy
Holding company for Italian operations whose principal activities are the manufacture and sale of paperboard and packaging products
Italy 100
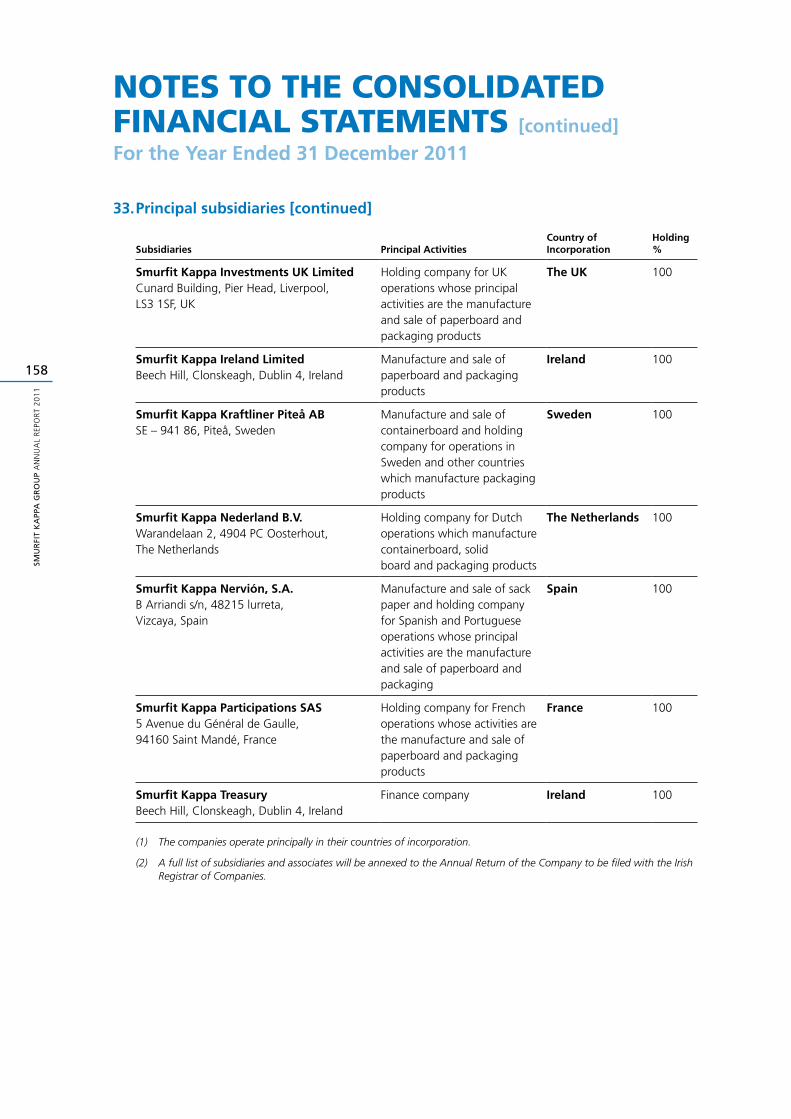
SMU
RFI
T K
APP
A G
RO
UP
AN
NU
AL
REP
OR
T 2
01
1
158
noteS to the ConSoliDateD finanCial StatementS [continued]
For the Year Ended 31 December 2011
33. Principal subsidiaries [continued]
Subsidiaries Principal ActivitiesCountry of Incorporation
Holding %
Smurfit Kappa Investments UK LimitedCunard Building, Pier Head, Liverpool, LS3 1SF, UK
Holding company for UK operations whose principal activities are the manufacture and sale of paperboard and packaging products
The UK 100
Smurfit Kappa Ireland LimitedBeech Hill, Clonskeagh, Dublin 4, Ireland
Manufacture and sale of paperboard and packaging products
Ireland 100
Smurfit Kappa Kraftliner Piteå ABSE – 941 86, Piteå, Sweden
Manufacture and sale of containerboard and holding company for operations in Sweden and other countries which manufacture packaging products
Sweden 100
Smurfit Kappa Nederland B.V.Warandelaan 2, 4904 PC Oosterhout, The Netherlands
Holding company for Dutch operations which manufacture containerboard, solidboard and packaging products
The Netherlands 100
Smurfit Kappa Nervión, S.A.B Arriandi s/n, 48215 lurreta,Vizcaya, Spain
Manufacture and sale of sack paper and holding company for Spanish and Portuguese operations whose principal activities are the manufacture and sale of paperboard and packaging
Spain 100
Smurfit Kappa Participations SAS5 Avenue du Général de Gaulle,94160 Saint Mandé, France
Holding company for French operations whose activities are the manufacture and sale of paperboard and packaging products
France 100
Smurfit Kappa TreasuryBeech Hill, Clonskeagh, Dublin 4, Ireland
Finance company Ireland 100
(1) The companies operate principally in their countries of incorporation.
(2) A full list of subsidiaries and associates will be annexed to the Annual Return of the Company to be filed with the Irish Registrar of Companies.
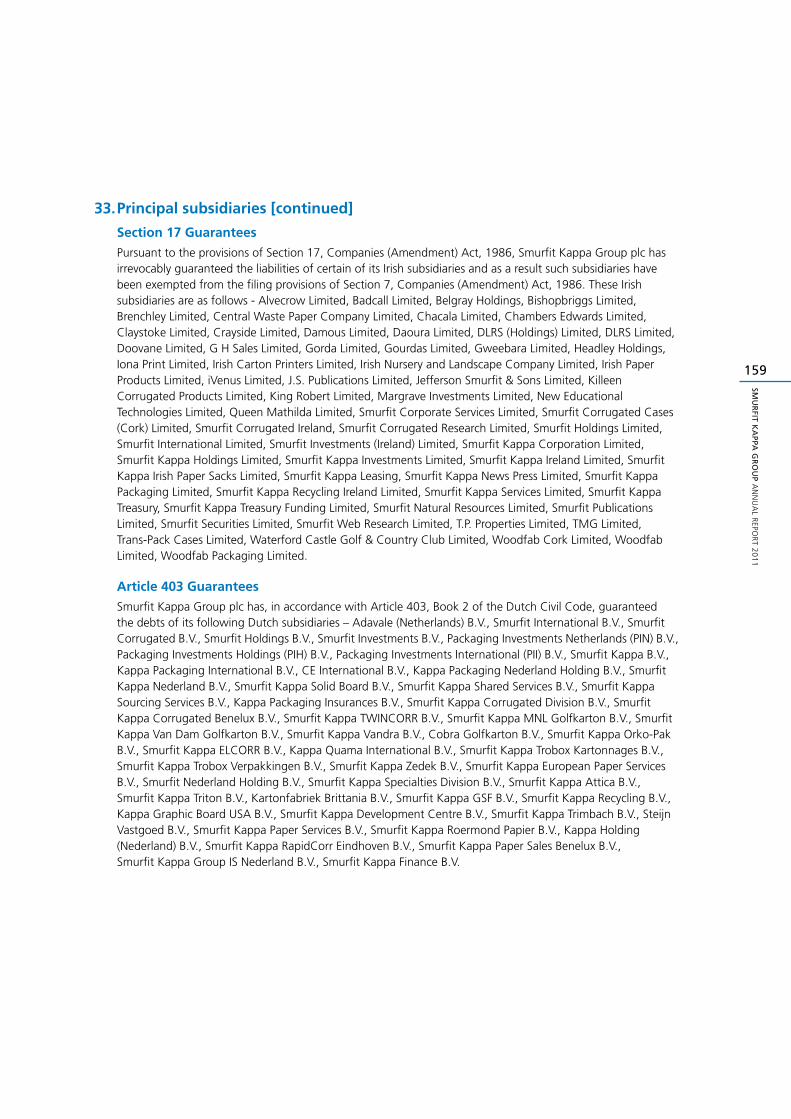
159
SMU
RFIT K
APPA
GR
OU
P A
NN
UA
L REPO
RT 2
01
1
33. Principal subsidiaries [continued]
Section 17 Guarantees
Pursuant to the provisions of Section 17, Companies (Amendment) Act, 1986, Smurfit Kappa Group plc has irrevocably guaranteed the liabilities of certain of its Irish subsidiaries and as a result such subsidiaries have been exempted from the filing provisions of Section 7, Companies (Amendment) Act, 1986. These Irish subsidiaries are as follows - Alvecrow Limited, Badcall Limited, Belgray Holdings, Bishopbriggs Limited, Brenchley Limited, Central Waste Paper Company Limited, Chacala Limited, Chambers Edwards Limited, Claystoke Limited, Crayside Limited, Damous Limited, Daoura Limited, DLRS (Holdings) Limited, DLRS Limited, Doovane Limited, G H Sales Limited, Gorda Limited, Gourdas Limited, Gweebara Limited, Headley Holdings, Iona Print Limited, Irish Carton Printers Limited, Irish Nursery and Landscape Company Limited, Irish Paper Products Limited, iVenus Limited, J.S. Publications Limited, Jefferson Smurfit & Sons Limited, Killeen Corrugated Products Limited, King Robert Limited, Margrave Investments Limited, New Educational Technologies Limited, Queen Mathilda Limited, Smurfit Corporate Services Limited, Smurfit Corrugated Cases (Cork) Limited, Smurfit Corrugated Ireland, Smurfit Corrugated Research Limited, Smurfit Holdings Limited, Smurfit International Limited, Smurfit Investments (Ireland) Limited, Smurfit Kappa Corporation Limited, Smurfit Kappa Holdings Limited, Smurfit Kappa Investments Limited, Smurfit Kappa Ireland Limited, Smurfit Kappa Irish Paper Sacks Limited, Smurfit Kappa Leasing, Smurfit Kappa News Press Limited, Smurfit Kappa Packaging Limited, Smurfit Kappa Recycling Ireland Limited, Smurfit Kappa Services Limited, Smurfit Kappa Treasury, Smurfit Kappa Treasury Funding Limited, Smurfit Natural Resources Limited, Smurfit Publications Limited, Smurfit Securities Limited, Smurfit Web Research Limited, T.P. Properties Limited, TMG Limited, Trans-Pack Cases Limited, Waterford Castle Golf & Country Club Limited, Woodfab Cork Limited, Woodfab Limited, Woodfab Packaging Limited.
Article 403 Guarantees
Smurfit Kappa Group plc has, in accordance with Article 403, Book 2 of the Dutch Civil Code, guaranteed the debts of its following Dutch subsidiaries – Adavale (Netherlands) B.V., Smurfit International B.V., Smurfit Corrugated B.V., Smurfit Holdings B.V., Smurfit Investments B.V., Packaging Investments Netherlands (PIN) B.V., Packaging Investments Holdings (PIH) B.V., Packaging Investments International (PII) B.V., Smurfit Kappa B.V., Kappa Packaging International B.V., CE International B.V., Kappa Packaging Nederland Holding B.V., Smurfit Kappa Nederland B.V., Smurfit Kappa Solid Board B.V., Smurfit Kappa Shared Services B.V., Smurfit Kappa Sourcing Services B.V., Kappa Packaging Insurances B.V., Smurfit Kappa Corrugated Division B.V., Smurfit Kappa Corrugated Benelux B.V., Smurfit Kappa TWINCORR B.V., Smurfit Kappa MNL Golfkarton B.V., Smurfit Kappa Van Dam Golfkarton B.V., Smurfit Kappa Vandra B.V., Cobra Golfkarton B.V., Smurfit Kappa Orko-Pak B.V., Smurfit Kappa ELCORR B.V., Kappa Quama International B.V., Smurfit Kappa Trobox Kartonnages B.V., Smurfit Kappa Trobox Verpakkingen B.V., Smurfit Kappa Zedek B.V., Smurfit Kappa European Paper Services B.V., Smurfit Nederland Holding B.V., Smurfit Kappa Specialties Division B.V., Smurfit Kappa Attica B.V., Smurfit Kappa Triton B.V., Kartonfabriek Brittania B.V., Smurfit Kappa GSF B.V., Smurfit Kappa Recycling B.V., Kappa Graphic Board USA B.V., Smurfit Kappa Development Centre B.V., Smurfit Kappa Trimbach B.V., Steijn Vastgoed B.V., Smurfit Kappa Paper Services B.V., Smurfit Kappa Roermond Papier B.V., Kappa Holding (Nederland) B.V., Smurfit Kappa RapidCorr Eindhoven B.V., Smurfit Kappa Paper Sales Benelux B.V., Smurfit Kappa Group IS Nederland B.V., Smurfit Kappa Finance B.V.
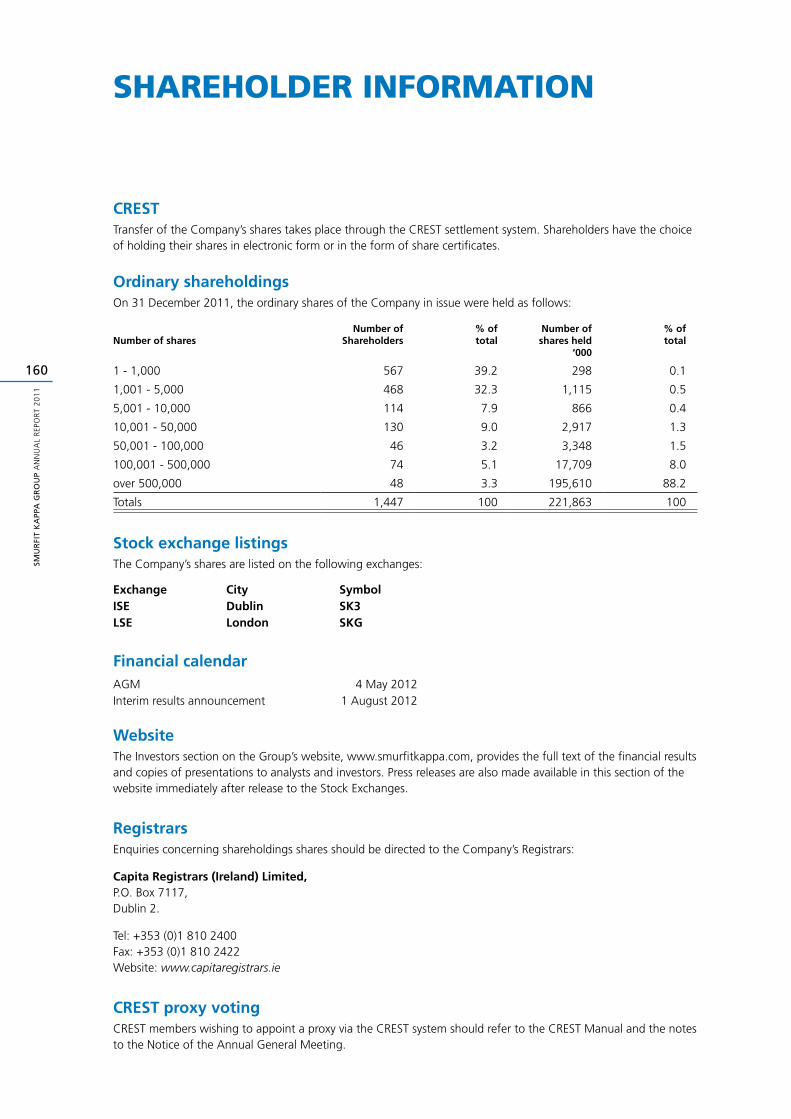
SMU
RFI
T K
APP
A G
RO
UP
AN
NU
AL
REP
OR
T 2
01
1
160
ShareholDer information
CRESTTransfer of the Company’s shares takes place through the CREST settlement system. Shareholders have the choice of holding their shares in electronic form or in the form of share certificates.
Ordinary shareholdingsOn 31 December 2011, the ordinary shares of the Company in issue were held as follows:
Number of shares
Number ofShareholders
% oftotal
Number ofshares held
‘000
% oftotal
1 - 1,000 567 39.2 298 0.1
1,001 - 5,000 468 32.3 1,115 0.5
5,001 - 10,000 114 7.9 866 0.4
10,001 - 50,000 130 9.0 2,917 1.3
50,001 - 100,000 46 3.2 3,348 1.5
100,001 - 500,000 74 5.1 17,709 8.0
over 500,000 48 3.3 195,610 88.2
Totals 1,447 100 221,863 100
Stock exchange listingsThe Company’s shares are listed on the following exchanges:
Exchange City SymbolISE Dublin SK3LSE London SKG
Financial calendar AGM 4 May 2012Interim results announcement 1 August 2012
WebsiteThe Investors section on the Group’s website, www.smurfitkappa.com, provides the full text of the financial results and copies of presentations to analysts and investors. Press releases are also made available in this section of the website immediately after release to the Stock Exchanges.
RegistrarsEnquiries concerning shareholdings shares should be directed to the Company’s Registrars:
Capita Registrars (Ireland) Limited, P.O. Box 7117, Dublin 2.
Tel: +353 (0)1 810 2400 Fax: +353 (0)1 810 2422 Website: www.capitaregistrars.ie
CREST proxy votingCREST members wishing to appoint a proxy via the CREST system should refer to the CREST Manual and the notes to the Notice of the Annual General Meeting.


