42
Annual report 2018

Annual report 2018

ABO Wind at a glance
Employees (excluding temporary staff and interns) 542
International orientation Project development in 16 countries and on 4 continents
Installed and commissioned so far 1,020 wind, solar and biogas plants with an output of around 2,400 megawatts
Climate Protection The installed plants avoid the emission of more than 2 million tons ofcarbon dioxide every year
Energy supply The plants produce around 3 million megawatt hours per year – theequivalent of the domestic electricity consumption of 2 million people
Portfolio of future projects Well over 6,500 megawatts worldwide – more than half of which is inan advanced stage of development
Annual project volume Around EUR 300 million
Turnover of the ABO Wind group 2018 EUR 150 million
Annual net profit of the ABO Wind group 2018 EUR 12.7 million
As of May 2019
Canada
Argentina
Colombia
South Africa
Tanzania
Finland
France
Spain
Ireland Germany
Poland
Hungary
NetherlandsUnited
Kingdom
Greece
Tunisia

1
2 Managing Board’s letter to the shareholders
4 ABO Wind AG group management report
20 Consolidated balance sheet
22 Consolidated income statement
23 Consolidated statement of changes in equity
24 Consolidated cash-flow statement
26 Group annex
35 Significant holdings of ABO Wind AG
36 Balance sheet ABO Wind AG
38 Profit and loss account ABO Wind AG
Content
Imprint
Publisher: ABO Wind AG, Unter den Eichen 7, 65195 Wiesbaden, www.abo-wind.com
Contact: Alexander Koffka, Public Relationsphone: +49 611 267 65-515, fax: +49 611 267 65-599, [email protected]
Design: Claudia Tollkühn Photographs: p.3: Ernst Wrba, p.12: Gabriele Röhle, Cover, p.6, p.13, p.14, p.15, p.25: Leon Tollkühn, p.10: Lentokuva Vallas Oy
Print: PRINT POOL GmbH, Taunusstein, printed on recycled paper with bio-paint, free of mineral oils

2
Managing Board’s letter to the shareholders
Wiesbaden, June 2019
Dear shareholders,
Globally, many markets are developing positively despite the contradictory signals that are emanating from the sector of renewable energies. In Germany, for example, setbacks must be overcome.
International energy transition
In many countries of the world, wind energy and photovoltaics have established as the most economical technologies for creating energy supply capacities. Argentina and Finland may not have a lot in common. The great importance of renewable energies in the energy transition process however connects Scandinavians with Latin Americans. Particularly pleasing: ABO Wind is present in both countries to help with the transition.
National setbacks
Globally, renewable energies are outpacing other sources. In Germany, which for a long time held the role of a forerunner, mistakes and missed opportunities characterise the situation. It was foreseeable for quite a while that Germany could not achieve the goal of a 40 per cent reduction of annual emissions of greenhouse gases by 2020 (relative to reference year 1990). Currently, the federal government is assuming that a 32 per cent reduction will be reached. Germany will therefore remain behind European Union guidelines. Double-digit penalties of billions of dollars paid to other European countries are pending if the climate protection policy does not get on track. At least, a coal commission has developed a plan for the long-term withdrawal of coal-based energy which is particularly environmentally harmful.
Taxing carbon dioxide
It is however frustrating that the federal government has until now failed to financially penalise the emission of climate-damaging gases. Scientists largely agree: This market-based instrument proven internationally (in Sweden, Switzerland and Great Britain) would significantly improve climate protection. The CO2 tax would replace existing taxes and fees that do not lead to a change in behaviour (EEC levy, energy tax, tax on heating oil and heating gas), and citizens and companies will overall not have to pay more than before. Those who act responsibly would profit - to the detriment of those who emit a particularly large amount of CO2 .
Lack of permits
In 2018 not even half as many new wind farms as in the previous year were connected to the grid in Germany. The sector is assuming a further reduction in 2019. In the meantime, politicians have corrected errors in the tender process. However, there is a flagrant lack of permits. In the first quarter of 2019 for example, wind parks with an output of 400 megawatts were approved. Tripling would be necessary in terms of energy policy. This figure would correspond to the level of the years 2014 to 2016. At that time, an average of more than 1000 megawatts were approved per quarter. A return to these conditions is urgently required. Otherwise, the goal fixed by the coalition agreement between the CDU, CSU and SPD of raising the share of renewable energies in electricity consumption from a current 38 per cent to 65 per cent by 2030 will not be achieved. This would require an annual increase of at least 4,500 megawatts wind energy.
Restrictions imposed by nature conservation authorities and air traffic control
The sector is not responsible for the slow trickle of wind park approvals and construction in Germany. More than 10,000 megawatts are stuck in the permit process. The procedures are becoming increasingly longer and much more complex. More and more projects are failing because conservationists, preservationists and the German air traffic control authority are blocking wind parks, sometimes without compelling reasons. Moreover, throughout the country, an insufficient amount of available space is being provided.
Political sluggishness
Politicians are now hesitantly beginning to remove obstacles to the expansion of renewable energies in Germany. It is to be hoped that the situation will soon improve and that significantly more wind farms will be connected to the grid by 2020. For some players, however, the expected improvements are too late. In recent months, turbine manufacturers such as Nordex, Enercon and Vestas have laid off hundreds of employees. Senvion filed for bankruptcy. The recess in the expansion of wind energy in Germany has also left its mark on the balance sheets of many project developers. It is therefore even more positive that ABO Wind is compensating the dent in the German market with successes in other countries.

3
Third-best result of ABO Wind’s history
For the third time in a row, ABO Wind has achieved a net profit in the double-digit millions in 2018. We reached our third-best result in the company’s history with EUR 12.7 million. Only in the years 2016 and 2017, when many positive effects came together, we were even more successful with surpluses of EUR 16.5 respectively 17 million.
Success in seven countries
Corporate success is broadly based given the increased international alignment in the past years and the expansion of the core business with solar park projects. The achieved diversification allows ABO Wind a continuity that is remarkable for the volatile business of project development. In 2018, the group was profitable in its domestic market Germany and six other countries, specifically Finland, Ireland, France, Spain, Argentina and the United Kingdom.
Significantly expanded project portfolio
Given the lack of concrete prospects of success, we abandoned project development in Iran in 2018. Nonetheless, we were successful in expanding our portfolio of worldwide projects in development. In each country in which we operate, we have secured a significant number of new projects and have driven their development forward. About every second new project uses solar power. The development of solar parks has become a second equivalent main area of business in addition to wind park development. We are currently working on wind and solar parks with a total output of 6,500 megawatts in 16 countries on four continents. Two comparative figures will help put things in perspective: From 1997 until today, ABO Wind connected 1,500 megawatts to the grid. The seven still active
German nuclear power plants have an overall output of 10,000 megawatts.
Favourable prospects, competent employees
As important as an extensive project pipeline may be for ongoing corporate success, even more important is the fact that we can rely on the skills and commitment of our 550 employees. They are the foundation for our confidence in maintaining our success in the long term as a developer of renewable energy projects - internationally and soon again in Germany.
Kind regards,
Dr. Jochen Ahn
Matthias Bockholt
Andreas Höllinger
Dr. Karsten Schlageter
The Managing Board of ABO Wind AG
Rödl & Partner completed its audit of the 2018 consolidated financial statements of ABO Wind AG on 8 May 2019 with the issue of an unqualified audit opinion. The complete audit opinion can be found on page 36ff. of the German version of the Annual Report.
Managing Board’s letter to the shareholders
The ABO Wind Managing Board (from the left to the right): Dr. Jochen Ahn, Andreas Höllinger, Dr. Karsten Schlageter and Matthias Bockholt.

4
Preliminary remark
This management report contains statements about the future. We would like to point out that actual events can deviate from the projections of expected trends.
1. Summary 2018
The ABO Wind group (ABO Wind) finished the financial year 2018 with an annual net profit of EUR 12.7 million (previous year: EUR 17.0 million). Total operating performance (sales plus changes in inventory and own work capitalized) amounted to EUR 149.9 million (previous year: EUR 176.3 million).
Like in the previous year, the consolidated figures include the business activities of 14 companies.
In line with expectations, the financial year 2018 did not trend as positively as the two prior record years. Nonetheless, the results achieved slightly exceeded the forecast.
In 2018, a pilot project of the most recent turbine generation and the construction of a wind park in a historical coal mining region stood out both technically and financially in the domestic market. For the first time, ABO Wind 2018 also sold a portfolio of German wind energy projects under development. The projects which are in various stages of development are scattered throughout Germany and consist of plants from different manufacturers. The eleven wind farms are being developed in collaboration with the investor.
The international business contributes to the good result in 2018 with project constructions in Finland, France and Ireland as well as project rights sales in Finland, France and Spain. As for the first time in 2017, ABO Wind generated more than half of its turnover (52 %) abroad. The successes in new business confirm the expectation that international activities will continue to account for the majority of business in the future. Especially in new national markets ABO Wind has secured new wind and solar projects with a volume of more than two gigawatts, thus laid a stable foundation for further successful financial years.
Despite a general skills shortage, advertised positions were well filled with competent personnel which will allow future challenges to be met. Overall, the group’s workforce grew by around eleven per cent in comparison to the previous year.
2. Foundations of the group
ABO Wind plans and constructs wind and solar farms in Germany, France, Spain, Ireland, Argentina, Finland, Greece, Hungary, the UK and Northern Ireland. The company also works on individual biogas projects exclusively within Germany, especially on the basis of waste fermentation. Moreover, ABO Wind has acquired new wind and solar projects in Canada, Colombia, South Africa, Tanzania and Tunisia. These newly acquired markets will be summarized in the current report since they have historically played a financially subordinate role for the group.
ABO Wind initiates projects, acquires sites, carries out all technical and commercial planning work, organises financing from international banks and constructs turnkey facilities on its own account as well as in cooperation with energy suppliers. Up to now, ABO Wind has connected wind turbines with a nominal output of about 1,500 megawatts to the grid. In addition to turnkey turbines, project rights for wind parks totalling around 800 megawatts have also been sold. Among the initial successes within the solar group was the construction of four small projects offering a total of 3 megawatts output. Much larger solar projects are in an advanced state of development within numerous national markets. ABO Wind also develops repowering concepts to make more effective use of tried and tested sites.
The technical and commercial management of ABO Wind manages the operating phase of wind farms, biogas and solar plants from the commissioning stage onwards. It ensures that the facilities in Germany, Finland, France and Iran produce the optimum amount of energy by means of modern monitoring systems and advanced services.
ABO Wind Service engineers provide maintenance, repairs, inspections, fault clearance services and replacement parts services throughout the entire operational phase.
ABO Wind is also working on special products for optimizing renewable energy plants. The first products ready for market are the access control system ABO Lock as well as Bat Link, a data interface for bat monitoring.
ABO Wind AG group management report 2018

5
3. Economic report
3.1 Global development of renewable energies
Worldwide investment in the energy sector is addressed in the World Energy Outlook 2018 produced by the international Energy Agency (IEA). Since 2010, more than half of the funds spent on new energy generation plants went into renewable energies, according to the report. Reduced costs have made investment attractive particularly in solar energy. A market analysis by Commerzbank confirms an internationally robust increase in renewable energies with a simultaneous reduction of production costs. The number of countries that use tenders to determine remuneration for energy from renewable sources rose from 64 in 2015 to 84 in 2017. Within the European Union, tenders have been mandatory since 2017.
According to the assessment of the Global Wind Energy Council (GWEC), 2018 was a positive year for global wind energy, although the increase (51.3 gigawatts) was four per cent less than in the previous year. Worldwide, 591 gigawatts of wind energy are connected to the grid. Since 2014, more than 50 gigawatts of power have been added annually. The same figure is expected by the GWEC for the coming years. Growth will come from new wind markets in Africa, the Middle East, Latin America and Southeast Asia. In 2018, these markets contributed ten per cent to the global expansion of wind energy. The greatest rate of increase internationally was again in China with 21.2 gigawatts and the United States with 7.6 gigawatts.
The analysts of the Fitch Group anticipate marked growth in the photovoltaics market. Installed output will rise from around 400 gigawatts (as of the end of 2017) to 942 gigawatts by the end of 2027.
3.1.1 Europe
New power plants were connected to the grid in the European Union in 2018 with a nominal output of 20.7 gigawatts. As has been the case for many years, wind energy remained the most strongly expanding technology with 10.1 gigawatts (49 per cent). Solar grew by 8 gigawatts (39 per cent), and biomass by 1.1 gigawatts (5 per cent). 95 per cent of recently installed capacity uses renewable energies. Gas power plants (0.8 gigawatts) increased the most among fossil energy sources. 0.2 gigawatts of coal power were added to the grid.
The dominance of renewable energies remains uninterrupted. Nonetheless, the rate of increase of wind energy was significantly less than in recent years. In comparison to the record year of 2017, the amount of new wind energy connected to the grid fell by one third. With an overall output of 178.8 gigawatts throughout Europe by the end of 2018, wind energy
remains the second most popular source of energy. Only the collective gas power plants linked to the grid deliver a higher nominal output.
The new installation of power plants within the EU is comfortably dominated by renewable energies. As in the past years, more fossil fuel power plants were disconnected from the grid than added. Existing power sources are therefore trending toward renewables.
WindEurope believes that the more sluggish expansion of wind energy in 2018 is because many European countries are switching from a remuneration system to the tendering process. The new environment for permits and project development has led to delays in many locations. The United Kingdom has withdrawn its remuneration regulation for onshore wind energy. Countryside installations have therefore taken a significant nosedive.
Over the last year, wind energy covered 14 per cent of the energy demand of EU citizens. This was two per cent more than in the previous year. The percentage was particularly high in Denmark where wind energy covers 41 per cent of demand, followed by Ireland (28 per cent). In Germany, the share of wind energy was 21 per cent. Even though only half as much wind energy was fed to the grid in Germany in 2018 than in the previous year, Germany nonetheless maintained its position as the most important wind market. 29 per cent of new European wind capacity was generated in Germany in 2018 (as compared to 39 per cent last year). Given the extensive use of wind energy on the high seas, the United Kingdom represents the second most important market with a share of 16 per cent, outpacing France (13 per cent) and Sweden (6 per cent). These four countries together constitute about two thirds of the expansion of wind energy within the European Union.
Beyond the legally guaranteed feed-in tariffs for renewable energies, private contracts between plant operators and large-scale consumers are gaining in importance. Throughout Europe, power supply contracts for 1500 megawatts of wind energy were concluded in 2018. Most of these agreements were for wind parks in Scandinavia; however projects in countries such as Germany or Poland are increasingly taking advantage of this option to establish a financial basis for renewable energy plants beyond the state regulated tariffs. For example in February 2019, an energy supplier reported concluding a power purchase agreement for a solar park in Germany with an output of 85 megawatts.
The size and type of wind turbines installed in Europe over 2018 differed widely in the individual countries. In Norway, the most powerful wind turbines in the country with an average output of 3.6 megawatts were connected to the grid. In Lithuania and Greece, the average rated output of 2 megawatts was the lowest. The weighted average onshore turbine size was 2.7 megawatts.
ABO Wind AG group management report 2018

6
3.1.1.1 Germany
The expansion of wind energy was more sluggish in 2018 than in recent years. 743 turbines with a nominal output of 2,402 megawatts were connected to the grid. This expansion was 55 per cent less than in 2017. In a joint press statement, the German Wind Energy Association (BWE) and German Engineering Federation (VDMA) complained that too few new wind parks had been approved, and that a “permit jam” exists in the federal states. The two organisations anticipated an even slower expansion of “around 2000 megawatts” for 2019. This reduction would endanger the leading position of the German wind industry among international competitors and pose major challenges for the sector. This is not obscured by the fact that Germany remains the largest market for land-based wind energy in Europe.
The lack of permits for building new wind parks is a dead weight on the resolution drafted in October 2018 by the CDU and SPD parliamentary parties to accelerate the expansion of renewable energies. Additional special tenders exist beyond the tenders provided in the Renewable Energy Act (EEG) for wind and solar facilities. Currently, the share of eco-power in Germany is about 36 per cent; the grand coalition envisions a share of 65 per cent in 2030. The associated permits to build new projects are needed for the approved special invitations
to tender to yield further expansion. In early 2019, an inner-coalition working group formed with the aim of increasing the acceptance of renewable energies expansion in Germany in order to reach the 65 per cent goal.
Within Germany, more than 2.8 gigawatts of new solar energy were installed overall in 2018. In comparison with 2017, this corresponds to growth of nearly 1.2 gigawatts and thus an increase in expansion by nearly 70 per cent. For the first time since the amendment of the Renewable Energy Act passed in 2014, the annual increase of at least 2.5 gigawatts specified in the act was reached.
ABO Wind AG group management report 2018
The construction experts of ABO Wind build stable foundations for wind turbines even under difficult conditions. They proved this during the construction of the Forst Briesnig wind farm on a former coal mining site in the german Lausitz region.
7
ABO Wind AG group management report 2018
3.1.1.2 France
France is the most attractive market for investing in renewable energies according to “Allianz Klima- und Energiemonitor 2018”. The monitor compares investment conditions in an emission-free energy infrastructure within the 19 most important industrial and emerging countries. Nonetheless, the expansion of wind energy was slightly less in France in 2018 than in the previous year. 1,565 megawatts went online following 1,692 megawatts in 2017. Since the decrease was stronger on a Europe-wide basis, France’s share in the European expansion of wind energy increased from 10 to 13 per cent. Overall, around 15,100 megawatts of wind energy was installed in France by the end of 2018.
France has therefore satisfied the expansion goal set forth in the multiyear program plan for energy (Programmation pluriannuelle de l’énergie, PPE) of achieving overall installed output for onshore wind energy of at least 15,000 megawatts by 2018. Power generation from wind energy reached 26.1 terawatt hours in 2018, corresponding to 5.5 per cent of overall power consumption. Approximately half of the wind energy installed in France is located in the Hauts-de-France region (4.0 gigawatts) and the Grand Est region (3.4 gigawatts).
The photovoltaic output installed in France equalled approximately 9,000 megawatts in 2018. Over the course of the year, facilities with an output of 862 megawatts were connected to the grid. In the previous year, a similarly high overall output (882 megawatts) was connected. 9.2 terawatt hours of power from solar energy (two per cent of overall French power consumption) was generated in 2018. The expansion of photovoltaics remained concentrated in the south of France.
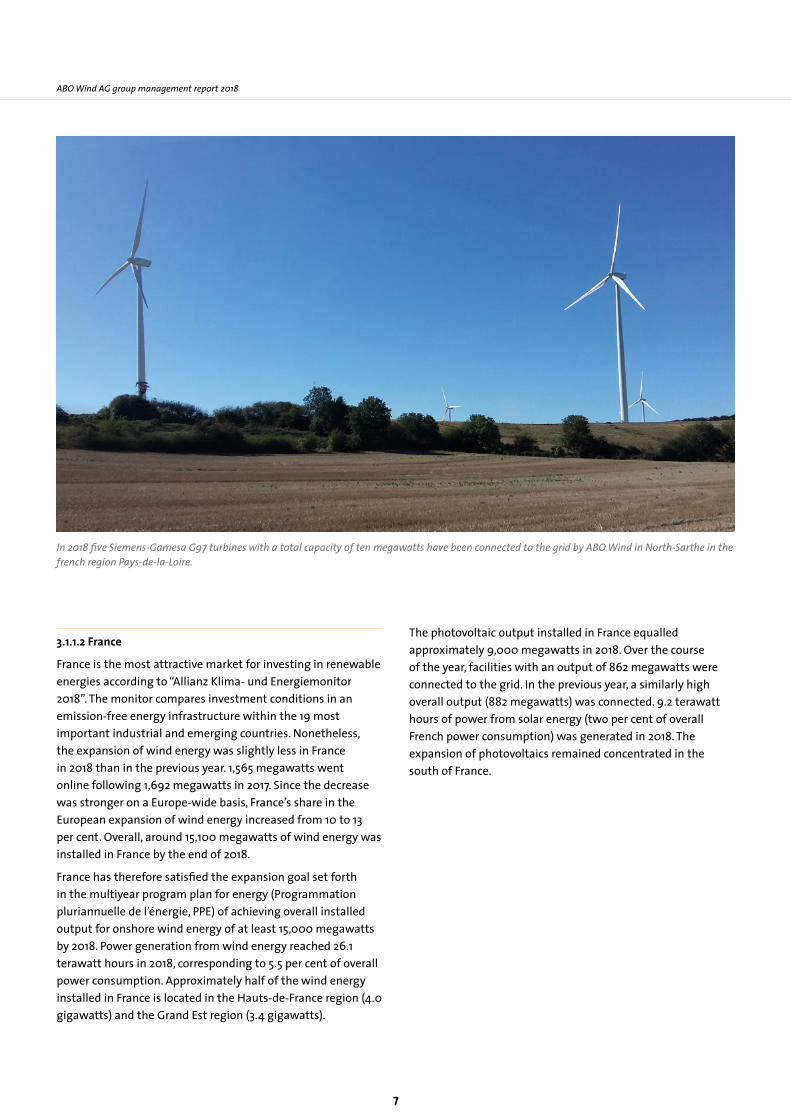
In 2018 five Siemens-Gamesa G97 turbines with a total capacity of ten megawatts have been connected to the grid by ABO Wind in North-Sarthe in the french region Pays-de-la-Loire.

8
ABO Wind AG group management report 2018
3.1.1.3 United Kingdom
In the motherland of coal-based power, coal no longer plays a role. During the Victorian era, coal fuelled Great Britain’s ascent to becoming a leading industrial nation. The first coal power plant in the world went online on January 12, 1882 in London. 135 years later, the grid operator reported that, for the first time, not a single kilowatt hour of coal power was fed into the grid during a day. The reason behind this was the minimum price of carbon dioxide emissions introduced in 2013 which rendered the operation of coal power plants increasingly uneconomical. The most important source of power generation is currently natural gas which commands a share of 39 per cent. Wind energy at 17 per cent comes in third following nuclear energy. Over the coming years, nuclear power will probably be overtaken. Coal plays a subordinate role at 5 per cent of energy production within the United Kingdom. By 2025, the last coal power plants are scheduled to be shut down. The United Kingdom is the world’s leader of wind energy on the high seas with 7,000 megawatts of installed capacity. Government plans envision additional contracts awarded on the basis of competitive tariffs for offshore wind energy. The conditions for land-based wind energy are currently less favourable. These projects must generally rely on power purchase contracts under private law for refinancing.
3.1.1.4 Spain
For a great while, Spain was the forerunner in the use of wind and sun for climate-friendly power production. However, in a reaction to an economic crisis, the government in 2012 suddenly undercut the expansion of renewable energies. Years of stagnation ensued. Since 2017, the new government has been attempting a revitalization of the sector which is currently underway. In the past two years, Spain issued tariffs for new wind and solar projects comprising several thousand megawatts in numerous calls to tender.
Most projects launched since 2017 are however still not online and therefore do not contribute to power production. Especially thanks to the solar and wind energy projects implemented before 2012, the share of renewable energies in the primary energy consumption of Spain was 16 per cent by the end of 2017. The delayed upswing in the renewable energy market is a reflection of the new installations. Accordingly, only 49 megawatts of wind energy were connected to the grid in 2016; 96 megawatts were connected in 2017, and 392 megawatts were connected in 2018. Indeed, the rate of increase in the expansion is considerable. Nonetheless, Spain remains in the European midfield with its level reached in 2018. Italy, Sweden, Turkey or Norway connected more wind energy to the grid in 2018. In the projected development scenario over the coming years, the branch association WindEurope anticipates that Spain will play a similarly major role in renewables as before 2012. Between 2018 and 2022, the association believes that Spain will connect 7,200 megawatts of onshore wind energy to the grid. In Europe, the association feels that only Germany and France will experience a greater number of new installations.
The Spanish solar market is also reinvigorated and has favourable prospects. Photovoltaic facilities with a 262 megawatt output went online in 2018. This corresponds to an increase of 94 per cent as compared to 2017. By 2022, the association SolarPower Europe forecasts an additional expansion of photovoltaics of 8,800 megawatts in Spain.
The great importance that Spain currently ascribes to renewable energies was underscored by King Filipe VI in April 2019 at a wind energy conference in Bilbao. Spain has the greatest potential for exploiting renewable energies within Europe, the head of state asserted.

9
3.1.1.5 Republic of Ireland
The Irish nation no longer wishes to have anything to do with the financing of fossil energies. In July 2018, the Parliament in Dublin ratified a law that commits the 8 billion euros state fund (Irish Strategic Investment Fund) to abandon its investments in coal, oil and gas over the next five years. This affects the 318 million euros distributed to 150 companies throughout the world in June 2017.
In 2018, only 193 megawatts of wind energy went online in the Republic of Ireland. In the year before that, the expansion was more than twice as large. The goal of satisfying 32 per cent of the national power demand with wind energy by 2020 is considered achievable. The goal of covering 16 per cent of the overall Irish gross energy demand from renewable sources appears less feasible. In 2016, the contribution was only 10 per cent. The share of fossil fuels in the provision of overall primary energy even rose in light of the positive economy. Nonetheless, the conditions in Ireland are favourable for producing much more wind energy in the future given the outstanding wind conditions and numerous potentially suitable sites. The government will submit new calls to tender for remuneration in 2019.
The responsible authority, SEAI (Sustainable Energy Authority of Ireland), estimates that the overall potential capacity for wind energy in 2050 is 46 gigawatts in the Republic of Ireland. Of this, 16 gigawatts are onshore wind farms, and 30 gigawatts are offshore. By the end of 2018, around 3.6 gigawatts of onshore wind energy were online in Ireland.
ABO Wind AG group management report 2018
The Cappawhite B wind farm, built in 2018 in County Tipperary, Ireland was the fifth wind farm to be connected to the grid by ABO Wind on the green island - and the first with Vestas turbines.

10
3.1.1.6 Finland
Within a few years, Finland connected 2,000 megawatts of wind energy to the grid with a fixed feed-in tariff. The country plans to allocate additional tariffs for renewable energy facilities in open-technology calls to tender. The 2030 National Energy and Climate Strategy provides increasing the share of renewable energies in final energy consumption to more than 50 per cent by 2030.
Dynamics within the wind sector are also leading to increased demand by large power consumers such as Google or Facebook which are committing to energy from wind turbines in long-term contracts. This also provides a sound financial basis for projects without a national feed-in tariff. For example WindEurope anticipates that between 2018 and 2022, a total of 2.3 gigawatts of wind energy will come online in Finland, which would be more than double the previously installed wind energy output.
3.1.1.7 Greece
The natural conditions of Greece are ideal for the exploitation of renewable energies. The government seeks to put this potential to better use and published a draft of a national energy and climate plan in early 2019. The plan provides raising the share of renewable energy sources in power generation to 55 per cent by 2030. In 2017, it stood at 27 per cent. Coal and gas contribute 31 and 30 per cent. In 2018, Greece allocated tariffs for new wind and solar parks through calls to tender for the first time.
In 2018 in Greece, wind farms with a nominal output of 207 megawatts were connected to the grid. Overall, 2,844 megawatts were installed by the year’s end. Over the period from 2018 to 2022, the sector association WindEurope anticipates a total increase of 1,500 megawatts of wind energy.
According to the plan of the Greek Energy Regulator, separate calls to tender will be awarded annually up to 2020 for photovoltaic and wind energy facilities as well as a joint call to tender for both technologies. A joint call to tender for 400 megawatts of wind energy with a nominal output of more than 50 megawatts and photovoltaic facilities with a nominal output of 20 megawatts which was planned for 2018 was postponed to 2019.
ABO Wind AG group management report 2018
Since entering the market in 2013, ABO Wind has connected 92 megawatts of wind power to the grid in Finland and has also sold several projects ready for construction. In 2018, the Finnish activities made again a significant contribution to the company‘s success. The photo shows Haapajärvi, this wind farm is now operated by ABO Invest.

11
ABO Wind AG group management report 2018
SolarPower Europe forecasts that around 1,600 megawatts will be added between 2018 and 2022 to the approximately 2,600 megawatts of photovoltaic output which were on the grid in Greece at the end of 2017.
3.1.1.8 Hungary
Hungary is among the smaller European markets for the renewable energy sector. Wind energy is not politically favoured and currently does not play any significant role. Only 329 megawatts are online. No new facility was erected in 2018. In the forecast for the European solar market by the sector association SolarPower Europe, Hungary was not cited as an independent market. The anticipated expansion is summarized in the category “Rest of Europe”. Currently according to the estimation of the European Commission, the share of renewable energies in Hungary’s power generation is approximately 10 per cent. To achieve the goal of reaching at least 15 per cent of power generation from renewable energy sources by 2020, the government is counting on biomass and solar energy. Developers are particularly interested in projects greater than one megawatt that were planned and approved according to the old support scheme (KÁT) valid up to end of 2016, although some of them are still pending. For projects that did not secure the old tariff, new rules have been in effect since 2017: Power will no longer be purchased at a fixed price. Solar energy will instead be sold to the market, a “green premium” will be paid, and the guaranteed term is now reduced to 13 years.
3.1.2 Argentina
Argentina possesses major, largely unexploited potential in renewable primary energy sources such as solar and wind energy. Petroleum and natural gas represent the largest share of Argentinian primary energy generation. Renewable energies currently cover about two per cent of power demand. It is the goal of the government to raise the share to 20 percent by 2025, especially by expanding solar and wind energy capacity. Since 2016, expansion has gained momentum. In 2018, 494 megawatts of wind energy were connected to the grid. Accordingly, Argentina is one of the largest wind energy markets in the American continents. The government announced additional contracts awarded on competitive rates for 2019. According to the global wind energy association GWEC, 63 wind parks with 3,700 megawatts of output went online over the past three years. US $5 billion were invested. The Global Wind Energy Council foresees additional stimulation of growth in Latin America from the expansion of production capacity by facility manufacturers. Investments by Vestas and Nordex in Argentina confirm the long-term potential of this market.
3.2 Business Performance
ABO Wind covers the entire value added chain in the development of wind farms and solar plants – from site acquisition to turnkey construction. The company’s own specialists carry out the vast majority of planning and organisational work.
Besides financial performance indicators such as sales and annual profits, for measuring the economic success ABO Wind uses important milestones to be achieved during project preparation as well as inventories of projects and service contracts as non-financial output indicators.
The important non-financial performance indicators include primarily the number of new projects, the order book of projects in development and construction – the so-called project pipeline – as well as the successfully completed project developments and construction in the financial year.
Further information on business process can be taken from the volumes of agreed project financing and sales, the scope of service activities as well as growth of employee numbers.
The indicators developed as follows in the financial year 2018 and the first quarter of 2019:
3.2.1 New projects
In last year’s annual report, an annual new business unit allocation of 500 megawatts across Europe for all technologies was predicted for the period of 2018 to 2020. In addition, significant new business was forecast for markets outside of Europe. As a point of fact, ABO Wind acquired new projects amounting to about 510 megawatts in financial year 2018 in Europe. Outside of Europe, projects totalling 2,200 megawatts were secured, of which about two thirds were wind projects and one third were solar.
In the first quarter of 2019, new projects equalling 920 megawatts involving various technologies were secured across the group – 660 megawatts of which in Europe.
3.2.2 Project pipeline
As of December 31, 2018, the pipeline for wind energy projects in development comprised about 4,500 megawatts, of which 1,000 megawatts are in Germany, 700 megawatts in France, 600 megawatts in Finland and 500 megawatts in Spain, as well as 300 megawatts in Ireland, Northern Ireland and Scotland. Outside of Europe at the turn of the new year, 900 megawatts were in development in Argentina, and a total of about 500 megawatts were in development in international markets.
12
In all, there were other solar projects with around 1,200 megawatts under development on the key date. These are mainly allocated between Argentina, Greece, Spain and South Africa.
The scope of projects under construction as of December 31, 2018 was 40 megawatts from one project respectively in France, Ireland and Hungary.
3.2.3 Project implementations
The period allocation of project implementations is based on the transfer of risk of the services rendered in accordance with the realisation principle under commercial law. Planning or technical milestones such as the infeed of the first kilowatt hour (technical commissioning) can differ from the scheduled project timeline.
3.2.3.1 Sale of portfolios and individual project rights
In financial year 2018, the rights to 14 projects in different development stages were sold. Some of the projects were bundled together in one portfolio and sold to one investor.
The 14 projects are 10 German projects comprising 182 megawatts, three Spanish projects totalling 113 megawatts and
a Finnish project of 50 megawatts.
Typically, the agreements with buyers provide for continued collaboration with ABO Wind in order to see the projects through to the construction phase and for actual installation and commissioning (see Section 3.2.5.2).
In the first quarter of 2019, project rights were sold for a Finnish project, two Spanish projects and eight French projects coming to a grand total of 317 megawatts.
3.2.3.2 Completed project developments
In the 2017 annual report, concluded project developments were forecast for 2018 to 2020 for an average of 250 megawatts.
The German market made the biggest contribution to the successful completion of project developments in financial year 2018 with six wind energy projects totalling 64 megawatts. An Irish project in development for 11 megawatts was also successfully concluded in 2018. In the solar sector, development of four smaller German projects that jointly total three megawatts were completed in 2018.
The total from project developments (around 80 megawatts) and sales of individual project rights and portfolios (about 350 megawatts) clearly exceeded the projection of finalising
ABO Wind AG group management report 2018
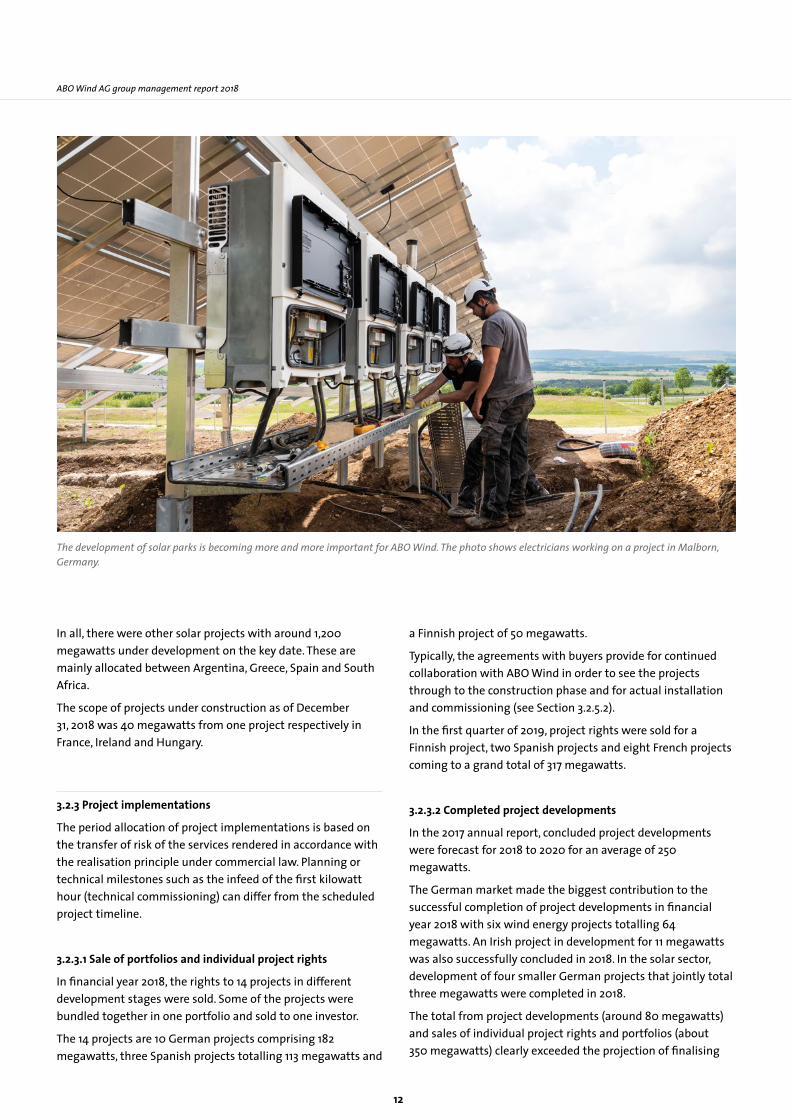
The development of solar parks is becoming more and more important for ABO Wind. The photo shows electricians working on a project in Malborn, Germany.

13
projects totalling a yearly average of 250 megawatts. Since an unfinished project that is sold naturally yields less profit per megawatt than a wind or solar farm that is fully developed, the overall business for this segment can be considered on target.
In the first quarter of 2019, a solar project of seven megawatts was successfully completed.
3.2.3.3 Completed project construction
In the 2017 annual report, completed projects were forecast for 2018 to 2020 for an average of 160 megawatts.
In fact, wind turbines with a nominal output of 104 megawatts were finalised in financial year 2018. The constructed wind farms were located in four countries: 49 megawatts in Germany, 27 megawatts in Finland and 14 megawatts in France and Ireland each. Financially, the constructed projects were more successful than anticipated at the beginning of the financial year.
In the solar sector, plants with two megawatts were constructed in the financial year 2018.
In the first quarter of 2019, a wind farm of 14 megawatts was finalised.
3.2.4 Project financing and turnkey sales
In 2018, long-term credit agreements totalling around EUR 45 million were arranged for approximately 29 megawatts. Of this, around 18 megawatts are German projects with a total credit volume of EUR 26 million. Parallel to obtaining project financing, turnkey projects of 92 megawatts were sold to investors in 2018.
In the first quarter of 2019, no project financing agreements were concluded. One project of nine megawatts was sold.
ABO Wind AG group management report 2018
In 2018, ABO Wind completed the modernisation of the biogas plant in Ramstein, Germany and installed solar modules on the site to cover part of the electricity needs.

14
ABO Wind AG group management report 2018
3.2.5 Service activities
3.2.5.1 Operations management and service
As of March 31, 2019, ABO Wind is managing 119 wind energy projects with 515 wind turbines totalling 1,251 megawatts distributed among Germany (899 megawatts), France (172 megawatts), Finland (97 megawatts), and Ireland (70 megawatts). In addition, five small plants in the new business area of solar are managed, of which four are in Germany and one in Iran. For around 160 wind turbines with different output levels, servicing is provided ranging from basic servicing to a full maintenance contract.
3.2.5.2 Portfolio and project rights management
For sold projects totalling 698 megawatts – of which around 401 megawatts from portfolio sales – ABO Wind per March 31, 2019, is working on behalf of the purchasers as a service provider to obtain outstanding rights and contracts or in connection with the construction of the projects.
3.2.6 Personnel development
The average number of employees at ABO Wind increased in the calendar year from 518 to 573.
3.3 Turnover and Profit
The overall profit of EUR 149.9 million noted at the onset for financial year 2018 comprises EUR 150.2 million from sales revenue, EUR 0.6 million from the decreased inventory of finished and unfinished products, and EUR 0.3 million from “Other own work capitalised”. Turnover is comprised of EUR 34.3 million from planning services and EUR 105.7 million from the construction of projects and sale of rights. ABO Wind generated EUR 10.4 million of sales from its service activities.
The materials ratio of around 47 per cent (financial year 2017: 56 per cent) is mainly due to a lower proportion of material-intensive construction services in the overall performance. The personnel expenditure amounting to EUR 36.3 million (previous year: EUR 32.0 million) include a special payment to employees.
Depreciations amounting to EUR 10.2 million (previous year: EUR12.8 million) are divided among EUR 1.4 million of scheduled amortisation on fixed assets, depreciation of a
Construction of the foundation for the Wennerstorf wind farm in Germany: In this repowering project, four older turbines were replaced by two modern ones. With the two 4.5 megawatt Nordex N149 generators, the new wind farm produces three times as much electricity as its predecessor.

15
German cable line amounting to EUR 0.2 million, and EUR 8.6 million of individual value adjustments for projects in development for which there is no longer a realistic possibility of realisation. Categorised by country, EUR 3.4 million are attributable to German projects, EUR 3.2 million to Iranian projects, EUR 1.1 million to French projects, EUR 0.7 million to projects in the United Kingdom and EUR 0.1 million to an Irish project.
The value adjustments for country risks were elevated in comparison to the previous year by EUR 0.2 million. The primary reason is the growing project business in Argentina. In absolute values, the increased Argentinian project volume has led to higher risk discounts. The overall value adjustments for country risk amount to EUR 2.1 million.
The net interest income of EUR 1.6 million (previous year: EUR 1.5 million) shows a slight increase in expenses compared to the previous year.
Overall, in the financial year 2018, the company reported encouraging results as expected from regular business activities of EUR 21.3 million (previous year: EUR 23.5 million) and an annual net profit of EUR 12.7 million (previous year: EUR 17.0 million).
3.4 Financial and assets situation
Fixed assets currently total EUR 10.0 million, of which tangible and financial assets comprise the major share. The share of intangible assets (EUR 0.9 million) grew slightly as a result of greater investments in IT systems.
Of the EUR 81.9 million of work in progress carried on the balance sheet, around EUR 10.6 million was attributable to projects under construction as on the balance sheet date of December 31, 2018.
Received payments for orders which were deducted from inventories in the amount of EUR 14.1 million included no advance payments. This includes only Installment payments, which cover the costs of services rendered or deliveries made and do not indicate or are payback obligations.
Of the receivables from affiliated companies totalling EUR 58.4 million (previous year: EUR 35.6 million), EUR 40.7 million are for a single German project. The project was quickly converted to the company’s own account and successfully started up in 2018 without any delay. The financing and sale of the project is envisioned for the second quarter of 2019. Another EUR 4.5 million are for a German project which had not been sold by December 31, 2018 but was financed in 2018 and successfully started up. The remaining amount relates almost exclusively
ABO Wind AG group management report 2018
In Hadamar, Germany, the Power Plant Management of ABO Wind has a hall to stock components. This ensures that the turbines we maintain are repaired quickly in the event of damage.

16
ABO Wind AG group management report 2018
to projects being developed and non-consolidated foreign subsidiaries of ABO Wind AG, which use these funds to provide interim financing for project costs. EUR 1.0 million of receivables from affiliated companies were received in the first quarter of 2019.
Shares in affiliated companies included in current assets have increased by EUR 6.6 million to EUR 14.1 million. This is mainly due to the acquisition of holdings in projects in Germany, Greece, Ireland and Hungary.
Under current assets, the item ‘Liquid assets’ includes shares in ABO Invest AG with a value of EUR 3.2 million and shares in ABO Kraft und Wärme AG with a value of EUR 1.5 million.
At 46 per cent, the equity ratio without mezzanine resources remains stable on the level of the two prior years. The equity ratio including mezzanine resources decreased slightly from 54 to 53 per cent.
ABO Wind AG issued convertible bonds according to the securities prospectus approved since April 2018 by the German Federal Financial Supervision Authority (Bafin). An individual bond costs EUR 15 and can be converted into a share of ABO Wind AG in October 2019. As on December 31, 2018, convertible bonds valuing EUR 8.8 million had been issued.
In terms of debt capital, EUR 12.0 million amortization loans with a term of five years were drawn down. Amortization loans were agreed for another EUR 12.0 million which were fully drawn down in the first quarter of 2019 and also have a term of five years. Credit lines and guarantees were extended by a total of EUR 16.9 million in the financial year 2018.
Given the high influx of liquidity at the year’s end, as in previous years, liabilities from banks remained low in financial year 2018. As on December 31, 2018, they exclusively consisted of low-interest repayment funds. The unused credit lines and guarantees of ABO Wind AG amounted to EUR 38.9 million as of December 31, 2018.
Liquid assets, defined as cash in hand and bank balances, were recorded at EUR 4.5 million as of December 31, 2018, around EUR 27.8 million lower than in the previous year.
Liquid assets were mainly used for operational activities. The cash flow statement shows a negative cash flow for operational business activities to the amount of EUR 28.1 million in the financial year 2018. The two greatest factors are the further expansion of the project pipeline as witnessed by the increase in inventories, and receivables from realized projects for which payment will be received in 2019.
Other liquid assets were used for investments in fixed assets. After netting, the cash flow from investment activities comprises outflows to the amount of EUR 3.2 million.
The cash flow from financing activities in 2018 results from the assumption of new loans and the issued bond minus capital services for borrowed funds and minus dividend distributions.
This yields an inflow to the amount of EUR 3.7 million from financing activities.
The limits agreed with credit institutions, which relate to selected key financial indicators – so-called covenants – were all complied with in the reporting period.
4. Remuneration report
The remuneration report includes a summary of the principles which are used to determine the total remuneration for the members of the Managing Board at ABO Wind AG. It also describes the structure and amount of remuneration for the members of the Managing Board. Furthermore, the principles and amount of remuneration for the members of the Supervisory Board are also detailed.
4.1 Main features of the remuneration system for the Managing Board
The total remuneration of the Managing Board is made up of a fixed basic salary, a profit-based bonus and other benefits and takes into account the respective level of responsibility of each member of the Managing Board. The structure of the remuneration system for the Managing Board is discussed by the Supervisory Board and scrutinised on a regular basis. The fixed basic salary is paid as a remuneration component which is not performance related on a monthly basis. The profit-based bonus is calculated according to the profit of the company and is paid out after being determined in the consolidated financial statements of ABO Wind AG. Entitlement to the profit-based bonus is regulated in a standardised fashion in the contracts for the Managing Board. The annual profit-based bonus entitlement is limited to a maximum amount. A negative business performance results in the complete loss of entitlement to the profit-based bonus. The minimum remuneration from the profit-based bonus is therefore EUR 0. In addition to the fixed basic salary and the profit-based bonus, the members of the Managing Board receive additional benefits in the form of benefits in kind.
17
ABO Wind AG group management report 2018
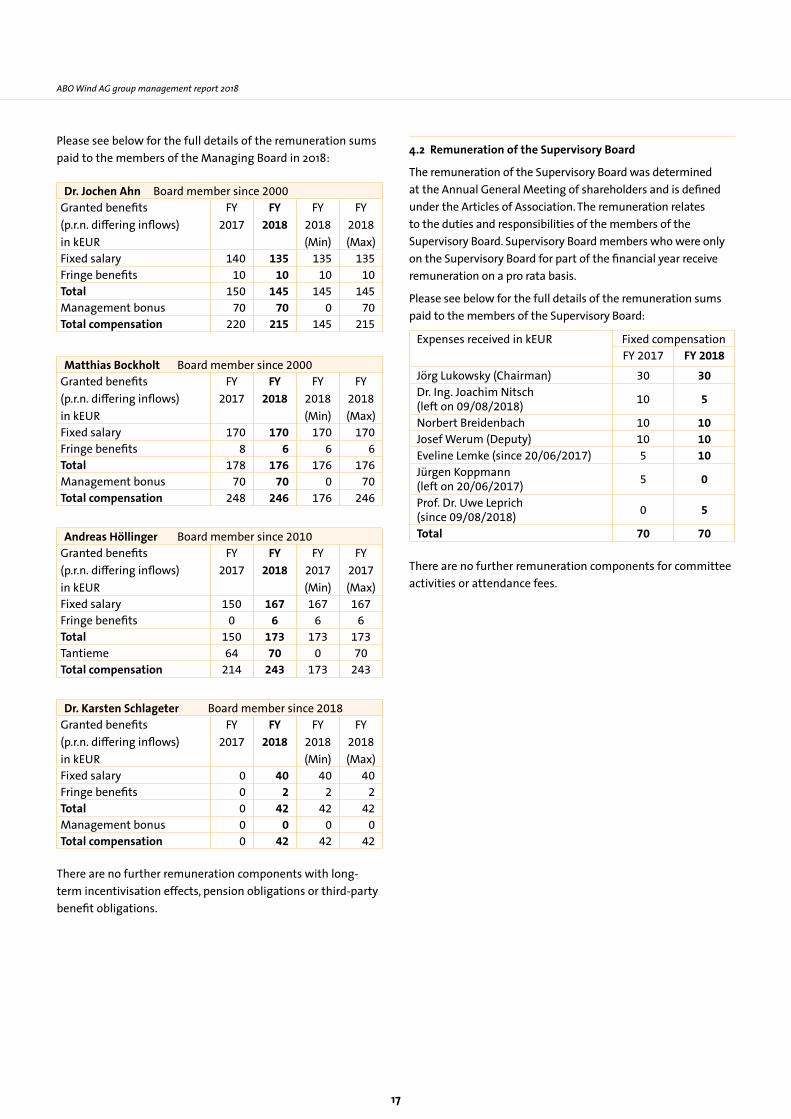
Please see below for the full details of the remuneration sums paid to the members of the Managing Board in 2018:
Dr. Jochen Ahn Board member since 2000Granted benefits(p.r.n. differing inflows)in kEUR
FY 2017
FY 2018
FY 2018 (Min)
FY 2018 (Max)
Fixed salary 140 135 135 135Fringe benefits 10 10 10 10Total 150 145 145 145Management bonus 70 70 0 70Total compensation 220 215 145 215
Matthias Bockholt Board member since 2000Granted benefits(p.r.n. differing inflows)in kEUR
FY 2017
FY 2018
FY 2018 (Min)
FY 2018 (Max)
Fixed salary 170 170 170 170Fringe benefits 8 6 6 6Total 178 176 176 176Management bonus 70 70 0 70Total compensation 248 246 176 246
Andreas Höllinger Board member since 2010Granted benefits(p.r.n. differing inflows)in kEUR
FY 2017
FY 2018
FY 2017 (Min)
FY 2017 (Max)
Fixed salary 150 167 167 167Fringe benefits 0 6 6 6Total 150 173 173 173Tantieme 64 70 0 70Total compensation 214 243 173 243
Dr. Karsten Schlageter Board member since 2018Granted benefits(p.r.n. differing inflows)in kEUR
FY 2017
FY 2018
FY 2018 (Min)
FY 2018 (Max)
Fixed salary 0 40 40 40Fringe benefits 0 2 2 2Total 0 42 42 42Management bonus 0 0 0 0Total compensation 0 42 42 42
There are no further remuneration components with long-term incentivisation effects, pension obligations or third-party benefit obligations.
4.2 Remuneration of the Supervisory Board
The remuneration of the Supervisory Board was determined at the Annual General Meeting of shareholders and is defined under the Articles of Association. The remuneration relates to the duties and responsibilities of the members of the Supervisory Board. Supervisory Board members who were only on the Supervisory Board for part of the financial year receive remuneration on a pro rata basis.
Please see below for the full details of the remuneration sums paid to the members of the Supervisory Board:
Expenses received in kEUR Fixed compensationFY 2017 FY 2018
Jörg Lukowsky (Chairman) 30 30Dr. Ing. Joachim Nitsch (left on 09/08/2018) 10 5
Norbert Breidenbach 10 10Josef Werum (Deputy) 10 10Eveline Lemke (since 20/06/2017) 5 10Jürgen Koppmann (left on 20/06/2017) 5 0
Prof. Dr. Uwe Leprich (since 09/08/2018) 0 5
Total 70 70
There are no further remuneration components for committee activities or attendance fees.

5. Opportunities and risks
5.1 Liquidity risks
The project development of renewable energies is characterised by high lead costs for small unit numbers. Inflows from project financing and project sales need to be very carefully balanced with the outflows for planning and construction. Short and medium-term liquidity is constantly managed across the entire group. Incoming payments are pooled and outgoing payments approved across the group via a manual cash pooling system at ABO Wind AG. The long-term demand is regularly reviewed by means of a multi-year business plan. Suitable capital measures are initiated and seen through centrally by ABO Wind AG where necessary.
5.2 Currency risks
ABO Wind AG is exposed to foreign exchange risks through its international operations in South America, the United Kingdom and other countries. Currently, foreign exchange risks are of minor importance. ABO Wind’s primary field of business is within the European region.
5.3 Interest rate risk
Rising interest rates represent a risk to the profitability of projects. Interest rate hedges may counteract these risks in the short to medium term. In the medium-to-long term, rising interest rates may need to be offset by lower investment and operating costs, as well as adjusted compensation rates. At this moment in time, no interest rate hedges have been agreed to any substantial extent.
5.4 Regulatory risks
Wind and solar energy facilities are, by nature, unable to generate revenue at call whilst in operation. On the other hand, the most substantial parts of ongoing fixed costs are determined by the original investment costs and from long-term credit and lease agreements. As a result of volatile electricity yields – due to the dependence on the weather – and long-term fixed costs, the economic viability of projects depends heavily on the framework conditions underpinning the sale of the energy produced. It is critical that the rules governing remuneration are clear and reliable. This applies in line with the protection of legitimate expectations for the investment period and in line with grandfathering for the economic lifespan.
Additional risks to renewable energy projects exist in the approval process, and in the conditions for connection to the grid and the feeding-in of electricity. Time delays and regulatory requirements for operating facilities and connecting them to the grid can have a significant impact on economic viability.
Overall, the greatest risk for planning of plants for using renewable energies lies in the political and administrative design and implementation of the framework conditions.
5.5 Opportunities and strategy
In general, policy makers at European level agree that it is desirable and necessary for the use of renewable energies to be increased. It is indisputable that onshore wind energy and solar energy are by far the most cost-effective way to generate environmentally-friendly electricity. Any reform of energy policy, which leads to a cost-sensitive increase in the use of renewable energies, should boost these technologies.
Project developers play a key role in carrying out the energy transition. Only by harnessing their expertise and their abilities during the planning and construction phases is it possible to implement projects to the extent intended.
This means working solidly, like in any industry. Our business philosophy to ensure long-term success has been to treat our partners fairly and openly – from landowners and suppliers to banks and investors.
Consistent diversification cushions the typical sectoral risks: The cooperation with different manufacturers for wind and solar plants as well as a regional distribution of projects reduce the importance of individual risk factors.
With this in mind, ABO Wind will continue to expand and develop in areas such as the servicing and maintenance of wind and solar energy facilities and by providing additional services. These business sectors, which are independent of our core business area of project development, will generate a solid contribution to our total earnings.
ABO Wind AG group management report 2018
18

6. Forecast
In the 2017 Annual Report, it was forecast that the overall results for 2018 would not match the level from 2017 and would approximate those of financial year 2016. With approximately EUR 26.4 million below the previous year’s level and around EUR 5.3 million above the overall performance for 2016, the actual figures correspond to the level predicted.
The decreased rate of expenditure for materials is in line with assumptions made in the previous year. In contrast, gross income developed more favourably than assumed. Instead of a decrease of up to 15 per cent, the gross income grew around two per cent in comparison to the previous year due to high-margin individual transactions and the additional sale of project rights.
In the financial year 2017, personal expenditure for financial year 2018 was forecast at a comfortable average 20 per cent over the entire year with an increase in the ratio of personnel expenditure to overall performance. At 24 per cent, the ratio was higher than anticipated. This was due to additional new hires and tighter competition for quality professionals.
With EUR 23.7 million, the combined entries for depreciations and additional expenditures corresponded to last year’s level as forecast.
In March 2018, the management predicted that annual average results for the previous four years would total EUR 11.6 million. The forecast was raised over the course of the year to EUR 12.5 million. Given the EUR 12.7 million actually achieved, the forecast was slightly exceeded.
For 2019 to 2021, annual new business to the amount of one to two gigawatts per year is assumed for the entire group and for all technologies. This forecast is based on further developments of new business in non-European markets and the influence of individual major projects. For example, the figures from the first quarter of 2019 include individual projects of 100 megawatts and more.
With regard to the concluded project developments from the existing pipeline, it is anticipated that ABO Wind will achieve a group-wide volume of 150 to 250 megawatts per year in 2019 to 2021 for all technologies. Measured in megawatts, the sale of project rights and portfolios will gain in importance over the same period and enable new profitable business in new national markets as well. For the completed construction output, we expect 160 megawatts annually across the group and including all technologies for the years 2019 to 2021 predominantly distributed over projects within Europe.
The financial year 2019 is currently developing positively. The construction services planned for this period were completed on time, and additional project rights for a Finnish project and a French project portfolio were sold. The forecast sales for the remainder of the year appear to be largely on target.
Overall results for 2019 will therefore probably remain on the level of that for financial year 2018. The sale of project rights will in all likelihood comprise a somewhat larger share in 2019 than in financial year 2018. After netting, gross income may be slightly elevated over 2018.
The ratio of personnel expenditure to overall performance may increase once again due to planned additions to staff. The growth rate in international markets will play a key role. There will probably not be any significant deviations from previous values in the category of depreciations and additional expenditures.
Taking all of the factors into consideration, the management believes that the annual net profit for 2019 may be higher than that of 2018.
Wiesbaden, 31 March 2019
ABO Wind AG
The Managing Board
ABO Wind AG group management report 2018
19

20
Consolidated balance sheet
Assets
As of 31.12. / in kEUR 2018 previous year
A. Fixed assets 9,952 10,487
I. Intangible assets 894 293
II. Tangible assets 4,553 4,627
1. Land, similar rights and buildings 321 366
2. Technical equipment and machinery 200 159
3. Other equipment, factory and office equipment 4,032 4,102
III. Financial assets 4,505 5,567
1. Shares in group undertakings 347 267
2. Loans to affiliated companies 2,828 789
3. Participating interests 585 3,710
4. Loans to companies in which the company has a participating interest 745 801
B. Current assets 182,545 161,612
I. Stocks 71,451 48,822
1. Work in progress 81,941 88,476
2. Finished goods and goods for resale 915 512
3. Payments on account 2,703 5,125
4. Received payments for orders -14,108 -45,292
II. Debtors and other assets 87,830 67,956
1. Trade debtors 20,231 24,387
2. Amounts owed by group undertakings 58,369 35,569
3. Amounts owed by undertakings in which the company has a participating interest 164 122
4. Other assets 9,066 7,877
III. Securities 18,747 12,499
1. Shares in group undertakings 14,067 7,462
2. Other securities 4,680 5,038
IV. Cash in hand and bank balances 4,517 32,335
C. Prepaid expenses 128 132
D. Deferred taxes 1,417 1,718
Total assets 194,042 173,949

21
Consolidated balance sheet
Equity and liabilities
As of 31.12. / in kEUR 2018 previous year
A. Equity 88,976 79,554
I. Subscribed capital 7,646 7,646
II. Capital reserves 13,542 13,542
III. Revenue reserves 55,271 41,543
1. Statutory reserve 490 490
2. Other revenue reserves 54,781 41,053
IV. Foreign currency translation differences -266 -228
V. Profit for the year 12,745 17,010
VI. Non-controlling interests 39 42
B. Mezzanine Capital 14,379 14,353
C. Provisions 21,014 23,881
1. Tax provisions 3,568 3,323
2. Other provisions 17,446 20,558
D. Creditors 69,672 56,161
1. Bonds 8,757 0
2. Bank loans and overdrafts 38,924 38,535
3. Trade creditors 10,983 9,914
4. Liabilities towards affiliated companies 1,563 913
5. Liabilities towards companies in which the company has a participating interest
0 3
6. Other creditors 9,444 6,796
E. Passive deferrals 1 1
Total liabilities and equity 194,042 173,949

22
Consolidated income statement
From 1.1. to 31.12. / in kEUR 2018 previous year
1. Turnover 150,264 146,786
2. Change in finished goods and work in progress -619 29,468
3. Other own work capitalised 256 0
4. Total output 149,901 176,254
5. Other operating income 2,973 3,750
6. Cost of materials -70,684 -99,298
a) Cost of raw materials, consumables and goods for resale -2,351 -13,101
b) Cost of purchased services -68,333 -86,197
7. Staff cost -36,305 -32,039
a) Wages and salaries -29,905 -26,860
b) Social security, pension and other benefits -6,400 -5,179
8. Depreciation and amortisation -10,204 -12,777
a) of fixed intangibles and tangible assets -1,438 -1,449
b) Exceptional amounts written off current assets -8,766 -11,328
9. Other operating expenses -13,465 -10,926
10. Income from investments 685 0
11. Other interest receivables and similar income 215 205
12. Depreciation on financial assets and securities reported under current assets
-15 0
13. Interest payable and other similar charges -1,802 -1,695
14. Profit on ordinary activities 21,298 23,475
15. Tax on profit -8,140 -6,302
16. Other taxes -397 -153
17. Net profit 12,761 17,019
18. Non-controlling interests -17 -9
19. Consolidated balance sheet profit 12,745 17,010

Consolidated statement of changes in equity
23
Equity of the parent company Non-controlling interests Group equity
In kEUR Subs
crib
ed c
apita
l
Capi
tal r
eser
ve
Stat
utor
y re
serv
e
Oth
er re
venu
e re
serv
es
Fore
ign
curr
ency
tr
ansl
atio
n di
ffere
nces
Annu
al n
et p
rofit
Tota
l
Fore
ign
curr
ency
tr
ansl
atio
n di
ffere
nces
Annu
al n
et p
rofit
Tota
l
Tota
l
As of 31.12.2016 7,646 13,542 490 38,079 -11 6,960 66,705 0 32 32 66,738
Allocations to revenue reserves - - - 6,960 - -6,960 0 - - 0 0
Dividends paid - - - -3,823 - - -3,823 - - 0 -3,823
Changes in the scope of consolidation
- - - -163 - - -163 - - 0 -163
Exchange rate effects - - - - -217 - -217 - - 0 -217
Consolidated balance sheet profit - - - - - 17,010 17,010 - 9 9 17,019
Change of the year - - - 2,974 -217 10,050 12,807 - 9 9 12,816
As of 31.12.2017 7,646 13,542 490 41,053 -228 17,010 79,512 0 42 42 79,554
Allocations to revenue reserves - - - 17,010 - -17,010 0 - - 0 0
Dividends paid - - - -3,058 - - -3,058 - - 0 -3,058
Changes in the scope of consolidation
- - - - - - 0 - - 0 0
Exchange rate effects - - - - -38 - -38 -19 - -19 -57
Other Changes - - - -224 - - -224 - - 0 -224
Consolidated balan-ce sheet profit - - - - - 12,745 12,745 - 17 17 12,761
Change of the year - - - 13,727 -38 -4,265 9,424 -19 17 -3 9,422
As of 31.12.2018 7,646 13,542 490 54,781 -266 12,745 88,937 -19 59 39 88,976

24
Consolidated cash-flow statement
in kEUR 2018
Current operating activites
Net profit or loss for the period 12,761
+/- Depreciation / Write-up of fixed assets 1,453
+/- Change in provisions -3,113
-/+ Change in stock -22,629
-/+ Change in debtors and other assets that cannot be attributed to investment and financingactivities -21,443
+/- Change in trade payables and other liabilities that cannot be attributed to investment andfinancing activities 5,005
-/+ Profit / Loss from the disposal of fixed assets -45
+ Interest expense 1,802
- Interest income -215
- Other investment income -685
+/- Income tax expense and income 8,140
-/+ Income tax payments -9,142
= Cash flows from current operating activities -28,110
Investment activities
+ Cash received on disposal of tangible assets 6
- Investments in tangible fixed assets -1,393
- Investments in intangible assets -782
+ Cash received on disposal of financial assets 173
- Cash paid for the purchase of financial assets -2,146
+ Interest received 215
+ Dividends received 685
= Cash flows from investing activities -3,242
Financing activities
- Cash payments to owners and minority shareholders (dividends, purchase of own shares,equity capital payback, other disbursements) -3,058
+ Cash proceeds from issuance of bonds and from short- or long-term borrowings 20,917
- Outgoing payments for the settlement of loans and (financial) credits -11,797
- Interest paid -2,389
= Cash flow from financing activities 3,672
= Net change in cash and cash equivalents -27,679
Change in cash funds from exchange rate movements, changes in group structure and in valuationprocedures for cash funds -138
Cash funds
At the start of the period 32,335
At the end of the period 4,517

25
Added value through efficiency: In Wennerstorf, south of Hamburg, ABO Wind dismantled a 15-year-old wind farm with four turbines of 1.3 megawatts each and replaced it with two Nordex N149 turbines. The workers were busy day and night to ensure that the wind farm could be built by the time of the “Windenergy” trade fair in Hamburg in 2018. Nordex offered visitors excursions to the remarkable project planned by ABO Wind.

26
I. General information
The consolidated financial statements of ABO Wind AG are prepared in accordance with the accounting regulations applicable for corporations of the German Commercial Code (Handelsgesetzbuch; HGB), with due consideration being given to the law relating to corporations (Aktiengesetz; AktG).
The profit and loss account has been prepared in accordance with the cost summary method set out in § 275 para. 2 of the HGB.
The financial year corresponds to the calendar year.
Due to the provisions of §§ 290 et seq. of the HGB, as the parent company ABO Wind AG is obliged to prepare consolidated financial statements.
The financial statements comply with § 246 para. 3 of the HGB and § 252 para. 1 no. 6 of the HGB.
In the interests of better clarity and transparency, the information to be provided in accordance with the legal regulations for the items of the balance sheet and profit and loss account and also the information to be provided either in the balance sheet or in the profit and loss account or in the notes is to a large extent set out in the notes to the consolidated financial statements.
II. Scope of consolidation
Aside from the parent company ABO Wind AG, 13 (previous year: 13) subsidiaries are included in the consolidated financial statements over which ABO Wind AG can exercise a direct, indirect or majority influence as defined by § 290 of the German Commercial Code (HGB).
The following companies were fully consolidated in the reporting year:
Company CapitalShare
ABO Wind Betriebs GmbH, Wiesbaden, Germany
100%
ABO Wind Biogas GmbH, Heidesheim, Germany
100%
ABO Wind Biogas-Mezzanine GmbH & Co. KG, Wiesbaden, Germany
100%
ABO Wind Energias Renovables S.A., Buenos Aires, Argentina
94%
ABO Wind España S.A.U., Valencia, Spain 100%
ABO Wind Ireland Ltd., Dublin, Ireland 100%
ABO Wind Mezzanine GmbH & Co. KG, Wiesbaden, Germany
100%
ABO Wind Mezzanine II GmbH & Co. KG, Wiesbaden, Germany
100%
ABO Wind N.I. Limited, Belfast, Großbritannien
100%
ABO Wind Oy, Helsinki, Finland 100%
ABO Wind SARL, Toulouse, France 100%
ABO Wind Service GmbH, Heidesheim, Germany
100%
ABO Wind UK Ltd., Bellshill, UK 100%
Not included within the consolidation scope were shares in group undertakings which are being held with the sole purpose of resale (§ 296 para. 1 no. 3 of the HGB) along with group undertakings which are of minor importance regarding the appropriate presentation of a true and fair view of the net assets, financial position and results of operations of the group (§ 296 para. 2 of the HGB).
Group annex

27
Group annex
III. Consolidation principles
General information
Financial statements included in the consolidation are prepared in accordance with accounting policies. The conversion of financial statements in foreign currency is carried out following the modified closing rate method.
Capital consolidation
Capital consolidation for those entities already fully consolidated in the previous year, continues to follow the book value method, according to § 66 para. 3 p. 4 of the Introductory Act to the German Commercial Code (EGHGB), through offsetting acquisition costs of investment with the (prorated) equity of the group undertaking.
The revaluation method is applied for companies newly entering the consolidation scope for the reporting year. In the process, acquisition costs of shares in subsidiaries are offset by equity, valued for the present value at the moment of first consolidation, allotted to the particular group undertaking. Active balances stemming from capital consolidation are in principle – after consideration of disclosed hidden reserves/ hidden liabilities as well as deferred taxes apportioned to each – capitalised as goodwill. For the ABO Wind group, such differences in calculation do not occur.
Debt consolidation
In the scope of debt consolidation, all amounts owed by and owed to group undertakings that are included in the consolidated financial statement are offset in accordance with § 303 para. 1 of the HGB.
Cost and income consolidation
Within the scope of cost and income consolidation in accordance with § 305 para. 1 of the HGB, income from services rendered and other income between the consolidated companies were consolidated with the corresponding costs. The same principle applies for other interests and similar income, which were offset with the corresponding expenditures.
Intercompany profit elimination
In accordance with § 304 para. 1 of the HGB, unrealised gains on transactions between group undertakings are eliminated.
IV. Balancing and evaluation methods
1. Balancing and evaluation of assets
Self-created industrial property rights and similar rights and assets are capitalized at costs of production (development costs), if there is at least a high probability that an asset will actually be created as of the reporting date. Production costs include the costs individually attributable to the consumption of goods and services as well as adequate parts of material and production overheads and depreciation of fixed assets as a result of the development process. Self-created industrial property rights and similar rights and assets are depreciated on a straight-line basis pro rata temporis over their expected useful lives.
Intangible assets acquired from third parties for a monetary consideration are capitalised at cost of purchase, and are depreciated using the straight-line method over their probable useful life; depreciation is recognised on a pro rata basis in the year of acquisition. EDP programs acquired for a monetary consideration are written down over a standard useful life of three years. One exception in this respect are EDP programs with costs of purchase of less than EUR 800; these are recognised immediately and in full in the profit and loss account. If the fair values of individual intangible assets are lower than their corresponding carrying amounts, additional unplanned depreciations are carried out if the reduction in value is probably of permanent nature.
Tangible assets are measured with cost of purchase or cost of production less straight-line depreciation over a period of 3 – 15 years. Depreciation in relation to additions to tangible assets are recognized on a pro rata basis. If the fair values of individual assets are lower than their corresponding carrying amounts, additional unplanned depreciations are carried out if the reduction in value is probably of permanent nature.
With regard to the recognition of minor-value assets, § 6 para. 2 of the German Income Tax Act (EstG) has been used. The costs of purchase or production of depreciable moveable fixed assets which are capable of being used independently are recognised in full as business expenses in the financial year in which the assets are purchased, produced or contributed if the costs of purchase or production, less any amount of VAT included in the amount, of the individual asset do not exceed EUR 800.
Under financial assets, the shares in group undertakings and the equity participations are measured at cost of purchase. Insofar as the fair values of individual financial assets are lower than their corresponding carrying amounts, additional unplanned depreciations are carried out if the reduction in value is probably of permanent nature.
28
Loans are always recognized at their nominal value.
Work in progress and unfinished goods are measured at cost of production. The costs of production contain the components of § 255 para.2 of the HGB which have to be capitalised. Furthermore, reasonable amounts of administrative costs as well as reasonable costs of social facilities of the company and for voluntary social services are also included in the costs of production if they are attributable to the period of production. Moreover, in accordance with § 255 para. 3 of the HGB, interest on borrowed capital was capitalised - insofar as it relates to the production of assets and to the period of production. In all cases, inventories are measured at the lower of cost or market value, i.e. if the probable selling prices minus the costs incurred up to the point at which the inventories are sold result in a lower fair value, corresponding impairments have been recognised.
Payments in advance for inventories are stated at nominal value.
Payments received are stated at nominal value, in accordance with § 268 para. 5 of the HGB openly set off against inventories and reduced by the included value added tax (so-called net method).
Debtors and other assets are shown at the lower of nominal value or fair value as of the balance sheet date. Reasonable impairments are recognised in the case of receivables if a recognisable level of risk is associated with the recoverability of such receivables; irrecoverable receivables are written off.
The marketable securities are shown with the costs of purchase or the lower fair value.
Liquid assets are shown with their nominal value on the balance sheet date.
Prepaid expenses show expenditure incurred before the reporting date if such expenditure relates to a period after that date.
2. Recognition and valuation of liabilities and equity
Subscribed capital is shown with its nominal value.
The group recognized Mezzanine capital as an item between equity and loans, exercising its option from § 265 para. 5 of the HGB. Mezzanine capital is shown with its nominal value.
The provisions were recognised with the settlement amount necessary in the opinion of a prudent businessman. Provisions with a remaining term of more than one year are discounted using the average market interest rate of the past seven years corresponding to the remaining term of the provisions.
Liabilities are recognised with their settlement amount.
Conversion of foreign currency
Foreign currency transaction are in principle translated into the group currency using the exchange rates prevailing at the dates of transactions. Balances from such transactions at the balance sheet date are recognized as follows:
Short-term foreign currency debtors (with a remaining term of one year or less) as well as liquid assets or other short-term assets in foreign currency are converted using the spot mid-rate applicable on the balance sheet date. Short-term foreign currency liabilities (with a remaining term of one year or less) are translated using the spot mid-rate on the balance sheet date.
For group undertakings included in the consolidated financial statements and whose currency is not equal to that of the group, the following applies:
Assets and liabilities for each balance sheet presented are translated at the spot mid-rate at the date of the balance sheet, costs and income are converted at average exchange rates and equity using the historic exchange rate. A resulting currency gap from the conversion is recognised in equity as the item “foreign currency translation differences”.
Deferred taxes
Deferred taxes are recognised in relation to the differences between the figures shown in the commercial accounts and the tax accounts if such differences will probably be reversed in subsequent financial years. In addition, deferred taxes are recognised on loss carryforwards and consolidation measures.
Expenses and income of movements in recognised deferred income taxes is designated in the item “Tax on profit” in the profit and loss account and explained separately in the annex.
The deferred taxes are calculated using an effective tax rate, which will probably be applicable at the point at which the differences are reversed.
Group annex

29
V. Information on balance sheet
Unless otherwise mentioned, the previous year‘s figures relate to the balance sheet as at December 31, 2017.
Fixed assets
The development of the individual items of fixed assets is shown in the schedule of assets, with details of depreciation recognised in the financial year. The schedule of assets is enclosed as an exhibit to the notes.
Shares in group undertakings and equity participations shown under financial assets – meaning companies of which ABO Wind directly or indirectly owns at least 20 percent of the shares – are further considered in the list of shareholdings in the appendix.
Debtors and other assets
Information on debtors and other assets can be obtained from the following claims analysis:
31.12.2018 in kEUR
Residual maturity
<1 year 1-5 years
Trade debtors (previous year)
20,231
(24,387)
20,131
(24,387)
100
(0)
Amounts owned by group undertakings (previous year)
58,369
(35,569)
58,369
(35,569)
0
(0)
Amounts owed by underta-kings in which the company has a participating interest (previous year)
164
(122)
164
(122)
0
(0)
Other assets (previous year)
9,066
(7,878)
9,033
(7,716)
33
(162)
Total (previous year)
87,830
(67,956)
87,697
(67,794)
133
(162)
Amounts owed by group undertakings are mainly the result of deliveries and services exchanged.
Deferred taxes
The item “Deferred taxes” shown separately in the balance sheet results from interim profits and/or tax loss carryforwards.
The evaluation of deferred tax assets and liabilities is carried out using the following, company individual tax rates:
• Argentina 35%
• Germany 30%
• Spain 25%
• Ireland 12.5%
• UK 20%
• France 33%
• Finland 20%
Shareholders‘ capital
The subscribed capital for ABO Wind AG is divided into 7,645,700 shares valued at one euro per share and with a corresponding share of the capital stock.
The basic capital of the company has increased by up to kEUR 1,000 through the release of up to 1,000,000 new, no-par bearer shares (Conditional Capital 2017). The conditional capital increase serves to grant shares to the holder of convertible and/or warrant bonds that will be issued on the basis of authorisation by the annual general meeting on December 20, 2017 by the company until December 19, 2022.
In the reporting year, ABO Wind AG recognised for the first time self-created intangible assets. There included are kEUR 256, for which a payout block exists in accordance with § 268 para. 8 of the HGB.
Mezzanine capital
Participation certificates in the amount of kEUR 14,379 (previous year: kEUR 14,353) were issued as at the balance sheet date. Each of the emitted participation certificates represents a theoretical share of EUR 1.
Of this amount, kEUR 7,666 (previous year: kEUR 7,666) is attributable to ABO Wind Mezzanine GmbH & Co. KG, kEUR 5,213 (previous year: kEUR 5,038) to ABO Wind Mezzanine II GmbH & Co. KG and kEUR 1,501 (previous year: kEUR 1,649) to ABO Wind Biogas-Mezzanine GmbH & Co. KG.
Group annex

30
Group annex
Provisions
Tax provision are comprised as follows:
Tax provisions31.12.18 in kEUR
31.12.17 in kEUR
Corporate tax provisions 3,153 2,084
Trade tax provisions 415 1,239
Total 3,568 3,323
Other provisions are comprised as follows:
Other provisions 31.12.18 in kEUR
31.12.17 in kEUR
Provisions for production costs without final invoices
8,055 12,676
Provisions for various project risks 1,538 1,340
Provisions for financial statements and auditing costs
145 158
Provisions for warranties 56 100
Provisions for the storage of business documents
25 25
Other provisions 7,627 6,259
Total 17,446 20,558
Creditors
ABO Wind AG has publicly offered convertible bonds on the basis of a securities prospectus approved by the Federal Financial Supervisory Authority (BaFin). The subscribers of the convertible bond secure the possibility to acquire shares of ABO Wind AG by converting the bond in October 2019 at a price of EUR 15.
The convertible bond is subject to the following conditions:
• Maturity: May 1, 2018 to April 30, 2020
• Interest rate: 3 percent annually
• Issue price: EUR 15
• Conversion periods: October 2018 and October 2019
• Conversion ratio: 1:1
• Issue volume: one million bonds, EUR 15 million
As of the reporting date, 583,812 convertible bonds with a total nominal value of kEUR 8,757 were subscribed.
The breakdown of creditors according to their remaining terms can be taken from the following creditors analysis:
As at 31.12.18 in kEUR Total Residual maturity
< 1 year 1 - 5 years
Bonds (previous year)
8,757(0)
0(0)
8,757(0)
Bank loans and overdrafts (previous year)
38,924
(38,535)
844
(1,125)
38,080
(37,410)
Trade creditors (previous year)
10,983
(9,914)
10,983
(9,914)
0
(0)
Liabilities towards affiliated companies (previous year)
1,563
(912)
1,560
(909)
3
(3)
Liabilities towards companies in which the company has a participating interest (previous year)
0
(3)
0
(3)
0
(0)
Other creditors (previous year)
9,444
(6,797)
9,444
(6,783)
0
(14)
- of which taxes (previous year)
7,591
(3,698)
7,591
(3,698)
0
(0)
- of which relating to social security (previous year)
399
(172)
399
(172)
0
(0)
Total (previous year)
69,672
(56,161)
22,831
(18,734)
46,841
(37,427)
Amounts owed to group undertakings mainly include deliveries and services exchanged.

31
VI. Information on the profit and loss calculation
Turnover
Turnover is broken down as follows by areas of activities:
2018 2017
kEUR % kEUR %
Planning and sale of rights
34,258 22.8 27,574 18.8
Construction 105,654 70.3 110,926 75.6
Services 10,352 6.9 8,285 5.6
150,264 100.0 146,785 100.0
Structuring according to specific regional markets results follow below:
2018 2017
kEUR % kEUR %
Germany 71,450 47.5 65,276 44.5
Finland 34,351 22.9 50,947 34.7
Ireland 23,508 15.6 2,250 1.5
France 18,726 12.5 20,541 14.0
Spain 1,158 0.8 2,386 1.6
Argentinien 851 0.6 586 0.4
UK 220 0.1 4,256 2.9
Iran 0 0.0 543 0.4
150,264 100.0 146,785 100.0
Other operating income
Other operating income includes kEUR 1,616 in income unrelated to the reporting period, resulting primarily from the reversal of provisions. Furthermore, income from foreign currency translation amounted to kEUR 147.
Depreciation
The depreciations include unplanned depreciations from non- feasible projects amounting to kEUR 8,766 (previous year kEUR 11,328).
Other operating expenses
Other operating expenses include kEUR 3,141 in expenses unrelated to the reporting period, mainly resulting from bad debt losses. In addition, expenses from currency translation amounting of kEUR 127 were recognised.
Tax on profit
Taxes on profits include amounts from the recognition of deferred tax income of kEUR 159 (previous year: kEUR 331) and deferred tax expenses of kEUR 467 (previous year: kEUR 275).
Group annex

VII. Other disclosures
Guarantees and commitments
ABO Wind AG has given a capped guarantee of payment to holders of profit-share certificates in Eurowind AG for interest and repayment claims in the amount of up to EUR 125.00 respectively. This guarantee of a total of kEUR 1,300 enables the profit-share certificate holders to make a direct claim to the guarantor in the event that Eurowind AG is at least 60 days in arrears with its payments. Interest on participation certificates have already been distributed for 2017.
Associated with the project rights, purchased by the French subsidiary, ABO Wind AG accepts liability for the French subsidiary in relation to the agreed profit participation in case of the realisation of the acquired projects in a maximum compensation of kEUR 1,550 until December 31, 2019 plus a maximum compensation of kEUR 511 until December 31, 2020.
Furthermore ABO Wind AG has issued a guarantee in connection with the purchase of project rights on the part of an Irish project corporation in the amount of kEUR 7,200 until December 31,2020.
Furthermore, ABO Wind AG has issued a guarantee in favour of LBBW bank in connection with the financing of a Finnish wind farm. The payment guarantee is limited to the maximum amount of kEUR 1,000.
Furthermore ABO Wind AG paid kEUR 37,997 to secure the payment claims which resulted from the contracts for delivery, mounting and commissioning of wind turbines for several project guarantees towards suppliers.
ABO Wind AG has also issued a guarantee in the context of the acquisition of project rights and the development of solar parks by the South African subsidiary for a maximum amount of around kEUR 500.
In addition, ABO Wind AG issued a guarantee in the amount of kEUR 59 relating to a land lease agreement for a Finnish project.
Moreover guarantees and sureties in the amount of kEUR 33,471 exist on the balance sheet date.
For the shown, to nominal values estimated contingent liabilities, no other reserves were made. This is because the company does not anticipate that the guarantees will be utilised.
Other financial obligations and off-balance sheet transactions
The group continues to have obligations arising out of fixed- term rental and lease agreements amounting to kEUR 6,988 (previous year: kEUR 4,071). These obligations relate primarily to the rental of office space and car leasing contracts.
Cash flow statement
The development of cash and cash equivalents is shown in detail in the cash flow statement. Cash and cash equivalents at the balance sheet date correspond to the balance sheet item “Cash in hand and bank balances”.
Auditor’s fee
The separate and consolidated financial statements of the parent company as at December 31, 2018 were audited by Rödl & Partner GmbH, Köln, Germany. The fees for services relating to the audit of the financial statements came to kEUR 71 (previous year: kEUR 76); kEUR 4 was paid for tax consulting services (previous year: EUR 0).
Employees
In the 2018 financial year, an average of 573 employees (previous year: 518) were employed who can be broken down into the following groups:
Employee group 31.12.18 31.12.17
Executives 14 11
Fulltime employees 385 361
Parttime employees 174 146
Total 573 518
Managing Board
Members of the Managing Board during the 2018 business year consisted of the following:
Dr. Jochen Ahn, Dipl. chemist, Wiesbaden, responsible for project acquisition and administration
Dipl. Ing. Matthias Bockholt, Dipl. Ing. for electrical engineering, Heidesheim, responsible for technology and operational management
Andreas Höllinger, Dipl. Kaufmann, Dipl. ESC Lyon, Frankfurt am Main, responsible for financing and sales
Dr. Karsten Schlageter, Dipl. Ing. for industrial engineering, Taunusstein, responsible for international business development (since October 2018)
Reference to the compensation of the board members is made in the compensation report which is a part of the status report.
Group annex
32

Supervisory board
Members of the supervisory board during the business year 2018:
Chairman
Attorney Jörg Lukowsky, specialised lawyer for tax and employment law, employed by the chambers of FUHRMANN WALLENFELS Wiesbaden attorney partnership, Wiesbaden
Other members
Prof. Dr. Uwe Leprich, Professor for Energy Economics at the Saarland University of Applied Sciences for Economics, Saarbrücken (from August 9, 2018)
Josef Werum, director of In.Power GmbH, Mainz
Norbert Breidenbach, board member of Mainova AG, Frankfurt
Eveline Lemke, Managing Director of Eveline Lemke Consulting, Volkesfeld
The compensation of the supervisory board amounted to kEUR 70 (previous year kEUR 70).
Appropriation of earnings proposed by the Managing Board
For the business year 2018, the group generated a net profit of kEUR 12,745, which is to be carried forward in full.
The Managing Board recommends carrying forward to new account the net profit of the parent company for the business year in the amount of kEUR 5,276.
VIII. Supplementary report
In the first quarter of 2019, amortising loans with a term of 5 years totalling kEUR 12,000 were paid out. At the same time, an extension of an existing guarantee credit line by kEUR 15,000 was agreed with a leading bank.
Up to and including February 2019, further 183,188 convertible bonds with a total nominal value of kEUR 2,748 were subscribed. The public offering ended on February 20, 2019. The convertible bonds can be converted for the last time in October 2019 at a ratio of 1:1 into shares of ABO Wind AG.
Otherwise, no events occurred after December 31, 2018 that are of considerable importance for ABO Wind AG‘s business performance as well as for the asset-, financial-, or profit situation and could lead to a different assessment of the situation.
Wiesbaden, March 31, 2019
Andreas Höllinger, Chairman of the Managing Board
Dr. Jochen Ahn Managing Director
Matthias Bockholt Managing Director
Dr. Karsten Schlageter Managing Director
Group annex
33

34
Group annex
Asset analysis for the business year 2018
In kEUR Acquisition costs Depreciation Book value01
.01.
2018
Curr
ency
effec
t
Addi
tions
Dis
posa
ls
Tran
sfer
s
As o
f 31
.12.
2018
01.0
1.20
18
Curr
ency
effec
t
Addi
tions
Dis
posa
ls
Tran
sfer
s
As o
f 31
.12.
2018
31.1
2.20
18
31.1
2.20
17
I. Intangibleassets
1.
Acquiredconcessions,industrialproperty andsimilar rights
1,651 4 228 - - 1,883 1,358 -2 187 - - 1,542 340 293
2. Payments on account - - 553 - - 553 - - - - - - 553 -
Totalintangibleassets
1,651 4 782 0 0 2,436 1,358 -2 187 0 0 1,542 894 293
II. Tangibleassets
1.
Land, similarrights andbuildingsincludingbuildings onthird-partyland
373 - - - -45 328 7 - - - - 7 321 366
2.
Technicalequipmentand machinery
179 - 60 3 - 235 20 - 17 2 - 35 200 159
3.
Other equipment,factoryand officeequipment
10,239 -61 1,333 326 - 11,184 6,137 43 1,234 262 - 7,152 4,032 4,102
Total tangibleassets 10,791 -61 1,393 330 -45 11,748 6,164 43 1,251 264 0 7,194 4,553 4,627
III. Financialassets
1.Sharesin groupundertakings
286 - 107 31 - 362 19 - 15 19 - 15 347 267
2.Loans togroupundertakings
789 - 2,039 - -3,125 -297 - - - - - - 2,828 789
3. Participations 4,217 - - - - 4,217 506 - - - - 506 585 3,710
4.Loans toaffiliatedcompanies
801 - - 57 - 745 - - - - - - 745 801
Total financialassets
6,092 0 2,146 88 -3,125 5,026 525 0 15 19 0 521 4,505 5,567
Total fixed assets 18,534 -58 4,321 417 -3,170 19,210 8,047 41 1,453 283 0 9,258 9,952 10,487

35
Significant holdings of ABO Wind AG
As of 31.12.2018 Share in % Equity
Equity in thousands
Annual result in thousands
GermanyABO Wind Verwaltungs GmbH, Wiesbaden 100 EUR 171* EUR 3*ABO Wind Betriebs GmbH, Wiesbaden 100 EUR 739 EUR 29ABO Wind Biogas GmbH, Wiesbaden 100 EUR 68 EUR 5ABO Wind Service GmbH, Heidesheim 100 EUR 111 EUR 39ABO Wind Sachverständigen GmbH, Heidesheim 100 EUR 44 EUR 44ABO Wind Solutions GmbH, Wiesbaden 100 EUR -20 EUR -41ABO Pionier AG, Wiesbaden 100 EUR 87 EUR -11ABO Invest AG, Wiesbaden 10 EUR 62,509* EUR 388*ABO Kraft & Wärme AG, Wiesbaden 20 EUR 10,464* EUR 148*ABO Wind Biogas- Mezzanine GmbH & Co. KG, Wiesbaden 100 EUR 43 EUR 3ABO Wind Mezzanine GmbH & Co. KG, Wiesbaden 100 EUR 104 EUR 8ABO Wind Mezzanine II GmbH & Co. KG, Wiesbaden 100 EUR 24 EUR 14BEG Windpark-Verwaltungs GmbH, Heidesheim 100 EUR 12 EUR 0United Battery Management GmbH, Berlin 70 EUR 42 EUR 17ABO Wind Speicher GmbH, Wiesbaden 100 EUR 24 EUR -1FranceABO Wind SARL, Toulouse 100 EUR 3,556 EUR 3,489SpainABO Wind Espana S.A.U., Valencia 100 EUR 791 EUR 135FinlandABO Wind OY, Helsinki 100 EUR 9,080 EUR 8,891ABO Wind Service Oy, Helsinki 100 EUR 1 EUR 1IrelandABO OMS Ltd., Dublin 100 EUR -30 EUR -35ABO Wind Ireland Ltd., Dublin 100 EUR 632 EUR 4.751CanadaABO Wind Canada Ltd., Calgary 100 CAD 13 CAD 103United KingdomABO Wind N.I. Ltd., Belfast 100 GBP 75 GBP 26ABO Wind UK Ltd., Livingston 100 GBP -205 GBP 28ArgentinaABO Wind Energias Renovables S.A, Buenos Aires 94 ARS 20,733 ARS 6,074GreeceABO Wind Hellas Energy S.A., Athens 99 EUR 24 EUR 0Energiaki Thessalias S.A., Athens 99 EUR 60 EUR 0Farma Energiaki S.A., Athens 99 EUR 60 EUR 0Helio Energia Kossou S.A., Athens 99 EUR 360 EUR 0ColombiaABO Wind Colombia S.A.S., Bogota 100 COP 1.000 COP 0South AfricaABO Wind Renewable Energies Ltd., Cape Town 100 ZAR 1 ZAR 1TunisiaABO Wind Tunisie SARL, Ariana 99 TND 1 TND 0ABO Wind Carthage SARL, Ariana 99 TND 32 TND 0HungaryJupiter SolarPark Kft., Budapest 100 HUF 4,000 HUF 0PG KDI Penzügyi Tanacsado Kft., Budapest 100 HUF 4,000 HUF 0*financial year 2017

36
Balance sheet ABO Wind AG
Assets
As of 31.12. / in kEUR 2018 Previous year
A. Fixed assets 8,681 9,377
I. Intangible assets 752 228
1. Concession and property rights and similar rights and assets, andlicences in such rights and assets 199 228
2. Payments on account 553 0
II. Tangible assets 2,950 3,108
1. Land, similar rights and buildings including buildings on third party land 321 321
2. Other equipment, factory and office equipment 2,629 2,787
III. Financial assets 4,979 6,041
1. Shares in group undertakings 821 741
2. Loans to affiliated companies 2,828 789
3, Participating interests 585 3,710
4. Loans to companies in which the company has a participatinginterest 745 801
B. Current assets 177,924 144,354
I. Stocks 70,247 61,152
1. Work in progress 75,509 65,203
2. Finished goods and goods for resale 0 214
3. Payments on account 2,219 4,643
4. Received payments for orders -7,480 -8,908
II. Debtors and other assets 87,445 42,479
1. Trade debtors 13,701 5,603
2. Receivables from group undertakings 65,444 32,455
3. Receivables from companies in which the company has aparticipating interest 164 122
4. Other assets - of which with a remaining term of more than one year 134 (previous year: 129) 8,135 4,299
III. Securities 17,360 10,816
1. Shares in group undertakings 11,428 4,532
2. Other securities 5,932 6,284
IV. Cheques, cash in hand, central Bank and postal giro balances,bank balances 2,873 29,907
C. Prepaid expenses 66 91
Total assets 186,671 153,822

3737
Equity and liabilities
As of 31.12. / in kEUR 2018 Previous year
A. Equity 76,862 74,644
I. Subscribed capital 7,646 7,646
II. Capital reserves 13,542 13,542
III. Revenue reserves 50,398 44,636
1. Statutory reserve 490 490
2. Other revenue reserves 49,908 44,146
IV. Profit for the year 5,277 8,820
B. Provisions 10,605 12,920
1. Tax provisions 466 1,788
2. Other provisions 10,139 11,132
C. Creditors 99,203 66,257
1. Bonds 8,757 0
2. Bank loans and overdrafts which of a remaining term of up to oneyear: 884 (previous year: 1,125) 38,924 38,536
3. Trade creditors of which a remaining term of up to one year: 7,426(previous year: 3,038) 7,426 3,038
4. Amounts owed to undertakings in which the company has aparticipating interest of which a remaining term of up to one year:38,649 (previous year: 20,966) 38,649 20,966
5. Amounts owed to affiliated companies- of which a remaining term of up to one year: 0 (previous year: 3) 0 3
6. Other creditors- of which to associates 21 (previous year: 19)- of which taxes 4,790 (previous year 3,300)- of which a remaining term of up to one year 5,447 (previous year: 3,714) 5,447 3,714
D. Deferred income 1 1
Total liabilities and equity 186,671 153,822
Balance sheet ABO Wind AG

38
Profit and loss account ABO Wind AG
From 1.1. to 31.12. / in kEUR 2018 Previous year
1. Turnover 81,755 90,996
2. Change in finished goods and work in progress 15,958 16,704
3. Other own work capitalised 256 0
4. Total output 97,969 107,700
5. Other operating income 2,748 3,147
6. Cost of materials -57,556 -53,252
a) Cost of raw materials, consumables and goods for resale -80 -88
b) Cost of purchased services -57,476 -53,164
7. Staff costs -27,910 -25,016
a) Wages and salaries -23,603 -21,571
b) Social security, pension and other benefits -4,307 -3,445
8. Depreciation and amortisation -9,502 -11,987
a) Of fixed intangibles and tangible assets -736 -659
b) Exceptional amounts written off current assets -8,766 -11,328
9. Other operating expenses -7,455 -7,484
10. Income from participating interests from group undertakings - of which from group undertakings: 10,527 (previous year: 500) 10,527 500
11. Other interest receivables and similar income- of which from group undertakings: 322 (previous year: 430) 349 529
12. Depreciation on financial assets and securities reported under current assets -15 0
13. Interest payable and other similar charges- of which to group undertakings: 479 (previous year: 444) -1,355 -1,210
14. Tax on profit -2,492 -4,079
15. Earnings after taxes 5,308 8,848
16. Other taxes -31 -28
17. Net Profit 5,277 8,820
18. Allocations to revenue reserves 0 0
19. Balance sheet profit 5,277 8,820
Deviations through rounding differences

Organisation ABO Wind group
As of May 2019 (excluding temporary staff and interns)
Operational Management & Services
Management, Administration, IT, Communications, Future Energy Concepts
Project Development Germany
Construction, Grid Connection, Purchase, Site Assessment
Project Development International
127
84
68
98
23
142
Finance & Sales
Number of Employees (Total: 542)

Germany
ABO Wind AG
Wiesbaden (Headquarters)Unter den Eichen 765195 Wiesbaden+49 611 267 65-0
Heidesheim Oberdorfstraße 1055262 Heidesheim+49 6132 89 88-00
Berlin Volmerstraße 7b12489 Berlin+49 30 99 29 69-100
Saarbrücken Metzer Str. 15866117 Saarbrücken+49 681 99 88 99-5
Hannover Andreaestraße 730159 Hannover+49 511 95 73 980-0
BarlebenAn der Sülze 1839179 Barleben +49 39203 23 90 34
RheineLandersumer Weg 40b48431 Rheine+49 5971 14 81 99 91
DortmundHauert 1444227 Dortmund+49 231 983 407-12
HadamarIndustriestraße 565589 Hadamar+49 6433 888-91 11
France
ABO Wind SARL
Toulouse 2 rue du Libre EchangeCS 9589331506 Toulouse CEDEX 5 +33 5 34 3116 76
Orléans19 boulevard Alexandre Martin45000 Orléans+33 2 38 52 21 65
Nantes12 allée Duguay Trouin44000 Nantes+33 2 51 72 79 57
Lyon75 rue de la VilletteLe Galaxie69003 Lyon+33 481 09 1830
Argentina Finland Greece Ireland Canada
ABO Wind Energías Renovables S.A.
ABO Wind Oy ABO Wind Hellas Energy S.A.
ABO Wind Ireland Limited
ABO Wind Canada Ltd.
Buenos AiresAv. Alicia Moreau de Justo 1050Piso 4 Oficina 196 – Dock 7C1107AAV – Puerto MaderoCiudad Autónoma de Buenos Aires+54 11 5368 2105
HelsinkiSalomonkatu 17A, 12. krs.00100 Helsinki+358 50 52 15 333
AthensVouliagmenis Avenue 4716777, Elliniko, Athens+30 211 016 8049
DublinUnit 3Aspen CourtCornelscourtDublin 18+ 353 1 207 0452
Calgary#210 3015 -12 Street NECalgary, AB T2E 7J2+1 587 355 8720
Colombia Northern Ireland Scotland Spain South Africa
ABO Wind Renovables Colombia S.A.S.
ABO Wind N.I. Limited ABO Wind UK Limited ABO Wind España S.A.U. ABO Wind renewable energies (Pty) Ltd.
MedellínCra 42 N° 3 Sur 81Torre 2 Piso 16Milla de Oro - Distrito de NegociosMedellín+57 4 480 2986
LisburnUnit 1 Wallace StudiosWallace AvenueLisburnBT27 4AE+44 28 9099 6445
BellshillWillow HouseKestrel ViewStrathclyde Business ParkBellshillML4 3PB +44 1698 510 910
ValenciaEmbajador Vich 3, 3 Q46002 Valencia+34 963 531 180
Cape TownUnit B1, Mayfair SquareCentury WayCentury City7441 Western Cape+27 64 030 3633
Tunisia
ABO Wind Carthage SARL
E-Mail: [email protected]
TunisImmeuble City CenterBloc B-Bureau 3.6Centre Urbain Nord1082 Tunis+216 70 038 158


