Application of a ring cavity surface emitting quantum cascade laser (RCSE-QCL) on the
measurement of H2S in a CH4 matrix for process analytics
Harald Moser,1 Andreas Genner,1 Johannes Ofner,1 C. Schwarzer,2 Gottfried Strasser,2 and Bernhard Lendl1,*
1Institute of Chemical Technologies and Analytics, Vienna University of Technology, Austria 2Institute of Solid State Electronics, Vienna University of Technology, Austria
Abstract: The present work reports on the first application of a ring-cavity-surface-emitting quantum-cascade laser (RCSE-QCL) for sensitive gas measurements. RCSE-QCLs are promising candidates for optical gas-sensing due to their single-mode, mode-hop-free and narrow-band emission characteristics along with their broad spectral coverage. The time resolved down-chirp of the RCSE-QCL in the 1227-1236 cm−1 (8.15-8.09 µm) spectral range was investigated using a step-scan FT-IR spectrometer (Bruker Vertex 80v) with 2 ns time and 0.1 cm−1 spectral resolution. The pulse repetition rate was set between 20 and 200 kHz and the laser device was cooled to 15-17°C. Employing 300 ns pulses a spectrum of ~1.5 cm−1 could be recorded. Under these laser operation conditions and a gas pressure of 1000 mbar a limit of detection (3σ) of 1.5 ppmv for hydrogen sulfide (H2S) in nitrogen was achieved using a 100 m Herriott cell and a thermoelectric cooled MCT detector for absorption measurements. Using 3 µs long pulses enabled to further extend the spectral bandwidth to 8.5 cm−1. Based on this increased spectral coverage and employing reduced pressure conditions (50 mbar) multiple peaks of the target analyte H2S as well as methane (CH4) could be examined within one single pulse.
1. B. Lendl, J. Frank, R. Schindler, A. Müller, M. Beck, and J. Faist, “Mid-infrared quantum cascade lasers for flow injection analysis,” Anal. Chem. 72(7), 1645–1648 (2000).
2. J. Kuligowski, G. Quintás, and B. Lendl, “High performance liquid chromatography with on-line dual quantum cascade laser detection for the determination of carbohydrates, alcohols and organic acids in wine and grape juice,” Appl. Phys. B 99(4), 833–840 (2010).
3. Y. Wang, M. G. Soskind, W. Wang, and G. Wysocki, “High-resolution multi-heterodyne spectroscopy based on Fabry-Perot quantum cascade lasers,” Appl. Phys. Lett. 104(3), 031114 (2014).
4. J. Faist, C. Gmachl, F. Capasso, C. Sirtori, D. L. Sivco, J. N. Baillargeon, and A. Y. Cho, “Distributed feedback quantum cascade lasers,” Appl. Phys. Lett. 70(20), 2670 (1997).
5. G. P. Luo, C. Peng, H. Q. Le, S. S. Pei, W.-Y. Hwang, B. Ishaug, J. Um, J. N. Baillargeon, and C.-H. Lin, “Grating-tuned external-cavity quantum-cascade semiconductor lasers,” Appl. Phys. Lett. 78(19), 2834 (2001).
6. G. Wysocki, R. F. Curl, F. K. Tittel, R. Maulini, J. M. Bulliard, and J. Faist, “Widely tunable mode-hop free external cavity quantum cascade laser for high resolution spectroscopic applications,” Appl. Phys. B 81(6), 769–777 (2005).
7. S. Slivken, N. Bandyopadhyay, Y. Bai, Q. Y. Lu, and M. Razeghi, “Extended electrical tuning of quantum cascade lasers with digital concatenated gratings,” Appl. Phys. Lett. 103(23), 231110 (2013).
8. A. Bismuto, Y. Bidaux, C. Tardy, R. Terazzi, T. Gresch, J. Wolf, S. Blaser, A. Muller, and J. Faist, “Extended tuning of mid-ir quantum cascade lasers using integrated resistive heaters,” Opt. Express 23(23), 29715–29722
(2015). 9. Y. Bidaux, A. Bismuto, C. Tardy, R. Terazzi, T. Gresch, S. Blaser, A. Muller, and J. Faist, “Extended and quasi-
continuous tuning of quantum cascade lasers using superstructure gratings and integrated heaters,” Appl. Phys. Lett. 107(22), 29715–29722 (2015).
10. S. Slivken, S. Sengupta, and M. Razeghi, “High power continuous operation of a widely tunable quantum cascade laser with an integrated amplifier,” Appl. Phys. Lett. 107(25), 251101 (2015).
11. J. Buus, M.-C. Amann, and D. J. Blumenthal, Tunable Laser Diodes and Related Optical Sources (Wiley-Interscience, 2005).
12. M. Brandstetter, A. Genner, C. Schwarzer, E. Mujagic, G. Strasser, and B. Lendl, “Time-resolved spectral characterization of ring cavity surface emitting and ridge-type distributed feedback quantum cascade lasers by step-scan FT-IR spectroscopy,” Opt. Express 22(3), 2656–2664 (2014).
13. J. Hodgkinson and R. P. Tatam, “Optical gas sensing: a review,” Meas. Sci. Technol. 24(1), 012004 (2013). 14. J. H. van Helden, N. Lang, U. Macherius, H. Zimmermann, and J. Röpcke, “Sensitive trace gas detection with
cavity enhanced absorption spectroscopy using a continuous wave external-cavity quantum cascade laser,” Appl. Phys. Lett. 103(13), 131114 (2013).
15. J. P. Waclawek, R. Lewicki, H. Moser, M. Brandstetter, F. K. Tittel, and B. Lendl, “Quartz-enhanced photoacoustic spectroscopy-based sensor system for sulfur dioxide detection using a CW DFB-QCL,” Appl. Phys. B 117(1), 113–120 (2014).
16. C. Reidl-Leuthner and B. Lendl, “Toward stand-off open-path measurements of NO and NO(2) in the sub-parts per million meter range using quantum cascade lasers (QCLs) in the intra-pulse absorption mode,” Appl. Spectrosc. 67(12), 1368–1375 (2013).
17. C. Reidl-Leuthner, A. Viernstein, K. Wieland, W. Tomischko, L. Sass, G. Kinger, J. Ofner, and B. Lendl, “Quasi-simultaneous in-line flue gas monitoring of NO and NO₂ emissions at a caloric power plant employing mid-IR laser spectroscopy,” Anal. Chem. 86(18), 9058–9064 (2014).
18. C. Reidl-Leuthner, J. Ofner, W. Tomischko, H. Lohninger, and B. Lendl, “Simultaneous open-path determination of road side mono-nitrogen oxides employing mid-IR laser spectroscopy,” Atmos. Environ. 112(2), 189–195 (2015).
19. J. B. McManus, D. D. Nelson, S. C. Herndon, J. H. Shorter, M. S. Zahniser, S. Blaser, L. Hvozdara, A. Muller, M. Giovannini, and J. Faist, “Comparison of cw and pulsed operation with a TE-cooled quantum cascade infrared laser for detection of nitric oxide at 1900 cm-1,” Appl. Phys. (Berl.) 85(2), 235–241 (2006).
20. B. Tuzson, M. Mangold, H. Looser, A. Manninen, and L. Emmenegger, “Compact multipass optical cell for laser spectroscopy,” Opt. Lett. 38(3), 257–259 (2013).
21. D. Herriott, H. Kogelnik, and R. Kompfner, “Off-axis paths in spherical mirror interferometers,” Appl. Opt. 3(4), 523–526 (1964).
22. J. B. McManus, M. S. Zahniser, and D. D. Nelson, “Dual quantum cascade laser trace gas instrument with astigmatic Herriott cell at high pass number,” Appl. Opt. 50(4), A74–A85 (2011).
23. B. H. Lee, E. C. Wood, M. S. Zahniser, J. B. McManus, D. D. Nelson, S. C. Herndon, G. W. Santoni, S. C. Wofsy, and J. W. Munger, “Simultaneous measurements of atmospheric HONO and NO2 via absorption spectroscopy using tunable mid-infrared continuous-wave quantum cascade lasers,” Appl. Phys. (Berl.) 2, 417-423 (2010).
24. B. G. Lee, M. Belkin, C. Pflugl, L. Diehl, H. Zhang, R. M. Audet, J. MacArthur, D. P. Bour, S. W. Corzine, G. E. Hufler, and F. Capasso, “DFB Quantum Cascade Laser Arrays,” IEEE J. Quantum Electron. 45(5), 554–565 (2009).
25. B. G. Lee, H. Zhang, C. Pflugl, L. Diehl, M. Belkin, M. Fischer, A. Wittmann, J. Faist, and F. Capasso, “Broadband Distributed-Feedback Quantum Cascade Laser Array Operating From 8.0 to 9.8 μm,” IEEE Photonics Technol. Lett. 21(13), 914–916 (2009).
26. M. Carras, G. Maisons, B. Simozrag, V. Trinite, M. Brun, G. Grand, P. Labeye, and S. Nicoletti, “Monolithic tunable single source in the mid-IR for spectroscopy,” Proc. SPIE 8631, 863113 (2013).
27. E. Mujagić, S. Schartner, L. K. Hoffmann, W. Schrenk, M. P. Semtsiv, M. Wienold, W. T. Masselink, and G. Strasser, “Grating-coupled surface emitting quantum cascade ring lasers,” Appl. Phys. Lett. 93(1), 011108 (2008).
28. E. Mujagić, L. K. Hoffmann, S. Schartner, M. Nobile, W. Schrenk, M. P. Semtsiv, M. Wienold, W. T. Masselink, and G. Strasser, “Low divergence single-mode surface emitting quantum cascade ring lasers,” Appl. Phys. Lett. 93(16), 161101 (2008).
29. E. Mujagić, M. Nobile, H. Detz, W. Schrenk, J. Chen, C. Gmachl, and G. Strasser, “Ring cavity induced threshold reduction in single-mode surface emitting quantum cascade lasers,” Appl. Phys. Lett. 96(3), 031111 (2010).
30. E. Mujagić, C. Schwarzer, Y. Yao, J. Chen, C. Gmachl, and G. Strasser, “Two-dimensional broadband distributed-feedback quantum cascade laser arrays,” Appl. Phys. Lett. 98(14), 141101 (2011).
31. C. Schwarzer, E. Mujagić, S. Il Ahn, A. M. Andrews, W. Schrenk, W. Charles, C. Gmachl, and G. Strasser, “Grating duty-cycle induced enhancement of substrate emission from ring cavity quantum cascade lasers,” Appl. Phys. Lett. 100(19), 191103 (2012).
32. C. Schwarzer, R. Szedlak, S. Il Ahn, T. Zederbauer, H. Detz, A. Maxwell Andrews, W. Schrenk, and G. Strasser, “Linearly polarized light from substrate emitting ring cavity quantum cascade lasers,” Appl. Phys. Lett. 103(8), 081101 (2013).
33. R. Szedlak, C. Schwarzer, T. Zederbauer, H. Detz, A. Maxwell Andrews, W. Schrenk, and G. Strasser, “On-chip focusing in the mid-infrared: Demonstrated with ring quantum cascade lasers,” Appl. Phys. Lett. 104(15), 151105 (2014).
34. B. Schwarz, P. Reininger, H. Detz, T. Zederbauer, A. Maxwell Andrews, S. Kalchmair, W. Schrenk, O. Baumgartner, H. Kosina, and G. Strasser, “A bi-functional quantum cascade device for same-frequency lasing and detection,” Appl. Phys. Lett. 101(19), 191109 (2012).
35. A. Harrer, R. Szedlak, B. Schwarz, H. Moser, T. Zederbauer, D. MacFarland, H. Detz, A. M. Andrews, W. Schrenk, B. Lendl, and G. Strasser, “Mid-infrared surface transmitting and detecting quantum cascade device for gas-sensing,” Sci. Rep. 6, 21795 (2016).
36. Z. Liu and D. Wasserman, “Room-temperature continuous-wave quantum cascade lasers grown by MOCVD without lateral regrowth,” Photonics 18(12), 1347–1349 (2006).
37. W. Uhmann, A. Becker, C. Taran, and F. Siebert, “Time-Resolved FT-IR Absorption Spectroscopy Using a Step-Scan Interferometer,” Appl. Spectrosc. 45(3), 390–397 (1991).
38. T. J. Johnson, A. Simon, J. M. Weil, and G. W. Harris, “Applications of time-resolved step-scan and rapid-scan FT-IR spectroscopy: dynamics from ten seconds to ten nanoseconds,” Appl. Spectrosc. 47(9), 1376–1381 (1993).
39. J. B. McManus, P. L. P. Kebabian, and M. S. M. Zahniser, “Astigmatic mirror multipass absorption cells for long-path-length spectroscopy,” Appl. Opt. 34(18), 3336–3348 (1995).
40. H. Siebert, Anwendungen der Schwingungsspektroskopie in der Anorganischen Chemie (Springer Verlag, 1966). 41. H. a. Jahn, “A New Coriolis Perturbation in the Methane Spectrum. I. Vibrational-Rotational Hamiltonian and
Wave Functions,” Proc. R. Soc. A Math. Phys. Eng. Sci. 168(935), 469–495 (1938). 42. S. N. Mikhailenko, Y. L. Babikov, and V. F. Golovko, “Information-calculating system Spectroscopy of
Atmospheric Gases. The structure and main functions,” Atmos. Oceanic Opt. 18(9), 685–695 (2005). 43. L. S. Rothman, I. E. Gordon, Y. Babikov, A. Barbe, D. Chris Benner, P. F. Bernath, M. Birk, L. Bizzocchi, V.
Boudon, L. R. Brown, A. Campargue, K. Chance, E. A. Cohen, L. H. Coudert, V. M. Devi, B. J. Drouin, A. Fayt, J.-M. Flaud, R. R. Gamache, J. J. Harrison, J.-M. Hartmann, C. Hill, J. T. Hodges, D. Jacquemart, A. Jolly, J. Lamouroux, R. J. Le Roy, G. Li, D. A. Long, O. M. Lyulin, C. J. Mackie, S. T. Massie, S. Mikhailenko, H. S. P. Müller, O. V. Naumenko, A. V. Nikitin, J. Orphal, V. Perevalov, A. Perrin, E. R. Polovtseva, C. Richard, M. A. H. Smith, E. Starikova, K. Sung, S. Tashkun, J. Tennyson, G. C. Toon, V. G. Tyuterev, and G. Wagner, “The HITRAN2012 molecular spectroscopic database,” J. Quant. Spectrosc. Radiat. Transf. 130, 4–50 (2013).
44. R. A. McClatchey, W. S. Benedict, S. A. Clough, D. E. Burch, R. F. Calfee, K. Fox, L. S. Rothman, and J. S. Garing, “AFCRL atmospheric absorption line parameters compilation,” Environ. Res. Pap. 434, 1–86 (1973).
45. D. Weidmann, F. K. Tittel, T. Aellen, M. Beck, D. Hofstetter, J. Faist, and S. Blaser, “Mid-infrared trace-gas sensing with a quasi- continuous-wave Peltier-cooled distributed feedback quantum cascade laser,” Appl. Phys. B 79(7), 907–913 (2004).
46. B. Neidhart and W. Wegscheider, Quality in chemical measurements (Springer Science and Business Media, 2001).
47. W. Chen, A. A. Kosterev, F. K. Tittel, X. Gao, and W. Zhao, “H2S trace concentration measurements using off-axis integrated cavity output spectroscopy in the near-infrared,” Appl. Phys. B 90(2), 311–315 (2008).
48. F. Schmidt, Laser-based Absorption Spectrometry - Development of NICE-OHMS Towards Ultra-sensitive Trace Species Detection (2007).
49. A. Foltynowicz, F. M. Schmidt, W. Ma, and O. Axner, “Noise-immune cavity-enhanced optical heterodyne molecular spectroscopy: Current status and future potential,” Appl. Phys. B 92(3), 313–326 (2008).
50. A. Varga, Z. Bozóki, M. Szakáll, and G. Szabó, “Photoacoustic system for on-line process monitoring of hydrogen sulfide (H2S) concentration in natural gas streams,” Appl. Phys. B 85(2), 315–321 (2006).
1. Introduction
Since their first realization in 1994, quantum cascade lasers (QCLs) have developed from research devices to powerful light sources for practical use in applied infrared spectroscopy. The first devices showing cascaded intersubband transitions in an AlInAs/GaInAs heterostructure could only be operated in pulsed mode at cryogenic temperatures and showed multi-mode emission with peak power of a few µW only. Resonator designs of such early architecture were based on Fabry-Perot (FP) [1] cavities. As FP-QCLs emit multimodal over a wide spectral range they tend to have limited applicability for applied infrared gas spectroscopy and even for condensed phase applications an external sample modulation is required for achieving the required selectivity [2]. In spite of the great progress achieved in high resolution spectroscopy using FP-QCL sources [3], for many applications the use of single mode sources is beneficial. Up to date, the spectral coverage of QCLs extends from below 3 µm over the mid-IR spectral range to the far-infrared and THz regime. Furthermore, concerning the mid-IR spectral range, single-mode emission in pulsed as well as in continuous wave (cw) mode are state of the art. Also resonator designs were improved over
the years with the distributed feedback (DFB) [4] and the external cavity (EC) [5] approach being the most prominent ones. Depending on the application in mind different properties of a given QCL may be of special relevance. Properties to be considered include, among others, pulse peak power, cw-operation, line widths as well as spectral coverage.
A general aim with respect to the ongoing development of QCLs for sensing applications is to reduce the line width of the emitted radiation to a minimum while achieving a spectral coverage as large as possible. So far EC-QCLs offer the largest tuning range which, depending on the employed gain medium, may cover up to several hundreds of wavenumbers. Operated in pulsed mode these lasers are good candidates for condensed phase spectroscopy and have found their applications in far-field as well as near-field infrared microscopy, stand-off measurements of solid residues as well as in the measurement of liquids. Unfortunately, these devices are not ideal for gas spectroscopy as even concerning their mode-hop free version practical issues arise with regard to mono-mode emission over a few tens of wavenumbers [6].
In recent years various methods for extending the tuning range were investigated by exploiting the large width of the gain curve of semiconductor lasers and the full gain width of optical amplifiers. Promising results could be achieved by modification of the sampled grating distributed feedback laser architecture with digital concatenated gratings [7], by incorporation of a buried microscopic heater element close to the active region [8], by integration of Vernier-effect distributed Bragg reflectors based on superstructure gratings [9] or by integrating an asymmetric sampled grating distributed feedback tunable laser with an optical amplifier [10]. It is characteristic of the various schemes for extended tuning that the resulting wavelength is no longer a relatively simple monotonous function of a single control parameter. Instead, it is often necessary to use two or more control variables (quasicontinuous tuning) [11]. In this manner the reported full tuning ranges will span between 9 and 14 cm−1 [8], [9] and can reach up to 120-236 cm−1 [7], [10].
The high quality requirements in terms of single mode emission and wavelength stability as needed for trace gas sensing are, however, met by DFB-type QCLs [12]. Commercial DFB-QCLs are configured as ridge lasers which are designed for edge emission. These lasers can be tuned by changing the temperature of the gain medium. The resulting tuning range covers thus a few wavenumbers only, and this is why typically one analyte is targeted by a given DFB-QCL.
Several different optical setups for quantitative gas phase spectroscopy using QCLs have been demonstrated already and the used techniques were recently reviewed [13]. These include, cavity enhanced absorption spectroscopy [14], quartz-enhanced photoacoustic spectroscopy [15] and open-path setups [16], which were all successfully applied to industrial [17] and environmental monitoring [18]. The most ‘straightforward’ setups for gas measurements in the mid-infrared spectral region using QCLs are based on absorbance measurements in multi-reflection cells [19]. While special cell types were successfully tested [20], the basic cell type for laser spectroscopy is the so called Herriott cell [21]. Common multi-gas analyzers based on QCLs suffer from the required space to combine the beam lines of different lasers to one gas cell [22]. These setups are typically based on multiple QCLs in separated packages, even if the spectral distance between the target absorptions is small [23].
Recently, different strategies were proposed to improve the spectral coverage while maintaining the high quality of single-line emission of DFB-QCLs. Processing different, individually addressable, ridge type DFB-QCLs on a single chip as an array allows to produce a laser source [24], [25] covering several tens of wavenumbers that still features a spectral resolution smaller than 0.01 cm−1. A further refinement of this concept concerns fusion of an optical coupler to the monolithically produced DFB-QCL array to achieve emission from a single spot [26].
Ring-cavity surface emitting (RCSE) QCLs represent a novel alternative [27] to commercially available ridge-type DFB-QCLs. In contrast to these edge emitting DFB-QCLs
wavelength selection and surface emission are made possible by radial second-order Bragg gratings etched in the top cladding of the gain material. The diameter of the surface emitting rings is in the order of a few hundreds of micrometer. Therefore, the beam divergence of RCSE-QCLs is only a few degrees [28] as compared to a few tens of degrees in case of edge emitting ridge lasers. This facilitates coupling of the emitted light in an optical system. Concerning peak optical power, threshold current and slope-efficiency the performance of RCSE-QCLs is improved when compared to ridge-type DFB-QCLs made of the same gain medium [12]. A further characteristic of these lasers is their broad tuning range, mode-hop-free operation and beam stability during operation [29]. Arrangement of several RCSE-QCLs with slightly different grating periods at each ring allows taking advantage of the whole spectral range provided by the used gain medium. An effective spectral coverage of 180 cm−1 was already demonstrated in 2011 [30]. In order to address the potential disadvantage of the RCSE design and its non-Gaussian output in the far-field, further improvement of the emitted radiation is possible using collimated substrate emission of RCSE-QCLs with on-chip focusing elements [31–33] or by modification of the distributed feedback grating by application of two π-phase-shifts at an angular distance of 180°. In this way a focused, central lobed and linearly polarized far field is achieved without external optics [32].
An innovative design of the QCL active region allows fabrication of a laser and a detector on the same chip [34], which reduces the sensor size and opens the door to new spectroscopic concepts [35].
Here we report on the first use of RCSE-QCL for gas spectroscopy. A widely tunable RCSE-QCL was operated in pulsed mode and coupled into an astigmatic Herriott cell and combined with a fast thermoelectrically cooled MCT detector. The laser down chirp produced by the pulsed mode-hop free RCSE-QCL was used for the simultaneous measurement of hydrogen sulfide (H2S) and methane (CH4).
2. Materials and methods
2.1 Laser and instrumentation for laser characterization
The QCL device used in this scope of work was based on the substrate P51 [36] and was processed as a RCSE-QCL [27]. By assuming an effective refractive index of neff = 3.18 and aiming for a emission wavenumber of 1234 cm−1 at room temperature, a grating period of the 2nd order was calculated to be 2.547 μm (481 slits) and realized. An in-house developed laser driver and TEC unit was used to control the injection current for pulsed operation of the RCSE-QCL and to adjust and stabilize the laser operation temperature to 0.1 K. Single mode emission at different operation parameters could be verified by recording spectra with an FT-IR spectrometer (Vertex 80v, Bruker Optics, Germany) equipped with a photovoltaic liquid nitrogen cooled MCT detector (Kolmar Technologies, USA) using the external source input port. Moreover, time-resolved step-scan FT-IR [37,38] measurements with a time resolution of 2 ns and a spectral resolution of 0.075 cm−1 were performed to characterize the laser chirp with this FT-IR spectrometer [12]. For recording the signal produced by a single laser pulse a transient recorder board (Spectrum GmbH, Germany) with an 8 bit resolution and 500 MS/s sample rate was used. The laser pulse repetition rate was set between 20 and 200 kHz and the temperature of the laser was set between 15 and 17 °C.
2.2 Optical setup for the H2S detection in CH4 containing nitrogen
The experimental set-up for absorbance measurements was designed to enable recording of the background spectrum as well as the sample spectrum using one detector. This was achieved by pulsed operation of the laser and splitting of the laser pulse at a beam splitter. Whereas one part of the laser pulse was directly focused onto a TE cooled MCT detector (PVI-2TE-10.6, Vigo Systems) the second part was delayed by passing a 100 m Herriott gas cell (AMAC100, Aerodyne Inc.) [39] before impinging on the same detector. This
configuration allowed separating background and sample spectrum in time for laser pulses up to pulse lengths of 300 ns. For experiments relying on pulse durations >300 ns the beam splitter had to be removed in order to prevent overlapping of the reference and probe pulses on the same detector. In order to calculate absorbance values, a synthetic background spectrum had to be reconstructed from the probe pulses exiting the multipass cell and containing spectral features of the analytes. The synthetic background spectrum was obtained by fitting the pulse intensity envelope via a higher order polynomial function and subsequently used for calculation of the corresponding absorbance spectrum. To facilitate alignment of the optical set-up a HeNe-trace laser beam was used. The Herriott cell was operated at pressures ranging from 50 mbar to 1000 mbar. At low pressure conditions the ro-vibrational bands of the analyte H2S could be resolved during short laser pulses. A calibration curve for H2S in nitrogen was recorded holding the cell pressure constant at 1000 mbar. Temperature was kept at room-temperature level throughout all experiments. Recording of the amplified detector signal was performed using an oscilloscope (14 bit, 600 MHz bandwidth, LeCroy Waverunner 64 Xi, Teledyne LeCroy SA, CH). For improving the signal to noise ratio, 1 k samples were internally averaged. A schematic and a picture of the full configuration including mirrors and lenses are given in Fig. 1.
Fig. 1. Schematic (a) and actual picture (b) of the optical setup. M…mirrors, L…lenses and, OAP M…off axis parabolic mirrors.
In order to confirm the correct wavelength calibration reference gas cells were used and inserted into the optical path as required. These cells, designed with an optical path-length of 5 cm, are filled with the single target analytes with 98% H2S and 5% CH4 backfilled with N2 to a total pressure of 50 mbar. They are sealed with wedged and Brewster angle tilted CaF2 windows.
3. The H2S / CH4 system in the mid-infrared spectral region
Based on the available RCSE-QCL substrate and processing of the laser grating, the mid-infrared spectral region between 1236 and 1227 cm−1 was available. This region is characterized by the overlapping of the ν2 (A1) bending-mode transition of H2S (C2v symmetry) and the ν4 (F2) bending mode of CH4 (Td symmetry) [40]. Further a Coriolis-coupling of the ν4(F2) and the ν2(E) appears, causing the presence of ν4-ν2-coupled ro-vibrational transitions [40,41] in this spectral window.
With regard to selection of the most appropriate absorption lines for measuring H2S in the presence of CH4 reference spectra were calculated [42] based on the HITRAN [43] database (Fig. 2). Using the available RCSE-QCL the ro-vibrational transitions corresponding to the ν2 bending-mode of H2S as listed in Table 1 were accessible. The rotational levels of H2S being a three-dimensional asymmetric top rotator with three different reciprocal moment of inertia are labeled by the three standard quantum numbers J, Ka and Kc [44]. For pulses with durations of 300 ns, the accessible spectral range was limited to 1235.4-1233.8 cm−1. Hence,
the measured H2S band centered at 1234.5 cm−1 is a sum of 4 basic ro-vibrational transitions of the ν2 bending-mode, which could partly be resolved by measuring at reduced pressure.
Table 1. Main ro-vibrational transitions of the ν2 bending-mode of H2S in the spectral region 1236-1227 cm−1.
Wavenumber (cm−1) Linestrenght (cmmol−1) RVSlow* [J Ka Kc]
* quantum numbers of higher and lower ro-vibrational state (RVS)
Fig. 2. Accesible linestrenghts of H2S and CH4 in the 1236-1227 cm−1 spectral region. For 300 ns pulses, the accessible spectral range was limited to 1235.4-1233.8 cm−1
4. Results and discussion
4.1 Measurement of the laser chirp, determination and validation of wavenumber calibration
The temporal and spectral behavior of the pulsed laser radiation was characterized by step-scan FT-IR spectroscopy and the obtained data was subsequently used for wavelength calibration of the laser chirp and is plotted in Fig. 3. The measured laser pulse was fitted to
the following logarithmic decay expression, termed transfer function which maps the laser emission wavelength in terms of wavenumber as a function of pulse time:
0( ) ln( ),v t v tα β= − ⋅ + (1)
where t denotes the pulse time as the independent variable and v0, α and β are the fitting parameters [45]. Having determined such expressions for a set of operating conditions, these transfer functions could be used for wavenumber calibration during the gas sensing experiments. As an example, v0 = 1154.3728, α = 5.8419 and β = 9.3623E-7 as the fit parameters for the logarithmic transfer function (Eq. (1) were obtained for a 3 µs pulse length, an operation temperature of 17 °C and a pulse current of 700 mA.
As shown in Fig. 3(a)-3(c) employing an intra-pulse time of 300 ns and depending on the supplied current (400-700 mA), a spectral down-chirp range between 1.2 cm−1 and 1.7 cm−1 could be recorded. Long pulses of >3 µs and injection current levels between 400 mA and 700 mA enabled to cover a spectral bandwidth of up to 8.5 cm−1. The results of the intra-pulse characteristics and tuning ranges for 3 µs pulses are outlined in Fig. 3(d)-(f).
Fig. 3. Different achievable tuning ranges and intra-pulse characteristics for low current 300 ns (a), medium current 300 ns (b), high current 300 ns (c), low current 3 µs (d), medium current 3 µs (e) and high current 3 µs RCSE-QCL pulses (f).
The tuning behavior of the pulsed laser was furthermore validated using the set-up for gas sensing and by inserting the two reference cells into the optical path. In Fig. 4 the intensities recorded during a 3 µs long pulse with 98%v H2S and 5%v CH4 present as absorbing gases in the reference cells are given along with the previously determined transfer function. The strongly structured pulse shape between onset and ~30% of the total intra pulse duration can be explained by transient changes in the thermal and electrical properties of the laser material. Compared to the short pulse durations, the much larger time constant of the cooling system gives rise to dynamic shifts of the operating point caused by the temperature changes of the laser structure. In order to calculate the corresponding absorbance spectrum a synthetic background spectrum had to be reconstructed by fitting the pulse intensity envelope via a higher order polynomial function. In Fig. 5 the calculated absorbance spectrum is plotted together with the simulated spectra using information contained in the HITRAN database concerning wavenumber and strength of the corresponding lines for hydrogen sulfide as well as for methane in the investigated spectral region as well as spectral broadening at a pressure of 50 mbar.
Fig. 4. A 3 µs long pulse with 98%v H2S and 5%v CH4 in the 5 cm reference cells at 50 mbar along with the tuning logarithmic fit.
Fig. 5. Resulting absorption spectrum with the different analyte contributions of H2S and CH4 (top and middle) and the according linestrengths of the contributing analytes (bottom).
The line positions and lineshapes of the H2S and CH4 features in the range between 1235 cm−1 and 1229 cm−1 could be spectrally reproduced as expected from Table 1 and are in good agreement with the HITRAN simulations.
4.2 Resolving H2S ro-vibrational features at reduced gas pressure
For the study of spectrally resolved ro-vibrational features a spectral region containing 4 transitions of H2S was selected. According to the HITRAN database three, closely spaced transitions (1234.5767, 1234.5830 and 1234.6113 cm−1) as well as a forth line at 1234.4351 cm−1 are to be expected. Experimental conditions were set such that a background and sample spectrum could be recorded from a single laser pulse. In Fig. 6(a) data recorded from 200 ns laser pulses measuring a gas sample containing 500 ppmv H2S at different gas pressures are shown. Successful low pressure resolution of the ro-vibrational features can be observed starting from 400 mbar downwards. Whereas a clear separation of the transition at 1234.4351 cm−1 from the group of three transitions and centered at 1234.59 cm−1 could be achieved, the latter three transitions were not resolved even at further reduced gas pressures. The resulting absorption spectrum at 200 mbar is shown in Fig. 6(b) and compared with HITRAN simulations showing excellent agreement. However, the strongly structured features at the pulse shape edges caused by transient changes in the thermal and electrical properties of the laser material and stemming from optical fringes are eventually the cause for the baseline noise between 25 ns and 75 ns.
Fig. 6. (a) Short 200 ns pulses with 500 ppmv H2S at different cell pressures and the resulting absorption spectra (inset); (b) Experimental data and HITRAN simulation of a short 200 ns pulse with 500 ppmv H2S at 200 mbar cell pressure demonstrating low pressure resolution of the ro-vibrational features.
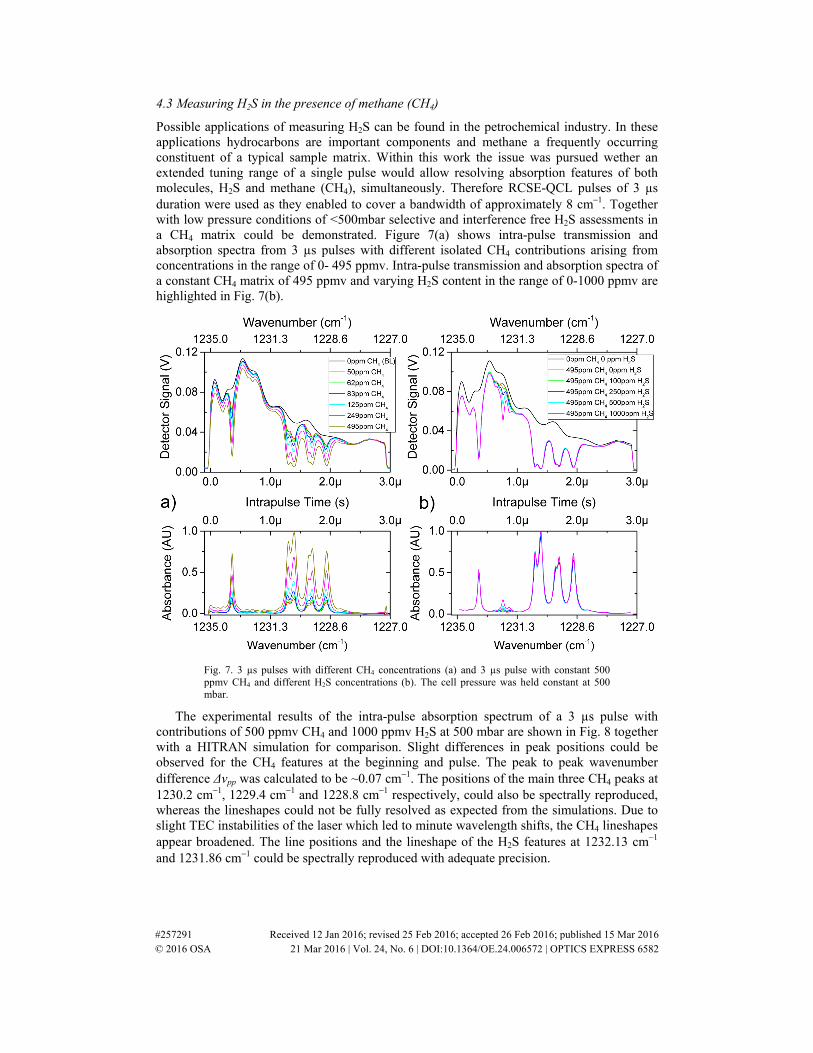
4.3 Measuring H2S in the presence of methane (CH4)
Possible applications of measuring H2S can be found in the petrochemical industry. In these applications hydrocarbons are important components and methane a frequently occurring constituent of a typical sample matrix. Within this work the issue was pursued wether an extended tuning range of a single pulse would allow resolving absorption features of both molecules, H2S and methane (CH4), simultaneously. Therefore RCSE-QCL pulses of 3 µs duration were used as they enabled to cover a bandwidth of approximately 8 cm−1. Together with low pressure conditions of <500mbar selective and interference free H2S assessments in a CH4 matrix could be demonstrated. Figure 7(a) shows intra-pulse transmission and absorption spectra from 3 µs pulses with different isolated CH4 contributions arising from concentrations in the range of 0- 495 ppmv. Intra-pulse transmission and absorption spectra of a constant CH4 matrix of 495 ppmv and varying H2S content in the range of 0-1000 ppmv are highlighted in Fig. 7(b).
Fig. 7. 3 µs pulses with different CH4 concentrations (a) and 3 µs pulse with constant 500 ppmv CH4 and different H2S concentrations (b). The cell pressure was held constant at 500 mbar.
The experimental results of the intra-pulse absorption spectrum of a 3 µs pulse with contributions of 500 ppmv CH4 and 1000 ppmv H2S at 500 mbar are shown in Fig. 8 together with a HITRAN simulation for comparison. Slight differences in peak positions could be observed for the CH4 features at the beginning and pulse. The peak to peak wavenumber difference Δνpp was calculated to be ~0.07 cm−1. The positions of the main three CH4 peaks at 1230.2 cm−1, 1229.4 cm−1 and 1228.8 cm−1 respectively, could also be spectrally reproduced, whereas the lineshapes could not be fully resolved as expected from the simulations. Due to slight TEC instabilities of the laser which led to minute wavelength shifts, the CH4 lineshapes appear broadened. The line positions and the lineshape of the H2S features at 1232.13 cm−1 and 1231.86 cm−1 could be spectrally reproduced with adequate precision.
Fig. 8. Experimental data and HITRAN simulation of the intrapulse tuning of a 3 µs pulse with contributions of 500ppmv CH4 and 1000ppmv H2S at 500 mbar.
4.4 Calibration of the H2S measurements and determination of the limit of detection (LOD)
The calibration of H2S inside the 100 m Herriott cell and the determination of the related limit of detection (LOD) was performed by applying laser pulses of 300 ns as shown in Fig. 9(a). According to the step-scan FT-IR measurements, the ro-vibrational transitions of Table 1 marked “accessible” could be probed. Different H2S concentrations from 50 ppm down to 1 ppm were applied and the related absorption spectra calculated as outlined in Fig. 9(b). Each point of the calibration curve in Fig. 10 correlates to an averaging of 10 samples and good linearity between integrated absorbance and H2S concentrations is observed. The corresponding limit of detection (LOD) was ascertained with the VALIDATA software package [46] at three times the standard deviation (3σ) of the intercept divided by the slope of the calibration curve, which resulted in 1.5 ppmv. Analysis of the residuals provided a convenient means of confirming the linearity of the calibration data.
In the aspect of process analytical integration and applicability sub-ppmv detection of H2S concentration levels is essential for production control and environmental monitoring purposes. When measuring H2S by IR spectroscopy high sensitivities are difficult to achieve due to the intrinsically weak linestrenghts of the H2S ro-vibrational features within the spectral range covered by diode lasers. Although detection of H2S concentrations levels of several ppbv has been demonstrated by employing integrated cavity output spectroscopy approaches [47], such sensitivities are difficult to obtain in field measurements as the robustness of these kind of systems remain limited [48,49]. A fully developed and industry tailored H2S sensor based on photoacoustic spectroscopy and a LOD of 0.5 ppmv is described in [50].
Fig. 10. Calibration curve of 0-25 ppmv H2S. The calculated LOD was ~1.5 ppmv.
5. Conclusions
The presented work showed the applicability of pulsed ring cavity surface emitting quantum cascade lasers (RCSE QCL) for gas measurements for the first time. Pulse length between 200 ns and 3 µs as well as pulse currents ranging from 400 to 700 mA were applied covering spectral bandwidths up to 8.5 cm−1, as revealed by step-scan FT-IR spectrometry. The ring-type cavity allows single-mode and mode-hop-free emission. Gas measurements were conducted in a 100 m astigmatic Herriott cell. When applying short pulses (200-300 ns) and using a beam splitter it was possible to measure a background and sample spectrum with a single thermoelectrically cooled MCT detector from a single laser pulse. The investigated target analyte was hydrogen sulfide (H2S), present either in pure nitrogen or in nitrogen containing methane (CH4) as possible interferent. With the developed set-up a LOD (3σ) of 1.5 ppmv for H2S could be obtained by evaluating the corresponding transitions in the spectral region from 1234.4 to 1234.7 cm−1. Planned research will benefit from the flexibility in the design of RCSE QCLs. Construction of multiple rings either side by side or in a centered configuration will allow for a further extended spectral coverage. Also integration of resonant cavities and detectors in one device is possible opening the path for highly miniaturized, sensitive gas sensors for detecting multiple gas molecules.
Acknowledgment
The authors acknowledge the Austrian Research Promotion Agency (FFG) within the K- project imPACts (contract no. 843546) for funding.