ENHANCEMENT OF POWER SECURITY ON NIGERIAN 330KV NETWORK
Jinkai Haruna1, Saidu Yerima Musa2, Zando John3
1, 3Post Graduate Student, Department of Electrical and Electronics Engineering, Modibbo Adama University of Technology Yola, Adamawa State, Nigeria
2Lecturer, Department of Electrical and Electronics Engineering, Modibbo Adama University of Technology Yola, Adamawa State, Nigeria
---------------------------------------------------------------------***---------------------------------------------------------------------Abstract - This paper presents the application of Unified Power Flow Controller (UPFC) for enhancement of power security on Nigeria’s national grid by minimizing power loss in transmission lines. The UPFC is used because it is the most versatile among the Flexible Alternating Current Transmission System (FACTS) family. Voltage sensitivity index method is used to determine the most appropriate location for the UPFC and bat algorithm optimization technique is used for finding the optimal size of the UPFC. Simulation results obtained before and after connecting the UPFC show net active and reactive power losses reducing from 106.58MW and 703.75MVAr to 84.23MW and 597.50MVAr respectively. Bus voltage enhancement was archived on most of the load buses with maximum enhancement of 0.1 pu recorded on three buses. Keywords: (UPFC, Power System Security, Voltage Sensitivity Index, Bat Algorithm)
1. INTRODUCTION Due to continuous expansion of the Nigerian national electrical power network as a result of continuous increase in power demand on it, the existing state of the network is best described as being over stretched. The demand on it compared with its operational capability means that the installed facilities are fully utilized. A power systems operated at this state are closer to their thermal and stability limits and they are constantly subjected to contingencies [1]. The factors that set the system security are voltage deviation, system overload and real power losses [2]. These factors have led to the continuous search for methods of reducing them so as to improve the power system performance in terms of its overall security. One of such methods is the use of Flexible Alternating Current Transmission Systems (FACTS) devices.
The evolution of the FACTS technology is given in [3]. Since then different kind of FACTS controllers have been recommended. FACTS controllers are based on voltage and current source converters and include devices such as Static Var Compensators(SVCs), Static Synchronous Compensators (STATCOMs), Thyristor Controlled Series Compensators (TCSCs), Static Synchronous Series Compensators (SSSCs) and Unified Power Flow Controllers (UPFCs). Among them,
UPFC is the most versatile and efficient because it has the advantage of controlling the three transmission parameters, namely, voltage magnitude, line impedance and phase angle [4].
In the last decade, new algorithms have been
developed with the use of FACTs devices especially for the optimal power flow incorporated with UPFC device placement. Some of them are sensitivity-based approach [5], evolutionary-programming-based load flow algorithm [6], genetic algorithm [7], particle swarm optimization [8], genetic algorithm [9] and artificial neural network ANN [10], a self-adaptive differential evolutionary (SADE) algorithm [11]. All these methods were adopted in searching for the optimal location or size of the UPFC in the network.
There has been some application of the UPFC to
improve the performance of the Nigerian network. There are procedures of locating the UPFC [12-13], use of UPFC for transient enhancement [14], real and reactive power control [15], [23] and voltage stability enhancement [24]
In this paper, the real power loss function has been
optimized using a bat algorithm optimization technique. Voltage sensitivity Index (VSI) method is used to identify the most appropriate location for the UPFC on the Nigerian 330kV integrated power network [15]. The performance of the network before and after installation of the controller are analyzed.
2. METHODOLOGY
This work is carried out in the following logical sequence:
1. Development and implementation of a power flow analysis based on Newton-Raphson for the study system in other to determine pre compensation (base case) bus voltages, power available on the buses and the power loss in each branch of the network.
2. Computation of voltage sensitivity indices (VSIs) for all the load buses of the study system to determine the weakest bus which is the optimal location for UPFC placement in the network.
International Research Journal of Engineering and Technology (IRJET) e-ISSN: 2395-0056
Volume: 07 Issue: 05 | May 2020 www.irjet.net p-ISSN: 2395-0072
3. Determination of optimal size of the UPFC using bat algorithm.
4. Evaluation of the benefit of this work on the Nigerian 31 bus transmission network.
2.1 Power Flow Analysis (PFA):
Power flow analysis, well documented in several literatures, is the method used to determine the steady state operational state of an interconnected power system using some known variables on its buses. The main objective of PFA is to obtain the system bus voltages in both magnitude and phase angle. Once this is done, it becomes possible to estimate the amount of power flow and losses in the system lines. Power flow is basically solving the complex and nonlinear power balance equations given in Equations (1) and (2).
1
2
PFA is implemented in the following procedure: Step 1: Form the nodal admittance matrix (Yij).
Step2: Initialization: Set one of the generator buses (N) as the slack bus with voltage magnitude |VN|=1 and angle N =0.0. For the load buses, real power Pisch and reactive power Q is being specified. Voltage magnitudes and phase angles are initialized with the slack bus values. For the generator buses, Vi and Pi are specified and the phase angles are set equal to the slack bus value. Initialize iteration counter k.
Step 3: Calculate the real power Pical and reactive power Qical
using equations (1) and (2) respectively.
Step 4: Form the Jacobian Matrix J.
Step 5: Calculate the power differences ΔPi and ΔQi for all the load buses using equations (3) and (4).
3
4
Step 6: Choose the tolerance values. Step 7: Stop the iteration if all ΔPi and ΔQi are within the tolerance values. Step 8: Update the values of Vi and δi using Equations (5) and (6) respectively.
(k 1) (k) (k)
i i iV V V 5
(k 1) (k) (k)
i i i 6
Step 9: Repeat from step 3 until all ΔPi and ΔQi are within the tolerance values.
2.2 Computation of Voltage Sensitivity Index(VSI)
A bus that cannot withstand its load due to inadequate reactive power support is termed a weak bus. The weakest bus is thus the most appropriate location for a compensator. One effective way of identifying weakest bus in a power system is to calculate one of several metrics of stability called stability indices. Many of these matrices have been developed by different researchers and made available in literature such as [18-20]. Among such indices are, Fast Voltage Stability Index (FVSI), Line Stability Index (Lmn), Voltage Collapse Prediction Index (VCPI) and Reactive Power Voltage Stability Index (RPVSI). Others are Power Transfer Stability Index (PTSI), Line Voltage Stability Index (LVSI), Equivalent Node Voltage Collapse Index (ENVCI) and many more.
The bus voltage of power system is more affected by reactive power than active power except in heavily loaded power system where the effect of active power on bus voltages can be noticeable [19]. Therefore, it is adequate to investigate bus voltage stability level by considering the variations of the bus voltage with the reactive power as (7).
7
The VSI in (7) is the Reactive Power Voltage Sensitivity Index (RPVSI). The computation of the RPVSI is by considering the linearized form of the nonlinear power balance equations. The linearized form is given in equation (8)
8
The reactive power is less sensitive to changes in phase angle and mainly dependent on changes in voltage magnitude. Similarly, the real power changes is less sensitive to the change in phase angle. So, it is quite accurate to set J2 and J3 in equation (8) to zero resulting in equation (9)
9
The RPVSI are computed as in equation (10).
} 10
A positive RPVSI is an indication of stable operation, the smaller the sensitivity index, the more stable the bus is, while the higher the sensitivity index, the weaker the bus.
2.3 Bat Algorithm BAT Algorithm is an optimization algorithm based
on the echolocation behavior of bats. The capability of
International Research Journal of Engineering and Technology (IRJET) e-ISSN: 2395-0056
Volume: 07 Issue: 05 | May 2020 www.irjet.net p-ISSN: 2395-0072
echolocation of bats is appealing as these bats can find their prey and discriminate between different types of insects even when they are in a complete darkness [21]. The advanced capability of echolocation of bats has been used to solve different optimization problems. Echolocation of bats works as a type of sonar in bats, where the bats emits a loud and short pulse of sound, wait as it hits into an object, the echo returns back to their ears. Thus, bats can compute how far they are from an object. In addition, this amazing orientation mechanism makes bats being able to distinguish the difference between an obstacle and a prey, allowing them to hunt even in a complete darkness.
Bats algorithm uses frequency tuning, it is in fact the
first algorithm of its kind in the context of optimization and computational intelligence. Each bat is encoded with a velocity and a location at iteration t, in a d-dimensional
search or solution space. The location can be considered as a solution vector to a problem of interest. Among the n bats in the population, the current best solution x∗ found so far can be archived during the iterative search process.
The Bat algorithm was developed with the following
characteristics:
1. All bats use echolocation to sense distance, and also know the difference between food/prey and background barriers in some magical way; 2. Bats fly randomly with velocity (vx) at position (xi) with a frequency (f) or wavelength (λ) and loudness (A0) to search for prey. They can automatically adjust the wavelength (or frequency) of their emitted pulses and adjust the rate of pulse emission r ∈ [0,1], depending on the proximity of their target; 3. Although the loudness can vary in many ways, we assume that the loudness varies from a large (positive) A0
to a minimum constant value Amin.
In this study, Bat Algorithm was used based on the following advantages especially over other methods. This includes:
1. Frequency Tuning: the BA uses echolocation and frequency tuning to solve problems. Though echolocation is not directly used to mimic the true function in reality, frequency variation is used, hence these made it to distinguish itself from the PSO, SA AND HS and other swam intelligent based algorithm. 2. Automatic Zooming: BA has a unique edge over other metaheuristic algorithm due to its capability of automatically zooming into a region where promising solutions have been found, thus guarantying a quick convergence rate at early stages compared to other algorithm. 3. Parameter control: many metaheuristic algorithms used fixed parameter by using some pre-tuned algorithm dependent parameter. Here, BA uses parameter control which can vary the values of the parameters (A and r) as the
iteration proceed. This provides an automatic switch from exploration to exploitation when the optimal solution is approaching.
According to [21], the mathematical equations for updating the locations and velocities can be written as:
fi = fmin + ( fmax – fmin) β 11 Vi
t = Vit-1 + ( xi
t –x* ) fi 12 Xi
t = Xit-1
+ vit 13
where β ∈ [0,1] is a random vector drawn from a uniform distribution.
Here x* is the current global best location (solution) after comparing all the solutions among all the n bats. A new solution for each bat is generated locally using random walk given by: xnew = xold + εAt 14
In addition, the loudness and pulse emission rates can be varied during the iterations. The following equations for varying the loudness and pulse emission rates is giving by Ai
t+1 = αAii 15
ri
t+1 = ri0 [1-exp (-γt ) 16
where 0 < α < 1 and γ > 0 are constants. For any 0 < α < 1 and y > 0, we have: Ai
t → 0. rit → ri
0 as t → ∞The initial loudness AO can typically be (1, 2), while the initial emission rate ri
0 can be (0, 1). 2.4 Objective Function
In this work, the aim is to minimize the real power losses in order to obtain maximum power transfer capability. Mathematically, the objective function can be written as [22],
17
Where 18
Gij is the conductance of line ij, Vi and Vj are the magnitudes of sending end and receiving end voltages of the line. δi and δj are the phase angles of the end voltages. Ntl is the number of transmission lines.
The equality constraints:
19
20
International Research Journal of Engineering and Technology (IRJET) e-ISSN: 2395-0056
Volume: 07 Issue: 05 | May 2020 www.irjet.net p-ISSN: 2395-0072
PGi is the real power generation at bus i, PDi is the power demand at bus i, Nb is the number of PQ nodes in the system. QGi is the reactive power generation at bus i, QDi is the reactive power demand at bus i, QCi is the reactive power from compensation nodes. The inequality constraints are:
Voltage limits for generator buses:
21
Where VGimin
is the minimum voltage at the generator bus, VGi is the actual voltage at the generator bus and VGi
max is the maximum voltage at the generator bus.
Real power generation limits:
22
Where PGimin is the minimum real power at the generator bus,
PGi is the actual real power at the generator bus and PGimax is
the maximum real power at the generator bus.
Reactive power generation limits:
23
Where QGimin is the minimum reactive power at the generator
bus, QGi is the actual reactive power at the generator bus and QGi
max is the maximum reactive power at the generator bus.
UPFC limits:
24
Where Vvrmin is the minimum shunt converter voltage
magnitude (p.u), Vvr is the actual shunt converter voltage (p.u) and Vvr
max is the maximum shunt converter voltage magnitude (p,u).
25
Where Vcrmin is the series converter voltage magnitude (p.u),
Vcr is the actual series converter voltage magnitude (p.u) and Vcr
max is the maximum series converter voltage magnitude (p.u)
2.5 Input Parameters of the Bat Algorithm
The table below shows the input data for the bat algorithm:
TABLE I INPUT PARAMETERS OF BATALGORITHM
S/N Parameters Quantity 1 Number of iterations 50 2 Number of population 20 3 Pulse rate 0.9 4 Loudness 0.9
2.6 Study System and Data Presentation
The transmission line data indicates the impedance per unit length on each line segment while the bus data includes information such as real power, reactive power, voltage magnitude and phase angle on each bus. The network has 31 buses of which nine (9) among these buses are generating stations i.e. generator bus, while the rest are load buses. One of the power station (Egbin power station) was chosen as the slack bus based on its location in the network and having the largest generating capacity [23]. This along with the one-line diagram is seen on the appendix of this paper.
3. RESULT The simulated result and analysis of this work is seen below 3.1 Optimal Location of the UPFC
The computed RPVSI for the Nigerian 330kV
network are given in Table II.
TABLE II: VSI RESULT FOR LOAD BUSES
From Table II, the bus with the highest RPVSI value
is bus 19, which is an indication of being the weakest bus and therefore the best location for the UPFC placement.
International Research Journal of Engineering and Technology (IRJET) e-ISSN: 2395-0056
Volume: 07 Issue: 05 | May 2020 www.irjet.net p-ISSN: 2395-0072
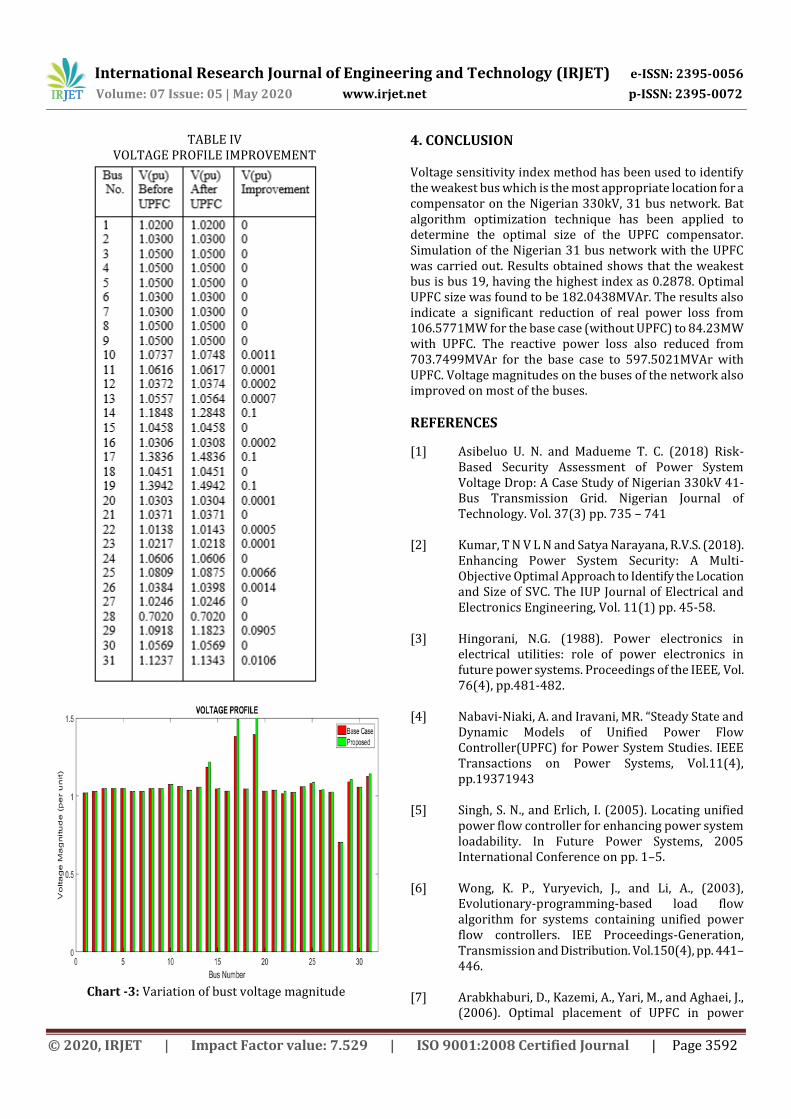
4. CONCLUSION Voltage sensitivity index method has been used to identify the weakest bus which is the most appropriate location for a compensator on the Nigerian 330kV, 31 bus network. Bat algorithm optimization technique has been applied to determine the optimal size of the UPFC compensator. Simulation of the Nigerian 31 bus network with the UPFC was carried out. Results obtained shows that the weakest bus is bus 19, having the highest index as 0.2878. Optimal UPFC size was found to be 182.0438MVAr. The results also indicate a significant reduction of real power loss from 106.5771MW for the base case (without UPFC) to 84.23MW with UPFC. The reactive power loss also reduced from 703.7499MVAr for the base case to 597.5021MVAr with UPFC. Voltage magnitudes on the buses of the network also improved on most of the buses.
REFERENCES
[1] Asibeluo U. N. and Madueme T. C. (2018) Risk-Based Security Assessment of Power System Voltage Drop: A Case Study of Nigerian 330kV 41-Bus Transmission Grid. Nigerian Journal of Technology. Vol. 37(3) pp. 735 – 741
[2] Kumar, T N V L N and Satya Narayana, R.V.S. (2018). Enhancing Power System Security: A Multi-Objective Optimal Approach to Identify the Location and Size of SVC. The IUP Journal of Electrical and Electronics Engineering, Vol. 11(1) pp. 45-58.
[3] Hingorani, N.G. (1988). Power electronics in
electrical utilities: role of power electronics in future power systems. Proceedings of the IEEE, Vol. 76(4), pp.481-482.
[4] Nabavi-Niaki, A. and Iravani, MR. “Steady State and
Dynamic Models of Unified Power Flow Controller(UPFC) for Power System Studies. IEEE Transactions on Power Systems, Vol.11(4), pp.19371943
[5] Singh, S. N., and Erlich, I. (2005). Locating unified
power flow controller for enhancing power system loadability. In Future Power Systems, 2005 International Conference on pp. 1–5.
[6] Wong, K. P., Yuryevich, J., and Li, A., (2003),
Evolutionary-programming-based load flow algorithm for systems containing unified power flow controllers. IEE Proceedings-Generation, Transmission and Distribution. Vol.150(4), pp. 441–446.
[7] Arabkhaburi, D., Kazemi, A., Yari, M., and Aghaei, J.,
(2006). Optimal placement of UPFC in power
International Research Journal of Engineering and Technology (IRJET) e-ISSN: 2395-0056
Volume: 07 Issue: 05 | May 2020 www.irjet.net p-ISSN: 2395-0072
systems using genetic algorithm. In IEEE International Conference on Industrial Technology. pp. 1694–1699.
[8] Saravanan, M., Slochanal, S. M. R., Venkatesh, P., and
Abraham, J. P. S. (2007). Application of particle swarm optimization technique for optimal location of FACTS devices considering cost of installation and system loadability. Electric Power System Research. Vol.77(3-4), pp. 276–283
[9] Ghahremani, E., and Kamwa, I. (2012, July).
Maximizing Transmission Capacity through a Minimum Set of Distributed Multi-Type FACTS. In Power and Energy Society General Meeting, 2012 IEEE, pp. 1-8.
[10] Mohanty, A., and Viswavandya, M. (2015). A novel
ANN based UPFC for voltage stability and reactive power management in a remote hybrid system. International Conference on Intelligent Computing, Communication and Convergence (ICCC-2014), Procedia Computer Science. Vol.48, pp. 555 – 560.
[11] Acharjee, P. (2016). Optimal power flow with UPFC
using security constrained self-adaptive differential evolutionary algorithm for restructured power system. International Journal of Electrical Power and Energy Systems, 76, pp. 69–81.
[12] Omorogiuwa, E., and Onohaebi, S. O. (2015).
Optimal location of IPFC in Nigeria 330KV Integrated power network using GA Technique. Journal of Electrical and Electronics. Vol. 4(1).
[13] Nwohu, M. N. (2010). Optimal Location of Unified
Power Flow Controller (UPFC) in Nigerian Grid System. International Journal of Electrical and Power Engineering. Vol. 4(2), pp. 147-153.
[14] Bakare, G. A., Aliyu, U. O., Haruna, Y. S., and Abu, U.
A. (2012). Transient enhancement of Nigerian Grid system using optimally tuned UPFC, Based on small population particle swarm optimization. Asian journal of Natural and Applied Sciences. Vol. 3(1), pp. 79-90.
[15] Musa S. Y. and Haruna J. (2020). Locating and Sizing
of Unified Power Flow Controller in Power System Network for Power Loss Minimization Using Voltage Sensitivity Index and Bat Algorithm. International Journal of Engineering Trends and Applications Vo. 7(2) pp 111-18
[16] Naik, P. (2014). Power system contingency ranking
using Newton Raphson load flow method and its
prediction using soft computing techniques (Doctoral dissertation)
[17] Pruthviraja L, Pradeepkumar F H, Ashok M and Mahesh Kumar B T. (2016). Load Flow Computation and Power Loss Reduction Using New Particle Swarm Optimization Technique. International Journal of Scientific Development and Research Vol.1(6) pp. 114-117.
[18] Bhadoriya, J.S., and Daheriya, C.K. (2014). An Analysis of Different Methodology for Evaluating Voltage Sensitivity. International Journal of Advanced Research in Electrical, Electronics and Instrumentation Engineering 3(9), pp. 12239-12246
[19] Moradi, R.A., Davarani, R.Z. and Safarzaei, M. (2017). Performance Evaluation of the Voltage Stability Indices in the Real Conditions of Power System. American Journal of Energy and Power Engineering, 4(5), pp. 6-12
[20] Amroune, M., Bourzami, A. and Bouktir, T. (2014). Weakest Buses Identification and Ranking in Large Power Transmission Network by Optimal Location of Reactive Power Supports. TELKOMNIKA Indonesian Journal of Electrical Engineering, 12(10), pp. 7123 – 7130
[21] Yang, X. –S. (2010). A new metaheuristic bat -
Inspired algorithm. Nature inspired Cooperative Strategies for Optimization Studies in Computational Intelligence, Springer International, Berlin. pp. 65-74.
[22] Xue Cui1, Jian Gao, Yunbin Feng, Chenlu Zou and
Huanlei Liu. (2018). Multi-objective Reactive Power Optimization Based on Improved Particle Swarm Algorithm. IOP Conference Series: Earth and Environment al Science 108 052081 doi: 10.1088/1755-1315/108/5/052081
[23] Mustapha, M., Musa, B. U., and Bakura, M. U. M.
(2015). Modelling of unified power flow controller for the control of real and reactive power flow on 500KV interconnected system. University of Maiduguri, Faculty of Engineering Seminar Series. Vol.6, pp. 98-105.
[24] Adeniji, O. A., and Mbamaliukem, P. O. (2017).
Voltage stability enhancement and efficiency improvement of Nigerian Transmission system using UPFC. American journal of Engineering research (AJER), Vol. 6(1), pp. 37-43.
International Research Journal of Engineering and Technology (IRJET) e-ISSN: 2395-0056
Volume: 07 Issue: 05 | May 2020 www.irjet.net p-ISSN: 2395-0072