Are GCC Countries Ready for Currency Union? By Belkacem Laabas and Imed Limam * April 2002 * Economists at the Arab Planning Institute, Kuwait. brought to you by CORE View metadata, citation and similar papers at core.ac.uk provided by Research Papers in Economics
Transcript
Are GCC Countries Ready for Currency Union?
By
Belkacem Laabas and Imed Limam *
April 2002
* Economists at the Arab Planning Institute, Kuwait.
brought to you by COREView metadata, citation and similar papers at core.ac.uk
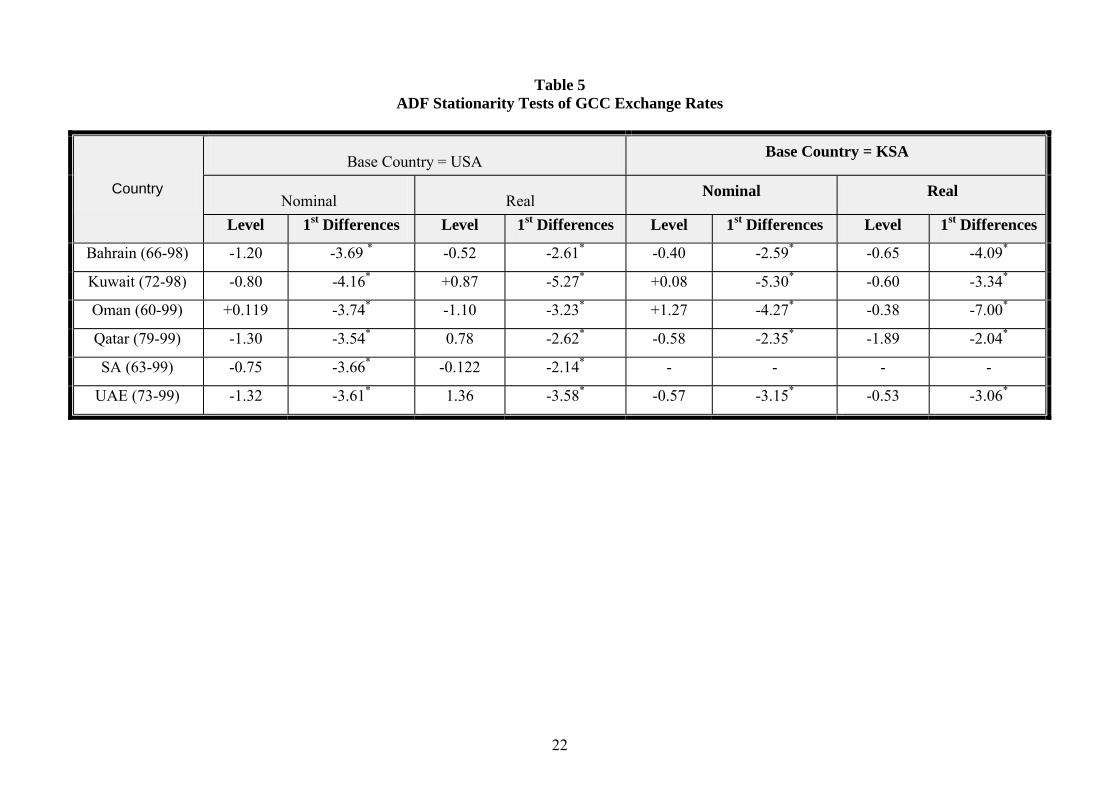
Using formal and informal criteria, we test whether GCC is an optimum currency area (OCA). Based on the traditional OCA criteria, we find that GCC countries are yet to fulfill the necessary pre-conditions for the establishment of Currency Union (CU). The structure of their economies remains dominated by the oil sector, intra-regional trade is very limited and, unlike what many believe, there does not seem to be evidence of convergence in their main macroeconomic fundamentals nor synchronization of their business cycles. The more formal test based on the Generalized Purchasing Power Parity Theory (G-PPP), shows that real exchange rates in GCC are closely related and share the same stochastic trend and hence points to the readiness, although to different degrees, of the countries of the region for CU. We argue that the main factors that are favorable for the establishment of CU are the commitment by all GCC countries to fixed exchange rate arrangements and a strong political resolve to achieve economic integration. Despite the lack of diversification and actual weakness of intra-GCC inter-industry trade, CU, once established, can expand intra-industry trade among GCC if the proper steps are taken toward more specialization and sophistication of their respective industries. On the other hand, CU may result in more synchronized business cycles provided that GCC countries achieve convergence in their economic structure, policies and regulations. In order to achieve these potential benefits of CU, GCC countries need to accelerate economic integration and fulfill the requirements of the GCC common market through the lifting of all restrictions on the free movement of goods and factors, and the creation of supranational institutions that would subordinate national interest for the regional one. This would be possible only if individual countries are willing to surrender some of their national prerogatives in favor of the interest of the region as a whole.
2
1. Introduction
In May 25, 1981, the countries of the Arab Gulf region, Bahrain, Kuwait, Oman,
Qatar, Saudi Arabia and the United Arab Emirates, have ratified the charter
establishing the Cooperation Council for the Arab States of the Gulf (GCC countries
hereafter). In their second Supreme Council meeting held in November 1981, the
GCC leaders have adopted an Economic Agreement (EA) setting the stage for a full
economic integration. The agreement had set out broad lines for the realization of
coordination, integration and cooperation in various aspects of economic affairs. The
Council has taken the necessary steps toward realizing the different stages of a full
economic integration namely, a free trade area, a customs union, a common market
and economic union. The intensification of cooperation in the relevant areas has been
achieved through the formation of various specialized committees whose goal has
been to implement the guidelines of the main constituent bodies of the GCC (the
Supreme Council, Ministerial Council and the Secretariat General).1
As a first step toward economic integration among the countries of the region, a
Free Trade Zone was established in 1983. A decision to move ahead with the next
phase of integration, through the establishment of a Customs Union, came at the
Riyadh Summit of the Leaders of GCC countries in 1999. A timetable was approved
to establish a Customs Union by the year 2005. Already in their Bahrain summit of
the year 2000, the GCC leaders have agreed to adopt a common peg for the different
currencies of the member states as a preliminary step toward adopting a single
currency, considered a cornerstone for achieving full economic integration.
During the last GCC summit December 30-31, 2001 in Muscat, the six GCC
countries have agreed to a joint customs tariff of five percent by the year 2003, two
years earlier than originally planned, and voted to create a single currency by the
year 2010. As an intermediate stage toward establishing a single currency, they have
also agreed to have the American dollar as a common peg for their currencies before
the end of the year 2002.
1 See Peterson (1988, p. 149). Further details about the achievements and the official documents of GCC can
be found in the GCC Secretariat General web-site at: http://www.gcc-sg.org.
3
In their desire to achieve monetary integration and a common currency, the GCC
countries hold the common belief that the complete integration of product and factor
markets requires the elimination of the transaction costs and uncertainties associated
with the existence of separate currencies. However, the worthiness of establishing a
common currency has been traditionally tested against several benchmarks
established by the theory of Optimum Currency Areas (OCA) and developed by
Mundell (1961), McKinnon (1963) and Kenen (1969). Many refinements of the
theory of OCA and the development of more sophisticated formal verification of the
optimality of many Currency Union (CU) experiences in the world, have allowed a
deeper analysis and evaluation of such experiences.
From this perspective, we propose in this paper to develop a general framework
to assess the preparedness of the GCC countries for CU. In section 2, we present a
brief rationalization of CU and its costs and benefits. In section 3, we test the
optimality criteria to assess the degree of preparedness of GCC countries for CU.
More formal tests of optimality are presented in section 4. Section 5 discusses the
potential impact of the GCC CU experience based on the characteristics of its
member countries. Concluding remarks are provided in section 6.
2. Optimum Currency Area: Definition and Potential Benefits
First, it important to clarify some of the concepts often used in the literature of
OCA. Broadly speaking �an OCA is a region for which it is optimal to have its own
currency and its own monetary policy.�2 Therefore, OCA can interchangeably be
called Monetary or Currency Union. It involves monetary integration, a single
currency and a common central bank controlling the pool of foreign exchange
reserves and administrating monetary policy for the union. Monetary integration, on
the other hand, involves the irrevocable fixing of the exchange rates, full and
complete convertibility of currencies, financial market integration (measures to
liberalize capital transactions and harmonize national financial regulations and
structures of institutions), the complete liberalization of current transactions and a
common monetary policy.3 In the present paper, we assume that CU is the
arrangement that the GCC countries are trying to achieve by the year 2010. The
2 Frankel and Rose (1996), p.14. 3 We owe these definitions to Tavlas (1993), p. 665.
4
attempt of GCC at achieving a common peg before the end of the year 2002, can be
considered a form of Exchange Rate Union.
Optimality of a CU is often measured by the realization of several criteria that
determine a priori the likely success of an OCA. These criteria evolve around how
integrated countries of the potential group are with one another in terms of trade and
other economic relationships as well as the extent of correlation in their business
cycles and similarity of shocks they are subject to.
An OCA is desirable to the extent that it allows exchange rates (ER) to be fixed
and therefore reduces ER uncertainty that hampers trade and investment.4 OCA is
also desirable to the extent that it reduces transaction costs associated with multiple
exchange rates. These costs relate to monitor ER fluctuations, cost of information to
predict ER movements, the cost of currency conversion, and the cost associated with
the need to keep and manage reserves for intra-regional trade. OCA also allows
some economies of scale to take place in terms of freeing idle reserves, enhancing
the role of money as a unit of account and as a means of payment. In addition, OCA
may help reduce the ability of speculators to affect prices and disrupt the conduct of
monetary policy and economize on reserves in case of offsetting payments
imbalances.5
A further advantage of an OCA is that it may reinforce discipline and credibility
of monetary policy especially in inflation-prone countries. The credibility of
monetary policy can be enhanced by attaching the latter to a low-inflation anchor
currency. This was for instance the case of the high inflation European countries of
Italy, Spain and Portugal in the 1970�s that wanted to tie their respective ER to that
of Germany for its credibility for fighting inflation. Equivalently, countries adopt a
common currency and fix its parity against a major currency as a way to attach
credibility to a fixed-exchange rate regime by surrendering the power to alter ER.
The main disadvantages of an OCA is the loss of independence of monetary and
exchange rate policies. Exchange rates are irrevocably fixed against one another,
interest rates are tied to foreign interest rates, and any increase in money stock will
4 This advantage is sometimes downplayed by the fact that empirical studies did not find overwhelming
detrimental impact of ER variability and by the very existence of means of hedging against ER risk.
5
result in balance of payment deficits. The monetary and exchange rate instruments
play an important role in economic adjustment as stabilizers. When countries are
involved in hand-tying institutional arrangements such as the ones related to an
OCA, they give up these important policy instruments resulting in important output
and employment losses. However, this apparent cost is mitigated to the extent that
shocks for all the countries in the region tend to be symmetric so as to justify a
common response, or if there are mechanisms making the adjustment to such shocks
occur more promptly. This would be the case if prices and wages are very flexible or
if labor and capital are mobile across members of the OCA. The cost of policy
autonomy could also be very high in countries relying on seigniorage revenues such
as the case for countries with underdeveloped tax systems.6
Other costs not emphasized in the literature are those associated with
coordinating policies and those associated with the possible break down of the
currency union. The latter costs are often factored in the OCA agreement by making
it difficult for countries to exit or to break the rules such as through imposing
sanctions on violators. This is, for instance, the case of the European Monetary
Union (EMU).
A relatively more recent strand of literature has emphasized that the main
benefits of CU stem from the expansion of bilateral trade among the countries of the
Union.7 For instance, Rose (2000) has found that trade among the countries of a CU
could triple after the start of the union. Some have argued that this might be too
optimistic due to some inherent upward bias in the estimation due to the endogeneity
of the decision to join a CU (Tenreyro (2001)), or to lumping together members of
CU and countries commonly using the money of a larger country in the same sample
(Yeyati (2001)).
Several factors have been identified in the literature for determining whether a
country is ready to join an OCA. These factors are related to the characteristics that
would make stable exchange rates and currency union more desirable. These are:
5 Ishiyama (1975). 6 Tavlas 1993, p. 673. 7 See for instance, Frankel and Rose (1996), Rose (2000) and Rose and van Wincoop (2001).
6
i. Openness: A small country that is largely dependent on
international trade is more likely to be affected by
exchange rate fluctuations and uncertainty since a large
portion of its goods is tradables. McKinnon (1969) argues
that the ER in the case of a small open-economy becomes
redundant as an instrument to correct balance of payments
problems. In this case, the exchange rate is strongly linked
to the price level in the economy to the extent that any
variation in the ER is translated into variation in costs.
Hence, the ER becomes an ineffective tool to improve
competitiveness. In addition, Ishiyama (1975) argues for
instance, that for a small open economy where a large part
of consumed goods are imported and in the absence of
domestic substitutes, the ER becomes an ineffective
corrective tool given the inelastic demand for imports.8
For all these reasons, it is easier for a small open economy
to enter into a currency union.
ii. Factor Mobility: In case of a shock, if two countries are
highly integrated in the sense that labor and capital can
freely move from one country to another, there will be a
lesser need for the country affected by the shock to use
the ER as a corrective tool. From this perspective, factor
mobility plays the role of a substitute to the ER, or
monetary policy for that matter, as an adjustment
mechanism should a shock occur. Therefore countries
with more mobile factors of production are better
candidates for currency union.
iii. Degree of Commodity Diversification: If an economy is
more diversified, it is better insulated against terms of
trade, and other, shocks, and hence is less prone to use the
exchange rate to mitigate the impact of the shock.
8 The GCC countries are a case in point.
7
Therefore, countries with diversified economies are better
candidates for CU.
iv. Similarity of Production Structure: Countries that share
common production structure are more likely to
experience symmetric shocks and to exhibit high
covariation in economic activities. They are less likely to
use their exchange rates as an adjustment tool and hence
are better candidates for CU. It should be noted that
structural shocks could also be symmetric (or correlated),
in addition to similarity of economic structure, because of
dependence on common foreign shocks such as the
fluctuation of the price of oil in international markets.
v. Price and Wage Flexibility: The flexibility of prices and
wages obviates the need to alter the ER in case of shocks.
Countries with flexible prices and wages are more
inclined to engage into CU arrangements that would
restrict the use of ER as an adjustment tool.
vi. Similarity of Inflation Rates: Similar inflation rates signal
similarity in structure and in the conduct of economic
policies. This would be desirable for countries that would
like to coordinate their policies to achieve the
requirements of a CU.
vii. Degree of Policy Integration: The similarity of policy
attitudes is an important indicator for the potential success
of policy coordination that will be required to achieve full
monetary integration.
viii. Political Factors: The success of CU would depend to a
great deal on the political will and resolve of member
countries to achieve the goal of CU. Experience has
shown that the political factors might be more important
than the economic criteria.
8
In the next section, we test these optimality criteria to assess the degree of
preparedness of GCC countries for CU.
3. GCC Countries and the Optimality Criteria for OCA
The purpose of this section is to verify whether the criteria mentioned above
qualify the GCC countries for OCA.
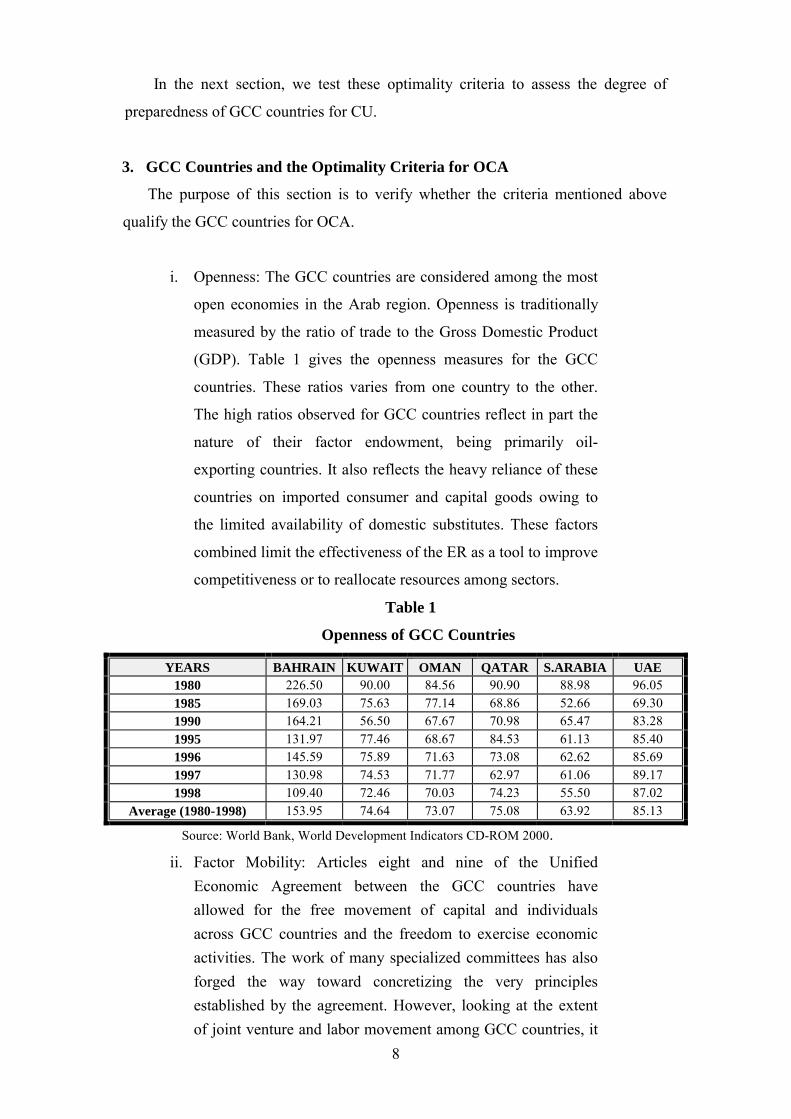
i. Openness: The GCC countries are considered among the most
open economies in the Arab region. Openness is traditionally
measured by the ratio of trade to the Gross Domestic Product
(GDP). Table 1 gives the openness measures for the GCC
countries. These ratios varies from one country to the other.
The high ratios observed for GCC countries reflect in part the
nature of their factor endowment, being primarily oil-
exporting countries. It also reflects the heavy reliance of these
countries on imported consumer and capital goods owing to
the limited availability of domestic substitutes. These factors
combined limit the effectiveness of the ER as a tool to improve
competitiveness or to reallocate resources among sectors.
Average (1980-1998) 153.95 74.64 73.07 75.08 63.92 85.13
Source: World Bank, World Development Indicators CD-ROM 2000.
ii. Factor Mobility: Articles eight and nine of the Unified Economic Agreement between the GCC countries have allowed for the free movement of capital and individuals across GCC countries and the freedom to exercise economic activities. The work of many specialized committees has also forged the way toward concretizing the very principles established by the agreement. However, looking at the extent of joint venture and labor movement among GCC countries, it
9
is clear that factor mobility cannot be relied upon as an alternative adjustment mechanism to the ER. GCC still impose restrictions on ownership and type of activities that GCC nationals could exercise. On the other hand, labor market regulation and institutions are not very similar. This, in addition to factors related to welfare state, preclude labor from moving across GCC countries.
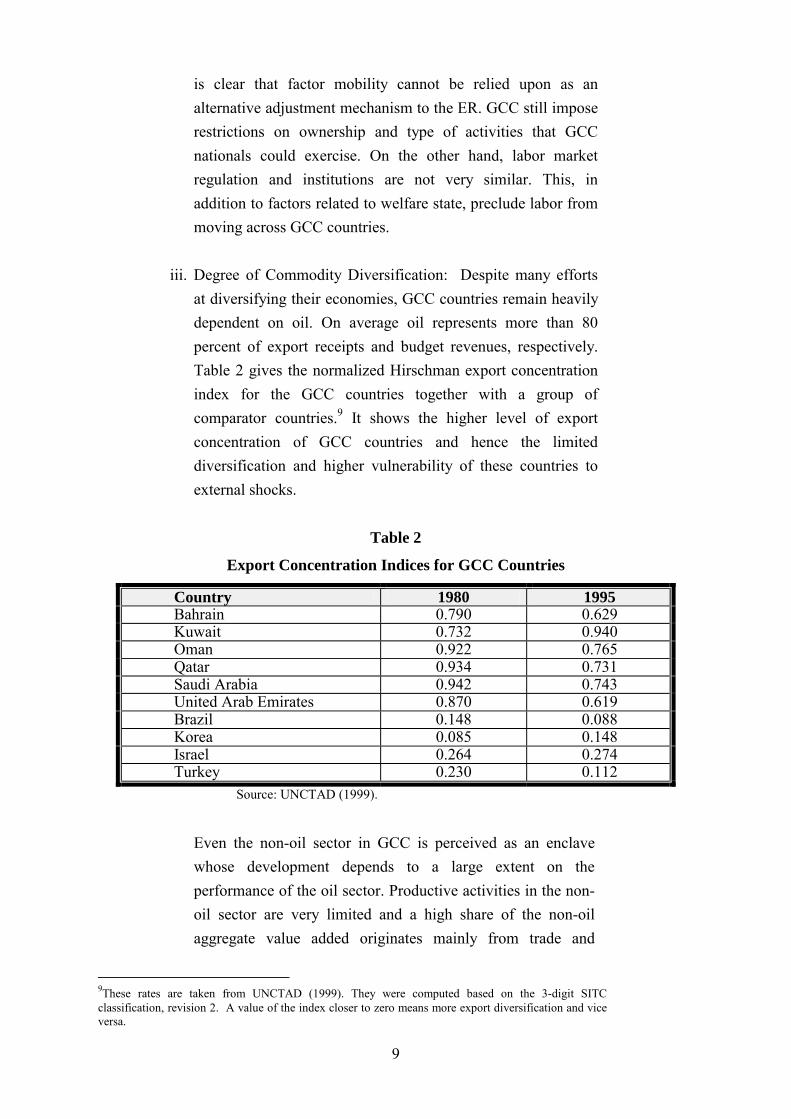
iii. Degree of Commodity Diversification: Despite many efforts
at diversifying their economies, GCC countries remain heavily dependent on oil. On average oil represents more than 80 percent of export receipts and budget revenues, respectively. Table 2 gives the normalized Hirschman export concentration index for the GCC countries together with a group of comparator countries.9 It shows the higher level of export concentration of GCC countries and hence the limited diversification and higher vulnerability of these countries to external shocks.
Table 2
Export Concentration Indices for GCC Countries
Country 1980 1995 Bahrain 0.790 0.629 Kuwait 0.732 0.940 Oman 0.922 0.765 Qatar 0.934 0.731 Saudi Arabia 0.942 0.743 United Arab Emirates 0.870 0.619 Brazil 0.148 0.088 Korea 0.085 0.148 Israel 0.264 0.274 Turkey 0.230 0.112
Source: UNCTAD (1999).
Even the non-oil sector in GCC is perceived as an enclave whose development depends to a large extent on the performance of the oil sector. Productive activities in the non-oil sector are very limited and a high share of the non-oil aggregate value added originates mainly from trade and
9These rates are taken from UNCTAD (1999). They were computed based on the 3-digit SITC classification, revision 2. A value of the index closer to zero means more export diversification and vice versa.
10
business services. As a consequence, the economies of the GCC remain vulnerable to the fluctuation of oil prices in international markets. However, despite being exposed to frequent terms of trade shocks, GCC countries adopt a common policy stance in which the ER is not considered as a policy instrument that can be adjusted in case of adverse oil shocks. In fact, the adjustment operates mainly through the Government expenditures instrument.
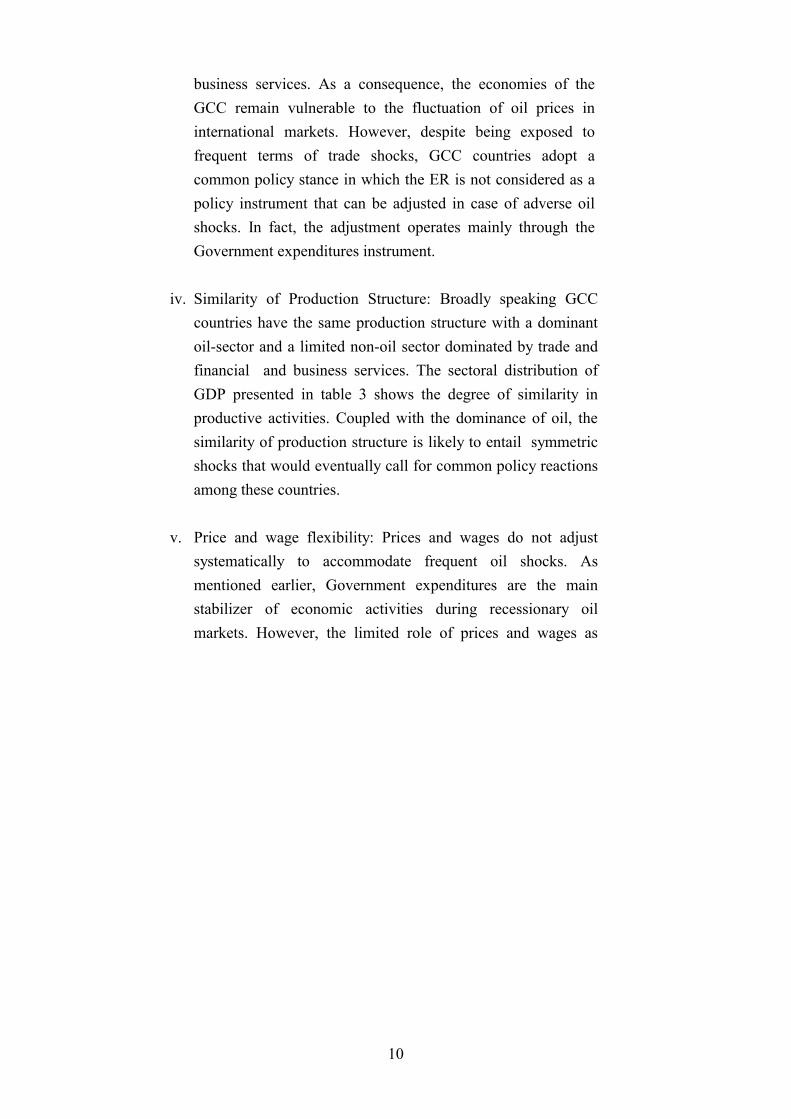
iv. Similarity of Production Structure: Broadly speaking GCC countries have the same production structure with a dominant oil-sector and a limited non-oil sector dominated by trade and financial and business services. The sectoral distribution of GDP presented in table 3 shows the degree of similarity in productive activities. Coupled with the dominance of oil, the similarity of production structure is likely to entail symmetric shocks that would eventually call for common policy reactions among these countries.
v. Price and wage flexibility: Prices and wages do not adjust
systematically to accommodate frequent oil shocks. As mentioned earlier, Government expenditures are the main stabilizer of economic activities during recessionary oil markets. However, the limited role of prices and wages as
Source: Computed by authors based on data from the Statistical Yearbook of the ESCWA Region 2000, United Nations.
12
adjustment mechanism in GCC countries does not qualify the ER as an alternative mechanism to either prices, wages or Government expenditures. In other words, the limited flexibility of prices and wages in GCC countries does not affect the ability of these countries to qualify for currency union to the extent that the ER is eliminated as an option for adjustment.
vi. Similarity of inflation rates: GCC are not inflation-prone
countries. However, inflation rates seem to be pro-cyclical
picking up at periods of oil price hikes and decreasing during
periods of oil price slumps. Inflation rates across GCC
countries are not highly correlated despite a relative similarity
in the conduct of macroeconomic policies namely, fiscal,
monetary and ER policies. This might seem to suggest that
inflation differentials among GCC countries reflect a
difference in the microeconomic determinants of inflation (i.e.
factors affecting the supply of and demand for goods and
services) notably, the presence of price inertia.
vii. Degree of policy integration: Many efforts have been deployed
by the GCC countries to reinforce commonalities and
coordinate many facets of economic and social policies.
Article 4 of the GCC charter stipulates, among other things,
the formulation of similar regulations in the economic and
financial affairs. The main policies that call for coordination in
the context of CU have already common features in the
countries of the region. For instance, monetary and exchange
rate policies in the GCC countries are commonly centered
around maintaining a wedge between domestic and foreign
interest rates in order to stabilize the ER and stem capital
outflows or portfolio reallocation in favor of foreign assets.
viii. Political factors: GCC leaders have shown a strong
commitment to this regional grouping. This commitment stems
from the many common traits shared by GCC countries
notably the similarity in their political, social, demographic
13
and cultural structures.10 Despite the fact that the tempo of
economic integration has incurred minor setbacks and
decelerations, it did not affect the resolve of GCC leaders to
reinforce cooperation and move ahead with economic and
political integration. Even if integration is moving at a much
slower pace than is generally hoped, GCC countries are often
praised for taking a pragmatic approach consisting of
progressively reinforcing commonalities rather than hastily
imposing unrealistic conditions to achieve such integration.11
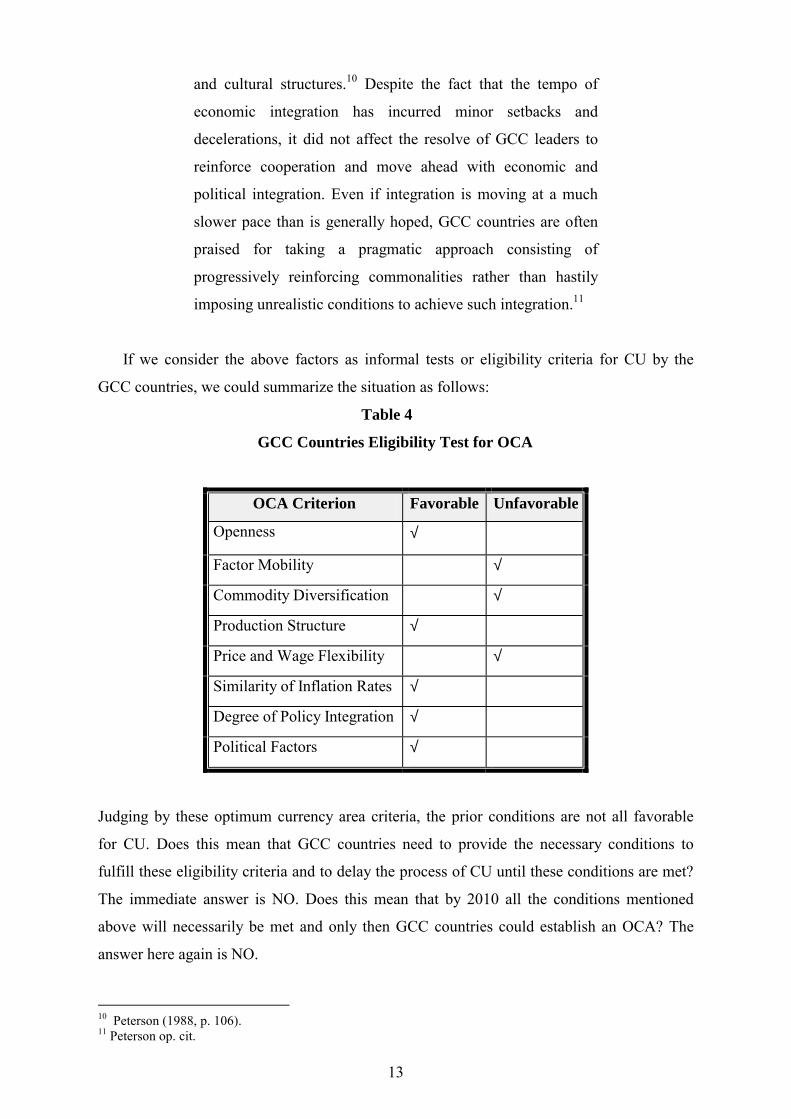
If we consider the above factors as informal tests or eligibility criteria for CU by the
GCC countries, we could summarize the situation as follows:
Table 4
GCC Countries Eligibility Test for OCA
OCA Criterion Favorable Unfavorable
Openness √
Factor Mobility √
Commodity Diversification √
Production Structure √
Price and Wage Flexibility √
Similarity of Inflation Rates √
Degree of Policy Integration √
Political Factors √
Judging by these optimum currency area criteria, the prior conditions are not all favorable
for CU. Does this mean that GCC countries need to provide the necessary conditions to
fulfill these eligibility criteria and to delay the process of CU until these conditions are met?
The immediate answer is NO. Does this mean that by 2010 all the conditions mentioned
above will necessarily be met and only then GCC countries could establish an OCA? The
answer here again is NO.
10 Peterson (1988, p. 106). 11 Peterson op. cit.
14
As for the first question, the recent literature on OCA has clearly indicated that the
so-called eligibility criteria are generally met ex post rather than ex ante. In fact, the EMU
which is considered a historically unprecedented experience in monetary integration, has
been carried through while few members did not fulfill the above criteria. In fact,
Eichengreen (1990) shows for instance, that the European countries in the euro zone display
less favorable conditions for CU than the different states of what is actually known as the
United States of America before they became a federation of states.
More intra-regional trade could be generated and business cycles could become more
aligned within the countries of the group after the launch of the OCA. But then the question
needs to be raised differently: Will GCC OCA generate more intra-regional trade and more
correlated business cycles among the countries of the group? The analysis in the next section
will address this prospective question in more details.
Coming to the second question on whether GCC countries should wait for the year
2010 to establish OCA, the NO answer could be justified based on the experience of EMU.
i. The European Monetary Integration Experience in a Nutshell:
The idea of a single currency for Europe has been an objective ever since the creation
of the European Common Market in the wake of the treaty of Rome in 1957. Based on their
historical aversion to exchange rate fluctuation and during the Hague meeting in 1969, a
committee headed by the prime minister of Luxembourg, Pierre Werner, presented a
proposal in what has come to be known later as the Werner report, suggesting locking EU
exchange rates and the establishment of a federated system of European Central Banks. The
plan was postponed after the collapse of the Bretton Woods system. In 1979 the European
community decided the creation of a network of mutually pegged exchange rates aimed at
providing monetary stability for the region. The System has come to be known as the
European Monetary System (EMS) or the Snake. The exchange rates were allowed to
fluctuate within a band of %25.2± relative to an assigned par value. Following many events
such as the German unification and the higher capital mobility and fiscal expansion within
Europe, there was a pressure on the Deutschmark to appreciate that was accompanied by a
speculative attack on the EMS on September 1992. As a result, the fluctuation margins of the
EMS were widened to up to %15± . The United Kingdom and Italy have chosen to exit
EMS.
15
The frequent currency realignments operated after the EMS (11 realignments between
1979 and 1987) has led the EU, in 1988, to reconfirm their commitment to a European
Monetary Union (EMU). In 1989 , a committee headed by Jacques Delors has set the
objective of an economic and monetary union (EMU) whereby national currencies are to be
replaced by a single currency managed by a centralized Central Bank (ECB). The road map
for the project with an explicit plan and timetable were approved in the Maastricht Treaty in
1991. The treaty has set a three-stage plan to establish the euro:
• Stage 1: Removal of remaining restrictions on capital
movements (July 1990).
• Stage 2: Establishing the European Monetary Institute (EMI)
as a precursor of a European Central Bank and imposing fiscal
Convergence criteria to be fulfilled by potential candidates for EMU were set in
terms of inflation rates, exchange rate stability, budget deficit, and Government debt. In
January 1999, the euro was introduced as a scriptural (non-cash) money. The euro has been
introduced as a one-for-one replacement of the European Currency Unit (ECU).12 The
bilateral central rates of the currencies of the countries of the euro zone against the ECU
have been used as benchmarks to determine the irrevocable conversion rates at which the
euro has been substituted for individual countries� currencies.13 In January 2002 euro coins
and banknotes were introduced. A transitional period for the co-existence of the euro and
national currencies was allowed until February 28, 2002. The euro zone actually comprises
the following countries:
�Belgium
� Germany
� Spain
� France
� Ireland
� Italy
12 The ECU has been created as an international currency within the EMS. It consists of weighted averages of
currencies of the European Community Countries. All countries participating in the EMS have agreed to limit variation of their currency parities with respect to the central rates defined in terms of ECU.
13 See for instance, Temperton (1998) for further details about the creation of the euro.
16
� Luxembourg
� Netherlands
� Austria
� Portugal
� Finland
� Greece (from 1 January 2001)
The remaining three European Community member states namely, United Kingdom,
Sweden and Denmark, have decided to opt out of the euro zone but may join in the future.
ii. Comparing the European and GCC Experiences:
At prima facie, the experience of the European monetary integration and that of the
GCC countries are not strictly comparable from the premise that the former is at a more
advanced stage than the latter. However, it is still useful to have a clear idea about where
the more recent GCC experience could benefit from the European one.
EU and GCC have a very common attitude toward CU. Both hold the view that the
complete integration of product markets requires the elimination of the transaction costs
and uncertainties associated with the existence of separate currencies. The EU relies
strongly on the argument that economic integration without monetary integration cannot
provide a political equilibrium. On the other hand, it is widely believed that monetary
integration requires political integration in order to lend credibility to Government�s
commitments to pursue fiscal policies that are consistent with price stability and
preservation of the monetary integration.14 GCC countries seem to follow the footsteps of
the EU in that respect. However, the political integration is yet to be seen in the case of the
GCC countries. In the EMU experience, the decision to create a European Parliament and
a European Central Bank as supranational entities designed to safeguard monetary
integration came ten years before the launching of the euro. There is no clear time table or
a formal plan for the establishment of such entities in the case of GCC. Only the loose
deadline of end of the year 2002 to finalize the procedures of a common peg to their
respective countries, was set.
In addition, the EMU experience is based on Germany, and to a lesser extent France,
as a driving force of the euro zone. Most of the countries in the euro zone have attached
their currencies and monetary policies to Germany given its high credibility in fighting
14 Eichengreen (1996).
17
inflation. This helps achieve convergence and coordination of policies between the partner
countries. In the case of GCC countries, such a focal point for convergence simply does
not exist.
More importantly, the European experience in achieving CU has focused on the
Maastricht convergence criteria to impose the necessary fiscal discipline to preserve
monetary integration. GCC countries are yet to establish such a mechanism.
An additional factor that made the birth of the euro less complicated is the legacy of
EMS, which is a system of tying up currencies within a narrow band. The existence of a
common denominator, ecu, consisting of a synthetic basket of European currencies made
the transition to the euro a relatively easy operation. The euro was simply set as a one-to-
one ratio with the ecu.
The GCC countries have relatively similar exchange rate arrangements. Up until
December 31, 1999, Bahrain, Qatar, Saudi Arabia and UAE peg their respective currencies
to the SDR; Oman to the U.S. dollar and Kuwait to a basket of currencies determined on
the basis of the currencies of its major trade and financial partners. Recently Bahrain and
Qatar switched the peg of their currencies from SDR to the dollar. In practice, all GCC
countries� currencies hold a stable relationship to the dollar. This explains the recent
decision of GCC countries to establish the dollar as the common currency their domestic
currencies are to be pegged to. The implementation of this intermediate stage will be a step
forward toward establishing the common GCC currency. This pre-commitment to fixed
exchange rates may help demonstrate the resolve of GCC to financial discipline and
achieve the necessary credibility for monetary integration.
4. Testing OCA for GCC: Generalized Purchasing Power Parity Approach
The Generalized Purchasing Power Parity Approach (G-PPP) for assessing the viability
of forming a currency area was developed and tested by Enders and Hurn (1994). The main
idea of the approach starts from the fact that real exchange rates of the countries potentially
candidates for a currency union area are non-stationary. This is so because the fundamental
macroeconomic variables (forcing variables) that determine real exchange rates are also non-
stationary and follow different growth paths. For countries to qualify for a successful
currency area, they should experience convergence and symmetrical shocks to their
fundamentals. The latter should move together and be sufficiently interrelated so that the real
18
exchange rates will have common stochastic trends. Therefore, the theory advocates that the
real exchange rates within a currency area should be co-integrated. This means that the
bilateral real exchange rates of the countries of the currency area should have at least one
linear combination that is stationary.
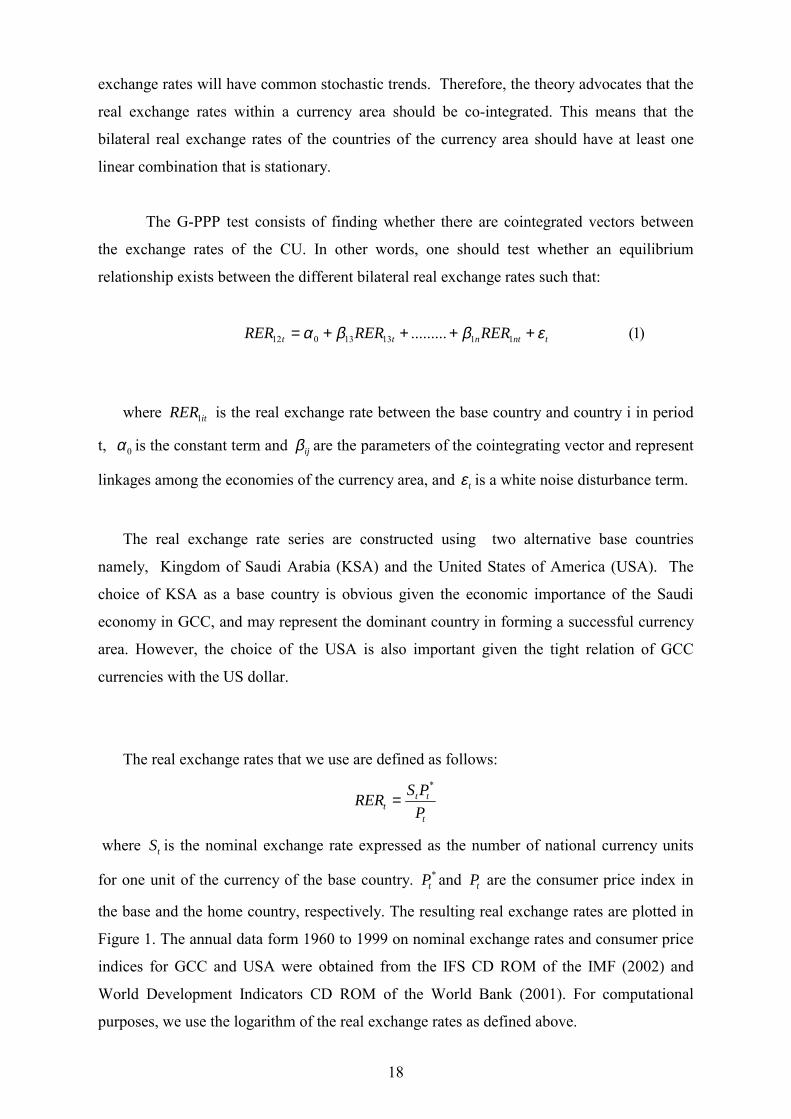
The G-PPP test consists of finding whether there are cointegrated vectors between
the exchange rates of the CU. In other words, one should test whether an equilibrium
relationship exists between the different bilateral real exchange rates such that:
critical value critical value r = 0 r > 0 196.36 97.17 r = 0 r = 1 101.44 25.51 0.995
r ≤ 1 r > 1 94.92 71.66 r = 1 r = 2 39.63 21.74 0.876
r ≤ 2 r > 2 55.29 49.91 r = 2 r = 3 25.48 18.03 0.739
r ≤ 3 r > 3 29.80 31.88 r = 3 r = 4 16.29 14.09 0.576
r ≤ 4 r > 4 13.51 17.79 r = 4 r = 5 8.51 10.29 0.361
r ≤ 5 r > 5 5.00 7.50 r = 5 r = 6 5.00 7.50 0.231
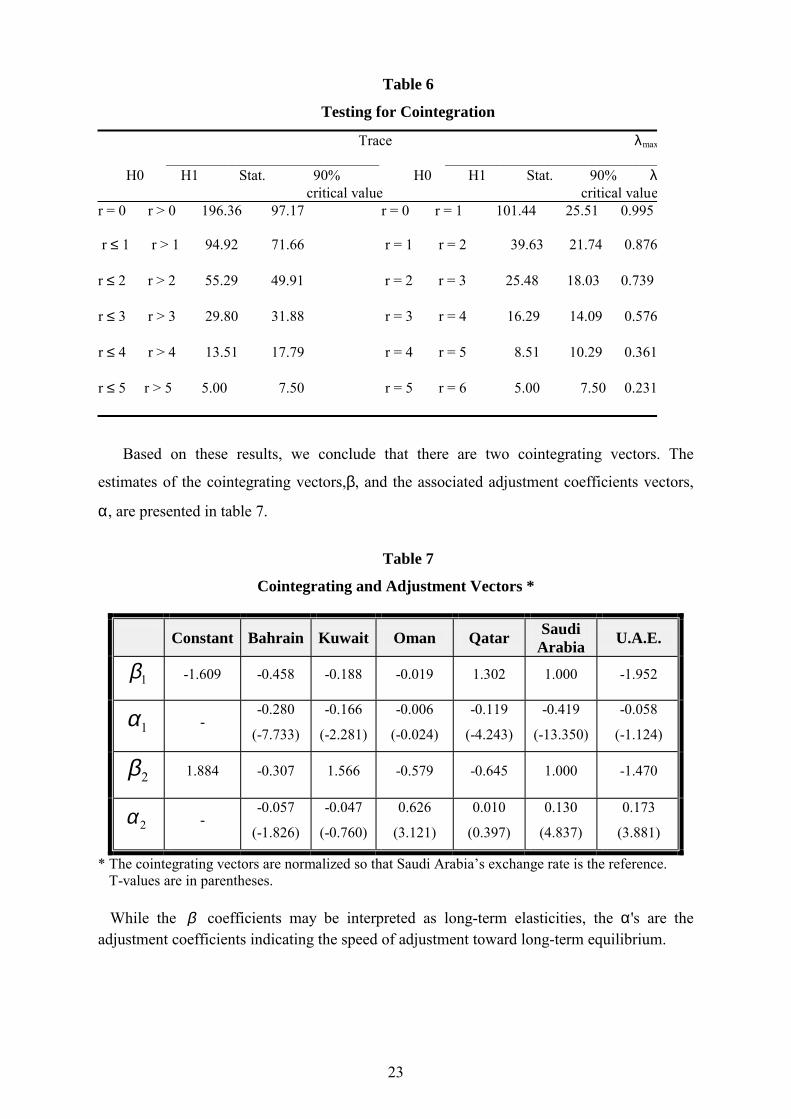
Based on these results, we conclude that there are two cointegrating vectors. The
estimates of the cointegrating vectors,β, and the associated adjustment coefficients vectors,
α, are presented in table 7.
Table 7
Cointegrating and Adjustment Vectors *
Constant Bahrain Kuwait Oman Qatar Saudi Arabia U.A.E.
1β -1.609 -0.458 -0.188 -0.019 1.302 1.000 -1.952
1α - -0.280
(-7.733)
-0.166
(-2.281)
-0.006
(-0.024)
-0.119
(-4.243)
-0.419
(-13.350)
-0.058
(-1.124)
2β 1.884 -0.307 1.566 -0.579 -0.645 1.000 -1.470
2α - -0.057
(-1.826)
-0.047
(-0.760)
0.626
(3.121)
0.010
(0.397)
0.130
(4.837)
0.173
(3.881)
* The cointegrating vectors are normalized so that Saudi Arabia�s exchange rate is the reference. T-values are in parentheses.
While the β coefficients may be interpreted as long-term elasticities, the α's are the adjustment coefficients indicating the speed of adjustment toward long-term equilibrium.
24
Overall, the presence of cointegrating relationships is a formal proof that G-PPP holds
and that GCC meet the requirements of a CU. However, cointegration is a statistical concept
and it is often very difficult to give sound economic interpretation to all cointegrating
relationships. In our case, we favor the first cointegrating vector on the ground that all
adjustment coefficients have the appropriate negative sign. The exchange rates of all GCC,
except Oman, enter this cointegrating relationship significantly. The zero restriction
Likelihood Ratio test for the Omani exchange rate could not be rejected at the 95 percent
level. This may reflect the fact that Oman is the least favorable candidate for CU. This
interpretation is compatible with the relatively low correlation between the macroeconomic
fundamentals of Oman and those of the other GCC countries.17 Furthermore, the α�s
coefficients for Oman and the UAE are very small and represent a slower adjustment process
to the equilibrium equation in the sense that deviations from G-PPP can persist for a
relatively long period of time. Differences in adjustment speed may also reflect differences
in country circumstances that would call for different policy measures. From this
perspective, Oman and UAE may be considered a less homogeneous subset than the rest of
GCC countries for the constitution of a CU.
It should be noted that many G-PPP-based tests in the literature reject the OCA
hypothesis despite stronger correlations between forcing variables than those observed in the
case of GCC. Overall, we find that G-PPP holds for the case of GCC. This rather
unconventional result can be rationalized, putting aside data limitations and modeling
difficulties, by the fact that GCC represent a rare case where exchange rates are stable and
anchored strongly to the US dollar and inflation rates are relatively similar.18 This result,
however, does not preclude forcing variables from drifting apart and should not be
interpreted as a sign of convergence among the economies of GCC. The success of GCC
monetary union requires that more policy coordination and synchronization be undertaken,
and further steps to create a single market where all restrictions on the movement of goods
and factors be removed.
17 See table 11. 18 To test the sensitivity of the results to sample limitations, the stationarity and cointegration analysis were
carried out using monthly data for Kuwait, Bahrain, and KSA using more than 200 observations. We obtain the same results: the exchange rates for these countr ies were cointegrated.
25
5. Potential of GCC Currency Union
As argued earlier, the benefits of a currency union are long-term while its costs are
immediate. In the long-run, the creation of a single currency may boost intra-regional trade
and investment and may help, over time, to reduce country differences and achieve
convergence with respect to economic policy. However, the fulfillment of these long-term
gains relies on features and characteristics of the countries of the grouping.
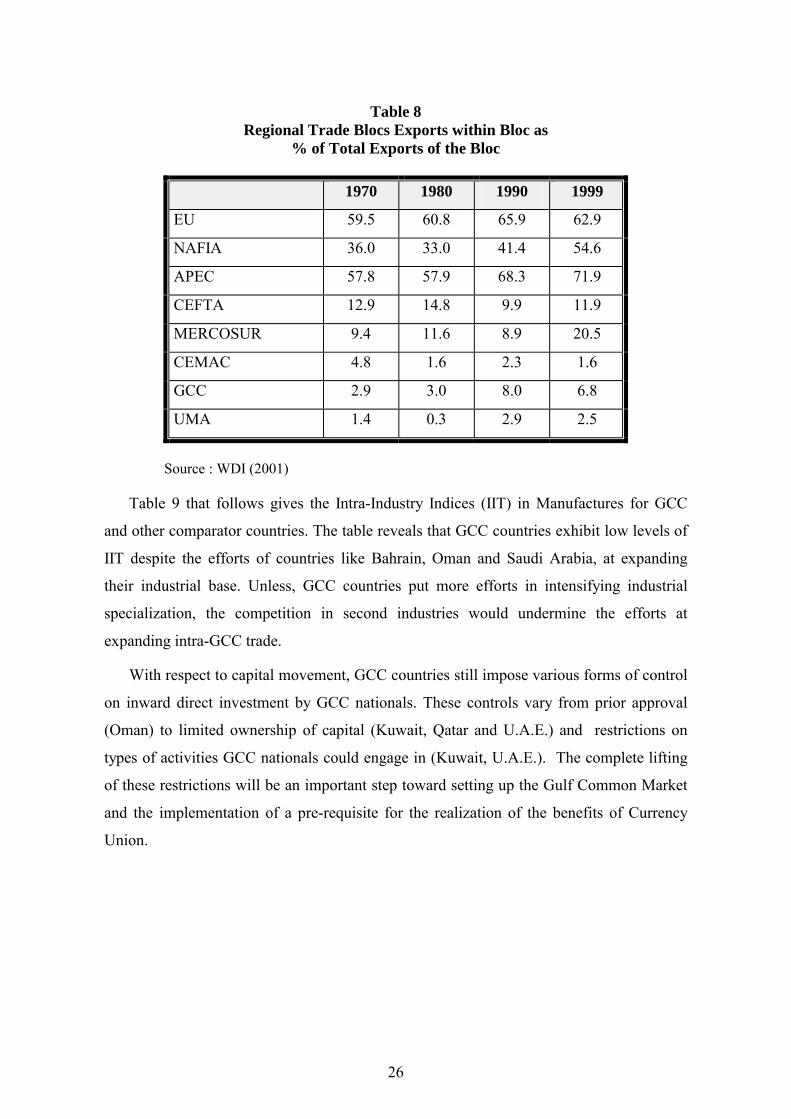
Despite the signing of a free trade area, inter-GCC trade remains weak. The share of
intra-GCC commodity exports in the total exports of each country remains very limited.
The average for these shares during the period 1989-1999 are 21.3% for Bahrain, 1.6% for
Kuwait, 17.1% for Oman, 6.3% for Qatar, 6.6% for Saudi Arabia and 4.6% for U.A.E. The
stagnation of these shares rather than their weaknesses is the more alarming. The degree of
intra-GCC trade integration, as shown in Table 8, is relatively weak in comparison with
other economic blocs in the world.
As shown previously in table 2, the limited diversification of GCC exports offers very
limited possibilities of expanding inter-industry trade. In addition and as argued by
Peterson (1988), the existence of similar second industries in the different GCC countries
�could generate long-term detrimental structural overlap� that would stifle efforts to
develop regional trade.
We argue, however, that a single currency might reinforce intra-industry trade if the
respective GCC countries achieve concerted efforts at increasing specialization and
improving the technical sophistication of their industrial sectors even in the oil-derivatives
industries.
26
Table 8 Regional Trade Blocs Exports within Bloc as
% of Total Exports of the Bloc
1970 1980 1990 1999
EU 59.5 60.8 65.9 62.9
NAFIA 36.0 33.0 41.4 54.6
APEC 57.8 57.9 68.3 71.9
CEFTA 12.9 14.8 9.9 11.9
MERCOSUR 9.4 11.6 8.9 20.5
CEMAC 4.8 1.6 2.3 1.6
GCC 2.9 3.0 8.0 6.8
UMA 1.4 0.3 2.9 2.5
Source : WDI (2001)
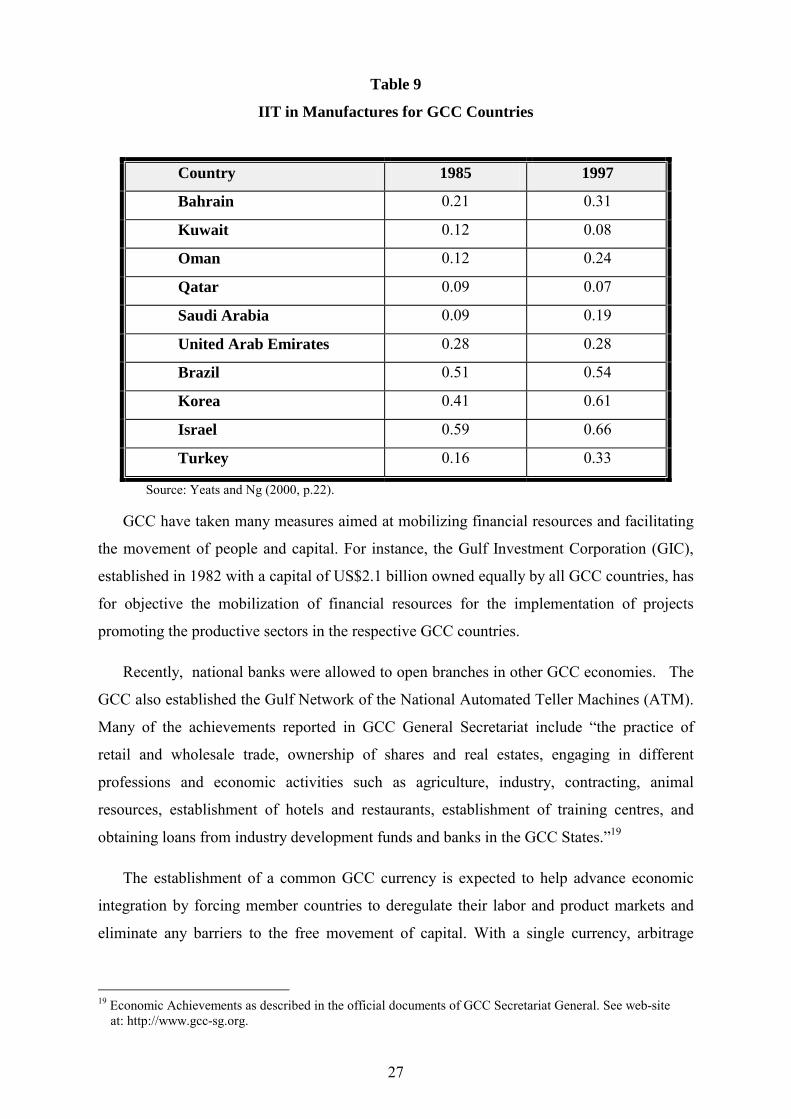
Table 9 that follows gives the Intra-Industry Indices (IIT) in Manufactures for GCC
and other comparator countries. The table reveals that GCC countries exhibit low levels of
IIT despite the efforts of countries like Bahrain, Oman and Saudi Arabia, at expanding
their industrial base. Unless, GCC countries put more efforts in intensifying industrial
specialization, the competition in second industries would undermine the efforts at
expanding intra-GCC trade.
With respect to capital movement, GCC countries still impose various forms of control
on inward direct investment by GCC nationals. These controls vary from prior approval
(Oman) to limited ownership of capital (Kuwait, Qatar and U.A.E.) and restrictions on
types of activities GCC nationals could engage in (Kuwait, U.A.E.). The complete lifting
of these restrictions will be an important step toward setting up the Gulf Common Market
and the implementation of a pre-requisite for the realization of the benefits of Currency
Union.
27
Table 9
IIT in Manufactures for GCC Countries
Country 1985 1997
Bahrain 0.21 0.31
Kuwait 0.12 0.08
Oman 0.12 0.24
Qatar 0.09 0.07
Saudi Arabia 0.09 0.19
United Arab Emirates 0.28 0.28
Brazil 0.51 0.54
Korea 0.41 0.61
Israel 0.59 0.66
Turkey 0.16 0.33
Source: Yeats and Ng (2000, p.22).
GCC have taken many measures aimed at mobilizing financial resources and facilitating
the movement of people and capital. For instance, the Gulf Investment Corporation (GIC),
established in 1982 with a capital of US$2.1 billion owned equally by all GCC countries, has
for objective the mobilization of financial resources for the implementation of projects
promoting the productive sectors in the respective GCC countries.
Recently, national banks were allowed to open branches in other GCC economies. The
GCC also established the Gulf Network of the National Automated Teller Machines (ATM).
Many of the achievements reported in GCC General Secretariat include �the practice of
retail and wholesale trade, ownership of shares and real estates, engaging in different
professions and economic activities such as agriculture, industry, contracting, animal
resources, establishment of hotels and restaurants, establishment of training centres, and
obtaining loans from industry development funds and banks in the GCC States.�19
The establishment of a common GCC currency is expected to help advance economic
integration by forcing member countries to deregulate their labor and product markets and
eliminate any barriers to the free movement of capital. With a single currency, arbitrage
19 Economic Achievements as described in the official documents of GCC Secretariat General. See web-site
at: http://www.gcc-sg.org.
28
between countries with different market conditions become easier and countries with the less
favorable conditions will be affected negatively.
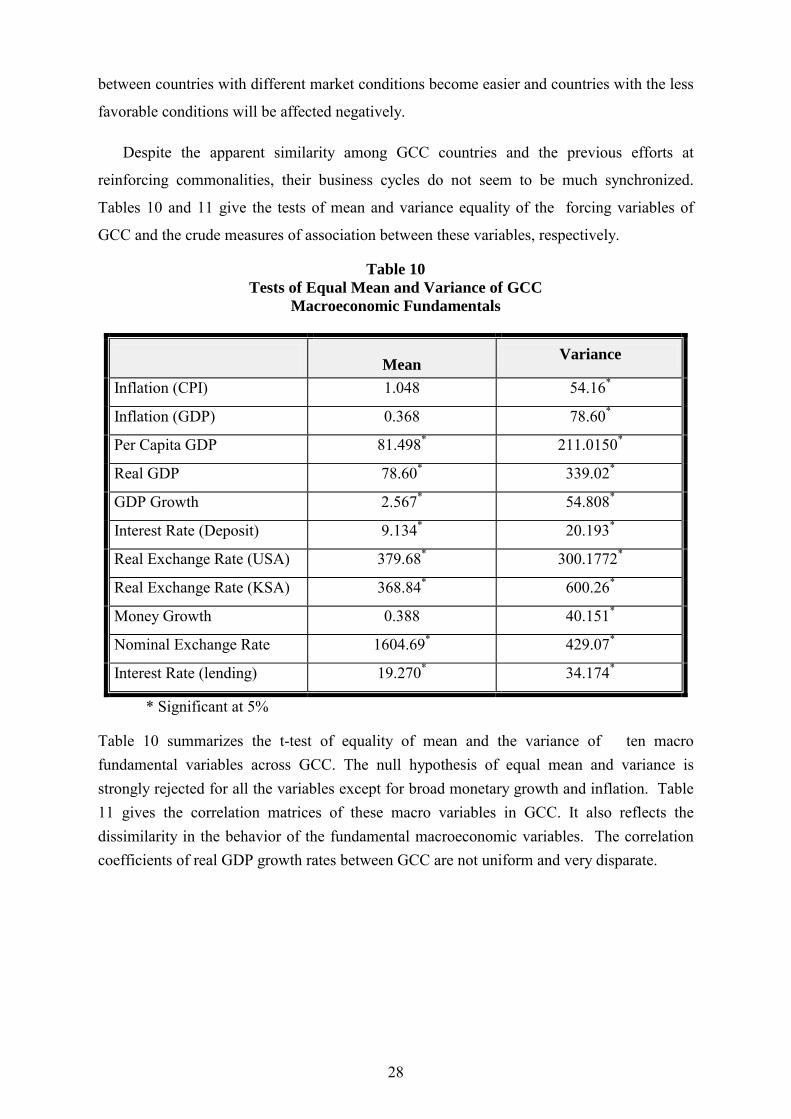
Despite the apparent similarity among GCC countries and the previous efforts at
reinforcing commonalities, their business cycles do not seem to be much synchronized.
Tables 10 and 11 give the tests of mean and variance equality of the forcing variables of
GCC and the crude measures of association between these variables, respectively.
Table 10 Tests of Equal Mean and Variance of GCC
Macroeconomic Fundamentals
Mean Variance
Inflation (CPI) 1.048 54.16*
Inflation (GDP) 0.368 78.60*
Per Capita GDP 81.498* 211.0150*
Real GDP 78.60* 339.02*
GDP Growth 2.567* 54.808*
Interest Rate (Deposit) 9.134* 20.193*
Real Exchange Rate (USA) 379.68* 300.1772*
Real Exchange Rate (KSA) 368.84* 600.26*
Money Growth 0.388 40.151*
Nominal Exchange Rate 1604.69* 429.07*
Interest Rate (lending) 19.270* 34.174*
* Significant at 5%
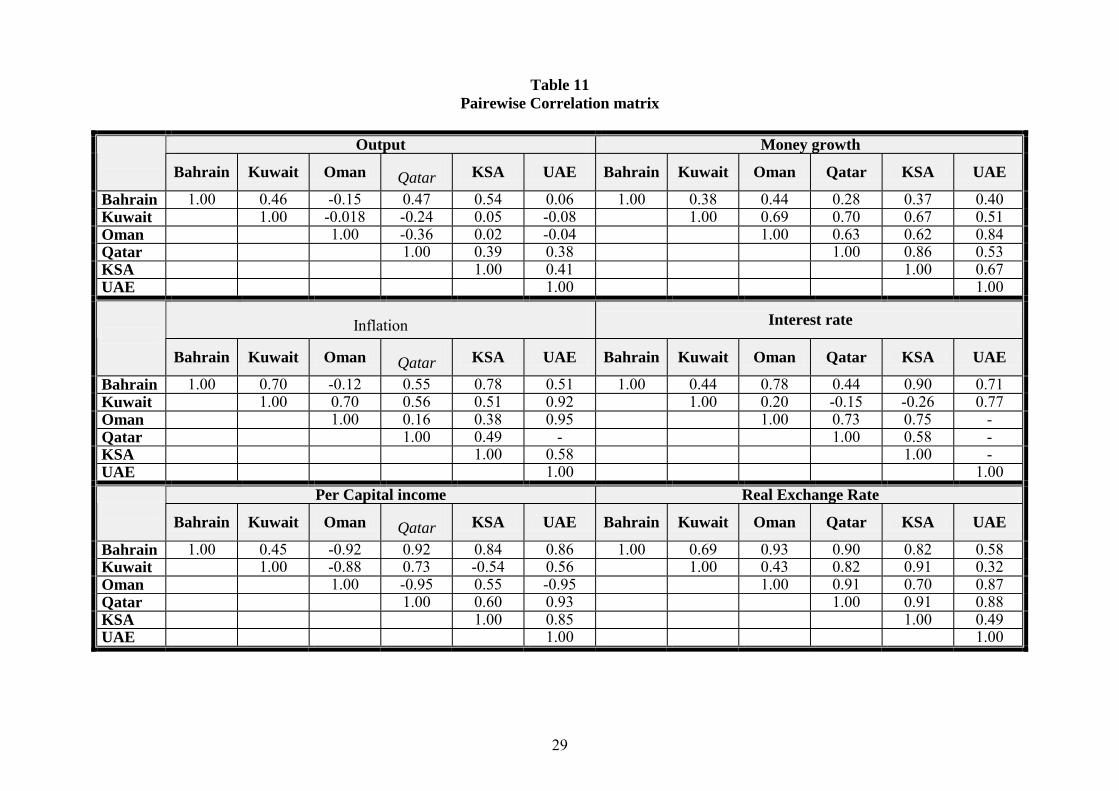
Table 10 summarizes the t-test of equality of mean and the variance of ten macro fundamental variables across GCC. The null hypothesis of equal mean and variance is strongly rejected for all the variables except for broad monetary growth and inflation. Table 11 gives the correlation matrices of these macro variables in GCC. It also reflects the dissimilarity in the behavior of the fundamental macroeconomic variables. The correlation coefficients of real GDP growth rates between GCC are not uniform and very disparate.
29
Table 11 Pairewise Correlation matrix
Output Money growth
Bahrain Kuwait Oman Qatar KSA UAE Bahrain Kuwait Oman Qatar KSA UAE
For instance, Oman�s correlation coefficient with Kuwait and Bahrain are negative and
very low. The same is true for UAE where growth correlation with other GCC is very weak.
The lack of synchronization in economic activity despite the common dominance of the oil
sector could be explained by the asymmetric reaction to the same oil shocks. In other words,
oil price fluctuation has different impacts on the countries of the region. Some countries face
more binding domestic constraints than others and have to adjust differently to the same
shocks. For example, following the 1998 oil price decline, growth in the UAE declined from
2.1 % in 1997 to �5.6 % in 1998, while it declined only from 3.0% to 2.1 % in Bahrain.
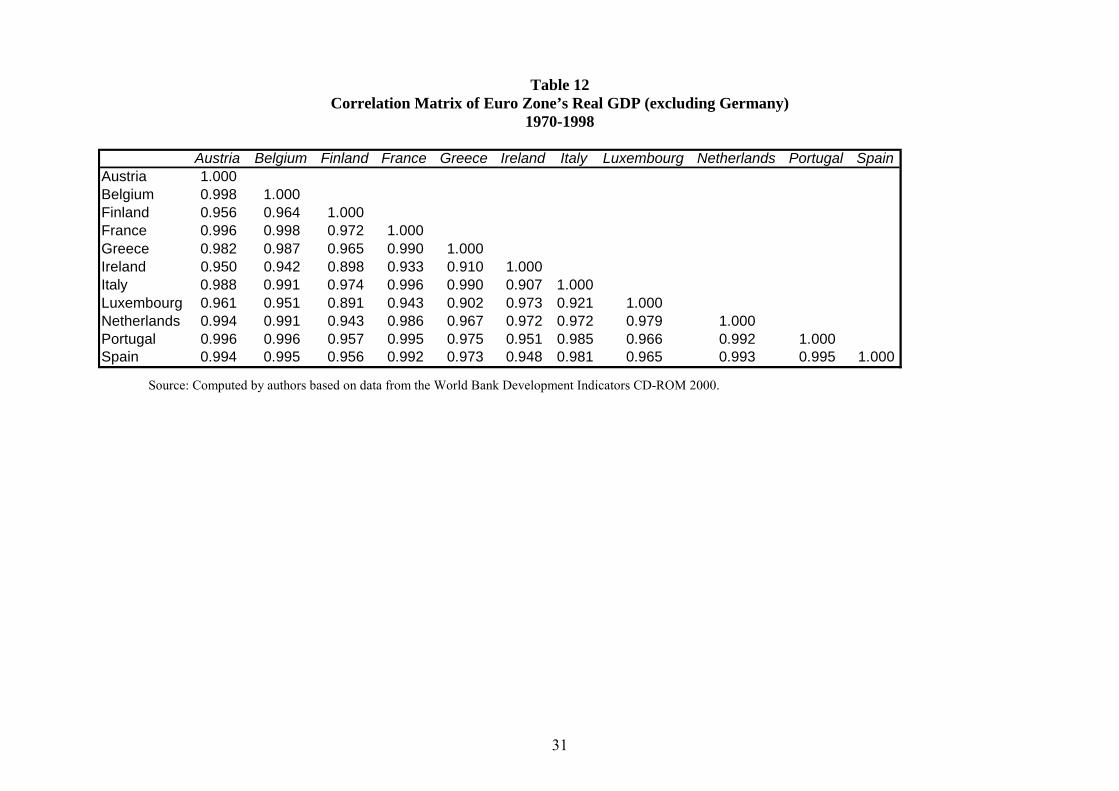
In contrast, and as shown in table 12, economic activity in the countries of the euro zone
seems to be more synchronized with higher correlation coefficients of real GDP. This shows
that the European economies were more convergent before the launch of the euro than their
GCC counterparts. Convergence in the case of the euro countries might reflect the longer
experience of their region with the gradual integration of their markets and policies. GCC
countries have done some mileage in that regard.20 Nonetheless, convergence and
synchronization of their business cycles will not be achieved unless goods and capital
markets become more integrated. As argued by Bayoumi and Eichengreen (1996), while CU
may help increase trade and hence economic integration, a common market increases the
readiness for monetary integration.
On the other hand, as long as differences persist in the political economy determinants of
adjustment and reform in the respective GCC countries, CU might not be stable if ever
achieved. Individual countries might face different domestic conditions that call for specific
measures not likely to be equally acceptable by other countries of the group. In this case,
political unification through the establishment of a supranational entity that would
subordinate national interest in favor of regional interest and surrender some of the national
prerogatives, is a necessary step toward achieving both economic and monetary
integration.21
20 Among the achievements of GCC in terms of unification of policies are a Joint Agricultural Policy and
common strategies for industrial development, population, and long-term development. 21 Peterson (1988, p. 157) quotes the former GCC associate secretary general for economic affairs, Abdulla
Al-Kuwaiz, in proposing that the Secretariat General become such a supranational entity with �more teeth from the Supreme Council�.
31
Table 12 Correlation Matrix of Euro Zone’s Real GDP (excluding Germany)
1970-1998
Austria Belgium Finland France Greece Ireland Italy Luxembourg Netherlands Portugal SpainAustria 1.000Belgium 0.998 1.000Finland 0.956 0.964 1.000France 0.996 0.998 0.972 1.000Greece 0.982 0.987 0.965 0.990 1.000Ireland 0.950 0.942 0.898 0.933 0.910 1.000Italy 0.988 0.991 0.974 0.996 0.990 0.907 1.000Luxembourg 0.961 0.951 0.891 0.943 0.902 0.973 0.921 1.000Netherlands 0.994 0.991 0.943 0.986 0.967 0.972 0.972 0.979 1.000Portugal 0.996 0.996 0.957 0.995 0.975 0.951 0.985 0.966 0.992 1.000Spain 0.994 0.995 0.956 0.992 0.973 0.948 0.981 0.965 0.993 0.995 1.000 Source: Computed by authors based on data from the World Bank Development Indicators CD-ROM 2000.
32
Historically, there seems to be ample evidence that political unification has preceded
monetary unification. Eichengreen (1996) gives few cases in point from the U.S., Germany
and Italy to demonstrate the importance of political integration. There needs to be a firm
conviction about the importance of such entity for GCC countries, in order to confer
credibility to the common currency project.
5. Concluding Remarks
In this paper, an attempt at evaluating the readiness of GCC countries at establishing a currency union is conducted using formal tests, based on G-PPP theory, and informal tests based on the OCA literature. Our analysis shows that despite progress achieved on many fronts, GCC countries are yet to fulfill the necessary pre-conditions for the establishment of CU. The structure of their economies remains dominated by the oil sector, intra-regional trade is very limited and, unlike what many believe, there does not seem to be evidence of convergence in their main macroeconomic fundamentals nor synchronization of their business cycles. The main factors that are favorable for the establishment of CU are the implicit commitment by all GCC to fixed exchange rate arrangements and a strong political resolve to achieve economic integration.
Starting from the premise, advanced by the recent strand in OCA literature, that countries are more likely to verify the optimality criteria of CU ex-post rather than ex-ante and that expansion of trade and more correlated business cycles are the outcome rather than the prerequisites of CU; we have attempted to analyze the potential impact of CU on GCC. We argue that despite the lack of diversification and actual weakness of intra-GCC inter-industry trade, CU can expand intra-industry trade among GCC if the proper steps are taken toward more specialization and sophistication of their respective industries. On the other hand, CU may result in more synchronized business cycles provided that GCC countries achieve convergence in their economic structure, policies and regulations.
One way to do that is to accelerate economic integration and achieve the requirements of the GCC common market through the lifting of all restrictions on the free movement of goods and factors. An additional means of achieving convergence is through political integration or the creation of supranational institutions that would subordinate national interest for the regional one. This will be possible only if individual countries are willing to surrender some of their political and policy prerogatives. The recent European experience as well as ample historical evidence points to the imperative of political unification as a predecessor for CU.
33
References
Bayoumi, T. and B. Eichengreen (1996), �Ever Closer to Haven? An Optimum-Currency-Area Index for European Countries�, Unpublished Manuscript.
Bergman, U.M. (1999), �Do Monetary Unions Make Economic Sense? Evidence from the Scandinavian Currency Union, 1873-1913�, Scandinavian Journal of Economics Vol. 101, No. 3, pp. 363-377.
Dickey, D.A and Fuller, W.A (1979), � Distribution of the estimators of Autoregressive Time Series with a unit Root �, Journal of the American Statistical Association, 74, pp. 427-431.
Eichengreen, B. (1990), �Is Europe an Optimum Currency Area?�, CEPR Discussion Paper No. 478.
Eichengreen, B. (1996), �A More Perfect Union? The Logic of Economic Integration�, Essays in International Finance, No. 198, June. Department of Economics, Princeton University, Princeton, New Jersey, U.S.A.
Enders, W. and S. Hurn (1994), �Theory and Tests of Generalized Purchasing-Power Parity: Common Trends and Real Exchange Rates in the Pacific Rim�, Review of International Economics, Vol. 2, No. 2, pp. 179-190.
Fielding, D. and K. Shields (1999), Is the Franc Zone an Optimal Currency Area, unpublished manuscript, Department of Economics, University of Leicester, United Kingdom.
Frankel, J.A. and A. K. Rose (1996), � Economic Structure and the Decision to Adopt a Common Currency�, Background Report for the Swedish Government Commission on EMU.
Frankel, J.A. and A. K. Rose (1997), � Is EMU More Justifiable Ex Post than Ex Ante?� The European Economic Review, Vol. 41, pp. 753-760. IMF (2002), International Financial Statistics CD- ROM, January 2002. Johansen, S (1991), � Estimation and Hypothesis Testing of Cointegration Vectors in Gaussian Vector Autoregressive Models,� Econometrica, 59, pp. 1551-1580. Johansen, S (1995), � Likelihood-Based Inference in Cointegrated Vector Autoregressive Models, Oxford University Press. Kenen, P. B. (1969), �The Theory of Optimum Currency Areas: An Eclectic View� in R.A. Mundel and A. K. Swoboda, Monetary Problems of the International Economy, University of Chicago Press, pp. 41-60. McKinnon, R.I. (1963), �Optimum Currency Areas�, American Economic Review, Vol. 53, pp. 717-725. Mkenda, B.K. (2001), �Is East Africa an Optimum Currency Area?�, working paper No. 41, Department of Economics, Göteborg University, Sweden. Mundell, R.A. (1961), �A Theory of Optimum Currency Areas�, American Economic Review, Vol. 51, pp. 657-665.
34
Osterwald-Lenum, M. (1992), �A Note with Fractiles of the Asymptotic Distribution of the Maximum Likelihood Cointegration Rank Test Statistics: Four Cases�, Oxford Bulletin of Economics and Statistics, Vol. 54, pp. 461-472. Peterson, E. R., (1988), The Gulf Cooperation Council: Search for Unity in a Dynamic Region, Westview Press, Boulder, Colorado, U.S.A.
Phillips, P.C.B and Peron, P (1988), � Testing for a Unit Root in Time Series Regression,� Biometrica, 75, pp. 335-346.
Rose, A.K. and E. van Wincoop (2001), �National Money as a Barrier to International Trade: The Real Case for Currency Union�, American Economic Review, Vol. 91, No.2, pp. 386-390.
Rose, A. (2000), �One Money, One Market: Estimating the Effect of Common Currencies on Trade�, Economic Policy, Vol. 30, pp. 7-45.
Tavlas, G.S. , (1993), �The �New� Theory of Optimum Currency Areas�, The World Economy, Vol. 16, No. 6, pp. 663-685.
Temperton, P. , (1998), The Euro, John Wiley and Sons, New York.
Tenreyro, S. , (2001), �On the Causes and Consequences of Currency Unions�, unpublished manuscript, Department of Economics, Harvard University, U.S.A.
UNCTAD (1999), Handbook of International Trade and Development Statistics 1996-1997.
World Bank (2001), � World Development Indicators�, CD-ROM.
Yeats, A.J. and F. Ng (2000), �Beyond the Year 2000: Implications of the Middle East�s Recent Trade Performance� in B. Hoekman and J. Zarrouk (eds) Catching Up with the Competition: Trade Opportunities and Challenges for Arab Countries, The University of Michigan Press.
Yeyati, E.L. (2001), On the Impact of a Common Currency on Bilateral Trade, unpublished manuscript, Universidad Torcuato Di Tella, Argentina.
Yoshihide, Ishiyama (1975), �The Theory of Optimum Currency Areas: A Survey�, IMF Staff Papers, Vol. XXII No.2, July, pp.344-383.


![Improving GCC Retargetability - CSE · GCC stands for GNU Compiler Collection. GCC is an integrated distribution of compilers for several programming languages[11]. GCC is one of](https://static.documents.pub/doc/80x56/5ed8c3576714ca7f4768857f/improving-gcc-retargetability-cse-gcc-stands-for-gnu-compiler-collection-gcc.jpg)


