At Home in the Nation’s Capital: Immigrant Trends in Metropolitan Washington Center on Urban and Metropolitan Policy Brookings Greater Washington Research Program The Brookings Institution Audrey Singer June 12, 2003
Transcript
At Home in the Nation’s Capital: Immigrant Trends in Metropolitan Washington
Center on Urban and Metropolitan PolicyBrookings Greater Washington Research Program
The Brookings Institution
Audrey SingerJune 12, 2003
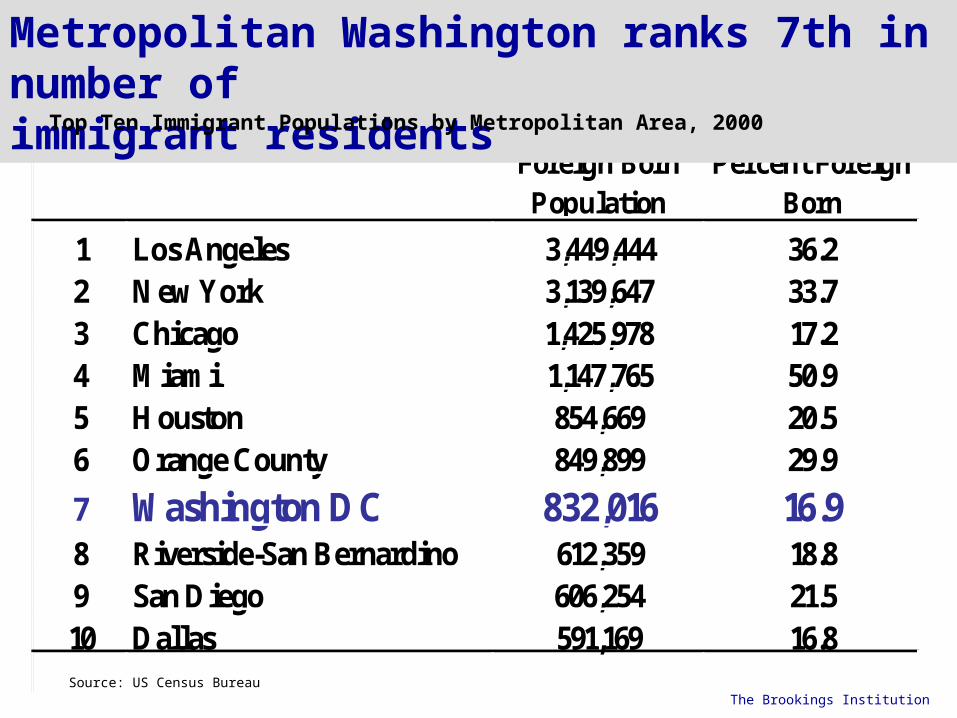
1 Los Angeles 3,449,444 36.22 New York 3,139,647 33.73 Chicago 1,425,978 17.24 Miami 1,147,765 50.95 Houston 854,669 20.56 Orange County 849,899 29.9
7 Washington DC 832,016 16.98 Riverside-San Bernardino 612,359 18.89 San Diego 606,254 21.510 Dallas 591,169 16.8
Percent Foreign Born
Foreign Born Population
Metropolitan Washington ranks 7th in number of immigrant residents
Source: US Census Bureau
Top Ten Immigrant Populations by Metropolitan Area, 2000
The Brookings Institution
Data and Methodology
• Study uses 1980, 1990 and 2000 Census data.
• Define foreign-born as:
* All persons born outside the United States
* Census 2000 did not ask about immigration status
* Includes legal permanent residents, temporary migrants (e.g., students), refugees and asylum seekers, and undocumented migrants.
The Brookings Institution
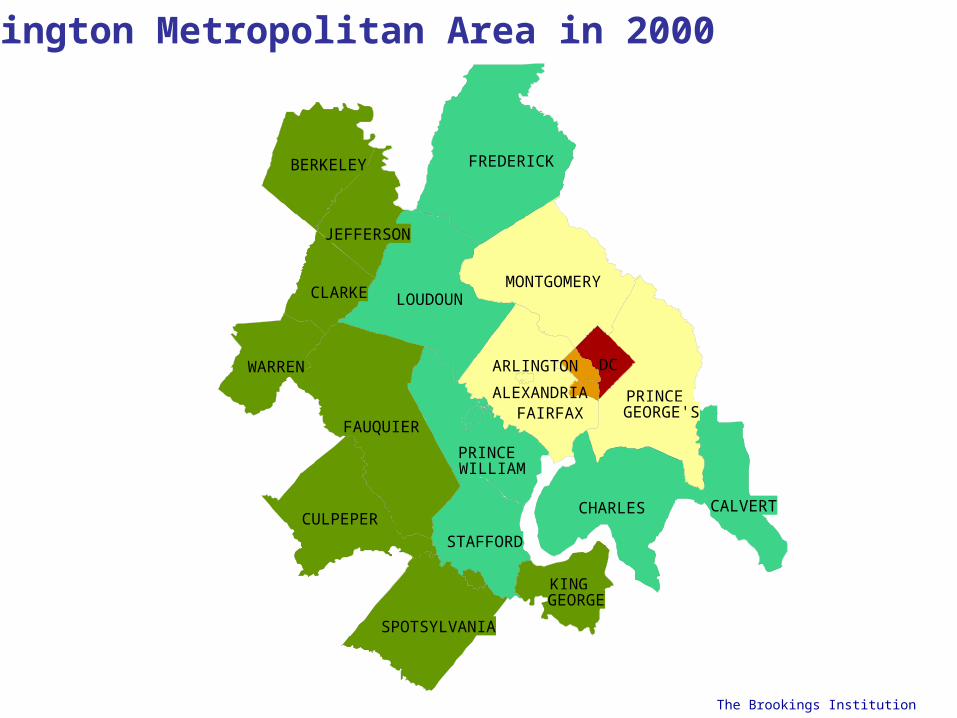
Washington Metropolitan Area in 2000
FREDERICK
CHARLES
LOUDOUN
STAFFORD
CALVERT
WILLIAMPRINCE
FAIRFAX
MONTGOMERY
PRINCE GEORGE'S
DC
FAUQUIER
CULPEPER
BERKELEY
SPOTSYLVANIA
WARREN
CLARKE
JEFFERSON
KING GEORGE
ARLINGTON
ALEXANDRIA
The Brookings Institution
127,579
256,535
489,668
832,016
0
100,000
200,000
300,000
400,000
500,000
600,000
700,000
800,000
900,000
1970
Metropolitan Washington’s foreign-born population grew by 70 percent in the 1990s, or nearly 350,000 immigrants
1970 1980 1990 2000Source: US Census Bureau
Immigrants in the Washington Metropolitan Region 1970-2000
The Brookings Institution
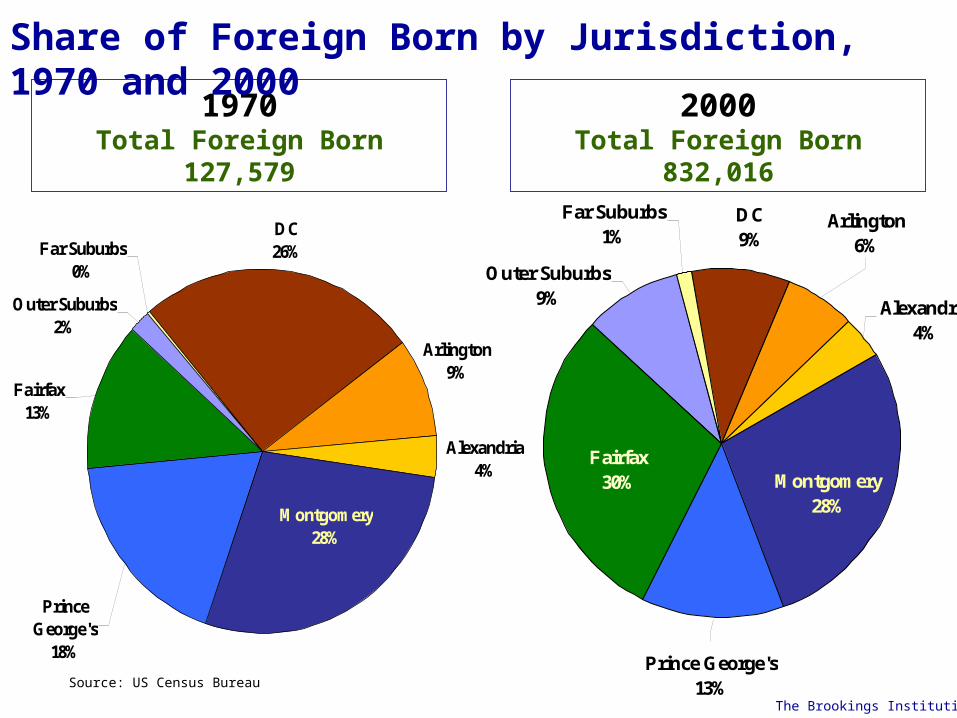
Outer Suburbs9%
Prince George's 13%
Montgomery 28%
Far Suburbs1%
DC9%
Arlington 6%
Alexandria 4%
Fairfax 30%
Outer Suburbs2%
Far Suburbs0%
Fairfax 13%
Montgomery 28%
Alexandria 4%
Arlington 9%
DC26%
Prince George's
18%
1970Total Foreign Born
127,579
Share of Foreign Born by Jurisdiction, 1970 and 2000
Source: US Census Bureau
2000Total Foreign Born
832,016
The Brookings Institution
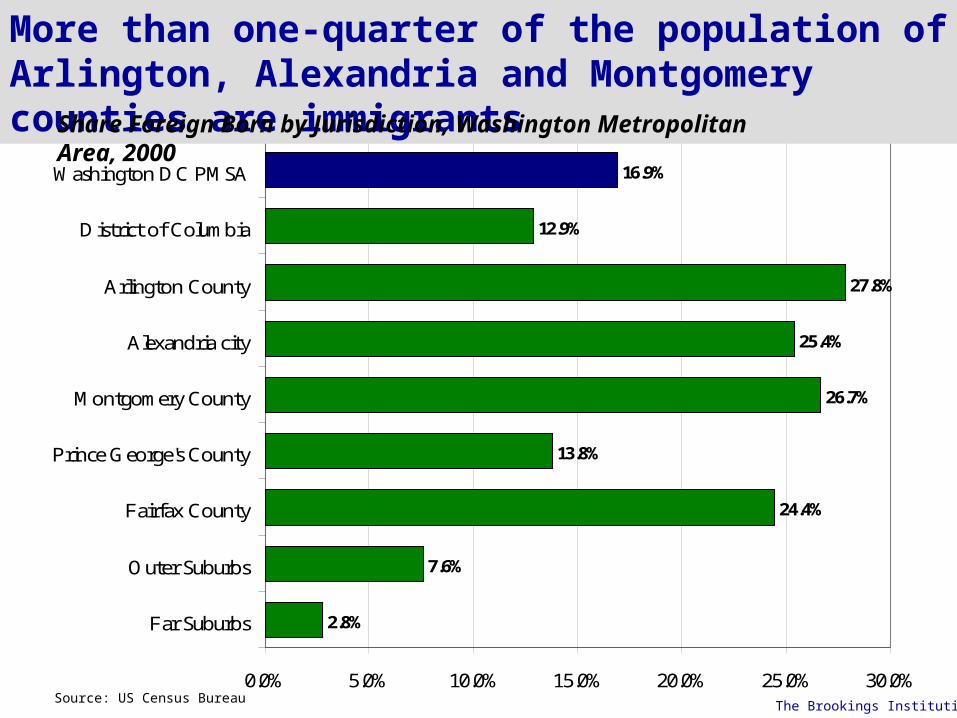
2.8%
7.6%
24.4%
13.8%
26.7%
25.4%
27.8%
12.9%
16.9%
0.0% 5.0% 10.0% 15.0% 20.0% 25.0% 30.0%
Far Suburbs
Outer Suburbs
Fairfax County
Prince George's County
Montgomery County
Alexandria city
Arlington County
District of Columbia
Washington DC PMSA
More than one-quarter of the population of Arlington, Alexandria and Montgomery counties are immigrants
Source: US Census Bureau
Share Foreign Born by Jurisdiction, Washington Metropolitan Area, 2000
The Brookings Institution
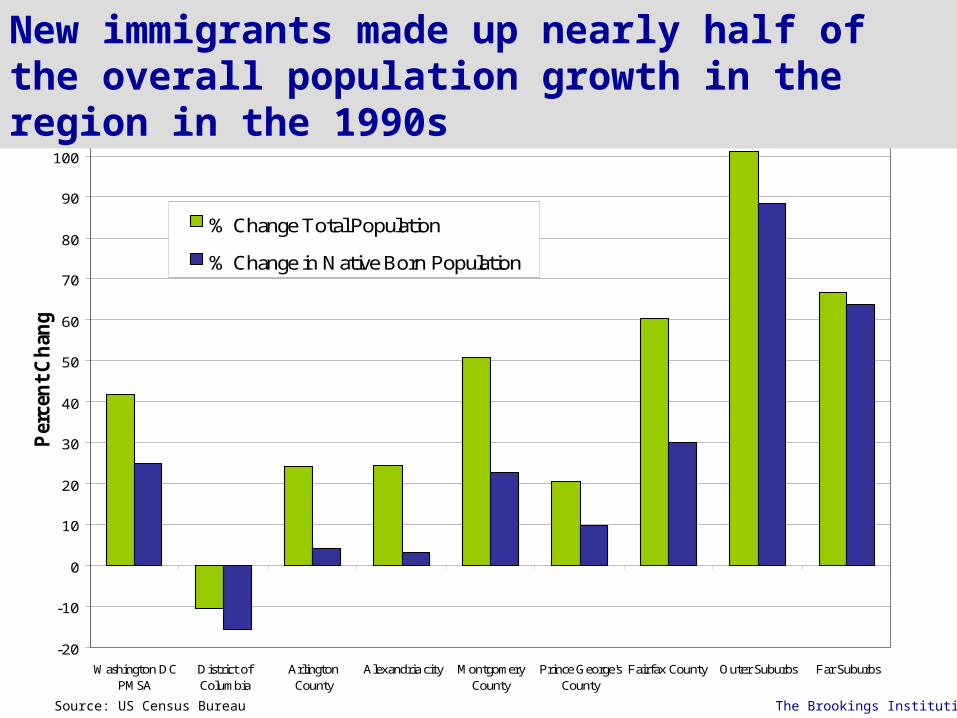
-20
-10
0
10
20
30
40
50
60
70
80
90
100
110
Washington DCPMSA
District ofColumbia
ArlingtonCounty
Alexandria city MontgomeryCounty
Prince George'sCounty
Fairfax County Outer Suburbs Far Suburbs
Per
cent Chan
ge
% Change Total Population
% Change in Native Born Population
New immigrants made up nearly half of the overall population growth in the region in the 1990s
Source: US Census Bureau The Brookings Institution
Fauquier
Frederick
Charles
Fairfax
Loudoun
Culpeper
Montgomery
Berkeley
Stafford
Calvert
Spotsylvania
Prince George's
Warren
Clarke
Prince William
Jefferson
DC
King George
Arlington
Alexandria
Manassas
Fairfax
Fredericksburg
I 66
I 95
I 70
I 270
I 495
Route 50
I 95
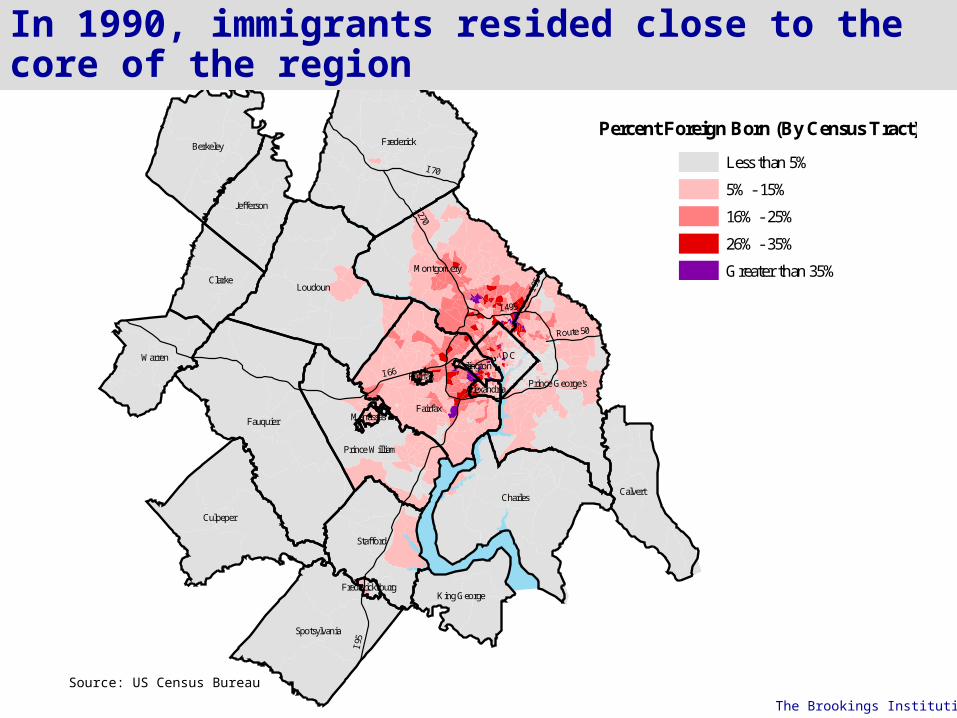
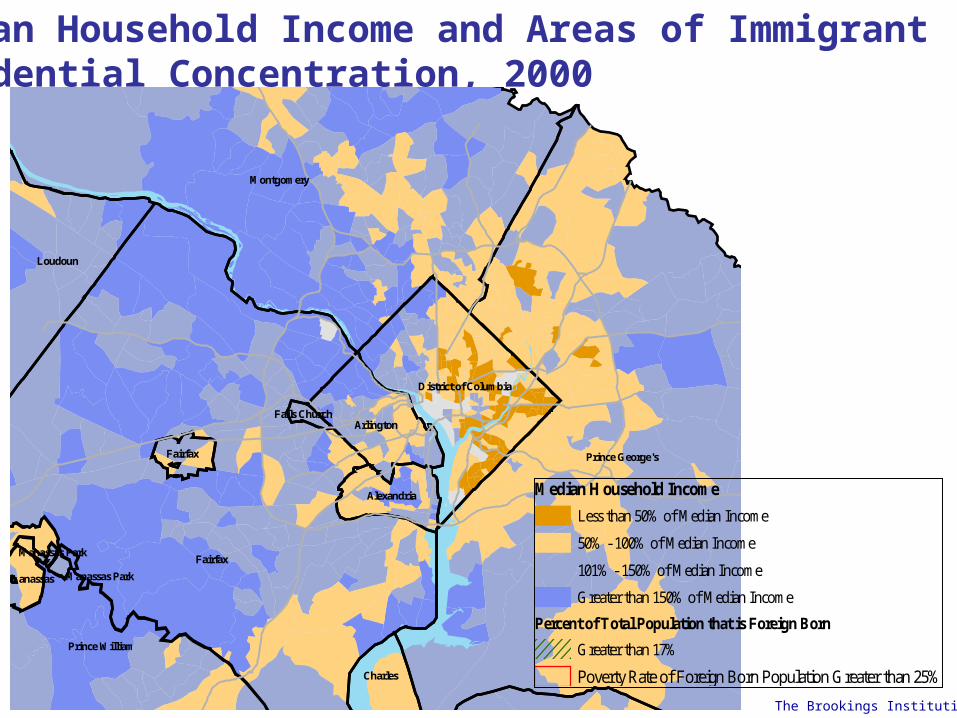
In 1990, immigrants resided close to the core of the region
Percent Foreign Born (By Census Tract)
Less than 5%
5% - 15%
16% - 25%
26% - 35%
Greater than 35%
Source: US Census Bureau
The Brookings Institution
Fauquier
Frederick
Charles
Fairfax
Loudoun
Culpeper
Montgomery
Berkeley
Stafford
Calvert
Spotsylvania
Prince George's
Warren
Clarke
Prince William
Jefferson
DC
King George
Arlington
Alexandria
Manassas
Fairfax
Fredericksburg
I 66I 95
I 70
I 270
I 495
Route 50
I 95
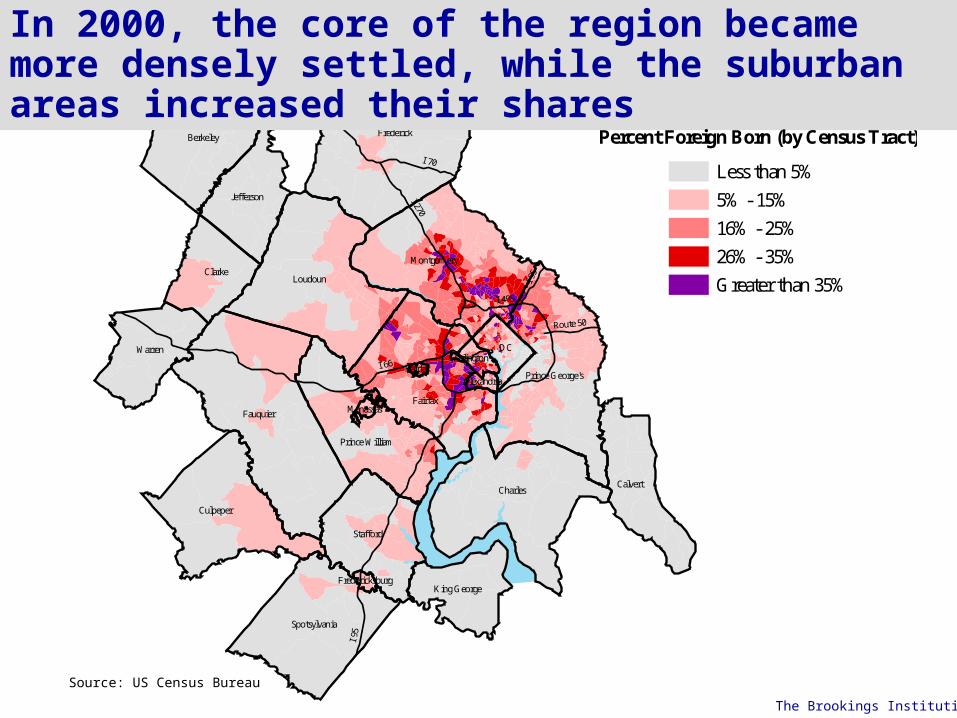
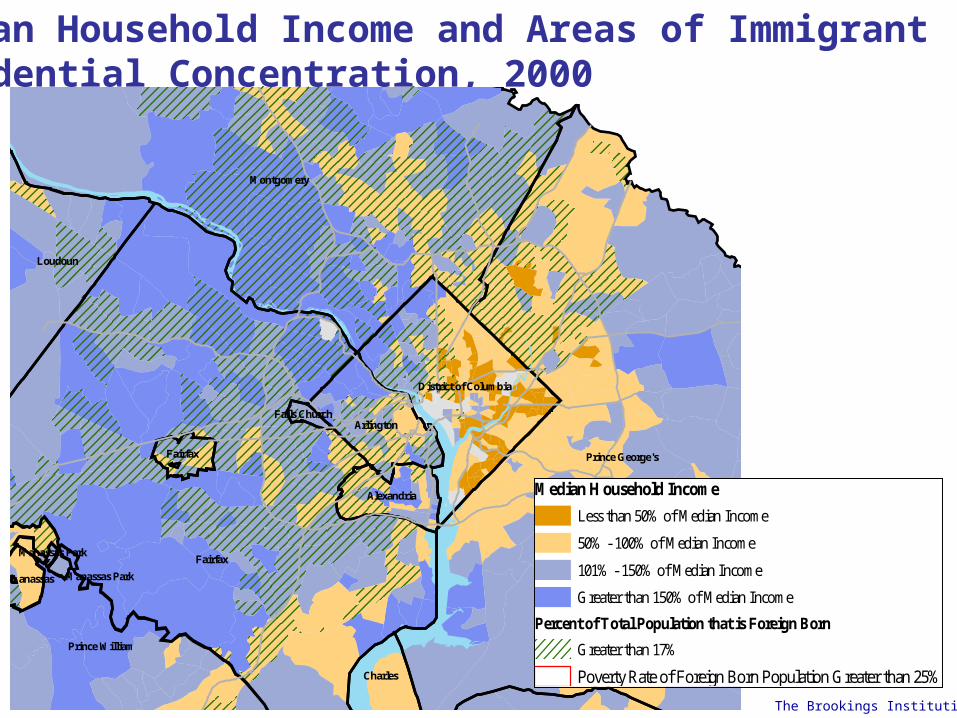
In 2000, the core of the region became more densely settled, while the suburban areas increased their shares
Percent Foreign Born (by Census Tract)
Less than 5%
5% - 15%
16% - 25%
26% - 35%
Greater than 35%
Source: US Census Bureau
The Brookings Institution
0% 25% 50% 75% 100%
Far Suburbs
Outer Suburbs
Fairfax County
Prince George's County
Montgomery County
Alexandria city
Arlington County
District of Columbia
Entered 1990-2000 Entered 1980-1990 Entered 1970-1980 1965-1969 Before 1965
Source: US Census Bureau
In 2000, nearly half of metropolitan Washington’s immigrants had arrived in the United States in the 1990s
The Brookings Institution
Europe12%
Other2%
Africa11%
Asia36%
Latin America/Caribbean
39%
Europe AsiaN. Europe 3.1 E. Asia 11.6W. Europe 3.7 S. Central Asia 11.4S. Europe 1.8 S.E. Asia 10.4E. Europe 3.5 W. Asia 2.5
Other 0.0 Other 0.2
AfricaLatin America and Caribbean
E. Africa 3.2 Caribbean 6.2M. Affrica 0.6 Central America 22.4N. Africa 1.6 South America 10.1S. Africa 0.3
W. Africa 5.1Other 0.4
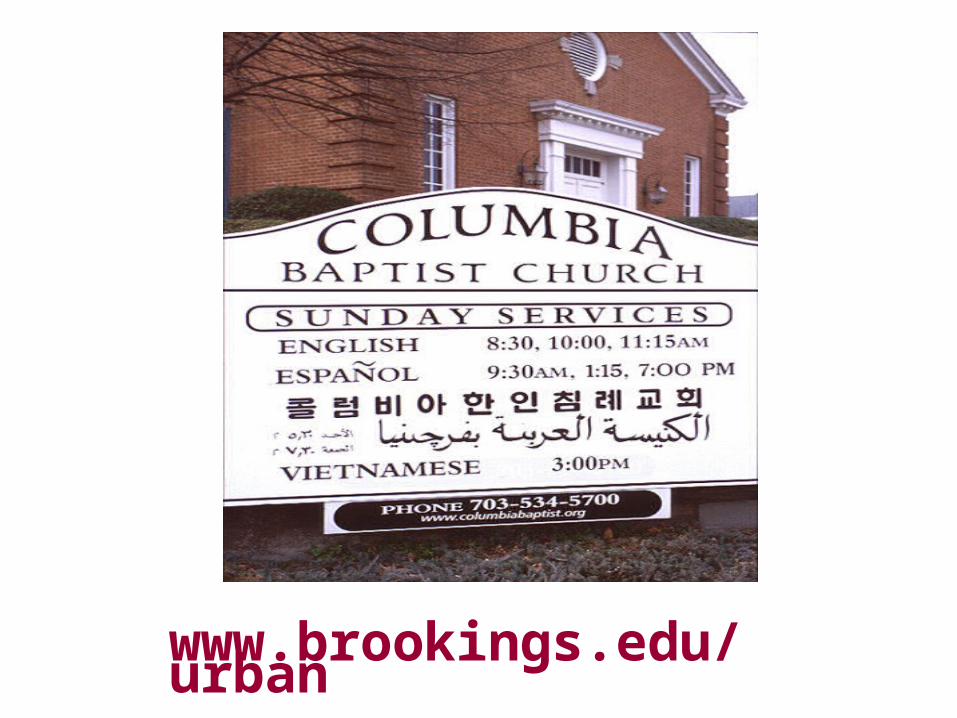
Region of Birth of the Foreign-Born in the Washington Metropolitan Area, 2000
Source: US Census Bureau
The Brookings Institution
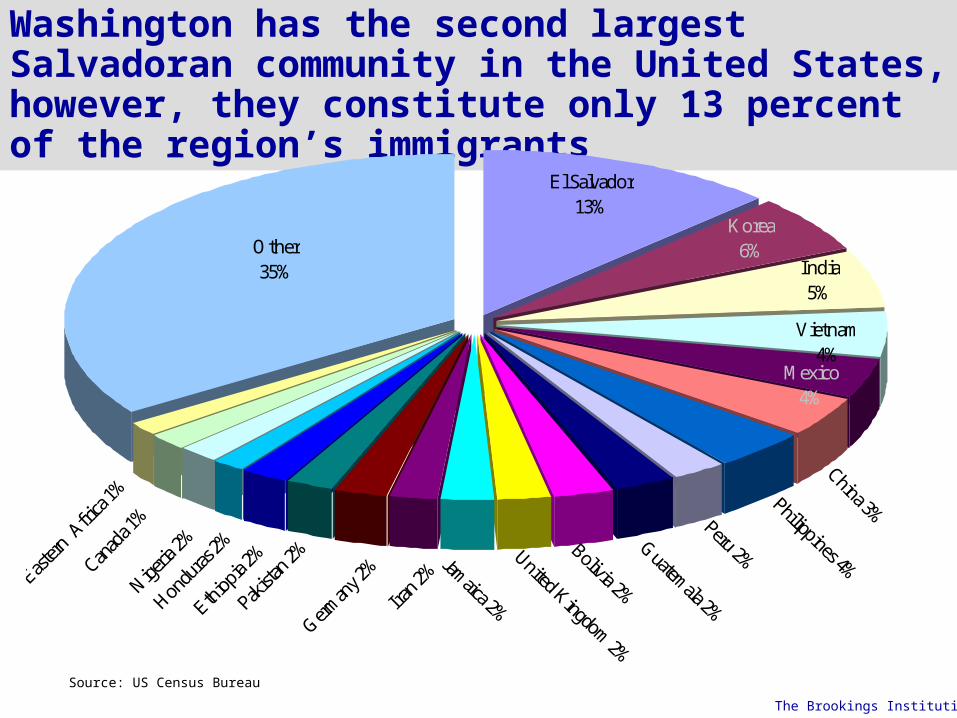
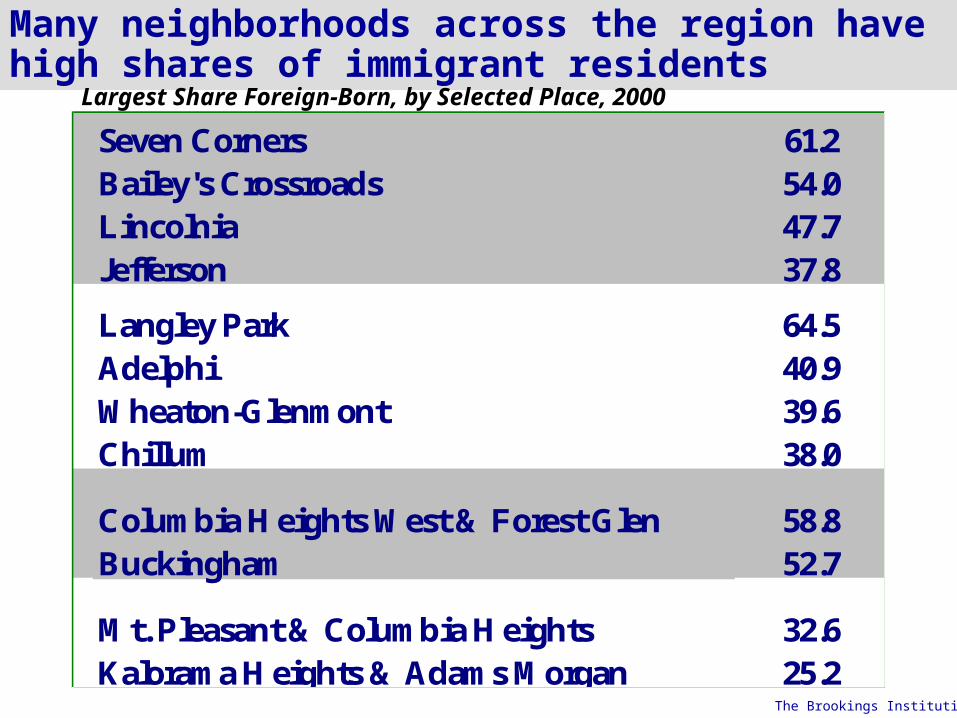
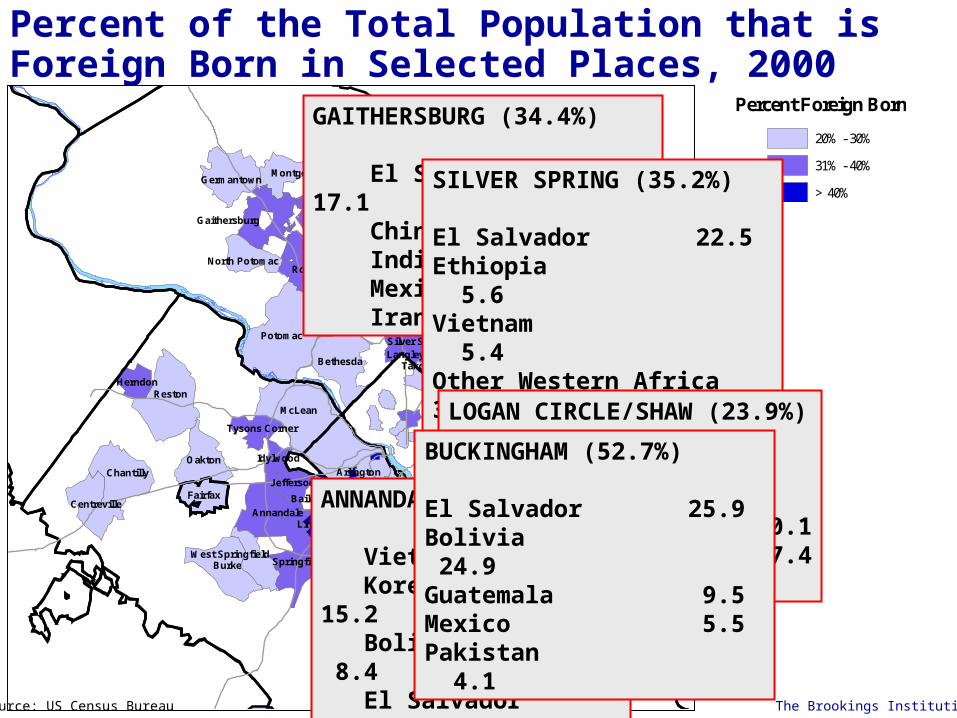
Washington has the second largest Salvadoran community in the United States, however, they constitute only 13 percent of the region’s immigrants