AUTOTROPHIC DENITRIFICATION OF GROUNDWATER IN A GRANULAR SULFUR-PACKED UP-FLOW REACTOR by SHIH-HUI PAN Presented to the Faculty of the Graduate School of The University of Texas at Arlington in Partial Fulfillment of the Requirements for the Degree of DOCTOR OF PHILOSOPHY THE UNIVERSITY OF TEXAS AT ARLINGTON May 2007
Transcript
AUTOTROPHIC DENITRIFICATION OF GROUNDWATER
IN A GRANULAR SULFUR-PACKED
UP-FLOW REACTOR
by
SHIH-HUI PAN
Presented to the Faculty of the Graduate School of
The University of Texas at Arlington in Partial Fulfillment
I wish to express my sincere thanks and appreciation to my supervising
professor, Dr. Syed R. Qasim, for his continual help and guidance. This dissertation
could not have taken place without the knowledge that I have gained from him
throughout the entire period of my Ph.D. program. Special gratitude is also extended to
all of the faculty members who have contributed to the completion of this dissertation,
as well as Dr. Ernest Crosby, Dr. Thomas Chrzanowski, Dr. Max Spindler, and Dr.
Chien-Pai Han for serving on my committee.
I would like to thank Dr. Ardekani Siamak for providing me partial funding on
the experimental reactor. I also want to thank Rodney Duke for his help in constructing
my experimental reactor. I would like to dedicate this dissertation to the memory of my
late father, Kung Pan, for his continual support while I was studying full time in my
Ph.D. program. Without him, I could not have come this far. I could never thank my
father enough for everything he has provided to me. Finally, I would also like to thank
my wife, Shwu-Ing Liao, and my son, Chuan-Jer Pan, for their patience, understanding
and encouragement, and for having faith in me.
April 10, 2007
iv
ABSTRACT
AUTOTROPHIC DENITRIFICATION OF GROUNDWATER
IN A GRANULAR SULFUR-PACKED
UP-FLOW REACTOR
Publication No. ______
Shih-Hui Pan, Ph.D.
The University of Texas at Arlington, 2007
Supervising Professor: Syed R. Qasim
Autotrophic denitrification is an effective treatment technique for nitrate
removal from groundwater. Six basic elements are required for the growth of
autotrophic denitrifiers: (1) electron donor, (2) electron acceptor, (3) active bacteria, (4)
anoxic/anaerobic environment, (5) micronutrients, and (6) optimum pH and
temperature. In this research, granular sulfur is an electron donor; nitrate is an electron
acceptor; anoxic and anaerobic environment was maintained in the reactor, and
micronutrients were added; pH was controlled between 6 and 9, and temperature was
maintained at the room temperature (20 + 2 oC). Batch reactor and continuous up-flow
reactor experiments were carried out to investigate the denitrification rate, and reaction
v
rate kinetic constants. The observed nitrate removal corresponded to the first order
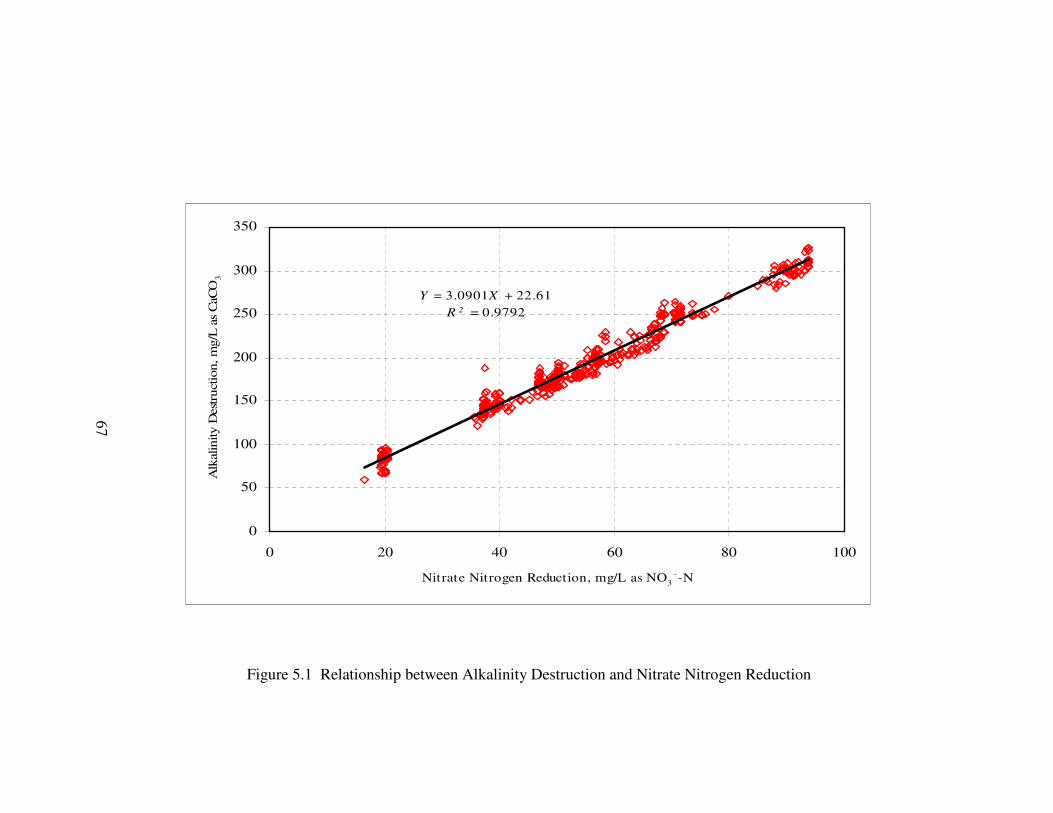
reaction kinetic. The data correlation between alkalinity destruction and nitrate nitrogen
reduction was linear with a slope of 3.09 mg-CaCO3 alkalinity destroyed per mg-
NNO3 −− removed. The data correlation between sulfate production and nitrate nitrogen
reduction was linear with a slope of 6.91 mg- −24SO produced per mg- NNO3 −
− removed.
Based on the biologically mediated half-reaction equations, the overall reaction
equations were developed. Based on the experimental data, the energy coefficients and
the stoichiometry of autotrophic denitrification were developed. Finally, an analytical
model based on conjugate reaction kinetic was utilized. The reaction rate constants k1
and k2 were determined from the experimental data. The model provides an analytical
tool to predict the nitrate and nitrite concentrations in the effluent from the up-flow
column. An example is presented to illustrate the design procedure of a sulfur-packed
up-flow column. In this example a sulfur-packed up-flow column is designed to treat a
given flow rate and influent concentration of nitrate nitrogen to achieve a desired degree
of treatment.
vi
TABLE OF CONTENTS
ACKNOWLEDGEMENTS....................................................................................... iii
ABSTRACT .............................................................................................................. iv LIST OF ILLUSTRATIONS..................................................................................... xi LIST OF TABLES..................................................................................................... xiii
2.2.4 Energy Requirement and Bacterial Growth.............................. 15
2.3 Conventional Methods of Nitrate Removal from Drinking WaterSupplies................................................................................................... 15
2.4 Overview of Biological Denitrification ................................................... 16
2.4.1 Denitrification in Surface Water.............................................. 16
2.4.2 Denitrification in Groundwater................................................. 17
2.4.3 Denitrification in Above Ground Reactor ................................ 18
5.2.4.2 Initial Sulfate Production ............................................. 79
5.2.5 Data Modeling of Sulfur-Packed Continuous Up-FlowReactor ..................................................................................... 80
5.2.5.1 Determination of Nitrate Reaction Rate Constant k1 ... 83
5.2.5.2 Determination of Nitrite Reaction Rate Constant k2 .... 83
5.2.5.3 Sensitivity Analysis of the Model ................................ 88
A. STOICHIOMETRIC RELATIONSHIP OF BIOLOGICALDENITRIFICATION ................................................................................... 101
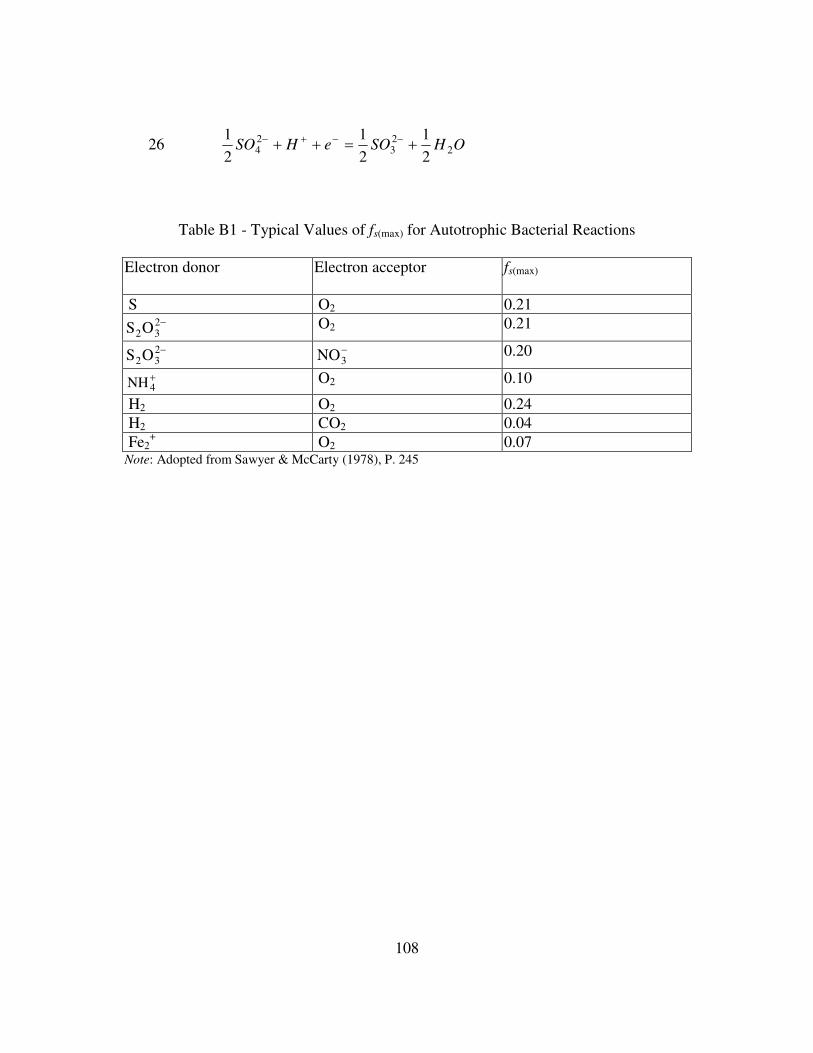
B. USEFUL HALF-REACTIONS INVOLVED IN BIOLOGICALSYSTEMS .................................................................................................... 104
C. PHYSICAL CHARACTERISTICS OF SULFUR MEDIA USED IN THISRESEARCH PROGRAM ............................................................................ 109
x
D. ANALYTICAL METHODS ....................................................................... 112
E. RAW EXPERIMENTAL DATA OF BATCH REACTOR STUDY........... 115
F. RAW EXPERIMENTAL DATA OF SULFUR-PACKED CONTINUOUSUP-FLOW REACTOR STUDY.................................................................... 119
G. DETERMINATION OF REACTION RATE CONSTANT k1 USINGFUJIMOTO METHOD ................................................................................. 138
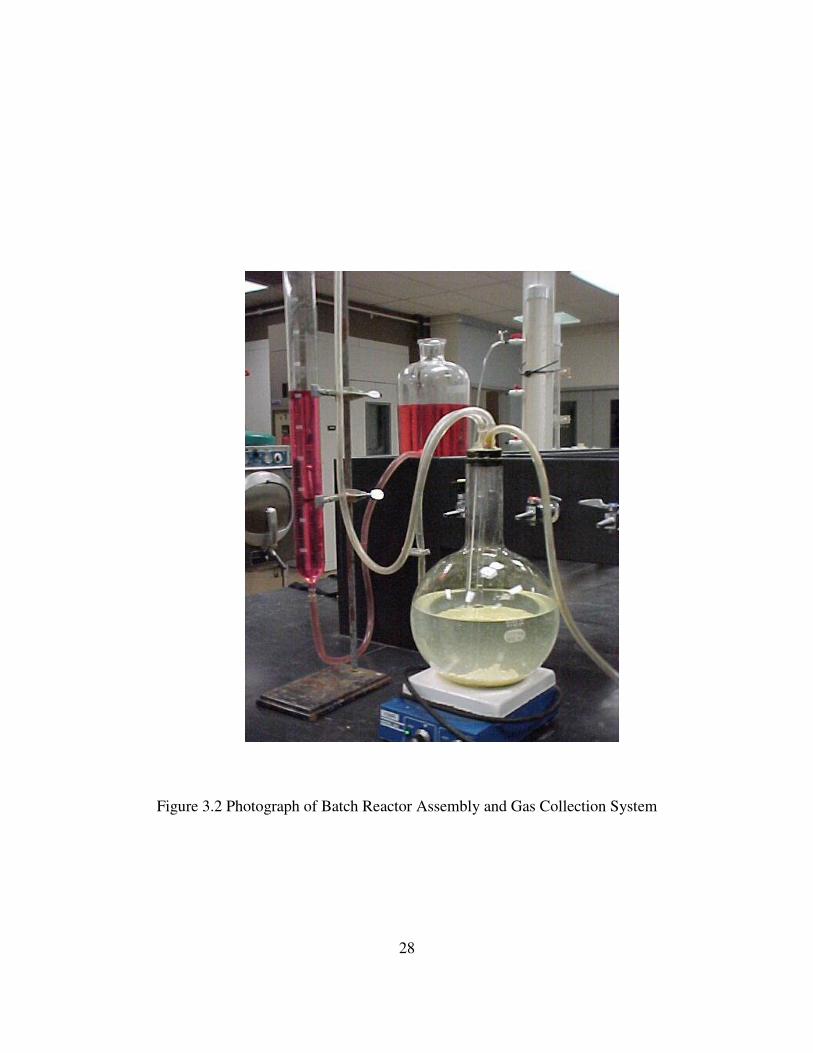
3.1 Details of Batch Reactor Assembly and Gas Collection System................. 27
3.2 Photograph of Batch Reactor Assembly and Gas Collection System.......... 28
3.3 Assembly of Sulfur-Packed Continuous Up-Flow Reactor ......................... 29
3.4 Photograph of Sulfur-Packed Continuous Up-Flow Reactor....................... 30
4.1 Graphical Presentation of Effluent Concentrations (a) NNO3 −− , and
NNO2 −− Concentrations with Respect to HRT, and (b) Alkalinity and
Sulfate Concentrations with Respect to HRT at Hydraulic Loading of0.06 m3/m2.hr................................................................................................ 48
4.2 Graphical Presentation of Effluent Concentrations (a) NNO3 −− , and
NNO2 −− Concentrations with Respect to THRT, and (b) Alkalinity and
Sulfate Concentrations with Respect to THRT at Hydraulic Loading of0.08 m3/m2.hr................................................................................................ 53
4.3 Graphical Presentation of Effluent Concentrations (a) NNO3 −− , and
NNO2 −− Concentrations with Respect to THRT, and (b) Alkalinity and
Sulfate Concentrations with Respect to THRT at Hydraulic Loading of0.10 m3/m2.hr................................................................................................ 57
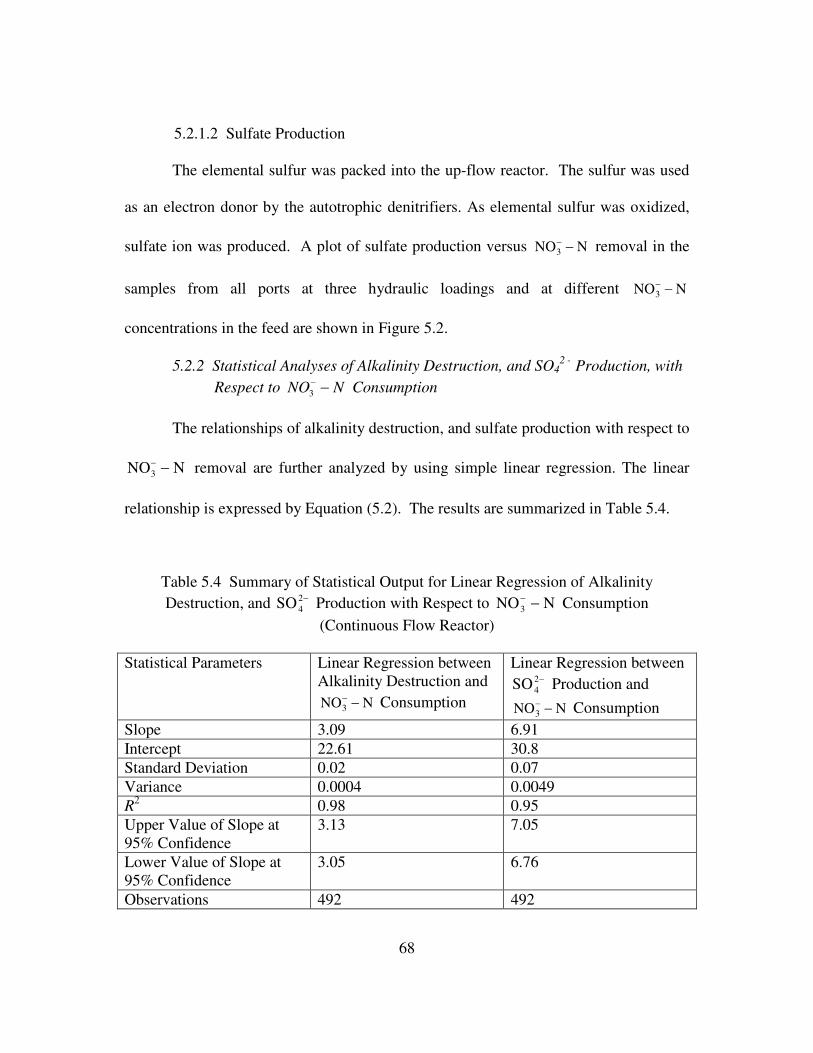
5.1 Relationship between Alkalinity Destruction andNitrate Nitrogen Reduction .......................................................................... 67
5.2 Relationship between Sulfate Production andNitrate Nitrogen Reduction .......................................................................... 69
5.3 Relationship between C/Co and THRT at Hydraulic Loading of0.06 m3/m2.hr................................................................................................ 84
xii
5.4 Relationship between C/Co and THRT at Hydraulic Loading of0.08 m3/m2.hr................................................................................................ 85
5.5 Relationship between C/Co and THRT at Hydraulic Loading of0.10 m3/m2.hr................................................................................................ 86
5.6 Relationship between Average C/Co and THRT at Three CombinedHydraulic Loadings ......................................................................................... 87
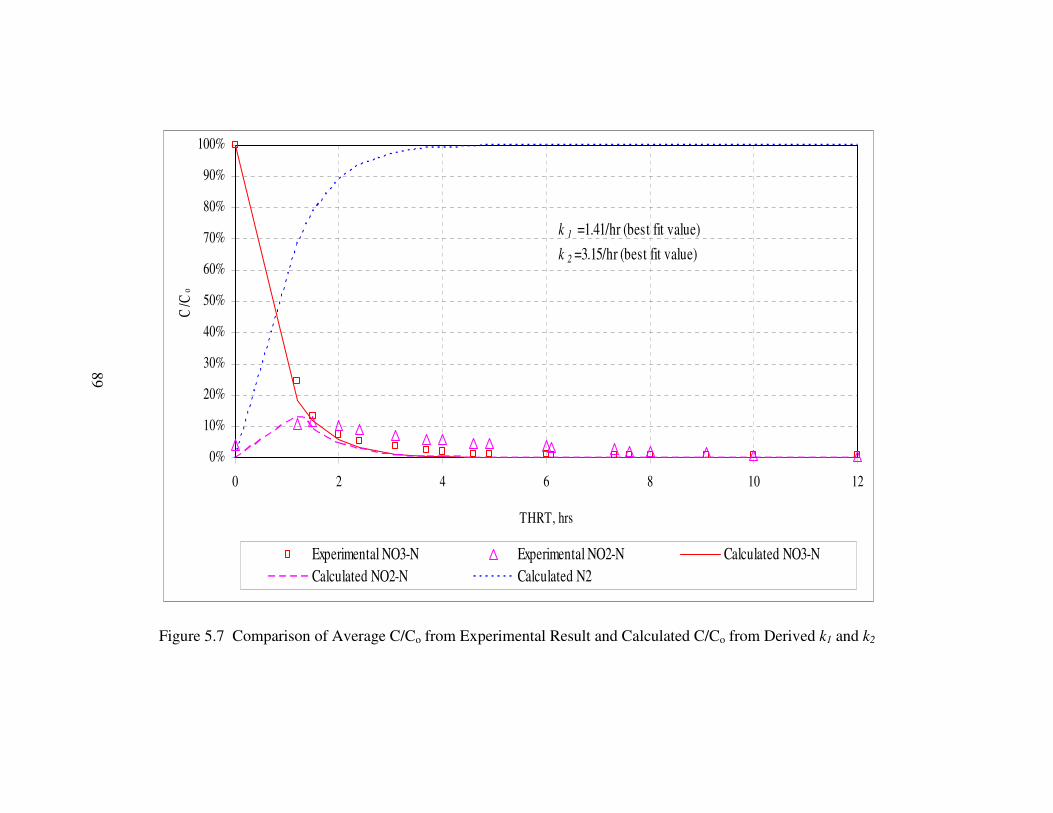
5.7 Comparison of Average C/Co from Experimental Result and CalculatedC/Co from Derived k1 and k2 ........................................................................... 89
5.8 Sensitivity Analysis and Concentration Profiles (a) k1 Constant at 1.41/hr(best fit value) and k2 = 4.73/hr (50% higher than best fit k2 = 3.15/hr),and (b) k1 Constant at 1.41/hr (best fit value) and k2 = 1.58/hr(50% lower than best fit k2 = 3.15/hr) ............................................................ 91
5.9 Sensitivity Analysis and Concentration Profiles (a) k2 Constant at 3.15/hr(best fit value) and k1 = 2.11/hr (50% higher than best fit k1 = 1.41/hr),and (b) k2 Constant at 3.15/hr (best fit value) and k1 = 0.71/hr(50% lower than best fit k2 = 1.41/hr)........................................................... 92
xiii
LIST OF TABLES
Table Page
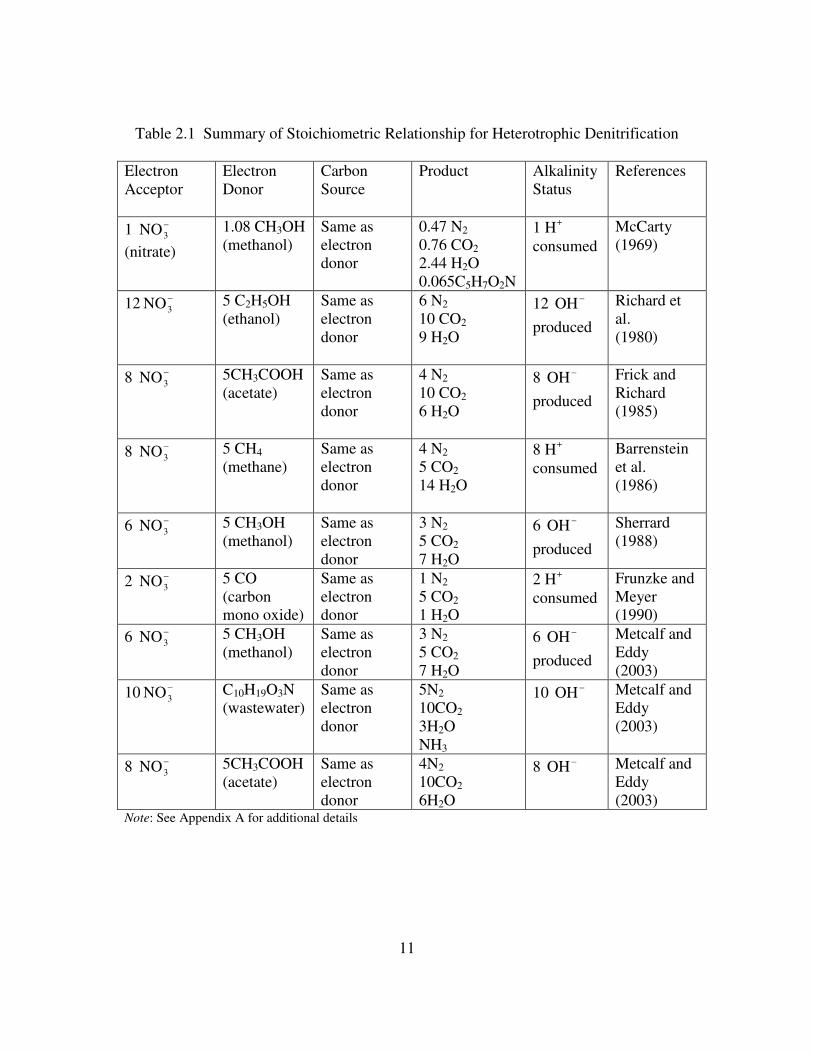
2.1 Summary of Stoichiometric Relationship for HeterotrophicDenitrification .............................................................................................. 11
2.2 Summary of Stoichiometric Relationship for AutotrophicDenitrification .............................................................................................. 12
3.1 The Density, Void Ratio, and Specific Surface Area of the Media ............. 31
3.2 Composition of Micro Nutrients for Continuous Up-Flow Reactor ............ 34
3.3 Hydraulic Loadings and NNO3 −− Concentrations in the Feed During
4.1 Characteristics of Batch Reactor Feed ......................................................... 42
4.2 Batch Reactor Daily Effluent Quality Data and Gas Generation................. 43
4.3 Average Concentrations of Measured Parameters in the Influent andEffluent from Each Port at Hydraulic Loading of 0.06 m3/m2.hr and
Influent Target NNO3 −− Concentrations of 20, 50, 70, and 90 mg/L........ 46
4.4 Average Concentrations of Measured Parameters in the Influent andEffluent from Each Port at Hydraulic Loading of 0.08 m3/m2.hr and
Influent Target NNO3 −− Concentrations of 20, 40, 50, 60, and 70 mg/L.. 50
4.5 Average Concentrations of Measured Parameters in the Influent andEffluent from Each Port at Hydraulic Loading of 0.10 m3/m2.hr and
Influent Target NNO3 −− Concentrations of 20, 40, 60, and 70 mg/L........ 55
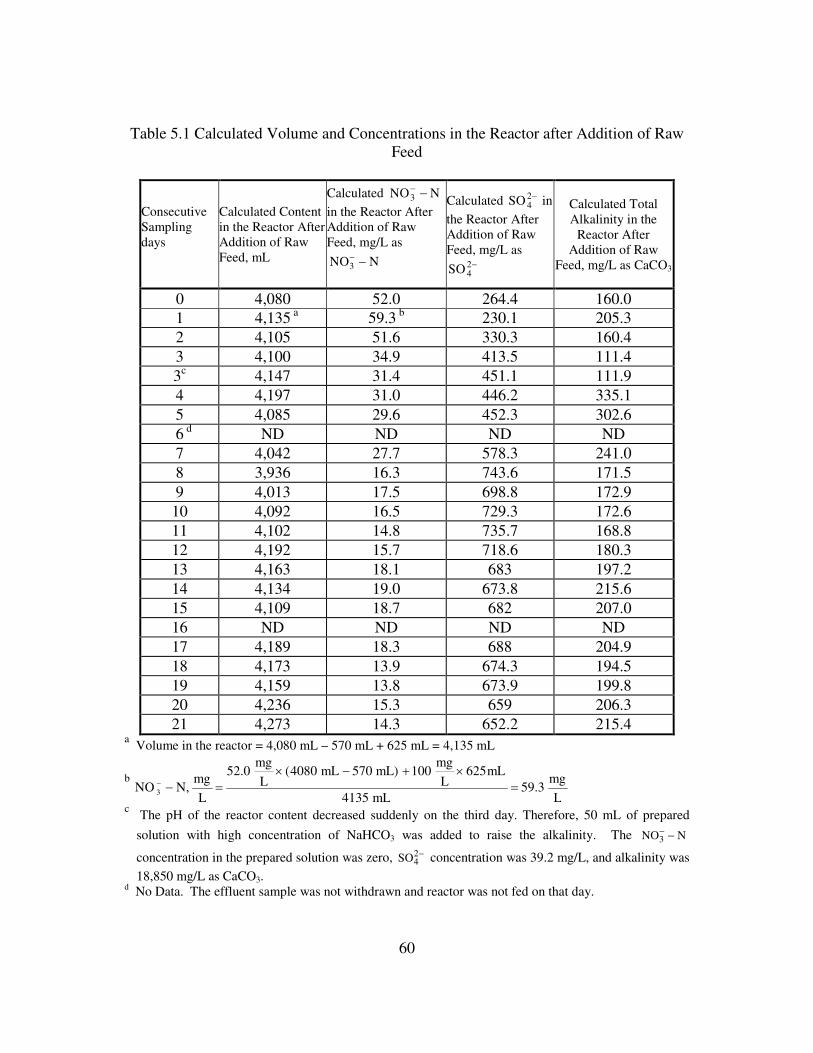
5.1 Calculated Volume and Concentrations in the Reactor after Addition ofRaw Feed ...................................................................................................... 60
Figure 3.2 Photograph of Batch Reactor Assembly and Gas Collection System
29
Figure 3.3 Assembly of Sulfur-Packed Continuous Up-Flow Reactor
Drain
9.53 mm (TYP)(3/8”)
12.7-mm (1/2”) Diameter(TYP)
15.24 cm(6”)
10.16 cm(4”)
30.48 cm(1’)
228.6 cm(7.5’)
EffluentS-6
S-5
S-4
S-3
S-1
InfluentReservoir
S-2
30.48 cm (TYP)(1’)
Gravel
Granular Sulfur
EffluentReservoir
Pump
30
Figure 3.4 Photograph of Sulfur-Packed Continuous Up-Flow Reactor
31
3.2 Sulfur Media
The media in the packed-bed reactor was elemental sulfur. The elemental sulfur
was obtained from the International Sulfur, Inc., Mount Pleasant, Texas. The media
size was between 2.38 mm and 4.76 mm in diameter (U.S. Standard Sieve Size #8 and
#4). The physical characteristics of the media was determined in the laboratory using
the standard procedures. These procedures are provided in Appendix C. The density,
void ratio, and specific surface area of the media are provided in Table 3.1.
Table 3.1 The Density, Void Ratio, and Specific Surface Area of the Media
Media Physical Characteristics Values
Density 1.997 g/cm3
Void Ratio 0.4
Specific Surface Area 1.45 x 10³ m2/m3
3.3 Reactor Operation
3.3.1 Seed Cultivation in the Batch Reactor
The digested sludge from the Village Creek Wastewater Treatment Plant in Fort
Worth, Texas was brought for seed. The bacteria culture was developed by adding 100-
mL digested sludge, 300 cm3 granular sulfur, and 10 mg/L NNO3 −− in total liquid
volume of 4 L in the reaction vessel of the batch reactor. The content of the batch
reactor was mixed by the magnetic stirrer. Gas generation started after 7 days of
32
continuous mixing. The normal operation of the batch reactor started by sample
withdrawal, reactor feeding, and gas volume measurement.
3.3.2 Operation of Batch Reactor
The batch reactor operation was on a fill and draw basis. Each day
approximately 600 mL of reactor content was removed for analyses and equal volume
of fresh feed was added. The sample analyses included measurement of pH,
concentrations of total alkalinity, NNO3 −− , and −2
4SO of the feed and the withdrawn
liquid. Additionally, temperature and gas production each day were recorded. The
volume of gas after measurement each day was released, and the level in the gas vessel
was reset.
Addition of sodium bicarbonate (NaHCO3) was necessary in the feed to
maintain proper alkalinity and pH in the system. The alkalinity addition was 5.0 mg/L
alkalinity as CaCO3 per mg/L of nitrate nitrogen added in the reactor. The samples
withdrawn were filtered through a 0.45 µm glass fiber paper prior to laboratory
analysis. The laboratory data was used to calculate total gas production, sulfate
production, and alkalinity destruction for each mg/L of NNO3 −− removed from the
feed.
3.3.3 Operation of Continuous Up-Flow Reactor
The continuous flow reactor was started using a standard procedure. After the
denitrification was established in the reactor, the operation mode began. The start up
and operational mode are presented below.
33
3.3.3.1 Start-up Phase
The start up phase of the continuous flow reactor included reactor seeding.
Approximately 600 mL of seed from the batch reactor was added into the packed-bed
reactor. The remaining volume of the column was filled with feed solution consisting of
20 mg/L of nitrate nitrogen. After one day of media soaking, the internal re-circulation
was started. The alkalinity and nitrate concentration in the reactor content was checked
daily. After several days of recirculation the nitrate concentration in the recirculating
liquid started to drop. At that time the continuous feeding was started. A peristaltic
pump (Cole-Parmer Instrument Co.) was used to continuously pump the feed from the
bottom of the reactor. Initially the nitrate removal was inconsistent. Tap water was
used to prepare the feed. It was speculated that the chlorine residuals in the tap water
may have caused the interference. Therefore, the tap water was aerated for three days
for dechlorination before preparing the feed. Also sodium bicarbonate and
micronutrients were added in the feed. The composition of the micronutrient solution is
provided in Table 3.2. After these improvements were made, the nitrate removal
stabilized and remained such until the end of this research.
3.3.3.2 Reactor Operation
The continuous flow reactor was operated at three hydraulic loadings. At each
hydraulic loading, four different NNO3 −− concentrations in the feed were tested. These
concentrations were 20, 40, 60, and 70 mg/L NNO3 −− and hydraulic loadings were
0.06, 0.08, and 0.10 m3/m2.hr. The reactor was operated for at least 7 days at each
34
nitrate nitrogen concentration in the feed. The reactor operation matrix is provided in
Table 3.3.
Table 3.2 Composition of Micro Nutrients for Continuous Up-Flow Reactor
Constituent Concentration in the feedNaHCO3 Based on alkalinity ratio of 5 mg/L as
CaCO3 per mg/L of NNO3 −− , NaHCO3
was added in the feedK2HPO4 0.2 mg/L as PNH4Cl 1 mg/L as NMgCl2.6H2O 1 mg/L as MgCl2.6H2OFeCl3.6H2O 1 mg/L as FeCl3.6H2OMnSO4.H2O 1 mg/L as MnSO4.H2OpH 8.3~8.6Note: This composition is a modification of the formula provided by Batchelor (1978)
Table 3.3 Hydraulic Loadings and NNO3 −− Concentrations in the Feed During
Operation Phase
Hydraulic Loading,m3/m2.hr
NNO3 −− Concentration in the Feed,
mg/L0.06 20 50 70 90 -
0.08 20 40 50 60 70
0.10 20 40 60 70 -
3.3.4 Sampling, and Sample Preparation
The influent sample was collected from the influent feed tank. The effluent
samples were collected from six effluent ports. The routine measurements and analyses
35
included temperature, pH, total alkalinity, NNO3 −− , NNO2 −
− , and −24SO . The
influent DO was checked on routine basis. The temperature, pH and total alkalinity
measurements were made immediately. The samples were filtered through 0.45 µm
membrane filter. Effluents were made to complete all analytical measurements on the
day of sampling. The samples were stored in the environmental chamber at 5oC to
complete the analysis at a later time. The maximum storage time was two days. All
stored samples were allowed to warm up to the room temperature before conducting the
analytical tests. The details of the analytical procedures are provided in Appendix D.
3.3.5 Applied Hydraulic and Substrate Loadings
The continuous up-flow reactor was operated under variable NNO3 −− as well
as hydraulic loadings. As a result, each sample withdrawn from different ports had
different detention time and NNO3 −− loading. The applied hydraulic loadings and
corresponding true hydraulic retention time (THRT) at each sampling port are
summarized in Table 3.4. The NNO3 −− loading at different sampling ports were
calculated from the hydraulic loading and the hydraulic retention time. The calculated
NNO3 −− loadings at each port resulting from different NNO3 −
− concentration in the
feed and hydraulic loadings are summarized in Tables 3.5-3.10.
36
Table 3.4 Summary of THRT at Each Sampling Port at Three Hydraulic Loadings
Sampling Port
1 2 3 4 5 6HydraulicSurface
Loading, Qv True Hydraulic Retention Time (THRT), hrs
Table 3.5 Summary of NNO3 −− Loadings at Each Sampling Port at Three Hydraulic
Loadings (Influent NNO3 −− = 20 mg/L)
Sampling Port
1 2 3 4 5 6HydraulicSurface
Loading, Qv NNO3 −− Loading, g/m3.d
0.06m3/m2.hr
236a 118 79 59 47 39
0.08m3/m2.hr
315 157 105 79 63 52
0.10m3/m2.hr
394 197 131 98 79 66a
.dg/m236.2hr/d)(240.4)m/(0.3048)g/m20.hr/mm(0.06
LoadingN-NO
3323
-3
=×××××
=××
=××
×=
×=
eh
CQ
eh
CQ/A
ehA
CQ
V
CQ v
37
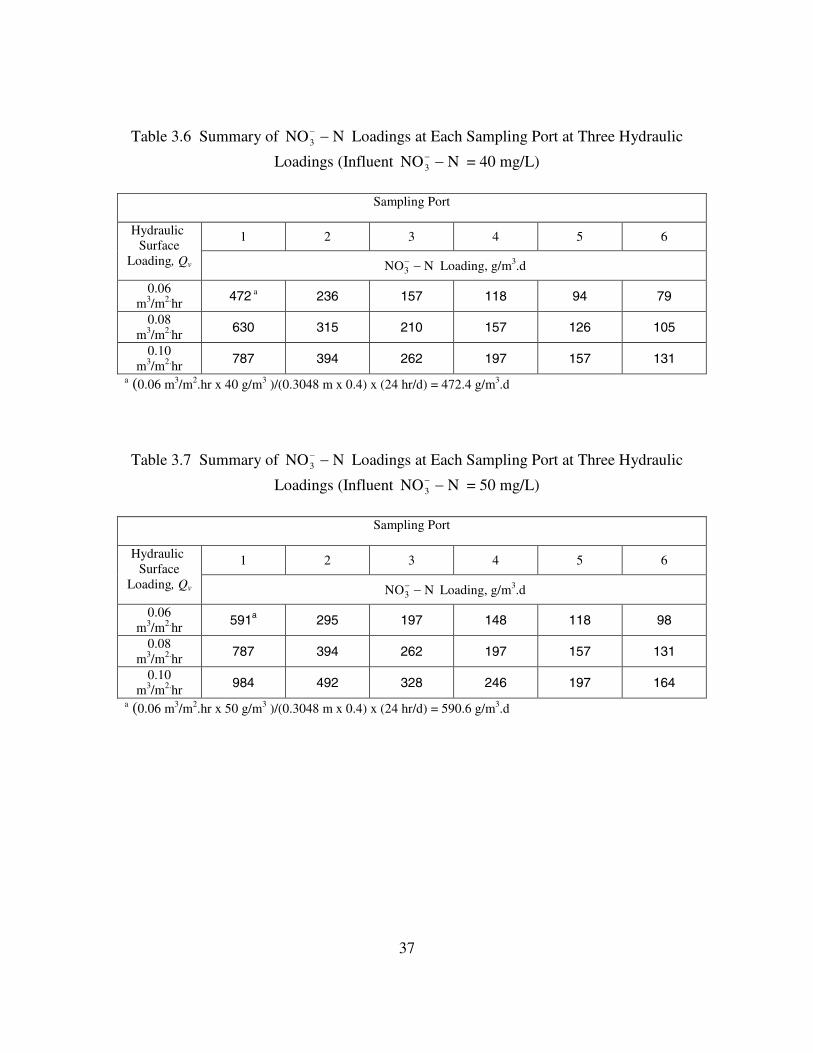
Table 3.6 Summary of NNO3 −− Loadings at Each Sampling Port at Three Hydraulic
Loadings (Influent NNO3 −− = 40 mg/L)
Sampling Port
1 2 3 4 5 6HydraulicSurface
Loading, Qv NNO3 −− Loading, g/m3.d
0.06m3/m2.hr 472 a 236 157 118 94 79
0.08m3/m2.hr 630 315 210 157 126 105
0.10m3/m2.hr 787 394 262 197 157 131
a (0.06 m3/m2.hr x 40 g/m3 )/(0.3048 m x 0.4) x (24 hr/d) = 472.4 g/m3.d
Table 3.7 Summary of NNO3 −− Loadings at Each Sampling Port at Three Hydraulic
Loadings (Influent NNO3 −− = 50 mg/L)
Sampling Port
1 2 3 4 5 6HydraulicSurface
Loading, Qv NNO3 −− Loading, g/m3.d
0.06m3/m2.hr 591a 295 197 148 118 98
0.08m3/m2.hr 787 394 262 197 157 131
0.10m3/m2.hr 984 492 328 246 197 164
a (0.06 m3/m2.hr x 50 g/m3 )/(0.3048 m x 0.4) x (24 hr/d) = 590.6 g/m3.d
38
Table 3.8 Summary of NNO3 −− Loadings at Each Sampling Port at Three Hydraulic
Loadings (Influent NNO3 −− = 60 mg/L)
Sampling Port
1 2 3 4 5 6HydraulicSurface
Loading, Qv NNO3 −− Loading, g/m3.d
0.06m3/m2.hr 709a 354 236 177 142 118
0.08m3/m2.hr 945 472 315 236 189 157
0.10m3/m2.hr 1181 591 394 295 236 197
a (0.06 m3/m2.hr x 60 g/m3 )/(0.3048 m x 0.4) x (24 hr/d) = 708.7 g/m3.d
Table 3.9 Summary of NNO3 −− Loadings at Each Sampling Port at Three Hydraulic
Loadings (Influent NNO3 −− = 70 mg/L)
Sampling Port
1 2 3 4 5 6HydraulicSurface
loading, Qv NNO3 −− Loading, g/m3.d
0.06m3/m2.hr 827a 413 276 207 165 138
0.08m3/m2.hr 1102 551 367 276 220 184
0.10m3/m2.hr 1378 689 459 344 276 230
a (0.06 m3/m2.hr x 70 g/m3 )/(0.3048 m x 0.4) x (24 hr/d) = 826.8 g/m3.d
39
Table 3.10 Summary of NNO3 −− Loadings at Each Sampling Port at Three Hydraulic
Loadings (Influent NNO3 −− = 90 mg/L)
Sampling Port
1 2 3 4 5 6HydraulicSurface
Loading, Qv NNO3 −− Loading, g/m3.d
0.06m3/m2.hr 1063a 531 354 266 213 177
0.08m3/m2.hr 1417 709 472 354 283 236
0.10m3/m2.hr 1772 886 519 443 354 295
a (0.06 m3/m2.hr x 90 g/m3 )/(0.3048 m x 0.4) x (24 hr/d) = 1,063 g/m3.d
40
CHAPTER 4
RESULTS
The experimental program was conducted with two reactors: (1) an anaerobic
batch reactor, and (b) a continuous up-flow reactor. Results of each reactor study are
presented below.
4.1 Batch Reactor Study
The purpose of the batch reactor study was to (1) develop microbial seed to be
used in the continuous flow reactor, and (2) develop relationships between gas volume
generated, alkalinity destruction, and sulfate production with respect to NNO3 −−
destruction. The batch reactor study was conducted under anaerobic condition. The
reactor contained granular sulfur and the reactor contents were continuously mixed.
The effluent and influent samples were withdrawn and fed daily. The graduated gas
collection vessel was connected to the reactor, and volume of gas generated daily was
recorded. During the initial adjustment phase of reactor operation, the active microbial
population was established. This was indicated by consistent gas production. It took
approximately two weeks to reach the nearly consistent gas generation, and the data
recording began.
On a daily basis, approximately 600 mL of the reactor content was removed and
equal volume of nitrate containing substrate was added into the reactor. The
41
concentrations of alkalinity, nitrate-N, and sulfate in the influent and effluent were
measured and recorded. Additionally, pH, temperature, and gas volume produced were
measured for each day of operation. The volume of gas produced each day was
recorded before releasing the gas. Daily pH values, concentrations of NNO3 −− and
−24SO , total alkalinity in the feed, and daily volume of feed introduced into the batch
reactor are summarized in Tables 4.1. Additionally, the daily pH values, and
concentrations of NNO3 −− , −2
4SO , and total alkalinity in the effluent, volume of gas
produced, and volume of liquid withdrawn from the reactor are provided in Table 4.2.
The data presented in Tables 4.1 and 4.2 are from the day the data recording began. The
initial data of approximately two weeks of operation are not included in these tables.
4.2 Continuous Up-Flow Reactor Study
The continuous flow reactor consisted of a column packed with granular sulfur.
The purpose of the continuous flow reactor study was to: (1) operate the reactor at
different hydraulic and nitrate loadings; (2) develop relationships of alkalinity
destruction per unit nitrate nitrogen removal, and sulfate generation per unit nitrate
nitrogen removal; and (3) utilize measured data to model the effluent concentrations of
NNO3 −− and NNO2 −
− with respect to THRT.
42
Table 4.1 Characteristics of Batch Reactor Feed
ConsecutiveSampling
DayspH
NitrateNitrogen,mg/L as
N3NO −−
Sulfate,mg/L as
−24SO
TotalAlkalinity,
mg/L asCaCO3
DailyFeed
Volume,mL
0 7.9 100 37.5 460 625
1 8.0 100 39.2 460 550
2 8.3 100 39.2 460 580
3 8.3 100 39.2 460 710
3a ND 0 39.2 18850 50
4 8.3 100 39.2 460 610
5 8.6 100 39.2 460 530
6 b ND ND ND ND ND
7 8.6 100 37.5 578 480
8 8.6 100 37.5 578 640
9 8.6 100 37.5 578 650
10 8.6 100 37.5 578 590
11 8.6 100 37.5 578 660
12 8.1 100 37.5 580 590
13 8.0 100 37.5 580 710
14 8.4 100 37.5 580 545
15 8.4 100 37.5 580 650
16 ND ND ND ND ND
17 8.4 100 37.5 580 550
18 8.7 100 37.5 580 565
19 8.0 100 37.5 572 650
20 8.3 100 37.5 572 610
21 8.3 100 37.5 572 605a The pH of the reactor content decreased suddenly on the third day. Therefore, 50 mL of prepared
solution with high concentration of NaHCO3 was added to raise the alkalinity. The NNO3 −−
concentration in this solution was zero, and −24SO concentration was 39.2 mg/L, and alkalinity was
18,850 mg/L as CaCO3.b No data. The effluent sample was not withdrawn and reactor was not fed.Note: The first data entry in this table is from the day the data collection began. Approximately two
weeks of initial unstable data are not included.
43
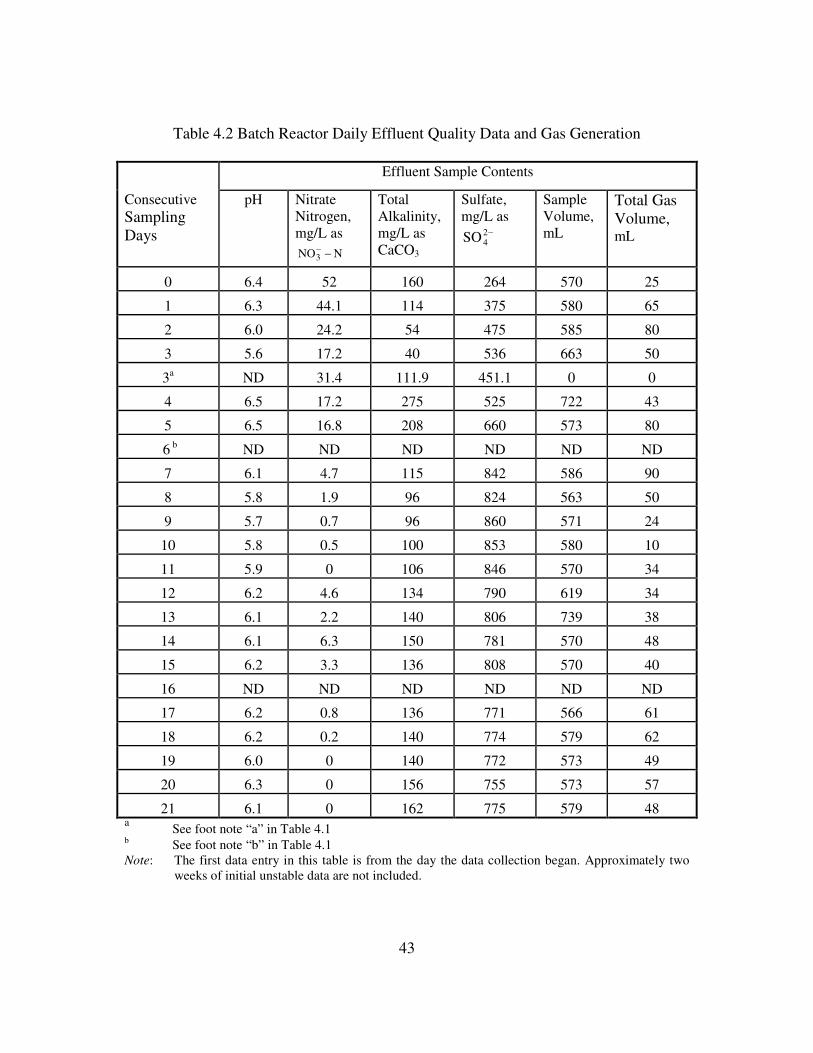
Table 4.2 Batch Reactor Daily Effluent Quality Data and Gas Generation
Effluent Sample Contents
ConsecutiveSamplingDays
pH NitrateNitrogen,mg/L as
NNO3 −−
TotalAlkalinity,mg/L asCaCO3
Sulfate,mg/L as
−24SO
SampleVolume,mL
Total GasVolume,mL
0 6.4 52 160 264 570 25
1 6.3 44.1 114 375 580 65
2 6.0 24.2 54 475 585 80
3 5.6 17.2 40 536 663 50
3a ND 31.4 111.9 451.1 0 0
4 6.5 17.2 275 525 722 43
5 6.5 16.8 208 660 573 80
6 b ND ND ND ND ND ND
7 6.1 4.7 115 842 586 90
8 5.8 1.9 96 824 563 50
9 5.7 0.7 96 860 571 24
10 5.8 0.5 100 853 580 10
11 5.9 0 106 846 570 34
12 6.2 4.6 134 790 619 34
13 6.1 2.2 140 806 739 38
14 6.1 6.3 150 781 570 48
15 6.2 3.3 136 808 570 40
16 ND ND ND ND ND ND
17 6.2 0.8 136 771 566 61
18 6.2 0.2 140 774 579 62
19 6.0 0 140 772 573 49
20 6.3 0 156 755 573 57
21 6.1 0 162 775 579 48a See foot note “a” in Table 4.1b See foot note “b” in Table 4.1Note: The first data entry in this table is from the day the data collection began. Approximately two
weeks of initial unstable data are not included.
44
4.2.1 Start-up Phase
During the start-up phase, the alkalinity and NNO3 −− destructions were
monitored. The influent feed contained: NNO3 −− = 20 mg/L, and Alkalinity = 184
mg/L as CaCO3. The hydraulic loading was 0.06 m3/m2.hr. During the start-up phase,
the reactor did not achieve high nitrate nitrogen removal efficiency. The following
modifications were made during startup phase: (1) the residual chlorine was removed by
aerating the tap water for three days before it was used to prepare the raw feed solution,
(2) micronutrients as specified in Table 3.2 were added into the raw feed, and (3) a
small granular sulfur-packed PVC pipe was provided in the front of the reactor column
to deoxygenate the feed. This trap effectively removed DO in the feed but also
removed a portion of NNO3 −− in the feed. As a result, the DO trap was removed,
while aeration for chlorine removal and micronutrients addition were continued during
the entire operational phase.
4.2.2 Operation Phase
After all the modifications were made during the start-up phase, the operation
phase was carried out for approximately three months at three different hydraulic
loadings, and four to five influent NNO3 −− concentrations. The measured parameters
for the continuous flow reactor were total alkalinity, nitrate nitrogen, nitrite nitrogen,
sulfate, pH, and temperature. These parameters were measured in the feed as well as in
the samples collected from each port of the column.
45
4.2.2.1 Results at Hydraulic Loading of 0.06 m3/m2.hr
The hydraulic loading of 0.06 m3/m2.hr was maintained at a feed rate of 8.1 mL
per minute (0.000486 m3/hr) over the column area of 0.0081 m2. The column at this
hydraulic loading was operated from January 30th to March 6th, and the target NNO3 −−
concentrations in the feed were changed in the ascending order of 20, 50, 70, and 90
mg/L. The actual NNO3 −− concentrations in the feed however, were slightly different
from the target concentrations. Only 6 to 11 days of operation data at each influent
NNO3 −− concentration were averaged, while approximately 1 to 2 days of transition
data immediately after changing the NNO3 −− concentration in the feed were ignored.
The data are reported in Table 4.3 and illustrated in Figure 4.1.
46
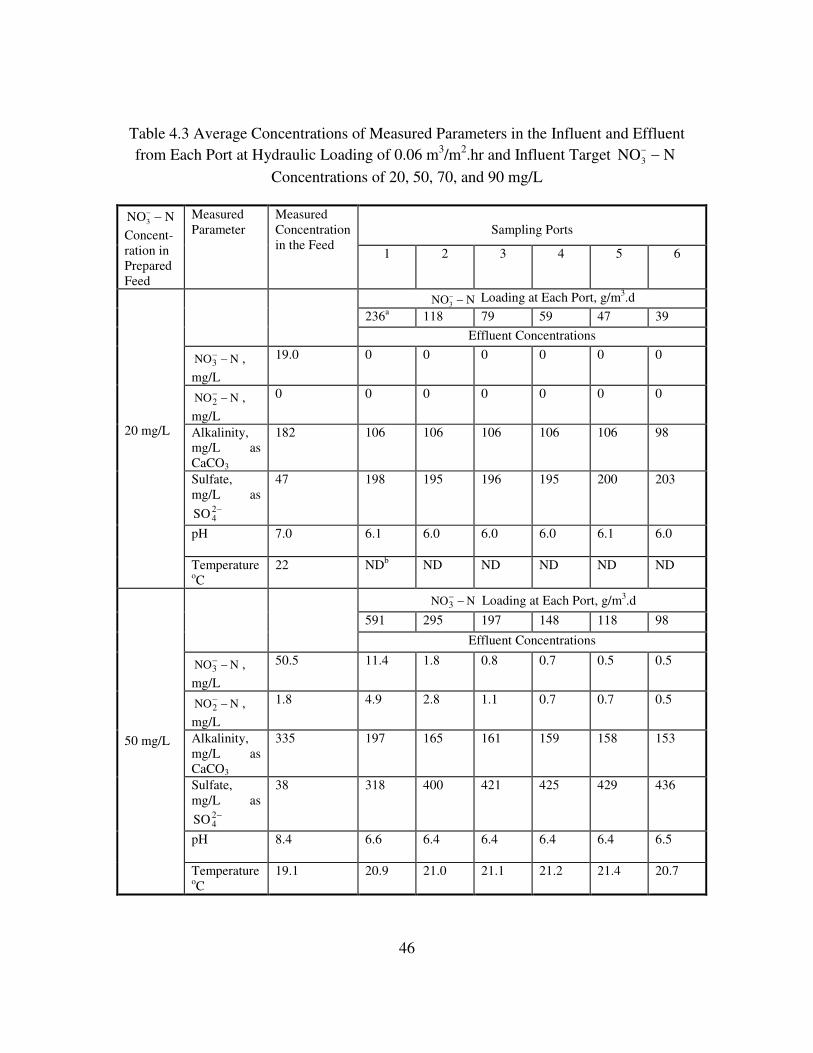
Table 4.3 Average Concentrations of Measured Parameters in the Influent and Effluentfrom Each Port at Hydraulic Loading of 0.06 m3/m2.hr and Influent Target NNO3 −
−
Concentrations of 20, 50, 70, and 90 mg/L
Sampling PortsNNO3 −
−
Concent-ration inPreparedFeed
MeasuredParameter
MeasuredConcentrationin the Feed
1 2 3 4 5 6
NNO3 −− Loading at Each Port, g/m3.d
236a 118 79 59 47 39
Effluent Concentrations
NNO3 −− ,
mg/L
19.0 0 0 0 0 0 0
NNO2 −− ,
mg/L
0 0 0 0 0 0 0
Alkalinity,mg/L asCaCO3
182 106 106 106 106 106 98
Sulfate,mg/L as
−24SO
47 198 195 196 195 200 203
pH 7.0 6.1 6.0 6.0 6.0 6.1 6.0
20 mg/L
TemperatureoC
22 NDb ND ND ND ND ND
NNO3 −− Loading at Each Port, g/m3.d
591 295 197 148 118 98
Effluent Concentrations
NNO3 −− ,
mg/L
50.5 11.4 1.8 0.8 0.7 0.5 0.5
NNO2 −− ,
mg/L
1.8 4.9 2.8 1.1 0.7 0.7 0.5
Alkalinity,mg/L asCaCO3
335 197 165 161 159 158 153
Sulfate,mg/L as
−24SO
38 318 400 421 425 429 436
pH 8.4 6.6 6.4 6.4 6.4 6.4 6.5
50 mg/L
TemperatureoC
19.1 20.9 21.0 21.1 21.2 21.4 20.7
47
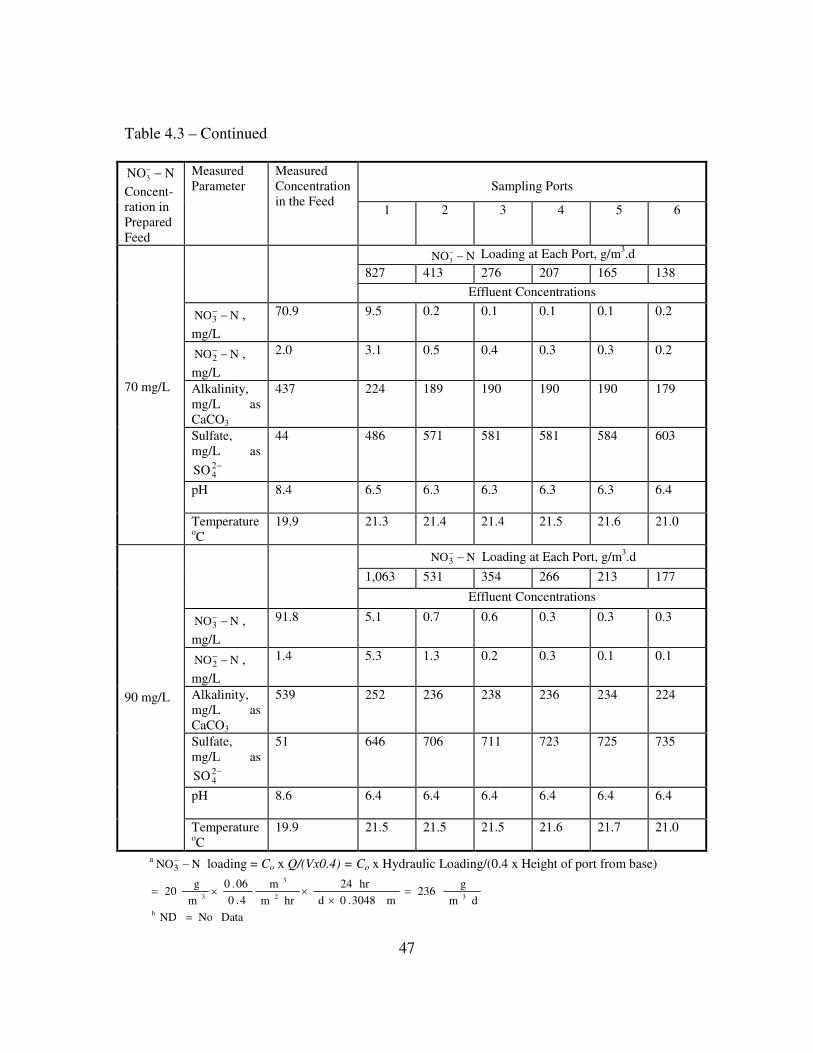
Table 4.3 – Continued
Sampling PortsNNO3 −
−
Concent-ration inPreparedFeed
MeasuredParameter
MeasuredConcentrationin the Feed
1 2 3 4 5 6
NNO3 −− Loading at Each Port, g/m3.d
827 413 276 207 165 138
Effluent Concentrations
NNO3 −− ,
mg/L
70.9 9.5 0.2 0.1 0.1 0.1 0.2
NNO2 −− ,
mg/L
2.0 3.1 0.5 0.4 0.3 0.3 0.2
Alkalinity,mg/L asCaCO3
437 224 189 190 190 190 179
Sulfate,mg/L as
−24SO
44 486 571 581 581 584 603
pH 8.4 6.5 6.3 6.3 6.3 6.3 6.4
70 mg/L
TemperatureoC
19.9 21.3 21.4 21.4 21.5 21.6 21.0
NNO3 −− Loading at Each Port, g/m3.d
1,063 531 354 266 213 177
Effluent Concentrations
NNO3 −− ,
mg/L
91.8 5.1 0.7 0.6 0.3 0.3 0.3
NNO2 −− ,
mg/L
1.4 5.3 1.3 0.2 0.3 0.1 0.1
Alkalinity,mg/L asCaCO3
539 252 236 238 236 234 224
Sulfate,mg/L as
−24SO
51 646 706 711 723 725 735
pH 8.6 6.4 6.4 6.4 6.4 6.4 6.4
90 mg/L
TemperatureoC
19.9 21.5 21.5 21.5 21.6 21.7 21.0
a NNO3 −− loading = Co x Q/(Vx0.4) = Co x Hydraulic Loading/(0.4 x Height of port from base)
Figure 4.1 Graphical Presentation of Effluent Concentrations (a) NNO3 −− , and
NNO2 −− Concentrations with Respect to THRT, and (b) Alkalinity and Sulfate
Concentrations with Respect to THRT at Hydraulic Loading of 0.06 m3/m2.hr
49
4.2.2.2 Results at Hydraulic Loading of 0.08 m3/m2.hr
The hydraulic loading of 0.08 m3/m2.hr was maintained at a feed rate of 10.8 mL
per minute (0.000649 m3/hr) over the column area of 0.0081 m2.
The column at this hydraulic loading was operated from March 19th to April
18th, and the target NNO3 −− concentrations in the feed were changed in the descending
order of 70, 60, 50, 40, and 20 mg/L. The actual NNO3 −− concentrations in the feed
however, were slightly different from the target concentrations. Only 4 to 6 days of the
operation data at each influent NNO3 −− concentration were averaged, while
approximately 1 to 2 days of transition data immediately after changing the NNO3 −−
concentration in the feed were ignored. The data are reported in Table 4.4 and
illustrated in Figure 4.2.
50
Table 4.4 Average Concentrations of Measured Parameters in the Influent and Effluentfrom Each Port at Hydraulic Loading of 0.08 m3/m2.hr and Influent Target NNO3 −
−
Concentrations of 20, 40, 50, 60, and 70 mg/L
Sampling PortsNNO3 −−
Concent-ration inPreparedFeed
MeasuredParameter
MeasuredConcentrationin the Feed
1 2 3 4 5 6
NNO3 −− Loading at Each Port, g/m3.d
315a 157 105 79 63 52
Effluent Concentrations
NNO3 −− ,
mg/L
19.9 0.1 0.1 0.0 0.0 0.0 0.0
NNO2 −− ,
mg/L
2.0 0.3 0.1 0.1 0.2 0.2 0.3
Alkalinity,mg/L asCaCO3
193 117 117 117 117 117 106
Sulfate,mg/L as
−24SO
63 229 236 231 237 240 244
PH 8.3 6.5 6.5 6.5 6.5 6.5 6.5
20 mg/L
TemperatureoC
21.0 21.8 21.8 21.9 22.0 22.0 22.0
NNO3 −− Loading at Each Port, g/m3.d
630 315 210 157 126 105
Effluent Concentrations
NNO3 −− ,
mg/L
37.9 1.1 0.7 0.6 0.6 0.6 0.6
NNO2 −− ,
mg/L
2.4 6.9 0.3 0.5 0.2 0.2 0.2
Alkalinity,mg/Las CaCO3
293 165 156 155 152 149 134
Sulfate,mg/L as
−24SO
59.3 345 365 378 380 375 390
pH 8.3 6.5 6.5 6.5 6.5 6.4 6.4
40 mg/L
TemperatureoC
21.0 21.9 21.9 21.9 22.0 22.0 21.7
51
Table 4.4 – Continued
Sampling PortsNNO3 −−
Concent-ration inPreparedFeed
MeasuredParameter
MeasuredConcentrationin the Feed
1 2 3 4 5 6
NNO3 −− Loading at Each Port, g/m3.d
787 394 262 197 157 131
Effluent Concentrations
NNO3 −− ,
mg/L
48.8 0.4 0.2 0.2 0.2 0.2 0.2
NNO2 −− ,
mg/L
1.5 4.9 0.6 0.3 0.4 0.3 0.3
Alkalinity,mg/Las CaCO3
342 181 174 175 175 174 166
Sulfate,mg/L as
−24SO
58 403 419 411 421 428 430
pH 8.4 6.5 6.4 6.4 6.4 6.4 6.5
50 mg/L
TemperatureoC
20.4 21.3 21.3 21.3 21.4 21.5 21.1
NNO3 −− Loading at Each Port, g/m3.d
945 472 315 236 189 157
Effluent Concentrations
NNO3 −− ,
mg/L
57.6 5.0 1.5 0.6 0.5 0.4 0.4
NNO2 −− ,
mg/L
1.3 12.2 7.2 3.3 1.4 1.2 0.5
Alkalinity,mg/Las CaCO3
394 214 200 193 192 191 186
Sulfate,mg/L as
−24SO
56 419 470 497 501 509 511
pH 8.5 6.5 6.5 6.4 6.4 6.4 6.5
60 mg/L
TemperatureoC
19.4 21.2 21.2 21.2 21.4 21.5 21.0
52
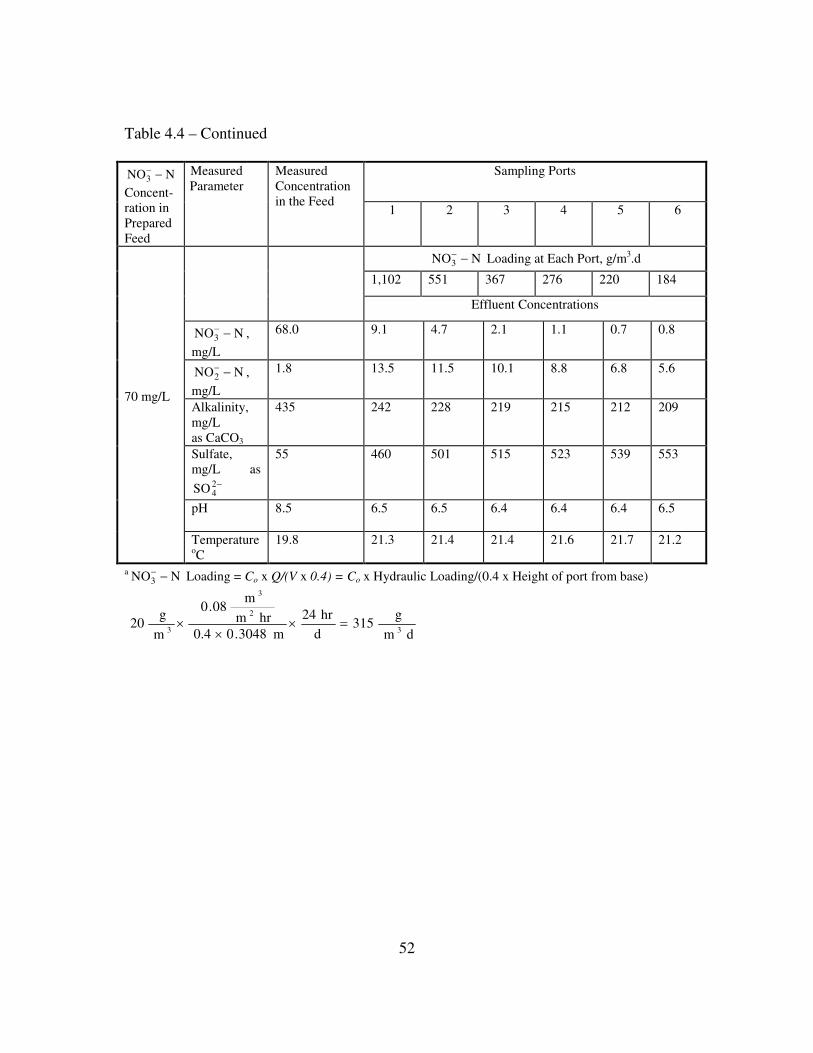
Table 4.4 – Continued
Sampling PortsNNO3 −−
Concent-ration inPreparedFeed
MeasuredParameter
MeasuredConcentrationin the Feed
1 2 3 4 5 6
NNO3 −− Loading at Each Port, g/m3.d
1,102 551 367 276 220 184
Effluent Concentrations
NNO3 −− ,
mg/L
68.0 9.1 4.7 2.1 1.1 0.7 0.8
NNO2 −− ,
mg/L
1.8 13.5 11.5 10.1 8.8 6.8 5.6
Alkalinity,mg/Las CaCO3
435 242 228 219 215 212 209
Sulfate,mg/L as
−24SO
55 460 501 515 523 539 553
pH 8.5 6.5 6.5 6.4 6.4 6.4 6.5
70 mg/L
TemperatureoC
19.8 21.3 21.4 21.4 21.6 21.7 21.2
a NNO3 −− Loading = Co x Q/(V x 0.4) = Co x Hydraulic Loading/(0.4 x Height of port from base)
Figure 4.2 Graphical Presentation of Effluent Concentrations (a) NNO3 −− , and
NNO2 −− Concentrations with Respect to THRT, and (b) Alkalinity and Sulfate
Concentrations with Respect to THRT at Hydraulic Loading of 0.08 m3/m2.hr.
54
4.2.2.3 Results at Hydraulic Loading of 0.10 m3/m2.hr
The hydraulic loading of 0.10 m3/m2.hr was maintained at a feed rate of 13.5 mL
per minute (0.000811 m3/hr) over the column area of 0.0081 m2.
The column at his hydraulic loading was operated from April 19th to May 11th,
and the target NNO3 −− concentrations in the feed were changed in the ascending order
of 20, 40, 60, and 70 mg/L. The actual NNO3 −− concentrations in the feed however,
were slightly different from the target concentrations. Only 4 to 6 days of operation data
at each influent NNO3 −− concentration were averaged, while approximately 1 day of
transition data immediately after changing the NNO3 −− concentration in the feed were
ignored. The data are reported in Table 4.5 and illustrated in Figures 4.3.
55
Table 4.5 Average Concentrations of Measured Parameters in the Influent and Effluentfrom Each Port at Hydraulic Loading of 0.10 m3/m2.hr and Influent Target NNO3 −
Figure 5.7 Comparison of Average C/Co from Experimental Result and Calculated C/Co from Derived k1 and k2
89
90
The results of sensitivity analysis are illustrated in Figures 5.8 and 5.9. The key results
are summarized below.
(1) The NNO2 −− concentrations are sensitive to change in reaction rate
constant k2. As k2 value is increased over the optimum k2, the model predicts
lower NNO2 −− concentration (Figure 5.8(a)). Alternatively, as k2 is
decreased from the optimum k2, the model predicts significantly higher
NNO2 −− concentration (Figure 5.8(b)). The largest change however, occurs
at THRT of around 1.2 hr.
(2) The NNO3 −− concentrations are sensitive to the change in reaction rate
constant k1. As k1 value is increased over the optimum k1, the model predicts
lower NNO2 −− concentration (Figure 5.9(a)). The NNO3 −
−
concentrations are very sensitive to the decrease in reaction rate constant k1.
It shows a significant rise at THRT of around 1.2 hr (Figure 5.9(b)). The
change of NNO3 −− concentrations is much less with the increase in k1.
(3) The concentration of both NNO3 −− and NNO2 −
− are very sensitive to the
change in k1 and k2 at THRT of around 1.2 hr. As the THRT is increased,
the results become less sensitive to the change in reaction rate constants k1
and k2. At THRT of 4.0 hr, concentrations of NNO3 −− and NNO2 −
−
approach zero.
91
0%
10%
20%
30%
40%
50%
60%
70%
80%
90%
100%
0 2 4 6 8 10 12
THRT, hrs
C/C
o
Experimental NO3-NExperimental NO2-NBest fit NO3-N (k1=1.41/hr, k2=3.15/hr)Best fit NO2-N (k1=1.41/hr, k2=3.15/hr)Calculated NO3-N, k2=4.73/hr (50% higher than best fit k2=3.15/hr)Calculated NO2-N, k2=4.73/hr (50% higher than best fit k2=3.15/hr)
k 1 constant at 1.41/hr (best fit value)
k 2 =4.73/hr (50% higher than best fit k 2=3.15/hr)
(a)
0%
10%
20%
30%
40%
50%
60%
70%
80%
90%
100%
0 2 4 6 8 10 12
THRT, hrs
C/C
o
Experimental NO3-NExperimental NO2-NBest fit NO3-N (k1=1.41/hr, k2=3.15/hr)Best fit NO2-N (k1=1.41/hr, k2=3.15/hr)Calculated NO3-N, k2=1.58/hr (50% lower than best fit k2=3.15/hr)Calculated NO2-N, k2=1.58/hr (50% lower than best fit k2=3.15/hr)
k 1 constant at 1.41/hr (best fit value)
k 2 = 1.58/hr (50% lower than best fit k 2 = 3.15/hr)
(b)
Figure 5.8 Sensitivity Analysis and Concentration Profiles (a) k1 Constant at 1.41/hr(best fit value) and k2 = 4.73/hr (50% higher than the best fit k2 = 3.15/hr), and (b) k1
Constant at 1.41/hr (best fit value) and k2 = 1.58/hr (50% lower than the best fit k2 =3.15/hr)
92
0%
10%
20%
30%
40%
50%
60%
70%
80%
90%
100%
0 2 4 6 8 10 12
THRT, hrs
C/C
o
Experimental NO3-NExperimental NO2-NBest fit NO3-N (k1 = 1.41/hr, k2 = 3.15/hr)Best fit NO2-N (k1 = 1.41/hr, k2 = 3.15/hr)Calculated NO3-N, k1 = 2.11/hr (50% higher than best fit k1 = 1.41/hr)Calculated NO2-N, k1 = 2.11/hr (50% higher than best fit k1 = 1.41/hr)
k 2 constant at 3.15/hr (best fit value)
k 1 = 2.11/hr (50% higher than best fit k 1 = 1.41/hr)
(a)
0%
10%
20%
30%
40%
50%
60%
70%
80%
90%
100%
0 2 4 6 8 10 12
THRT, hrs
C/C
o
Experimental NO3-NExperimental NO2-NBest fit NO3-N (k1 = 1.41/hr, k2 = 3.15/hr)Best fit NO2-N (k1 = 1.41/hr, k2= 3.15/hr)Calculated NO3-N, k1 = 0.71 (50% lower than best fit k1= 1.41/hr)Calculated NO2-N, k1 = 0.71/hr (50% lower than best fit k1=1.41/hr)
k 2 constant at 3.15/hr (best fit value)
k 1 = 0.71/hr (50% lower than best fit k 1 = 1.41)
(b)
Figure 5.9 Sensitivity Analysis and Concentration Profiles (a) k2 Constant at 3.15/hr(best fit value) and k1 = 2.11/hr (50% higher than the best fit k1 = 1.41/hr), and (b) k2
Constant at 3.15/hr (best fit value) and k1 = 0.71/hr (50% lower than the best fit k1 =1.41/hr)
93
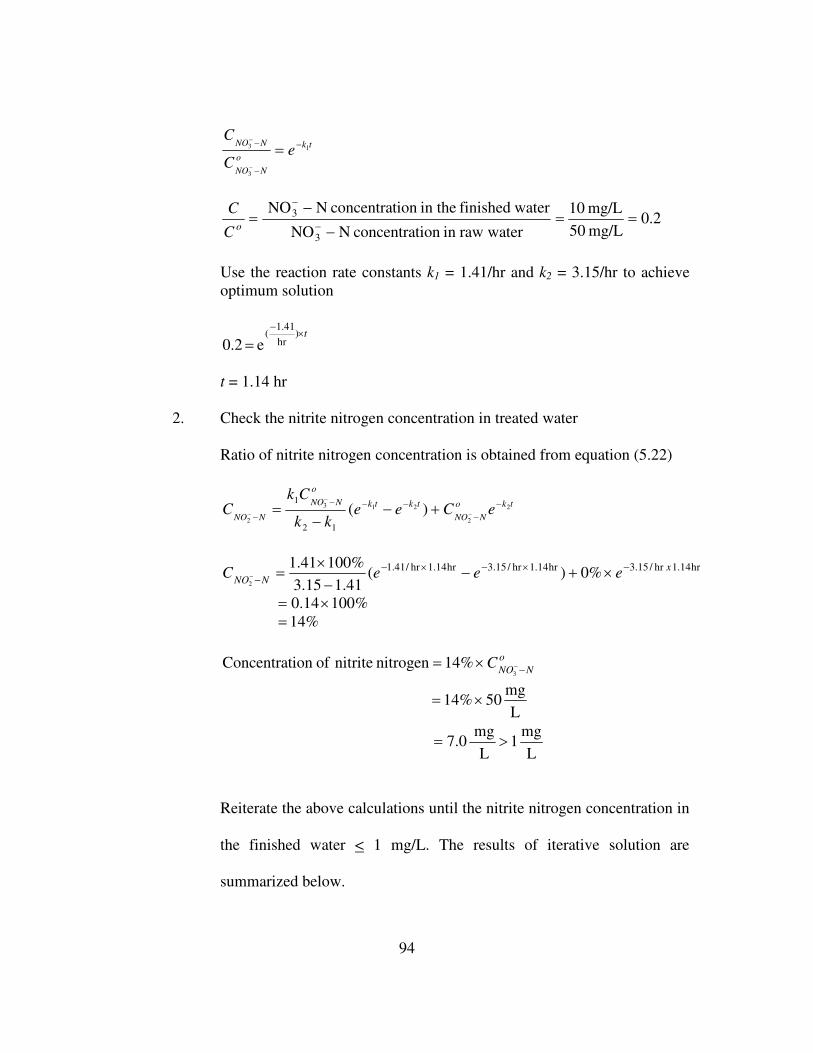
5.2.6 Design Example
A design example is presented in this section to illustrate the procedure for
designing an up-flow sulfur packed column to remove nitrate from a groundwater
supply source. The average nitrate nitrogen concentration is 50 mg/L, and average flow
is 0.5 mgd. The finished water quality must meet the Safe Drinking Water Quality
Standards; the MCLs for NNO3 −− and NNO2 −
− below 10 mg/L and 1 mg/L
respectively. Determine the dimension of the sulfur-packed up-flow reactor.
(A) Design Criteria Used
The design criteria for the sulfur-packed up-flow column.
Design flow = 0.5 mgd = 1,893 m3/d
Reactor type = up-flow granular sulfur-packedcolumn
Raw water NNO3 −− concentration = 50 mg/L
Raw water NNO2 −− concentration = 0 mg/L
Finished water NNO3 −− concentration < 10 mg/L
Finished water NNO2 −− concentration < 1 mg/L
(B) Solution
1. Determine the true hydraulic detention time (THRT)
THRT is obtained from equation (5.21)
94
tk
o
NNO
NNOe
C
C1
3
3 −
−
− =−
−
2.0mg/L50
mg/L10
waterrawinionconcentratNNO
waterfinishedin theionconcentratNNO
3
3 ==−
−=
−
−
oC
C
Use the reaction rate constants k1 = 1.41/hr and k2 = 3.15/hr to achieveoptimum solution
t×−
=)
hr
41.1(
e0.2
t = 1.14 hr
2. Check the nitrite nitrogen concentration in treated water
Ratio of nitrite nitrogen concentration is obtained from equation (5.22)
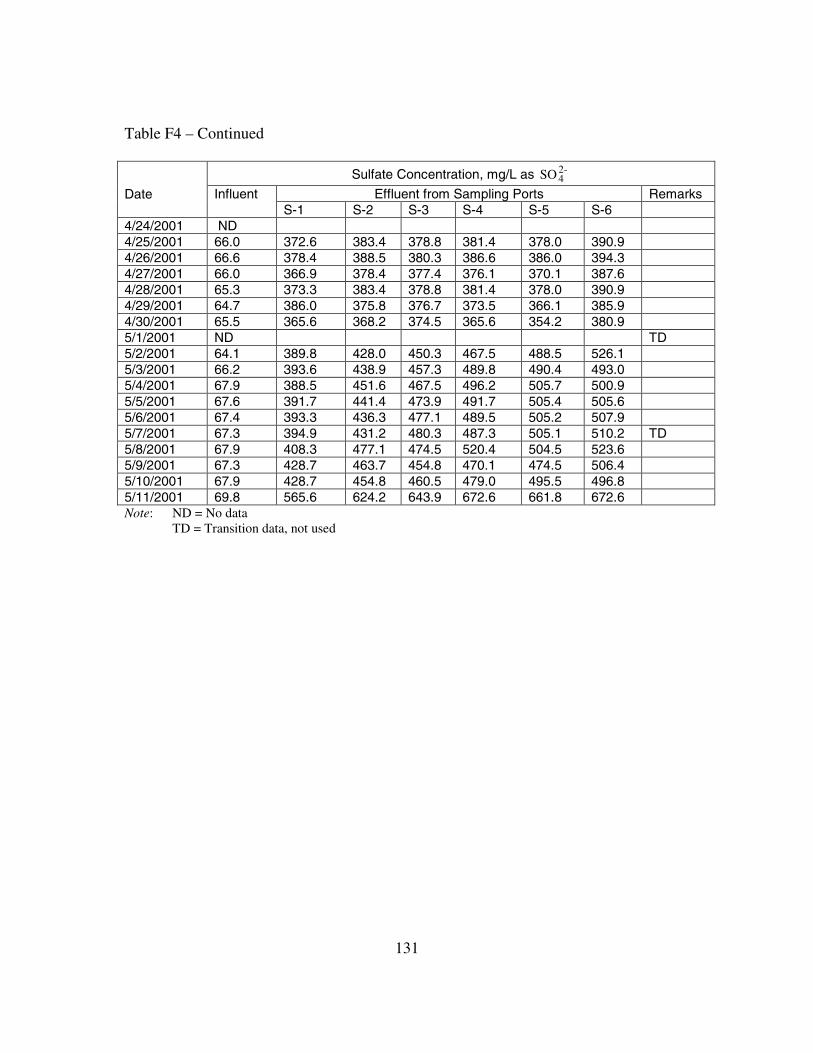
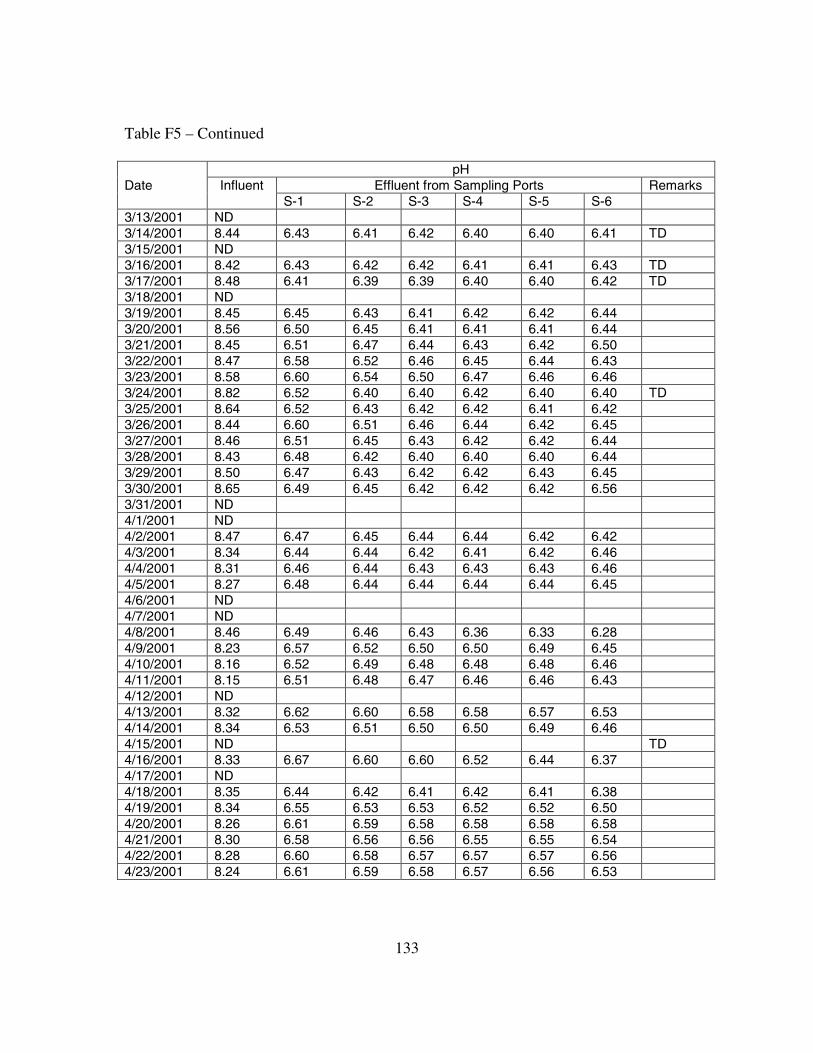
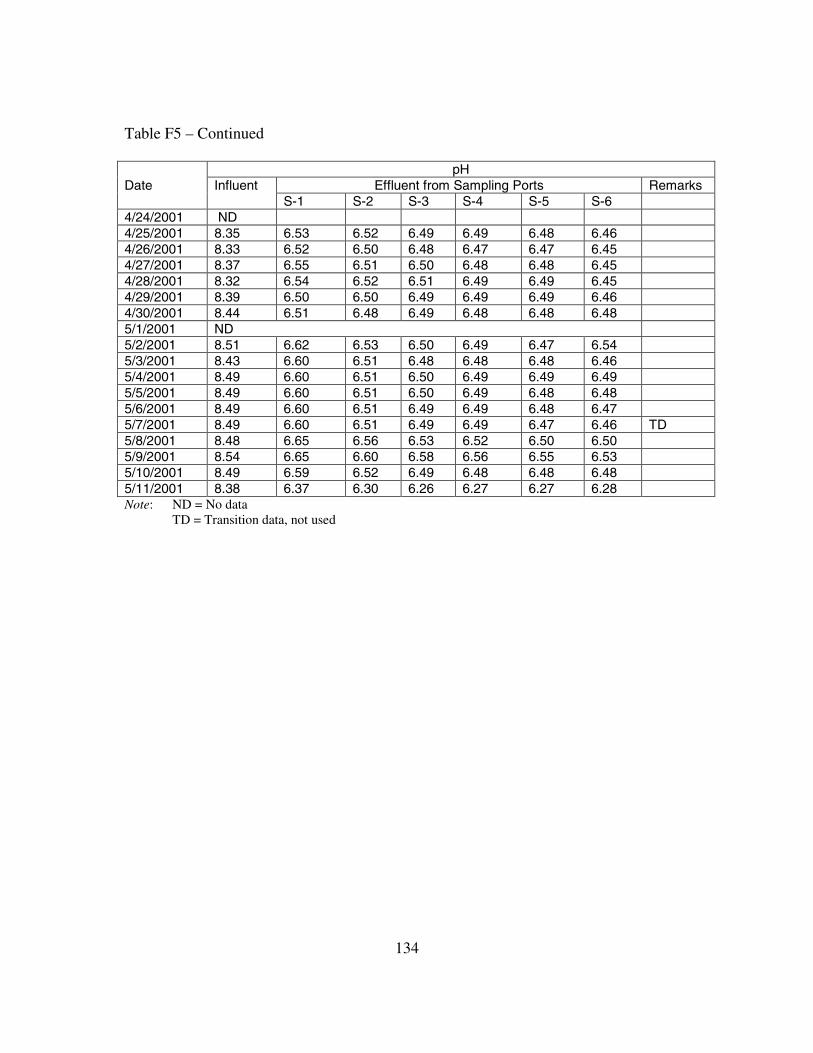
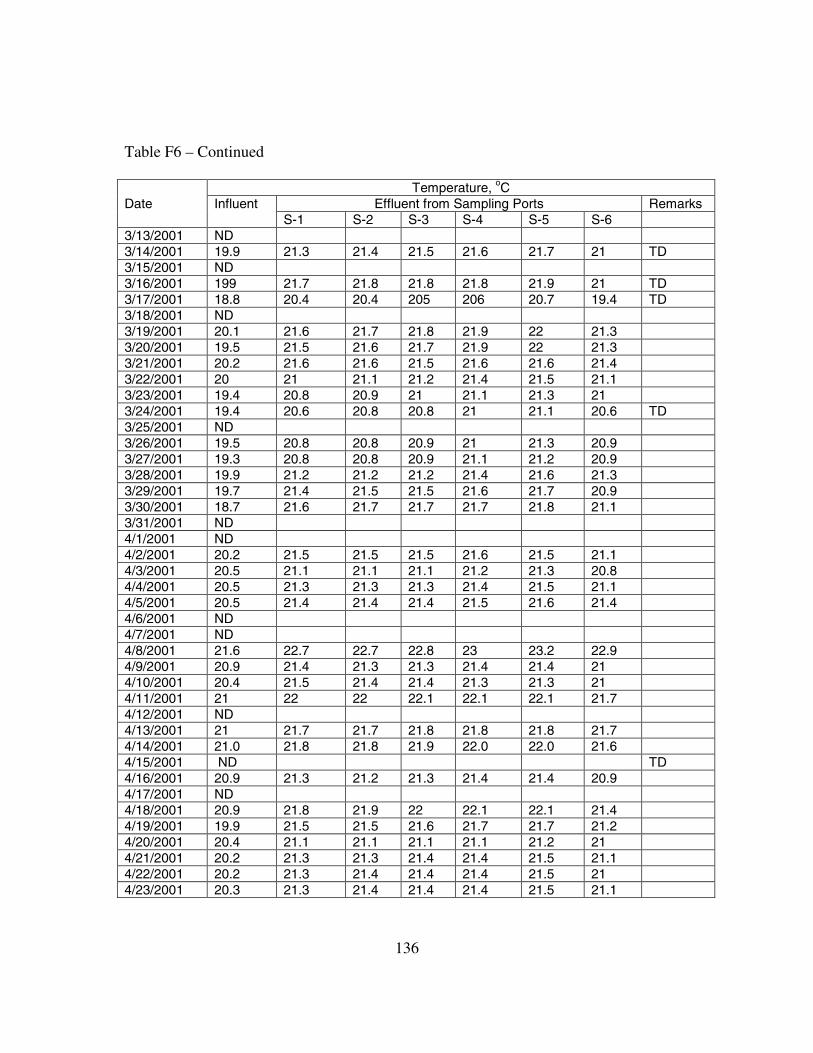
Table F3 - Experimental Data of Alkalinity Concentration in the Influent and Effluentfrom Different Ports of the Sulfur-Packed Continuous Up-Flow Reactor
DETERMINATION OF REACTION RATE CONSTANT k1 USING FUJIMOTO
METHOD
139
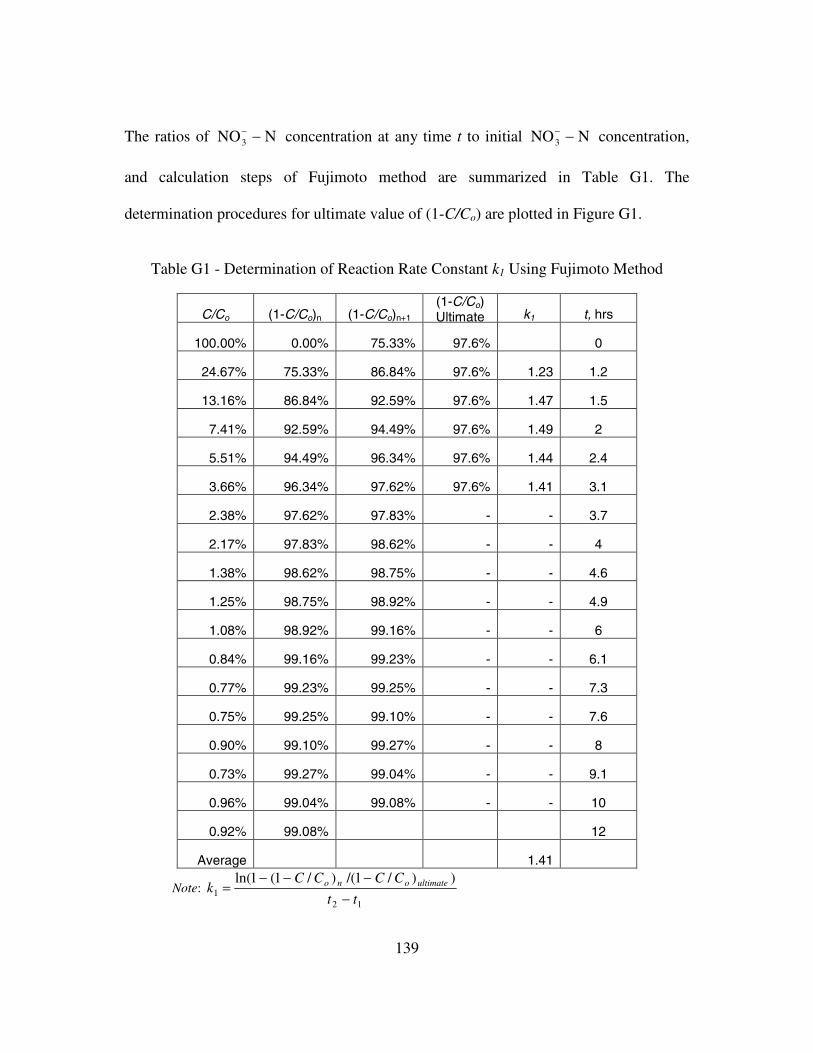
The ratios of NNO3 −− concentration at any time t to initial NNO3 −
− concentration,
and calculation steps of Fujimoto method are summarized in Table G1. The
determination procedures for ultimate value of (1-C/Co) are plotted in Figure G1.
Table G1 - Determination of Reaction Rate Constant k1 Using Fujimoto Method
C/Co (1-C/Co)n (1-C/Co)n+1
(1-C/Co)Ultimate k1 t, hrs
100.00% 0.00% 75.33% 97.6% 0
24.67% 75.33% 86.84% 97.6% 1.23 1.2
13.16% 86.84% 92.59% 97.6% 1.47 1.5
7.41% 92.59% 94.49% 97.6% 1.49 2
5.51% 94.49% 96.34% 97.6% 1.44 2.4
3.66% 96.34% 97.62% 97.6% 1.41 3.1
2.38% 97.62% 97.83% - - 3.7
2.17% 97.83% 98.62% - - 4
1.38% 98.62% 98.75% - - 4.6
1.25% 98.75% 98.92% - - 4.9
1.08% 98.92% 99.16% - - 6
0.84% 99.16% 99.23% - - 6.1
0.77% 99.23% 99.25% - - 7.3
0.75% 99.25% 99.10% - - 7.6
0.90% 99.10% 99.27% - - 8
0.73% 99.27% 99.04% - - 9.1
0.96% 99.04% 99.08% - - 10
0.92% 99.08% 12
Average 1.41
Note:12
1
))/1/()/1(1ln(
tt
CCCCk ultimateono
−−−−
=
Y = 0.2523X + 0.7296
R 2 = 0.9079
0%
10%
20%
30%
40%
50%
60%
70%
80%
90%
100%
0% 10% 20% 30% 40% 50% 60% 70% 80% 90% 100%
(1-C/C o )n
(1-C
/Co) n
+1
(1-C/Co )ultimate = 97.6%
Y = X
Figure G1 Determination of (1-C/Co)ultimate using Fujimoto method
140
141
REFERENCES
1 American Public Health Association (APHA), American Water WorksAssociation (AWWA), Water Environment Federation (WEF), 1992 “StandardMethods for the Examination of Water and Wastewater,” 18th Edition,Washington, D.C.
2 American Water Works Association (AWWA), 1995, “Survey RevealPesticides, Nitrates in Water from Farming Areas,” Journal of American WaterWorks Association, vol. 87, No. 10, pp. 13-14
3 Baalsrud, K. and K. S. Baalsrud, 1954, “Studies on Thiobacillus Denitrificans,”Archives of Microbiology, vol. 20, No. 1, pp. 34-62
4 Barcelona, M. J., 1984, “TOC Determinations in Groundwater,” Ground Water,vol. 22, No. 1, pp. 18-24
5 Barrenstein, A., U. Kramer, and P. Obermann, 1986, “Underground Treatmentof Nitrate Rich Groundwater by Infiltration with Treated Wastewater orMethane-Rich Natural Gas,” DVGW-Schriftenreihe, Wasser, Frankfort, WestGermany, vol. 106, pp. 99-116
6 Batchelor, B., and A. W. Lawence, 1978a. “A Kinetic Model for AutotrophicDenitrification Using Elemental Sulfur,” Water Research, vol. 12, No 12, pp.1075-1084
7 Batchelor, B., and A. W. Lawence, 1978b, “Autotrophic Denitrification UsingElemental Sulfur,” Journal of Water Pollution Control Federation, vol. 50, No8, pp. 1986-2001
8 Batchelor, B., and A. W. Lawence, 1978c. “Stoichiometry of AutotrophicDenitrification Using Elemental Sulfur,” In: A.J. Rubin (Ed.), Chemistry ofWastewater Technology. Ann Arbor Science Publishers, Inc., Ann Arbor,Michigan, pp. 421-440.
9 Bergey, D. H., R. E. Buchanan, and N. E. Gibbons, 1974, “Bergey’s Manual ofDeterminative Bacteriology,” Eighth Edition, Williams & Wilkins Company,Baltimore, MD, pp. 456-461
142
10 Bergey, D. H., N. R. Krieg, and J. G. Holt, 1986, “Bergey’s Manual ofSystematic Bacteriology,” Volume II, Williams & Wilkins Company, Baltimore,MD, pp. 427-438
11 Bisogni, J. J. Jr., and C. T. Driscoll, 1977, “Denitrification Using Thiosulfateand Sulfide,” Journal of Environmental Engineering Division, American Societyof Civil Engineering, vol. 103, No. 4, pp. 593-604
12 Blecon, G., M. Gillet, G. Martin, and J. M. Philipot, 1983, “AutotrophicBiological Denitrification by Thiobacillus Denitrificans on Sulfur-Marl,” RevueFrancaise des Science de I’Eau, vol. 2, No. 3, pp. 267-279
13 Bouchard, D. C., M. K. Williams, and R.Y. Surampalli, 1992, “NitrateContamination of Groundwater: Sources and Potential Health Effects,” Journalof American Water Works Association, vol. 84, No. 9, pp. 85-90
14 Bouwer, E. J., and P. B. Crowe, 1988, “Biological Processes in Drinking WaterTreatment,” Journal of American Water Works Association, vol. 80, No. 9, pp.82-93
15 Brezonik, P. L., 1977, “Denitrification in Natural Waters,” Progress in WaterTechnology, vol. 8, No. 4-5, pp. 373-392
16 Brock, T. D., M. T. Madigan, J. Martinko, and J. Parker, 1994, “Biology ofMicroorganisms,” Prentice Hall International Editions, Seventh Edition,Englewood Cliffs, New Jersey.
17 Challis, B. C., 1973, “Rapid Nitrosation of Phenols and its Implications forHealth Hazards from Dietary Nitrites,” Nature, vol. 244 (5416), p. 466
18 Champ, D. R., J. Gulens, and R.E. Jackson, 1979, “Oxidation-ReductionSequences in Groundwater Flow Systems,” Canadian Journal of Earth Science,vol. 16, No. 1, pp. 12-23
19 Cizinska, S., V. Mateju, J. Krejci, T. Janoch and E. Kyslikova, 1992, “WaterDenitrification by an Immobilized Biocatalyst,” Journal of ChemicalTechnology and Biotechnology, vol. 55, No. 1, pp. 33-38
20 Claus, G., and H. J. Kutzner, 1985a, “Autotrophic Denitrification by
Thiobacillus Denitrificans in a Packed Bed Reactor,” Applied Microbiology andBiotechnology, vol. 22, No. 3, pp. 289-296
143
21 Claus, G., and H. J. Kutzner, 1985b, “Physiology and Kinetics of AutotrophicDenitrification by Thiobacillus Denitrificans,” Applied Microbiology andBiotechnology, vol. 22, No. 2, pp. 283-288
22 Clifford, D., and X. Liu, 1993, “Ion Exchange for Nitrate Removal,” Journal ofAmmerican Water Works Association, vol. 85, No. 4, pp. 135-143
23 Dahab, M. D., 1991, “Nitrate Treatment Methods: an Overview,” North AtlanticTreaty Organization Advanced Science Institutes, Series, G 30. NitrateContamination, Edit by Bogardi, I., and Kuzelka, R.D., Spring-Verlag, BerlinHeidelberg, pp. 349-368
24 Davidson, M. S., and H. F. Ridgeway, 1995, “Biological Denitrification ofGroundwater Using Sulfur-Oxidizing Bacteria, : Construction and Evaluation ofa 25 gpm Pilot System,” Report of A Cooperative Project of Orange CountyWater District, and the Metropolitan Water District of Southern California
25 Davies, T. R., 1973, “ Isolation of Bacteria Capable of Utilizing Methane as aHydrogen Donor in the Process of Denitrification,” Water Research, vol. 7, No.4, April, pp. 575-579
26 Delanghe, B., F. Nakamura, H. Myoga, and Y. Magara, 1994a, “BiologicalDenitrification with Ethanol in a Membrane Bioreactor,” EnvironmentalTechnology, vol. 15, No. 1, pp. 61-67
27 Delanghe, B., J. Nakamura, H. Myoga, Y. Magara and E. Guibal, 1994b,“Drinking Water Denitrification in a Membrane Bioreactor,” Water ScienceTechnology, vol. 30, No. 6, pp. 157-160
28 Exner, M. E., and R. F. Spalding, 1990, “Occurrence of Pesticides and Nitrate inNebraska’s Groundwater,” Water Center Publication, No. 1. Institute ofAgriculture and Natural Resources, University of Nebraska, Lincoln.
29 Flere, J. M., 1997, “Remediation of Nitrate-Contaminated Water Using Sulfurand Limestone Autotrophic Denitrification Processes,” M.S. Thesis, Departmentof Civil Engineering, University of Nebraska-Lincoln at Omaha Campus,Omaha, NE
30 Frank, C., and W. Dott, 1985, “Nitrate Removal from Drinking-Water byBiological Denitrification,” Vom Wasser, Weinheim, Germany, Vol. 65, pp.287-295.
144
31 Frick, B. R., and Y. Richard, 1985, “Experience with Biological Denitrificationin a Full Scale Drinking Water Treatment Plant,” Vom Wasser, vol. 64, pp. 145-154
32 Frunzke, K., and O. Meyer, 1990, “Nitrate Respiration, Denitrification, andUtilization of Nitrogen Sources by Aerobic Carbon Monoxide-OxidizingBacteria, Archives of Microbiology, vol. 154, No. 2, pp. 168-174
33 Furumai, H., H. Tagui, and K. Fujita, 1996, “Effects of pH and Alkalinity onSulfur-Denitrification in a Biological Granular Filter,” Water ScienceTechnology, Printed in Great Britain, vol. 34, No. 1-2, pp. 355-362
34 Gantzer, C. J., 1995, “ Membrane Dissolution of Hydrogen for BiologicalNitrate Removal,” Proceedings of Water Environment Federation 8th AnnualConference, Miami Beach, Florida
35 Gaudy, A. F. Jr., and E. T. Gaudy, 1980, “Microbiology for EnvironmentalScientists and Engineers,” McGraw-Hill, Inc., New York, p. 195
36 Gauntlett, R. B., and D. G. Craft, 1979, “Biological Removal of Nitrate fromRiver Water,” Technical Report TR 98, Water Research Centre, Medmenham,England
37 Gayle, B. P., G. D. Boardman, J.H. Sherrard, and R.E. Benoit, 1989, “BiologicalDenitrification of Water,” Journal of Environmental Engineering Division,ASCE, vol. 115, No. 5, pp. 930-943
38 Gross, H., and K. Treuter, 1986, “Biological Denitrification Process withHydrogen-Oxidizing Bacteria for Drinking Water Treatment,” Aquarium, vol. 5,No. 5, pp. 288-290
40 Hashimoto, S., K. Furikawa, and M. Shiyana, 1989, “Enrichment of SulfurDenitrifying Bacteria and Its Accumulation to Elemental Sulfur,” Journal ofWater Pollution Research, vol. 12, No. 7, pp. 431-440
41 Hiscock, K. M., J. W. Lloyd, and D. N. Lerner, 1991, “Review of Natural andArtificial Denitrification of Groundwater,” Printed in Great Britain, WaterResources, vol. 25, No. 9, pp. 1099-1111
145
42 van der Hoek, J. P., W. A. M. Hijnen, C. A. van Bennekom, and B. J.Mijnarends, 1992a, “Optimization of the Sulfur-Limstone Filtration Process forNitrate Removal from Groundwater,” Journal of Water SRT-AQUA, vol. 41, No.4, pp. 209-218
43 van der Hoek, J. P., J. W. N. M. Kappelhof, and W. A. M. Hijnen, 1992b,“Biological Nitrate Removal from Ground Water by Sulphur/LimestoneDenitrifcation,” Journal of Chemical Technology and Biotechnology, vol. 54,No. 2, pp. 197-200
44 van der Hoek, J. P., P. J. M. van der Ven, and A. Klapwijk, 1988b, “CombinedIon Exchange/Biological Denitrification for Nitrate Removal from GroundwaterUnder Different Process Conditions,” Water Research, vol. 22, No.6, pp. 679-684
45 Howard, K. W. F., 1985, “Denitrification in a Major Lime Stone Aquifer,”Journal of Hydrology, vol. 76, pp. 265-280
46 Justin P., and D. P. Kelly, 1978a, “Growth Kinetics of ThiobacillusDenitrificans in Anaerobic and Aerobic Chemostat Culture,” Journal of GeneralMicrobiology, vol. 107, No. 1, pp. 123-130
47 Kapoor, A., and T. Viraraghavan, 1997, “Nitrate Removal From DrinkingWater-Review,” Journal of Environmental Engineering Division, ASCE, vol.123, No. 4, April, pp. 371-380
48 Kelly, D. P., 1982, “Biochemistry of the Chemolithotrophic Oxidation ofInorganic Sulphur,” Philosphical Transactions, Royal Society of London, SeriesB 298, pp. 499-528
49 Kurt, M., I. J. Dunn, and J. R. Bourne, 1987, “Biological Denitrification ofDrinking Water Using Autotrophic Organisms with Hydrogen in a Fludized-BedBiofilm Reactor,” Biotechnology Bioengineering, vol. 29, No. 4, pp. 493-501
50 Korom, S., 1992, “Natural Denitrification in the Saturated Zone: A Review,”Water Resources Research, vol. 28 No. 6, pp. 1657-1668
51 Lampe, D. G., and T.C. Zhang, 1997. “Sulfur-based Autotrophic Denitrificationfor Remediation of Nitrate-contaminated Water,” In Situ and On-SiteBioremediation Symposium. New Orleans, April 28 – May 1. Battelle Press
52 Lewandowski, I., R. Bakke, and W. G. Characklis, 1987, “Nitrification andAutotrophic Denitrification in Calcium Alginate Beads,” Water ScienceTechnology, vol. 19, pp. 175-182
146
53 Lyubchenko, O. A., N. F. Mogilevich, and P. I. Gvozdyak, 1996, “MicrobialNitrification and Sewage Treatment,” Journal of Water Chemistry andTechnology, vol. 18, No. 1, pp. 98-112
54 McCarty, P. L., “Energetics and Bacterial Growth,” Presented at the July, 1969,5th Rudolf Research Conference, Rutgers University, New Brunswick, N.J.
55 Metcalf and Eddy, Inc. Revised by Tchobanoglous, G., L. Franklin, H. Burton,and D. Stensel, 2003, “Wastewater Engineering: Treatment and Reuse,”McGraw Hill Companies Inc. Fourth Edition, New York, NY.
56 Mirvish, S., 1991, “The significance for Human Health of Nitrate, Nitrite, andNitroso Compounds,” North Atlantic Treaty Organization, Advanced ScienceInstitutes, Series G30. Nitrate Contamination. Edit by Bogardi, I., and R. D.Kuzelka, pp. 253-266, Springer-Verlag Berlin Heidelberg
57 Myers, R. J. K., 1972, “Effect of Sulfide on Nitrate Reduction in Soil,“ Plantand Soil, vol. 37, No. 2, pp. 431-433
58 Overath, H., A. Hussmann, and K. Haberer, 1986, “Biological Denitrificationby Thiobacillus Denitrificans Using Elemental Sulfur Fixed on GranularActivated Carbon as Electron Donor,” Vom Wasser, vol. 66, pp.59-83
59 Pontius, F. W., 1993, “Nitrate and Cancer: Is There a Link,” Journal ofAmerican Water Works Association, vol. 85, No. 4, pp. 12-14.
60 Power, J. F. and J. S. Schepers, 1989, “Nitrate Contamination of Groundwater inNorth America,” Agriculture, Ecosystems and Environment, vol. 26, No. 3-4,pp. 165-187
61 Reddy, K. R., P. S. C. Rao, and R. E. Jessup, 1982, “The Effect of CarbonMineralization on Denitrification Kinetics in Mineral and Organic Soils,” SoilScience Society of America Journal, vol. 46, No. 1, pp. 62-68
62 Richard, Y., A. Leprince, G. Martin, and C. Leblanc, 1980, “Denitrification ofWater for Human Consumption,” Progress in Water Technology, Oxford,England, vol. 12, No. 6, pp. 173-191
63 Rittmann, B. E., and P. M. Huck, 1989, “Biological Treatment of Public Water,”Chemical Rubber Company, Critical Reviews in Environmental Control, vol. 19,No. 2, pp. 119-184
64 Sawyer, C. N. and P. L. McCarty., 1978 “Chemistry for EnvironmentalEngineering” Third Edition, pp. 242-245
147
65 Sikora L. J. and D. R. Keeney, 1976, “Evaluation of a Sulfur ThiobacillusDenitrificans Nitrate Removal System,” Journal of Environmental Quality, vol.5, No. 3, pp. 298-303
66 Skerman, V. B. and I. C. MacRae, 1957, “The Influence of Oxygen Availabilityon the Degree of Nitrate Reduction by Pseudomonas Denitrificans,” CanadianJournal of Microbiology, vol. 3, pp. 505-530
67 Smith, R. L., and J. H. Duff, 1988, “Denitrification in a Sand and GravelAquifer,” Applied and Environmental Microbiology, vol. 54, No. 5, pp. 1071-1078
68 Smith, R. L., M. L. Ceazan, and M. H. Brooks, 1994, “Autotrophic, Hydrogen-Oxidizing, Denitrifying Bacteria in Groundwater, Potential Agents forBioremediation of Nitrate Contamination,” Applied and EnvironmentalMicrobiology, vol. 60, No. 6, pp. 1949-1955
69 Thurman, E. M., 1985, ”Organic Geochemistry of Natural Waters,” Nijhoff-Junk, Dordrecht.
70 Waki, T., K. I. Murayma, Y. Kawato, and K. Ichikawa, 1980, “TransientCharacteristics of Paracoccus Denitrificans with Changes Between Aerobic andAnaerobic Conditions, Journal of Fermentation Technology, vol. 58, No. 3, pp.243-249
148
BIOGRAPHICAL INFORMATION
Shih-Hui Pan received a Bachelor of Science degree (BS) in Civil Engineering
from Chung Christian University, Chung Li, Taiwan in 1980. He received his MS
degree in Civil Engineering from the University of Texas at Arlington in 1995. His
experience after obtaining his BS degree includes: two years in the Taiwan Army Corps
of Engineers, four years in Min Young Real Estate and Advertisement Company at
Taiwan, one year at Utah State University in the Civil and Environmental Engineering
Department for course study, five years in engineering consulting firms in Taiwan, and
six years in engineering consulting firms in the United States. His civil engineering
experience includes: design of water wells, sewage lift stations, booster pump stations,
groundwater storage tanks, and water/wastewater treatment plants. He also had seven
years experience as a Graduate Teaching Assistant working in the water quality
laboratory at the University of Texas at Arlington.
His research interests are water and wastewater treatment processes. He would
like to work as an environmental engineer in a consulting engineering firm, or as a