Prepared for: U.S. Department of Energy Office of Fossil Energy – Office of Oil and Natural Gas Prepared by: Advanced Resources International, Inc. March 2005 BASIN ORIENTED STRATEGIES FOR CO 2 ENHANCED OIL RECOVERY: ONSHORE GULF COAST
Transcript
Prepared for:U.S. Department of EnergyOffice of Fossil Energy – Office of Oil and Natural Gas
Prepared by:Advanced Resources International, Inc.
March 2005
BASIN ORIENTED STRATEGIES FOR CO2 ENHANCED OIL RECOVERY:
ONSHORE GULF COAST
Disclaimer This material was prepared as an account of work sponsored by an agency of the United States Government. Neither the United States nor the United States Department of Energy, nor any of their employees, makes any warranty, express or implied, or assumes any legal liability or responsibility for the accuracy, completeness, or usefulness of any information, apparatus, product, or process disclosed, or represents that its use would not infringe privately owned rights.
BASIN ORIENTED STRATEGIES FOR CO2 ENHANCED OIL RECOVERY: ONSHORE GULF COAST BASINS Prepared for: U.S. Department of Energy Prepared by: Advanced Resources International, Inc. March 2005
i
TABLE OF CONTENTS 1. SUMMARY OF FINDINGS 1.1 INTRODUCTION 1.2 ALTERNATIVE OIL RECOVERY STRATEGIES AND SCENARIOS 1.3 OVERVIEW OF FINDINGS 1.4. ACKNOWLEDGEMENTS 2. INTRODUCTION 2.1 CURRENT SITUATION 2.2 BACKGROUND 2.3 PURPOSE 2.4 KEY ASSUMPTIONS 2.5 TECHNICAL OBJECTIVES 3. OVERVIEW OF GULF COAST OIL PRODUCTION 3.1 HISTORY OF OIL PRODUCTION 3.2 EXPERIENCE WITH IMPROVED OIL RECOVERY 3.3 THE “STRANDED OIL” PRIZE 3.4 REVIEW OF PRIOR STUDIES 4. MECHANISMS OF CO2-EOR 4.1 MECHANISMS OF MISCIBLE CO2-EOR. 4.2 MECHANISMS OF IMMISCIBLE CO2-EOR 4.3 INTERACTIONS BETWEEN INJECTED CO2 AND RESERVOIR OIL. 5. STUDY METHODOLOGY 5.1 OVERVIEW 5.2 ASSEMBLING THE MAJOR OIL RESERVOIRS DATA BASE 5.3 SCREENING RESERVOIRS FOR CO2-EOR. 5.4 CALCULATING MINIMUM MISCIBILITY PRESSURE 5.5 CALCULATING OIL RECOVERY 5.6 ASSEMBLING THE COST MODEL 5.7 CONSTRUCTING AN ECONOMICS MODEL 5.8 PERFORMING SCENARIO ANALYSES 6. RESULTS BY STATE 6.1 LOUISIANA 6.2 MISSISSIPPI 6.3 TEXAS/DISTRICT 3. 7. IMPACT OF STATE RISK SHARING ACTIONS 7.1 LOUISIANA 7.2 MISSISSIPPI 7.3 TEXAS 7.4 POTENTIAL BENEFITS OF RISK SHARING 7.5 ESTIMATED IMPACTS OF STATE RISK SHARING FOR CO2-EOR.
ii
LIST OF FIGURES Figure 1 Impact of Technology and Financial Conditions on Economically
Recoverable Oil from the Gulf Coast Region’s Major Reservoirs Using CO2-EOR (Million Barrels)
Figure 2 Location of Major Gulf Coast Oil Fields Figure 3 Location of Existing and Planned CO2 Supply Pipelines in Mississippi
and Louisiana Figure 4 Conceptual CO2 Pipeline System Connecting CO2 Sources with Major
Louisiana Oil Fields Figure 5 History of Gulf coast Crude Oil Production, 1950-2002 Figure 6 One-Dimensional Schematic Showing the CO2 Miscible Process Figure 7A Carbon Dioxide, CH4 and N2 densities at 1050F. Figure 7B Carbon Dioxide, CH4 and N2 viscosities at 1050F. Figure 8A Relative Oil Volume vs. Pressure for a Light West Texas Reservoir Fluid Figure 8B Oil Swelling Factor vs. Pressure for a Heavy Oil in Turkey Figure 9 Viscosity Reduction Versus Saturation Pressure. Figure 10 Estimating CO2 Minimum Miscibility Pressure Figure 11 Correlation of MW C5+ to Tank Oil Gravity Figure 12 Louisiana Anchor Fields Figure 13 Mississippi Anchor Fields Figure 14 Texas/District 3 Figure 15 Texas/District 3 Anchor Fields
LIST OF TABLES Table 1 Size and Distribution of the Gulf Coast Region’s Large Oil Reservoirs
Data Base Table 2 The Gulf Coast’s “Stranded Oil” Amenable to CO2-EOR Table 3 Applicability of Miscible and Immiscible CO2-EOR Table 4 Economically Recoverable Resources Under Scenario #1: “Traditional
Practices” CO2-EOR Table 5 Economically Recoverable Resources Under Alternative Scenarios Table 6 Potential CO2 Supply Requirements in the Gulf Coast Region Scenario
#4 (“Ample Supplies of CO2”) Table 6 Matching of CO2-EOR Technology With the Gulf Coast’s Oil Reservoirs Table 7 Crude Oil Annual Production, Ten Largest Gulf Coast Oil Fields, 2000-
2002 (Million Barrels per Year) Table 8 Selected Major Oil Fields of the Gulf Coast Region Table 9 Reservoir Data Format: Major Oil Reservoirs Data Base. Table 10 Gulf Coast Oil Reservoirs Screened Acceptable for CO2-EOR Table 11 Economic Model Established by the Study Table 12 Recent History of Louisiana Onshore Oil Production Table 13 Status of Louisiana “Anchor” Fields/Reservoirs, 2002 Table 14 Reservoir Properties and Improved Oil Recovery Activity, “Anchor” Oil
Fields/Reservoirs Table 15 Economic Oil Recovery Potential Under Current Conditions, Louisiana. Table 16 Economic Oil Recovery Potential with More Favorable Financial
Conditions, Louisiana
iii
Table 17 Recent History of Mississippi Oil Production Table 18 Status of Mississippi “Anchor” Fields/Reservoirs, 2001 Table 19 Reservoir Properties and Improved Oil Recovery Activity, “Anchor” Oil
Mississippi “Immiscible-CO2” Oil Fields/Reservoirs Table 21 Economic Oil Recovery Potential Under Base Case Financial Conditions,
Mississippi. Table 22 Economic Oil Recovery Potential with More Favorable Financial
Conditions, Mississippi Table 23 Recent History of Texas/District 3 Oil Production Table 24 Status of Texas Railroad District 3 “Anchor” Fields/Reservoirs, 2002 Table 25 Reservoir Properties and Improved Oil Recovery Activity, “Anchor” Oil
Fields/Reservoirs Table 26 Economic Oil Recovery Potential Under Base Case Financial Conditions,
Texas/District 3. Table 27 Economic Oil Recovery Potential with More Favorable Financial
Conditions, Texas Railroad District 3 Table 28 Impacts of State Risk Sharing for CO2-EOR
JAF024147.DOC 1-1 March 2005
1. SUMMARY OF FINDINGS
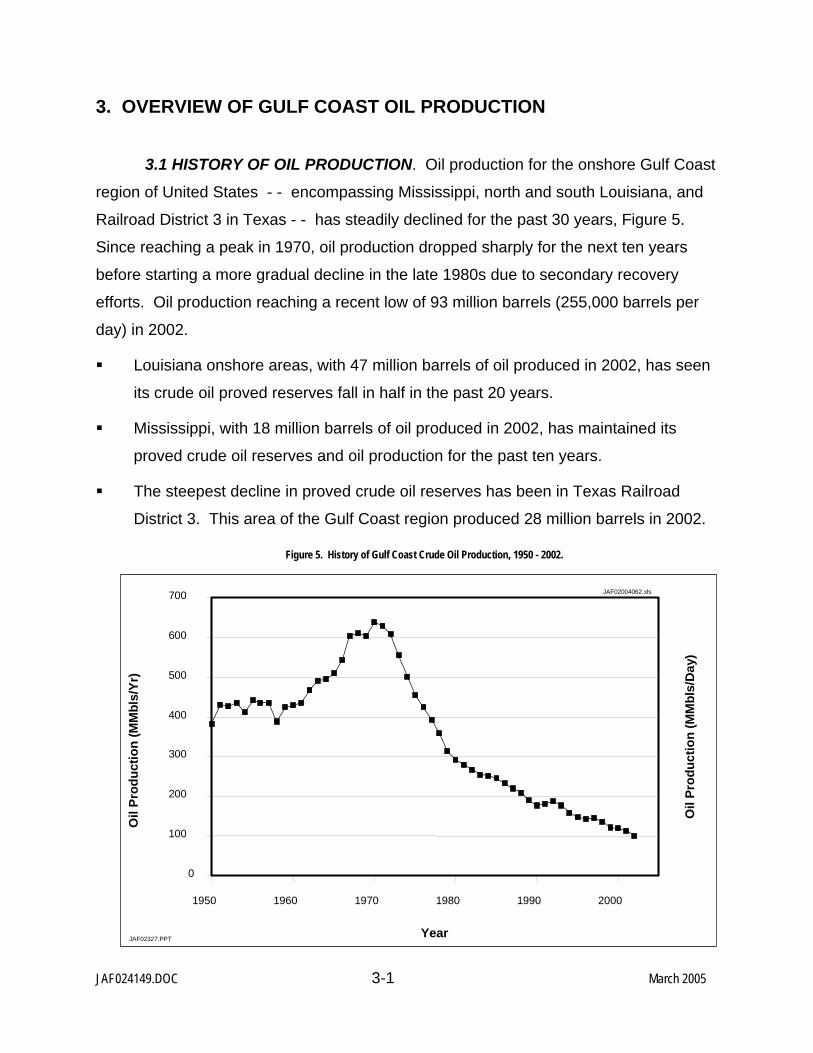
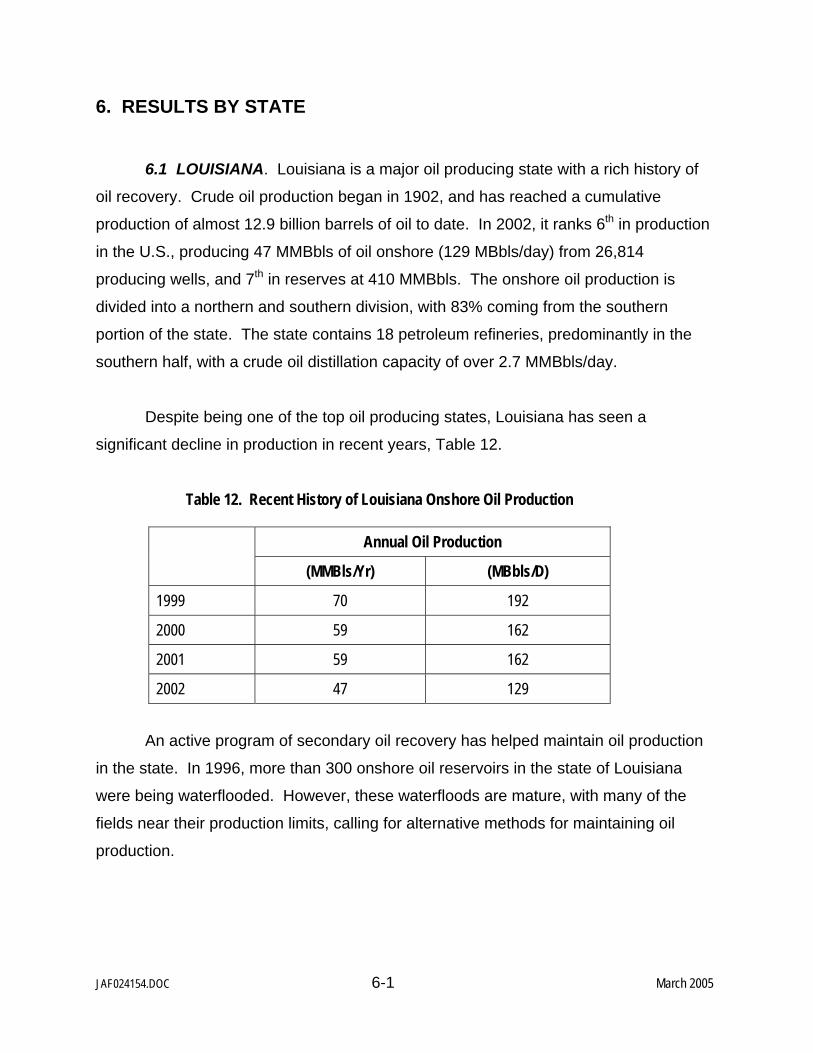
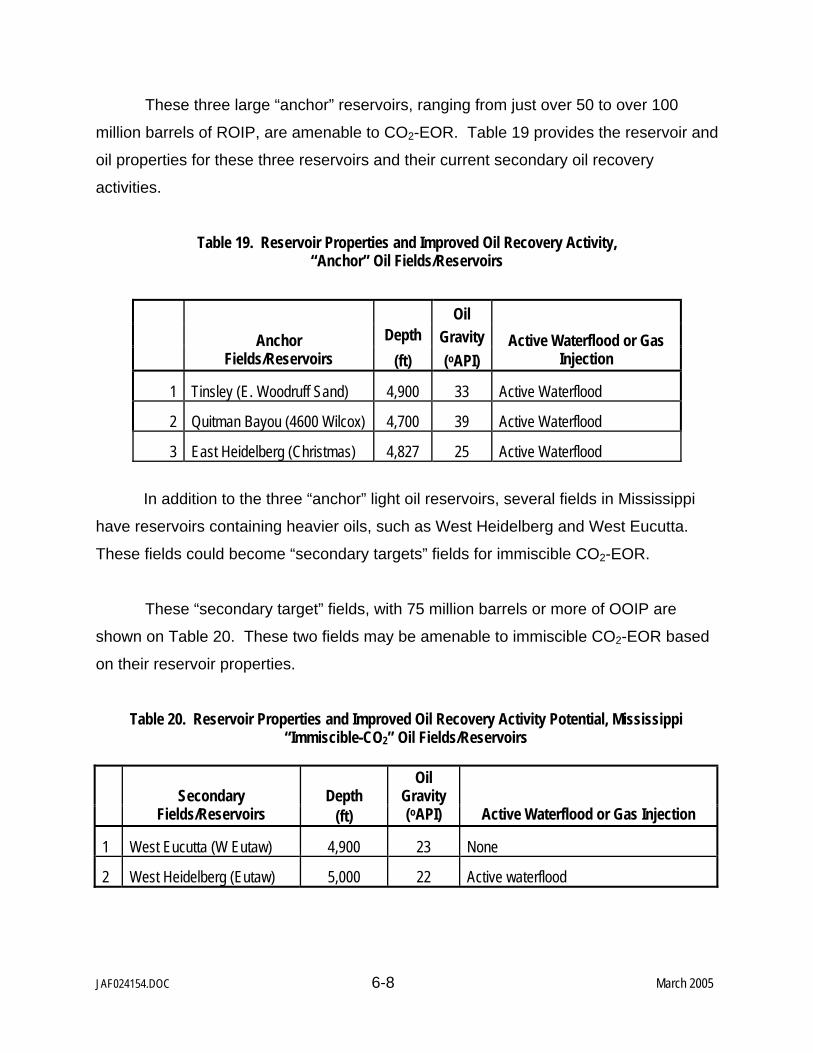
1.1 INTRODUCTION. The onshore Gulf Coast oil and gas producing region of
Louisiana, Mississippi and Texas/District 3 has 36 billion barrels of oil which will be left
in the ground, or “stranded”, following the use of today’s oil recovery practices. A major
portion of this “stranded oil” is in reservoirs technically and economically amenable to
enhanced oil recovery (EOR) using carbon dioxide (CO2) injection.
This report evaluates the future oil recovery potential in the large oil fields of the
onshore Gulf Coast region and the barriers that stand in the way of this potential. The
report then discusses how a concerted set of “basin-oriented strategies” could help the
Gulf Coast’s oil production industry overcome these barriers.
1.2 ALTERNATIVE OIL RECOVERY STRATEGIES AND SCENARIOS. The
report sets forth four scenarios for using CO2-EOR to recover “stranded oil” in the
onshore Gulf Coast producing region.
The first scenario captures how CO2-EOR technology has been applied and
has performed in the past. Under this low technology, high-risk scenario,
called “Traditional Practices”, because of low oil recoveries efficiency there is
little potential in this oil-producing region for using CO2-EOR.
The second scenario, entitled “State of the Art”, assumes that the technology
progress in CO2-EOR, achieved in other areas, is successfully applied to the
oil reservoirs of Illinois. In addition, a comprehensive set of research, pilot
tests and field demonstrations help lower the risk inherent in applying new
technology to these complex oil reservoirs. However, because of limited
sources of CO2, these supply costs are high (equal to $1.25 per Mcf) the oil
price) and significantly hamper economic feasibility of using CO2-EOR.
JAF024147.DOC 1-2 March 2005
The third scenario, entitled “Risk Mitigation,” examines how the economic
potential of CO2-EOR could be increased through a strategy involving state
production tax reductions, federal tax credits, royalty relief and/or higher world
oil prices that together would be equal to $10 per barrel in the price that the
producer receives for produced crude oil.
In the final scenario, entitled “Ample Supplies of CO2,” low-cost, “EOR-ready”
CO2 supplies (equal to $0.70 per Mcf) are aggregated from various sources.
These include industrial high-concentration CO2 emissions from hydrogen
facilities, gas processing plants and other sources. These would be
augmented, in the longer-term, from low CO2 concentration industrial sources
including combustion and electric generation plants. Capture of industrial CO2
emissions would be part of national efforts for reducing greenhouse gas
emissions.
The CO2-EOR potential of the onshore Gulf Coast region is examined using
these four bounding scenarios.
1.3 OVERVIEW OF FINDINGS. Ten major findings emerge from the study of
“Basin Oriented Strategies for CO2 Enhanced Oil Recovery: Onshore Gulf Coast Oil
Basins.”
1. Today’s oil recovery practices will leave behind a large resource of “stranded oil” in the onshore Gulf Coast region. The original oil resource in onshore
Gulf Coast reservoirs was 61 billion barrels. To date, 25 billion barrels of this original oil
in-place (OOIP) has been recovered or proved. Thus, without further oil recovery
methods, 36 billion barrels of the Gulf Coast’s oil resource will become “stranded”,
Table 1.
JAF024147.DOC 1-3 March 2005
Table 1. Size and Distribution of the Gulf Coast Region’s Large Oil Reservoirs Data Base
Region No. of
Reservoirs OOIP
(Billion Bbls)
Cumulative Recovery/ Reserves*
(Billion Bbls) ROIP
(Billion Bbls)
A. Major Oil Reservoirs
Louisiana 135 19.2 7.4 11.8
Mississippi 22 2.6 0.9 1.6
Texas/District 3 60 13.2 6.0 7.2
Data Base Total 217 35.0 14.3 20.6
B. Regional Total* n/a 60.8 24.5 36.4 *Estimated from State of Louisiana, Mississippi and Texas data on cumulative oil recovery and proved reserves, as of the end of 2002.
2. The great bulk of the “stranded oil” resource in the large oil reservoirs of the Gulf Coast is amenable to CO2 enhanced oil recovery. To address the
“stranded oil” issue, Advanced Resources assembled a database that contains 217
major Gulf Coast oil reservoirs, accounting for 58.5% of the region’s estimated ultimate
oil production. Of these, 205 reservoirs, with 31.1 billion barrels of OOIP and 17.7
billion barrels of “stranded oil” (ROIP)), were found to be favorable for CO2-EOR, as
shown below by region, Table 2.
Table 2. The Gulf Coast’s “Stranded Oil” Amenable to CO2-EOR
Region No. of
Reservoirs OOIP
(Billion Bbls)
Cumulative Recovery/ Reserves
(Billion Bbls) ROIP
(Billion Bbls)
Louisiana 128 16.1 6.7 9.4
Mississippi 20 1.9 0.7 1.2
Texas/District 3 57 13.1 6.0 7.1
TOTAL 205 31.1 13.4 17.7
JAF024147.DOC 1-4 March 2005
3. Application of miscible CO2-EOR would enable a significant portion of the Gulf Coast’s “stranded oil” to be recovered. Of the 205 large Gulf Coast oil
as being favorable for miscible CO2-EOR. The remaining 6 oil reservoirs (with 0.5
billion barrels OOIP) screen as being favorable for immiscible CO2-EOR. The total
technically recoverable resource from applying CO2-EOR in these 205 large oil
reservoirs, ranges from 2,600 million barrels to 5,860 million barrels, depending on the
type of CO2-EOR technology that is applied - - “Traditional Practices” or “State of the
Art”, Table 3.
Table 3. Applicability of Miscible and Immiscible CO2-EOR
Miscible Immiscible
Region No. of
Reservoirs
Technically Recoverable*
(MMBbls) No. of
Reservoirs
Technically Recoverable*
(MMBbls)
Louisiana 128 1,430 – 3,240 0 -
Mississippi 17 150 – 330 3 0-20
Texas (3) 54 1,020 – 2,290 3 0-30
TOTAL 199 2,600 – 5,860 6 0-50 *Range in technically recoverable oil reflects the performance of “Traditional Practices” and “State of the Art” CO2-EOR technology.
4. With “Traditional Practices” CO2 flooding technology, high CO2 costs and high risks, very little of the Gulf Coast’s “stranded oil” will become economically recoverable. Traditional application of miscible CO2-EOR technology to
the 199 large reservoirs in the data base would enable 2,600 million barrels of “stranded
oil” to become technically recoverable from the Gulf Coast region. However, with the
current high costs for CO2 in the Gulf Coast region (equal to $1.25 per Mcf),
uncertainties about future oil prices and the performance of CO2-EOR technology, only
a very small portion, about 70 million barrels, of this “stranded oil” would become
economically recoverable at oil prices of $25 per barrel as adjusted for gravity and
location, (with most of it from District 3 in Texas), Table 4.
JAF024147.DOC 1-5 March 2005
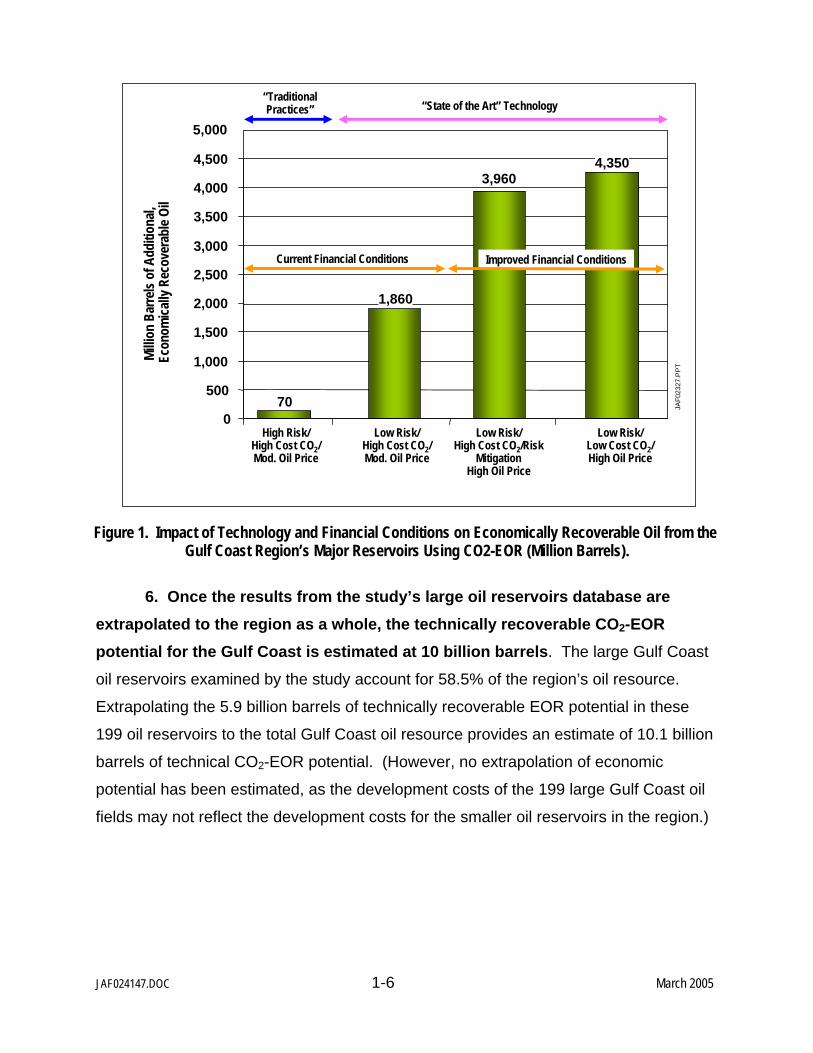
5. Introduction of “State of the Art” CO2-EOR technology, lower CO2 costs and risk sharing, would enable 4.3 billion barrels of additional oil to become economically recoverable. With “State of the Art” CO2-EOR technology, and its higher
oil recovery efficiency a much larger portion of the oil remaining in the Gulf Coast’s
reservoirs becomes economically recoverable, equal to 1,860 million barrels. Risk
mitigation and higher oil prices, providing revenues equal to $35 per barrel, would
enable 3,960 million barrels of oil to become economically recoverable from the Gulf
Coast’s large oil reservoirs. Lower cost CO2 supplies (from a large transportation
system and incentives for CO2 capture) would enable the economic potential to
increase to 4,350 million barrels, Figure 1 and Table 5.
Table 5. Economically Recoverable Resources Under Alternative Scenarios
Scenario #2:
“State of the Art” Scenario #3:
“Risk Mitigation” Scenario #4:
“Ample Supplies of CO2”
Basin
(Moderate Oil Price/ High CO2 Cost*)
(MMBbls)
(High Oil Price/ High CO2 Cost**)
(MMBbls)
High Oil Price/ Low CO2 Cost***
(MMBbls)
Louisiana 430 1,800 2,130
Mississippi 50 160 200
Texas (3) 1,380 2,000 2,020
TOTAL 1,860 3,960 4,350 *This case assumes an oil price of $25 per barrel, a CO2 cost of $1.25/Mcf and a ROR hurdle rate of 15% (before tax). **This case assumes an oil price of $35 per barrel, a CO2 cost of $1.25/Mcf and a ROR hurdle rate of 15% (before tax). ***This case assumes an oil price of $35 per barrel, a CO2 cost of $0.70/Mcf and a ROR hurdle rate of 15% (before tax).
TOTAL 199 30,529 2,600 70 *This case assumes an oil price of $25 per barrel, a CO2 cost of $1.25 per Mcf, and a ROR hurdle rate of 25% (before tax). **Less than 5 MMBbls.
JAF024147.DOC 1-6 March 2005
Figure 1. Impact of Technology and Financial Conditions on Economically Recoverable Oil from the Gulf Coast Region’s Major Reservoirs Using CO2-EOR (Million Barrels).
6. Once the results from the study’s large oil reservoirs database are
extrapolated to the region as a whole, the technically recoverable CO2-EOR potential for the Gulf Coast is estimated at 10 billion barrels. The large Gulf Coast
oil reservoirs examined by the study account for 58.5% of the region’s oil resource.
Extrapolating the 5.9 billion barrels of technically recoverable EOR potential in these
199 oil reservoirs to the total Gulf Coast oil resource provides an estimate of 10.1 billion
barrels of technical CO2-EOR potential. (However, no extrapolation of economic
potential has been estimated, as the development costs of the 199 large Gulf Coast oil
fields may not reflect the development costs for the smaller oil reservoirs in the region.)
“TraditionalPractices” “State of the Art” Technology
Millio
n Ba
rrels
of A
dditi
onal,
Ec
onom
ically
Rec
over
able
Oil
JAF0
2327
.PP
T
5,000
1,860
3,9604,350
JAF024147.DOC 1-7 March 2005
7. The ultimate additional oil recovery potential from applying CO2-EOR in the Gulf Coast will, most likely, prove to be higher than defined by this study. Introduction of more “advanced” CO2-EOR technologies still in the research or field
demonstration stage, such as gravity stable CO2 injection, extensive use of horizontal or
multi-lateral wells and CO2 miscibility control agents, could significantly increase
recoverable oil volumes while expanding the state’s geologic storage capacity for CO2
emissions. The benefits and impacts of using “advanced” CO2-EOR technology on Gulf
Coast oil reservoirs will be examined in a subsequent study.
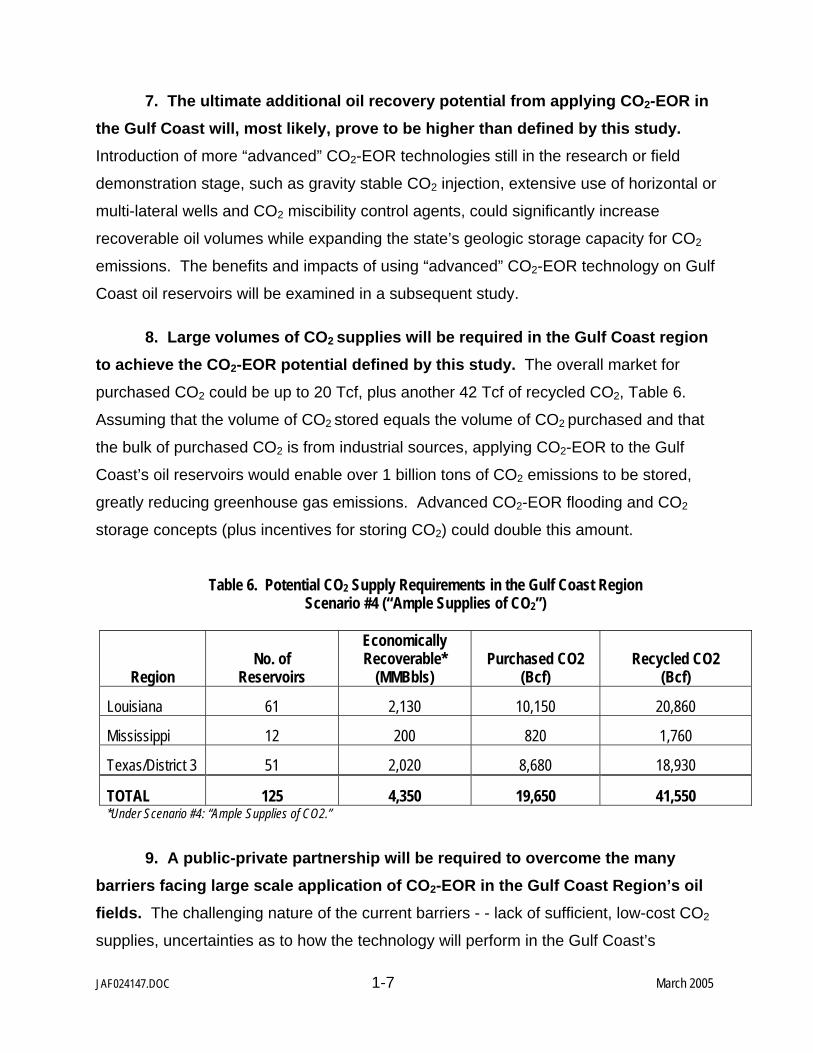
8. Large volumes of CO2 supplies will be required in the Gulf Coast region to achieve the CO2-EOR potential defined by this study. The overall market for
purchased CO2 could be up to 20 Tcf, plus another 42 Tcf of recycled CO2, Table 6.
Assuming that the volume of CO2 stored equals the volume of CO2 purchased and that
the bulk of purchased CO2 is from industrial sources, applying CO2-EOR to the Gulf
Coast’s oil reservoirs would enable over 1 billion tons of CO2 emissions to be stored,
greatly reducing greenhouse gas emissions. Advanced CO2-EOR flooding and CO2
storage concepts (plus incentives for storing CO2) could double this amount.
Table 6. Potential CO2 Supply Requirements in the Gulf Coast Region Scenario #4 (“Ample Supplies of CO2”)
Region No. of
Reservoirs
Economically Recoverable*
(MMBbls) Purchased CO2
(Bcf) Recycled CO2
(Bcf)
Louisiana 61 2,130 10,150 20,860
Mississippi 12 200 820 1,760
Texas/District 3 51 2,020 8,680 18,930
TOTAL 125 4,350 19,650 41,550 *Under Scenario #4: “Ample Supplies of CO2.”
9. A public-private partnership will be required to overcome the many barriers facing large scale application of CO2-EOR in the Gulf Coast Region’s oil fields. The challenging nature of the current barriers - - lack of sufficient, low-cost CO2
supplies, uncertainties as to how the technology will perform in the Gulf Coast’s
JAF024147.DOC 1-8 March 2005
complex oil fields, and the considerable market and oil price risk - - all argue that a
partnership involving the oil production industry, potential CO2 suppliers and
transporters, the Gulf Coast states and the Federal Government will be needed to
overcome these barriers.
10. Many entities will share in the benefits of increased CO2-EOR based oil production in the Gulf Coast. Successful introduction and wide-scale use of CO2-
EOR in the Gulf Coast will stimulate increased economic activity, provide new higher
paying jobs, and lead to higher tax revenues for the state. It will help revive a declining
domestic oil production and service industry.
1.4 ACKNOWLEDGEMENTS. Advanced Resources would like to acknowledge
the most valuable assistance provided to the study by a series of individuals and
organizations in Louisiana, Mississippi and Texas.
In Louisiana, we would like to thank the Department of Natural Resources and
particularly Ms. Jo Ann Dixon, Mineral Production Specialist, for help with using the
SONRIS system and assembling historic data on cumulative natural gas production by
field and by area. We recognize and appreciate the considerable assistance provided
by Ms. Dixon to assemble the relevant data. We also fully support all efforts to upgrade
the SONRIS system as a data source for independent producers seeking to recover
more of the oil remaining in the Louisiana oil reservoirs.
In Mississippi, we would like to thank the Mississippi Oil and Gas Board, and
specifically Ms. Juanita Harper and Mr. Jeff Smith for providing data on statewide
annual production and guidance on field and reservoir level production and well counts.
In Texas, we would like to thank the Office of the Texas Comptroller of Public
Accounts who provided detailed information on the severance taxes relevant to Texas
District 3.
JAF024147.DOC 1-9 March 2005
Finally, the study would like to acknowledge Mr. William “Clay” Kimbrell of
Kimbrell & Associates, LLC, a co-author of SPE 35431, “Screening Criteria for
Application of Carbon Dioxide Miscible Displacement in Waterflooded Reservoirs
Containing Light Oil”, and explaining who helped in identifying and explaining the
information used in the SPE paper.
JAF024148.DOC 2-1 March 2005
2. INTRODUCTION
2.1 CURRENT SITUATION. The Gulf Coast oil producing region is mature and in
decline. Stemming the decline in oil production will be a major challenge, requiring a
coordinated set of actions by numerous parties who have a stake in this problem - - Gulf
Coast state revenue and economic development officials; private, state and Federal
royalty owners; the Gulf Coast oil production and refining industry; the public, and the
Federal Government.
The main purpose of this report is to provide information to these “stakeholders” on the
potential for pursuing CO2 enhanced oil recovery (CO2-EOR) as one option for slowing
or potentially stopping the decline in the Gulf Coast’s oil production.
This report, “Basin Oriented Strategies for CO2 Enhanced Oil Recovery: Gulf Coast Oil
Basins,” provides information on the size of the technical and economic potential for
CO2-EOR in the Gulf Coast oil producing regions of onshore Louisiana, Mississippi and
Texas/District 3. It also identifies the many barriers - - insufficient and costly CO2
supplies, high market and economic risks, and concerns over technology performance -
- that currently impede the cost-effective application of CO2-EOR in the Gulf Coast oil
producing region.
2.2 BACKGROUND. The onshore Gulf Coast region of Louisiana, Mississippi
and Texas/District 3 was, at one time, one of the largest onshore domestic oil producing
regions. With severe declines in crude oil reserves and production capacity, these three
areas of the Gulf Coast currently produce only 255 thousand barrels of oil per day (in
2002). However, the deep, light oil reservoirs of this region are ideal candidates for
miscible carbon-dioxide based enhanced oil recovery (CO2-EOR). The Gulf Coast oil
producing region and the concentration of its major oil fields are shown in Figure 2.
JAF0
2414
8.DOC
2-
2 M
arch
2005
# ##
#
##
#
#
#
#
#
#
#
##
#
##
##
#
#
#
#
#
#
#
#
#
#
##
#
#
#
# #
#
#
#
#
#
#
#
#
##
##
#
#
#
#
#
##
#
#
#
#
#
#
#
#
#
#
#
#
#
##
# #
#
#
#
#
##
#
###
##
#
#
###
#
#
#
##
##
#
#
#
#
#
#
#
#
#
#
#
#
#
#
## #
#
##
##
#
##
#
##
#
#
#
#
##
#
#
#
#
#
#
#
#
#
#
#
#
#
#
#
##
#
##
#
#
##
#
##
#
##
###
# #
#
# #
#
#
#
Mon
roe
Shre
vepo
rt
Alex
andr
ia
Lake
Cha
rles
Lafa
yette
Bato
n Ro
uge
New
Orle
ans
Jack
son
Hatti
esbu
rg
Mob
ile
Hous
ton
Met
ro A
rea
Texa
sLo
uisi
ana
Arka
nsas
Okl
ahom
a
Mis
siss
ippi
Alab
ama
Gul
f of M
exic
o
Dalla
s M
etro
Are
a
Oil
Fiel
d#
Cou
nty
Line
Stat
e Li
ne
City
Gul
f Coa
st O
il Fi
elds
300
3060
9012
0M
iles
30°
30°
33°
33°
94°
94°
91°
91°
88°
88°
Figu
re 2.
Loc
atio
n of
Majo
r Gul
f Coa
st O
il Fiel
ds.
JAF0
2327
.PP
T
JAF024148.DOC 2-3 March 2005
2.3 PURPOSE. This report, “Basin Oriented Strategies for CO2 Enhanced Oil
Recovery: Gulf Coast Oil Basins” is part of a larger effort to examine the enhanced oil
recovery and CO2 storage potential in key U.S. oil basins. A previous report addressed
the oil fields of California. Subsequent reports will assess the oil fields of the Mid-
Continent and Alaska. The work involves establishing the geological and reservoir
characteristics of the major oil fields in the region; examining the available CO2 sources,
volumes and costs; calculating oil recovery and CO2 storage capacity; and, estimating
economic feasibility.
Future studies will also examine: (1) alternative public-private partnership strategies for
developing lower-cost CO2 capture technology; (2) launching R&D/pilot projects of
advanced CO2 flooding technology; and, (3) structuring royalty/tax incentives and
policies that would help accelerate the application of CO2-EOR and CO2 storage in the
major oil basins of the U.S.
An important purpose of the larger study is to develop a desktop modeling and
analytical capability for “basin oriented strategies” that would enable DOE/FE to
formulate policies and research programs that would support increased recovery of
domestic oil resources. As such, this desktop model complements, but does not
duplicate, the more extensive TORIS modeling system maintained by DOE/FE’s
National Energy Technology Laboratory.
2.4 KEY ASSUMPTIONS. For purposes of this study, it is assumed that sufficient
supplies of CO2 will become available, either by pipeline from natural sources such as
Jackson Dome, from industrial sources such as the hydrogen plants at the refineries in
Lake Charles, Louisiana, Pascagoula, Mississippi and Texas City, Texas, or from power
plants in the region. The timing of this availability assumes that this CO2 will be
delivered in the near future, as forecasting field life is not part of the study.
Figure 3 shows the existing pipeline system that transports CO2 from the natural CO2
reservoir at Jackson Dome to the oil fields of central Mississippi and northeastern
Louisiana. It also shows the proposed extension of this pipeline system to the oil fields
JAF024148.DOC 2-4 March 2005
of eastern Mississippi and to southeastern Louisiana. According to a Denbury
Resources press release in the fall of 2004, this operator of the Jackson Dome CO2
reservoir has moved forward with plans to construct the 84-mile extension from East
Mississippi to Eucutta Field in Mississippi.
Figure 4 provides a conceptual illustration of a CO2 pipeline system that would
transport captured CO2 emissions from the Louisiana’s refinery complex at Lake
Charles to the nearby oil fields of Louisiana. This conceptual industrial CO2 pipeline
system could link with the existing natural CO2 pipeline system, providing a more secure
overall CO2 supply system for the Gulf Coast region and makes no warranties to the
availability of pipeline right-of-ways due to environmental or landowner constraints.
JAF024148.DOC 2-5 March 2005
##
#
#
#
#
#
#
#
#
#
#
#
#
#
#
##
#
#
#
#
#
#
#
#
#
#
#
#
##
#
##
#
#
#
#
#
#
#
##
#
#
#
#
#
#
#
#
#
#
#
#
#
#
#
#
##
#
#
#
#
#
##
#
###
Baton Rouge
New Orleans
Jackson
Hattiesburg
10 0 10 20 30 Miles
City
State Line
County Line
Oil Field#
Jackson DomeCO2 Pipelines
Existing Pipeline
Proposed Pipeline
29° 29°
30° 30°
31° 31°
32° 32°
91°
91°
90°
90°
89°
89°Figure 3. Location of Existing and Planned CO2 Supply Pipelines in Mississippi and Louisiana.
JAF02328.PPT
JAF0
2414
8.DOC
2-
6 Ma
rch 20
05
#
##
##
#
#
##
#
#
#
#
#
#
#
#
#
#
#
#
#
#
#
#
#
#
#
#
#
#
#
#
#
#
#
#
#
#
#
#
#
# #
#
#
#
#
#
#
#
#
#
#
###
#
#
#
#
#
##
#
#
#
#
#
#
#
#
##
#
#
#
Alex
andr
ia
Lake
Cha
rles
Lafa
yette
Bato
n Ro
uge
New
Loui
sian
a
ê
200
2040
Mile
s
City
Stat
e Li
ne
Cou
nty
Line
Oil
Fiel
d#
Lake
Cha
rles
CO2
Pipe
lines
Prop
osed
Pip
elin
e
Lake
Cha
rles
Refin
ery
ê
29°
29°
30°
30°
31°
31°
94°
94°
93°
93°
92°
92°
91°
91°
Figu
re 4.
Con
cept
ual C
O2 P
ipeli
ne S
yste
m C
onne
ctin
g CO
2 Sou
rces
with
Majo
r Lou
isian
a Oil F
ields
.
JAF0
2327
.PP
T
JAF024148.DOC 2-7 March 2005
2.5 TECHNICAL OBJECTIVES. The objectives of this study are to examine the
technical and the economic potential of applying CO2-EOR in the Gulf Coast oil region,
under two technology options:
1. “Traditional Practices” Technology. This involves the continued use of past CO2
flooding and reservoir selection practices. It is distinguished by using miscible
CO2-EOR technology in light oil reservoirs and by injecting moderate volumes of
CO2, on the order of 0.4 hydrocarbon pore volumes (HCPV), into these
reservoirs. (Immiscible CO2 is not included in the “Traditional Practices”
technology option). Given the still limited application of CO2-EOR in this region
and the inherent technical and geologic risks, economic evaluations typically add
a risk factor for making this technology option in the Gulf Coast region.
2. “State of the Art” Technology. This involves bringing to the Gulf Coast the
benefits of recent gains in understanding of the CO2-EOR process and how best
to customize its application to the many different types of oil reservoirs in the
region. As further discussed below, moderately deep, light oil reservoirs are
selected for miscible CO2-EOR and the shallower light oil and the heavier oil
reservoirs are targeted for immiscible CO2-EOR. “State of the Art” technology
entails injecting much larger volumes of CO2, on the order of 1 HCPV, with
considerable CO2 recycling.
Under “State of the Art” technology, with CO2 injection volumes more than twice
as large, oil recovery is projected to be higher than reported for past field projects
using “Traditional Practices”, although this concept required further testing. The
CO2 injection/oil recovery ratio may also be higher under this technology option,
further spotlighting the importance of lower cost CO2 supplies. With the benefits
of field pilots and pre-commercial field demonstrations, the risk premium for this
technology option and scenario would be reduced to conventional levels.
JAF024148.DOC 2-8 March 2005
The set of oil reservoirs to which CO2-EOR would be applied fall into two groups,
as set forth below:
1. Favorable Light Oil Reservoirs Meeting Stringent CO2 Miscible Flooding
Criteria. These are the moderately deep, higher gravity oil reservoirs where
CO2 becomes miscible (after extraction of light hydrocarbon components into
the CO2 phase) with the oil remaining in the reservoir. Typically, reservoirs at
depths greater than 3,000 feet and with oil gravities greater than 25o API
would be selected for miscible CO2-EOR. Major Gulf Coast light oil fields
such as Webster (TX), West Heidelberg (MS) and Lake Washington (LA) fit
into this category. The great bulk of past CO2-EOR floods have been
conducted in these types of “favorable reservoirs”.
2. Challenging Reservoirs Involving Immiscible Application of CO2-EOR. These
are the moderately heavy oil reservoirs (as well as shallower light oil
reservoirs) that do not meet the stringent requirements for miscibility. This
reservoir set includes the large Gulf Coast oil fields, such as East Heidelberg
(MS) and West Eucutta (MS) that still hold a significant portion of their original
oil. Although few, Gulf Coast reservoirs at depths greater than 3,000 feet
with oil gravities between 17.5o and 25o API (or higher) would generally be
included in this category.
Combining the technology and oil reservoir options, the following oil reservoir
and CO2 flooding technology matching is applied to the Gulf Coast’s reservoirs
amenable to CO2-EOR, Table 6.
JAF024148.DOC 2-9 March 2005
Table 6. Matching of CO2-EOR Technology With the Gulf Coast’s Oil Reservoirs
and West Bay (5 A’B”). Of the 499 reservoirs screened (representing 5.3 billion
bbl of OOIP), 197 were deemed acceptable for CO2-EOR and 40 were
determined to be economic under the constraints of the study. These 40
reservoirs were estimated to provide a relatively modest volume of incremental
oil production - - 73 million barrels.
• In Texas, 378 oil reservoirs were screened for their applicability to CO2-EOR,
with 211 of these reservoirs screening as being economic. For Texas/District 3
(the Gulf Coast area addressed by this study), 33 reservoirs screened as being
economic for CO2-EOR, representing a potential for 2 billion barrels of
incremental oil recovery.
A second study of the CO2-EOR potential in Texas was performed by the Bureau
of Economic Geology in 1999. This study screened over 1,700 Texas oil reservoirs for
their applicability to CO2-EOR. This study identified 80 billion barrels of OOIP, 31 billion
barrels of which was considered “residual oil”. The largest portion of this stranded
resource was judged to exist within the platform carbonates of West Texas and the
fluvial-deltaic reservoirs of East Texas. A target of 8 billion barrels of the OOIP was
identified to exist within 90 miles of major coal- and lignite-fired power plants that would,
in the future, become sources for CO2 supplies. The study did not provide quantitative
data on technical or economic incremental oil production from CO2-EOR, citing only that
technical and economic potential did, in fact, exist in many Texas oil reservoirs.
JAF024152.DOC 4-1 March 2005
4. MECHANISMS OF CO2-EOR
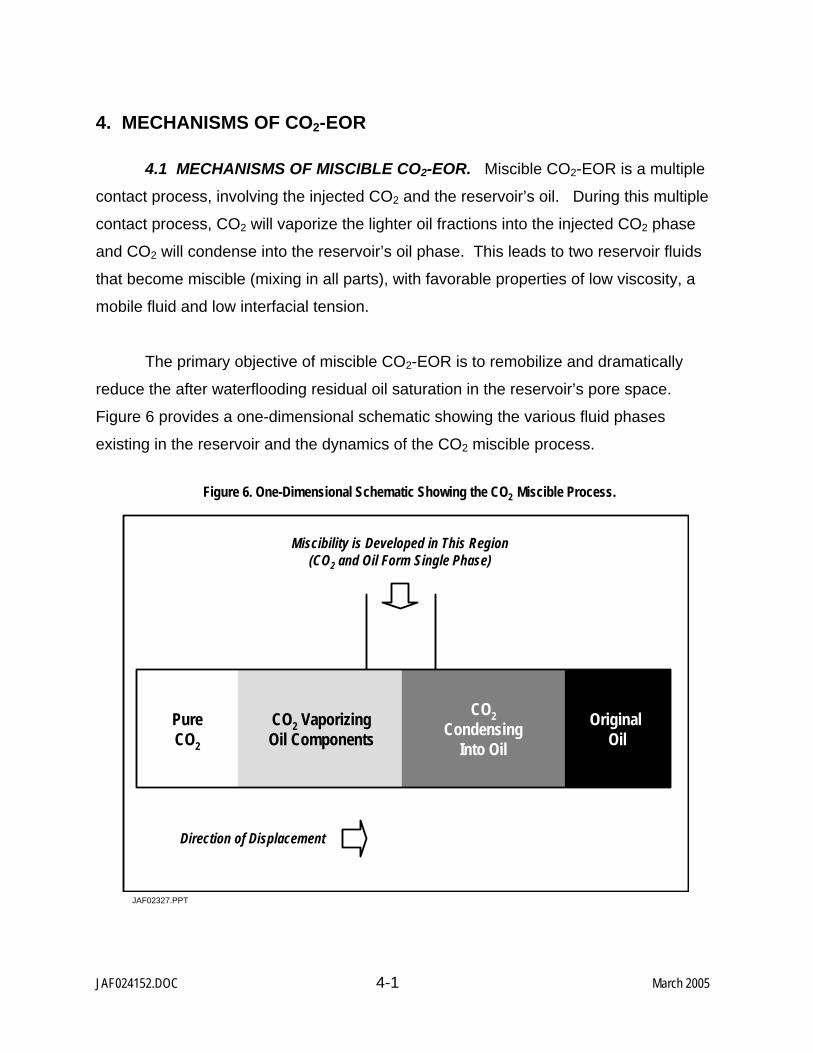
4.1 MECHANISMS OF MISCIBLE CO2-EOR. Miscible CO2-EOR is a multiple
contact process, involving the injected CO2 and the reservoir’s oil. During this multiple
contact process, CO2 will vaporize the lighter oil fractions into the injected CO2 phase
and CO2 will condense into the reservoir’s oil phase. This leads to two reservoir fluids
that become miscible (mixing in all parts), with favorable properties of low viscosity, a
mobile fluid and low interfacial tension.
The primary objective of miscible CO2-EOR is to remobilize and dramatically
reduce the after waterflooding residual oil saturation in the reservoir’s pore space.
Figure 6 provides a one-dimensional schematic showing the various fluid phases
existing in the reservoir and the dynamics of the CO2 miscible process.
Figure 6. One-Dimensional Schematic Showing the CO2 Miscible Process.
PureCO2
CO2 VaporizingOil Components
CO2Condensing
Into Oil
Original Oil
Miscibility is Developed in This Region(CO2 and Oil Form Single Phase)
Direction of Displacement
JAF02327.PPT
JAF024152.DOC 4-2 March 2005
4.2 MECHANISMS OF IMMISCIBLE CO2-EOR. When insufficient reservoir
pressure is available or the reservoir’s oil composition is less favorable (heavier), the
injected CO2 is immiscible with the reservoir’s oil. As such, another oil displacement
mechanism, immiscible CO2 flooding, occurs. The main mechanisms involved in
immiscible CO2 flooding are: (1) oil phase swelling, as the oil becomes saturated with
CO2; (2) viscosity reduction of the swollen oil and CO2 mixture; (3) extraction of lighter
hydrocarbon into the CO2 phase; and, (4) fluid drive plus pressure. This combination of
mechanisms enables a portion of the reservoir’s remaining oil to be mobilized and
produced. In general, immiscible CO2-EOR is less efficient than miscible CO2-EOR in
recovering the oil remaining in the reservoir.
4.3 INTERACTIONS BETWEEN INJECTED CO2 AND RESERVOIR OIL. The
properties of CO2 (as is the case for most gases) change with the application of
pressure and temperature. Figures 7A and 7B provide basic information on the change
in CO2 density and viscosity, two important oil recovery mechanisms, as a function of
pressure.
Oil swelling is an important oil recovery mechanism, for both miscible and
immiscible CO2-EOR. Figures 8A and 8B show the oil swelling (and implied residue oil
mobilization) that occurs from: (1) CO2 injection into a West Texas light reservoir oil;
and, (2) CO2 injection into a very heavy (12oAPI) oil reservoir in Turkey. Laboratory
work on the Bradford Field (Pennsylvania) oil reservoir showed that the injection of CO2,
at 800 psig, increased the volume of the reservoir’s oil by 50%. Similar laboratory work
on Mannville “D” Pool (Canada) reservoir oil showed that the injection of 872 scf of CO2
per barrel of oil (at 1,450 psig) increased the oil volume by 28%, for crude oil already
saturated with methane.
Viscosity reduction is a second important oil recovery mechanism, particularly for
immiscible CO2-EOR. Figure 9 shows the dramatic viscosity reduction of one to two
orders of magnitude (10 to 100 fold) that occur for a reservoir’s oil with the injection of
CO2 at high pressure.
JAF024152.DOC 4-3 March 2005
Figure 7A. Carbon Dioxide, CH4 and N2 densities at 1050F. At high pressures, CO2 has a density close to that of a liquid and much greater than that of either
methane or nitrogen. Densities were calculated with an equation of state (EOS).
Figure 7B. Carbon Dioxide, CH4 and N2 viscosities at 1050F. At high pressures, the viscosity of CO2 is also greater then that of methane or nitrogen, although it remains
low in comparison to that of liquids. Viscosities were calculated with an EOS.
JAF02328.PPT
JAF0
2415
2.DOC
4-
4 Ma
rch 20
05
1.24
050
010
0015
0020
00
Pres
sure
, PSI
G
2500
1.22 1.2
1.18
1.16
1.14
1.12 1.1
1.08
1.06
1.04
Oil Swelling Factor
Figu
re 8A
. Rela
tive O
il Vol
ume v
s. Pr
essu
re fo
r a L
ight
Wes
t Te
xas R
eser
voir
Flui
d. (H
olm
and
Jose
ndal)
CO2
Satu
rate
dSe
para
tor O
il1.
6
1.7
1.5
1.4
1.3
1.2
1.1
1.0
050
010
0015
0020
00
Relative Oil Volume,BBL. Oil/BBL. Residual Oil at 60oF
Pres
sure
, PSI
G
Reco
mbi
ned
Rese
rvoi
r Flu
id
CO2
Satu
rate
dRe
serv
oir F
luid
Figu
re 8B
. Oil S
wellin
g Fa
ctor
vs. P
ress
ure f
or a
Heav
y Oi
l in
Tur
key (
Issev
eran
d To
pkoy
a).
JAF0
2327
.PP
T
JAF024152.DOC 4-5 March 2005
Figure 9. Viscosity Reduction Versus Saturation Pressure. (Simon and Graue)
.7
.8
.6
.5
.4
.3
.2
.1
0 1000 30002000
Saturation Pressure, PSIG
0
.9
1.0
51050
100500
1000
Ratio
of A
ltere
d Vi
scos
ity to
Orig
inal
Visc
osity
Original Oil
Viscosity
JAF02328.PPT
JAF0
2415
3.DOC
5-
2 Ma
rch 20
05
Tabl
e 9. R
eser
voir
Data
For
mat
: Majo
r Oil R
eser
voirs
Dat
a Bas
e.
Bas
in N
ame
Fiel
d N
ame
Res
ervo
ir
Res
ervo
ir Pa
ram
eter
s:O
il Pr
oduc
tion
Volu
mes
Area
(A)
Prod
ucin
g W
ells
(act
ive)
OO
IP (M
Mbl
)N
et P
ay (f
t)Pr
oduc
ing
Wel
ls (s
hut-i
n)C
um O
il (M
Mbl
)D
epth
(ft)
2001
Pro
duct
ion
(Mbb
l)EO
Y 20
01 R
eser
ves
(MM
bl)
Poro
sity
Dai
ly P
rod
- Fie
ld (B
bl/d
)U
ltim
ate
Rec
over
y (M
Mbl
)R
eser
voir
Tem
p (d
eg F
)C
um O
il Pr
oduc
tion
(MM
bbl)
Rem
aini
ng (M
Mbb
l)In
itial
Pre
ssur
e (p
si)
EOY
2001
Oil
Res
erve
s (M
Mbb
l)U
ltim
ate
Rec
over
ed (%
)Pr
essu
re (p
si)
Wat
er C
ut
OO
IP V
olum
e C
heck
B oi
Wat
er P
rodu
ctio
nR
eser
voir
Volu
me
(AF)
B o @
So,
swep
t20
01 W
ater
Pro
duct
ion
(Mbb
l)Bb
l/AF
S oi
Dai
ly W
ater
(Mbb
l/d)
OO
IP C
heck
(MM
bl)
S or
Swep
t Zon
e S o
Inje
ctio
nSR
OIP
Vol
ume
Che
ckS w
iIn
ject
ion
Wel
ls (a
ctiv
e)R
eser
voir
Volu
me
(AF)
S wIn
ject
ion
Wel
ls (s
hut-i
n)Sw
ept Z
one
Bbl/A
F20
01 W
ater
Inje
ctio
n (M
Mbb
l)SR
OIP
Che
ck (M
Mbb
l)AP
I Gra
vity
Dai
ly In
ject
ion
- Fie
ld (M
bbl/d
)Vi
scos
ity (c
p)C
um In
ject
ion
(MM
bbl)
Dai
ly In
j per
Wel
l (Bb
l/d)
RO
IP V
olum
e C
heck
Dyk
stra
-Par
sons
RO
IP C
heck
(MM
bl)
JAF2
0040
05.X
LS
JAF024153.DOC 5-3 March 2005
Considerable effort was required to construct an up-to-date, volumetrically
consistent data base that contained all of the essential data, formats and interfaces to
enable the study to: (1) develop an accurate estimate of the size of the original and
remaining oil in-place in the Gulf Coast; (2) reliably screen the reservoirs as to their
amenability for miscible and immiscible CO2-EOR; and, (3) provide the CO2-PROPHET
Model (developed by Texaco for the DOE Class I cost-share program) the essential
input data for calculating CO2 injection requirements and oil recovery.
5.3 SCREENING RESERVOIRS FOR CO2-EOR. The data base was screened
for reservoirs that would be applicable for CO2-EOR. Five prominent screening criteria
were used to identify favorable reservoirs. These were: reservoir depth, oil gravity,
reservoir pressure, reservoir temperature and oil composition. These values were used
to establish the minimum miscibility pressure for conducting miscible CO2-EOR and for
selecting reservoirs that would be amenable to this oil recovery process. Reservoirs not
meeting the miscibility pressure standard were considered for immiscible CO2-EOR.
The preliminary screening steps involved selecting the deeper oil reservoirs that
had sufficiently high oil gravity. A minimum reservoir depth of 3,000 feet, at the mid-
point of the reservoir, was used to ensure the reservoir could accommodate high
pressure CO2 injection. A minimum oil gravity of 17.5o API was used to ensure the
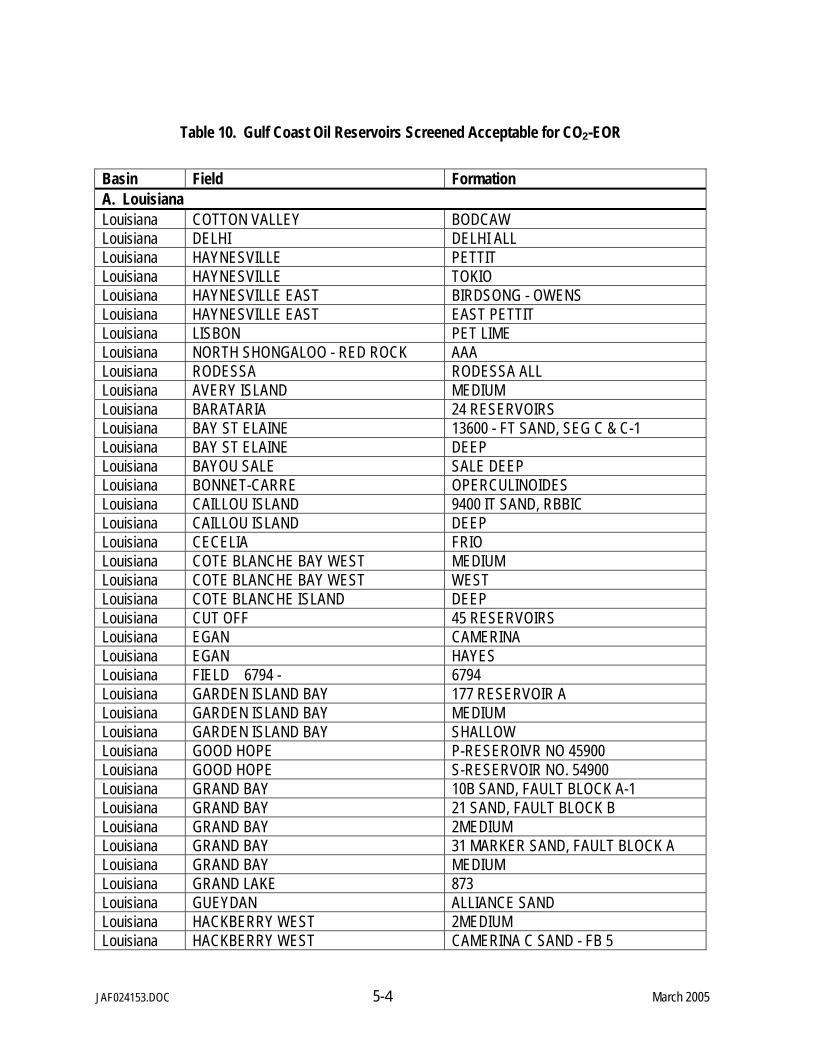
reservoir’s oil had sufficient mobility, without requiring thermal injection. Table 10
tabulates the oil reservoirs that passed the preliminary screening step. Many of these
fields contain multiple reservoirs, with each reservoir holding a great number of stacked
sands. Because of data limitations, this screening study combined the sands into a
single reservoir.
JAF024153.DOC 5-4 March 2005
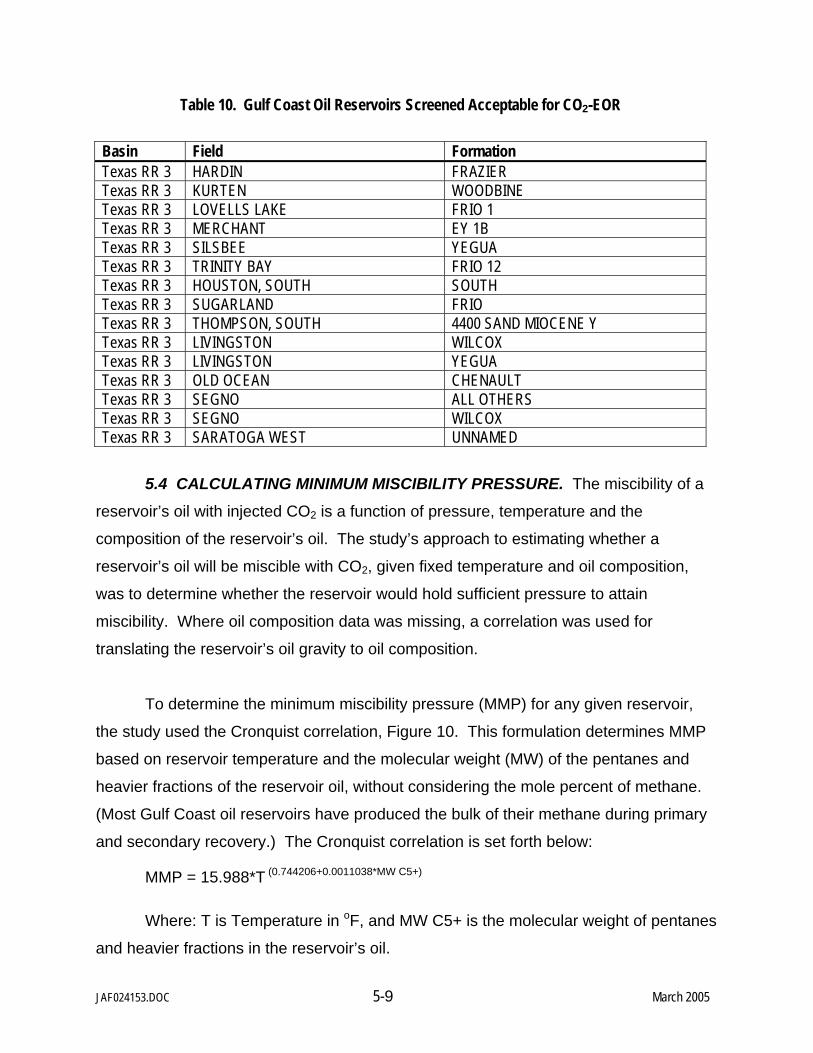
Table 10. Gulf Coast Oil Reservoirs Screened Acceptable for CO2-EOR
Basin Field Formation A. Louisiana Louisiana COTTON VALLEY BODCAW Louisiana DELHI DELHI ALL Louisiana HAYNESVILLE PETTIT Louisiana HAYNESVILLE TOKIO Louisiana HAYNESVILLE EAST BIRDSONG - OWENS Louisiana HAYNESVILLE EAST EAST PETTIT Louisiana LISBON PET LIME Louisiana NORTH SHONGALOO - RED ROCK AAA Louisiana RODESSA RODESSA ALL Louisiana AVERY ISLAND MEDIUM Louisiana BARATARIA 24 RESERVOIRS Louisiana BAY ST ELAINE 13600 - FT SAND, SEG C & C-1 Louisiana BAY ST ELAINE DEEP Louisiana BAYOU SALE SALE DEEP Louisiana BONNET-CARRE OPERCULINOIDES Louisiana CAILLOU ISLAND 9400 IT SAND, RBBIC Louisiana CAILLOU ISLAND DEEP Louisiana CECELIA FRIO Louisiana COTE BLANCHE BAY WEST MEDIUM Louisiana COTE BLANCHE BAY WEST WEST Louisiana COTE BLANCHE ISLAND DEEP Louisiana CUT OFF 45 RESERVOIRS Louisiana EGAN CAMERINA Louisiana EGAN HAYES Louisiana FIELD 6794 - 6794 Louisiana GARDEN ISLAND BAY 177 RESERVOIR A Louisiana GARDEN ISLAND BAY MEDIUM Louisiana GARDEN ISLAND BAY SHALLOW Louisiana GOOD HOPE P-RESEROIVR NO 45900 Louisiana GOOD HOPE S-RESERVOIR NO. 54900 Louisiana GRAND BAY 10B SAND, FAULT BLOCK A-1 Louisiana GRAND BAY 21 SAND, FAULT BLOCK B Louisiana GRAND BAY 2MEDIUM Louisiana GRAND BAY 31 MARKER SAND, FAULT BLOCK A Louisiana GRAND BAY MEDIUM Louisiana GRAND LAKE 873 Louisiana GUEYDAN ALLIANCE SAND Louisiana HACKBERRY WEST 2MEDIUM Louisiana HACKBERRY WEST CAMERINA C SAND - FB 5
JAF024153.DOC 5-5 March 2005
Table 10. Gulf Coast Oil Reservoirs Screened Acceptable for CO2-EOR
Basin Field Formation Louisiana HACKBERRY WEST MEDIUM Louisiana HACKBERRY WEST OLIGOCENE AMOCO OPERATED ONLY Louisiana LAKE BARRE LB LM2 SU Louisiana LAKE BARRE LM1 LB SU Louisiana LAKE BARRE UNIT B UPPER M-1 SAND Louisiana LAKE BARRE UPPER MS RESERVOIR D Louisiana LAKE PALOURDE EAST All Louisiana LAKE PELTO PELTO DEEP Louisiana LAKE WASHINGTON 21 RESERVOIR A Louisiana LAKE WASHINGTON DEEP Louisiana OLD LISBON PETTIT LIME Louisiana PARADIS DEEP Louisiana PARADIS LOWER 9000 FT SAND RM Louisiana PARADIS PARADIS ZONE, SEG A-B Louisiana QUARANTINE BAY 3 SAND, RESERVOIR B Louisiana QUARANTINE BAY 8 SAND, RESERVOIR B Louisiana QUARANTINE BAY MEDIUM Louisiana ROMERE PASS 28 RESERVOIRS Louisiana ROMERE PASS 9700 Louisiana SATURDAY ISLAND All others Louisiana SATURDAY ISLAND 11 RESERVOIRS Louisiana SWEET LAKE All others Louisiana SWEET LAKE AVG 30 SANDS Louisiana VENICE B-13 SAND Louisiana VENICE B-30 SAND Louisiana VENICE B-6 SAND Louisiana VENICE B-7 SAND Louisiana VENICE M-24 SAND Louisiana WEEKS ISLAND DEEP Louisiana WEEKS ISLAND R-SAND RESERVOIR A Louisiana WEEKS ISLAND S-SAND RESERVOIR A Louisiana WEST BAY 11A SAND (RESERVOIR A) Louisiana WEST BAY 11B SAND FAULT BLOCK B Louisiana WEST BAY 6B RESERVOIR G Louisiana WEST BAY 8A SAND FAULT BLOCK A Louisiana WEST BAY 8AL SAND Louisiana WEST BAY MEDIUM Louisiana WEST BAY PROPOSED WB68 (RG) SAND UNIT Louisiana WEST BAY WB 1 (FBA) SU Louisiana WEST BAY X-11 (RESERVOIR A) Louisiana WEST BAY X-9 A SAND (RESERVOIR A)
JAF024153.DOC 5-6 March 2005
Table 10. Gulf Coast Oil Reservoirs Screened Acceptable for CO2-EOR
Basin Field Formation Louisiana WEST DELTA BLOCK 83 10100 C SAND Louisiana WHITE LAKE WEST AMPH B Louisiana WHITE LAKE WEST BIG 3-2, RE, RC Louisiana ANSE LABUTTE MIOCENE AMOCO OPERATED ONLY Louisiana BATEMAN LAKE 10400 GRABEN Louisiana BLACK BAYOU FRIO SAND, RESERVOIR A Louisiana BLACK BAYOU T-SAND Louisiana BLACK BAYOU RESERVOIR OT SAND Louisiana BLACK BAYOU T2 SAND RESERVOIR F Louisiana BOSCO DISCORBIS Louisiana BULLY CAMP TEXTULARLA, RL Louisiana CAILLOU ISLAND UPPER 8000 RA SU Louisiana CAILLOU ISLAND 53-C RA SU Louisiana CHANDELEUR SOUND BLOCK 0025 BB RA SAND Louisiana CLOVELY M RESERVOIR B Louisiana CLOVELY 50 SAND, FAULT BLOCK VII Louisiana CLOVELY FAULT BLOCK IV NO. 50 SAND Louisiana COTE BLANCHE ISLAND 20 SAND Louisiana COTTON VALLEY BODCAW Louisiana DELHI DELHI ALL Louisiana DELTA DUCK CLUB A SEQ LOWER 6,300’ SAND Louisiana DELTA DUCK CLUB B SEQ LOWER 6,300’ SAND Louisiana DOG LAKE DGL CC RU SU (REVISION) Louisiana ERATH 8,700 Louisiana ERATH 7,300 SAND Louisiana FORDOCHE WI2 RA Louisiana HAYNESVILLE PETTIT Louisiana HAYNESVILLE TOKIO Louisiana HAYNESVILLE EAST EAST PETTIT Louisiana HAYNESVILLE EAST BIRDSONG-OWENS Louisiana LAFITTE LOWER SF DENNIS SAND, SEQ H Louisiana LAKE HATCH 9,850 SAND Louisiana LEEVILLE 95 SAND, SEQ B Louisiana LEEVILLE 96 SAND, SEQ B Louisiana LITTLE LAKE E-4 SAND, RES A Louisiana MAIN PASS BLOCK 0035 90 CHANNEL G2 Louisiana MAIN PASS BLOCK 0035 G2 RESERVOIR A SAND UNIT Louisiana MANILE VILLAGE 29 SAND Louisiana NORTH SHOUGALOO-RED ROCK AAA Louisiana LISBON PET LIME Louisiana PARADIS MAIN PAY, SET T
JAF024153.DOC 5-7 March 2005
Table 10. Gulf Coast Oil Reservoirs Screened Acceptable for CO2-EOR
Basin Field Formation Louisiana PHOENIX LAKE BROWN A-1 Louisiana PORT BARRE FUTRAL SAND, RESERVOIR A Louisiana QUARANTINE BAY 9A SAND, FAULT BLOCK C Louisiana QUARANTINE BAY 5 SAND, (REF) Louisiana RODESSA RODESSE ALL Louisiana SECTION 28 2ND HACKBERRY, RESERVOIR D Louisiana SOUTHEAST PASS J-5 SAND RA Louisiana SOUTHEAST PASS L RESERVOIR C Louisiana TEPETATE ORTEGO A Louisiana TEPETATE WEST MILLER Louisiana VALENTINE N SAND RESERVOIR A Louisiana VALENTINE VAL N RC SU Louisiana VILLE PLATTE RL BASAL COCKFIELD Louisiana VILLE PLATTE RD BASAL COCKFIELD Louisiana VILLE PLATTE MIDDLE COCKFIELD RA Louisiana WELSH CAMERINA Louisiana WHITE CASTLE 01 RF SU Louisiana WHITE LAKE EAST 4- SAND B. Mississippi Mississippi BAY SPRINGS CVL LOWER COTTON VALLEY Mississippi CRANFIELD LOWER TUSCALOOSA Mississippi EUCUTTA EAST E_EUTAW Mississippi HEIDELBERG, EAST E_CHRISTMAS Mississippi HEIDELBERG, EAST E_EUTAW Mississippi HEIDELBERG, EAST UPPER TUSCALOOSA Mississippi HEIDELBERG, WEST W_CHRISTMAS Mississippi LITTLE CREEK LOWER TUSCALOOSA Mississippi MALLALIEU, WEST LOWER TUSCALOOSA WMU C Mississippi MCCOMB LOWER TUSCALOOSA B Mississippi PACHUTA CREEK, EAST ESOPU RES. Mississippi QUITMAN BAYOU 4600 WILCOX Mississippi SOSO BAILEY Mississippi TINSLEY SELMA-EUTAW-TUSCALOOSA Mississippi TINSLEY E_WOODRUFF SAND EAST SEGMENT Mississippi TINSLEY W_WOODRUFF SAND WEST SEGMENT Mississippi YELLOW CREEK, WEST EUTAW Mississippi EUCUTTA, WEST W_EUTAW Mississippi FIELD 13 013 Mississippi HEIDELBERG, WEST EUTAW C. Texas Railroad District 3 Texas RR 3 AMELIA FRIO
JAF024153.DOC 5-8 March 2005
Table 10. Gulf Coast Oil Reservoirs Screened Acceptable for CO2-EOR
Basin Field Formation Texas RR 3 ANAHUAC 13A-2 FRIO FB Texas RR 3 BARBERS HILL MIOCENE-FRIO Texas RR 3 CLEAR LAKE FRIO Texas RR 3 CONROE CONROE MAIN Texas RR 3 MAGNET WITHERS All Texas RR 3 BRYAN WOODBINE Texas RR 3 HUMBLE All Texas RR 3 MANVEL All others Texas RR 3 ORANGE All Texas RR 3 MANVEL (OLIGOCENE) OLIGOCENE Texas RR 3 SOUR LAKE All Texas RR 3 WEST COLUMBIA WEST Texas RR 3 WITHERS, NORTH NORTH Texas RR 3 WEST COLUMBIA NEW NEW Texas RR 3 GILLOCK EAST SEGMENT & BIG GAS Texas RR 3 GILLOCK, SOUTH BIG GAS Texas RR 3 GOOSE CREEK MIOCENE Texas RR 3 HANKAMER MIOCENE SAND Texas RR 3 HASTINGS, EAST EAST Texas RR 3 HASTINGS, WEST WEST Texas RR 3 HULL MERCHANT YEGUA Texas RR 3 LOVELLS LAKE 2FRIO 2 Texas RR 3 MARKHAM, NORTH-BAY CITY WEST CORNELIUS Texas RR 3 MARKHAM, NORTH-BAY CITY CARLSON Texas RR 3 OLD OCEAN ARMSTRONG Texas RR 3 OYSTER BAYOU SEABREEZE Texas RR 3 PIERCE JUNCTION All Texas RR 3 RACCOON BEND All Texas RR 3 RACCOON BEND COCKFIELD Texas RR 3 SPINDLETOP All Texas RR 3 THOMPSON All others Texas RR 3 THOMPSON, NORTH NORTH Texas RR 3 THOMPSON, SOUTH FRIO POOL Texas RR 3 TOMBALL COCKFIELD Texas RR 3 TOMBALL SCHULTZ, SOUTHEAST Texas RR 3 WEBSTER FRIO Texas RR 3 CHOCOLATE BAYOU ALIBEL Texas RR 3 CHOCOLATE BAYOU UPPER FRIO Texas RR 3 FAIRBANKS FAIRBANKS Texas RR 3 FIG RIDGE SEABREEZE Texas RR 3 GIDDINGS AUSTIN CHALK
JAF024153.DOC 5-9 March 2005
Table 10. Gulf Coast Oil Reservoirs Screened Acceptable for CO2-EOR
Basin Field Formation Texas RR 3 HARDIN FRAZIER Texas RR 3 KURTEN WOODBINE Texas RR 3 LOVELLS LAKE FRIO 1 Texas RR 3 MERCHANT EY 1B Texas RR 3 SILSBEE YEGUA Texas RR 3 TRINITY BAY FRIO 12 Texas RR 3 HOUSTON, SOUTH SOUTH Texas RR 3 SUGARLAND FRIO Texas RR 3 THOMPSON, SOUTH 4400 SAND MIOCENE Y Texas RR 3 LIVINGSTON WILCOX Texas RR 3 LIVINGSTON YEGUA Texas RR 3 OLD OCEAN CHENAULT Texas RR 3 SEGNO ALL OTHERS Texas RR 3 SEGNO WILCOX Texas RR 3 SARATOGA WEST UNNAMED
5.4 CALCULATING MINIMUM MISCIBILITY PRESSURE. The miscibility of a
reservoir’s oil with injected CO2 is a function of pressure, temperature and the
composition of the reservoir’s oil. The study’s approach to estimating whether a
reservoir’s oil will be miscible with CO2, given fixed temperature and oil composition,
was to determine whether the reservoir would hold sufficient pressure to attain
miscibility. Where oil composition data was missing, a correlation was used for
translating the reservoir’s oil gravity to oil composition.
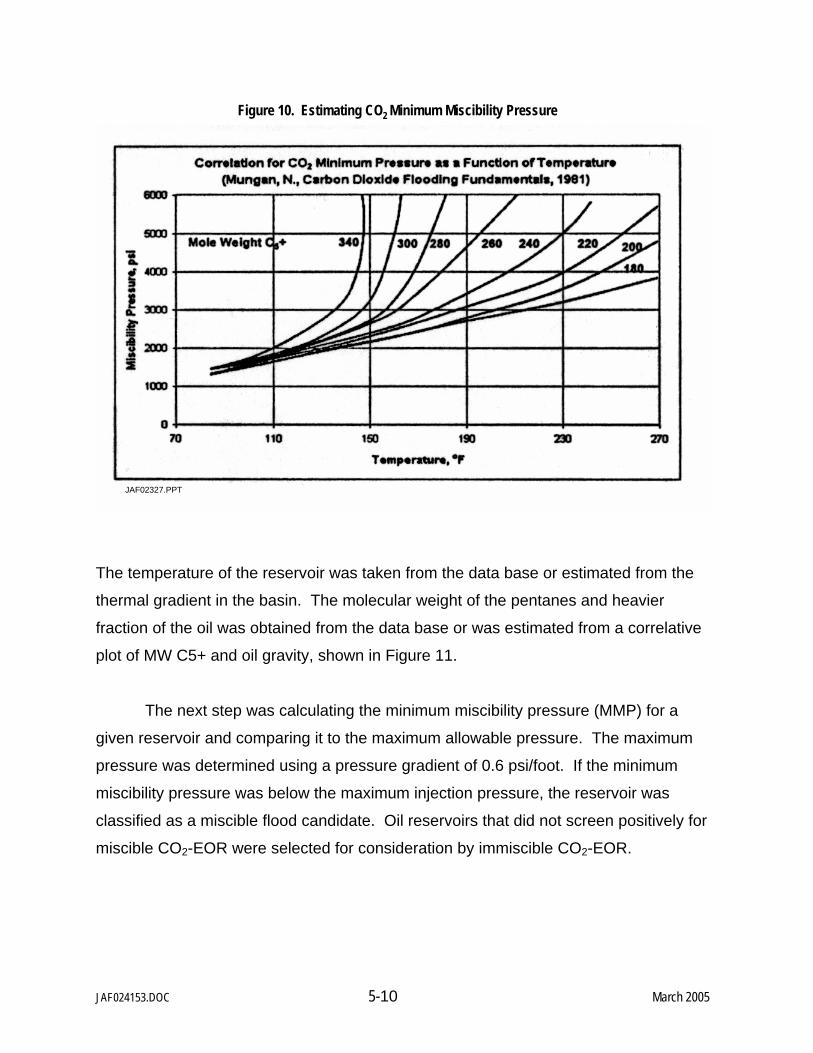
To determine the minimum miscibility pressure (MMP) for any given reservoir,
the study used the Cronquist correlation, Figure 10. This formulation determines MMP
based on reservoir temperature and the molecular weight (MW) of the pentanes and
heavier fractions of the reservoir oil, without considering the mole percent of methane.
(Most Gulf Coast oil reservoirs have produced the bulk of their methane during primary
and secondary recovery.) The Cronquist correlation is set forth below:
MMP = 15.988*T (0.744206+0.0011038*MW C5+)
Where: T is Temperature in oF, and MW C5+ is the molecular weight of pentanes
and heavier fractions in the reservoir’s oil.
JAF024153.DOC 5-10 March 2005
The temperature of the reservoir was taken from the data base or estimated from the
thermal gradient in the basin. The molecular weight of the pentanes and heavier
fraction of the oil was obtained from the data base or was estimated from a correlative
plot of MW C5+ and oil gravity, shown in Figure 11.
The next step was calculating the minimum miscibility pressure (MMP) for a
given reservoir and comparing it to the maximum allowable pressure. The maximum
pressure was determined using a pressure gradient of 0.6 psi/foot. If the minimum
miscibility pressure was below the maximum injection pressure, the reservoir was
classified as a miscible flood candidate. Oil reservoirs that did not screen positively for
miscible CO2-EOR were selected for consideration by immiscible CO2-EOR.
Figure 10. Estimating CO2 Minimum Miscibility Pressure
JAF02327.PPT
JAF024153.DOC 5-11 March 2005
5.5 CALCULATING OIL RECOVERY. The study utilized CO2-PROPHET to
calculate incremental oil produced using CO2-EOR. CO2-PROPHET was developed by
the Texaco Exploration and Production Technology Department (EPTD) as part of the
DOE Class I cost-share program. The specific project was “Post Waterflood CO2 Flood
in a Light Oil, Fluvial Dominated Deltaic Reservoir” (DOE Contract No. DE-FC22-
93BC14960). CO2-PROPHET was developed as an alternative to the DOE’s CO2
miscible flood predictive model, CO2PM. According to the developers of the model,
CO2-PROPHET has more capabilities and fewer limitations than CO2PM. For example,
according to the above cited report, CO2-PROPHET performs two main operations that
provide a more robust calculation of oil recovery than available from CO2PM:
CO2-PROPHET generates streamlines for fluid flow between injection and
production wells, and
y = 4247.98641x-0.87022
R2 = 0.99763
0
100
200
300
400
500
0 20 40 60 80 100
Tank Oil Gravity, oAPI
Mol
ecul
ar W
T C
5+
Figure 11. Correlation of MW C5+ to Tank Oil Gravity
JAF02327.PPT
JAF024153.DOC 5-12 March 2005
The model performs oil displacement and recovery calculations along the
established streamlines. (A finite difference routine is used for oil
displacement calculations.)
Appendix A discusses, in more detail, the CO2-PROPHET model and the
calibration of this model with an industry standard reservoir simulator.
Even with these improvements, it is important to note the CO2-PROPHET is still
primarily a “screening-type” model, and lacks some of the key features, such as gravity
override and compositional changes to fluid phases, available in more sophisticated
reservoir simulators.
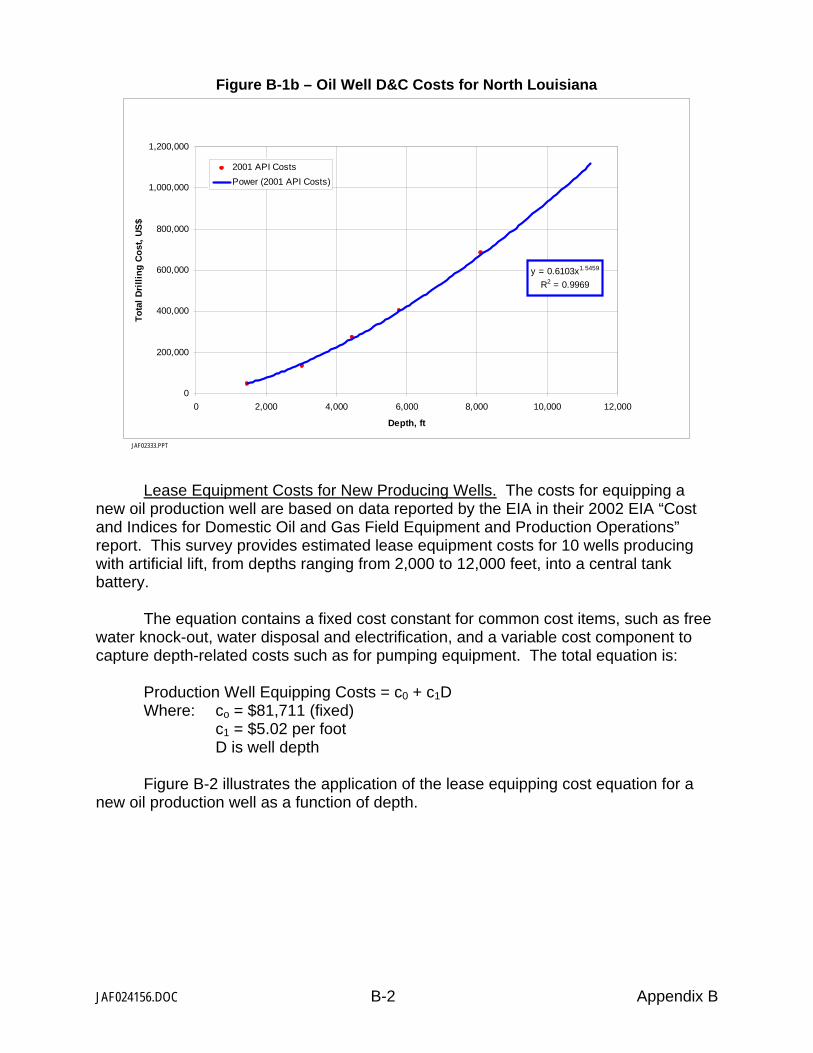
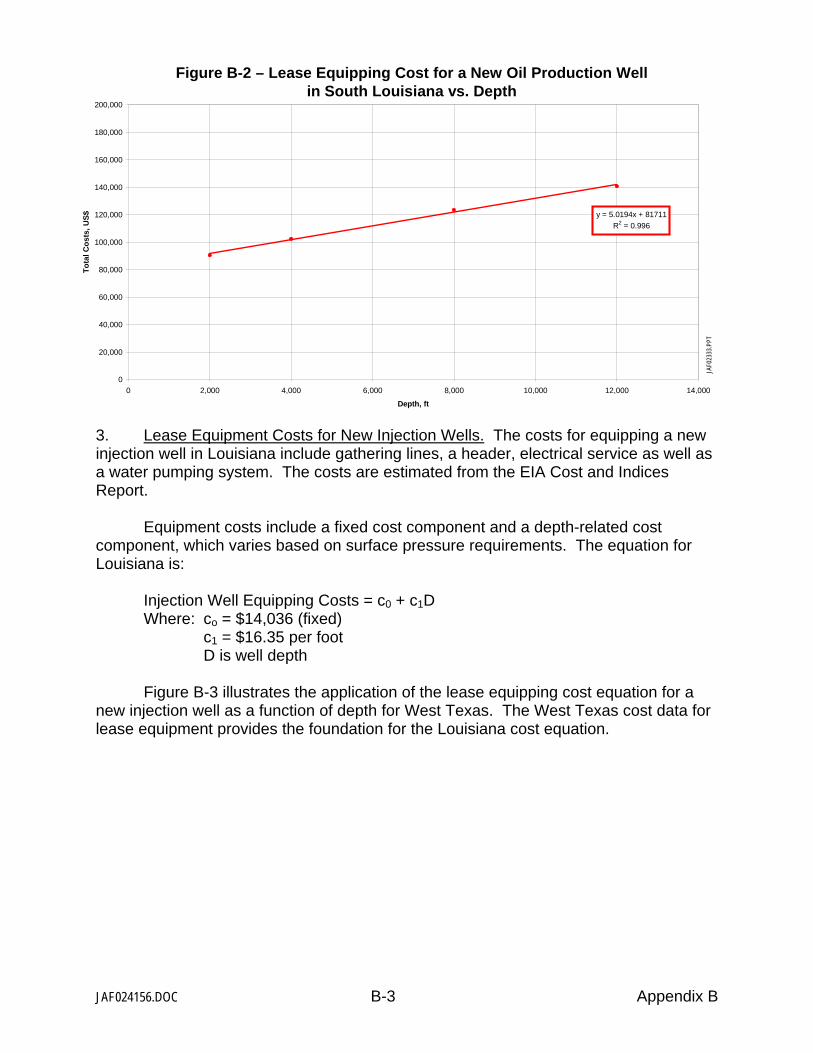
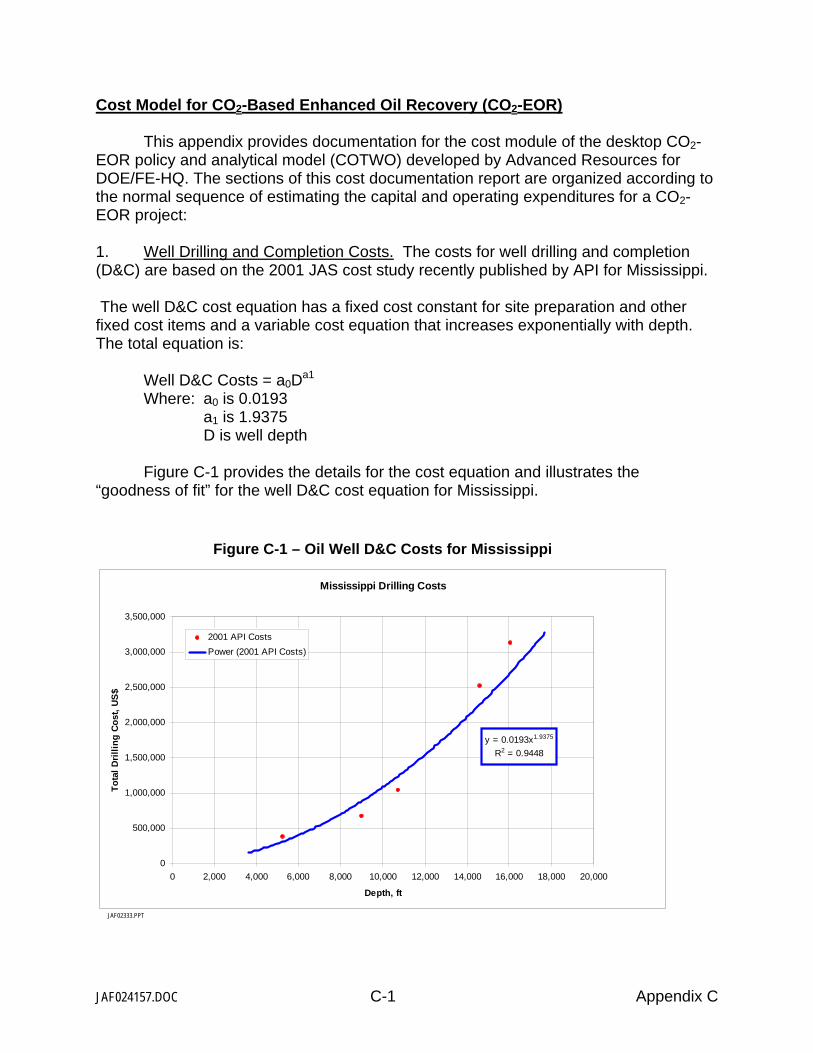
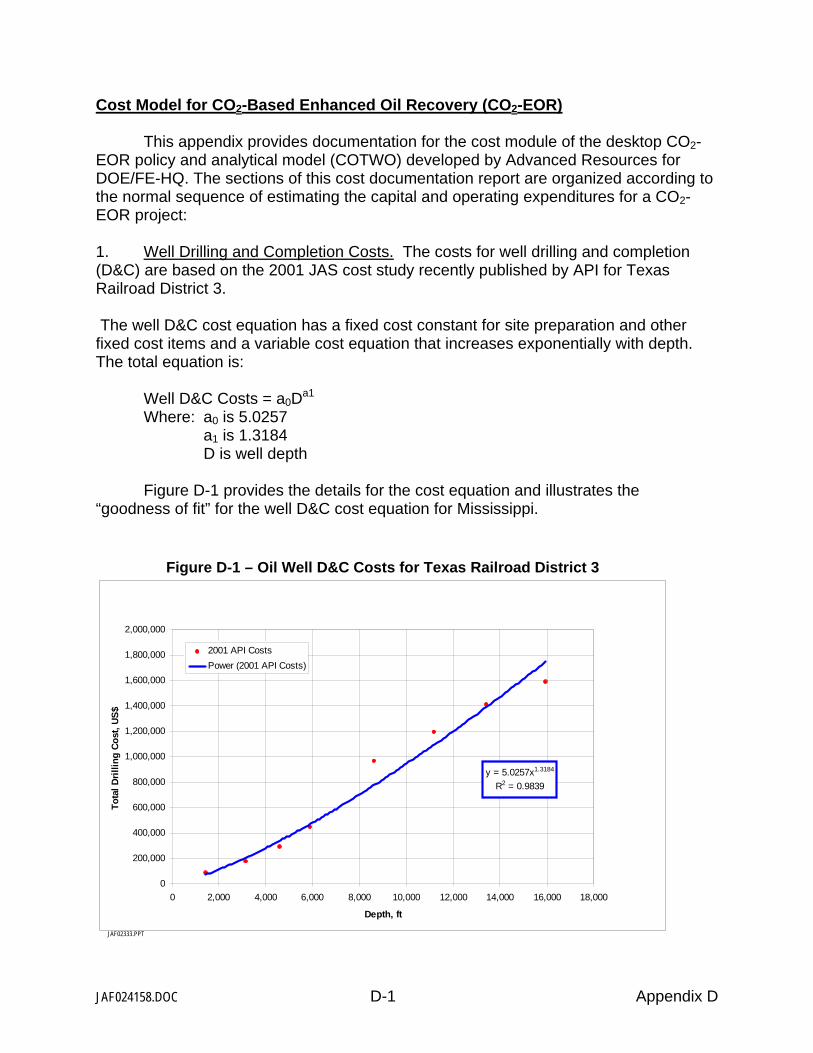
5.6 ASSEMBLING THE COST MODEL. A detailed, up-to-date CO2-EOR Cost
Model was developed by the study. The model includes costs for: (1) drilling new wells
or reworking existing wells; (2) providing surface equipment for new wells; (3) installing
the CO2 recycle plant; (4) constructing a CO2 spur-line from the main CO2 trunkline to
the oil field; and, (5) various miscellaneous costs.
The cost model also accounts for normal well operation and maintenance (O&M),
for lifting costs of the produced fluids, and for costs of capturing, separating and
reinjecting the produced CO2. A variety of CO2 purchase and reinjection costs options
are available to the model user. (Appendices B, C and D provide state-level details on
the Cost Model for CO2-EOR prepared by this study.)
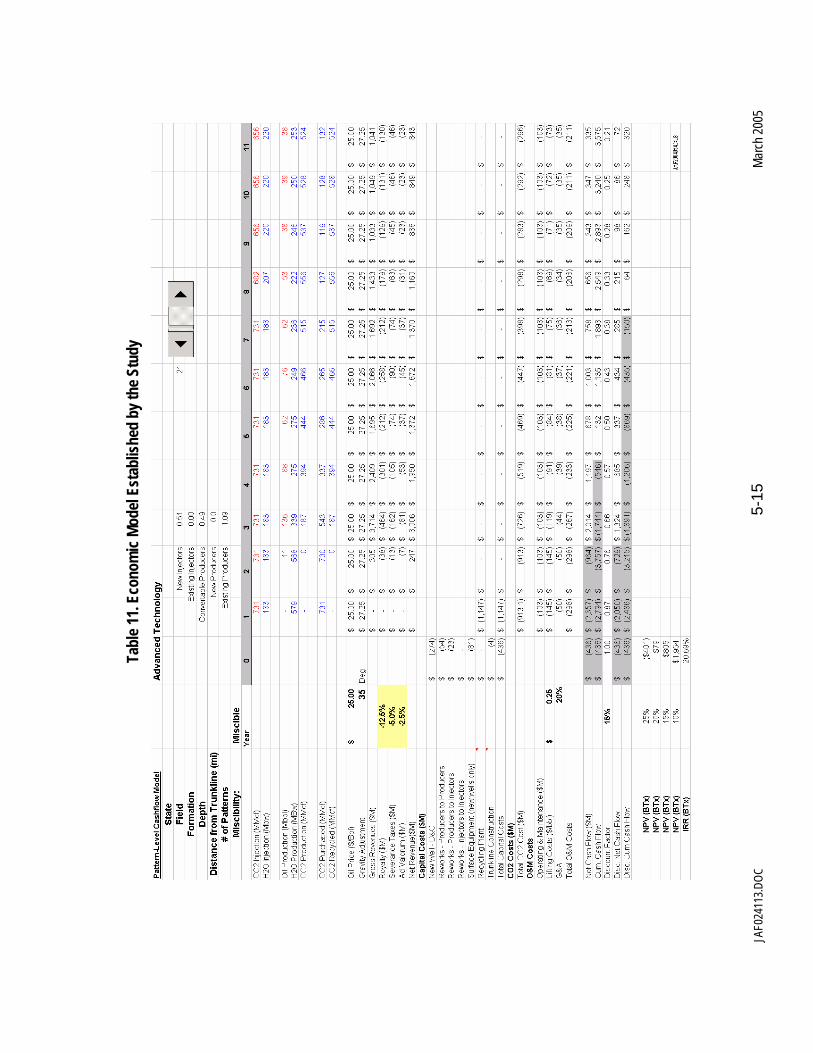
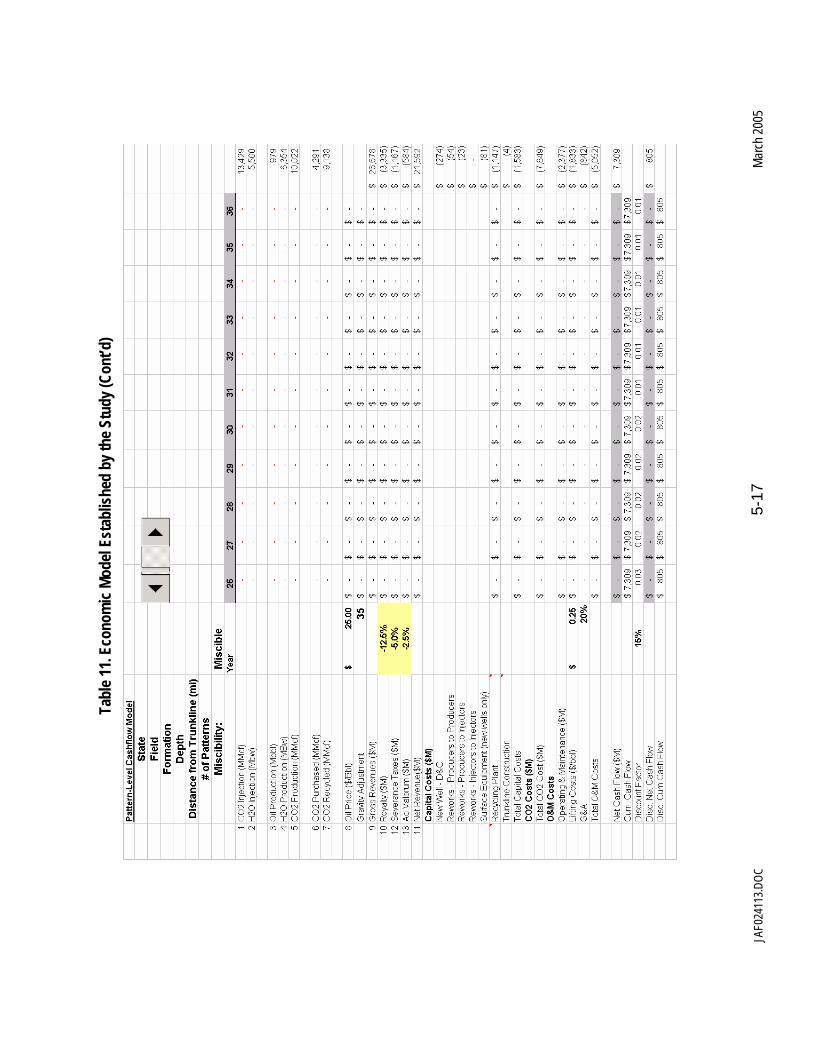
5.7 CONSTRUCTING AN ECONOMICS MODEL. The economic model used by
the study is an industry standard cash flow model that can be run on either a pattern or
a field-wide basis. The economic model accounts for royalties, severance and ad
valorem taxes, as well as any oil gravity and market location discounts (or premiums)
from the “marker” oil price. A variety of oil prices are available to the model user. Table
12 provides an example of the Economic Model for CO2-EOR used by the study.
JAF024153.DOC 5-13 March 2005
5.8 PERFORMING SCENARIO ANALYSES. A series of analyses were
prepared to better understand how differences in oil prices, CO2 supply costs and
financial risk hurdles could impact the volumes of oil that would be economically
produced by CO2-EOR from the Gulf Coast’s oil basins and major oil reservoirs.
Two technology cases were examined. As discussed in more detail in Chapter 2,
the study examined the application of two CO2-EOR options - - “Traditional
Practices” and “State of the Art” Technology.
Two oil prices were considered. A $25 per barrel oil price was used to represent the
moderate oil price case; a $35 per barrel oil price was used to represent the
availability of Federal/state risk sharing and/or the continuation of the current high oil
price situation.
Two CO2 supply costs were considered. The high CO2 cost was set at $1.25 per Mcf
(5% of the oil price) to represent the costs of a new transportation system bringing
natural CO2 to the Gulf Coast’s oil basins. A lower CO2 supply cost equal to $0.50
per Mcf (2% of the oil price) was included to represent the potential future availability
of low-cost CO2 from industrial and power plants as part of CO2 storage.
Two minimum rate of return (ROR) hurdles were considered, a high ROR of 25%,
before tax, and a lower 15% ROR, before tax. The high ROR hurdle incorporates a
premium for the market, reservoir and technology risks inherent in using CO2-EOR in
a new reservoir setting. The lower ROR hurdle represents application of CO2-EOR
after the geologic and technical risks have been mitigated with a robust program of
field pilots and demonstrations.
These various technology, oil price, CO2 supply cost and rate of return hurdles
were combined into four scenarios, as set forth below:
JAF024153.DOC 5-14 March 2005
The first scenario captures how CO2-EOR technology has been applied and has
performed in the past. In this low technology, high risk scenario, called “Traditional
Practices”, there is little economically feasible potential in this oil producing region for
using CO2-EOR.
The second scenario, entitled “State of the Art”, assumes that the technology
progress in CO2-EOR, achieved in other areas, is successfully applied to the oil
reservoirs of Illinois. In addition, a comprehensive set of research, pilot tests and
field demonstrations help lower the risk inherent in applying new technology to these
complex oil reservoirs. However, because of limited sources of CO2, these supply
costs are high (equal to $1.25 per Mcf) the oil price) and significantly hamper
economic feasibility of using CO2-EOR.
The third scenario, entitled “Risk Mitigation,” examines how the economic potential
of CO2-EOR could be increased through a strategy involving state production tax
reductions, federal tax credits, royalty relief and/or higher world oil prices that
together would be equal to $10 per barrel in the price that the producer receives for
produced crude oil.
In the final scenario, entitled “Ample Supplies of CO2,” low-cost, “EOR-ready” CO2
supplies (equal to $0.70 per Mcf) are aggregated from various sources. These
include industrial high-concentration CO2 emissions from hydrogen facilities, gas
processing plants and other sources. These would be augmented, in the longer-
term, from low CO2 concentration industrial sources including combustion and
electric generation plants. Capture of industrial CO2 emissions would be part of
national efforts for reducing greenhouse gas emissions.
JA
F024
113.D
OC
5-15
Ma
rch 20
05
Tabl
e 11.
Econ
omic
Mode
l Est
ablis
hed
by th
e Stu
dy
JA
F024
113.D
OC
5-16
Ma
rch 20
05
Tabl
e 11.
Econ
omic
Mode
l Est
ablis
hed
by th
e Stu
dy (C
ont’d
)
JA
F024
113.D
OC
5-17
Ma
rch 20
05
Tabl
e 11.
Econ
omic
Mode
l Est
ablis
hed
by th
e Stu
dy (C
ont’d
)
JAF024153.DOC 5-1 March 2005
5. STUDY METHODOLOGY
5.1 OVERVIEW. A seven part methodology was used to assess the CO2-EOR
potential of the Gulf Coast’s oil reservoirs. The seven steps were: (1) assembling the
Gulf Coast Major Oil Reservoirs Data Base; (2) screening reservoirs for CO2-EOR; (3)
are candidates for miscible CO2-EOR technology. In addition, the district has 3
reservoirs that could benefit from immiscible CO2-EOR. The potential for economically
developing these oil reservoirs is examined first under Base Case financial criteria that
combine an oil price of $25 per barrel, CO2 supply costs ($1.25/Mcf), and a high risk
rate of return (ROR) hurdle (25% before tax).
Under “Traditional Practices”, with Base Case financial conditions, 2 reservoirs
are economic, providing 66 million barrels of additional oil recovery from Texas/District
3. Applying “State of the Art” technology, involving miscible EOR with high volume CO2
injection and a lower-risk rate of return hurdle of 15% before tax, 26 reservoirs are
economic providing nearly 1,400 million barrels, Table 26.
JAF024154.DOC 6-16 March 2005
Table 26. Economic Oil Recovery Potential Under Base Case Financial Conditions, Texas/District 3.
Original Oil In-Place
Technical Potential
Economic Potential
CO2-EOR Technology
No. of Reservoirs
Studied (MMBbls) (MMBbls) (No. of
Reservoirs) (MMBbls)
“Traditional Practices” 54 12,777 1,019 2 66
“State of Art” Technology 57 13,073 2,316 26 1,378
Improved financial conditions of lower-cost CO2 supplies and risk
mitigation/higher oil prices would significantly increase the economically recoverable oil
volumes in Texas/District 3, particularly when applied with “State of the Art” CO2-EOR
Technology. With the benefit of these two more favorable financial conditions, 2 billion
barrels of additional oil (in 51 major oil reservoirs) would be economically recoverable in
Texas/District 3, Table 27.
Table 27. Economic Oil Recovery Potential with More Favorable Financial Conditions, Texas Railroad District 3
More Favorable Conditions
No. of Economic Reservoirs
Economic Potential (MMBbls)
Plus: Risk Mitigation* 48 2,001
Plus: Low Cost CO2** 51 2,021 * Higher oil price of $35 per barrel, adjusted for market factors ** Reduced CO2 supply costs, to $0.70/Mcf
JAF024207.DOC 7-1 March 2005
7. IMPACT OF STATE RISK SHARING ACTIONS Each of the three states - - Louisiana, Mississippi and Texas - - already provide
some form of risk sharing actions or incentives for enhanced oil recovery. These risk
sharing actions are incorporated into the assessments of economically viable CO2-EOR
projects and volumes set forth in this report.
7.1 LOUISIANA. The Louisiana Revenue Statute Ann. 47:633.4 is effective as
of July, 1984 with no sunset. Its stated goal is:
“To provide an economic incentive to producers to invest in tertiary
recovery projects to enhance Louisiana’s crude oil production, to the
ultimate benefit of the state and the people.”
The provisions of the “Tertiary Recovery Statute” are that no severance tax shall
be due on production from a qualified tertiary recovery project approved by the
Secretary of the Department of Natural Resources until the project has reached payout.
Payout is calculated using investment costs; expenses particular to the tertiary project,
not to include charges attributed to primary and secondary options on that reservoir;
and interest at commercial rates.
The regular state oil severance tax rate in Louisiana is 12.5% of the value of the
produced oil. As such, eliminating the severance tax until payout for CO2-EOR projects
would provide front-end risk sharing equal to $2.73 per barrel of incrementally produced
oil (assuming a sales price of $25 per barrel of oil and a royalty rate of 12.5%).
To the extent that this reduction in state severance taxes stimulates new projects
and incremental oil production that otherwise would not occur, the State of Louisiana
gains substantial new tax revenues.
JAF024207.DOC 7-2 March 2005
7.2 MISSISSIPPI. The Mississippi Code Ann. 27-25-503(i) (1972) is effective as
of April, 1994 with no sunset. Its stated goal is:
“Encourage the use of enhanced recovery methods of production.”
The “Enhanced Oil Recovery Statute” reduces the assessed severance tax rate
to 3% of the value of the oil produced by an enhanced oil recovery method. The original
statute, only covering use of carbon dioxide transported by a pipeline to the oil well, was
expanded to include any other enhanced oil recovery method approved and permitted
by the State Oil and Gas Board on or after April 1, 1994.
The regular state oil severance tax rate in Mississippi is 6% of the value of the
produced oil. Reduction of the severance tax to 3% provides a modest risk sharing
equal to $0.66 per barrel of incrementally produced oil (assuming a sales price of $25
per barrel of oil and a royalty rate of 12.5%).
7.3 TEXAS. The Statewide Rule 50 and the Texas Tax Code Ann. 2(I),
202.054 is effective as of 1989 for new projects and 1991 for expanded projects. (The
statue is due to expire on January 1, 2007). Its stated goals is:
“To encourage additional recovery of the state’s oil reserves through the
use of enhanced oil recovery technology, and to extend the lives of wells
with the resulting benefit to the Texas economy through job creation and
additional severance taxes.”
In the “Enhanced Oil Recovery Statute”, the state severance tax is reduced by
50% (from 4.6% to 2.3%) for oil production from new enhanced oil recovery projects
and incremental production from expanded projects. A two-step Railroad Commission
certification is required. First, the operator must obtain approval and area certification
for the new/expanded project; second, the operator seeks Railroad Commission
certification that the project evidences a positive production response (an increased rate
JAF024207.DOC 7-3 March 2005
of production attributable to the project). The application for positive production
response certification must be filed within five years for a tertiary oil recovery project.
The regular state oil severance tax rate in Texas is 4.6% of the value of the
produced oil. Reduction of the severance tax to 2.3% provides a modest risk sharing
equal to $0.50 per barrel of incrementally produced oil (assuming a sales price of $25
per barrel of oil and a royalty rate of 12.5%).
7.4 POTENTIAL BENEFITS OF RISK SHARING
Risk Sharing for CO2-EOR. Risk and revenue sharing actions stimulate
increased CO2-enhanced oil recovery activity and oil production in four distinct ways:
First, the reduction (or front-end elimination) of the severance tax improves
the rate of return of a CO2-EOR project. This enables a certain number of
projects, that are close to the minimum economic threshold, to cross this
threshold and be placed on a company’s list of potential investments.
Second, the front-end elimination of the severance tax until project payout
significantly reduces economic risk, enabling the project to compete with a
lower risk hurdle rate. An across the board reduction of the severance tax
helps reduce risk by providing additional downside protection against lower
future oil prices.
Third, the reduction or front-end elimination of the severance tax will help
accelerate the selection and implementation of CO2-EOR projects. This
occurs because with a boost in the rate of return the project moves higher on
the list of priority investments.
JAF024207.DOC 7-4 March 2005
Fourth, a reduction (or front-end elimination) of the severance tax will
increase the cash flow and thus the investment capital available for
expanding the approved project and initiating new CO2-EOR projects.
7.5 ESTIMATED IMPACTS OF STATE RISK SHARING FOR CO2-EOR. This
section provides quantitative data on the increase in the number of CO2-EOR projects
and the additional volume of benefits and impacts from the risk sharing actions of
lowering the state severance tax rates in Louisiana, Mississippi and Texas District #3.
Additional impacts could occur due to accelerated and expanded application of CO2-
EOR, as discussed above.
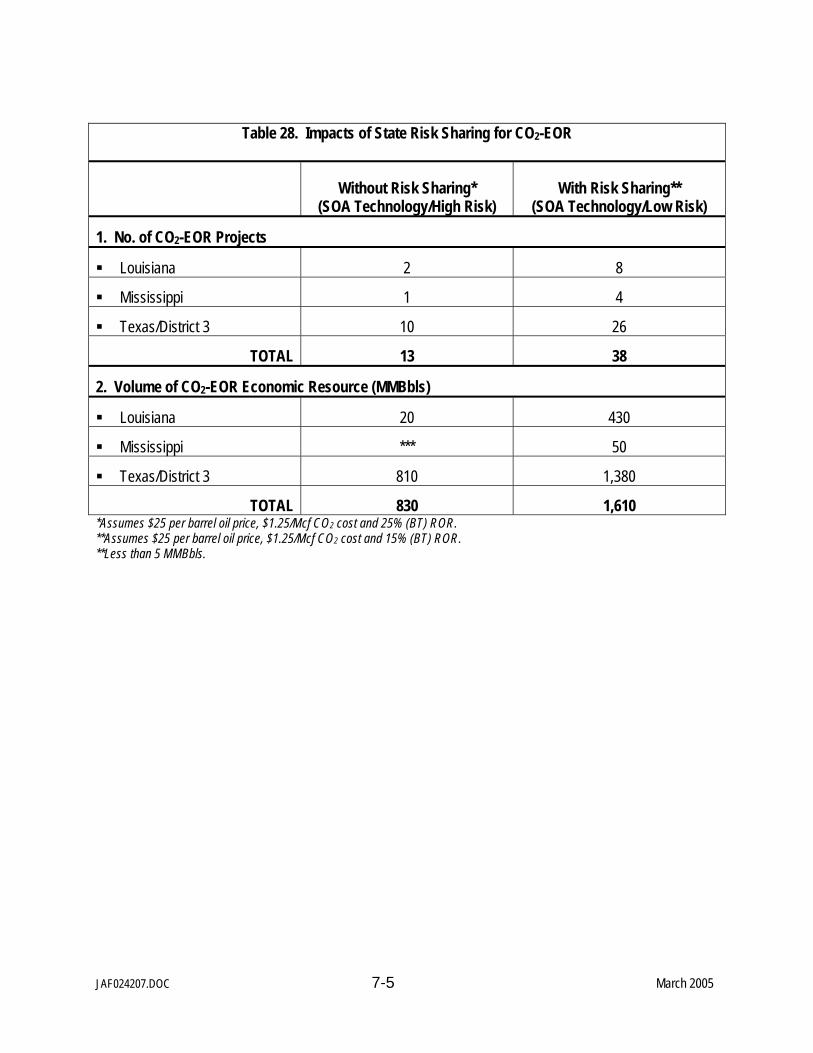
Table 28 tabulates the impacts and benefits from the existing risk sharing action
of reduced state severance taxes. (The analysis assumes $25 per barrel oil, $1.25 per
Mcf for the cost of CO2, a high financial risk hurdle rate without risk sharing and a lower
financial risk hurdle with risk sharing.) The table shows that:
The number of CO2-EOR projects in the Gulf Coast Region increases to 38
with risk sharing from 13 without risk sharing. The largest increase is in
Texas/District 3 with a gain of 16 projects.
The volume of economically recoverable resource from CO2-EOR increases
to 1,610 million barrels with risk sharing from 830 million barrels without risk
sharing. The largest relative increase is in Louisiana where severance tax
front-end elimination, when paired with “state-of-the-art” technology and a
solid oil price, could launch a viable CO2-EOR industry, assuming availability
of affordable CO2 supplies.
JAF024207.DOC 7-5 March 2005
Table 28. Impacts of State Risk Sharing for CO2-EOR
Without Risk Sharing*
(SOA Technology/High Risk) With Risk Sharing**
(SOA Technology/Low Risk)
1. No. of CO2-EOR Projects
Louisiana 2 8
Mississippi 1 4
Texas/District 3 10 26
TOTAL 13 38
2. Volume of CO2-EOR Economic Resource (MMBbls)
Louisiana 20 430
Mississippi *** 50
Texas/District 3 810 1,380
TOTAL 830 1,610 *Assumes $25 per barrel oil price, $1.25/Mcf CO2 cost and 25% (BT) ROR. **Assumes $25 per barrel oil price, $1.25/Mcf CO2 cost and 15% (BT) ROR. **Less than 5 MMBbls.
Appendix A
Using CO2-PROPHET for Estimating Oil Recovery
March 2005
JAF024159.DOC A-1 Appendix A
Model Development
The study utilized the CO2-PROPHET model to calculate the incremental oil
produced by CO2-EOR from the large California oil reservoirs. CO2-PROPHET was
developed by the Texaco Exploration and Production Technology Department (EPTD)
as part of the DOE Class I cost share program. The specific project was “Post
Waterflood CO2 Flood in a Light Oil, Fluvial Dominated Deltaic Reservoir” (DOE
Contract No. DE-FC22-93BC14960). CO2-PROPHET was developed as an alternative
to the DOE’s CO2 miscible flood predictive model, CO2PM.
Input Data Requirements
The input reservoir data for operating CO2-PROPHET are from the Major Oil
Reservoirs Data Base. Default values exist for input fields lacking data. Key reservoir
properties that directly influence oil recovery are:
Residual oil saturation, Dykstra-Parsons coefficient, Oil and water viscosity, Reservoir pressure and temperature, and Minimum miscibility pressure.
A set of three relative permeability curves for water, CO2 and oil are provided (or
can be modified) to ensure proper operation of the model.
Calibrating CO2-PROPHET
The CO2-PROPHET model was calibrated by Advanced Resources with an
industry standard reservoir simulator, GEM. The primary reason for the calibration was
to determine the impact on oil recovery of alternative permeability distributions within a
multi-layer reservoir. A second reason was to better understand how the absence of a
gravity override function in CO2-PROPHET might influence the calculation of oil
recovery. CO2-PROPHET assumes a fining upward permeability structure.
JAF024159.DOC A-2 Appendix A
The San Joaquin Basin‘s Elk Hills (Stevens) reservoir data set was used for the
calibration. The model was run in the miscible CO2-EOR model using one hydrocarbon
pore volume of CO2 injection.
The initial comparison of CO2-PROPHET with GEM was with fining upward and
coarsening upward (opposite of fining upward) permeability cases in GEM. All other
reservoir, fluid and operational specifications were kept the same. As Figure A-1
depicts, the CO2-PROPHET output is bounded by the two GEM reservoir simulation
cases of alternative reservoir permeability structures in an oil reservoir.
A second comparison of CO2-PROPHET and GEM was for randomized
permeability (within the reservoir modeled with multiple layers). The two GEM cases
are High Random, where the highest permeability value is at the top of the reservoir,
and Low Random, where the lowest permeability is at the top of the reservoir. The
permeability values for the other reservoir layers are randomly distributed among the
remaining layers. As Figure A-2 shows, the CO2-PROPHET results are within the
envelope of the two GEM reservoir simulation cases of random reservoir permeability
structures in an oil reservoir.
Based on the calibration, the CO2-PROPHET model seems to internally
compensate for the lack of a gravity override feature and appears to provide an average
calculation of oil recovery, neither overly pessimistic nor overly optimistic. As such,
CO2-PROPHET seems well suited for what it was designed - - providing project scoping
and preliminary results to be verified with more advanced evaluation and simulation
models.
Comparison of CO2-PROPHET and CO2PM
According to the CO2-PROPHET developers, the model performs two main
operations that provide a more robust calculation of oil recovery than available from
Figure A-2. CO2-PROPHET and GEM: Comparison to Random Permeability Cases of GEM
JAF0
2318
.PPT
JAF024159.DOC A-4 Appendix A
CO2-PROPHET generates streamlines for fluid flow between injection and production wells, and
The model then performs oil displacement and recovery calculations along the streamlines. (A finite difference routine is used for the oil displacement calculations.)
Other key features of CO2-PROPHET and its comparison with the technical
capability of CO2PM are also set forth below:
Areal sweep efficiency in CO2-PROPHET is handled by incorporating streamlines that are a function of well spacing, mobility ratio and reservoir heterogeneity, thus eliminating the need for using empirical correlations, as incorporated into CO2PM.
Mixing parameters, as defined by Todd and Longstaff, are used in CO2-PROPHET for simulation of the miscible CO2 process, particularly CO2/oil mixing and the viscous fingering of CO2.
A series of reservoir patterns, including 5 spot, line drive, and inverted 9 spot, among others, are available in CO2-PROPHET, expanding on the 5 spot only reservoir pattern option available in CO2PM.
CO2-PROPHET can simulate a variety of recovery processes, including continuous miscible CO2, WAG miscible CO2 and immiscible CO2, as well as waterflooding. CO2PM is limited to miscible CO2.
Appendix B
Louisiana CO2-EOR Cost Model
March 2005
JAF024156.DOC B-1 Appendix B
Cost Model for CO2-Based Enhanced Oil Recovery (CO2-EOR) This appendix provides documentation for the cost module of the desktop CO2-EOR policy and analytical model (COTWO) developed by Advanced Resources for DOE/FE-HQ. The sections of this cost documentation report are organized according to the normal sequence of estimating the capital and operating expenditures for a CO2-EOR project: 1. Well Drilling and Completion Costs. The costs for well drilling and completion (D&C) are based on the 2001 JAS cost study recently published by API for Louisiana. The well D&C cost equation has a fixed cost constant for site preparation and other fixed cost items and a variable cost equation that increases exponentially with depth. The total equation is: Well D&C Costs = a0Da1 Where: a0 is 0.1626 (South) or 0.6103 (North), depending on location a1 is 1.8228 (South) or 1.5459 (North), depending on location D is well depth Figure B-1a and Figure B-1b provides the details for the cost equation and illustrates the “goodness of fit” for the well D&C cost equation for Louisiana.
y = 0.1626x1.8228
R2 = 0.9717
0
500,000
1,000,000
1,500,000
2,000,000
2,500,000
3,000,000
3,500,000
4,000,000
4,500,000
0 2,000 4,000 6,000 8,000 10,000 12,000
Depth, ft
Tota
l Dril
ling
Cos
t, US
$
2001 API CostsPower (2001 API Costs)
Figure B-1a – Oil Well D&C Costs for South Louisiana
JAF02333.PPT
JAF024156.DOC B-2 Appendix B
Lease Equipment Costs for New Producing Wells. The costs for equipping a new oil production well are based on data reported by the EIA in their 2002 EIA “Cost and Indices for Domestic Oil and Gas Field Equipment and Production Operations” report. This survey provides estimated lease equipment costs for 10 wells producing with artificial lift, from depths ranging from 2,000 to 12,000 feet, into a central tank battery.
The equation contains a fixed cost constant for common cost items, such as free water knock-out, water disposal and electrification, and a variable cost component to capture depth-related costs such as for pumping equipment. The total equation is:
Production Well Equipping Costs = c0 + c1D Where: co = $81,711 (fixed) c1 = $5.02 per foot D is well depth Figure B-2 illustrates the application of the lease equipping cost equation for a
new oil production well as a function of depth.
y = 0.6103x1.5459
R2 = 0.9969
0
200,000
400,000
600,000
800,000
1,000,000
1,200,000
0 2,000 4,000 6,000 8,000 10,000 12,000
Depth, ft
Tota
l Dril
ling
Cos
t, US
$
2001 API CostsPower (2001 API Costs)
Figure B-1b – Oil Well D&C Costs for North Louisiana
JAF02333.PPT
JAF024156.DOC B-3 Appendix B
3. Lease Equipment Costs for New Injection Wells. The costs for equipping a new injection well in Louisiana include gathering lines, a header, electrical service as well as a water pumping system. The costs are estimated from the EIA Cost and Indices Report.
Equipment costs include a fixed cost component and a depth-related cost component, which varies based on surface pressure requirements. The equation for Louisiana is:
Injection Well Equipping Costs = c0 + c1D Where: co = $14,036 (fixed)
c1 = $16.35 per foot D is well depth
Figure B-3 illustrates the application of the lease equipping cost equation for a new injection well as a function of depth for West Texas. The West Texas cost data for lease equipment provides the foundation for the Louisiana cost equation.
Figure B-2 – Lease Equipping Cost for a New Oil Production Well in South Louisiana vs. Depth
y = 5.0194x + 81711R2 = 0.996
0
20,000
40,000
60,000
80,000
100,000
120,000
140,000
160,000
180,000
200,000
0 2,000 4,000 6,000 8,000 10,000 12,000 14,000
Depth, ft
Tota
l Cos
ts, U
S$
JAF0
2333
.PPT
JAF024156.DOC B-4 Appendix B
4. Converting Existing Production Wells into Injection Wells. The conversion of existing oil production wells into CO2 and water injection wells requires replacing the tubing string and adding distribution lines and headers. The costs assume that all surface equipment necessary for water injection are already in place on the lease.
The existing well conversion costs include a fixed cost component and a depth-related cost component, which varies based on the required surface pressure and tubing length. The equation for Louisiana is:
Well Conversion Costs = c0 + c1D Where: co = $16,651 (fixed)
c1 = $4.19 per foot D is well depth
Figure B-4 illustrates the average cost of converting an existing producer into an injection well for West Texas. The West Texas cost data for converting wells provide the foundation for the Louisiana cost equation.
W TX 1.00 1.00 8,246 14.19 CA 0.85 1.94 7,002 27.50 RM 1.24 0.95 10,189 13.49 S TX 1.48 1.23 12,194 17.42 LA 1.70 1.15 14,036 16.35 OK 1.13 1.16 9,357 16.44
Ratio to W. TX
Figure B-3 – Lease Equipping Costs for a New Injection Well in West Texas vs. Depth
JAF02333.PPT
JAF024156.DOC B-5 Appendix B
5. Costs of Reworking an Existing Waterflood Production or Injection Well for CO2-EOR (First Rework). The reworking of existing oil production or CO2-EOR injection wells requires pulling and replacing the tubing string and pumping equipment. The well reworking costs are depth-dependent. The equation for Louisiana is:
Well Rework Costs = c1D Where: c1 = $16.77 per foot)
D is well depth Figure B-5 illustrates the average cost of well conversion as a function of depth for West Texas. The West Texas cost data for reworking wells provides the foundation for the Louisiana cost equation.
Figure B-4 – Cost of Converting Existing Production Wells into Injection Wells in West Texas vs. Depth
US$ US$/ftW TX 1.00 1.00 9,782 3.64 CA 0.85 1.94 8,307 7.05 RM 1.24 0.95 12,088 3.46 S TX 1.48 1.23 14,466 4.46 LA 1.70 1.15 16,651 4.19 OK 1.13 1.16 11,101 4.21
Ratio to W. TX
JAF02333.PPT
JAF024156.DOC B-6 Appendix B
6. Annual O&M Costs, Including Periodic Well Workovers. The EIA Cost and Indices report provides secondary operating and maintenance (O&M) costs only for West Texas. As such, West Texas and Louisiana primary oil production O&M costs (Figure B-6) are used to estimate Louisiana secondary recovery O&M costs. Linear trends are used to identify fixed cost constants and variable cost constants for each region, Table B-1.
Figure B-5 – Cost of an Existing Waterflood Production or Injection Well for CO2-EOR in West Texas vs. Depth
y = 14.549xR2 = 0.9607
0
20,000
40,000
60,000
80,000
100,000
120,000
140,000
0 1000 2000 3000 4000 5000 6000 7000 8000 9000
Depth, ft
Cos
ts, U
S$ReworkLinear (Rework)
Basin co c1 co c1US$ US$/ft
W TX 1.00 1.00 0 14.55 CA 0.85 1.94 0 28.20 RM 1.24 0.95 0 13.84 S TX 1.48 1.23 0 17.87 LA 1.70 1.15 0 16.77 OK 1.13 1.16 0 16.87
Ratio to W. TX
JAF02333.PPT
y = 3.8941x + 6903.6R2 = 0.9936
y = 2.3158x + 13839R2 = 0.9632
y = 2.0089x + 8129.7R2 = 0.9543
y = 2.3287x + 9225.8R2 = 0.9708
y = 2.4669x + 12023R2 = 0.9525
y = 1.9109x + 10046R2 = 0.9808
0
10,000
20,000
30,000
40,000
50,000
60,000
0 2,000 4,000 6,000 8,000 10,000 12,000 14,000
Depth, ft
Tota
l Cos
ts, U
S$ p
er Y
ear
California OklahomaSouth Louisiana South TexasWest Texas Rocky MountainsLinear (California) Linear (South Louisiana)Linear (West Texas) Linear (Oklahoma)Linear (South Texas) Linear (Rocky Mountains)
Figure B-6 – Annual Lease O&M Costs for Primary Oil Production by AreaJA
F023
33.P
PT
JAF024156.DOC B-7 Appendix B
To account for the O&M cost differences between waterflooding and CO2-EOR,
two adjustments are made to the EIA’s reported O&M costs for secondary recovery. Workover costs, reported as surface and subsurface maintenance, are doubled to reflect the need for more frequent remedial well work in CO2-EOR projects. Liquid lifting are subtracted from annual waterflood O&M costs to allow for the more rigorous accounting of liquid lifting volumes and costs for CO2-EOR. (Liquid lifting costs for CO2-EOR are discussed in a later section of this appendix.) Figure B-7 shows the depth-relationship for CO2-EOR O&M costs in West Texas. These costs were adjusted to develop O&M for Louisiana, shown in the inset of Figure B-7. The equation for Louisiana is:
7. CO2 Recycle Plant Investment Cost. Operation of CO2-EOR requires a recycling plant to capture and reinject the produced CO2. The size of the recycle plant is based on peak CO2 production and recycle requirements.
The cost of the recycling plant is set at $700,000 per MMcfd of CO2 capacity. As such, small CO2-EOR project in the Tokio formation of the Haynesville field, with 14 MMcfd of CO2 reinjection, will require a recycling plant costing $9.5 million. A large project in the Delhi field, with 177 MMcfd of peak CO2 reinjection and 112 injectors, requires a recycling plant costing $124 million.
Table B-1 – Regional Lease O&M Costs and Their Relationship to West Texas
JAF02333.PPT
JAF024156.DOC B-8 Appendix B
The model has three options for installing a CO2 recycling plant. The default
setting costs the entire plant one year prior to CO2 breakthrough. The second option places the full CO2 recycle plant cost at the beginning of the project (Year 0). The third option installs the CO2 recycle plant in stages. In this case, half the plant is built (and half the cost is incurred) in the year of CO2 breakthrough. The second half of the plant is built when maximum recycle capacity requirements are reached. 8. Other COTWO Model Costs. a. CO2 Recycle O&M Costs. The O&M costs of CO2 recycling are indexed to energy costs and set at 1% of the oil price ($0.25 per Mcf @ $25 Bbl oil). b. Lifting Costs. Liquid (oil and water) lifting costs are calculated on total liquid production and costed at $0.25 per barrel. This cost includes liquid lifting, transportation and re-injection. c. CO2 Distribution Costs. The CO2 distribution system is similar to the gathering systems used for natural gas. A distribution “hub” is constructed with smaller pipelines delivering purchased CO2 to the project site.
The distribution pipeline cost is dependent on the injection requirements for the project. The fixed component is $150,000. The variable cost component accounts for increasing piping diameters associated with increasing CO2 injection requirements. These range from $80,000 per mile for 4” pipe (CO2 rate less than 15MMcfd), $120,000 per mile for 6” pipe (CO2 rate of 15 to 35 MMcfd), $160,000 per mile for 8” pipe (CO2
Figure B-7 – Annual CO2-EOR O&M Costs for West Texas
W TX 1.00 1.00 18,700 7.39 CA 0.85 1.94 15,880 14.33 RM 1.24 0.95 23,108 7.03 S TX 1.48 1.23 27,655 9.08 LA 1.70 1.15 31,833 8.52 OK 1.13 1.16 21,221 8.57
Ratio to W. TX
JAF02333.PPT
JAF024156.DOC B-9 Appendix B
rate of 35 to 60 MMcfd), and $200,000 per mile for pipe greater than 8” diameter (CO2 rate greater than 60 MMcfd). Aside from the injection volume, cost also depend on the distance from the CO2 “hub” (transfer point) to the oil field. Currently, the distance is set at 10 miles.
The CO2 distribution cost equation for Louisiana is: Pipeline Construction Costs = $150,000 + CD*Distance Where: CD is the cost per mile of the necessary pipe diameter (from the CO2
injection rate) Distance = 10.0 miles
d. G&A Costs. General and administrative (G&A) costs of 20% are added to well O&M and lifting costs.
e. Royalties. Royalty payments are assumed to be 12.5%.
f. Production Taxes. Severance and ad valorum taxes are set at 5.0% and 2.5%, respectively, for a total production tax of 7.5% on the oil production stream. Production taxes are taken following royalty payments.
g. Crude Oil Price Differential. To account for market and oil quality (gravity) differences on the realized oil price, the cost model incorporated the current basis differential for Louisiana (-$0.60 per barrel) and the current gravity differential (-$0.25 per oAPI, from a basis of 40 oAPI) into the average wellhead oil price realized by each oil reservoir. The equation for Louisiana is:
Wellhead Oil Price = Oil Price + (-$0.60) – [$0.25*(40 - oAPI)] Where: Oil Price is the marker oil price (West Texas intermediate)
oAPI is oil gravity If the oil gravity is less than 40 oAPI, the wellhead oil price is reduced; if the oil gravity is greater than 40 oAPI, the wellhead oil price is increased. In addition, some fields within Louisiana contain very light oil (>45 API). In order to keep the economics of these fields level with the rest of the fields, we imposed a ceiling of 45 API for all fields with lighter oil when applying the Crude Oil Price Differential.
Appendix C
Mississippi CO2-EOR Cost Model
March 2005
JAF024157.DOC C-1 Appendix C
Cost Model for CO2-Based Enhanced Oil Recovery (CO2-EOR) This appendix provides documentation for the cost module of the desktop CO2-EOR policy and analytical model (COTWO) developed by Advanced Resources for DOE/FE-HQ. The sections of this cost documentation report are organized according to the normal sequence of estimating the capital and operating expenditures for a CO2-EOR project: 1. Well Drilling and Completion Costs. The costs for well drilling and completion (D&C) are based on the 2001 JAS cost study recently published by API for Mississippi. The well D&C cost equation has a fixed cost constant for site preparation and other fixed cost items and a variable cost equation that increases exponentially with depth. The total equation is: Well D&C Costs = a0Da1 Where: a0 is 0.0193 a1 is 1.9375 D is well depth Figure C-1 provides the details for the cost equation and illustrates the “goodness of fit” for the well D&C cost equation for Mississippi.
2. Lease Equipment Costs for New Producing Wells. The costs for equipping a new oil production well are based on data reported by the EIA in their 2002 EIA “Cost and Indices for Domestic Oil and Gas Field Equipment and Production Operations” report. This survey provides estimated lease equipment costs for 10 wells producing with artificial lift, from depths ranging from 2,000 to 12,000 feet, into a central tank battery.
The equation contains a fixed cost constant for common cost items, such as free water knock-out, water disposal and electrification, and a variable cost component to capture depth-related costs such as for pumping equipment. The total equation is:
Production Well Equipping Costs = c0 + c1D Where: co = $81,711 (fixed) c1 = $5.02 per foot D is well depth Figure C-2 illustrates the application of the lease equipping cost equation for a
new oil production well as a function of depth. 3. Lease Equipment Costs for New Injection Wells. The costs for equipping a new injection well in Mississippi include gathering lines, a header, electrical service as well as a water pumping system. The costs are estimated from the EIA Cost and Indices Report.
Figure C-2 – Lease Equipping Cost for a New Oil Production Well in Mississippi vs. Depth
y = 5.0194x + 81711R2 = 0.996
0
20,000
40,000
60,000
80,000
100,000
120,000
140,000
160,000
180,000
200,000
0 2,000 4,000 6,000 8,000 10,000 12,000 14,000
Depth, ft
Tota
l Cos
ts, U
S$
JAF0
2333
.PPT
JAF024157.DOC C-3 Appendix C
Equipment costs include a fixed cost component and a depth-related cost
component, which varies based on surface pressure requirements. The equation for Mississippi is:
Injection Well Equipping Costs = c0 + c1D Where: co = $14,036 (fixed)
c1 = $16.35 per foot D is well depth
Figure C-3 illustrates the application of the lease equipping cost equation for a new injection well as a function of depth for West Texas. The West Texas cost data for lease equipment provides the foundation for the Mississippi cost equation.
Figure C-3 – Lease Equipping Costs for a New Injection Well in West Texas vs. Depth
Basin co c1 co c1US$ US$/ft
W TX 1.00 1.00 8,246 14.19 CA 0.85 1.94 7,002 27.50 RM 1.24 0.95 10,189 13.49 S TX 1.48 1.23 12,194 17.42 MS 1.70 1.15 14,036 16.35 OK 1.13 1.16 9,357 16.44
Ratio to W. TX
JAF02333.PPT
JAF024157.DOC C-4 Appendix C
4. Converting Existing Production Wells into Injection Wells. The conversion of existing oil production wells into CO2 and water injection wells requires replacing the tubing string and adding distribution lines and headers. The costs assume that all surface equipment necessary for water injection are already in place on the lease.
The existing well conversion costs include a fixed cost component and a depth-related cost component, which varies based on the required surface pressure and tubing length. The equation for Mississippi is:
Well Conversion Costs = c0 + c1D Where: co = $16,651 (fixed)
c1 = $4.19 per foot D is well depth
Figure C-4 illustrates the average cost of converting an existing producer into an injection well for West Texas. The West Texas cost data for converting wells provide the foundation for the Mississippi cost equation.
Figure C-4 – Cost of Converting Existing Production Wells into Injection Wells in West Texas vs. Depth
US$ US$/ftW TX 1.00 1.00 9,782 3.64 CA 0.85 1.94 8,307 7.05 RM 1.24 0.95 12,088 3.46 S TX 1.48 1.23 14,466 4.46 MS 1.70 1.15 16,651 4.19 OK 1.13 1.16 11,101 4.21
Ratio to W. TX
JAF02333.PPT
JAF024157.DOC C-5 Appendix C
5. Costs of Reworking an Existing Waterflood Production or Injection Well for CO2-EOR (First Rework). The reworking of existing oil production or CO2-EOR injection wells requires pulling and replacing the tubing string and pumping equipment. The well reworking costs are depth-dependent. The equation for Mississippi is:
Well Rework Costs = c1D Where: c1 = $16.77 per foot)
D is well depth Figure C-5 illustrates the average cost of well conversion as a function of depth for West Texas. The West Texas cost data for reworking wells provides the foundation for the Mississippi cost equation. 6. Annual O&M Costs, Including Periodic Well Workovers. The EIA Cost and Indices report provides secondary operating and maintenance (O&M) costs only for West Texas. As such, West Texas and Mississippi primary oil production O&M costs (Figure C-6) are used to estimate Mississippi secondary recovery O&M costs. Linear trends are used to identify fixed cost constants and variable cost constants for each region, Table C-1.
Figure C-5 – Cost of an Existing Waterflood Production or Injection Well for CO2-EOR in West Texas vs. Depth
y = 14.549xR2 = 0.9607
0
20,000
40,000
60,000
80,000
100,000
120,000
140,000
0 1000 2000 3000 4000 5000 6000 7000 8000 9000
Depth, ft
Cos
ts, U
S$
ReworkLinear (Rework)
Basin co c1 co c1US$ US$/ft
W TX 1.00 1.00 0 14.55 CA 0.85 1.94 0 28.20 RM 1.24 0.95 0 13.84 S TX 1.48 1.23 0 17.87 MS 1.70 1.15 0 16.77 OK 1.13 1.16 0 16.87
Ratio to W. TX
JAF02333.PPT
JAF024157.DOC C-6 Appendix C
To account for the O&M cost differences between waterflooding and CO2-EOR,
two adjustments are made to the EIA’s reported O&M costs for secondary recovery. Workover costs, reported as surface and subsurface maintenance, are doubled to reflect the need for more frequent remedial well work in CO2-EOR projects. Liquid lifting are subtracted from annual waterflood O&M costs to allow for the more rigorous accounting of liquid lifting volumes and costs for CO2-EOR. (Liquid lifting costs for CO2-EOR are discussed in a later section of this appendix.)
y = 3.8941x + 6903.6R2 = 0.9936
y = 2.3158x + 13839R2 = 0.9632
y = 2.0089x + 8129.7R2 = 0.9543
y = 2.3287x + 9225.8R2 = 0.9708
y = 2.4669x + 12023R2 = 0.9525
y = 1.9109x + 10046R2 = 0.9808
0
10,000
20,000
30,000
40,000
50,000
60,000
0 2,000 4,000 6,000 8,000 10,000 12,000 14,000
Depth, ft
Tota
l Cos
ts, U
S$ p
er Y
ear
California OklahomaSouth Louisiana South TexasWest Texas Rocky MountainsLinear (California) Linear (South Louisiana)Linear (West Texas) Linear (Oklahoma)Linear (South Texas) Linear (Rocky Mountains)
Figure C-6 – Annual Lease O&M Costs for Primary Oil Production by Area
JAF0
2333
.PPT
Table C-1 – Regional Lease O&M Costs and Their Relationship to West Texas
Figure C-7 shows the depth-relationship for CO2-EOR O&M costs in West Texas. These costs were adjusted to develop O&M for Mississippi, shown in the inset of Figure C-7. The equation for Mississippi is:
7. CO2 Recycle Plant Investment Cost. Operation of CO2-EOR requires a recycling plant to capture and reinject the produced CO2. The size of the recycle plant is based on peak CO2 production and recycle requirements.
The cost of the recycling plant is set at $700,000 per MMcfd of CO2 capacity. As such, small CO2-EOR project in the Christmas formation of the West Heidelberg field, with 11 MMcfd of CO2 reinjection, will require a recycling plant costing $7.7 million. A large project in the Lower Tuscaloosa formation of the Little Creek field, with 127 MMcfd of peak CO2 reinjection and 119 injectors, requires a recycling plant costing $89 million.
Figure C-7 – Annual CO2-EORO&M Costs for West Texas
W TX 1.00 1.00 18,700 7.39 CA 0.85 1.94 15,880 14.33 RM 1.24 0.95 23,108 7.03 S TX 1.48 1.23 27,655 9.08 MS 1.70 1.15 31,833 8.52 OK 1.13 1.16 21,221 8.57
Ratio to W. TX
JAF02333.PPT
JAF024157.DOC C-8 Appendix C
The model has three options for installing a CO2 recycling plant. The default setting costs the entire plant one year prior to CO2 breakthrough. The second option places the full CO2 recycle plant cost at the beginning of the project (Year 0). The third option installs the CO2 recycle plant in stages. In this case, half the plant is built (and half the cost is incurred) in the year of CO2 breakthrough. The second half of the plant is built when maximum recycle capacity requirements are reached. 8. Other COTWO Model Costs. a. CO2 Recycle O&M Costs. The O&M costs of CO2 recycling are indexed to energy costs and set at 1% of the oil price ($0.25 per Mcf @ $25 Bbl oil). b. Lifting Costs. Liquid (oil and water) lifting costs are calculated on total liquid production and costed at $0.25 per barrel. This cost includes liquid lifting, transportation and re-injection. c. CO2 Distribution Costs. The CO2 distribution system is similar to the gathering systems used for natural gas. A distribution “hub” is constructed with smaller pipelines delivering purchased CO2 to the project site.
The distribution pipeline cost is dependent on the injection requirements for the project. The fixed component is $150,000. The variable cost component accounts for increasing piping diameters associated with increasing CO2 injection requirements. These range from $80,000 per mile for 4” pipe (CO2 rate less than 15MMcfd), $120,000 per mile for 6” pipe (CO2 rate of 15 to 35 MMcfd), $160,000 per mile for 8” pipe (CO2 rate of 35 to 60 MMcfd), and $200,000 per mile for pipe greater than 8” diameter (CO2 rate greater than 60 MMcfd). Aside from the injection volume, cost also depend on the distance from the CO2 “hub” (transfer point) to the oil field. Currently, the distance is set at 10 miles.
The CO2 distribution cost equation for Mississippi is: Pipeline Construction Costs = $150,000 + CD*Distance Where: CD is the cost per mile of the necessary pipe diameter (from the CO2
injection rate) Distance = 10.0 miles
d. G&A Costs. General and administrative (G&A) costs of 20% are added to well O&M and lifting costs.
e. Royalties. Royalty payments are assumed to be 12.5%.
f. Production Taxes. Severance and ad valorum taxes are set at 5.0% and 2.5%, respectively, for a total production tax of 7.5% on the oil production stream. Production taxes are taken following royalty payments.
JAF024157.DOC C-9 Appendix C
g. Crude Oil Price Differential. To account for market and oil quality (gravity) differences on the realized oil price, the cost model incorporated the current basis differential for Mississippi ($0.00 per barrel) and the current gravity differential (-$0.25 per oAPI, from a basis of 40 oAPI) into the average wellhead oil price realized by each oil reservoir. The equation for Mississippi is:
Wellhead Oil Price = Oil Price + ($0.00) – [$0.25*(40 - oAPI)] Where: Oil Price is the marker oil price (West Texas intermediate)
oAPI is oil gravity If the oil gravity is less than 40 oAPI, the wellhead oil price is reduced; if the oil gravity is greater than 40 oAPI, the wellhead oil price is increased. In addition, some fields within Mississippi contain very light oil (>45 API). In order to keep the economics of these fields level with the rest of the fields, we imposed a ceiling of 45 API for all fields with lighter oil when applying the Crude Oil Price Differential.
Appendix D
Texas Railroad District 3 CO2-EOR Cost Model
March 2005
JAF024158.DOC D-1 Appendix D
Cost Model for CO2-Based Enhanced Oil Recovery (CO2-EOR) This appendix provides documentation for the cost module of the desktop CO2-EOR policy and analytical model (COTWO) developed by Advanced Resources for DOE/FE-HQ. The sections of this cost documentation report are organized according to the normal sequence of estimating the capital and operating expenditures for a CO2-EOR project: 1. Well Drilling and Completion Costs. The costs for well drilling and completion (D&C) are based on the 2001 JAS cost study recently published by API for Texas Railroad District 3. The well D&C cost equation has a fixed cost constant for site preparation and other fixed cost items and a variable cost equation that increases exponentially with depth. The total equation is: Well D&C Costs = a0Da1 Where: a0 is 5.0257 a1 is 1.3184 D is well depth Figure D-1 provides the details for the cost equation and illustrates the “goodness of fit” for the well D&C cost equation for Mississippi.
Figure D-1 – Oil Well D&C Costs for Texas Railroad District 3
JAF02333.PPT
JAF024158.DOC D-2 Appendix D
2. Lease Equipment Costs for New Producing Wells. The costs for equipping a new oil production well are based on data reported by the EIA in their 2002 EIA “Cost and Indices for Domestic Oil and Gas Field Equipment and Production Operations” report. This survey provides estimated lease equipment costs for 10 wells producing with artificial lift, from depths ranging from 2,000 to 12,000 feet, into a central tank battery.
The equation contains a fixed cost constant for common cost items, such as free water knock-out, water disposal and electrification, and a variable cost component to capture depth-related costs such as for pumping equipment. The total equation is:
Production Well Equipping Costs = c0 + c1D Where: co = $75,010 (fixed) c1 = $4.53 per foot D is well depth Figure D-2 illustrates the application of the lease equipping cost equation for a
new oil production well as a function of depth. Figure D-2 – Lease Equipping Cost for a New Oil Production Well
in South Texas vs. Depth
y = 4.5331x + 75010R2 = 0.9959
0
20,000
40,000
60,000
80,000
100,000
120,000
140,000
160,000
180,000
200,000
0 2,000 4,000 6,000 8,000 10,000 12,000 14,000
Depth, ft
Tota
l Cos
ts, U
S$
JAF0
2333
.PPT
JAF024158.DOC D-3 Appendix D
3. Lease Equipment Costs for New Injection Wells. The costs for equipping a new injection well in Texas Railroad District 3 include gathering lines, a header, electrical service as well as a water pumping system. The costs are estimated from the EIA Cost and Indices Report.
Equipment costs include a fixed cost component and a depth-related cost component, which varies based on surface pressure requirements. The equation for Texas Railroad District 3 is:
Injection Well Equipping Costs = c0 + c1D Where: co = $12,194 (fixed)
c1 = $17.42 per foot D is well depth
Figure D-3 illustrates the application of the lease equipping cost equation for a new injection well as a function of depth for West Texas. The West Texas cost data for lease equipment provides the foundation for the Texas Railroad District 3 cost equation.
Figure D-3 – Lease Equipping Costs for a New Injection Well in West Texas vs. Depth
Basin co c1 co c1US$ US$/ft
W TX 1.00 1.00 8,246 14.19 CA 0.85 1.94 7,002 27.50 RM 1.24 0.95 10,189 13.49 S TX 1.48 1.23 12,194 17.42 LA 1.70 1.15 14,036 16.35 OK 1.13 1.16 9,357 16.44
Ratio to W. TX
JAF02333.PPT
JAF024158.DOC D-4 Appendix D
4. Converting Existing Production Wells into Injection Wells. The conversion of existing oil production wells into CO2 and water injection wells requires replacing the tubing string and adding distribution lines and headers. The costs assume that all surface equipment necessary for water injection are already in place on the lease.
The existing well conversion costs include a fixed cost component and a depth-related cost component, which varies based on the required surface pressure and tubing length. The equation for Texas Railroad District 3 is:
Well Conversion Costs = c0 + c1D Where: co = $14,466 (fixed)
c1 = $4.46 per foot D is well depth
Figure D-4 illustrates the average cost of converting an existing producer into an injection well for West Texas. The West Texas cost data for converting wells provide the foundation for the Texas Railroad District 3 cost equation. Figure D-4 – Cost of Converting Existing Production Wells into
US$ US$/ftW TX 1.00 1.00 9,782 3.64 CA 0.85 1.94 8,307 7.05 RM 1.24 0.95 12,088 3.46 S TX 1.48 1.23 14,466 4.46 LA 1.70 1.15 16,651 4.19 OK 1.13 1.16 11,101 4.21
Ratio to W. TX
JAF02333.PPT
JAF024158.DOC D-5 Appendix D
5. Costs of Reworking an Existing Waterflood Production or Injection Well for CO2-EOR (First Rework). The reworking of existing oil production or CO2-EOR injection wells requires pulling and replacing the tubing string and pumping equipment. The well reworking costs are depth-dependent. The equation for Texas Railroad District 3 is:
Well Rework Costs = c1D Where: c1 = $17.87 per foot)
D is well depth Figure D-5 illustrates the average cost of well conversion as a function of depth for West Texas. The West Texas cost data for reworking wells provides the foundation for the Texas Railroad District 3 cost equation.
Figure D-5 – Cost of an Existing Waterflood Production or Injection Well for CO2-EOR in West Texas vs. Depth
y = 14.549xR2 = 0.9607
0
20,000
40,000
60,000
80,000
100,000
120,000
140,000
0 1000 2000 3000 4000 5000 6000 7000 8000 9000
Depth, ft
Cos
ts, U
S$
ReworkLinear (Rework)
Basin co c1 co c1US$ US$/ft
W TX 1.00 1.00 0 14.55 CA 0.85 1.94 0 28.20 RM 1.24 0.95 0 13.84 S TX 1.48 1.23 0 17.87 LA 1.70 1.15 0 16.77 OK 1.13 1.16 0 16.87
Ratio to W. TX
JAF02333.PPT
JAF024158.DOC D-6 Appendix D
6. Annual O&M Costs, Including Periodic Well Workovers. The EIA Cost and Indices report provides secondary operating and maintenance (O&M) costs only for West Texas. As such, West Texas and Texas Railroad District 3 primary oil production O&M costs (Figure D-6) are used to estimate Texas Railroad District 3 secondary recovery O&M costs. Linear trends are used to identify fixed cost constants and variable cost constants for each region, Table D-1.
y = 3.8941x + 6903.6R2 = 0.9936
y = 2.3158x + 13839R2 = 0.9632
y = 2.0089x + 8129.7R2 = 0.9543
y = 2.3287x + 9225.8R2 = 0.9708
y = 2.4669x + 12023R2 = 0.9525
y = 1.9109x + 10046R2 = 0.9808
0
10,000
20,000
30,000
40,000
50,000
60,000
0 2,000 4,000 6,000 8,000 10,000 12,000 14,000
Depth, ft
Tota
l Cos
ts, U
S$ p
er Y
ear
California OklahomaSouth Louisiana South TexasWest Texas Rocky MountainsLinear (California) Linear (South Louisiana)Linear (West Texas) Linear (Oklahoma)Linear (South Texas) Linear (Rocky Mountains)
Figure D-6 – Annual Lease O&M Costs for Primary Oil Production by Area
JAF0
2333
.PPT
Table D-1 – Regional Lease O&M Costs and Their Relationship to West Texas
To account for the O&M cost differences between waterflooding and CO2-EOR, two adjustments are made to the EIA’s reported O&M costs for secondary recovery. Workover costs, reported as surface and subsurface maintenance, are doubled to reflect the need for more frequent remedial well work in CO2-EOR projects. Liquid lifting are subtracted from annual waterflood O&M costs to allow for the more rigorous accounting of liquid lifting volumes and costs for CO2-EOR. (Liquid lifting costs for CO2-EOR are discussed in a later section of this appendix.) Figure D-7 shows the depth-relationship for CO2-EOR O&M costs in West Texas. These costs were adjusted to develop O&M for Texas Railroad District 3, shown in the inset of Figure D-7. The equation for Texas Railroad District 3 is:
W TX 1.00 1.00 18,700 7.39 CA 0.85 1.94 15,880 14.33 RM 1.24 0.95 23,108 7.03 S TX 1.48 1.23 27,655 9.08 LA 1.70 1.15 31,833 8.52 OK 1.13 1.16 21,221 8.57
Ratio to W. TX
JAF02333.PPT
JAF024158.DOC D-8 Appendix D
7. CO2 Recycle Plant Investment Cost. Operation of CO2-EOR requires a recycling plant to capture and reinject the produced CO2. The size of the recycle plant is based on peak CO2 production and recycle requirements.
The cost of the recycling plant is set at $700,000 per MMcfd of CO2 capacity. As such, small CO2-EOR project in the Frio 12 formation of the Trinity Bay field, with 29 MMcfd of CO2 reinjection, will require a recycling plant costing $20.2 million. A large project in the Thompson field, with 376 MMcfd of peak CO2 reinjection and 241 injectors, requires a recycling plant costing $263 million.
The model has three options for installing a CO2 recycling plant. The default
setting costs the entire plant one year prior to CO2 breakthrough. The second option places the full CO2 recycle plant cost at the beginning of the project (Year 0). The third option installs the CO2 recycle plant in stages. In this case, half the plant is built (and half the cost is incurred) in the year of CO2 breakthrough. The second half of the plant is built when maximum recycle capacity requirements are reached. 8. Other COTWO Model Costs. a. CO2 Recycle O&M Costs. The O&M costs of CO2 recycling are indexed to energy costs and set at 1% of the oil price ($0.25 per Mcf @ $25 Bbl oil). b. Lifting Costs. Liquid (oil and water) lifting costs are calculated on total liquid production and costed at $0.25 per barrel. This cost includes liquid lifting, transportation and re-injection. c. CO2 Distribution Costs. The CO2 distribution system is similar to the gathering systems used for natural gas. A distribution “hub” is constructed with smaller pipelines delivering purchased CO2 to the project site.
The distribution pipeline cost is dependent on the injection requirements for the project. The fixed component is $150,000. The variable cost component accounts for increasing piping diameters associated with increasing CO2 injection requirements. These range from $80,000 per mile for 4” pipe (CO2 rate less than 15MMcfd), $120,000 per mile for 6” pipe (CO2 rate of 15 to 35 MMcfd), $160,000 per mile for 8” pipe (CO2 rate of 35 to 60 MMcfd), and $200,000 per mile for pipe greater than 8” diameter (CO2 rate greater than 60 MMcfd). Aside from the injection volume, cost also depend on the distance from the CO2 “hub” (transfer point) to the oil field. Currently, the distance is set at 10 miles.
The CO2 distribution cost equation for South Texas is: Pipeline Construction Costs = $150,000 + CD*Distance Where: CD is the cost per mile of the necessary pipe diameter (from the CO2
injection rate) Distance = 10.0 miles
JAF024158.DOC D-9 Appendix D
d. G&A Costs. General and administrative (G&A) costs of 20% are added to well O&M and lifting costs.
e. Royalties. Royalty payments are assumed to be 12.5%.
f. Production Taxes. Severance and ad valorum taxes are set at 5.0% and 2.5%, respectively, for a total production tax of 7.5% on the oil production stream. Production taxes are taken following royalty payments.
g. Crude Oil Price Differential. To account for market and oil quality (gravity) differences on the realized oil price, the cost model incorporated the current basis differential for Texas Railroad District 3 ($3.60 per barrel) and the current gravity differential (-$0.25 per oAPI, from a basis of 40 oAPI) into the average wellhead oil price realized by each oil reservoir. The equation for Texas Railroad District 3 is:
Wellhead Oil Price = Oil Price + ($3.60) – [$0.25*(40 - oAPI)] Where: Oil Price is the marker oil price (West Texas intermediate)
oAPI is oil gravity If the oil gravity is less than 40 oAPI, the wellhead oil price is reduced; if the oil gravity is greater than 40 oAPI, the wellhead oil price is increased. In addition, some fields within Texas Railroad District 3 contain very light oil (>45 API). In order to keep the economics of these fields level with the rest of the fields, we imposed a ceiling of 45 API for all fields with lighter oil when applying the Crude Oil Price Differential.