29
Biosolids and Carbon Biosolids and Carbon Footprint Footprint Patricia Scanlan Andrew Shaw, Steve Tarallo November 3, 2009

Biosolids and CarbonBiosolids and CarbonFootprintFootprint
Patricia Scanlan
Andrew Shaw, Steve Tarallo
November 3, 2009

November 3, 2009Page - 2
� The Buzz About CarbonFootprints
� International, national, andregional initiatives and drivers

November 3, 2009Page - 3
The Buzz…Why are we inventorying GHG emissions anddeveloping carbon footprints?
� GHG emissions vs. carbon footprint
� Means for auditing, measuring GHG emissions
� Global warming potential (GWP)
� Useful if carbon trading programs are implemented orcarbon caps are imposed in the future
� Important component of a sustainability assessment
� Strategic planning and process selection

November 3, 2009Page - 4
International Initiatives and Drivers
� Kyoto Protocol (1997)
� By 2012, reduce GHG emissions to 5% below 1990levels
� Reduction requirements vary by country
� Only 37 countries required to reduce emissions
� US targeted at 7% reduction
� US did NOT ratify Kyoto
� Expires in 2012. UN Climate Change Conference (Dec2009)
November 3, 2009Page - 5
National Initiatives� Conference of Mayors Climate
Protection Agreement
� Includes 1,012 cities
� Meet or beat Kyoto Protocoltargets (7% reduction by 2012)
� Local implementation
� Arizona cities include:
� Apache Junction
� Bisbee
� Buckeye
� Bullhead City
� Flagstaff
� Gilbert
� Goodyear
� Mesa
� Oro Valley
� Phoenix
� Tucson
� Winslow

November 3, 2009Page - 6
National Initiatives - Legislation

November 3, 2009Page - 7
National Initiatives - Legislation
� American Clean Energy and Security Act of 2009 (ACES) (H.R. 2454)
� Reduce GHG emissions by 17% by 2020
� Applies to emitters of 10,000 tonne/yr CO2e (for specific categoriesof emitters)
� Establishes federal GHG registry
� Includes Cap-and-Trade provisions
� Addresses barriers to carbon sequestration and capture
� Provides for trading, banking, borrowing credits and offsets
� Senate hearings this week

November 3, 2009Page - 8
National Initiatives - Rules� USEPA 40 CFR Part 98
� Mandatory reporting of GHG emissions forspecific industries
� Triggered at 25,000 tonne/year CO2 equiv
�Based on actual, direct emissions
�Does not include electricity purchase
�Biogenic emissions reported separately
�30 mmBtu/hr comparison

November 3, 2009Page - 9
Regional Initiatives� Northeast, midwest, and western
initiatives
� Western Climate Initiative (WCI)
� Reduce GHG emissions to 15%below 2005 levels by 2020(beginning in 2012). POTWsincluded starting 2015. Measured atpoint of emission
� Reporting begins at 10,000 tonne/yrCO2e
� Compliance at 25,000 tonne/yrCO2e
� Triggers based on stationarycombustion emissions
� Includes reporting of emissionsfrom biomass combustion
� Offsets limited to 49% of reductions WCI Partners

November 3, 2009Page - 10
� Carbon footprint of biosolidsmanagement
� Options to reduce emissions

November 3, 2009Page - 11
What are the WW Treatment Carbon Footprint Boundaries?
Treatment System
DecommissioningOperationConstruction

November 3, 2009Page - 12
Inventory Operational Boundaries
Source:WRI/WBCSD

November 3, 2009Page - 13
Scope Definitions
Contracted services
Supply chainsources
Waste disposal
Employee travel
Purchasedelectricity
Direct processemissions
Direct fugitiveemissions
Stationarycombustion
Vehicle fleet fuelcombustion
Scope 3(Optional)
Scope 2Scope 1
November 3, 2009Page - 14
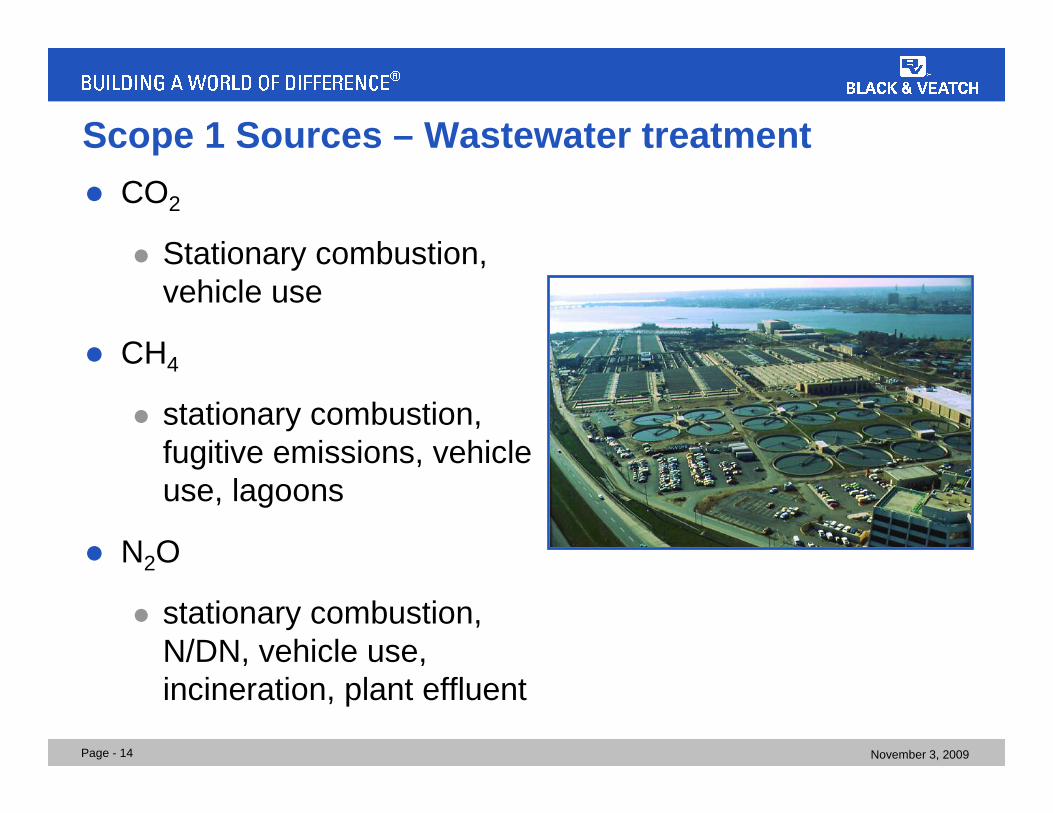
Scope 1 Sources – Wastewater treatment� CO2
� Stationary combustion,vehicle use
� CH4
� stationary combustion,fugitive emissions, vehicleuse, lagoons
� N2O
� stationary combustion,N/DN, vehicle use,incineration, plant effluent

November 3, 2009Page - 15
Scope 2 Purchased Electricity - eGRID
AZNM: 1,316 lb/MWh
National Average: 1,329 lb/MWh
The Emissions & Generation Resource IntegratedDatabase for 2007
(eGRID2007) Technical Support Document
November 3, 2009Page - 16
Scope 3 Sources – Wastewater treatment
� “Embodied” carbon from supply chain
� Equipment
� Chemicals
� Consumables for maintenance
� Solids disposal/final use
� Contractor hauling (mobile combustion)
� Landfill gas production (w/ or w/o LFG collection system)
� Land application
� Fertilizer offset, carbon sequestration, N2O emissions
November 3, 2009Page - 17
Developing the Carbon Footprint for BiosolidsProcesses
� Build GHG emissions from “ground up”
� Identify evaluated processes
� Identify emissions associated with each process
�Use measurement or emission factors
�May be difficult to identify actual energy useassociated with specific processes
� Remember impacts of sidestream treatment

November 3, 2009Page - 18
Carbon Footprint of Thickening and Dewatering
�Polymer use
�Equipmentmanufacture andconstruction
�Transportation forstaff
�Purchasedelectricity
�None
Scope 3(Optional)
Scope 2Scope 1

November 3, 2009Page - 19
Carbon Footprint of Aerobic Digestion
�Polymer use
�Equipmentmanufacture andconstruction
�Transportation forstaff
�Purchasedelectricity
�N2O emissions
Scope 3(Optional)
Scope 2Scope 1

November 3, 2009Page - 20
Carbon Footprint of Anaerobic Digestion
�Chemicals for biogascleaning
�Offsets for biogas use“outside the fence”
�Equipmentmanufacture andconstruction
�Transportation for staff
�Purchased electricity
�Electricity offset(shown as reduction inpurchased electricity)
�Natural gas use
�Fugitive CH4
emissions
�Flare combustion orcogeneration emissions(N2O and CH4)
Scope 3(Optional)
Scope 2Scope 1

November 3, 2009Page - 21
Carbon Footprint of Thermal Processes
�Equipmentmanufacture andconstruction
�Transportation for staff
�Purchased electricity
�Electricity offset frompower generation(shown as reduction inpurchased electricity)
�Combustionemissions (incinerators– N2O)
�Natural gas use(incineration/heatdrying)
Scope 3(Optional)
Scope 2Scope 1

November 3, 2009Page - 22
Carbon Footprint for Final Use Options
�Contracted hauling
�Landfill emissions
�Land application N2Oemissions
�Chemical use (alkalinestabilization)
�Offsets for energy use“outside the fence”
�Offsets for fertilizerreplacement
�Offsets for carbonsequestration
�Purchased electricity�Utility-owned hauling
Scope 3(Optional)
Scope 2Scope 1
November 3, 2009Page - 23
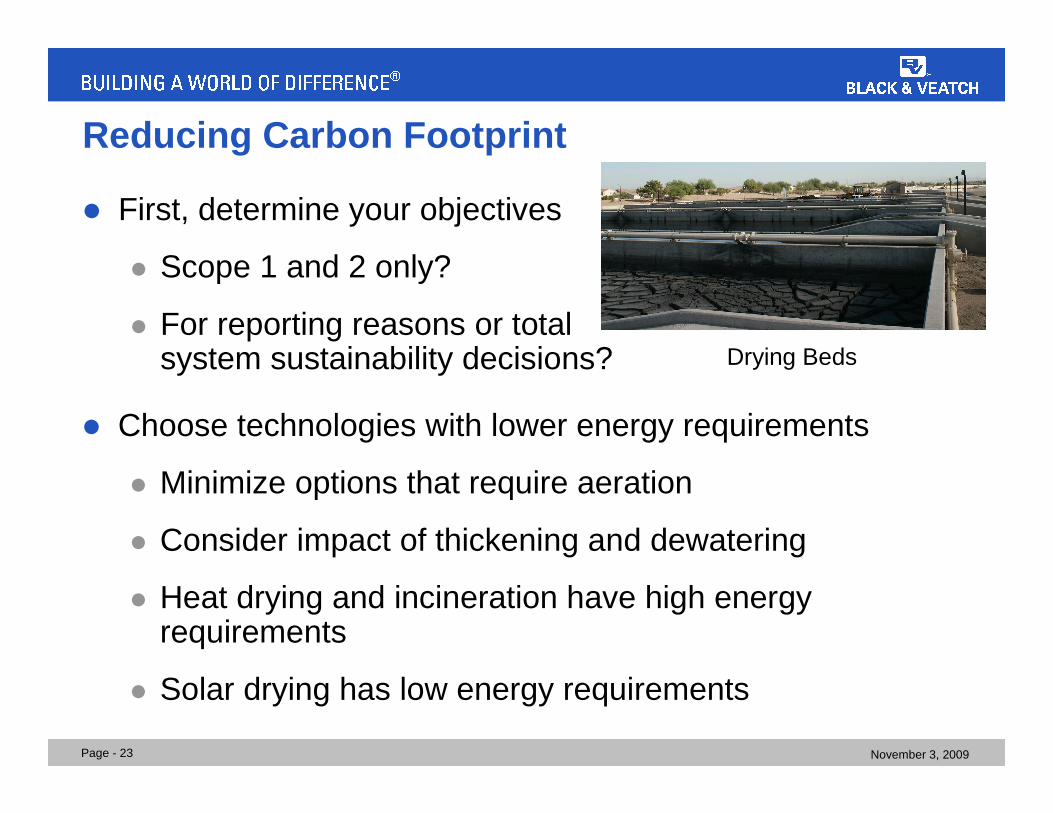
Reducing Carbon Footprint
� First, determine your objectives
� Scope 1 and 2 only?
� For reporting reasons or totalsystem sustainability decisions? Drying Beds
� Choose technologies with lower energy requirements
� Minimize options that require aeration
� Consider impact of thickening and dewatering
� Heat drying and incineration have high energyrequirements
� Solar drying has low energy requirements
November 3, 2009Page - 24
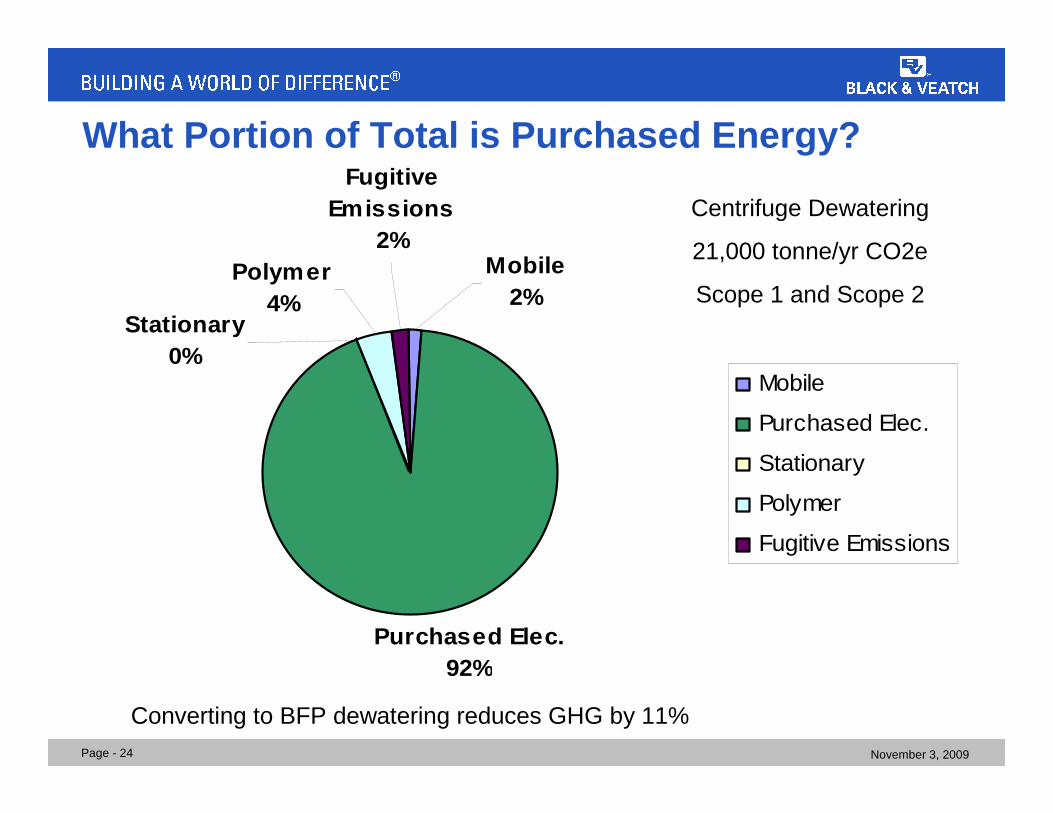
What Portion of Total is Purchased Energy?
Purchased Elec.92%
Mobile2%
Stationary0%
FugitiveEmissions
2%Polymer
4%
Mobile
Purchased Elec.
Stationary
Polymer
Fugitive Emissions
Centrifuge Dewatering
21,000 tonne/yr CO2e
Scope 1 and Scope 2
Converting to BFP dewatering reduces GHG by 11%

November 3, 2009Page - 25
What is the Impact of Technology Choice onGHG?
GHG EmissionsBy Emissions Source
0
5,000
10,000
15,000
20,000
25,000
30,000
35,000
40,000
Cent. BFP Cent w / ER BFP w /ER Drying Incineration
To
nn
e/ye
ar
Fugitive Emissions
Incineration
Polymer
Stationary
Purchased Elec.
Mobile

November 3, 2009Page - 26
Environmental Product Declarations (EPD)
� EPD describes the environmentalimpact of producing and using aproduct based on verified Life CycleAssessments (LCA) in accordance withISO 14025
� Good Example: Flygt Pumpshttp://int.flygt.com/1000251.asp
� Climate Declaration is a simplifiedEPD just for green-house gases,expressed as CO2-equivalents for aproduct's life cycle.
� Tools where customers can comparedifferent products' environmentalperformance.
CO2e kg per kW ofPumping Power
Used over 5yr Life
Production Use Total
Consider Impacts of Equipment Choice

November 3, 2009Page - 27
Reducing Carbon Footprint (continued)
� Maximize use of energy recovery
� Use biogas for power generation, process orbuilding heating/cooling
� Consider biogas augmentation processes
�Co-digestion with FOG
�WAS pretreatment (OpenCEL, Crown Biogest,thermal hydrolysis)

November 3, 2009Page - 28
Reducing Carbon Footprint – Scope 3
� In general, final use options using land applicationhave the lowest GHG emissions
� Landfill disposal has high GHG emission
� Landfill gas systems may not capture methanegenerated by biosolids (3-5 year delay)

November 3, 2009Page - 29
Putting Biosolids in Perspective
� Western Australia (42 mgd / 62 dtpd)
� SBR treatment
� Rotary screw thickeners
� Anaerobic digestion
� Centrifuge dewatering
� Co-generation
1.3 tonne/tonne total
� Co-generation decreased totalby 1.1 tonne/tonne (46%)
29%
71%
Plant Total Solids Treatment


