42
Dr. Shahram Yazdani Brain Drain Shahid Beheshti University of Medical Sciences School of Medical Education Strategic Policy Sessions: 12
| Date post: | 02-Jan-2016 |
| Category: |
Documents |
| Upload: | emi-melendez |
| View: | 56 times |
| Download: | 1 times |
Dr. Shahram Yazdani
Brain Drain
Shahid Beheshti University of Medical SciencesSchool of Medical Education
Strategic Policy Sessions: 12

Dr. S
hahra
m
Yazd
ani
2
For every complex problem,
there’s a simple, obvious answer
that just happens to be wrong!H.L. Menken
Dr. S
hahra
m
Yazd
ani
3
Between 150,000-180,000 Iranians try to immigrate by various means annually
Dr. S
hahra
m
Yazd
ani
4
The latest figures released by the International Monetary Found (IMF) indicates that Iran ranks first in brain drain among 61 developing and less developed countries (LDC).
Dr. S
hahra
m
Yazd
ani
5
Our part in others development !
1.434 million people (12%) out of the 12 million people who have science and engineering degrees in the U.S.A., are of foreign origin.
Over 72% of these were originally born in a developing country.
23% of those having a doctorate are not U.S.A. born citizens
This proportion in key areas such as engineering and computer sciences is 40%
The SESTAT database of the National Science Foundation (NSF) 2005
Dr. S
hahra
m
Yazd
ani
6
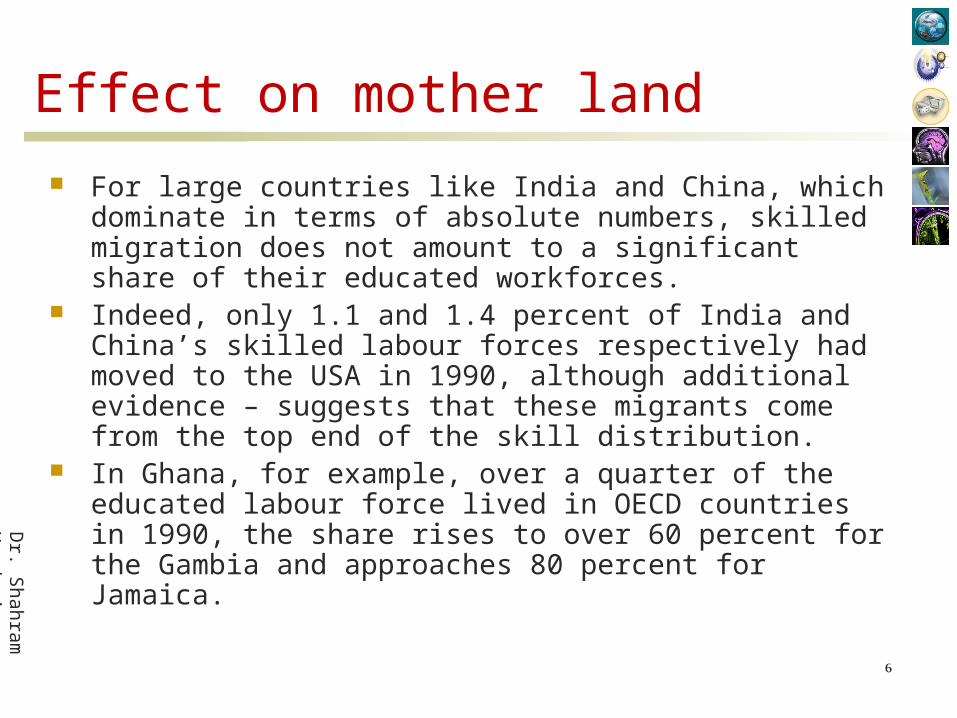
Effect on mother land
For large countries like India and China, which dominate in terms of absolute numbers, skilled migration does not amount to a significant share of their educated workforces.
Indeed, only 1.1 and 1.4 percent of India and China’s skilled labour forces respectively had moved to the USA in 1990, although additional evidence – suggests that these migrants come from the top end of the skill distribution.
In Ghana, for example, over a quarter of the educated labour force lived in OECD countries in 1990, the share rises to over 60 percent for the Gambia and approaches 80 percent for Jamaica.
Dr. S
hahra
m
Yazd
ani
7
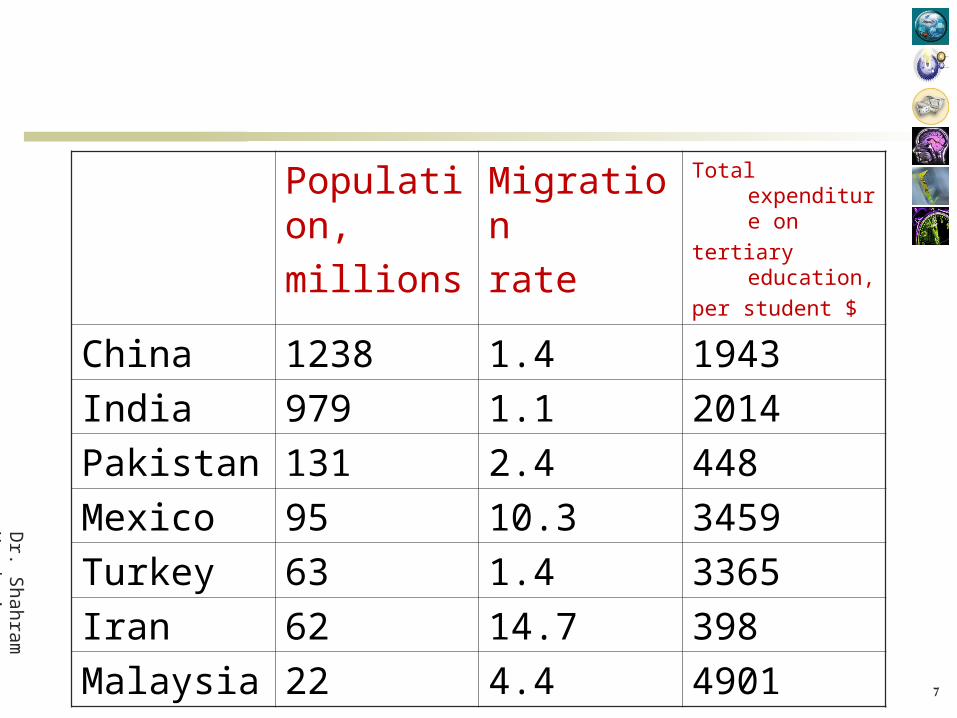
Population,
millions
Migration
rate
Total expenditure on
tertiary education,
per student $
China 1238 1.4 1943
India 979 1.1 2014
Pakistan 131 2.4 448
Mexico 95 10.3 3459
Turkey 63 1.4 3365
Iran 62 14.7 398
Malaysia 22 4.4 4901
Dr. S
hahra
m
Yazd
ani
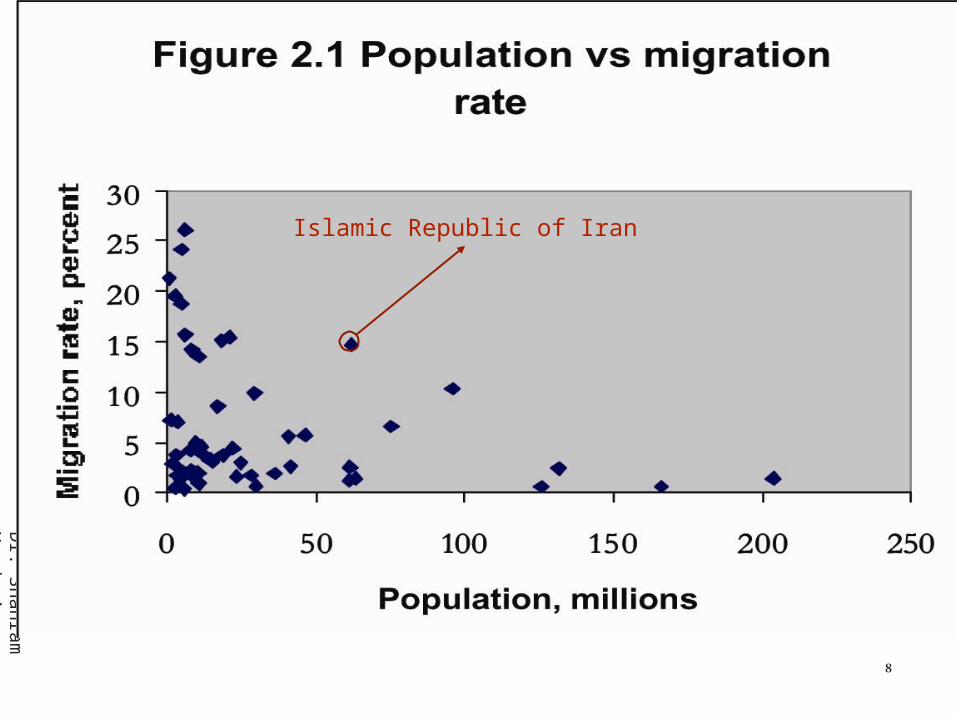
8
Islamic Republic of Iran
Dr. S
hahra
m
Yazd
ani
9
Who are the expatriates?
Of 125 Iranian high school students who have won awards at International Science Olympiads over the past three years, 90 of them are now at US universities (2001 figures)
More than 150,000 Iranian surgeons and engineers now live in the United States
Dr. S
hahra
m
Yazd
ani
10
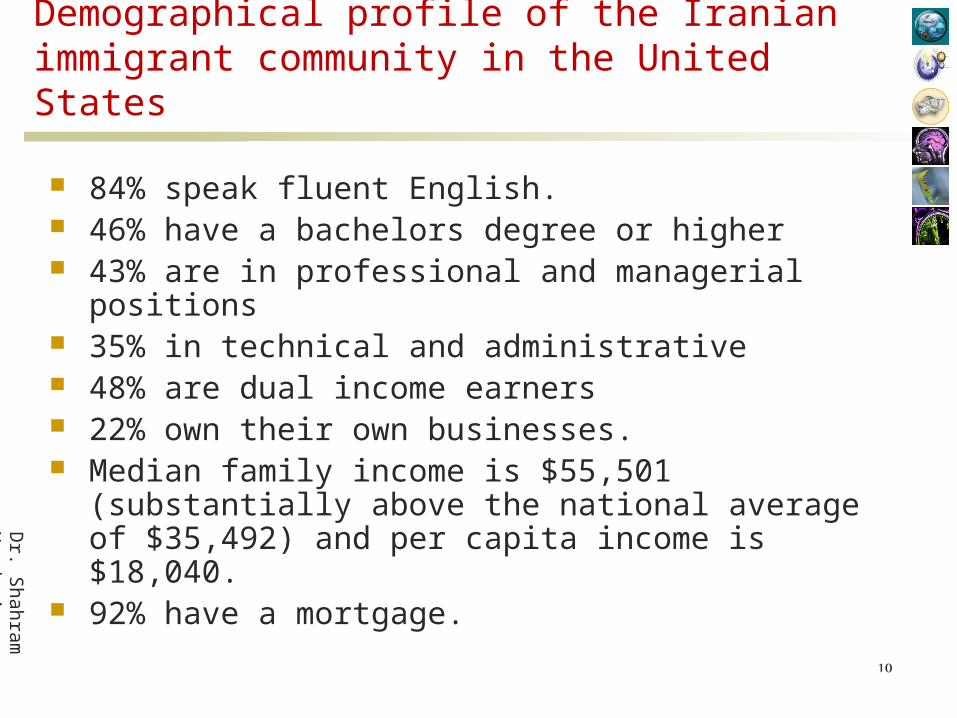
Demographical profile of the Iranian immigrant community in the United States
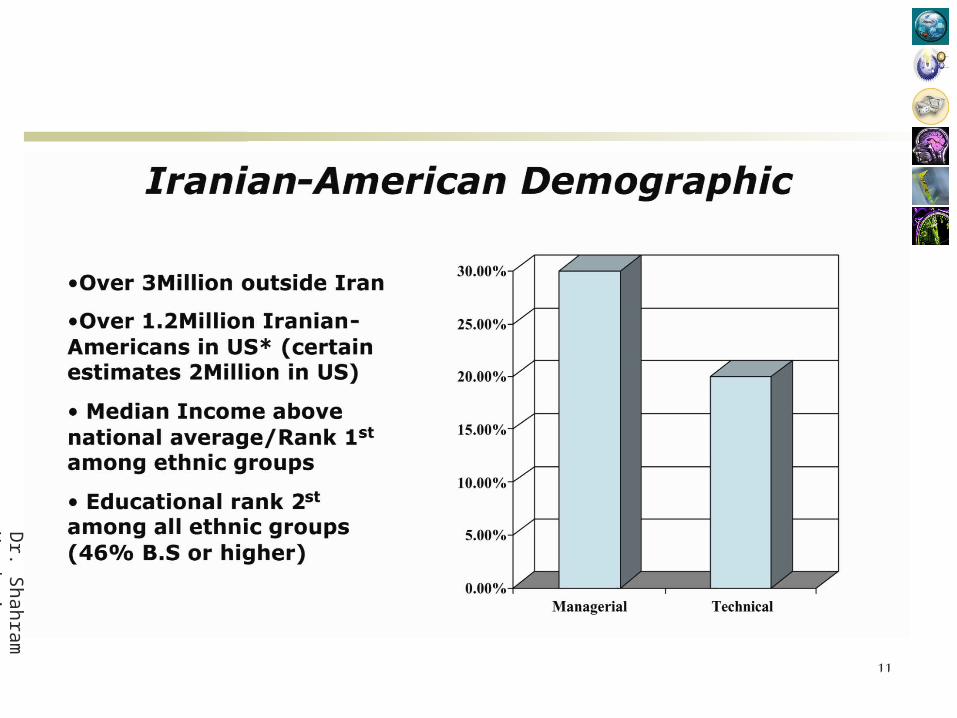
84% speak fluent English. 46% have a bachelors degree or higher 43% are in professional and managerial positions 35% in technical and administrative 48% are dual income earners 22% own their own businesses. Median family income is $55,501 (substantially
above the national average of $35,492) and per capita income is $18,040.
92% have a mortgage.
Dr. S
hahra
m
Yazd
ani
11
Dr. S
hahra
m
Yazd
ani
12
Dr. S
hahra
m
Yazd
ani
13
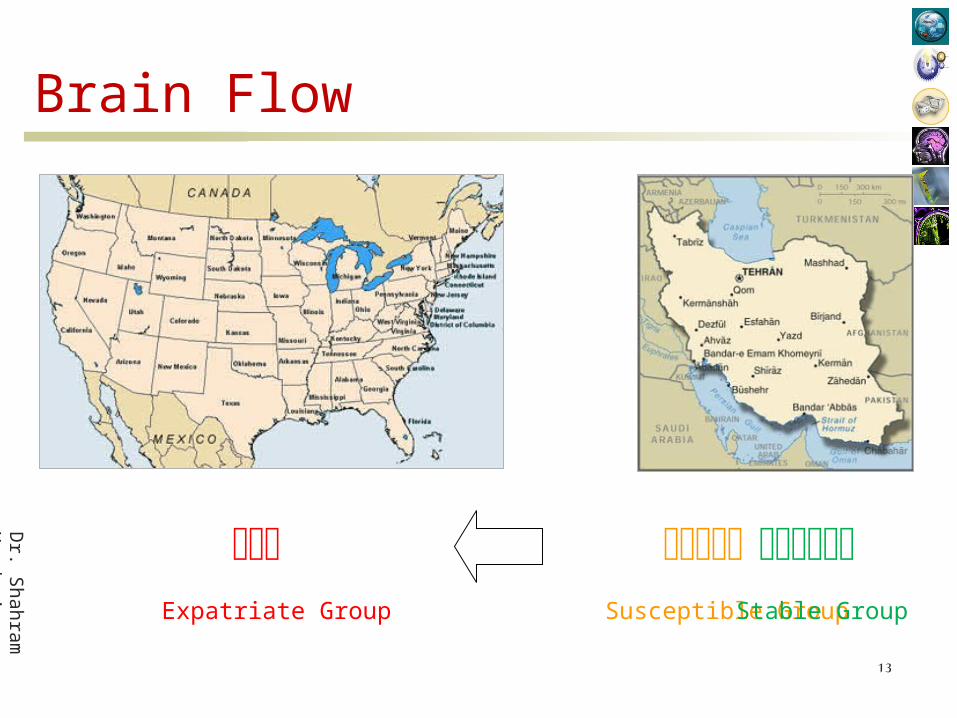
Brain Flow
Susceptible GroupExpatriate Group Stable Group
Dr. S
hahra
m
Yazd
ani
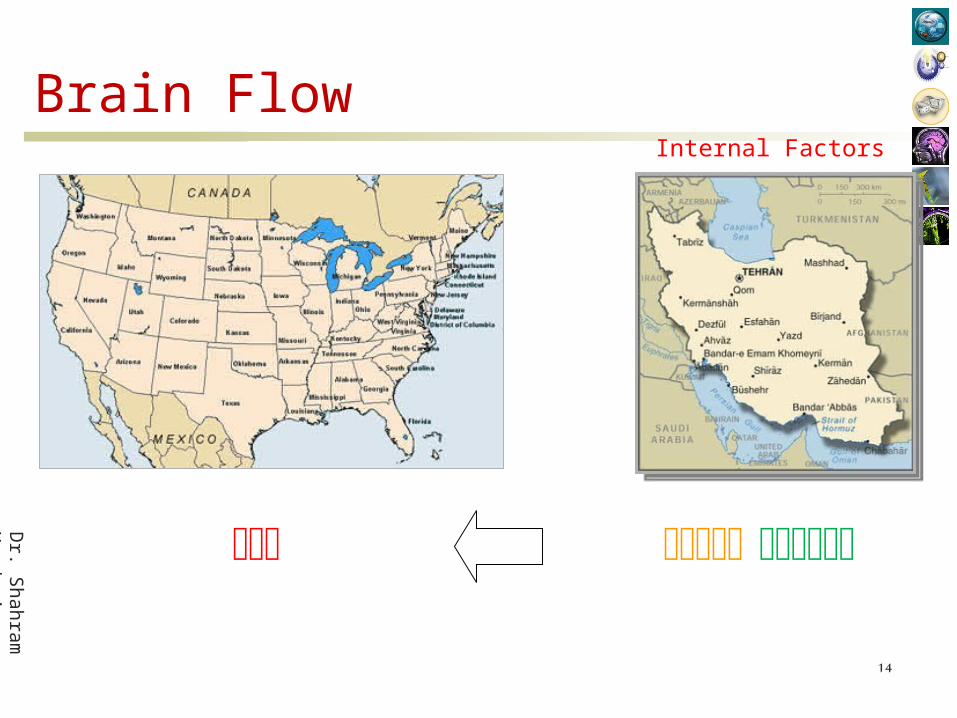
14
Brain FlowInternal Factors
Dr. S
hahra
m
Yazd
ani
Disease vs. Symptom
Migration of educated people is not the ‘disease’
It is the
‘symptom’
Dr. S
hahra
m
Yazd
ani
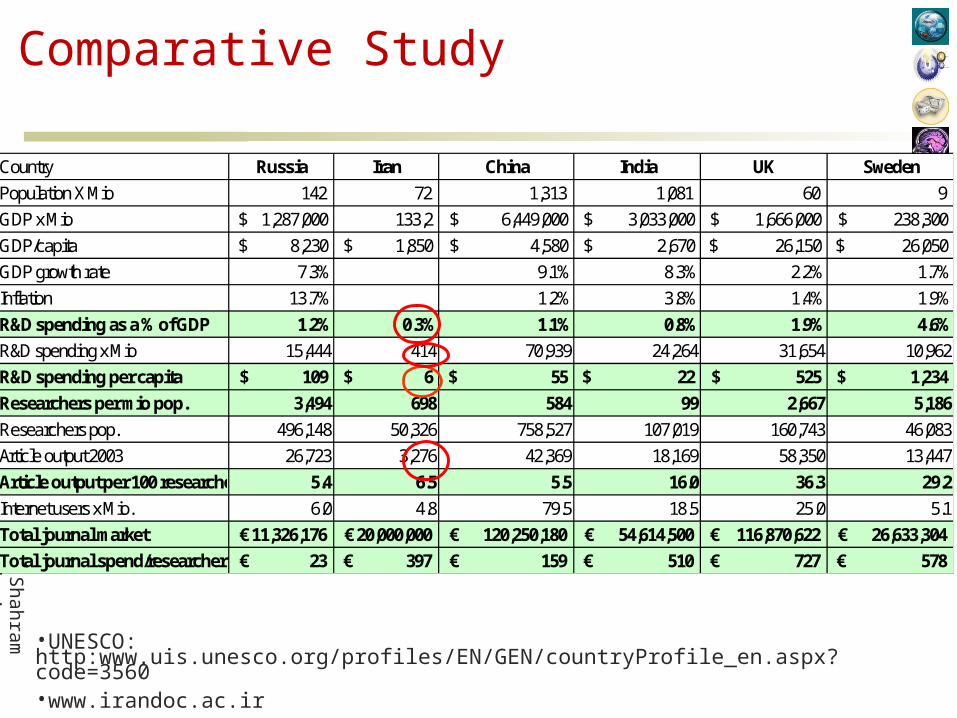
Comparative Study
Country Russia Iran China India UK Sweden
Population X Mio 142 72 1,313 1,081 60 9 GDP x Mio 1,287,000$ 133,2 6,449,000$ 3,033,000$ 1,666,000$ 238,300$ GDP/capita 8,230$ 1,850$ 4,580$ 2,670$ 26,150$ 26,050$ GDP growth rate 7.3% 9.1% 8.3% 2.2% 1.7%Inflation 13.7% 1.2% 3.8% 1.4% 1.9%R&D spending as a % of GDP 1.2% 0.3% 1.1% 0.8% 1.9% 4.6%
R&D spending x Mio 15,444 414 70,939 24,264 31,654 10,962R&D spending per capita 109$ 6$ 55$ 22$ 525$ 1,234$
Researchers per mio pop. 3,494 698 584 99 2,667 5,186
Researchers pop. 496,148 50,326 758,527 107,019 160,743 46,083Article output 2003 26,723 3,276 42,369 18,169 58,350 13,447Article output per 100 researchers 5.4 6.5 5.5 16.0 36.3 29.2
Internet users x Mio. 6.0 4.8 79.5 18.5 25.0 5.1Total journal market 11,326,176€ 20,000,000€ 120,250,180€ 54,614,500€ 116,870,622€ 26,633,304€
Total journal spend/researcher 23€ 397€ 159€ 510€ 727€ 578€
•UNESCO: http:www.uis.unesco.org/profiles/EN/GEN/countryProfile_en.aspx?code=3560•www.irandoc.ac.ir
Dr. S
hahra
m
Yazd
ani
17
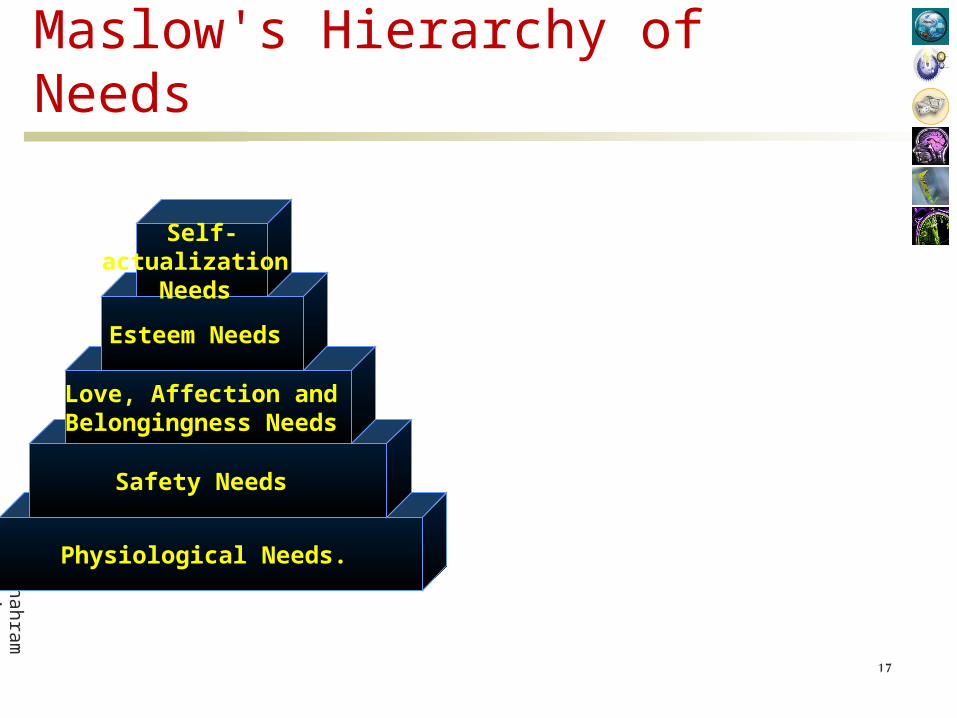
Maslow's Hierarchy of Needs
Physiological Needs.
Safety Needs
Love, Affection and Belongingness Needs
Esteem Needs
Self-actualization
Needs
Dr. S
hahra
m
Yazd
ani
18
Maslow's Hierarchy of Needs
Physiological Needs.
Safety Needs
Love, Affection and Belongingness Needs
Esteem Needs
Self-actualization
Needs
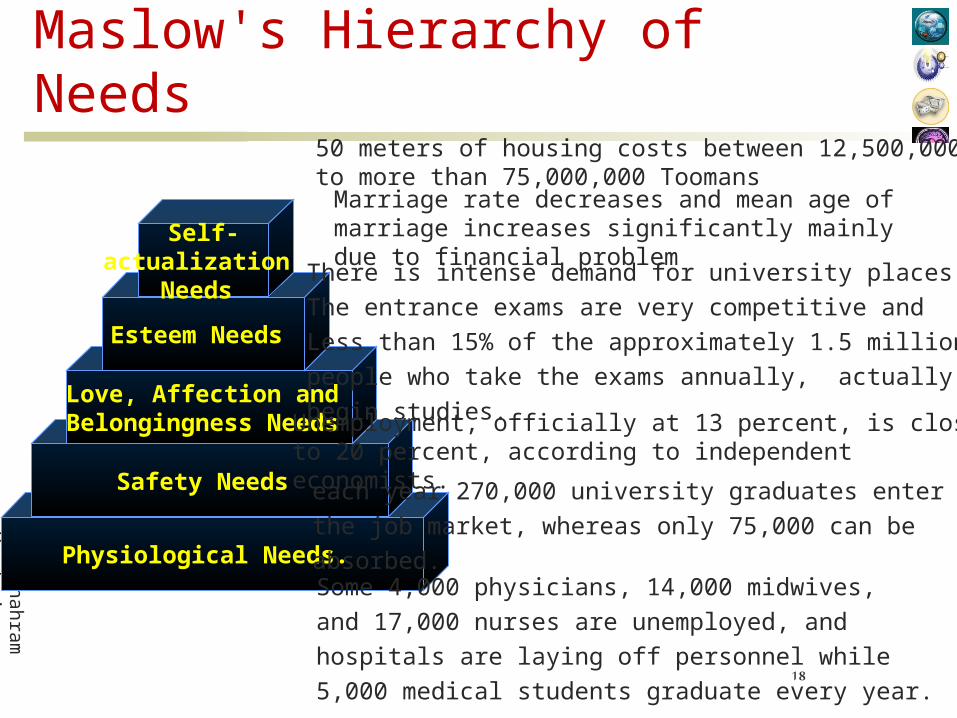
50 meters of housing costs between 12,500,000 to more than 75,000,000 Toomans
Unemployment, officially at 13 percent, is closer to 20 percent, according to independent economists.
There is intense demand for university places.
The entrance exams are very competitive and
Less than 15% of the approximately 1.5 million
people who take the exams annually, actually
begin studies.
each year 270,000 university graduates enter
the job market, whereas only 75,000 can be
absorbed. Some 4,000 physicians, 14,000 midwives,
and 17,000 nurses are unemployed, and
hospitals are laying off personnel while
5,000 medical students graduate every year.
Marriage rate decreases and mean age of marriage increases significantly mainly due to financial problem
Dr. S
hahra
m
Yazd
ani
19
Maslow's Hierarchy of Needs
Physiological Needs.
Safety Needs
Love, Affection and Belongingness Needs
Esteem Needs
Self-actualization
Needs
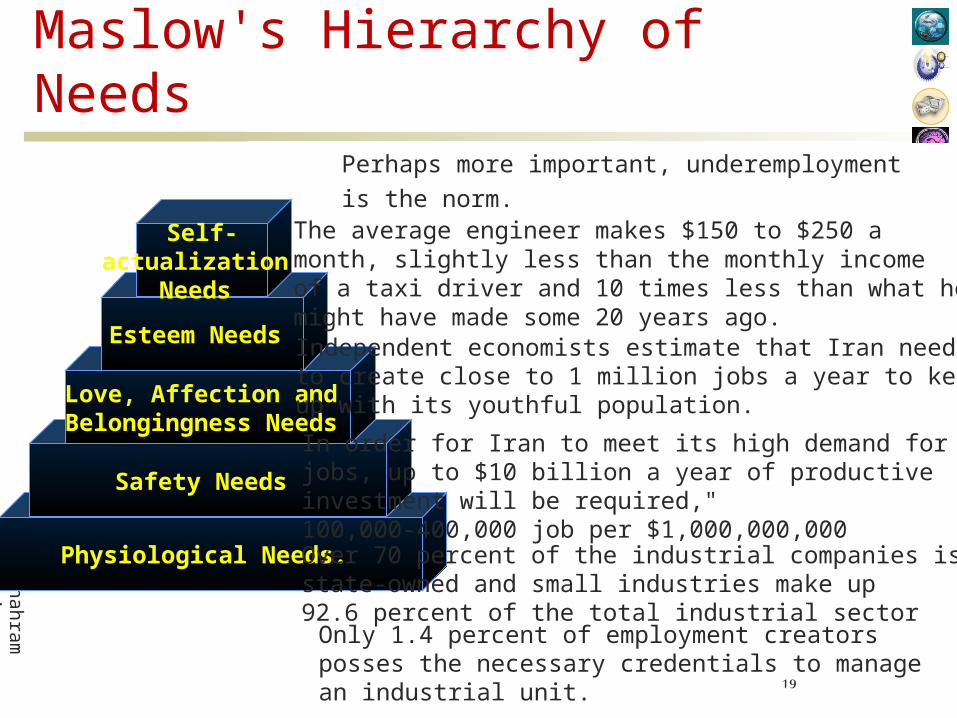
Perhaps more important, underemployment
is the norm. The average engineer makes $150 to $250 a month, slightly less than the monthly income of a taxi driver and 10 times less than what he might have made some 20 years ago. Independent economists estimate that Iran needsto create close to 1 million jobs a year to keep up with its youthful population.
In order for Iran to meet its high demand for jobs, up to $10 billion a year of productive investment will be required,"100,000-400,000 job per $1,000,000,000Over 70 percent of the industrial companies is state-owned and small industries make up 92.6 percent of the total industrial sectorOnly 1.4 percent of employment creators posses the necessary credentials to manage an industrial unit.
Dr. S
hahra
m
Yazd
ani
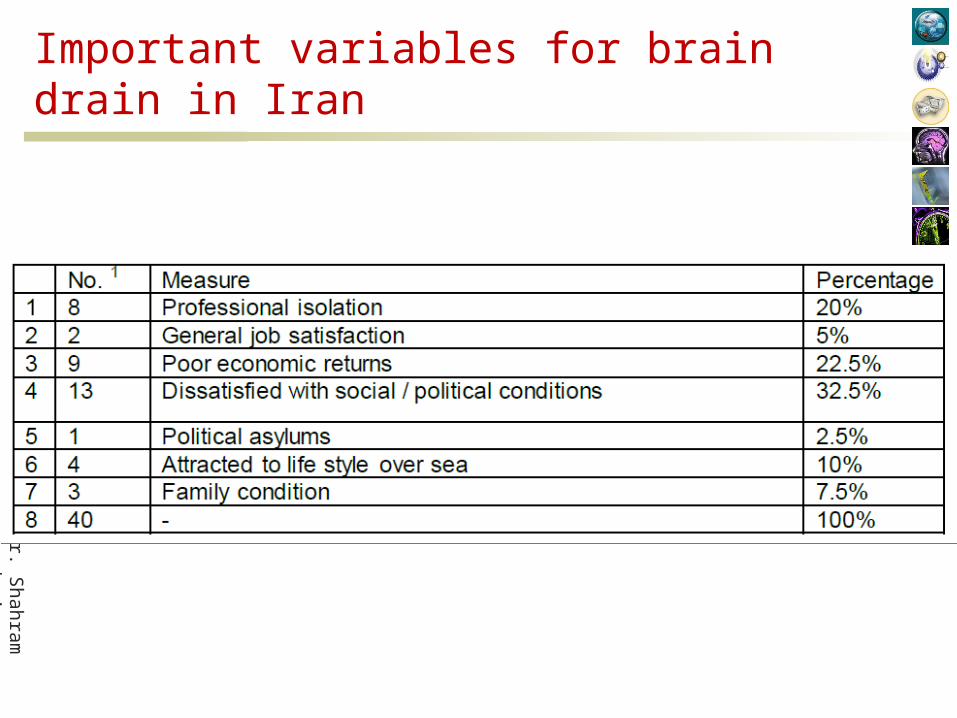
Important variables for brain drain in Iran
Dr. S
hahra
m
Yazd
ani
21
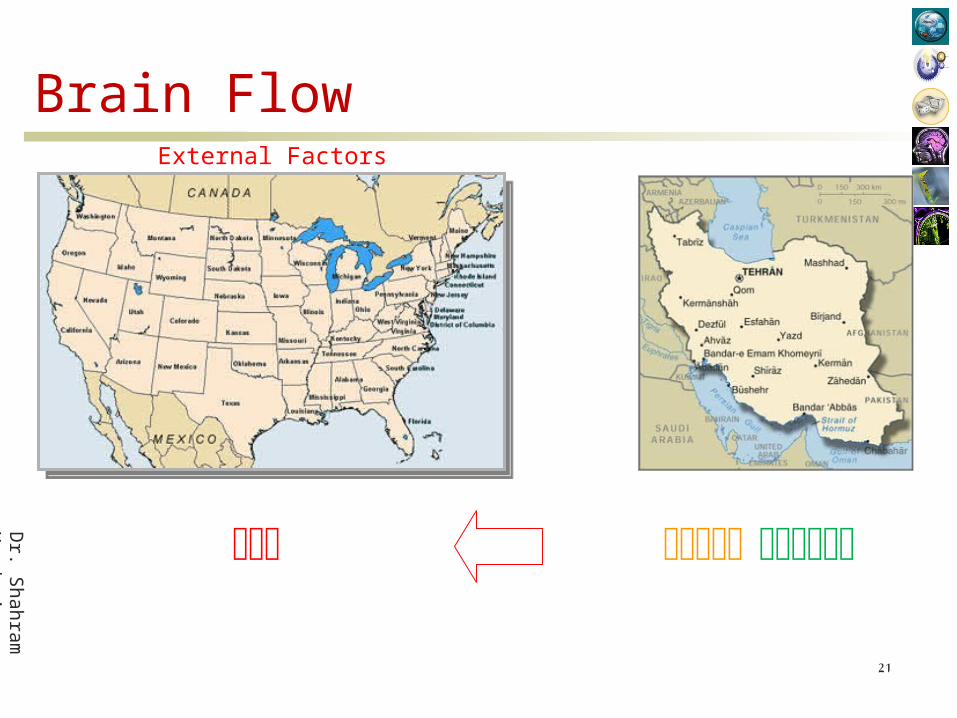
Brain FlowExternal Factors
Dr. S
hahra
m
Yazd
ani
22
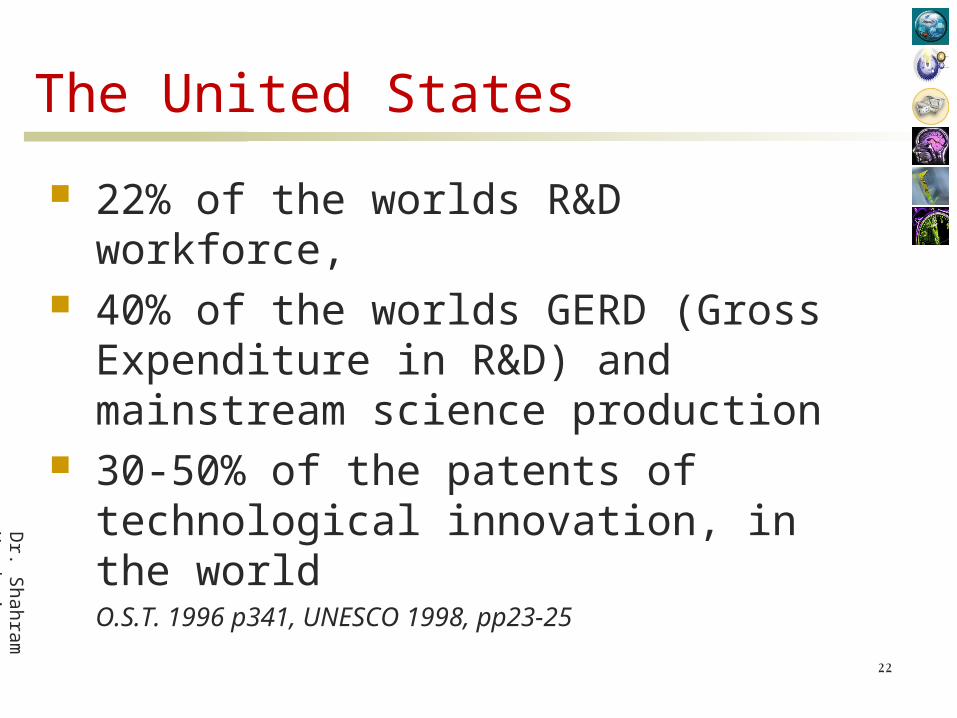
The United States
22% of the worlds R&D workforce, 40% of the worlds GERD (Gross
Expenditure in R&D) and mainstream science production
30-50% of the patents of technological innovation, in the world
O.S.T. 1996 p341, UNESCO 1998, pp23-25
Dr. S
hahra
m
Yazd
ani
23
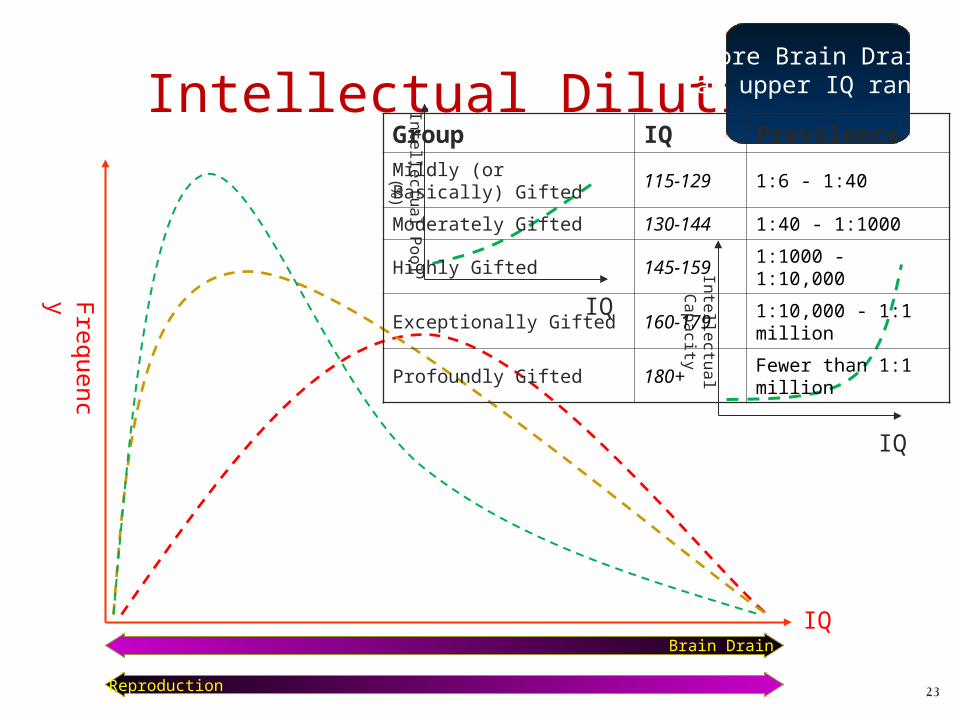
Intellectual DilutionNormal
Distribution ofIQ
Reproduction
Brain Drain
Iso-intellectualMarriage
GenerationalTransmission of
Intellectual Capacity
Skewness to Right
More Reproduction atLower IQ Range
More Brain Drainat upper IQ range
IQ
Frequenc
y
IQ
Inte
llectu
al
Ca
pa
city
IQ
Inte
llectu
al P
oo
l (%
)
Group IQ Prevalence
Mildly (or Basically) Gifted 115-129 1:6 - 1:40
Moderately Gifted 130-144 1:40 - 1:1000
Highly Gifted 145-159 1:1000 - 1:10,000
Exceptionally Gifted 160-179 1:10,000 - 1:1 million
Profoundly Gifted 180+ Fewer than 1:1 million
Dr. S
hahra
m
Yazd
ani
24
Effect on unskilled employment
There is an optimal balance between the number of skilled labor workforce unskilled labor workforce
Brain Drain also leads to unskilled unemployment
Dr. S
hahra
m
Yazd
ani
25
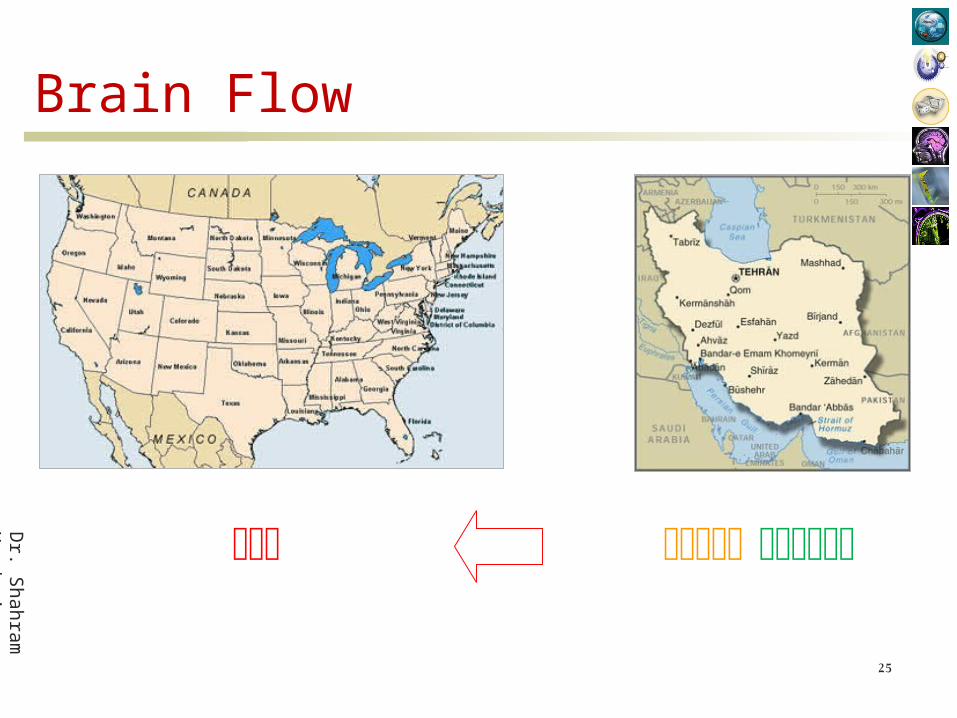
Brain Flow
Dr. S
hahra
m
Yazd
ani
26
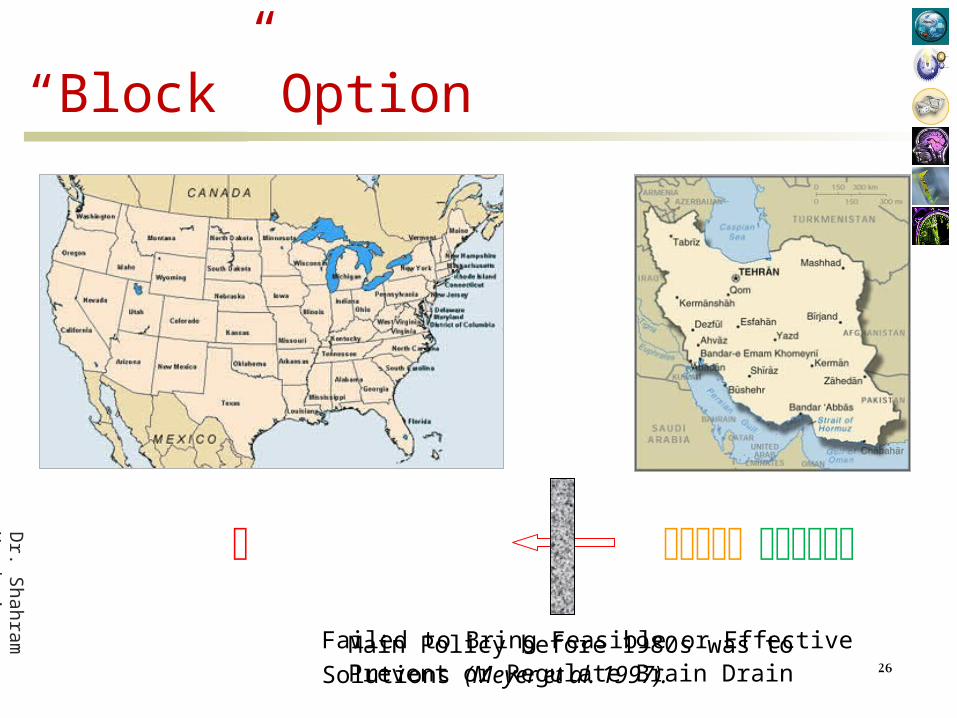
“Block” Option
Main Policy before 1980s was to Prevent or Regulate Brain DrainFailed to Bring Feasible or Effective
Solutions (Meyer et al. 1997).
Dr. S
hahra
m
Yazd
ani
27
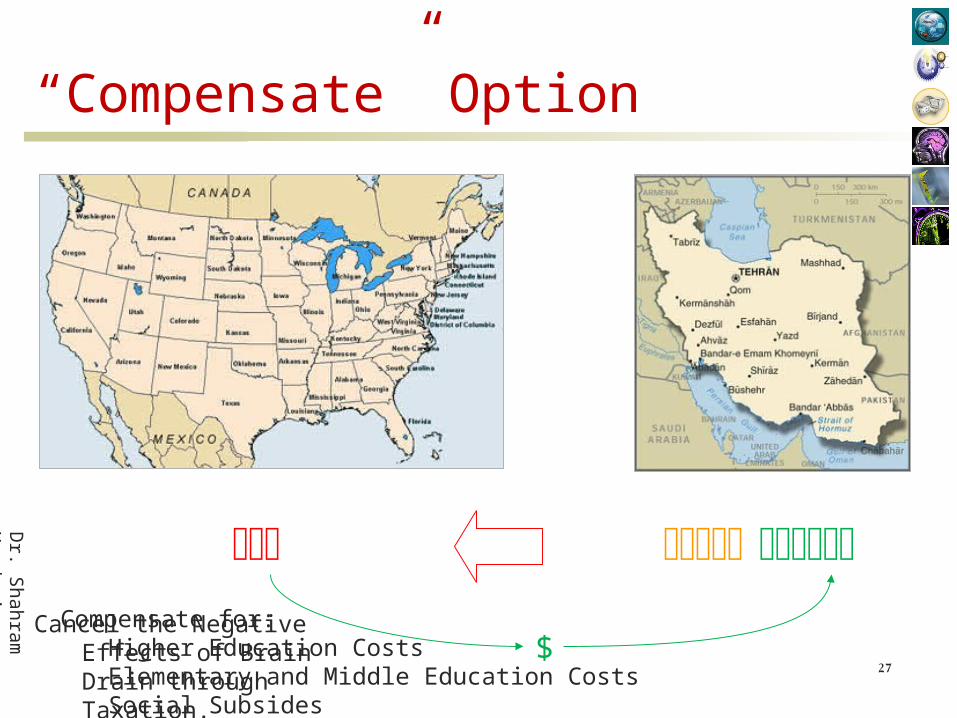
Compensate for:Higher Education CostsElementary and Middle Education CostsSocial Subsides
“Compensate” Option
$Cancel the Negative Effects
of Brain Drain through Taxation.
Dr. S
hahra
m
Yazd
ani
28
“Compensate” Option
Theoretical Assumptions on which these Policies were Based are Wrong
They basically referred to human capital approaches where the skilled person is conceived as an individual capital asset, made of all his/her qualifications and professional experience resulting of prior investments (Gary
Becker). The human capital approach reflects but a small
part of the phenomenon.
Dr. S
hahra
m
Yazd
ani
29
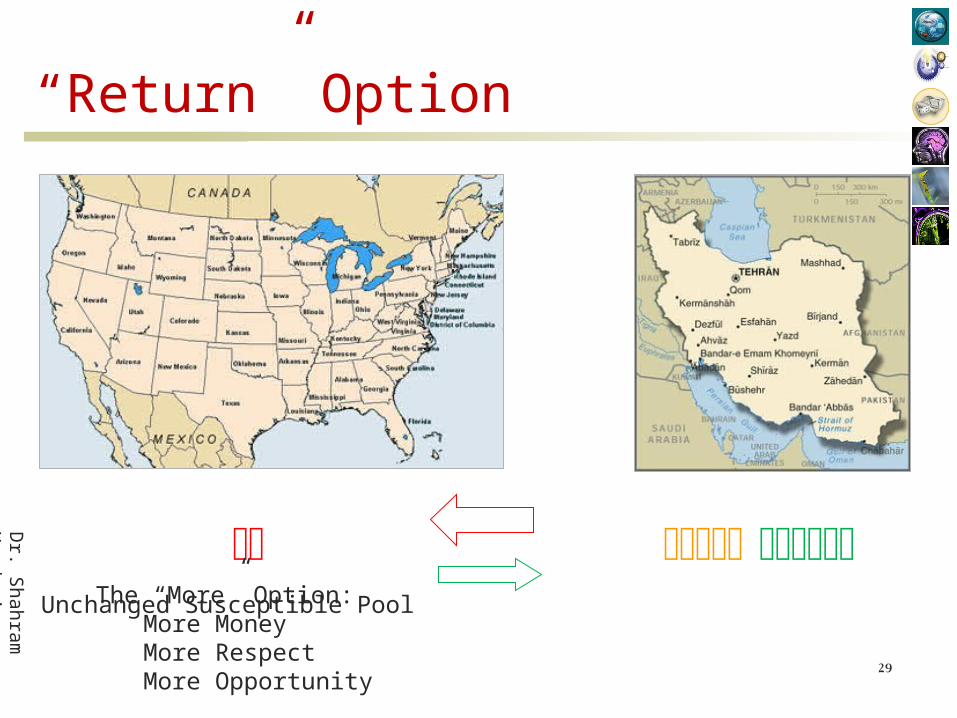
“Return” Option
The “More” Option:More MoneyMore RespectMore Opportunity
Unchanged Susceptible Pool
Dr. S
hahra
m
Yazd
ani
30
“Return” Option
The Republic of Korea has focused on encouraging skilled emigrants to return, rather than invest at home.
Intensive recruiting programs search out older professionals and scholars and offer them salaries competitive with overseas incomes, better working conditions, and help with housing and children’s schooling.
Dr. S
hahra
m
Yazd
ani
31
“Return” Option
Visiting professor programs allow the Republic of Korea to tap the expertise of those uncertain about returning home for good.
These initiatives, backed by the country’s improved economy, have produced strong results.
In the 1960’s, just 16 percent of Korean scientists and engineers with doctorates from the United States returned to Korea. In the 1980’s, that share jumped to about 70 percent.
Dr. S
hahra
m
Yazd
ani
32
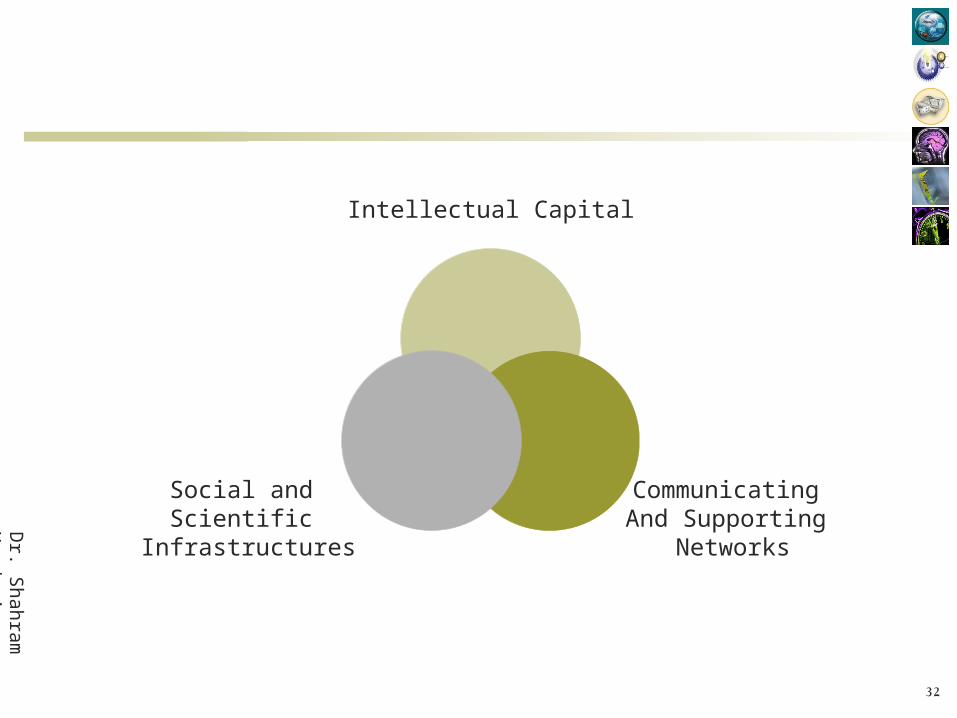
Intellectual Capital
Communicating And Supporting
Networks
Social and Scientific
Infrastructures
Dr. S
hahra
m
Yazd
ani
33
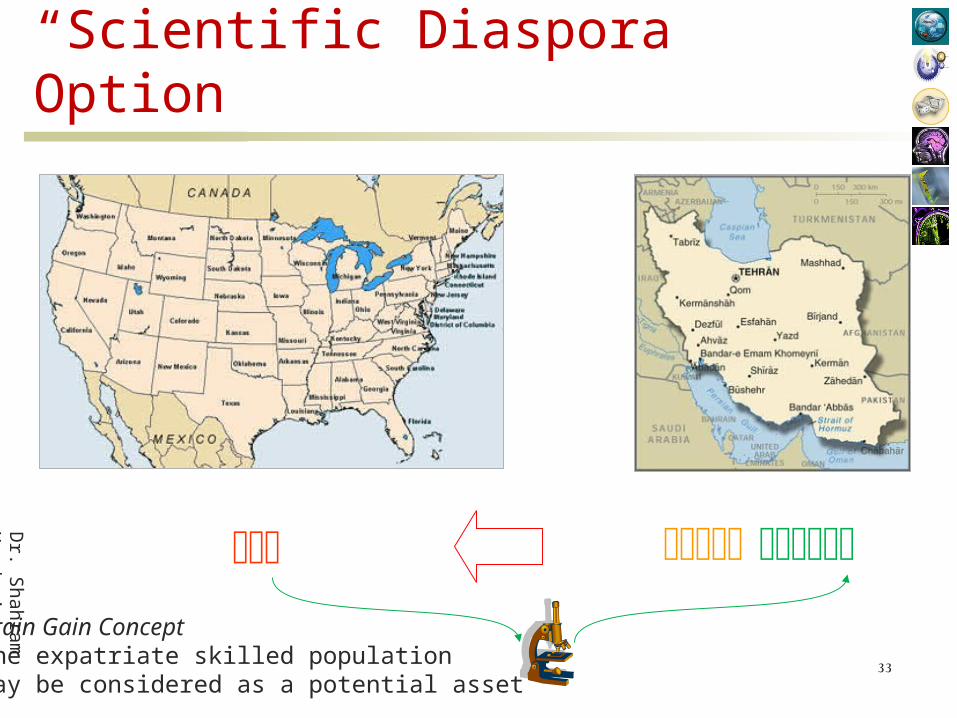
“Scientific Diaspora” Option
Brain Gain Conceptthe expatriate skilled population may be considered as a potential asset
Dr. S
hahra
m
Yazd
ani
34
The Scientific Diaspora Option
It takes for granted that many of the expatriates are not likely to return. They have often settled abroad and built their professional as well as their personal life there.
However, they may still be very concerned with the development of their country of origin, because of religious, cultural, family or other ties.
The objective, then, is to create the links through which they could effectively and productively be connected to its development, without any physical temporary or permanent return.
Dr. S
hahra
m
Yazd
ani
35
The Scientific Diaspora Option
This type of distant cooperative work is now possible as cases of international research projects or multinational corporations’ (MNC).
Relationships between expatriate intellectuals and their mother country have often existed in the past.
What is new today, is that these sporadic, exceptional and limited links may now become systematic, dense and multiple.
Dr. S
hahra
m
Yazd
ani
36
The Scientific Diaspora Option
Student/Scholarly Networks, Local Associations of Skilled Expatriates, Expert pool assistance through the
Transfer of Knowledge Through Expatriate Nationals (TOKTEN) program of the UNDP
Intellectual/Scientific Diaspora Networks. Developing Established and organized
Dr. S
hahra
m
Yazd
ani
37
Networked Activities
Conferences Seminars Workshops Focus group discussions Social events such as dinners, new year Newsletter or news groups Joint developmental projects
Dr. S
hahra
m
Yazd
ani
38
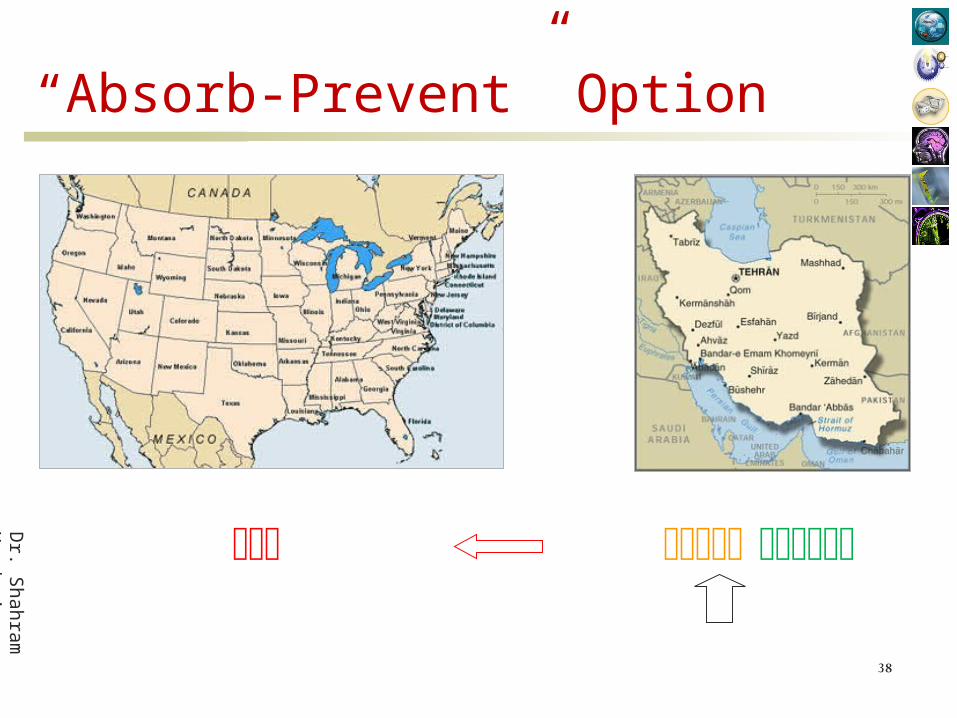
“Absorb-Prevent” Option
Dr. S
hahra
m
Yazd
ani
39
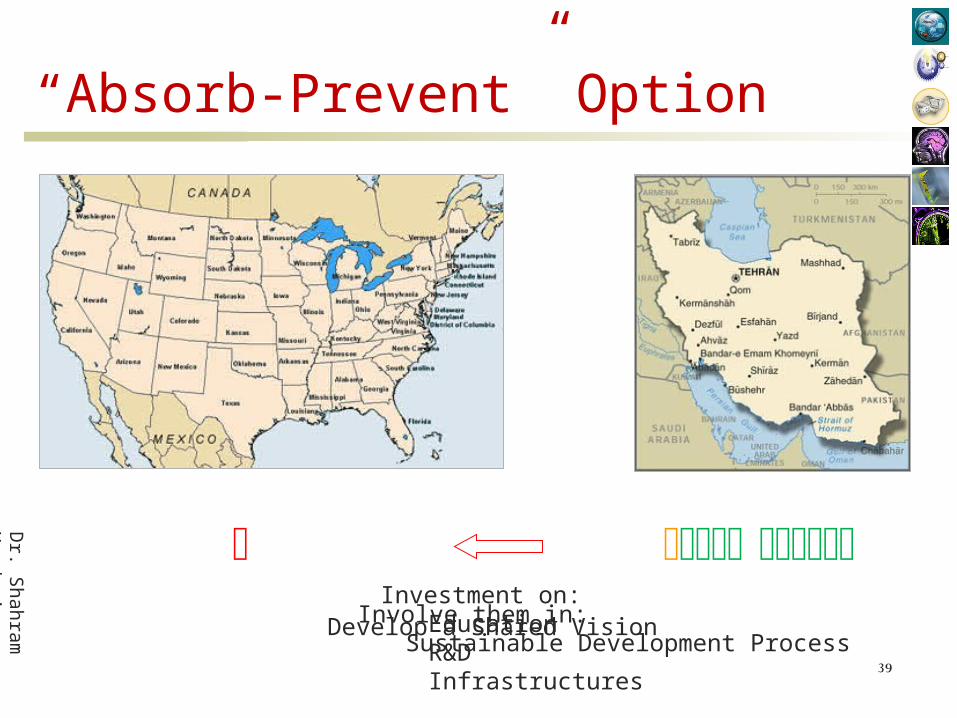
“Absorb-Prevent” Option
Investment on: EducationR&DInfrastructures
Involve them in:Sustainable Development Process
Develop a Shared Vision
Dr. S
hahra
m
Yazd
ani
40
“Absorb-Prevent” Option
This option has been successfully realized in various new industrialized countries (NICs) such as Singapore and the Republic of Korea or big developing countries such as India and China (Charum, Meyer, 1999).
Strong programs to repatriate many of their skilled nationals abroad have been put in place since 1980.
They have created at home the networks in which these returnees could effectively find a place and be operational.
Dr. S
hahra
m
Yazd
ani
41
“Absorb-Prevent” Option
These countries are the ones that significantly invest in S&T material as well as human infrastructure.
They had started to build the research and technico-industrial web which could appropriately sustain such R&D activities employing S&E.
Obviously the success of that option depends very much on this specific capacity. Such a prerequisite is not easily matched by many developing countries.

Thank You !
Any Question ?


