158
C®ãù Ê¥ BÊ®Ý, I«Ê Comprehensive Annual Financial Report For Fiscal Year Ended September 30, 2012 Prepared by: Department of Finance and AdministraƟon

C B , I
Comprehensive Annual
Financial Report
For Fiscal Year Ended
September 30, 2012 Prepared by:
Department of Finance and Administra on

Cover Images– clockwise from top right:
Kayaking enthusiasts are among the first to enjoy the City’s new River Recrea on Park, which officially opened in June 2012.
Mayor Bieter joins Zions Bank and Gardner Co. representa ves for the official groundbreaking of the 8th and Main Building in July. The 8th & Main Building will be the Idaho headquarters for Zions Bank and will finally put an end to Boise’s infamous “Hole in the Ground.”
The City’s new Fire Sta on 15 in east Boise opened its doors to the public in July 2012.

CITY OF BOISE COMPREHENSIVE ANNUAL FINANCIAL REPORT FOR THE YEAR ENDED SEPTEMBER 30, 2012
TABLE OF CONTENTS
INTRODUCTORY SECTION Letter of Transmittal ................................................................................................................................... A-1 GFOA Certificate of Achievement .............................................................................................................. A-5 Organization Charts ................................................................................................................................... A-9 Names of Principal City Officials .............................................................................................................. A-10 FINANCIAL SECTION Independent Auditor’s Report .................................................................................................................... B-1 Management’s Discussion and Analysis ................................................................................................... C-1 BASIC FINANCIAL STATEMENTS Government-wide Financial Statements: Statement of Net Assets .................................................................................................................... D-2 Statement of Activities ....................................................................................................................... D-6 Fund Financial Statements: Balance Sheet-Governmental Funds ................................................................................................. D-8 Reconciliation of the Balance Sheet of Governmental Funds to the Statement of Net Assets ............................................................................................................. D-10 Statement of Revenues, Expenditures, and Changes in Fund Balances- Governmental Funds .................................................................................................................. D-12 Reconciliation of the Statement of Revenues, Expenditures, and Changes in Fund Balances of Governmental Funds to the Statement of Activities .................................. D-14 Statement of Revenues, Expenditures, and Changes in Fund Balances- Budget and Actual: General Fund .............................................................................................................................. D-17 Statement of Net Assets-Proprietary Funds .................................................................................... D-18 Reconciliation of the Proprietary Funds Statement of Net Assets to the Statement of Net Assets ............................................................................................................. D-22 Statement of Revenues, Expenses, and Changes in Fund Net Assets- Proprietary Funds ....................................................................................................................... D-24 Reconciliation of the Statement of Revenues, Expenses, and Changes in Fund Net Assets of Proprietary Funds to the Statement of Activities ......................................... D-26 Statement of Cash Flows-Proprietary Funds ................................................................................... D-28 Statement of Fiduciary Net Assets-Fiduciary Funds ....................................................................... D-32 Statement of Changes in Fiduciary Net Assets-Fiduciary Funds .................................................... D-33 Notes to the Financial Statements ......................................................................................................... E-1 Combining and Individual Fund Statements and Schedules: Combining Balance Sheet-Nonmajor Governmental Funds .................................................................. F-2 Combining Statement of Revenues, Expenditures, and Changes in Fund Balances-Nonmajor Governmental Funds ........................................................................................ F-4 Schedules of Revenues, Expenditures, and Changes in Fund Balances- Budget and Actual: Capital Projects Fund .................................................................................................................. G-1 Debt Service Fund ....................................................................................................................... G-2 Community and Economic Development - Special Revenue Fund ............................................. G-3
Heritage Fund ........................................................................................................................... G-4 Dedicated Trust - Permanent Fund .......................................................................................... G-5 Capital Projects - Impact Fee Fund .......................................................................................... G-6
Combining Statement of Net Assets-Nonmajor Proprietary Funds ....................................................... H-2 Combining Statement of Revenues, Expenses, and Changes in Fund Net Assets-Nonmajor Proprietary Funds .................................................................................................. H-4
CITY OF BOISE COMPREHENSIVE ANNUAL FINANCIAL REPORT FOR THE YEAR ENDED SEPTEMBER 30, 2012
TABLE OF CONTENTS
Combining Statement of Cash Flows-Nonmajor Proprietary Funds ............................ H-6 Schedule of Revenues, Expenses-Airport Fund ...................................................... I-1 Schedule of Passenger Facility Charges Collected, Held and Used-Airport Fund .......... I-2 Combining Statement of Net Assets-Internal Service Funds ..................................... J-2 Combining Statement of Revenues, Expenses, and Changes in Fund Net Assets- Internal Service Funds ......................................................................... J-3 Combining Statement of Cash Flows-Internal Service Funds ..................................... J-4 Statement of Changes in Assets and Liabilities-Agency Fund .................................... J-8 STATISTICAL INFORMATION Financial Trends Net Assets by Component – Last Ten Fiscal Years ...................................................K-1 Changes in Net Assets – Last Ten Fiscal Years ........................................................K-2 Fund Balances, Governmental Funds –Last Ten Fiscal Years .....................................K-3 Changes in Fund Balances, Governmental Funds - Last Ten Fiscal Years ....................K-4 Revenue Capacity Assessed Value and Actual Value of Taxable Property – Last Ten Fiscal Years .............K-6 Direct and Overlapping Property Tax Rates – Last Ten Fiscal Years ...........................K-8 Principal Property Tax Payers – Current Year and Nine Years Ago ............................ K-10 Property Tax Levies and Collections – Last Ten Fiscal Years.................................... K-11 Debt Capacity Ratio of Outstanding Debt By Type – Last Ten Fiscal Years ..................................... K-12 Ratio of Net General Bonded Debt Outstanding – Last Ten Fiscal Years .................... K-12 Direct and Overlapping Governmental Activities Debt ........................................... K-13 Legal Debt Margin Information – Last Ten Fiscal Years .......................................... K-14 Pledged Revenue Coverage – Last Ten Fiscal Years ............................................... K-15 Demographic and Economic Information Demographic and Economic Statistics – Last Ten Calendar Years ............................ K-16 Principal Employers – Current Year and Nine Years Ago ........................................ K-17 Operating Information Full-time Equivalent City Government Employees by Function/Program ................... K-18 Operating Indicators by Function/Program ........................................................... K-19 Capital Asset Statistics by Function/Program ........................................................ K-21 SINGLE AUDIT Schedule of Federal Financial Awards and Passenger Facility Charges Expended for the Fiscal Year Ended September 30, 2012 ....................................................... L-1 Report on Internal Control Over Financial Reporting and on Compliance and Other Matters Based on an Audit of Financial Statements Performed in Accordance with Government Auditing Standards ................ L-5 Independent Auditor’s Report on Compliance With Requirements Applicable to the Passenger Facility Charge Program and on Internal Control Over Compliance ............. L-7 Independent Auditor’s Report on Compliance with Requirements that Could Have a Direct and Material Effect on Each Major Program and on Internal Control Over Compliance in Accordance with OMB Circular A-133 .................................................... L-9 Schedule of Findings and Questioned Costs ............................................................. L-11

INTRODUCTION
A-1

INTRODUCTION
A-2

INTRODUCTION
A-3

This page intentionally left blank
INTRODUCTION
A-4
INTRODUCTION
A-5

This page intentionally left blank
INTRODUCTION
A-6

ORGANIZATION
Boise City is one of 200 cities in the State of Idaho. Cities are "creatures of the state" authorized for organization by the Idaho Co nstitution. "The legislature shall provide by general laws for the incorporation, organization and classification of the citie s and towns in p roportion to the population," (Idaho Constitution Article 12, Section 1). "The l egislature by general and uniform laws shall p rovide for such township, precinct and municipal (city) officers as probable convenience may require," (Idaho Constitution Article 18, Section 6). Boise City operates under the mayor-council system of government as a city of the first class under the general laws of the State of Idaho with a may or and six council members. The mayor is elected to a four-year term. Council members are also elected for four-year terms, three being elected every two years to stagger the terms for continuity. The Mayor is th e chief executive officer for the City, res ponsible for carrying out policies set by the coun cil and for enforcing the ordinances existing in the City Code. The Mayor is assisted in this responsibility by Department Director’s appointed by the Mayor and confirmed with the consent of the council. For CAFR reporting purposes, the city’s General Fund is divided into eight functions/programs:
1) General Government
2) Fire
3) Police
4) Parks and Recreation
5) Culture
6) Community Service
7) Community and Eco nomic Development
8) Interest and Fiscal Charges
Additionally, the CAF R reports business-type activities of the city’s Airport, Sewer and Solid Waste Funds. Smaller funds are reported in aggregate for both governmental and business-type activities. This required reporting structure does not necessarily equate to t he operational structure of the City of Boise which is shown on the following page.
INTRODUCTION
A-7

This page intentionally left blank
INTRODUCTION
A-8

INTRODUCTION
A-9

City of Boise Names of Principal City Officials As of September 30, 2012 Name Position – Title Department David Bieter Mayor Executive Maryanne Jordan Council member – Council President Legislative David Eberle Council member – Council Pro Tem Legislative Elaine Clegg Council member Legislative Lauren McLean Council member Legislative Ben Quintana Council member Legislative TJ Thomson Council member Legislative Garry Beaty Director Information and Technology Kevin Booe Director Library Deborah Broughton Director Finance and Administration Hal Simmons Director (Interim) Planning and Development Services Cary Colaianni City Attorney Legal Dennis Doan Chief Fire Doug Holloway Director (Interim) Parks and Recreation Michael Masterson Chief Police Rebecca Hupp Director Aviation and Public Transportation Shawn Miller Director Human Resources Neal Oldemeyer Director Public Works Jade Riley Administrative Assistant to the Mayor and Council Mayor’s Office Terri Schorzman Director Arts and History
INTRODUCTION
A-10

www.eidebai l ly.com
877 W. Main St., Ste. 800 | Boise, ID 83702-5858 | T 208.344.7150 | F 208.344.7435 | EOE
Independent Auditor’s Report
To the Honorable Mayor and
Members of the City Council
Boise City, Idaho
We have audited the accompanying financial statements of the governmental activities, the business-type
activities, the discretely presented component unit, each major fund, and the aggregate remaining fund
information of the City of Boise, Idaho (the City) as of and for the year ended September 30, 2012, which
collectively comprise the City’s basic financial statements as listed in the table of contents. These financial
statements are the responsibility of the City’s management. Our responsibility is to express opinions on these
financial statements based on our audit.
We conducted our audit in accordance with auditing standards generally accepted in the United States of America
and the standards applicable to financial audits contained in Government Auditing Standards, issued by the
Comptroller General of the United States. Those standards require that we plan and perform the audit to obtain
reasonable assurance about whether the financial statements are free of material misstatement. An audit includes
examining, on a test basis, evidence supporting the amounts and disclosures in the financial statements. An audit
also includes assessing the accounting principles used and the significant estimates made by management, as well
as evaluating the overall financial statement presentation. We believe that our audit provides a reasonable basis
for our opinions.
In our opinion, the financial statements referred to above present fairly, in all material respects, the respective
financial position of the governmental activities, the business-type activities, the discretely presented component
unit, each major fund, and the aggregate remaining fund information, and the respective budgetary comparison for
the general fund of the City, as of September 30, 2012, and the respective changes in financial position, and cash
flows, where applicable, thereof for the year then ended in conformity with accounting principles generally
accepted in the United States of America.
As discussed in Note IV L to the financial statements, an error resulting in understatement of previously reported
liabilities as of September 30, 2011, were discovered by management of the City during the current
year. Accordingly, an adjustment has been made to the beginning net assets and fund balance as of September 30,
2011 to correct the error.
In accordance with Government Auditing Standards, we have also issued our report dated March 11, 2013, on our
consideration of the City’s internal control over financial reporting and on our tests of its compliance with certain
provisions of laws, regulations, contracts, and grant agreements and other matters. The purpose of that report is to
describe the scope of our testing of internal control over financial reporting and compliance and the results of that
testing, and not to provide an opinion on internal control over financial reporting or on compliance. That report is
an integral part of an audit performed in accordance with Government Auditing Standards and should be
considered in assessing the results of our audit.
Accounting principles generally accepted in the United States of America require that the management’s
discussion and analysis as listed in the table of contents be presented to supplement the basic financial statements.
Such information, although not a part of the basic financial statements, is required by the Governmental
Accounting Standards Board, who considers it to be an essential part of financial reporting for placing the basic
B-1

financial statements in an appropriate operational, economic, or historical context. We have applied certain
limited procedures to the required supplementary information in accordance with auditing standards generally
accepted in the United States of America, which consisted of inquiries of management about the methods of
preparing the information and comparing the information for consistency with management’s responses to our
inquiries, the basic financial statements, and other knowledge we obtained during our audit of the basic financial
statements. We do not express an opinion or provide any assurance on the information because the limited
procedures do not provide us with sufficient evidence to express an opinion or provide any assurance.
Our audit was conducted for the purpose of forming opinions on the financial statements that collectively
comprise the City’s financial statements as a whole. The introductory section, combining and individual nonmajor
fund financial statements, and statistical section, are presented for purposes of additional analysis and are not a
required part of the financial statements. The accompanying schedule of expenditures of federal awards is
presented for purposes of additional analysis as required by U.S. Office of Management and Budget Circular A-
133, Audits of States, Local Governments, and Non-Profit Organizations, and is also not a required part of the
financial statements. The combining and individual nonmajor fund financial statements and the schedule of
expenditures of federal awards are the responsibility of management and were derived from and relate directly to
the underlying accounting and other records used to prepare the financial statements. The information has been
subjected to the auditing procedures applied in the audit of the financial statements and certain additional
procedures, including comparing and reconciling such information directly to the underlying accounting and other
records used to prepare the financial statements or to the financial statements themselves, and other additional
procedures in accordance with auditing standards generally accepted in the United States of America. In our
opinion, the information is fairly stated in all material respects in relation to the financial statements as a whole.
The introductory and statistical sections have not been subjected to the auditing procedures applied in the audit of
the basic financial statements and, accordingly, we do not express an opinion or provide any assurance on them.
Boise, Idaho
March 11, 2013
B-2
Management’s Discussion and Analysis
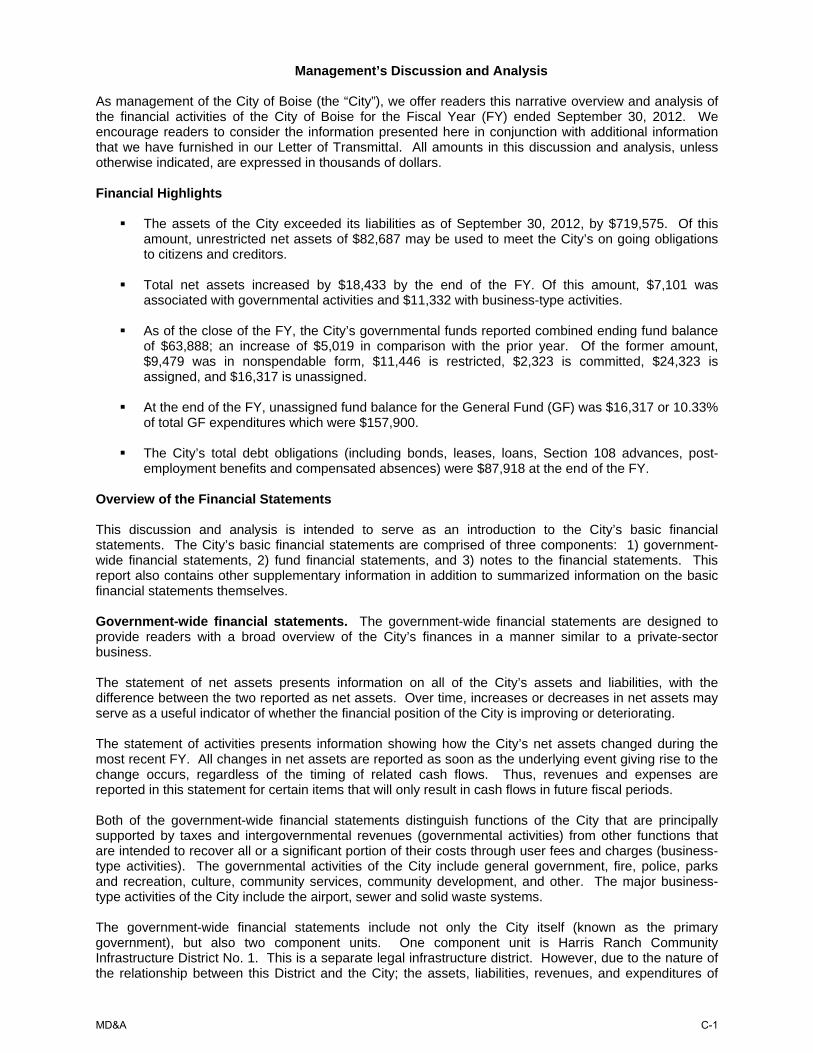
As management of the City of Boise (the “City”), we offer readers this narrative overview and analysis of the financial activities of the City of Boise for the Fiscal Year (FY) ended September 30, 2012. We encourage readers to consider the information presented here in conjunction with additional information that we have furnished in our Letter of Transmittal. All amounts in this discussion and analysis, unless otherwise indicated, are expressed in thousands of dollars. Financial Highlights
The assets of the City exceeded its liabilities as of September 30, 2012, by $719,575. Of this amount, unrestricted net assets of $82,687 may be used to meet the City’s on going obligations to citizens and creditors.
Total net assets increased by $18,433 by the end of the FY. Of this amount, $7,101 was
associated with governmental activities and $11,332 with business-type activities.
As of the close of the FY, the City’s governmental funds reported combined ending fund balance of $63,888; an increase of $5,019 in comparison with the prior year. Of the former amount, $9,479 was in nonspendable form, $11,446 is restricted, $2,323 is committed, $24,323 is assigned, and $16,317 is unassigned.
At the end of the FY, unassigned fund balance for the General Fund (GF) was $16,317 or 10.33%
of total GF expenditures which were $157,900.
The City’s total debt obligations (including bonds, leases, loans, Section 108 advances, post-employment benefits and compensated absences) were $87,918 at the end of the FY.
Overview of the Financial Statements This discussion and analysis is intended to serve as an introduction to the City’s basic financial statements. The City’s basic financial statements are comprised of three components: 1) government-wide financial statements, 2) fund financial statements, and 3) notes to the financial statements. This report also contains other supplementary information in addition to summarized information on the basic financial statements themselves. Government-wide financial statements. The government-wide financial statements are designed to provide readers with a broad overview of the City’s finances in a manner similar to a private-sector business. The statement of net assets presents information on all of the City’s assets and liabilities, with the difference between the two reported as net assets. Over time, increases or decreases in net assets may serve as a useful indicator of whether the financial position of the City is improving or deteriorating. The statement of activities presents information showing how the City’s net assets changed during the most recent FY. All changes in net assets are reported as soon as the underlying event giving rise to the change occurs, regardless of the timing of related cash flows. Thus, revenues and expenses are reported in this statement for certain items that will only result in cash flows in future fiscal periods. Both of the government-wide financial statements distinguish functions of the City that are principally supported by taxes and intergovernmental revenues (governmental activities) from other functions that are intended to recover all or a significant portion of their costs through user fees and charges (business-type activities). The governmental activities of the City include general government, fire, police, parks and recreation, culture, community services, community development, and other. The major business-type activities of the City include the airport, sewer and solid waste systems. The government-wide financial statements include not only the City itself (known as the primary government), but also two component units. One component unit is Harris Ranch Community Infrastructure District No. 1. This is a separate legal infrastructure district. However, due to the nature of the relationship between this District and the City; the assets, liabilities, revenues, and expenditures of
MD&A
C-1

this entity are blended into the City’s government-wide financial statements. The second component unit (Capital City Development Corporation) is also legally separate from the City; being a redevelopment agency. Financial information for this component unit is reported separately from the financial information presented for the primary government itself. Fund financial statements. A fund is a grouping of related accounts that is used to maintain control over resources that have been segregated for specific activities or objectives. The City, like other state and local governments, uses fund accounting to ensure and demonstrate compliance with finance-related legal requirements. All funds can be divided into three categories: governmental funds, proprietary funds, and fiduciary funds. Governmental funds. Governmental funds are utilized to account for essentially the same functions reported as governmental activities in the government-wide financial statements. However, unlike the government-wide financial statements, governmental fund financial statements focus on near-term inflows and outflows of spendable resources, as well as on balances of spendable resources available at the end of the FY. Such information may be useful in evaluating a government’s near-term financing requirements. Because the focus of governmental funds is narrower than that of the government-wide financial statements, it is useful to compare the information presented for governmental funds with similar information presented for governmental activities in the government-wide financial statements. By doing so, readers may better understand the long-term impact of the government’s near-term financing decisions. Both the governmental fund balance sheet and the governmental fund statement of revenues, expenditures, and changes in fund balances provide a reconciliation to facilitate this comparison between the two forms of measurement focus. The City maintains seven individual governmental funds. Information is presented separately in the governmental fund balance sheet and in the governmental fund statement of revenues, expenditures, and changes in fund balances for the General, Capital Projects, and Debt Service funds. These funds are considered major funds. Data from the other four funds, which are the Community and Economic Development Special Revenue Fund, Heritage Special Revenue Fund, Dedicated Trust Permanent Fund, and Impact Fee Capital Projects Fund are combined into a single, aggregate for presentation purposes. Individual fund data for each of these non-major governmental funds is provided in the form of combining statements in a section behind the basic financial statements. The City approves a two-year budget for the General Fund (GF). A budgetary comparison statement has been provided for the GF to demonstrate compliance with the FY2012 budget. Proprietary funds. The City maintains two different types of proprietary funds – enterprise and internal service. Enterprise funds are used to report the same functions presented as business-type activities in the government-wide financial statements. The City maintains six individual enterprise funds. Information is presented separately in the proprietary statement of net assets and the proprietary statement of revenues, expense and changes in fund net assets for the Airport, Sewer and Solid Waste Funds. These funds are considered major enterprise funds. Data from the other three funds, which are the Geothermal, Municipal Irrigation and Housing Rehabilitation Funds are combined into a single aggregate for presentation purposes. Individual fund data for each of these non-major proprietary funds is provided in the form of combining statements elsewhere in this report. Internal service funds are used to accumulate and allocate costs internally among the City’s various functions. The City uses internal service funds to account for its fleet maintenance, arboretum, and risk management activities. Because these services predominantly benefit governmental rather than business type functions, they have been included within governmental activities in the government-wide financial statements. However, the City’s internal service funds are combined into a single, aggregated presentation in the proprietary fund financial statements due to having an economic resources based transaction measurement focus similar to enterprise funds. Individual fund data for the internal service funds is provided in the form of combining statements in a section behind the basic financial statements. Fiduciary funds. Fiduciary funds are used to account for resources held for the benefit of parties outside the government. Fiduciary funds are not reflected in the government-wide financial statement because the resources of those funds are not available to support the City’s own programs. The basis of
MD&A
C-2

accounting and transaction measurement focus used for fiduciary funds is much like that used for proprietary funds. Notes to the financial statements. The notes provide additional information that is essential to a full understanding of the data provided in the government-wide and fund financial statements. Other information. In addition to the basic financial statements and accompanying notes, this report also presents certain other supplementary information. The combining statements referred to earlier in connection with non-major funds and internal service funds are presented immediately after the basic financial statements. Also included are budget comparisons for governmental funds other than the GF. Government-wide Financial Analysis As noted earlier, net assets may serve over time as a useful indicator of a government’s financial position. At September 30, 2012, the City’s assets exceeded liabilities by $719,575. By far the largest portion of the City’s net assets (81%) reflects its investment in capital assets, less any related outstanding debt used to acquire those assets. Capital assets are used to provide services to citizens and they are not available for future spending. Although the investment in capital assets is reported net of related debt, it should be noted that the resources needed to repay this debt must be provided from other sources, since the capital assets themselves cannot be used to liquidate these liabilities.
City of Boise's Net AssetsGovernmental Activities Business Activities Total
2012 2011 2012 2011 2012 2011Current and other assets 205,752$ 193,079$ 113,657$ 112,719$ 319,409$ 305,798$ Capital assets 192,405 190,413 443,997 438,141 636,402 628,554 Total assets 398,157 383,492 557,654 550,860 955,811 934,352 Long-term liabilities outstanding 37,502 31,908 42,867 47,818 80,369 79,726 Other liabilities 137,538 135,279 18,329 17,916 155,867 153,195 Total liabilities 175,040 167,187 61,196 65,734 236,236 232,921
Net assets:Invested in capital assets, net of related debt 186,760 184,211 398,046 386,676 584,806 570,887 Restricted 18,072 12,148 34,010 33,065 52,082 45,213 Unrestricted 18,285 19,657 64,402 65,385 82,687 85,042 Total net assets, as restated 223,117$ 216,016$ 496,458$ 485,126$ 719,575$ 701,142$
A portion of the net assets (7.24%), represent resources that are subject to external restrictions on how the funds may be utilized. The $82,687 balance of unrestricted net assets may be used to meet the City’s ongoing obligations to citizens and creditors. At the end of the current FY, the City is able to report positive balances in all three categories of net assets for the government as a whole. The City is in an improving financial situation, as assets are growing faster than liabilities leading to an increase in net assets. The FY2012 increase in net assets of 2.63% is greater than the 1.5% increase experienced in FY2011.
MD&A
C-3

City of Boise's Changes in Net Assets
2012 2011 2012 2011 2012 2011Revenues:Program revenues:
Charges for services 33,962$ 34,127$ 77,898$ 76,855$ 111,860$ 110,982$
Operating grants and contributions 19,221 20,085 5,610 6,512 24,831 26,597
Capital grants and contributions 4,027 5,069 18,715 15,844 22,742 20,913
General Revenues:Property taxes 109,314 105,534 109,314 105,534 Other taxes 7,189 6,849 7,189 6,849
Other 941 854 1,334 1,367 2,275 2,221 Total revenues 174,654 172,518 103,557 100,578 278,211 273,096 Expenses:General government 28,255 33,915 28,255 33,915 Fire 43,876 41,485 43,876 41,485 Police 47,591 46,051 47,591 46,051
Parks and recreation 22,362 22,634 22,362 22,634 Culture 10,253 10,471 10,253 10,471 Community services 13,287 13,674 13,287 13,674 Community development 842 935 842 935 Interest and fiscal charges 1,195 1,549 1,195 1,549 Airport 30,983 31,934 30,983 31,934 Sewer 31,853 30,468 31,853 30,468 Solid waste 24,406 24,044 24,406 24,044 Other 4,875 3,977 4,875 3,977 Total expenses 167,661 170,714 92,117 90,423 259,778 261,137
Increase in net assets before transfers 6,993 1,804 11,440 10,155 18,433 11,959 Net Transfers 108 (56) (108) 56 - -
Increase in net assets 7,101 1,748 11,332 10,211 18,433 11,959 Net assets October 1st 216,016 214,557 485,126 474,915 701,142 689,472
Restatement (289) (289) Net assets September 30th , as restated (Note 1 ) 223,117$ 216,016$ 496,458$ 485,126$ 719,575$ 701,142$
Note 1: Beginning Governmental fund balance was restated by $289 for FY2012.
Refer to Foonote Section IV - L.
Governmental Activities Business-type Activities Total
MD&A
C-4

Governmental activities in FY2012. Governmental activities in FY2012 increased the City’s net assets by $7,101. This increase accounted for 39% of the total increase in net assets, after transfers were taken into account. The key elements of this increase were as follows:
• Revenues exceeded expenses by $6,993 before transfers due to cost containment efforts and isolated increases in certain revenue sources. Total revenues increased by $2,136 (1.24%) compared to FY2011 on a net basis. This net increase is primarily due to increases in general revenues (property taxes, other taxes, and other category) of $4,207, and decreases in capital/operating grants and contributions of -$1,906, and charges for services of -$165.
• Expenses during the fiscal year decreased on a net basis by -$3,053 (-1.79%) in comparison to
FY2011. Decreases occurred in the following functional areas: General Government (-$5,660), Community Services and Development (-$480), Interest/fiscal charges (-$354), Parks (-$272), and Culture (-$218). These decreases were offset by increased expense in Fire ($2,391) and Police (1,540). Decreases in General Government were due principally to lower M&O, equipment replacement, and cost containment efforts. The Community Services and Development decrease was due to lower utility and repair and maintenance expense. Decreases in Interest/Fiscal charges were due primarily to a bond refunding transaction. The Parks decrease was associated with the timing of equipment purchases. Decreases in Culture were due to lower personnel and utility costs. Increases in Fire and Police were associated with higher personnel costs and equipment purchases for those two departments.
-
10
20
30
40
50
60
G
ener
algo
vern
men
t
F
ire
P
olic
e
P
arks
and
recr
eatio
n
C
ultu
re
C
omm
unity
serv
ices
C
omm
unity
deve
lopm
ent
I
nter
est a
nd fi
scal
char
ges
2012 Expense and Program Revenues - Governmental Activities
Expenses in 1,000,000's Revenues in 1,000,000's
Charges for services19%
Operating grants and contributions
11%
Capital grants and contributions
2%
Property taxes63%
Franchise fees4%
Other 1%
2012 Revenues by Source - Government Activities
MD&A
C-5

Business-type activities in FY2012. Business-type activities in FY2012 increased the City’s net assets by $11,332; accounting for 61% of the total net asset growth. Key elements of the increase are as follows:
• Revenues increased on a net basis by $2,979 (2.96%) as compared to FY 2011. Increases were exhibited in Capital Grants and Contributions ($2,871) and Charges for Services ($1,043). Operating Grants and Contributions and Investment/Interest Earnings decreased by -$902 and -$33, respectively. Net increases in Capital Grants and Contributions resulted from the following fund increases/ decreases, respectively: Airport ($2,481), Sewer ($844), Solid Waste ($4) and Other Funds (-$458). During FY2012, Airport received additional discretionary capital grant revenue to rehabilitate runways. Sewer revenues increased due to greater residential trunk and treatment connection fees, as well as greater developer contributions. Other Funds revenue decreased due to lower Neighborhood Stabilization Program and Housing Rehabilitation drawdown activities. Net increases in Charges for Services resulted from the following fund increases/decreases respectively: Sewer ($606), Solid Waste ($590), Other Funds ($3) and Airport (-$156). Changes in this revenue category were due to principally to increases in the residential and commercial customer base for Sewer and Solid Waste funds. During FY2012, increased capital replacement revenues were earned by the Sewer Fund from the Northwest Sewer District due to NPDES Permit modifications at the Lander Street sewage processing facility. Airport’s decrease was not a material variance for that fund in total. The net decrease in Operating Grants and Contributions resulted from the following fund decreases/increases, respectively: Other Funds (-$1,277), Airport (-$67), Sewer ($251), and Solid Waste ($191). Investment and Interest Earnings decreased across all business-type funds by -$33 in comparison to FY2011. Other Funds operating grant drawdown activity was lower in FY2012, in comparison to FY2011. The Sewer and Solid Waste Funds experienced greater crop and recycling rebates, respectively in comparison to the prior year.
• Expenses increased net by $1,694 (1.87%), as compared to FY2011. The net increase resulted from the following fund increases/decreases, respectively: Sewer ($1,385), Other Funds ($898), Solid Waste ($362), and Airport (-$951). Changes in contractual services, utilities, depreciation, and bad debt write offs accounted for the net expense increase.
-
5
10
15
20
25
30
35
40
A
irport
S
ewer
S
olid
Was
te
O
ther
2012 Expense and Program Revenues - Business-Type Activities
Expenses in 1,000,000's Revenues in 1,000,000's
MD&A
C-6

Charges for services75%
Operating grants and contributions
6%
Capital grants and contributions
18%
Unrestricted investment earnings
1%
2012 Revenues by Source - Business-Type Activities
Financial Analysis of the Governmental Funds As noted earlier, the City of Boise uses fund accounting to ensure and demonstrate compliance with finance-related legal requirements. Governmental Funds in FY2012. The purpose of the City’s governmental funds is to provide information on near-term inflows, outflows, and balances of spendable resources. Such information is useful in assessing the City’s financing requirements. In particular, unassigned fund balance may serve as a useful measure of a government’s net resources available for spending at the end of the year. At September 30, 2012, the City’s governmental funds reported combined ending fund balance of $63,888. Fund balance increased by $5,019 in comparison to the prior year. Starting in FY2011, governmental funds report fund balance in non-spendable and spendable classifications. Nonspendable fund balance represents resources that cannot be spent due to their existing form (ex: inventories). Governmental fund balance that is available for spending is disclosed into four reporting categories: Restricted, Committed, Assigned, and Unassigned. Restricted Fund Balance represents resources that can only be spent based upon externally imposed restrictions. Committed Fund Balance represents City Council mandated constraints imposed on the use of funds. Assigned Fund Balance represents management’s intended use of resources. Unassigned Fund Balance represents resources that have not been classified in one of the aforementioned categories. Governmental funds reported: Nonspendable of $9,479, Restricted of $11,446, Committed of $2,323, Assigned of $24,323, and Unassigned of $16,317 at the end of FY2012. Within the Nonspendable Fund Balance category, $4,487 was associated with property held for resale whereas $3,057 is related to permanent trust fund capital that must be preserved intact. The remaining $1,935 is composed of inventory, prepaid items, and non-current receivables. Within the Restricted Fund Balance category, $4,337 is restricted for Foothills conservation. Restrictions for Impact Fees and Heritage Trust projects account for $3,861 and $1,280, respectively of this category balance. A total of $1,342 has been restricted for drug enforcement initiatives and the Library IOLS/Gift Fund. Finally, $626 has been restricted for debt service reserves. The Committed Fund Balance category is comprised of funds committed to: Homelessness Prevention ($2,000), Detox Center ($316), and Kaylynn Jackson Reward ($7). As stated previously, Assigned Fund Balance represents management’s intended use of resources. At the end of FY2012, the City has made the following assignments: debt service/postretirement benefits ($10,145), community services ($6,481), general government ($2,416), parks and recreation ($1,452), fire ($1,283), culture ($1,224), and police ($672), community and economic development ($588), and warm springs reserve ($62). The remainder of fund balance ($16,317) is contained within the Unassigned Fund Balance category. Changes in fund balance between fiscal years have been explained in the prior governmental revenue and expense discussion. The General Fund (GF) is the City’s chief operating fund. The fund balance of the City’s GF increased by $5,176; as compared to FY2011. In total, General Fund revenues exceeded the budgetary target by $1,654. In comparison to FY2011, net revenues increased $3,402 primarily due to a $2,808 increase in
MD&A
C-7

property taxes, and a $2,208 increase in licenses, permits, intergovernmental, donations and investment income revenue categories. Miscellaneous revenues, franchise fees, and fines & forfeitures, lowered net revenues due to decreases of -$1,397, -$143, and -$74, respectively in comparison to FY2011. Expenditures decreased by $3,361 on a net basis, in comparison to FY2011. Decreases were exhibited in the following functional areas: general government (-$4,631), capital outlay (-$457), parks and recreation (-$304), and culture (-$143). The following functional areas exhibited expenditure increases in comparison to FY2011: fire ($1,082), police ($932) and community services ($160). The Capital Projects fund balance experienced a net increase of $595 in fund balance to $15,878 at the end of FY2012. The majority of this increase in fund balance was due to adjusting the beginning fund balance at the start of the fiscal year by $289 (prior period adjustment), isolated asset sales, and normal capital-related transfers in from the General Fund. These transactions assisted in offsetting the decreased revenues and increased capital expenditures that occurred during the fiscal year. At the end of the fiscal year, the Capital Projects fund balance was composed of the following amounts: $4,487 was in non-spendable form as in property held for resale; $4,337 was being held in the restricted category for the Foothills Levy; $7,054 is assigned by management to the following functional areas or initiatives: community services ($4,820), parks ($593), fire ($591), culture ($580), general government ($408), and warm springs reserve ($62). Proprietary funds in FY2012. The City’s proprietary funds provide the same type of information found in the government-wide financial statements, but in more detail. Unrestricted net asset balances of the Airport, Sewer, and Solid Waste Funds at the end of FY2012 were $29,068, $34,604, and $875, respectively. Airport and Sewer funds demonstrated a total combined increase of all reported capital areas (invested in capital assets-net of related debt, restricted, and unrestricted net assets) of $6,363 and $5,180, when compared to FY2011. The Solid Waste Fund had a -$105 decrease in net assets across these capital categories, when compared to FY2011. Other factors concerning the finances of these funds have already been addressed in the discussion of the City’s business-type activities. General Fund (GF) Budgetary Highlights in FY2012 The final General Fund revenue budget was $246 more than the originally adopted budget due to the net effect of adjustments associated with grant and contract revenues. The final General Fund expenditure budget was $5,310 more than the originally adopted budget due to rebudgeted and encumbered expenditures carried forward from FY2011 to FY2012. Budgeted revenues exceeded budgeted expenditures in the final budget for GF by $161. Actual revenues exceeding actual expenditures by $12,622. The final net budget to actual variances of $1,654 in revenues and $10,807 in expenditures (both favorable) can be summarized as follows: General Fund Favorable Revenue variances • Property tax revenue exceeded budgetary estimates by $404 due to greater delinquent property tax
collections.
• Intergovernmental revenues and licenses and permits exceeded budgetary estimates by $1,115 and $941, respectively. Actual sales tax collections exceeded estimates by $605. Grant revenues exceeded estimates by $336. Licenses and permits increased due to improvement in local economic conditions.
• Charges for Services and Investment income exceeded budgetary estimates by $590 and $149,
respectively. Increases in Charges for Services revenue was due to user fee programs performing better than expected. The City’s Investment income revenue category also includes interest and penalty amounts. The favorable budget to actual variance associated with this category is due primarily to increased investment principal balances and amounts received for interest and penalties related to delinquent property taxes.
MD&A
C-8

General Fund Unfavorable Revenue variances • The Franchise Fees budget to actual variance was unfavorable by $361. This was predominately
due to the recent gas franchise rate reductions. • The Fines and forfeitures budget to actual variance was unfavorable by $509. Parking fine revenue
fell short of budget by $172 and traffic fines fell short of budget by $369. Other revenues in this category accounted for the remaining differential.
• The Donations budget to actual variance was unfavorable by $85. Typically, revenues in this
category are difficult to budget; with matched expense only occurring after a donation is received.
• Miscellaneous revenues fell short of final budgetary estimates by $590. Unused revenue neutral contingency appropriation ($431) accounts for the majority of this shortfall.
General Fund Favorable Expenditure variances During the fiscal year, all functional categories experienced favorable budgetary variances on a net basis. Total actual expenditures were $10,807 less than the final budgetary amount. Savings across the organization were spread throughout both maintenance and operations (M&O) and equipment expenditure accounts. A large part of the savings is associated with unused contingency accounts and cost containment measures by all city departments. • General government expenditures were under budgetary estimates by $5,545 for the fiscal year.
This variance is explained by lower expenditures in various M&O and unused contingency expenditure accounts.
• Culture and community services expenditures were under budgetary estimates by $1,363 and
$1,299, respectively. Culture budgetary savings occurred in Library. This was predominately due to lower M&O expenditures by this department. The Library Department executed cost containment measures earlier than other departments during the fiscal year. That department had $457 in unused appropriation associated with the future replacement of the IOLS on-line system.
• Parks and recreation, police, and fire expenditures were under their budgetary estimates by $700,
$689, and $666, respectively. These savings were principally due to the timing of equipment purchases and ongoing programs that were rebudgeted into FY2013.
• Capital outlay expenditures were under budgetary estimates by $545. These savings were
principally due to the timing of expenditures on multi-year projects. Encumbrances for contractual obligations that could not be completed during the fiscal year were $1,024 while amounts to be rebudgeted into subsequent year expenditures totaled $5,512. Capital Asset and Debt Administration Capital assets in FY2012. The City’s investment in capital assets for its governmental and business- type activities at September 30, 2012, amounted to $636,402 (net of accumulated depreciation). This investment in capital assets includes land, buildings, improvements, service lines, automobiles and equipment, streetlights, and public art. Sidewalks, bridges, and roads belong to the Ada County Highway District (ACHD). The total increase in the City’s investment in capital assets for FY2012 was 1.25% in comparison to the prior year. Of this percent, governmental activities accounted one fourth of the increase whereas business-type activities accounted for the remaining three quarters of the increase. Major capital asset events during the current FY included the following: Governmental Activities
• $3,941 – City Hall Remodel • $1,898 – Harris Ranch Fire Station #15 • $1,873 – City Financial System Implementation • $868 – Marianne Williams Park • $811 – Boise River White Water Recreation Facility
MD&A
C-9
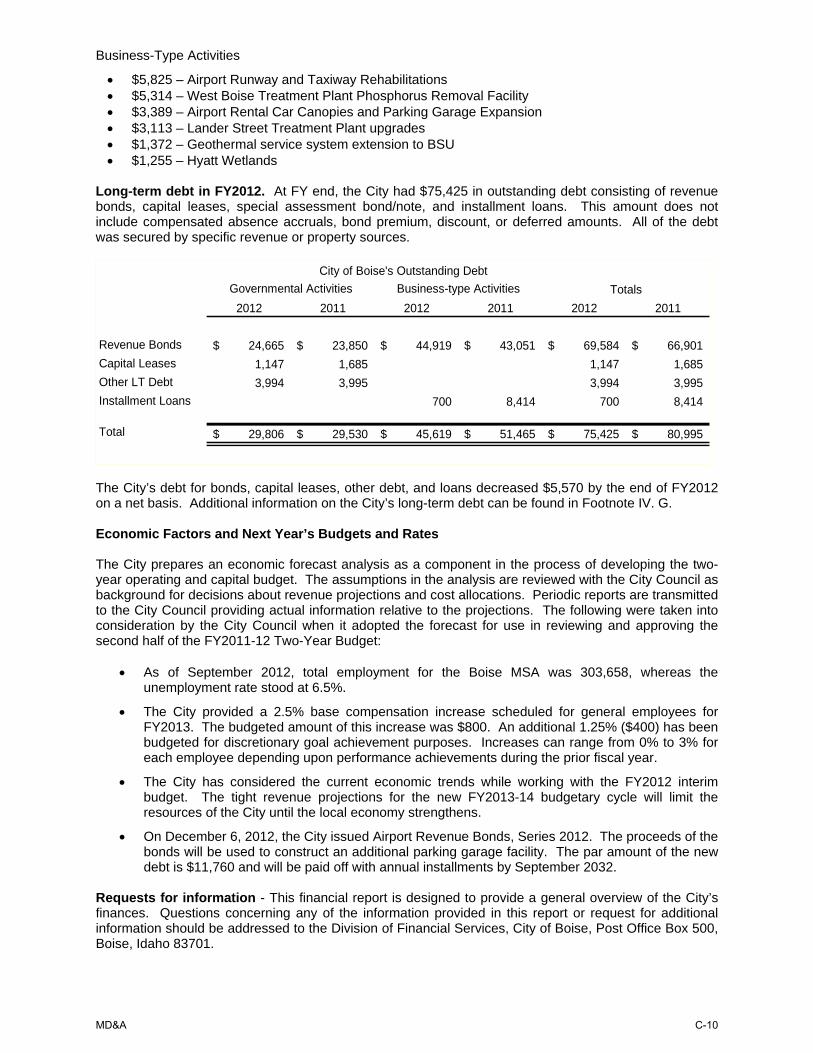
Business-Type Activities • $5,825 – Airport Runway and Taxiway Rehabilitations • $5,314 – West Boise Treatment Plant Phosphorus Removal Facility • $3,389 – Airport Rental Car Canopies and Parking Garage Expansion • $3,113 – Lander Street Treatment Plant upgrades • $1,372 – Geothermal service system extension to BSU • $1,255 – Hyatt Wetlands
Long-term debt in FY2012. At FY end, the City had $75,425 in outstanding debt consisting of revenue bonds, capital leases, special assessment bond/note, and installment loans. This amount does not include compensated absence accruals, bond premium, discount, or deferred amounts. All of the debt was secured by specific revenue or property sources.
City of Boise's Outstanding DebtGovernmental Activities Business-type Activities Totals
2012 2011 2012 2011 2012 2011
Revenue Bonds 24,665$ 23,850$ 44,919$ 43,051$ 69,584$ 66,901$ Capital Leases 1,147 1,685 1,147 1,685 Other LT Debt 3,994 3,995 3,994 3,995 Installment Loans 700 8,414 700 8,414
Total 29,806$ 29,530$ 45,619$ 51,465$ 75,425$ 80,995$
The City’s debt for bonds, capital leases, other debt, and loans decreased $5,570 by the end of FY2012 on a net basis. Additional information on the City’s long-term debt can be found in Footnote IV. G. Economic Factors and Next Year’s Budgets and Rates The City prepares an economic forecast analysis as a component in the process of developing the two-year operating and capital budget. The assumptions in the analysis are reviewed with the City Council as background for decisions about revenue projections and cost allocations. Periodic reports are transmitted to the City Council providing actual information relative to the projections. The following were taken into consideration by the City Council when it adopted the forecast for use in reviewing and approving the second half of the FY2011-12 Two-Year Budget:
• As of September 2012, total employment for the Boise MSA was 303,658, whereas the unemployment rate stood at 6.5%.
• The City provided a 2.5% base compensation increase scheduled for general employees for
FY2013. The budgeted amount of this increase was $800. An additional 1.25% ($400) has been budgeted for discretionary goal achievement purposes. Increases can range from 0% to 3% for each employee depending upon performance achievements during the prior fiscal year.
• The City has considered the current economic trends while working with the FY2012 interim
budget. The tight revenue projections for the new FY2013-14 budgetary cycle will limit the resources of the City until the local economy strengthens.
• On December 6, 2012, the City issued Airport Revenue Bonds, Series 2012. The proceeds of the bonds will be used to construct an additional parking garage facility. The par amount of the new debt is $11,760 and will be paid off with annual installments by September 2032.
Requests for information - This financial report is designed to provide a general overview of the City’s finances. Questions concerning any of the information provided in this report or request for additional information should be addressed to the Division of Financial Services, City of Boise, Post Office Box 500, Boise, Idaho 83701.
MD&A
C-10

This page intentionally left blank
BASIC FINANCIAL STATEMENTS
THE NOTES TO THE FINANCIAL STATEMENTS ARE AN INTEGRAL PART OF THIS STATEMENT
D-1

Governmental Business-typeASSETS Activities Activities Total
Current assets Cash (Note IV A) 11,330$ 990$ 12,320$ Investments (Note IV A) 59,129 69,900 129,029 Receivables (net of allowance for uncollectibles) (Note IV B) Taxes - current 113,645 113,645 Taxes - delinquent 3,347 3,347 Accounts and interest 6,781 8,732 15,513 Grants 376 3,628 4,004 Assessments 21 2,170 2,191 Due from other governmental units Interfund balances (Note IV E) 3,056 (3,056) Inventory 814 2,184 2,998 Other current assets 4,487 463 4,950 Prepaid items 1,364 61 1,425 Total current assets 204,350 85,072 289,422
Noncurrent assets Restricted cash and investments (Note IV A and C) 710 13,584 14,294 Long-term receivable (Note IV B) 2,712 2,712 Mortgage loans receivable 12,265 12,265 Deferred charges 692 24 716 Capital assets not being depreciated: (Note IV D) Land 70,527 35,161 105,688 Intangible assets 474 470 944 Construction in progress 14,947 28,468 43,415 Capital assets net of accumulated depreciation: (Note IV D) Land improvements 24,310 24,310 Leasehold improvements 969 969 Buildings 47,043 161,860 208,903 Improvements other than buildings 32,123 14,945 47,068 Service lines 143,175 143,175 Automobiles and trucks 9,864 8,052 17,916 Machinery and equipment 12,958 26,676 39,634 Intangible assets 1,048 218 1,266 Other capital assets 2,452 662 3,114 Total noncurrent assets 193,807 472,582 666,389 Total assets 398,157$ 557,654$ 955,811$
Primary Government
City of Boise, IdahoStatement of Net Assets
September 30, 2012(amounts expressed in thousands)
BASIC FINANCIAL STATEMENTS
THE NOTES TO THE FINANCIAL STATEMENTS ARE AN INTEGRAL PART OF THIS STATEMENT
D-2

Component UnitCapital City Total
Development Corporation Reporting Entity
5,948$ 18,268 3,520 132,549
8,472 122,117 3,347
669 16,182 4,004 2,191
41,705 41,705
2,998 4,950
1,858 3,283 62,172 351,594
13,512 27,806 2,712
12,265 1,282 1,998
3,944 109,632 944
43,415
24,310 969
17,293 226,196 1,134 48,202
143,175 17,916
322 39,956 1,266 3,114
37,487 703,876 99,659$ 1,055,470$
BASIC FINANCIAL STATEMENTS
THE NOTES TO THE FINANCIAL STATEMENTS ARE AN INTEGRAL PART OF THIS STATEMENT
D-3
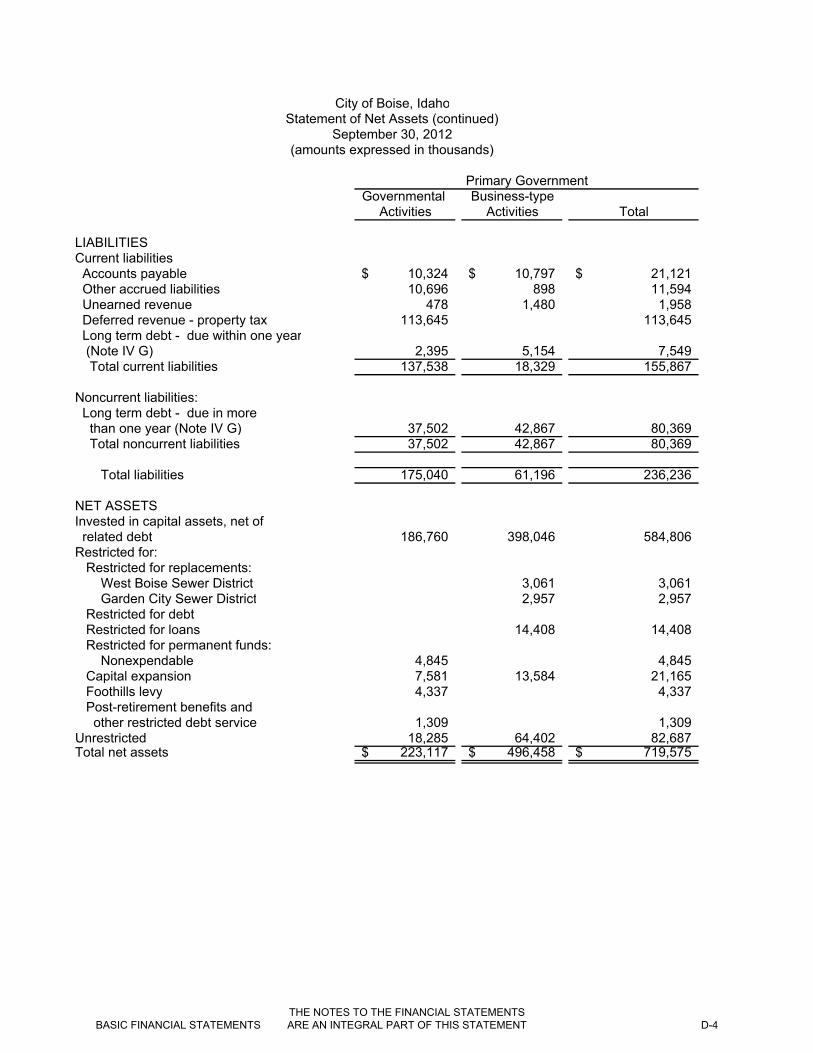
Governmental Business-typeActivities Activities Total
LIABILITIESCurrent liabilities Accounts payable 10,324$ 10,797$ 21,121$ Other accrued liabilities 10,696 898 11,594 Unearned revenue 478 1,480 1,958 Deferred revenue - property tax 113,645 113,645 Long term debt - due within one year (Note IV G) 2,395 5,154 7,549 Total current liabilities 137,538 18,329 155,867
Noncurrent liabilities: Long term debt - due in more than one year (Note IV G) 37,502 42,867 80,369 Total noncurrent liabilities 37,502 42,867 80,369
Total liabilities 175,040 61,196 236,236
NET ASSETSInvested in capital assets, net of related debt 186,760 398,046 584,806 Restricted for: Restricted for replacements: West Boise Sewer District 3,061 3,061 Garden City Sewer District 2,957 2,957 Restricted for debt Restricted for loans 14,408 14,408 Restricted for permanent funds: Nonexpendable 4,845 4,845 Capital expansion 7,581 13,584 21,165 Foothills levy 4,337 4,337 Post-retirement benefits and other restricted debt service 1,309 1,309 Unrestricted 18,285 64,402 82,687 Total net assets 223,117$ 496,458$ 719,575$
Primary Government
City of Boise, IdahoStatement of Net Assets (continued)
September 30, 2012(amounts expressed in thousands)
BASIC FINANCIAL STATEMENTS
THE NOTES TO THE FINANCIAL STATEMENTS ARE AN INTEGRAL PART OF THIS STATEMENT
D-4

Component UnitCapital City Total
Development Corporation Reporting Entity
1,691$ 22,812$ 461 12,055
9,648 11,606 113,645
6,734 14,283 18,534 174,401
61,695 142,064 61,695 142,064
80,229 316,465
11,538 596,344
3,061 2,957
7,841 7,841 14,408
4,845
21,165 4,337
1,309 51 82,738
19,430$ 739,005$
BASIC FINANCIAL STATEMENTS
THE NOTES TO THE FINANCIAL STATEMENTS ARE AN INTEGRAL PART OF THIS STATEMENT
D-5

Operating Capital Charges for Grants and Grants and
Functions/Programs Expenses Services Contributions ContributionsPrimary government: Governmental activities: General government 28,255$ 6,697$ 16,102$ $ Fire 43,876 7,149 304 605 Police 47,591 5,171 1,307 354 Parks and recreation 22,362 6,203 495 2,050 Culture 10,253 495 220 2 Community services 13,287 8,103 315 971 Community and economic development 842 144 478 45 Interest and fiscal charges 1,195 Total governmental activities 167,661 33,962 19,221 4,027
Business-type activities: Airport 30,983 22,824 563 13,527 Sewer 31,853 28,625 3,182 4,492 Solid waste 24,406 23,976 334 5 Other 4,875 2,473 1,531 691 Total business-type activities 92,117 77,898 5,610 18,715 Total primary government 259,778$ 111,860$ 24,831$ 22,742$
Component unit: Capital City Development Corporation Total component unit
General revenues: Taxes: Property taxes, levied for general purposes Property taxes, levied for debt service Franchises, based on gross receipts Unrestricted investment earningsInterfund transfers, net Total general revenues, special items and transfers Change in net assetsNet assets-beginning, as restatedNet assets-ending
Program Revenues
(amounts expressed in thousands)
City of Boise, IdahoStatement of Activities
For the Fiscal Year Ended September 30, 2012
BASIC FINANCIAL STATEMENTS
THE NOTES TO THE FINANCIAL STATEMENTS ARE AN INTEGRAL PART OF THIS STATEMENT
D-6

Component UnitCapital City
Governmental Business-type Development Activities Activities Total Corporation Reporting Entity
(5,456)$ $ (5,456)$ $ (5,456)$ (35,818) (35,818) (35,818) (40,759) (40,759) (40,759) (13,614) (13,614) (13,614)
(9,536) (9,536) (9,536) (3,898) (3,898) (3,898)
(175) (175) (175) (1,195) (1,195) (1,195)
(110,451) (110,451) (110,451)
5,931 5,931 5,931 4,446 4,446 4,446
(91) (91) (91) (180) (180) (180)
10,106 10,106 10,106 (110,451) 10,106 (100,345) (100,345)
(6,254) (6,254) (6,254) (6,254)
106,994 106,994 9,243 116,237 2,320 2,320 2,320 7,189 7,189 7,189
941 1,334 2,275 23 2,298 108 (108)
117,552 1,226 118,778 9,266 128,044 7,101 11,332 18,433 3,012 21,445
216,016 485,126 701,142 16,418 717,560 223,117$ 496,458$ 719,575$ 19,430$ 739,005$
Total Primary Government
Net (Expense) Revenue and Changes in Net Assets
BASIC FINANCIAL STATEMENTS
THE NOTES TO THE FINANCIAL STATEMENTS ARE AN INTEGRAL PART OF THIS STATEMENT
D-7

Other TotalGovernmental Governmental
General Capital Projects Debt Service Funds FundsASSETSCash and cash equivalents (Note IV A) 11,043$ 132$ 3$ 61$ 11,239$ Investments (Note IV A) 24,913 5,486 10,072 9,173 49,644 Receivables (net of allowance for uncollectibles) (Note IV B) Taxes - current 113,608 113,608 Taxes - delinquent 3,347 3,347 Accounts and interest 6,004 695 31 24 6,754 Special assessments 37 37 Grants 334 42 376 Assessments 21 21 Due from component unit Interfund receivables (Note IV E) 5,990 8,064 404 14,458 Inventory 802 802 Prepaid items 827 827 Restricted assets: (Note IV C) Restricted cash and investments 174 536 710 Property held for resale 4,487 4,487 Total assets 166,889$ 18,864$ 10,280$ 10,277$ 206,310$
LIABILITIES AND FUND BALANCESLiabilities: Accounts and interest payable 7,583$ 1,979$ 20$ 320$ 9,902$ Other accrued liabilities 5,039 705 5,744 Due to component unit Interfund payables (Note IV E) 9,065 302 642 10,009 Unearned revenue 331 37 368 Deferred revenue - property tax (Note IV B) 116,399 116,399 Total liabilities 138,417 2,986 20 999 142,422
Fund balances: Nonspendable: Inventory 802 802 Prepaid items 827 827 Employee advances - long term receivable 306 306 Property held for resale 4,487 4,487 Permanent fund principal 3,057 3,057 Restricted for: Drug enforcement 616 616 IOLS consortium 469 469 Library gift funds 257 257 Impact fees projects 19 3,842 3,861 Heritage funds 1,280 1,280 Debt service - WSGC 115 115 Debt service - CID 511 511 Foothills levy 4,337 4,337 Committed to: Homelessness prevention 2,000 2,000 Kaylynn reward 7 7 Detox center 316 316
City of Boise, IdahoBalance Sheet
Governmental FundsSeptember 30, 2012
(amounts expressed in thousands)
BASIC FINANCIAL STATEMENTS
THE NOTES TO THE FINANCIAL STATEMENTS ARE AN INTEGRAL PART OF THIS STATEMENT
D-8

Other TotalGovernmental Governmental
General Capital Projects Debt Service Funds Funds
LIABILITIES AND FUND BALANCESFund balances: Assigned to: General government 2,008 408 2,416 Fire 692 591 1,283 Police 672 672 Parks and recreation 859 593 1,452 Culture 644 580 1,224 Community services 1,661 4,820 6,481 Warm Springs reserve 62 62 Debt service and post employment benefits 10,145 10,145 Community and economic development 588 588 Unassigned 16,317 16,317 Total fund balances 28,472 15,878 10,260 9,278 63,888 Total liabilities and fund balances 166,889$ 18,864$ 10,280$ 10,277$ 206,310$
City of Boise, IdahoBalance Sheet
Governmental Funds (continued)September 30, 2012
(amounts expressed in thousands)
BASIC FINANCIAL STATEMENTS
THE NOTES TO THE FINANCIAL STATEMENTS ARE AN INTEGRAL PART OF THIS STATEMENT
D-9
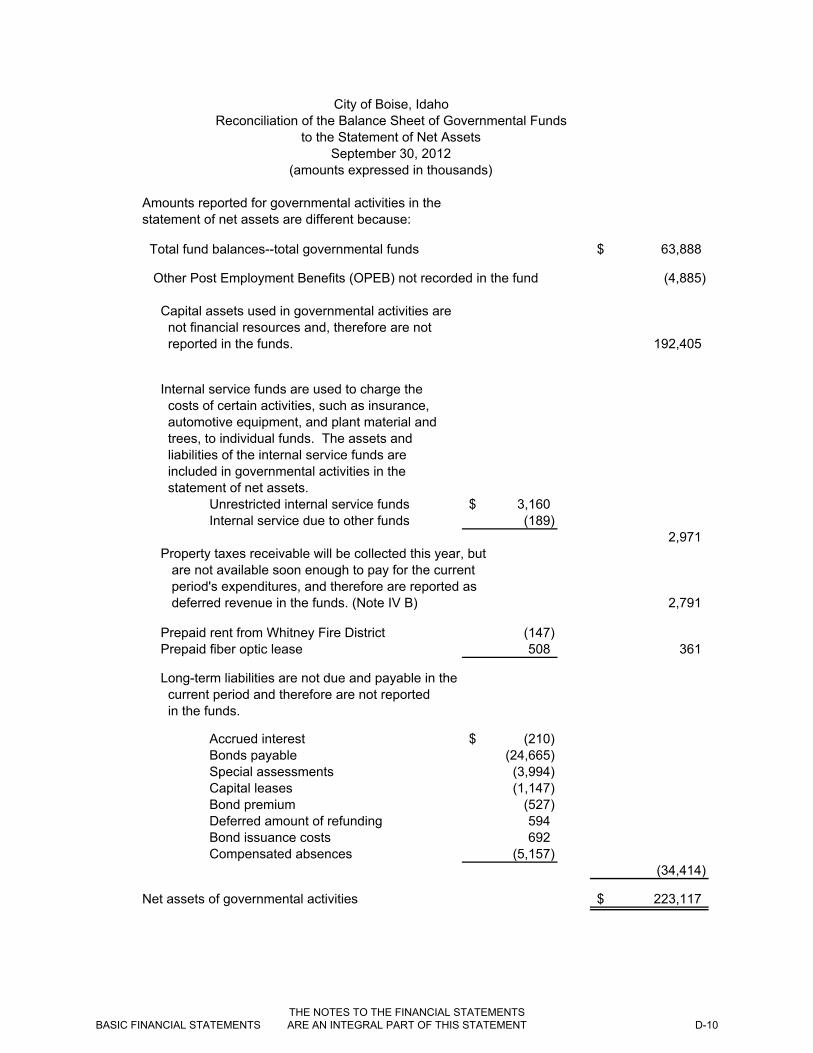
Amounts reported for governmental activities in the statement of net assets are different because:
Total fund balances--total governmental funds 63,888$
Other Post Employment Benefits (OPEB) not recorded in the fund (4,885)
Capital assets used in governmental activities are not financial resources and, therefore are not reported in the funds. 192,405
Internal service funds are used to charge the costs of certain activities, such as insurance, automotive equipment, and plant material and trees, to individual funds. The assets and liabilities of the internal service funds are included in governmental activities in the statement of net assets.
Unrestricted internal service funds 3,160$ Internal service due to other funds (189)
2,971 Property taxes receivable will be collected this year, but are not available soon enough to pay for the current period's expenditures, and therefore are reported as deferred revenue in the funds. (Note IV B) 2,791
Prepaid rent from Whitney Fire District (147) Prepaid fiber optic lease 508 361
Long-term liabilities are not due and payable in the current period and therefore are not reported in the funds.
Accrued interest (210)$ Bonds payable (24,665) Special assessments (3,994) Capital leases (1,147) Bond premium (527) Deferred amount of refunding 594 Bond issuance costs 692 Compensated absences (5,157)
(34,414)
Net assets of governmental activities 223,117$
(amounts expressed in thousands)
City of Boise, IdahoReconciliation of the Balance Sheet of Governmental Funds
to the Statement of Net AssetsSeptember 30, 2012
BASIC FINANCIAL STATEMENTS
THE NOTES TO THE FINANCIAL STATEMENTS ARE AN INTEGRAL PART OF THIS STATEMENT
D-10

This page intentionally left blank
BASIC FINANCIAL STATEMENTS
THE NOTES TO THE FINANCIAL STATEMENTS ARE AN INTEGRAL PART OF THIS STATEMENT
D-11
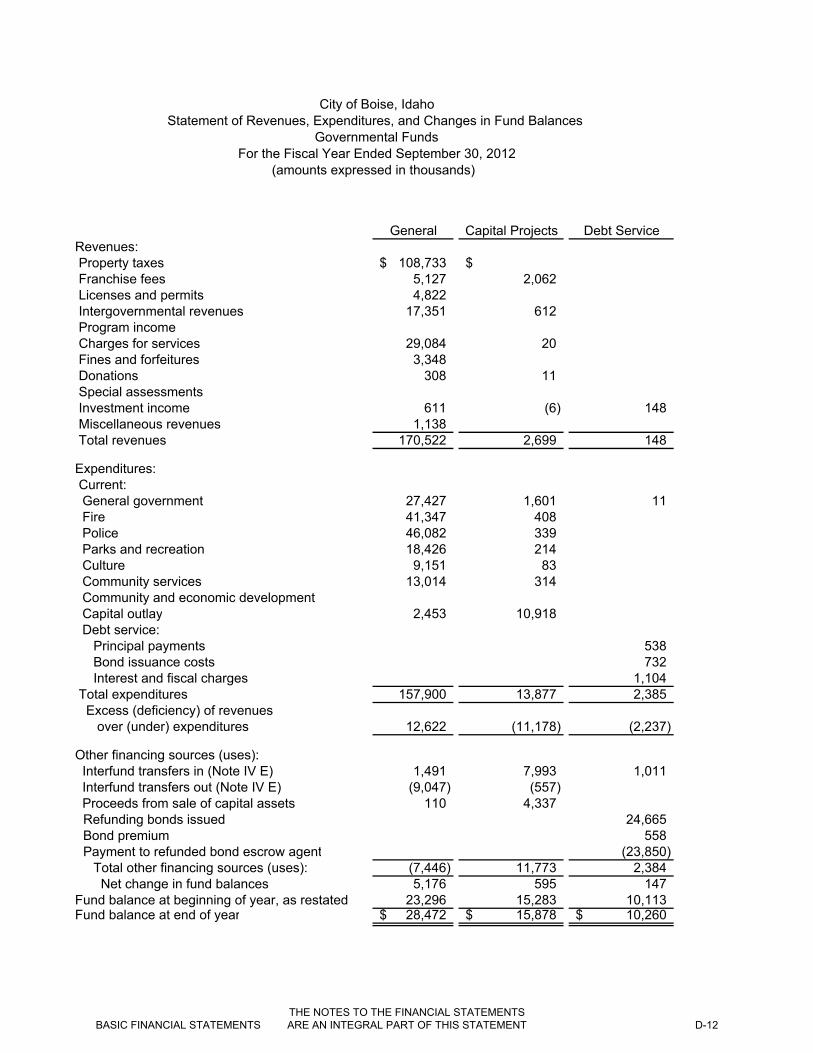
General Capital Projects Debt ServiceRevenues: Property taxes 108,733$ $ Franchise fees 5,127 2,062 Licenses and permits 4,822 Intergovernmental revenues 17,351 612 Program income Charges for services 29,084 20 Fines and forfeitures 3,348 Donations 308 11 Special assessments Investment income 611 (6) 148 Miscellaneous revenues 1,138 Total revenues 170,522 2,699 148
Expenditures: Current: General government 27,427 1,601 11 Fire 41,347 408 Police 46,082 339 Parks and recreation 18,426 214 Culture 9,151 83 Community services 13,014 314 Community and economic development Capital outlay 2,453 10,918 Debt service: Principal payments 538 Bond issuance costs 732 Interest and fiscal charges 1,104 Total expenditures 157,900 13,877 2,385 Excess (deficiency) of revenues over (under) expenditures 12,622 (11,178) (2,237)
Other financing sources (uses): Interfund transfers in (Note IV E) 1,491 7,993 1,011 Interfund transfers out (Note IV E) (9,047) (557) Proceeds from sale of capital assets 110 4,337 Refunding bonds issued 24,665 Bond premium 558 Payment to refunded bond escrow agent (23,850)
Total other financing sources (uses): (7,446) 11,773 2,384 Net change in fund balances 5,176 595 147 Fund balance at beginning of year, as restated 23,296 15,283 10,113 Fund balance at end of year 28,472$ 15,878$ 10,260$
City of Boise, IdahoStatement of Revenues, Expenditures, and Changes in Fund Balances
Governmental FundsFor the Fiscal Year Ended September 30, 2012
(amounts expressed in thousands)
BASIC FINANCIAL STATEMENTS
THE NOTES TO THE FINANCIAL STATEMENTS ARE AN INTEGRAL PART OF THIS STATEMENT
D-12

Other TotalGovernmental Governmental
Funds Funds
$ 108,733$ 7,189
1,726 6,548 478 18,441 144 144 528 29,632
3,348 220 539 45 45
105 858 1,138
3,246 176,615
29,039 41,755 46,421
91 18,731 9,234
2 13,330 811 811
2,834 16,205
1 539 732
358 1,462 4,097 178,259
(851) (1,644)
10 10,505 (58) (9,662)
4,447 24,665
558 (23,850)
(48) 6,663 (899) 5,019
10,177 58,869 9,278$ 63,888$
BASIC FINANCIAL STATEMENTS
THE NOTES TO THE FINANCIAL STATEMENTS ARE AN INTEGRAL PART OF THIS STATEMENT
D-13

Amounts reported for governmental activities in the statement of activities are different because:
Net change in fund balances--total governmental funds 5,019$
Other Post Employment Benefits (OPEB) are not recorded in the fund but are included in the government-wide change in net assets due to governmental activities. 590
Net revenues (expenses) of certain internal service funds is included with governmental activities. (947)
Some of the City's taxes will be collected after year end, but, are not available soon enough for the current period's expenditures and therefore are reported as deferred revenue in the funds. The amount represents the net change in deferred revenue. 581
Governmental funds report capital outlays as expenditures. However, in the Statement of Activities the cost of those assets is allocated over their estimated useful lives and reported as depreciation expense. This is the amount by which capital outlay ($16,205) exceeded depreciation ($9,903) in the current period. 6,302
The net effect of various transactions involving capital assets (i.e., sales and donations) is to increase net assets. (Note II)
Donations of capital assets 875$ Whitney deferred rent amortization 6 Prepaid fiber optic lease 535 Fiber optic lease amortization (27) Proceeds from sale of capital assets (4,447) Loss on sale of capital assets (611) (3,669)
The issuance of long-term debt (e.g., bonds, leases) provides current financial resources to governmental funds, while repayment of the principal of long-term debt consumes the current financial resources of governmental funds. Neither transaction, however, has any effect on net assets. Also, governmental funds report the effect of issuance costs, premiums, discounts and similar items when debt is first issued, whereas these amounts are deferred and amortized in the Statement of Activities. This amount represents the net effect of these differences in the treatment of long-term debt and related items. (Note II)
Golf lease payments 95$ City Hall Lease payments 443 CID long term debt payments 1 Revenue refunding bonds (24,665) Bond premium (558) Deferred issuance costs CID (16) Deferred issuance costs 2011A 732 Payment to escrow agent for refunding 23,850 (118)
(amounts expressed in thousands)
City of Boise, IdahoReconciliation of the Statement of Revenues, Expenditures,
to the Statement of Activities For the Fiscal Year Ended September 30, 2012
and Changes in Fund Balances of Governmental Funds
BASIC FINANCIAL STATEMENTS
THE NOTES TO THE FINANCIAL STATEMENTS ARE AN INTEGRAL PART OF THIS STATEMENT
D-14

Interest expense in the Statement of Activities differ from the amount reported in governmental funds. Additional accrued interest was calculated for bonds and notes payable, and the difference arising from the advance refunding and is being amortized (added to interest expense for the year). This amount represents the net change in accrued interest.
Prior year interest accrual 524$ CID long term debt interest (35) County building current interest (38) Amortization of bond premium 31 Amortization of issuance costs (40) Amortization of deferred charge on refunding (16) Refunding 2011A current interest (137) 289
Compensated absences reported in the Statement of Activities do not require the use of current financial resources and therefore are not reported as expenditures in governmental funds. This amount represents the net change in compensated absences. (946)
Change in net assets of governmental activities 7,101$
(amounts expressed in thousands)
City of Boise, IdahoReconciliation of the Statement of Revenues, Expenditures,
and Changes in Fund Balances of Governmental Fundsto the Statement of Activities (continued)
For the Fiscal Year Ended September 30, 2012
BASIC FINANCIAL STATEMENTS
THE NOTES TO THE FINANCIAL STATEMENTS ARE AN INTEGRAL PART OF THIS STATEMENT
D-15

This page intentionally left blank
BASIC FINANCIAL STATEMENTS
THE NOTES TO THE FINANCIAL STATEMENTS ARE AN INTEGRAL PART OF THIS STATEMENT
D-16

Variances with Original Final Actual Amounts Final Budget
Revenues: Property taxes 108,329$ 108,329$ 108,733$ 404$ Franchise fees 5,488 5,488 5,127 (361) Licenses and permits 3,880 3,881 4,822 941 Intergovernmental revenues 15,636 16,236 17,351 1,115 Charges for services 28,980 28,494 29,084 590 Fines and forfeitures 3,857 3,857 3,348 (509) Donations 263 393 308 (85) Investment income 462 462 611 149 Miscellaneous revenues 1,727 1,728 1,138 (590) Total revenues 168,622 168,868 170,522 1,654
Expenditures: Current: General government 31,237 32,972 27,427 5,545 Fire 41,488 42,013 41,347 666 Police 46,126 46,771 46,082 689 Parks and recreation 18,645 19,126 18,426 700 Culture 9,435 10,514 9,151 1,363 Community services 13,364 14,313 13,014 1,299 Capital outlay 3,102 2,998 2,453 545 Total expenditures 163,397 168,707 157,900 10,807 Excess of revenues over expenditures 5,225 161 12,622 12,461
Other financing sources (uses):
Interfund transfers in 253 253 1,491 1,238 Interfund transfers out (5,476) (4,008) (9,047) (5,039) Proceeds from capital assets 110 110 Total other financing sources (uses): (5,223) (3,755) (7,446) (3,691) Net change in fund balances 2 (3,594) 5,176 8,770 Fund balance at beginning of year 23,296 23,296 23,296 Fund balance at end of year 23,298$ 19,702$ 28,472$ 8,770$
(amounts expressed in thousands)
Budgeted Amounts
City of Boise, IdahoGeneral Fund
Statement of Revenues, Expenditures, and Changes in Fund Balances - Budget and ActualFor the Fiscal Year Ended September 30, 2012
BASIC FINANCIAL STATEMENTS
THE NOTES TO THE FINANCIAL STATEMENTS ARE AN INTEGRAL PART OF THIS STATEMENT
D-17

SolidAirport Sewer Waste
ASSETSCurrent assets:Cash and cash equivalents (Note IV A) 885$ $ 105$ Investments (Note IV A) 30,513 36,496 1,128 Receivables (net of allowance for uncollectibles) (Note IV B) Accounts and interest 1,551 5,165 1,650 Grants 3,310 Assessments 2,163 Interfund receivables (Note IV E) 58 464 166 Inventory 490 1,521 Other assets 338 66 Prepaid items 55 1 Total current assets 37,200 45,876 3,049
Noncurrent assets:Restricted cash and investments (Note IV C) 13,584 Interfund receivables (Note IV E) 63 112 555 Long-term receivables 2,145 Mortgage loans receivableDeferred charges 24 Capital assets: (Note IV D) Land 18,372 14,318 Land improvements 67,177 Buildings 121,393 126,043 Improvements other than buildings 30,685 8,255 Service lines 188,590 Automobiles and trucks 8,684 8,702 241 Machinery and equipment 25,042 43,873 258 Intangible assets 368 1,180 Construction in process 10,650 14,786 Other capital assets 560 302 25 Less accumulated depreciation (122,059) (138,587) (200) Total capital assets (net of accumulated depreciation) 160,872 267,462 324 Total noncurrent assets 174,543 269,719 879 Total assets 211,743$ 315,595$ 3,928$
City of Boise, IdahoStatement of Net Assets
Proprietary FundsSeptember 30, 2012
(amounts expressed in thousands)
Business-type Activities--Enterprise Funds
BASIC FINANCIAL STATEMENTS
THE NOTES TO THE FINANCIAL STATEMENTS ARE AN INTEGRAL PART OF THIS STATEMENT
D-18

GovernmentalOther Nonmajor Activities-Business-type Internal Service
Funds Totals Funds
$ 990$ 91$ 1,763 69,900 9,485
366 8,732 27 318 3,628
7 2,170 183 871 1,102 173 2,184 12 59 463 5 61 29
2,874 88,999 10,746
13,584 730
567 2,712 12,265 12,265
24
2,471 35,161 67,177
10,632 258,068 1,215 2,330 41,270 84 5,326 193,916
142 17,769 587 755 69,928 187 37 1,585 197
3,032 28,468 887
(9,386) (270,232) (1,528)
15,339 443,997 742 28,171 473,312 742 31,045$ 562,311$ 11,488$
BASIC FINANCIAL STATEMENTS
THE NOTES TO THE FINANCIAL STATEMENTS ARE AN INTEGRAL PART OF THIS STATEMENT
D-19

SolidAirport Sewer Waste
LIABILITIESCurrent liabilities: Accounts payable 6,435$ 2,199$ 1,888$ Other accrued liabilities 181 528 Compensated absences (Note IV G) 35 99 4 Interfund payables (Note IV E) 1,067 2,725 295 Unearned revenue 664 508 Current portion of long-term debt (Note IV G) 2,975 1,895 Total current liabilities 10,693 8,110 2,695
Noncurrent liabilities: Compensated absences and other post employment benefits (Note IV G) 501 1,296 34 Interfund payables Other long-term debt, non-current (Note IV G) 25,918 14,463 Total noncurrent liabilities 26,419 15,759 34 Total liabilities 37,112 23,869 2,729
NET ASSETSInvested in capital assets, net of related debt 131,979 251,104 324 Restricted for replacements: West Boise Sewer District 3,061 Garden City Sewer District 2,957 Restricted for loansRestricted for capital expansion 13,584 Unrestricted (deficit) 29,068 34,604 875 Total net assets 174,631$ 291,726$ 1,199$
Business-type Activities--Enterprise Funds
September 30, 2012(amounts expressed in thousands)
City of Boise, IdahoStatement of Net Assets (continued)
Proprietary Funds
BASIC FINANCIAL STATEMENTS
THE NOTES TO THE FINANCIAL STATEMENTS ARE AN INTEGRAL PART OF THIS STATEMENT
D-20

GovernmentalOther Nonmajor Activities-Business-type Internal Service
Funds Totals Funds
275$ 10,797$ 422$ 189 898 4,740
6 144 12 647 4,734 1,688 308 1,480
140 5,010 1,565 23,063 6,862
95 1,926 106 112 112 618
560 40,941 767 42,979 724
2,332 66,042 7,586
14,639 398,046 742
3,061 2,957
14,408 14,408 13,584
(334) 64,213 3,160 28,713$ 496,269$ 3,902$
BASIC FINANCIAL STATEMENTS
THE NOTES TO THE FINANCIAL STATEMENTS ARE AN INTEGRAL PART OF THIS STATEMENT
D-21
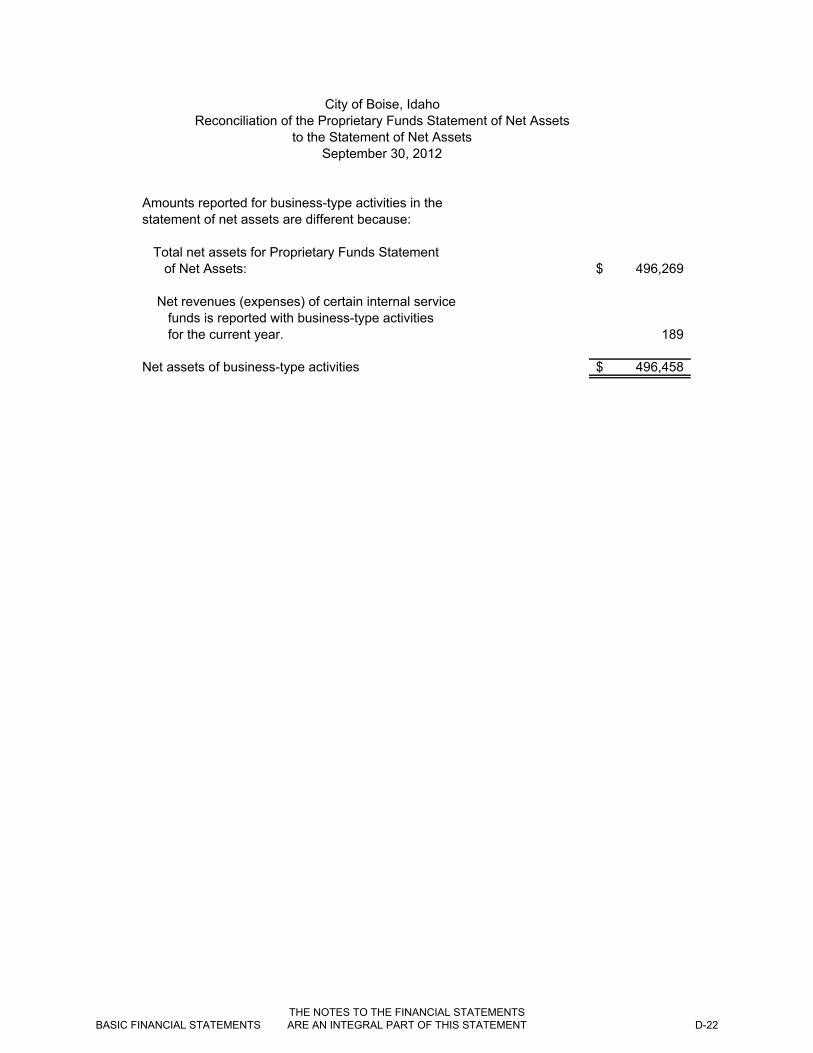
Amounts reported for business-type activities in the statement of net assets are different because:
Total net assets for Proprietary Funds Statement of Net Assets: 496,269$
Net revenues (expenses) of certain internal service funds is reported with business-type activities for the current year. 189
Net assets of business-type activities 496,458$
City of Boise, IdahoReconciliation of the Proprietary Funds Statement of Net Assets
to the Statement of Net AssetsSeptember 30, 2012
BASIC FINANCIAL STATEMENTS
THE NOTES TO THE FINANCIAL STATEMENTS ARE AN INTEGRAL PART OF THIS STATEMENT
D-22

This page intentionally left blank
BASIC FINANCIAL STATEMENTS
THE NOTES TO THE FINANCIAL STATEMENTS ARE AN INTEGRAL PART OF THIS STATEMENT
D-23
SolidAirport Sewer Waste
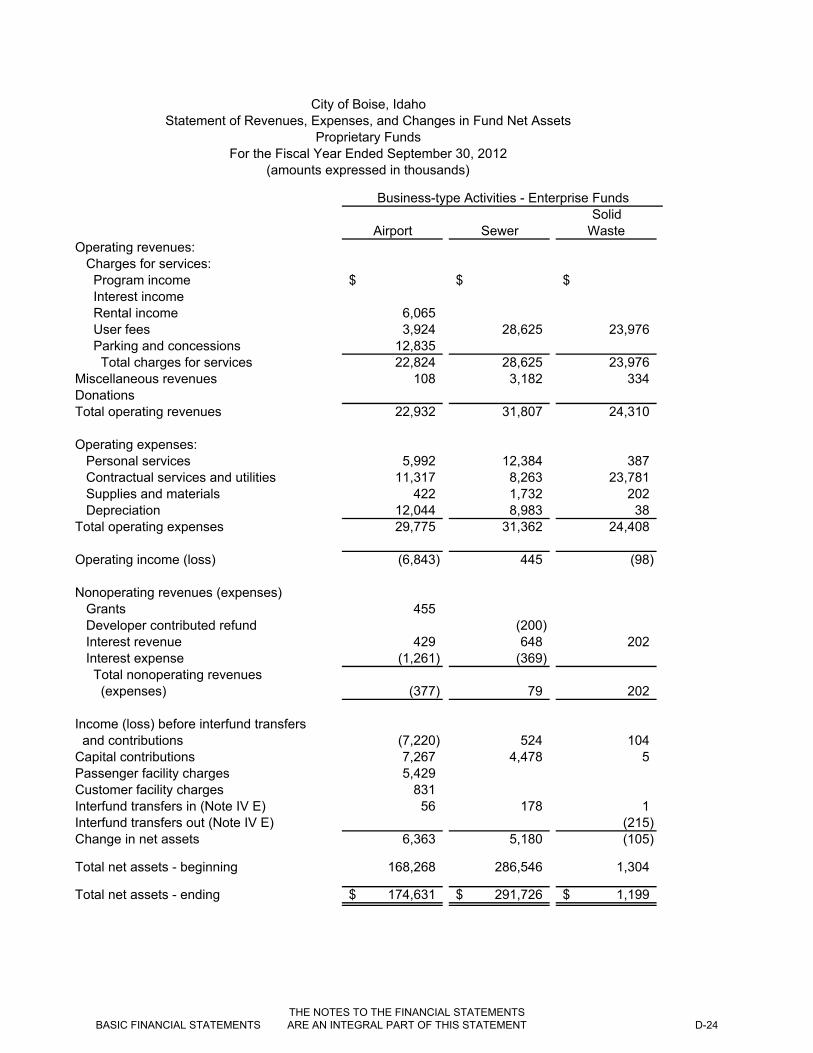
Operating revenues: Charges for services: Program income $ $ $ Interest income Rental income 6,065 User fees 3,924 28,625 23,976 Parking and concessions 12,835 Total charges for services 22,824 28,625 23,976 Miscellaneous revenues 108 3,182 334 DonationsTotal operating revenues 22,932 31,807 24,310
Operating expenses: Personal services 5,992 12,384 387 Contractual services and utilities 11,317 8,263 23,781 Supplies and materials 422 1,732 202 Depreciation 12,044 8,983 38 Total operating expenses 29,775 31,362 24,408
Operating income (loss) (6,843) 445 (98)
Nonoperating revenues (expenses) Grants 455 Developer contributed refund (200) Interest revenue 429 648 202 Interest expense (1,261) (369) Total nonoperating revenues (expenses) (377) 79 202
Income (loss) before interfund transfers and contributions (7,220) 524 104 Capital contributions 7,267 4,478 5 Passenger facility charges 5,429 Customer facility charges 831 Interfund transfers in (Note IV E) 56 178 1 Interfund transfers out (Note IV E) (215) Change in net assets 6,363 5,180 (105)
Total net assets - beginning 168,268 286,546 1,304
Total net assets - ending 174,631$ 291,726$ 1,199$
For the Fiscal Year Ended September 30, 2012(amounts expressed in thousands)
Business-type Activities - Enterprise Funds
City of Boise, IdahoStatement of Revenues, Expenses, and Changes in Fund Net Assets
Proprietary Funds
BASIC FINANCIAL STATEMENTS
THE NOTES TO THE FINANCIAL STATEMENTS ARE AN INTEGRAL PART OF THIS STATEMENT
D-24

Total Nonmajor Governmental Activities-Business-type Funds Totals Internal Service Funds
1,346$ 1,346$ $ 508 508
6,065 619 57,144 6,614
12,835 2,473 77,898 6,614
14 3,638 20 6
2,487 81,536 6,640
998 19,761 1,417 3,227 46,588 4,432
17 2,373 753 590 21,655 117
4,832 90,377 6,719
(2,345) (8,841) (79)
1,517 1,972 (200)
55 1,334 83 (45) (1,675) (9)
1,527 1,431 74
(818) (7,410) (5) 659 12,409
5,429 831
48 283 9 (130) (345) (790) (241) 11,197 (786)
28,954 485,072 4,688
28,713$ 496,269$ 3,902$
BASIC FINANCIAL STATEMENTS
THE NOTES TO THE FINANCIAL STATEMENTS ARE AN INTEGRAL PART OF THIS STATEMENT
D-25

Amounts reported for business-type activities in the statement of activities are different because:
Net change in net assets--total business-type funds 11,197$
Net revenues (expenses) of certain internal service funds is reported with business-type activities. 135
Change in net assets of business-type activities 11,332$
For the Fiscal Year Ended September 30, 2012
City of Boise, IdahoReconciliation of the Statement of Revenues, Expenses,
and Changes in Fund Net Assets of Proprietary Fundsto the Statement of Activities
BASIC FINANCIAL STATEMENTS
THE NOTES TO THE FINANCIAL STATEMENTS ARE AN INTEGRAL PART OF THIS STATEMENT
D-26

This page intentionally left blank
BASIC FINANCIAL STATEMENTS
THE NOTES TO THE FINANCIAL STATEMENTS ARE AN INTEGRAL PART OF THIS STATEMENT
D-27

Airport SewerCASH FLOWS FROM OPERATING ACTIVITIES Receipts from customers and users 21,753$ 27,673$ Receipts from interfund services provided 418 Receipts from interfund services used 447 1,988 Other operating revenue received 500 3,262 Payments to suppliers (8,848) (9,993) Payments to employees (6,096) (12,455) Payments for interfund services provided (20) Payments for interfund services used Other operating payments (51) Net cash provided (used) by operating activities 7,685 10,893 CASH FLOWS FROM NONCAPITAL FINANCING ACTIVITIES Interfund transfers to other funds Receipts from advances to other funds 8 Operating grants received Interfund transfers from other funds 56 178 Payments for advances from other funds Net cash provided (used) by noncapital financing activities 64 178 CASH FLOWS FROM CAPITAL AND RELATED FINANCING ACTIVITIES Acquisition and construction of capital assets (12,159) (12,586) Proceeds from sale of capital assets 30 60 Proceeds from long term debt 16,345 NSP refurbishments Principal paid on debt (2,860) (18,699) Interest paid on financing (1,560) (579) Capital contributions received Capital grants received 6,326 Hook-on fees received 3,727 Developer contributed refunds paid (200) Passenger facility charges 5,429 Customer facility charges 831 Net cash used by capital and related financing activities (3,963) (11,932)
Business-type Activities -Enterprise Funds
City of Boise, IdahoStatement of Cash Flows
Proprietary FundsFor the Fiscal Year Ended September 30, 2012
(amounts expressed in thousands)
BASIC FINANCIAL STATEMENTS
THE NOTES TO THE FINANCIAL STATEMENTS ARE AN INTEGRAL PART OF THIS STATEMENT
D-28
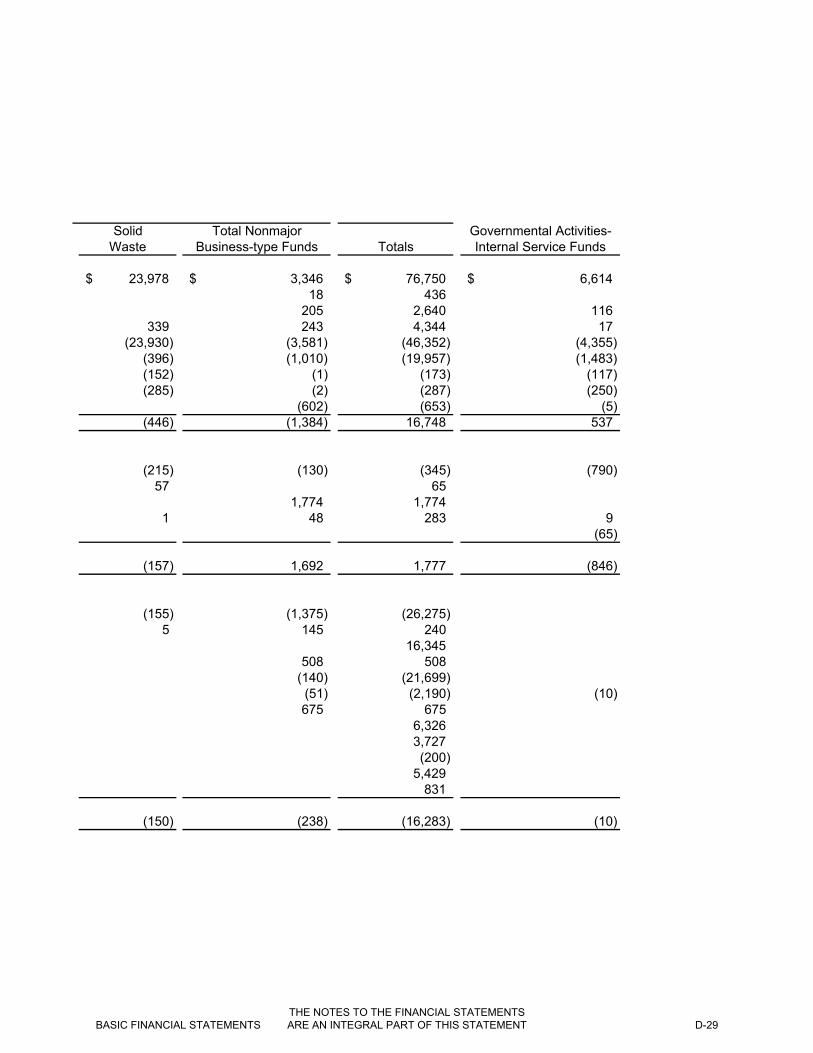
Solid Total Nonmajor Governmental Activities-Waste Business-type Funds Totals Internal Service Funds
23,978$ 3,346$ 76,750$ 6,614$ 18 436 205 2,640 116
339 243 4,344 17 (23,930) (3,581) (46,352) (4,355)
(396) (1,010) (19,957) (1,483) (152) (1) (173) (117) (285) (2) (287) (250)
(602) (653) (5) (446) (1,384) 16,748 537
(215) (130) (345) (790) 57 65
1,774 1,774 1 48 283 9
(65)
(157) 1,692 1,777 (846)
(155) (1,375) (26,275) 5 145 240
16,345 508 508
(140) (21,699) (51) (2,190) (10) 675 675
6,326 3,727 (200)
5,429 831
(150) (238) (16,283) (10)
BASIC FINANCIAL STATEMENTS
THE NOTES TO THE FINANCIAL STATEMENTS ARE AN INTEGRAL PART OF THIS STATEMENT
D-29

Airport SewerCASH FLOWS FROM INVESTING ACTIVITIES Purchase of investment securities (30,029) (26,312) Proceeds from sale and maturities of investment securities 28,097 25,636 Interest on investments and advances 393 648 Net cash provided (used) by investing activities (1,539) (28) Net increase (decrease) in cash and cash equivalents 2,247 (889) Cash and cash equivalents at beginning of year
Cash and cash equivalents at beginning of year 12,222 889
Cash and cash equivalents at end of year 14,469$ $
Reconciliation of operating income to net cashprovided (used) by operating activities: Operating income (loss) (6,843)$ 445$ Adjustments to reconcile operating income (loss) to net cash provided (used) by operating activities: Depreciation 12,044 8,983 Amortization 148 32 (Gain) loss on disposal of capital assets 118 48 (Increase) decrease in accounts receivable (155) (957) (Increase) decrease in assessments (Increase) decrease in mortgage loans receivable (Increase) decrease in mortgage loans in process (Increase) decrease in other assets 74 (Increase) decrease in inventory 122 (47) (Increase) decrease in interfund receivables (20) 418 (Increase) decrease in prepaid items 8 Increase (decrease) in accounts payable 2,493 (607) Increase (decrease) in compensated absences 162 533 Increase (decrease) in other accrued liabilities 3 52 Increase (decrease) in interfund payables 447 1,988 Increase (decrease) in unearned revenue (916) 5 Total adjustments 14,528 10,448 Net cash provided (used) by operating activities 7,685$ 10,893$
Noncash investing, capital and financing activities: Contributions of capital assets from government 14 Contributions of capital assets from developers 613 Increase (decrease) in fair value of investments 36
Enterprise Funds
City of Boise, IdahoStatement of Cash Flows (continued)
Proprietary FundsFor the Fiscal Year Ended September 30, 2012
(amounts expressed in thousands)
Business-type Activities -
BASIC FINANCIAL STATEMENTS
THE NOTES TO THE FINANCIAL STATEMENTS ARE AN INTEGRAL PART OF THIS STATEMENT
D-30

Solid Total Nonmajor Governmental Activities-Waste Business-type Funds Totals Internal Service Funds
(225) (1,249) (57,815) (8,129) 550 1,090 55,373 8,369 198 53 1,292 110 523 (106) (1,150) 350
(230) (36) 1,092 31
335 36 13,482 60
105$ $ 14,574$ 91$
(98)$ (2,345)$ (8,841)$ (79)$
38 590 21,655 117 180
5 171 (14) 26 927 (159) 1
(2) (2) (357) (357) 366 366
74 (10) 65 1
(152) 17 263 (79) (4) 4 5
36 (362) 1,560 (22) 8 26 729 (372) (317) 779
(285) 203 2,353 (172) (24) (61) (996)
(348) 961 25,589 616 (446)$ (1,384)$ 16,748$ 537$
32 46 613
1 2 39 (16)
BASIC FINANCIAL STATEMENTS
THE NOTES TO THE FINANCIAL STATEMENTS ARE AN INTEGRAL PART OF THIS STATEMENT
D-31

Health InsuranceSelf FundingTrust Fund
ASSETS Cash and cash equivalents (Note IV A) 239$ 10$ Receivables: (Note IV B) Accounts receivable 56 Interest and dividends 11 Investments, at fair value: (Note IV A) U.S. Treasuries 200 Federal government agencies 3,063 Other investments 711 1,093 Total investments 3,974 1,093 Total assets 4,280 1,103
LIABILITIES Accounts and interest payable 1,412 339 Refunds payable and other 764 Total liabilities 1,412 1,103$
NET ASSETSHeld in trust for: Employees' health insurance benefits 2,868 Total net assets 2,868$
Agency Fund
(amounts expressed in thousands)
City of Boise, IdahoStatement of Fiduciary Net Assets
Fiduciary FundsSeptember 30, 2012
Boise City
BASIC FINANCIAL STATEMENTS
THE NOTES TO THE FINANCIAL STATEMENTS ARE AN INTEGRAL PART OF THIS STATEMENT
D-32

Health InsuranceSelf FundingTrust Fund
AdditionsContributions: Employer 345$ Plan members 11,200 Total contributions 11,545 Investment earnings: Net increase (decrease) in fair value of investments 3 Interest 36 Total investment earnings 39 Pharmacy Rebate 117 Total additions 11,701
DeductionsInsurance claim benefits 11,167 Administrative expenses 1,358 Total deductions 12,525 Change in net assets (824) Net assets - beginning of the year 3,692 Net assets - end of the year 2,868$
(amounts expressed in thousands)
City of Boise, IdahoStatement of Changes in Fiduciary Net Assets
Fiduciary FundsFor the Fiscal Year Ended September 30, 2012
BASIC FINANCIAL STATEMENTS
THE NOTES TO THE FINANCIAL STATEMENTS ARE AN INTEGRAL PART OF THIS STATEMENT
D-33

This page intentionally left blank
BASIC FINANCIAL STATEMENTS
THE NOTES TO THE FINANCIAL STATEMENTS ARE AN INTEGRAL PART OF THIS STATEMENT
D-34

CITY OF BOISE NOTES TO THE FINANCIAL STATEMENTS FOR THE FISCAL YEAR ENDING SEPTEMBER 30, 2012 (AMOUNTS EXPRESSED IN THOUSANDS) I. SUMMARY OF SIGNIFICANT ACCOUNTING POLICIES The accounting and reporting policies of the City of Boise (the City) conform to U.S. generally accepted accounting principles applicable to state and local governments. Generally accepted accounting principles (GAAP) for local governments include those principles prescribed by the Government Accounting Standards Board (GASB), the American Institute of Certified Public Accountants (AICPA) in the publication entitled “Audits of State and Local Governmental Units”, and by the Financial Accounting Standards Board (FASB) when applicable. As allowed in Section P80 of GASB’s “Codification of Governmental Accounting and Financial Reporting Standards”, the City has elected not to apply to its enterprise and government-wide financial statements private-sector guidance issued after November 30, 1989. A. Financial Reporting Entity As required by GAAP, these basic financial statements present the City and its component unit in conformance with the GASB Statement No. 14, “The Financial Reporting Entity” and GASB Statement No. 39, “Determining Whether Certain Organizations Are Component Units.” Under these statements, component units are organizations that are included in the City’s reporting entity because of the significance of their operational or financial relationship with the City. The Component Unit column in the accompanying financial statements contains the financial data for one of the City’s component units; the Capital City Development Corporation (CCDC). CCDC is a separate and distinct legal entity created by state statute but does not have fiscal independence from the City. The directors are appointed by the Mayor and approved by City Council. If the CCDC should go out of business, the assets would revert to the City. CCDC is therefore included in the financial statements as a discretely presented component unit. CCDC provides urban renewal services and parking facilities for the citizens of the City. Complete financial statements of CCDC can be obtained from their office at 800 W. Idaho Street, Boise, Idaho. The City has another component unit, Harris Ranch Community Infrastructure District No. 1. This is a separate legal entity that is duly organized and operated under Chapter 31, Title 50 of the Idaho Code. The assets, liabilities, revenues, and expenditures of this entity are blended within the City’s Government-wide financial statements. Organizations for which the City is accountable because it appoints a voting majority of the board but is not financially accountable are referred to as related organizations. Financial information of related organizations is not included in the City’s financial statements. The only related organization of the City is the Boise City/Ada County Housing Authority. B. Government Wide and Fund Financial Statements The government wide financial statements, which are the statement of net assets and the statement of activities, report information on all of the non-fiduciary activities of the primary government and it’s discretely presented component units. For the most part, the effect of inter-fund activity has been removed from these statements. Governmental activities, which normally are supported by taxes and intergovernmental revenues, are reported separately from business-type activities, which rely to a significant extent on fees and charges for support. Governmental activities for this fiscal year include the assets, liabilities, revenues, and expenditures of a legally separate entity (Harris Ranch Community Infrastructure District) that met the blending requirements for component unit presentation. Similar to last fiscal year, the primary government and its blended component unit are reported separately from Capital City Development Corporation (CCDC). CCDC is a legally separated component unit (CCDC) for which the primary government is financially accountable. The statement of activities demonstrates the degree to which the direct expenses of a given function or segment is offset by program revenues. Direct expenses are those that are clearly identifiable with a specific function or segment. Program revenues include: 1) charges to customers or applicants who purchase, use, or directly benefit from goods, services, or privileges provided by a given function
FOOTNOTES
E-1

or segment; and 2) grants and contributions that are restricted to meeting the operational and/or capital requirements of a particular function or segment. Taxes and other items not included among program revenues are reported instead as general revenues. Separate financial statements are provided for governmental funds, proprietary funds, and fiduciary funds; even though the latter are excluded from the government wide financial statements. Measurement Focus, Basis of Accounting, and Financial Statement Presentation The government wide financial statements are reported using the economic resources measurement focus and the accrual basis of accounting, as are the proprietary fund and fiduciary fund financial statements. Agency funds use the accrual basis of accounting, but have no measurement focus. Revenues are recorded when earned and expenses are recorded when a liability is incurred regardless of the timing of the cash flows. Property taxes are recognized as revenues in the year for which they are levied. Grants and similar items are recognized as revenue as soon as all eligibility requirements imposed by the provider have been met. Governmental fund financial statements are reported using the current financial resources measurement focus and the modified accrual basis of accounting. Revenues are recognized as soon as they are both measurable and available. Revenues are considered to be available when they are collectible within the current period or soon enough thereafter to pay liabilities of the current period. For this purpose, the City considers property tax revenues to be available if they are collected within 60 days of the end of the current period. Expenditures generally are recorded when a liability is incurred, as under accrual accounting. However, debt service expenditures, as well as expenditures related to compensated absences, claims and judgments, are recorded only when payment is due. Property taxes, sales and liquor taxes, franchise fees, and interest associated with the current fiscal period are all considered to be susceptible to accrual; and so have been recognized as revenues of the current period. The government reports the following major governmental funds:
The General Fund is the government’s primary operating fund. It accounts for all financial resources of the general government, except those required to be accounted for in another fund. The Capital Projects Fund is used to account for financial resources used for the acquisition, construction, and improvement of major capital assets other than those financed by proprietary and fiduciary funds. The Debt Service Fund is used to account for governmental principal and interest debt service in addition to amounts accumulated for debt reserves, compensated absences, and post-retirement benefits.
The government reports the following major proprietary funds:
The Airport Fund accounts for the operation of the municipal airport. All operations, debt service, and capital additions are accounted for in the fund. The Sewer Fund accounts for the operation of the portion of the sewer system owned by the City. Three sewer districts collect sewage within the City and contract with the City to process it in one of the two City operated plants. Debt service and capital improvements are also accounted for in this fund. The Solid Waste Fund accounts for the City solid waste service. The collection service is contracted with an independent firm and Ada County landfill service.
Additionally, the government reports the following fund types: Internal Service Funds account for vehicle maintenance, risk management, and arboretum services provided to other departments of the government or other government entities on a cost reimbursement basis.
FOOTNOTES
E-2

The Health Insurance Trust is used to account for the City’s self insured health insurance trust. Plan assets are dedicated to providing health benefits to current and retired employees.
The Agency Fund accounts for items that must be held in trust for any reason. The major item accounted for in this fund is the Boise Improvement District payments. As a general rule, the effect of inter-fund activity has been eliminated from the government-wide financial statements. Exceptions to this general rule are charges between the government’s sewer and solid waste functions and various other functions of the government. Elimination of these charges would distort the direct costs and program revenues reported for the various functions concerned. Indirect charges have been eliminated in the entity wide statements. Proprietary funds distinguish operation revenues and expenses from non-operating items. Operating revenues and expenses generally result from providing services, producing and delivering goods in connection with a proprietary fund’s principal ongoing operations. The principal operating revenues of the proprietary and internal service funds are charges to customers for sales and services. Operating expenses for proprietary funds and internal service funds include the cost of sales and services, administrative expenses and depreciation on capital assets. All revenues and expenses not meeting this definition are reported as non-operating revenues and expenses. C. Assets, Liabilities and Net Assets or Equity 1. Cash and Investments Cash represents cash on hand and in banks. Some of the cash resources of the individual funds are combined to form a pool of cash for cash management purposes. Investments made from pooled cash consist primarily of short-term investments. Typically, these funds are invested in money market mutual funds and the State of Idaho Local Government Investment Pool. Interest income earned as a result of pooling is distributed to the appropriate funds based on the average daily balance of pooled cash of each fund. Investments are reported at fair value except for money market investments with a remaining life to maturity at time of purchase of less than one year as required by GASB Statement No. 31. Fair value is estimated for investments without quoted market prices by using on line or other independent sources to identify market prices of similar investments. Restricted cash equivalents are defined differently than unrestricted cash equivalents because they are restricted by an outside source. Restricted cash equivalents are reported in the statement of cash flows. The City has entered into a custodial agreement with a financial institution for the purpose of providing safekeeping and custody of certain investments owned by the City. Idaho Code provides authorization for the investment of funds as well as specific guidelines as to what constitutes and allowable investment. City policy is consistent with these guidelines. The City, except as indicated below, is limited to the following general types of investments:
• Certain revenue bonds, general obligation bonds, local improvement district bonds, tax and revenue anticipation notes, and registered warrants of state and local government entities.
• Time deposit accounts. • Bonds, treasury bills, interest-bearing notes, debentures or other similar obligations of the
United States Government and the Farm Credit System and its agencies and instrumentalities. U.S. Government Securities include U.S. Treasury receipts and U.S. Treasury Stripped Interest Payment series (STRIPS).
• Repurchase agreements. • Banker’s acceptance and prime commercial paper. • Mutual or Money Market Funds. • Corporate notes rated A or better.
Investments associated with the City’s deferred compensation plans are subject to the investment guidelines of state laws governing such plans, which allow for investment in equity securities in addition to the investment alternatives indicated above. Investments associated with the Health Insurance Trust Fund must be allowable under both Idaho code 50-1013 and 68:401 et. Seq.
FOOTNOTES
E-3

2. Receivables and Payables Outstanding balances between funds at the end of the fiscal year are referred to as either “interfund receivables” or “interfund payables”. Any residual balances outstanding between the governmental activities and business-type activities are reported in the government wide financial statements as “interfund balances”. Idaho Code provides taxing entities the ability to levy property taxes for the current or ensuing year. The City levies property taxes, as most entities do, for the ensuing year. This results in the tax collections being received in the fiscal year they are budgeted for and used to pay expenditures of that period. In the General Fund, there is an allowance for uncollectibles for any specific items in dispute. In the proprietary funds, receivables are shown net of an allowance for uncollectibles. In the Sewer and Solid Waste Funds, the allowance consists of amounts equal to 15% of utility receivables. The Airport Allowance is made up of specific receivables turned over to collections. The property tax calendar is as follows:
• Property taxes attach as an enforceable lien on property as of January 1st. • Taxes are levied on the third Monday in September for the subsequent year. • Ada County bills and collects property taxes for the City. • The first half of the taxes is payable to Ada County by December 20th and the second by June
20th of the following year. Taxes are remitted to the City in the month following collection. 3. Inventories Inventories are stated at cost (first in, first out method). The cost of inventory items are recognized as expenditures in governmental financial statements and as expenses in government-wide and proprietary fund financial statements when used (consumption method). 4. Restricted Assets Funds to meet bond reserve and debt service requirements for the debt service and enterprise funds, deferred compensation amounts held for the benefit of employees and cash from Passenger Facility Charges are classified as restricted assets since applicable bond indenture provisions, trust agreements, and federal regulations limit their use. While there is no written policy, the practice is to use restricted assets first when an expense is incurred for purposes for which both restricted and unrestricted assets are available. 5. Property, Plant, and Equipment Capital assets, including property, plant, equipment, and infrastructure assets (e.g., sewer lines, runways, and similar items) are reported in the applicable governmental or business-type activities columns in the government-wide financial statements. The government defines capital assets, as assets with an initial individual cost equal to $5 or more and an estimated useful life of at least three years. All material capital assets are valued at historical cost. Donated capital assets are valued at their estimated fair value on the date donated. When an asset is disposed of, cost and related accumulated depreciation is removed. Any gain or loss arising from the disposal is credited or charged back to operations. The cost of normal maintenance and repairs that do not add to the value of the asset or materially extend asset lives are not capitalized. Major outlays for capital assets and improvements are capitalized as projects are constructed. Interest incurred during the construction phase of capital assets of business-type activities is included as part of the capitalized value of the assets constructed. The total capitalized interest during the current fiscal year was $142 for Airport projects and $372 for Sewer projects. Depreciation is recorded by use of the straight-line method. The book value of each asset is reduced by equal amounts over its estimated useful life as follows:
FOOTNOTES
E-4
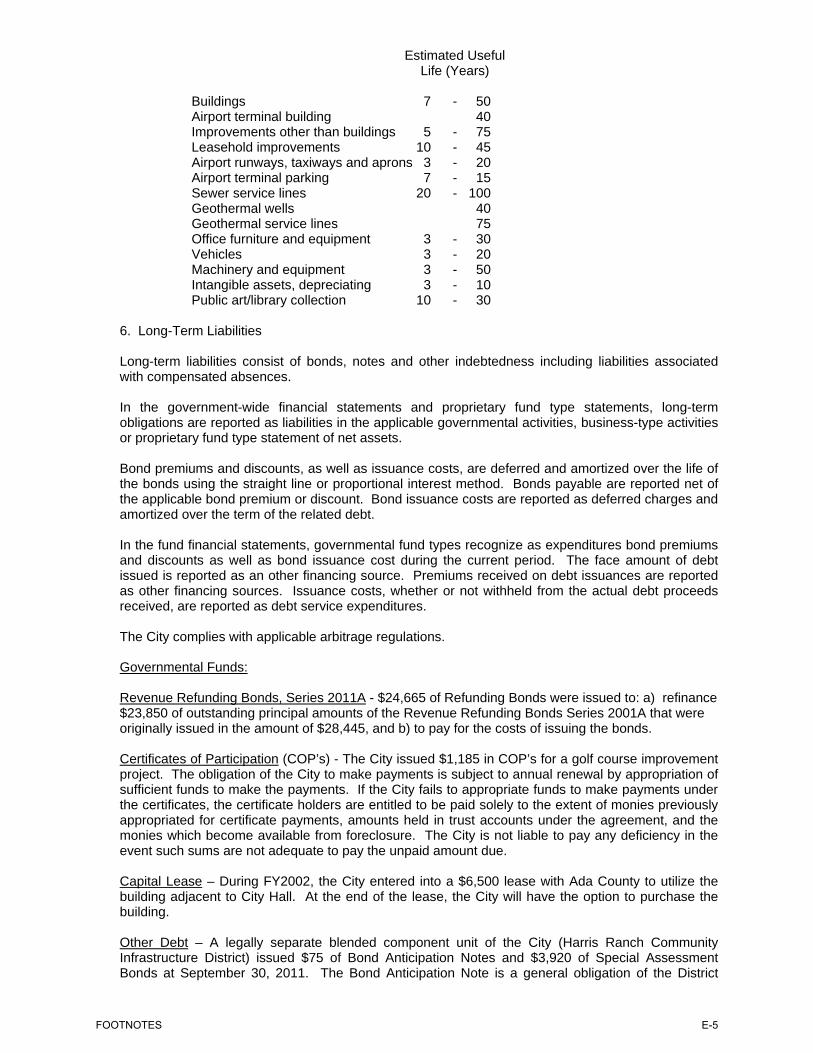
Estimated Useful Life (Years)
Buildings 7 - 50 Airport terminal building 40 Improvements other than buildings 5 - 75 Leasehold improvements 10 - 45 Airport runways, taxiways and aprons 3 - 20 Airport terminal parking 7 - 15 Sewer service lines 20 - 100 Geothermal wells 40 Geothermal service lines 75 Office furniture and equipment 3 - 30 Vehicles 3 - 20 Machinery and equipment 3 - 50 Intangible assets, depreciating 3 - 10 Public art/library collection 10 - 30
6. Long-Term Liabilities Long-term liabilities consist of bonds, notes and other indebtedness including liabilities associated with compensated absences. In the government-wide financial statements and proprietary fund type statements, long-term obligations are reported as liabilities in the applicable governmental activities, business-type activities or proprietary fund type statement of net assets. Bond premiums and discounts, as well as issuance costs, are deferred and amortized over the life of the bonds using the straight line or proportional interest method. Bonds payable are reported net of the applicable bond premium or discount. Bond issuance costs are reported as deferred charges and amortized over the term of the related debt. In the fund financial statements, governmental fund types recognize as expenditures bond premiums and discounts as well as bond issuance cost during the current period. The face amount of debt issued is reported as an other financing source. Premiums received on debt issuances are reported as other financing sources. Issuance costs, whether or not withheld from the actual debt proceeds received, are reported as debt service expenditures. The City complies with applicable arbitrage regulations. Governmental Funds: Revenue Refunding Bonds, Series 2011A - $24,665 of Refunding Bonds were issued to: a) refinance $23,850 of outstanding principal amounts of the Revenue Refunding Bonds Series 2001A that were originally issued in the amount of $28,445, and b) to pay for the costs of issuing the bonds. Certificates of Participation (COP’s) - The City issued $1,185 in COP’s for a golf course improvement project. The obligation of the City to make payments is subject to annual renewal by appropriation of sufficient funds to make the payments. If the City fails to appropriate funds to make payments under the certificates, the certificate holders are entitled to be paid solely to the extent of monies previously appropriated for certificate payments, amounts held in trust accounts under the agreement, and the monies which become available from foreclosure. The City is not liable to pay any deficiency in the event such sums are not adequate to pay the unpaid amount due. Capital Lease – During FY2002, the City entered into a $6,500 lease with Ada County to utilize the building adjacent to City Hall. At the end of the lease, the City will have the option to purchase the building. Other Debt – A legally separate blended component unit of the City (Harris Ranch Community Infrastructure District) issued $75 of Bond Anticipation Notes and $3,920 of Special Assessment Bonds at September 30, 2011. The Bond Anticipation Note is a general obligation of the District
FOOTNOTES
E-5
whereas the Special Assessment bond is to be repaid by assessments against individual properties within the District. These debt issues are not an obligation of the City. Compensated Absences Payable – Boise City provides vacation and sick leave to its full-time employees. Earned vacation is paid to employees when taken or paid to employees or their beneficiaries upon the employee’s termination, retirement, or death. Certain employees can elect to be paid each year for a portion of their accrued unused vacation. The amount of unused vacation accumulated by City employees is accrued as expense when incurred in Proprietary funds and the entity-wide financial statements, which both use the accrual basis of accounting. In the Governmental Fund statements only the amount that normally would be liquidated with expendable available financial resources is accrued as current year expenditures and therefore compensated absences are recognized only when they mature. Unless it is anticipated that compensated absences will be used in excess of a normal year’s accumulation, no additional expenditures are accrued. Sick leave is paid to employees when taken and the cost is recognized when payment is made. There are some employee groups accounted for in the General Fund that receive a portion of their earned sick leave when they retire due to the provisions of related employee group contracts. During 2012, $118 was paid to these eligible employees. These employee group contracts also provide for some of the sick leave payoff funds to be transferred annually to a Post Employment Health Plan (PEHP). In 2012, the City contributed on behalf of employees not belonging to the contract groups mentioned above, a percentage of sick leave accumulated over 600 hours to the PEHP. During 2012, $76 was transferred to the PEHP for this group. See the separate discussion of the PEHP. Enterprise Funds: Airport Refunding Bonds – The City issued the Airport Revenue Refunding Bonds Series 2011 in the amount of $32,480. The bonds were used to: a) refinance the outstanding principal amount of the Airport Revenue COPS, Series 2000 originally issued in the aggregate amount of $52,000 and (b) to pay the costs of issuing the bonds. The pledged revenue to cover the bonds includes all Airport operating revenue, interest income, operating grants and passenger facility charges. It excludes interest expense, gain on property sale/exchange, depreciation, expenditures and debt service on senior and parity debt related to passenger facility charges. In FY 2012 the net available revenue pledged to the bonds was $11,059. The debt service was $2,860 principal and $1,560 interest giving a coverage ratio of 2.50. Note IV G contains the bond terms. Wastewater Facility Refunding Bonds – Series 2012 The City issued the Wastewater Facility Refunding Bonds, Series 2012 in the amount of $16,699. The proceeds from the refunding bonds were used to extinguish two forms of debt: a) refinance $9,945 of outstanding principal of the 1999 Refunding Bonds originally issued in the aggregate amount of $22,145; (b) to refund $7,339 of outstanding DEQ Loans originally issued in the aggregate amount of $8,912; and (c) to pay the costs of issuing the bonds. Section 108 Advance – The City has entered into an advance with the United States Department of Housing and Urban Development to convert facilities for use as affordable housing units. Optional redemption is available for principal amounts due on or after August 1, 2013. DEFERRED COMPENSATION The City has two deferred compensation plans. The first is available to regular employees other than sworn police officers and the second for regular sworn police officers only. Employees may make voluntary contributions to the plans within the dollar limits allowed by the Internal Revenue Service Code Section 457. The City matches any contribution made by a sworn police officer up to a maximum of 3.5 percent of base salary each plan year. The City also matches the contribution of general employees, based on years of service, up to a maximum of 2 percent. The City matches contributions made by Department Heads at 4.5 percent of salary per plan year. Fire Fighters do not receive matching funds toward their contributions to the plan. The City has no liability for losses under the plan but the Administrative Board does have fiduciary responsibility regarding oversight of the plan and the investment options made available to
FOOTNOTES
E-6

participants. The assets held in the City’s Deferred Compensation Accounts are not presented in the City’s Comprehensive Annual Financial Report. POST EMPLOYMENT HEALTH PLANS The City has a Post Employment Health Plan for all regular full and part time employees working 20 hours or more per week. The City makes annual contributions to a medical trust established under IRS code section 501(c)(9) on behalf of the participants utilizing existing funding sources. Individual accounts are established for the benefit of and are the property of each participant. Each participant is responsible for selecting the investment vehicle for his/her account. Upon separation from service, the employee may use the accumulated balance for IRS allowable medical expenses for themselves and qualified dependents. The City has no ongoing responsibility for the trust and has not recorded it in the financial statements. 7. Postretirement Benefits By City Council authorization, the City provides all employees eligible to retire under the Public Employee Retirement System of Idaho, a $10,000 life insurance policy, the premium of which is paid for by the City. Additionally, the City contributes $100 per month toward a retiree health insurance plan for retirees under the age of 65. For post-65 retirees, the City contributes $50 per month towards a City-offered Medicare Advantage plan. Funds for the estimated liability associated with the governmental fund types are set-aside in the Debt Service Fund. Amounts related to the proprietary fund types are provided for separately in those funds. This is a single employer plan and all changes and/or amendments to the plan require City Council approval. The decision on funding methodology resides with the Mayor and the City Council. The Health Trust issues its own separate report. A copy can be obtained by contacting Boise City Controller Jim McMahon at (208) 384-3798. The postretirement benefits are determined on an actuarial basis. Actuarial valuations of the postretirement benefits were done as of September 30, 2012 and are determined on a prospective basis. The unfunded actuarially accrued liability (UAAL) is $11,549 – this is 12% of the covered payroll. The liability is considered unfunded due to the decision of the City to not place the funds in a trust. The annual required contribution (ARC) for fiscal year 2012 is $1,291. The ARC is made up of the benefits earned in the current period and an amount of the unfunded AAL on a straight line amortization method. Since these funds were not placed in a trust, the expense and offsetting liability are reflected in the financial statements. The actuarial cost method used is the Projected Unit Credit Actuarial Cost method. The table below summarizes the Other Postemployment Benefits (OPEB) costs. Annual required contribution (ARC) 1,291$ Interest on net OPEB obligation 200 ARC Adjustment (293) Annual OPEB cost 1,198 Contributions made and Adjustments (479) Increase in net OPEB obligation 719 Net OPEB obligation - beginning of year 5,475 Net OPEB obligation - end of year 6,194$
Fiscal Year Ended Annual OPEB CostPercentage of Annual OPEB Cost
Contributed Net OPEB Obligation9/30/10 1,527 65% 4,874 9/30/11 1,272 43% 5,475 9/30/12 1,198 40% 6,194
The City's annual OPEB cost, the percentage of annual OPEB cost contributed to the plan, and the net OPEB obligation for fiscal year 2012 and the two preceding fiscal years were as follows:
FOOTNOTES
E-7

Schedule of Funding Progress for the City of Boise
Actuarial Valuation
Actuarial Value of Assets
Actuarial Accrued Liability
(AAL)
Unfunded AAL
(UAAL)Funded Ratio
Covered Payroll
UAAL as a percentage of Covered
PayrollDate (a) (b) (b-a) (a/b) (c) ((b-a)/c)
9/30/2010 - 10,311 10,311 0% 92,681 11%9/30/2011 - 11,471 11,471 0% 93,141 12%9/30/2012 - 11,549 11,549 0% 94,509 12%
The unfunded actuarial accrued liability is being amortized as a level percentage of projected payroll on an open basis. The remaining amortization period as of September 30, 2012 was 26 years. The significant actuarial assumptions used to determine funding requirements are: a) a discount rate of 3.65%, b) an expected Asset Return rate of 3.65%, c) the percentage of eligible retirees electing spousal health coverage is 10% for general employees and 40% for Fire and Police, d) the termination rates for general employees are based on the July 1, 2012 Public Employees Retirement System of Idaho assumptions. Termination rates for Fire and Police are based on Boise City historical data, e) Employees are assumed to retire based upon the July 1, 2012 Public Employees Retirement System of Idaho assumptions, f) the salary scale was assumed to grow at 3.75%, and g) the inflation rate utilized is 3.25%. As of September 30, 2012, there are 883 active plan participants. On that date, the City had 6 retirees and 1 dependent receiving health insurance benefits under the City’s Health Trust. As of January 1, 2011 all Active Fire and Police Union members, Command Staff, and Union Retirees moved to a separate Health Trust. This Health Trust is entirely administered by Union representatives. The City has no management responsibility for the Trust. As of September 30, 2012, there were 498 retirees receiving life insurance coverage paid for by the City. Each retiree’s life is insured for $10,000. 8. Risk Management The City is exposed to various risks of loss related to torts, theft of, damage to, or destruction of assets, errors or omissions, or employee injuries. The City has a Risk Management Fund (an internal service fund to account for and finance these risks of loss.) The self-insured retention is summarized as follows:
Fiscal Workers Year Liability Coverage Property Coverage Compensation Coverage
Per Incident Aggregate Per Incident Aggregate Per Incident Aggregate
2012 $500 unlimited $50 unlimited $400 unlimited The City has purchased commercial insurance for claims in excess of these amounts. All funds of the City participate in the program except for liability coverage for the Airport Fund, which is insured under a separate policy purchased from an outside insurance carrier. Amounts to be provided for funding of the self insured retention are based on actuarial estimates of the amounts necessary to pay and current year claims and to establish a reserve for catastrophic losses. A liability for claims is established if information indicates that it is probable that a liability has been incurred at the date of the financial statements and the amount of the loss can be reasonably estimated. 9. Self Insurance Health Trust Fund In 2005, the City created a trust fund for its health insurance costs. Plan assets are dedicated to provide benefits to City employees and retirees. The assets are legally protected from creditors and
FOOTNOTES
E-8

employer contributions to the plan are irrevocable. The trust is basically self insured but has reinsurance for claims over $200 with an aggregate limit of 120% of aggregate claims. 10. Fund Equity Governmental funds report fund balance in two major categories: non-spendable and spendable components. Nonspendable fund balance represents resources that cannot be spent due to their form. Governmental fund balance that is available for spending is classified into four reporting categories: Restricted, Committed, Assigned, and Unassigned. Restricted fund balance represents resources that can only be spent based upon external party restrictions. Committed Fund Balance represents City Council mandated constraints imposed on the use of funds. Assigned Fund Balance represents management’s intended use of resources. Unassigned Fund Balance represents resources that have not been classified in one of the aforementioned categories. Enterprise Funds report Net Assets into three major categories: Invested in Capital Assets, Net of Related Debt, Reserved, and Unreserved. II. RECONCILIATION OF GOVERNMENT-WIDE AND FUND FINANCIAL STATEMENTS Reconciliations of government-wide and fund statements are used to explain certain differences between the governmental fund statement of revenues, expenditures, and changes in fund balances and the government-wide statement of activities. The reconciliations are contained in the Basic Financial Statements. III. STEWARDSHIP, COMPLIANCE, AND ACCOUNTABILITY A. Budgets and Budgetary Accounting The basis of budgeting refers to the conventions for recognition of costs and revenues in budget development and in establishing and reporting appropriations, which are the legal authority to spend or to collect revenues. The City used a modified accrual basis for budgeting in governmental funds. Under Idaho State Law, unspent appropriations from prior years must be specifically “re-budgeted,” via resolution of the City Council, or “encumbered,” in order to be carried forward into the next fiscal year. A valid, legal commitment such as a contract or purchase order is required for encumbrances. Proprietary funds are budgeted using accrual concepts. However, all operating and capital expenses that will be incurred during the year and income to be received and credited to the year are identified in the budgeting process because of the need for appropriation authority. The budget is fully reconciled to the accounting system at the beginning of the year, and in preparing the Comprehensive Annual Financial Report (CAFR) at year end. A number of adjustments are made to reflect balance sheet needs and their effect on the budget. These include changes in designations and reserves and recognition, via studies and analysis of various sorts, of accrued liabilities. Amounts needed for such long-term liabilities as future payoffs of accumulated employee vacation and sick leave, are budgeted as they are recognized via actuarial projections and subsequently adjusted to actual amounts. The budget does not recognize capital construction expense in enterprise funds in the same manner as in the Comprehensive Annual Financial Report. Reconciliations are completed in quarterly and annual budget to actual reports. The City uses a two-year budget format to facilitate a strategic approach to financial planning and to reduce the time spent in budget preparation. The FY 2012 budget was the first year of the FY 2012 and 2013 Two Year Budget. Idaho State Code does not recognize the concept of a two-year budget and requires the City to adopt an annual budget each year through formal publishing and hearing requirements and by adopting an annual appropriation ordinance. Therefore, each year of the two-year budget is separately adopted consistent with State Code requirements. However, administratively, the two-year budget incorporates both annual budgets and the second year adoption entails a streamlined mid-biennium review and revision process to address changes from the time that the two-year budget was developed. The City of Boise has established a Six-Year Financial Plan that includes financial and
FOOTNOTES
E-9

human resource policies that provide direction for accounting, budgeting, cash management, and other financial management for the City. The policies provide broad direction for financial planning, control and reporting. The following procedures are used to establish budgetary control:
1. Prior to October 1, the budget for all governmental and proprietary funds is legally enacted (adoption) through passage of an ordinance which includes public process hearings.
2. Budgets are adopted on a basis consistent with generally accepted accounting principles
(GAAP). Total appropriations represent budget amounts as originally adopted plus current year adjustments for City Council approved prior year encumbrances, uncompleted items (primarily capital and equipment) carried forward to the following year and new projects or expenditures approved by City Council from prior year turn back dollars and appropriation changes approved during the year.
3. Formal budgetary integration is employed as a management control device during the year
for the General, Special Revenue, Capital Projects, Enterprise, Internal Service and certain Trust Funds. To provide oversight and control, the Mayor’s Executive Management Team reviews all proposed changes to the budget that are exceptions to department director authority.
4. During the fiscal year, all expenditures are authorized by Payment Voucher, Purchase Order,
or Journal Entry. These expenditures are reviewed according to procedures outlined in the City Code related to budget authority, funds availability, adherence to City purchasing procedures, and sound business practice.
5. Department directors have defined discretionary authority to transfer budget appropriation
amounts within approved budget totals, between line items within funds, and consistent with the Mayor’s Budget Flexibility Guidelines. Department directors cannot initiate inter-departmental transfers without City Council approval.
6. Transfer of budget appropriations between funds are approved by the City Council.
Revisions increasing total expenditure appropriation of any fund or adding permanent employee positions must be approved by the City Council. Any transfers of contingent funds require Mayor and City Council approval. State law does not allow fund expenditures to exceed fund appropriation. Appropriations lapse at year-end.
7. Idaho State Code allows the City to reopen the annual budget if a need for increased
appropriations beyond the budgeted total is experienced. The reopened budget must be adopted by following a process similar to that, which was used to adopt the original budget, including public hearings and adoption of a revised annual appropriations ordinance. The legal requirement of budgetary control in the State of Idaho is at the fund level. No supplemental appropriations were necessary during fiscal year 2012.
FOOTNOTES
E-10

IV. DETAILED NOTES ON ALL FUNDS A. At September 30, 2012, cash and investments, including restricted investments were invested as follows:
BankCarrying Ledger Amount Balance
Cash - demand deposits:
Insured and Collateralized 12,569$ 13,473$ Less: Fiduciary Fund Balance (249) (238) Total Net Cash 12,320$ 13,235$
FairInvestments: Value Commercial paper 6,997$ U.S. Agency Securities 94,744 U.S. Treasury Securities 2,475 Certificates of Deposit 245 Money market and mutual funds 33,921 Local Government Investment Pool 10,008 Subtotal 148,390
Less: restricted and fiduciary fund investments (19,361) Total Net Investments 129,029$
Deposit and Investment Policies Idaho Code 50-1013 limits the City’s legal investments to savings accounts, prime commercial paper, general obligations of the State of Idaho and United States Treasury, notes, bonds, and obligations of Government Sponsored Enterprises (FNMA, FHLMC, FFCB, FHLB), A-rated corporate bonds, and money market and mutual funds whose portfolios consist of the aforementioned underlying instruments. The City’s Investment Policy requires that investments within the portfolio are to be diversified as to security type, duration, and issuer in order to maintain a balanced portfolio. The policy does not place specific restrictions with regard to credit, concentration, and interest rate risks. The City only conducts investment purchases on a delivery versus payment basis with all securities held by a safekeeper, in the City’s name, to eliminate custodial credit risk. Interest Rate Risk As of September 30, 2012 the City had the following investments: Investments by Type Fair Value Effective DurationU.S. Agency Securities 94,744$ 1.371Commercial Paper 6,997 0.018U.S. Treasury Securities 2,475 1.61Certificates of Deposit 245 0.208Money Market and Mutual Funds 33,921 Not AvailableLocal Government Investment Pool 10,008 Not AvailableTotal Fair Value 148,390$
In accordance with the City's Investment Policy of diversifying its investments as to type, issuer, and maturity, the City chooses to monitor its interest rate risk exposure utilizing effective duration. Effective duration is the preferred method for callable securities, and measures the price sensitivity of an investment or portfolio, taking into account that expected cash flows will change as interest rates change. The effective duration of the City's Investment Portfolio was .907% on September 30, 2012.
FOOTNOTES
E-11

Credit Risk – Credit Quality Distribution Investment Type Credit Rating Portfolio PercentageU.S. Agency Securities AA+ 64.33%U.S. Treasury Securities AA+ 1.36%Commercial Paper A1/P1 4.75%Money Market and Mutual Funds AAA 22.42%Local Government Investment Pool Not Rated 6.80%Key Bank Account (FDIC Insured) N/A 0.17%Certificates of Deposit (FDIC Insured) N/A 0.17% Total 100.00% In order to maintain a balanced portfolio, the City's adopted Investment Policy requires that investments within the portfolio be diversified as to type of security, duration, and issuer. Agency securities within the portfolio at September 30, 2012 are rated AA+ by Standard and Poors or Aaa by Moody's. All commercial paper held in the Portfolio on September 30, 2012 is rated A1/P1 by Standard and Poors and Moody's, respectively. All money market mutual funds are rated AAAm by Standard and Poor's and Aaa-mf by Moody’s as of September 30, 2012. An interest bearing FDIC insured account is maintained at Key Bank with a $250,000 balance. The State of Idaho Local Government Investment Pool is unrated. Custodial Credit Risk As of September 30, 2012, the City's Investment Portfolio was held in the City's name by a third-party custodian. Consequently, the City is not exposed to custodial credit risk. Concentration of Credit Risk In order to maintain a balanced portfolio, the City's Diversification Policy requires that investments within the portfolio be diversified as to type of security, duration, and issuer. Consequently, to the extent allowed by State Code, the Investment Policy does not specifically place limits on amounts invested in any one issuer. On September 30, 2012, the City's investment portfolio exceeded 5% of total Portfolio value in the following issuers: Issuer Portfolio Percentage Federal National Mortgage Association 23.28% Federal Home Loan Mortgage Corporation 20.77% Federal Home Loan Bank 12.51% Federal Farm Credit Bank 7.95%
FOOTNOTES
E-12

B. Receivables September 30, 2012
General Capital Debt Airport Sewer Solid Waste
Nonmajor and Other
Funds Fiduciary TotalReceivables
Interest 12$ 1$ -$ 102$ 98$ 1$ 82$ 11$ 307$ Taxes 116,955 116,955 Accounts 5,992 694 31 1,011 4,065 1,769 902 56 14,520
Passenger Facility Charges 475 475 Sewer District 3,263 3,263 Special Assessments 21 2,163 44 2,228 Grants 334 3,310 360 4,004 Loans 13,165 13,165
Gross Receivables 123,314 695 31 4,898 9,589 1,770 14,553 67 154,917
Less: Allowance for uncollectibles 37 116 120 900 1,173
123,314$ 695$ 31$ 4,861$ 9,473$ 1,650$ 13,653$ 67$ 153,744$
Sewer and Other Funds includes $2,145 and $567 of long-term receivables, respectively. This is included in the Statement of Net Assets under Noncurrent Assets. Governmental funds report deferred revenue in connection with receivables for revenues that are not considered to be available to liquidate liabilities of the current period. Governmental funds also defer revenue recognition in connection with resources that have been received but not yet earned. At the end of the current fiscal year, the various components of deferred revenue reported in the governmental fund financials were as follows: Property taxes deferred $ 116,399 Other unearned revenue 368 Total deferred/unearned revenue for governmental funds $ 116,767 C. Restricted Assets
Debt Bond / Interest / Proceeds /Reserve Lease Payment Construction City Held
Funds Fund Fund Funds TotalGovernmental Fund TypeCommunity Infrastructure Dist. #1 392$ 84$ 35$ 25$ 536$ Warm Springs Golf Course 115 59 174 Subtotal 507 84 35 84 710 Business-Fund Type Airport PFC Restriction 13,109 13,109 Airport DEQ Trust 475 475 Subtotal 13,584 13,584 Total All Funds 507$ 84$ 35$ 13,668$ 14,294$ Funds set aside for payment of governmental and proprietary fund debt are classified as restricted assets, since their use is limited by applicable debt agreements. Amounts restricted for specific purposes relate to Golf Course Debt Reserves, Airport transportation Passenger Facility Charges and a DEQ Trust.
FOOTNOTES
E-13

D. Capital Assets A Summary of the changes in capital assets for the year ending September 30, 2012, follows: Primary GovernmentGovernmental activities
Balance BalanceOctober 1, September 30,
2011 Additions Transfers Deletions 2012Capital assets, not being depreciated:Land 74,773$ -$ -$ (4,246)$ 70,527$ Intangible assets 474 474 Construction-in-progress 8,401 11,257 (4,511) (200) 14,947 Total capital assets, not being depreciated 83,648 11,257 (4,511) (4,446) 85,948
Capital assets, being depreciated:Buildings 81,375 2,041 814 (59) 84,171 Improvements other than buildings 65,396 1,387 2,540 (950) 68,373 Automobiles and trucks 24,796 1,428 (29) (1,223) 24,972 Machinery and equipment 30,532 673 1,030 (989) 31,246 Leasehold improvements 1,640 19 3 1,662 Intangible assets 3,608 105 80 (108) 3,685 Other capital assets 8,428 170 27 8,625 Total capital assets being depreciated 215,775 5,823 4,465 (3,329) 222,734
Less accumulated depreciation for:Buildings 34,742 2,431 (45) 37,128 Improvements other than buildings 34,056 2,682 (488) 36,250 Automobiles and trucks 14,204 2,110 (46) (1,160) 15,108 Machinery and equipment 17,424 1,771 (907) 18,288 Leasehold improvements 541 152 693 Intangible assets 2,442 302 (107) 2,637 Other capital assets 5,601 572 6,173 Total accumulated depreciation 109,010 10,020 (46) (2,707) 116,277
Total capital assets, being depreciated, net 106,765 (4,197) 4,511 (622) 106,457
Governmental activities capital assets, net 190,413$ 7,060$ -$ (5,068)$ 192,405$
FOOTNOTES
E-14

Business-type activities: Balance October 1,
2011
Additions Transfers Deletions Balance September 30,
2012Capital assets, not being depreciated:Land 34,644$ 517$ -$ -$ 35,161$ Intangible assets 470 470 Construction-in-progress 12,843 20,304 (4,679) 28,468 Total capital assets, not being depreciated 47,957 20,821 (4,679) - 64,099
Capital assets, being depreciated:Buildings 257,243 442 383 258,068 Land improvements/terminal parking 66,611 510 152 (96) 67,177 Improvements other than buildings 39,963 536 771 41,270 Service lines 191,696 1,871 349 193,916 Automobiles and trucks 15,062 1,670 1,211 (174) 17,769 Machinery and equipment 67,625 1,887 1,791 (1,375) 69,928 Intangible assets 1,173 (58) 1,115 Other capital assets 887 887 Total capital assets, being depreciated 640,260 6,916 4,657 (1,703) 650,130
Less accumulated depreciation for:Buildings 88,314 7,894 96,208 Land improvements/terminal parking 39,303 3,660 (96) 42,867 Improvements other than buildings 23,834 2,491 26,325 Service lines 48,852 1,889 50,741 Automobiles and trucks 8,738 1,106 46 (173) 9,717 Machinery and equipment 39,998 4,464 (1,210) 43,252 Intangible assets 840 115 (58) 897 Other capital assets 197 28 - 225 Total accumulated depreciation 250,076 21,647 46 (1,537) 270,232
Total capital assets, being depreciated, net 390,184 (14,731) 4,611 (166) 379,898
Business-type activities capital assets, net 438,141$ 6,090$ (68)$ (166)$ 443,997$
Depreciation Expense was charged to the government functions as follows: General Government $ 1,700 Fire 1,666 Police 1,192 Parks and Recreation 3,739 Culture and Library 977 Community Service 616 Community development 13 Total government functions 9,903 Depreciation on transferred property Capital assets held by the government’s internal service funds charged to the various functions based on their usage 117 Total Depreciation Expense-Governmental Activities $ 10,020
FOOTNOTES
E-15
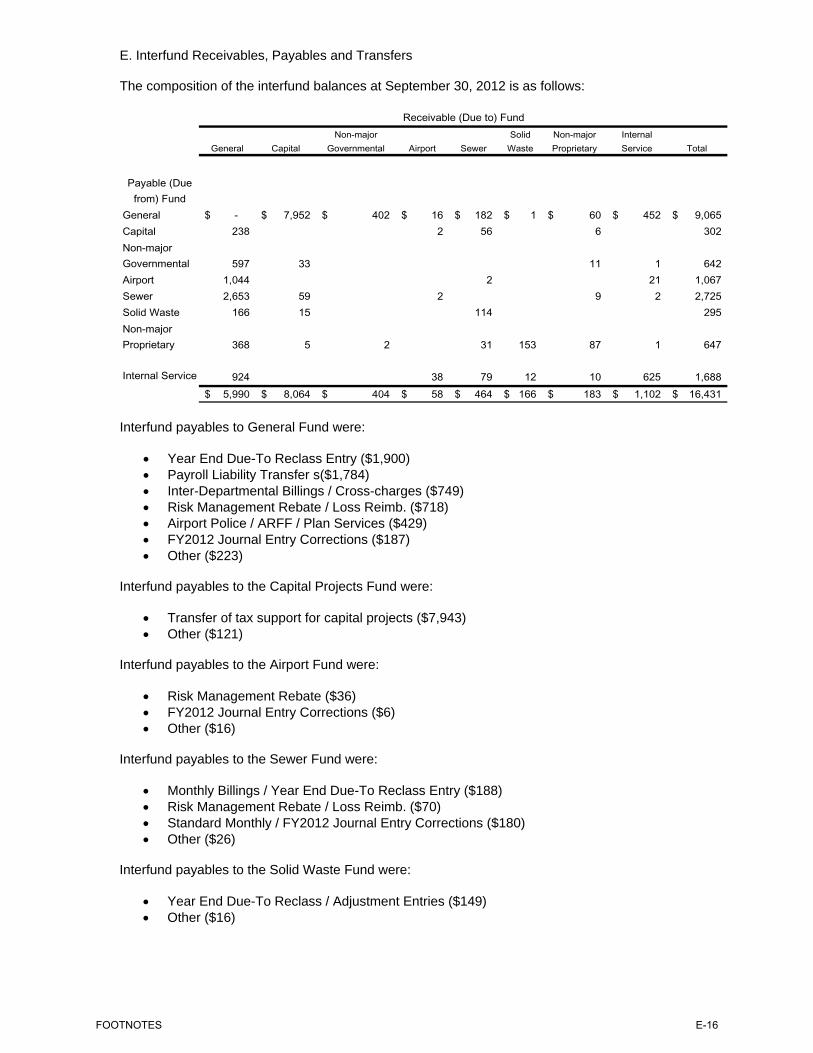
E. Interfund Receivables, Payables and Transfers The composition of the interfund balances at September 30, 2012 is as follows:
Receivable (Due to) Fund
General CapitalNon-major
Governmental Airport SewerSolid
WasteNon-major Proprietary
Internal Service Total
Payable (Due from) Fund
General -$ 7,952$ 402$ 16$ 182$ 1$ 60$ 452$ 9,065$ Capital 238 2 56 6 302 Non-major Governmental 597 33 11 1 642 Airport 1,044 2 21 1,067 Sewer 2,653 59 2 9 2 2,725 Solid Waste 166 15 114 295 Non-major Proprietary 368 5 2 31 153 87 1 647
Internal Service 924 38 79 12 10 625 1,688 5,990$ 8,064$ 404$ 58$ 464$ 166$ 183$ 1,102$ 16,431$
Interfund payables to General Fund were:
• Year End Due-To Reclass Entry ($1,900) • Payroll Liability Transfer s($1,784) • Inter-Departmental Billings / Cross-charges ($749) • Risk Management Rebate / Loss Reimb. ($718) • Airport Police / ARFF / Plan Services ($429) • FY2012 Journal Entry Corrections ($187) • Other ($223)
Interfund payables to the Capital Projects Fund were:
• Transfer of tax support for capital projects ($7,943) • Other ($121)
Interfund payables to the Airport Fund were:
• Risk Management Rebate ($36) • FY2012 Journal Entry Corrections ($6) • Other ($16)
Interfund payables to the Sewer Fund were:
• Monthly Billings / Year End Due-To Reclass Entry ($188) • Risk Management Rebate / Loss Reimb. ($70) • Standard Monthly / FY2012 Journal Entry Corrections ($180) • Other ($26)
Interfund payables to the Solid Waste Fund were:
• Year End Due-To Reclass / Adjustment Entries ($149) • Other ($16)
FOOTNOTES
E-16

Advances to/from other funds as of September 30, 2012: Receivable Fund Payable Fund Amount Airport Internal Service $ 63 Sewer Non-major proprietary 112 Solid Waste Internal Service 555 $ 730 The amount not expected to be repaid within one year to the Solid Waste and Airport Funds from the Fleet Services Fund was $555 and $63, respectfully. The $112 balance of the loan from the Sewer Fund to the Geothermal Fund is the result of stopping the planned payments for fiscal year 2011 on a temporary basis to ensure adequate cash flow for a major pipeline extension. This temporary suspension started in FY2009.
General Capital DebtNon-major
Governmental Airport SewerSolid
WasteNon-major Proprietary
Internal Service Total
Transfer out:General -$ 7,993$ 1,011$ 10$ 20$ -$ -$ 13$ -$ 9,047$ Capital Projects 557 557
Non-major Governmental 58 58 Solid Waste 104 111 215 Non-major Proprietary 100 30 130 Internal Service 672 36 67 1 5 9 790
1,491$ 7,993$ 1,011$ 10$ 56$ 178$ 1$ 48$ 9$ 10,797$
Transfer in:
Significant Transfers Out during FY2012 were as follows: a) transfer from the General Fund to the Capital Projects Fund for authorized projects ($7,993); b) transfer from General Fund to the Debt Service Fund of amounts for debt service payments ($1,011); and c) Risk Management rebate ($1,055) back to payor funds during the year.
FOOTNOTES
E-17

F. Risk Management –Claim Liability Liability 2012 2011
Total unpaid claims and claim adjustment expenses at September 30th of prior year 1,626$ 2,406$ Provision for self-insured events of the current year 380 250 Total incurred claims and claims adjustment expenses 2,006 2,656
Payments:Claims and claim adjustment expenses attributable to self insured events of the current year 24 416 Claims and claim adjustment expenses attributed to self insured events of prior years 34 69 Plus: Close-out of prior years - 545 Total Payments 58 1,030 Total unpaid claims and claim adjustment expenses at September 30th 1,948$ 1,626$
Workers Compensation 2012 2011
Total unpaid claims and claim adjustment expenses at September 30th of prior year 2,337$ 3,085$ Provision for self-insured events of the current year 1,410 1,316 Total incurred claims and claims adjustment expenses 3,747 4,401
Payments:Claims and claim adjustment expenses attributable to self insured events of the current year 327 391 Claims and claim adjustment expenses attributed to self insured events of prior years 613 591 Plus: Close-out of prior years - 1,082 Total Payments 940 2,064
Total unpaid claims and claim adjustment expenses at September 30th 2,807$ 2,337$
Total Risk Management Other Accrued Liabilities as of September 30th 4,755$ 3,963$
FOOTNOTES
E-18

G. Long-Term Debt The following is a summary of changes in long-term obligations of the City a September 30, 2012.
Long-Term
Long-Term Obligations at
Obligations at September Due Within
Governmental Activities October 1, 2011 Additions Deletions 30, 2012 One Year
Refunding Bonds 2001A 23,850$ -$ 23,850$ -$ -$
Refunding Bonds 2011A - 24,665 - 24,665 905
Plus premium 558 31 527
Less deferral (297) (16) (281)
Capital Leases:
Golf Course Improvement Project 300 95 205 100
City Hall 2 1,385 443 942 462
Other LT Debt Obligations:
Harris Ranch CID SA Bond 3,920 3,920
Less deferral (318) (11) (307)
Harris Ranch CID GO BA Note 75 1 74 1
Less deferral (8) (2) (6)
Compensated Absences / OPEB 9,803 1,122 767 10,158 927
Total Governmental Activities 39,007 26,048 25,158 39,897 2,395
Business-Type Activities
Revenue Bonds:
Airport Revenue Refunding 2011 31,080 2,860 28,220 2,975
Less deferral (903) (163) (740)
Plus premium 1,724 311 1,413
Wastewater Facility Note 11,125 11,125 -
WW Facility Refunding 2012 16,699 16,699 1,895
Less deferral 25 (361) 5 (341)
Installment Loans:
Sewer Line Loan 1,005 1,005 -
Sewer Line Loan 24 24 -
Sewer Line Loan 6,545 6,545 -
Other Long-Term Debt
Obligations:
Section 108 Advance 840 140 700 140
Compensated Absences / OPEB 1,341 966 237 2,070 144
Total Business-Type
Activities 52,806 17,304 22,089 48,021 5,154Total 91,813$ 43,352$ 47,247$ 87,918$ 7,549$
For Governmental Activities, the General Fund generally liquidates compensated absences. Governmental Activities: BONDS: Refunding Bonds 2011A: $24,665 Revenue Refunding Bonds due in annual installments of $905 to $1,680 through 2032, interest accrues at 3.00% to 4.00%. $24,665 Less deferral (281)
Plus premium 527 Harris Ranch CID SA Bond: $3,920 due in annual installments of $40 to $360, 2014 through 2040.
interest accrues at 9.00%. 3,920 Less deferral (307)
FOOTNOTES
E-19
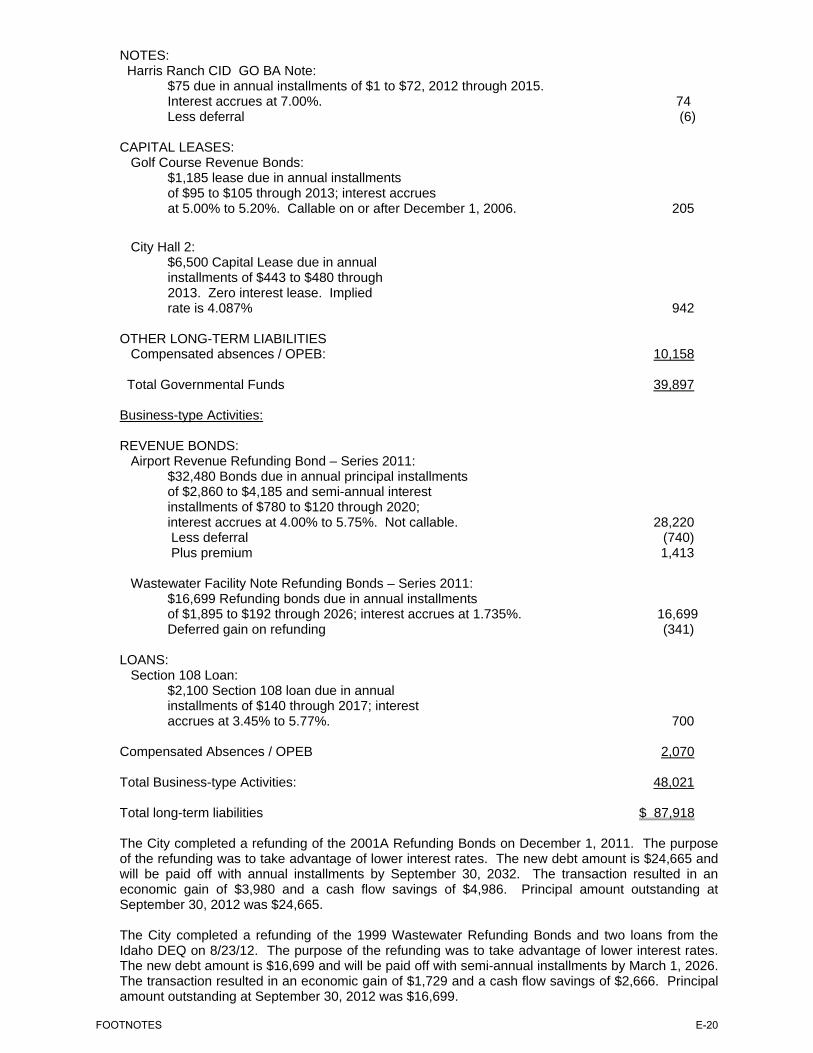
NOTES: Harris Ranch CID GO BA Note: $75 due in annual installments of $1 to $72, 2012 through 2015.
Interest accrues at 7.00%. 74 Less deferral (6)
CAPITAL LEASES: Golf Course Revenue Bonds: $1,185 lease due in annual installments of $95 to $105 through 2013; interest accrues at 5.00% to 5.20%. Callable on or after December 1, 2006. 205
City Hall 2: $6,500 Capital Lease due in annual installments of $443 to $480 through 2013. Zero interest lease. Implied rate is 4.087% 942 OTHER LONG-TERM LIABILITIES Compensated absences / OPEB: 10,158 Total Governmental Funds 39,897 Business-type Activities: REVENUE BONDS: Airport Revenue Refunding Bond – Series 2011: $32,480 Bonds due in annual principal installments of $2,860 to $4,185 and semi-annual interest installments of $780 to $120 through 2020; interest accrues at 4.00% to 5.75%. Not callable. 28,220 Less deferral (740)
Plus premium 1,413 Wastewater Facility Note Refunding Bonds – Series 2011: $16,699 Refunding bonds due in annual installments of $1,895 to $192 through 2026; interest accrues at 1.735%. 16,699
Deferred gain on refunding (341) LOANS: Section 108 Loan: $2,100 Section 108 loan due in annual installments of $140 through 2017; interest accrues at 3.45% to 5.77%. 700 Compensated Absences / OPEB 2,070 Total Business-type Activities: 48,021 Total long-term liabilities $ 87,918 The City completed a refunding of the 2001A Refunding Bonds on December 1, 2011. The purpose of the refunding was to take advantage of lower interest rates. The new debt amount is $24,665 and will be paid off with annual installments by September 30, 2032. The transaction resulted in an economic gain of $3,980 and a cash flow savings of $4,986. Principal amount outstanding at September 30, 2012 was $24,665. The City completed a refunding of the 1999 Wastewater Refunding Bonds and two loans from the Idaho DEQ on 8/23/12. The purpose of the refunding was to take advantage of lower interest rates. The new debt amount is $16,699 and will be paid off with semi-annual installments by March 1, 2026. The transaction resulted in an economic gain of $1,729 and a cash flow savings of $2,666. Principal amount outstanding at September 30, 2012 was $16,699.
FOOTNOTES
E-20

Conduit Bonds The City is authorized under Title 50 Chapter 27 of the Idaho Code to create an industrial development corporation for the purpose of issuing Industrial Revenue Bonds to provide financial assistance to private-sector entities for the acquisition and construction of manufacturing, processing, production, assembly, warehousing, solid waste disposal, ski area and energy facilities (excluding facilities to transmit, distribute or produce electrical energy). Ordinance No. 4700 of the City created the Industrial Development Corporation of the City of Boise, Idaho. From time to time the City, through the Industrial Development Corporation, has issued Industrial Revenue Bonds. The bonds are payable solely from payments received from the private-sector entity served by the issuance. Upon repayment of the bonds, ownership of the acquired facilities transfers to the private-sector entity. Pursuant to Title 50 Chapter 2706 of the Idaho Code, neither the City, the State, nor any political subdivision thereof, is obligated in any manner for repayment of the bonds. Accordingly, the bonds are not reported as liabilities in the accompanying financial statements. As of September 30, 2012, there were no Industrial Revenue Bonds outstanding. Capital Leases At fiscal year end, the City is obligated under two leases that are accounted capital leases. The leased asset and related obligation are accounted for in the Statement of Net Assets in the Governmental-Wide Financial Statements. The future minimum lease payment as of September 30, 2012 is $1,215 for governmental activities. The original capitalized amount of the governmental leases was $6,091 with total accumulated depreciation of $1,885 as of September 30, 2012. The following is a schedule of future minimum lease payments under the capital leases, together with the net present value of the minimum lease payments as of September 30, 2012.
Fiscal Year Ending September 30th
Governmental Lease
Payments2013 608$ 2014 607
Minimum Lease Payments for the Capital Leases 1,215 Less: Amount representing interest at the City's incremental borrowing rate of interest. (68) Present value of minimum lease payments on September 30, 2012 1,147$
FOOTNOTES
E-21

The annual requirements to amortize all debt outstanding as of September 30, 2012 excluding obligations associated with compensated absences, post-retirement benefits, and deferred amounts are as follows:
Governmental Activities Business-type Activities Entity WideYear/Period Principal Interest Principal Interest Principal Interest
2013 1,468$ 1,311$ 5,010$ 1,768$ 6,478$ 3,079$ 2014 1,561 1,265 5,167 1,601 6,728 2,866 2015 1,072 1,105 5,360 1,405 6,432 2,510 2016 1,035 1,067 5,555 1,200 6,590 2,267 2017 1,070 1,033 5,756 986 6,826 2,019
2018-2022 5,910 4,604 17,464 1,665 23,374 6,269 2023-2027 7,000 3,513 1,307 46 8,307 3,559 2028-2032 8,525 1,989 - - 8,525 1,989 2033-2037 1,175 781 - - 1,175 781 2038-2042 990 184 - - 990 184
Total 29,806$ 16,852$ 45,619$ 8,671$ 75,425$ 25,523$ In Idaho, a municipality is allowed a debt limit of two percent of the market valuation of the real and personal property in its taxing area. The City’s legal debt limit for 2012, based on data available from Ada County, would be approximately $282,423. H. Pension Plan Substantially all full-time employees of the City participate in the Public Employees Retirement System of Idaho (PERSI), a cost-sharing multiple-employer public employee retirement system, created by the Idaho State Legislature. It is a defined benefit plan requiring that both the member and the employer contribute. Designed as a mandatory system for eligible state and school district employees, the legislation provided for political subdivisions to participate by contractual agreement with PERSI. Financial reports for the plan are available from PERSI upon request. After five years of credited service, members become fully vested in retirement benefits earned to date. Members are eligible for retirement benefits upon attainment of the ages specified for their employment classification. For each year of credited service, the annual service retirement allowance is 2.0 percent or 2.3 percent (depending upon employee classification) of the average monthly salary for the highest consecutive forty-two months. For the year ended September 30, 2012, the required contribution rates, as determined by PERSI, are as follows: Employee Employer General Member 6.23% 10.39% Police 7.69% 10.73% Fire (hired after October 1, 1980) 7.69% 27.97% Fire (hired before October 1, 1980) 11.45% 36.62% The combined contributions from the City and employees were $20,973, $20,569, and $19,737 for the three years ended September 30, 2012, 2011 and 2010, respectively. I. Fund Balance Designations Governmental funds report fund balance in two major components: nonspendable and spendable components. Nonspendable fund balance represents resources that cannot be spent due to their resource form. Governmental fund balance that is available for spending is classified into four reporting categories: Restricted, Committed, Assigned, and Unassigned. Restricted Fund Balance represents resources subject to externally enforceable legal restrictions. Committed Fund Balance represents City Council mandated constraints imposed on the use or release of funds from this category. Assigned Fund Balance represents management’s established intended use of resources.
FOOTNOTES
E-22

Unassigned Fund Balance represents resources that have not been classified in one of the aforementioned categories. The City’s highest level of decision making authority is vested with City Council. A resolution approved by Council is the formal action that is required to establish, modify, or rescind a commitment of fund balance. City Council vests with the Chief Financial Officer of the Department of Finance and Administration the authorization to assign amounts to specific purposes approved by Council as described in the City’s adopted Fund Balance Policy. The City considers restricted and unrestricted amounts to have been spent when an expenditure is incurred for which the fund balance category has been made available. It is the policy of the City that expenditures, for which more than one category of fund balance could be used, will be expended in the following categorical order: Restricted, Committed, Assigned, and Unassigned. A stabilization arrangement is incorporated into the City’s adopted Fund Balance Policy. The City’s Fund Balance Policy has been formally adopted by resolution. This stabilization arrangement consists of two components: a Cashflow Reserve and Service Maintenance Reserve. The Cashflow Reserve is intended to be a reserve for unexpected events that would have a significant impact on the City’s ability to maintain sufficient working capital. The Service Maintenance Reserve may be used to provide funding associated with fluctuations in fiscal cycles and operating requirements that exceed $500. For FY2012, the combined reserves are established at 6.77% of the subsequent annual budgeted General Fund base revenues ($9,974). Any usage or addition to the Cash Flow Reserves must be appropriated/approved by City Council. The reserves are incorporated into the Governmental Funds Balance Sheet within the Unassigned Fund Balance category. The following is a listing of Assigned Encumbrance and Rebudget amounts by function on September 30, 2012.
Encumbrances General
Fund Capital Projects
Fund TotalGeneral Gov 247$ 644$ 891$ Fire 58 303 361 Police - - Parks & Rec 223 392 615 Culture 79 209 288 Community Svcs 417 3,109 3,526 Comm Dev - - - Subtotal 1,024 4,657 5,681
Rebudgets General
Fund Capital Projects
Fund TotalGeneral Gov 1,761 (236) 1,525 Fire 634 288 922 Police 672 672 Parks & Rec 636 200 836 Culture 565 372 937 Community Svcs 1,244 1,711 2,955 Comm Dev - - - Subtotal 5,512 2,335 7,847 Grand Total 6,536$ 6,992$ 13,528$ J. Commitments Construction-in-progress in the governmental funds as of September 30, 2012 was $14,947; whereas capital related commitments were $7,484. Of the later amount, $7,449 is attributable to Capital Projects Fund encumbrance and rebudget amounts and $35 is associated with Harris Ranch CID No.1 Fund unspent construction bond proceeds. See Note I for City commitments that are included in fund balance designations.
FOOTNOTES
E-23

Construction-in-progress in the proprietary funds as of September 30, 2012 was $28,468. The estimated cost to complete proprietary construction projects was approximately $38,733. Of the estimated cost to complete proprietary construction projects, approximately $4,281 will be funded by state and/or federal grants and passenger facility charges. K. Contingent Liabilities The City is involved in several claims and is a defendant in pending and threatened litigation. While it is not feasible to predict or determine the ultimate outcome of all these matters, in management’s opinion, they will not have a material adverse effect upon the accompanying financial statements. One of these potential legal matters is disclosed below. Community House Inc. v. City of Boise, United States District Court for the District of Idaho A jury verdict of $1 million was entered against the City of Boise in this matter on September 12, 2012. In addition, Plaintiffs seek $1.8 million in attorney fees and costs. The City has filed a motion to set aside the verdict and has objected to Plaintiff’s request for fees and cost. It is not anticipated that the Court will rule on the pending motions regarding the judgment or request for attorney fees and costs until early 2013. In any event, the City intends to vigorously defend and appeal any judgment. The City is self-insured up to $400,000, with excess insurance over that threshold. The City has not recognized a liability for this matter at the end of FY2012. L. Prior Period Adjustments The City has determined that $289 of Capital Fund liabilities were incorrectly reduced during FY2008. A manual accounts payable adjustment entry was posted that duplicated a system generated entry during that fiscal year. To correct this error, the beginning FY2012 Capital Projects Fund Balance of $15,572, as originally reported, was decreased by $289 whereas the ending accounts payable liability balance was increased by the same amount. The table below displays the adjustment:
Capital Projects Fund Balance
Statement of Net Assets - Governmental Activities
Ending Balance, September 30, 2011 15,572$ 216,305$ Restatement (289) (289) Beginning Balance, October 1, 2012, As Restated 15,283$ 216,016$
M. Subsequent Event On December 6, 2012, the City issued Airport Revenue Bonds, Series 2012. The proceeds of the bonds will be used to construct an additional parking garage facility. The par amount of the new debt is $11,760 and will be paid off with annual installments by September 2032. N. Discretely Presented Component Unit Capital City Development Corporation (the Agency) is an urban renewal agency created by and existing under the Idaho Urban Renewal Law of 1965, as amended, and is an independent public body, corporate and politic. The following is a summary of the disclosures required for a fair presentation of the component unit in the City’s financial statements: The accounting and reporting policies of the Agency relating to the funds included in the accompanying financial statements conform to generally accepted accounting principles applicable to state and local governments. As allowed in Section P80 of GASB’s “Codification of Governmental Accounting and Financial Reporting Standards”, the Corporation has elected not to apply to its government-wide financial statements Financial Accounting Standards Board Statements and
FOOTNOTES
E-24

Interpretations, Accounting Principles Board Opinions, and Accounting Research Bulletins of the Committee of Accounting Procedure issued after November 30, 1989. Restricted Assets – The Agency has three revenue allocation funds, one for each of its three revenue allocation districts. Title 50, Chapter 20 of the Idaho Code delineates the purposes for which revenue allocation funds may be spent by urban renewal agencies, along with the purposes set forth in the Agency’s several urban renewal plans. Since the use of funds is proscribed in statute, the fund balance of the revenue allocation funds is considered restricted under the definitions provided in GASB Statement 54. Therefore, fund balance in its entirety is reported as restricted on the fund financial statements. Restricted fund balance as of September 30, 2012 for Central, River Myrtle and Westside is $1,597, $3,936 and $4,584, respectively. The restricted balance in the Parking Fund is $2,257 and is restricted for reserves on the outstanding bonds. Restricted assets are held by the Agency’s agent in the Agency’s name. Investments are generally held until maturity. The bond resolutions limit investments to certain types of securities which meet defined standards. Due From Other Governmental Units Amounts due from other agencies and units of government are as follows:
Ada County Capital Lease 41,705$
The following represents the minimum future payments on the capital lease from Ada County.
2013 5,088$ 2014 5,234 2015 5,313 2016 5,472 2017 5,636 Thereafter 26,894 Subtotal 53,637 Less amount representing interest (11,932) Total 41,705$
FOOTNOTES
E-25

Long-term Debt At September 30, 2012 long-term debt consists of the following:
Beginning Balance Additions Reductions
Ending Balance
Due Within One Year
Government Activities:2005 Series 44,370$ -$ (2,665)$ 41,705$ 3,025$ 2010 A-1 2,810 - 2,810 520 2010 A-2 1,650 (1,070) 580 580 2010 B-1 7,480 - 7,480 230 2010 B-2 785 (500) 285 285 2010C 2,430 (145) 2,285 150 2011B 12,865 (440) 12,425 790 Total 72,390$ -$ (4,820)$ 67,570$ 5,580$
Parking Revenue and Revenue Allocation Bonds:2005 Series 41,705$ 2010 A-1 2,810 2010 A-2 580 2010 B-1 7,480 2010 B-2 285 2010C 2,285 2011B 12,425 Total 67,570$
At September 30, 2012, long-term debt is classified on the Statement of Net Assets as:Long-term debt Current portion 5,580$ Long-term portion 61,990 Total 67,570$
The 2005 Series bonds bear interest at rates between 4.162% and 5.24%. The Agency does not have the option to redeem bonds maturing in years 2012 through 2015 prior to the maturity date, unless extraordinary events happen as prescribed in the debt agreement. Series that mature on or after August 15, 2016 are subject to redemption at the option of the Agency, which option shall be exercised upon the written direction of Ada County, in whole or in part, at any time at a price equal to 100% plus accrued interest. The bonds mature on August 15, 2022. The Series 2010 A-1 are tax exempt fixed rate bonds with a rate of 2.81% that mature on September 1, 2015. The Series 2010 A-2 are taxable fixed rate bonds with a rate of 2.80% that mature on September 1, 2013. The Series 2010 B-1 are tax exempt fixed rate bonds with a rate of 4.25% that mature on September 1, 2024. The Series 2010 B-2 are taxable fixed rate bonds with a rate of 3.05% that mature on September 1, 2013. The 2010 C Revenue Refunding Note was issued through the Boise City Housing Authority, is tax exempt, has a fixed rate of 4.29% and matures on September 1, 2024. The 2011 B Revenue Refunding Note was issued through the Boise City Housing Authority, is tax exempt but subject to the alternative minimum tax and has a fixed rate of 4.75% and matures on September 1, 2024. There are certain restrictive covenants, coverage requirements and ratios associated with the Agency’s bonds and notes. As of September 30, 2012 the Agency is compliance with these requirements.
FOOTNOTES
E-26

The annual requirements to retire the debt for the 2005, 2010 A and 2010 B bonds and the 2010 C and 2011 B notes as of September 30, 2012 are shown below.
Principal Interest
2013 5,580$ 3,173$ 2014 5,975 2,921 2015 6,325 2,649 2016 5,585 2,359 2017 6,015 2,088
2018-2022 33,470 5,768 2023-2025 4,620 317
Total 67,570$ 19,275$
Governmental Activities
The Agency has a line of credit of $3,000 with Bank of America. The rate on the line of credit may be either fixed or floating. The rate is the fixed LIBOR plus 2% or the floating LIBOR plus 2%. The annual fee for the line of credit is 0.5% of the unborrowed amount. The line of credit is subordinate to the Agency’s bond debt and is supported by a pledge of all legally available revenues from parking and revenue allocation. The line of credit expires on December 12, 2012. A request to renew the line of credit with the same terms and an expiration date of December 12, 2014 is under consideration with Bank of America as of the financial statement date. As of September 30, 2012 the amount outstanding on the line of credit was $0. Leases The Agency is a party to the following leases: The Agency entered into the lease for its office space on July 1, 2008. The lease term expires on June 30, 2013. Monthly rent is $15. The Agency entered into a lease for its copier in September 2010. The lease has a term of three years and expires on October 12, 2013. The monthly rent is $1. The lease qualifies as a capital lease. The original amount and accumulated depreciation are as follows: Copier capital lease agreement 22$ Accumulated depreciation 14$
The payout schedule is as follows:2013 8$ Less amount representing interest (1) Principal 7$ Lease Other The Agency has entered into an agreement with Ada County on the County Courthouse Project. The Agency has leased approximately 10.3 acres of land owned by Ada County under a master ground lease obligation that expires in 2098. The Agency issued bonds, Series 1999 for the County Courthouse Project in the amount of $62,620 to finance the acquisition, construction and improvement of the courthouse and administration building for use by Ada County, and related parking facilities, integrated retail space and other public improvements. The Agency refunded the Series 1999 bonds and issued the Series 2005 bonds. The bonds are the obligation of the Agency, payable from and secured solely by lease payments made by Ada County under the agreement. The agreement provides for lease payments equal to the amount necessary for the payment of annual debt service requirements for the Series 2005 bonds. The Agency plans to lease the Courthouse to Ada County for the remaining 12 years of the bond obligation, with title reverting to Ada County at the end of that term. Upon satisfaction of the outstanding lease obligation, Ada County may purchase the facilities from the Agency for $1. The Agency has recorded the transaction as a capital lease receivable for $41,705. This receivable will be received over the remaining 12 years of the term.
FOOTNOTES
E-27

The Agency entered into an agreement with Eleven Eleven West Jefferson LLC to lease 200 parking permits in the Boise Plaza Parking garage for a period of five years. The Agency has the right to sell the parking permits to the public in compliance with the rates in its parking management plan. The lease term is for 60 months following the effective date. The lease became effective on June 29, 2009, 60 days after the certificate of occupancy was issued. The Agency paid a prorated lease rate of $55 for the period June 29, 2009 to September 30, 2009. The annual lease rate is $214 and payment is due in advance on October 1st of each fiscal year. The lease terminates June 29, 2014. Future minimum lease payments under the leases are as follows:
Commitments and Contingencies The Agency agreed to take responsibility for the match requirement for the Federal Transportation Authority Multi-Modal Center grant that is administered through Valley Regional Transit. The match responsibility was previously the obligation of Boise City. The total match requirement may be up to $2,393. Of this total requirement, $250 has already been met, leaving a remaining maximum match commitment of $2,143. If the actual match is less than $2,143, the Agency will provide funding up to a total of $2,143, inclusive of the grant match to other projects identified in the Downtown Mobility Study. As the payout amount is uncertain, no amount has been recorded. The Agency established a separate bank account in which to deposit funds for the match. As of September 30, 2012 the balance in this account was $2,143. The Agency agreed to enter into an Owners Participation Agreement (OPA) with the Gardner Company, the developer of the project at 8th and Main in the Central District. The proposed project is a 15 floor office building with a value estimated by the developer at $50 to $60 million. The Agency’s financial participation will involve an anticipated amount up to but not exceeding $4 million of public improvements and site remediation. The OPA sets out conditions of performance that must be met to become eligible for financial participation. Pledged Revenues The Agency has certain long-term debt obligations for which revenues have been pledged. The Agency issued the Series 2010 A bonds to refund the 1995A, 1995 B, 1998 and 1999 bonds. Amounts in the 2010 A bond fund are pledged to support this debt. One twelfth of the annual debt service is to be deposited into the bond fund each month. The source revenues for the deposits into the bond fund are revenue allocation from the Central District and parking revenues from the parking system. The 2010 A bonds mature in 2015. The bond fund is pledged until the bonds mature. For the year ended September 30, 2012 the total debt service on these bonds was $1,185. The Agency issued the Series 2010 B bonds to refund the 2004 A and 2004 B bonds. Amounts in the 2010 B bond fund are pledged to support this debt. One twelfth of the annual debt service is to be deposited into the bond fund each month. The source revenues for the deposits into the bond fund are revenue allocation from the River Myrtle District and parking revenues from the parking system. The 2010 B bonds mature in 2024. The bond fund is pledged until the bonds mature. For the year ended September 30, 2012, the total debt service on these bonds was $814. The Agency issued the Series 2010 C Revenue Refunding Note to refund the 2002 C bonds. Amounts in the 2010 C note fund are pledged to support this debt. One twelfth of the annual debt
MasterGround Office Boise
Period Lease Facility Plaza Total2013 5,088$ 135$ 214$ 5,437$ 2014 5,234 159 5,393 2015 5,313 5,313 2016 5,472 5,472 2017 5,637 5,637
Thereafter 51,550 51,550 Total 78,294$ 135$ 373$ 78,802$
Total lease expense for the year ended September 30, 2012 w as $5,292.
FOOTNOTES
E-28

service is to be deposited into the note fund each month. The source revenues for the deposits into the note fund are revenue allocation from the River Myrtle District and parking revenues from the parking system. The 2010 B Revenue Refunding Note matures in 2024. The bond fund is pledged until the bonds mature. For the year ended September 30, 2012, the total debt service on this note was $241. The Agency issued the Series 2011 B Revenue Refunding Note to refund the 2002 B bonds. Amounts in the 2011 B note fund are pledged to support this debt. One twelfth of the annual debt service is to be deposited into the note fund each month. The source revenues for the deposits into the note fund are revenue allocation from the River Myrtle District and parking revenues from the parking system. The 2011 B Revenue Refunding Note matures in 2024. The bond fund is pledged until the bonds mature. For the year ended September 30, 2012, the total debt service on this note was $1,004. Significant Contractual Agreements The Agency is party to numerous agreements related to the development of the parcels in the Ada County Courthouse Corridor. In 2011, the various agreements were amended to facilitate the refunding of the 2002 B bonds with the 2011 B Revenue Refunding Note. The Business Terms Sheet/Funds Flow calculation was one of the agreements amended. Under the terms of the amended agreement, the tax increment guarantee for the Idaho Place parcels was restated as $245 for fiscal year 2011, increasing 3% each year thereafter through fiscal year 2024. The developer will receive credit against the guarantee amount for any actual increment received from the subject parcels. The supplemental rent obligation on the apartment parcels. The Agency is party to numerous agreements related to the development of the parcels in the Ada County Courthouse Corridor. In 2011, the various agreements were amended to facilitate the refunding of the 2002 B bonds with the 2011B Revenue Refunding Note. The Business Terms Sheet/Funds Flow calculation was one of the agreements amended. Under the terms of the amended agreement, the tax increment guarantee for the Idaho Place parcels was restated as $245 for fiscal year 2011, increasing 3% each year thereafter through fiscal year 2024. The developer will receive credit against the guarantee amount for any actual increment received from the subject parcels. The supplemental rent obligation on the apartment parcels in the Courthouse Corridor is stated in the Business Terms Sheet as $289 for fiscal year 2011, increasing 3% each year thereafter through fiscal year 2024. The developer will receive credit against the supplemental rent amount for any actual increment received from the apartment parcels. As of September 30, 2012, the tax increment guarantee and supplemental rent obligations that were due for fiscal year 2012 were unpaid. The unpaid tax increment guarantee for fiscal year 2012 due to the Agency is $238 and the unpaid supplemental rent for fiscal year 2012 due to the Agency is $64. Fund Conversion and Fund Balance Fund balance is reported in compliance with the agency’s fund balance policy and the guidance of GASB No. 54 (GASB 54), Fund Balance Reporting and Governmental Fund Type Definitions. This statement redefines the elements of fund balance in governmental funds and more clearly describes the different types of governmental funds to make the nature and extent of the constraints placed on a government’s fund balance more transparent. The governmental fund types classify fund balances as follows: Fund balance is reported as nonspendable when the resources cannot be spent because they are either legally or contractually required to be maintained intact, or are in a nonspendable form such as inventories, prepaid accounts, and assets held for resale. Fund balance is reported as restricted when the constraints placed on the use of resources are either: (a) externally imposed by creditors, grantors, contributors, or laws or regulations of other governments: or (b) imposed by law through constitutional provisions or enabling legislation. Fund Balance is reported as committed when the Board of Commissioners passes a resolution that places specific constraints on how the resources may be used. The Board can modify or rescind the resolution at any time through passage of an additional resolution.
FOOTNOTES
E-29

Fund Balance is reported as assigned when it is intended for a specific purpose and the authority to “assign” is delegated to the Executive Director. Unassigned fund balance is the residual classification for the General Fund. This classification represents fund balance that has not been restricted, committed, or assigned within the General Fund. This classification is also used to report any negative fund balance amounts in other governmental funds. The Board of Commissioners is the Agency’s highest level of decision making authority. The Board adopted the Fund Balance Policy on September 12, 2011. Per the guidance in the policy, the Board established that an emergency repair reserve in the minimum amount of $500 shall be on hand as of September 30th of each fiscal year in the Parking fund. Funds within this reserve may be used intra-fiscal year for unforeseen, non-routine repair and maintenance expenditures in the garages when failure to do such repair and maintenance could adversely affect life safety or the ability to operate the garage(s) normally in the immediate future. The Board will evaluate the emergency repair reserve amount as part of each fiscal year’s budget process and may amend the amount by resolution as it deems appropriate. The balance in the Parking Emergency Repair Reserve fund as of September 30, 2012 was $500. The Board further determined that it may be appropriate to set aside funds apart from working capital for a future project or initiative pursuant generally to the budget and related documents such as the capital investment plan and parking reinvestment program. The Board delegated its authority to assign funds in this manner to the Executive Director. As of September 30, 2012, $5,218 and $63 was assigned in the Parking and General funds respectively for parking reinvestment and capital projects budgeted in fiscal year 2013. The Board recommends a spending order of restricted, committed, assigned and then unassigned unless they approve otherwise.
FOOTNOTES
E-30
This page intentionally left blank
NONMAJOR GOVERNMENTAL FUNDS
F-1

Special RevenueCommunity and Special Revenue Permanent Fund
Economic Heritage DedicatedDevelopment Fund Trust
ASSETSCash and cash equivalents 61$ $ $ Investments 568 1,270 3,107 Accounts and interest receivable 2 2 12 Special assessments receivable 37 Grants receivable 42 Interfund receivables 4 14 12 Restricted cash and investments 536 Total assets 1,250$ 1,286$ 3,131$
LIABILITIESAccounts payable 82$ 3$ $ Interfund payables 32 3 74 Unearned revenue 37 Total liabilities 151 6 74
FUND BALANCESFund balances:Nonspendable: Permanent fund principal 3,057 Restricted for: Impact fees projects Heritage funds 1,280 Debt service - CID 511 Assigned to: Community and economic development 588 Total fund balances 1,099 1,280 3,057 Total liabilities and fund balances 1,250$ 1,286$ 3,131$
(amounts expressed in thousands)September 30, 2012
Nonmajor Governmental Funds Combining Balance Sheet
City of Boise, Idaho
NONMAJOR GOVERNMENTAL FUNDS
F-2

Capital Projects Total NonmajorImpact Fees Governmental
Fund Funds
$ 61$ 4,228 9,173
8 24 37
42 374 404
536 4,610$ 10,277$
235$ 320$ 533 642
37 768 999
3,057
3,842 3,842
1,280 511
588
3,842 9,278 4,610$ 10,277$
NONMAJOR GOVERNMENTAL FUNDS
F-3

Special Revenue Community and Special Revenue Permanent Fund
Economic Heritage DedicatedDevelopment Fund Trust
Revenues: Licenses and permits $ $ $ Intergovernmental revenues 478 Program income 144 Charges for services 154 Donations 220 Special assessments 45 Investment income 4 9 47 Total revenues 671 229 201
Expenditures: Current: Parks and recreation 86 Community and economic development 811 Community services 2 Capital outlay 543 41 Debt service: Principal payments 1 Interest and fiscal charges 358 Total expenditures 1,713 127 2
Excess (deficiency) of revenues over (under) expenditures (1,042) 102 199
Other financing sources (uses): Interfund transfers in 10 Interfund transfers out (58) Total other financing sources (uses): 10 (58)
Net change in fund balances (1,032) 102 141
Fund balance at beginning of year 2,131 1,178 2,916
Fund balance at end of year 1,099$ 1,280$ 3,057$
Combining Statement of Revenues, Expenditures, and Changes in Fund BalancesCity of Boise, Idaho
Nonmajor Governmental FundsFor the Fiscal Year Ended September 30, 2012
(amounts expressed in thousands)
NONMAJOR GOVERNMENTAL FUNDS
F-4

Capital Projects Total NonmajorImpact Fees Governmental
Fund Funds
1,726$ 1,726 478
144 374 528
220 45
45 105 2,145 3,246
5 91 811
2 2,250 2,834
1
358 2,255 4,097
(110) (851)
10 (58)
(48)
(110) (899)
3,952 10,177
3,842$ 9,278$
NONMAJOR GOVERNMENTAL FUNDS
F-5

This page intentionally left blank
NONMAJOR GOVERNMENTAL FUNDS
F-6

Actual Variances with Original Final Amounts Final Budget
Revenues: Property taxes $ $ $ $ Franchise fees 2,090 2,090 2,062 (28) Intergovernmental revenues 1,326 612 (714) Charges for services 358 20 (338) Donations 1,280 1,472 11 (1,461) Investment income 175 175 (6) (181) Miscellaneous revenues 175 (175) Total revenues 3,545 5,596 2,699 (2,897)
Expenditures: Current: General Government 1,099 2,388 1,601 787 Police 349 759 339 420 Fire 422 917 408 509 Parks and recreation 215 467 214 253 Culture 85 185 83 102 Community services 323 702 314 388 Capital outlay 9,195 19,982 10,918 9,064 Total expenditures 11,688 25,400 13,877 11,523 Excess (deficiency) of revenues over expenditures (8,143) (19,804) (11,178) 8,626
Other financing sources (uses):Capital leases Interfund transfers in 3,440 3,368 7,993 4,625 Interfund transfers out (557) (557) Proceeds from capital assets 4,337 4,337 Total other financing sources (uses) 3,440 3,368 11,773 8,405 Net change in fund balances (4,703) (16,436) 595 17,031 Fund balance at beginning of year, as restated 15,283 15,283 15,283 Fund balance at end of year 10,580$ (1,153)$ 15,878$ 17,031$
Budgeted Amounts
City of Boise, IdahoCapital Projects Fund
Schedule of Revenues, Expenditures, and Changes in Fund Balances - Budget and ActualFor the Fiscal Year Ended September 30, 2012
(amounts expressed in thousands)
BUDGET AND ACTUAL COMPARISON FOR NONMAJOR GOVENMENT FUNDS
G-1

Actual Variances with Original Final Amounts Final Budget
Revenues: Investment income 379$ 379$ 148$ (231)$ Total revenues 379 379 148 (231)
Expenditures: Current: General government 11 (11) Debt service: Principal 1,240 595 538 57 Bond issuance costs 116 732 (616) Interest and other charges 1,683 932 1,104 (172) Total expenditures 2,923 1,643 2,385 (742) Excess (deficiency) of revenues over expenditures (2,544) (1,264) (2,237) (973)
Other financing sources (uses):Interfund transfers in 2,497 1,101 1,011 (90) Refunding bonds issued 24,665 24,665 Bond premium 558 558 Payment to refunded bond escrow agent (25,096) (23,850) 1,246 Total other financing sources (uses) 2,497 1,228 2,384 1,156 Net change in fund balances (47) (36) 147 183 Fund balance at beginning of year 10,113 10,113 10,113 Fund balance at end of year 10,066$ 10,077$ 10,260$ 183$
Budgeted Amounts
Debt Service FundCity of Boise, Idaho
Schedule of Revenues, Expenditures, and Changes in Fund Balances - Budget and ActualFor the Fiscal Year Ended September 30, 2012
(amounts expressed in thousands)
BUDGET AND ACTUAL COMPARISON FOR NONMAJOR GOVENMENT FUNDS
G-2

Actual Variances with Original Final Amounts Final Budget
Revenues: Intergovernmental revenues 812$ 1,226$ 478$ (748)$ Program income 74 74 144 70 Special assessments 45 45 Investment income 4 4 Total revenues 886 1,300 671 (629)
Expenditures: Current: Community and economic development 1,201 1,625 811 814 Capital outlay 388 543 (155) Debt service: Principal payments 1 (1) Interest and other charges 358 (358) Total expenditures 1,201 2,013 1,713 300 Excess (deficiency) of revenues over expenditures (315) (713) (1,042) (329) Other financing sources (uses): Interfund transfers in 10 10 Total other financing sources (uses) 10 10 Net change in fund balances (315) (713) (1,032) (319) Fund balance at beginning of year 2,131 2,131 2,131 Fund balance at end of year 1,816$ 1,418$ 1,099$ (319)$
Budgeted Amounts
City of Boise, IdahoSpecial Revenue - Community and Economic Development
For the Fiscal Year Ended September 30, 2012(amounts expressed in thousands)
Schedule of Revenues, Expenditures, and Changes in Fund Balances - Budget and Actual
BUDGET AND ACTUAL COMPARISON FOR NONMAJOR GOVENMENT FUNDS
G-3

Actual Variances with Original Final Amounts Final Budget
Revenues: Donations 1,000$ 1,000$ 220$ (780)$ Investment income 9 9 Total revenues 1,000 1,000 229 (771)
Expenditures: Current: Parks and recreation 1,000 500 86 414 Capital outlay 500 41 459 Total expenditures 1,000 1,000 127 873 Excess (deficiency) of revenues over expenditures 102 102
Net change in fund balances 102 102 Fund balance at beginning of year 1,178 1,178 1,178 Fund balance at end of year 1,178$ 1,178$ 1,280$ 102$
(amounts expressed in thousands)
Budgeted Amounts
City of Boise, IdahoSpecial Revenue - Heritage Fund
Schedule of Revenues, Expenditures, and Changes in Fund Balances - Budget and ActualFor the Fiscal Year Ended September 30, 2012
BUDGET AND ACTUAL COMPARISON FOR NONMAJOR GOVENMENT FUNDS
G-4

Actual Variances with Original Final Amounts Final Budget
Revenues: Charges for services 40$ 40$ 154$ 114$ Investment income 80 80 47 (33) Total revenues 120 120 201 81
Expenditures: Current: Community services 63 63 2 61 Total expenditures 63 63 2 61
Excess (deficiency) of revenues over (under) expenditures 57 57 199 142
Other financing sources (uses):Interfund transfers out (50) (50) (58) (8) Total other financing sources (uses): (50) (50) (58) (8) Net change in fund balances 7 7 141 134 Fund balance at beginning of year 2,916 2,916 2,916 Fund balance at end of year 2,923$ 2,923$ 3,057$ 134$
Budgeted Amounts
City of Boise, IdahoPermanent Fund - Dedicated Trust
Schedule of Revenues, Expenditures, and Changes in Fund Balances - Budget and ActualFor the Fiscal Year Ended September 30, 2012
(amounts expressed in thousands)
BUDGET AND ACTUAL COMPARISON FOR NONMAJOR GOVENMENT FUNDS
G-5

Actual Variances with Original Final Amounts Final Budget
Revenues: Licenses and permits 958$ 958$ 1,726$ 768$ Charges for services 374 374 Investment income 45 45 Total revenues 958 958 2,145 1,187
Expenditures: Current: Parks and recreation 5 (5) Capital outlay 6,068 2,250 3,818 Total expenditures 6,068 2,255 3,813 Excess (deficiency) of revenues over expenditures 958 (5,110) (110) 5,000
Net change in fund balances 958 (5,110) (110) 5,000 Fund balance at beginning of year 3,952 3,952 3,952 Fund balance at end of year 4,910$ (1,158)$ 3,842$ 5,000$
(amounts expressed in thousands)
Budgeted Amounts
City of Boise, IdahoCapital Projects - Impact Fees Fund
Schedule of Revenues, Expenditures, and Changes in Fund Balances - Budget and ActualFor the Fiscal Year Ended September 30, 2012
BUDGET AND ACTUAL COMPARISON FOR NONMAJOR GOVENMENT FUNDS
G-6

This page intentionally left blank
NONMAJOR PROPIETARY FUND
H-1

Municipal Housing Total NonmajorGeothermal Irrigation Rehabilitation Business-type Funds
ASSETSCurrent assets:Cash and cash equivalents $ $ $ $ Investments 51 80 1,632 1,763 Receivables (net of allowance for uncollectibles) Accounts and interest 15 351 366 Grants 168 150 318 Assessments 7 7 Interfund receivables 9 13 161 183 Inventory 173 173 Other assets 59 59 Prepaid items 4 1 5 Total current assets 420 100 2,354 2,874
Noncurrent assets:Long-term receivables 567 567 Mortgage loans receivable 12,265 12,265 Capital assets: Land 2,471 2,471 Buildings 110 10,522 10,632 Improvements other than buildings 2,175 155 2,330 Service lines 5,177 149 5,326 Automobiles and trucks 142 142 Machinery and equipment 405 115 235 755 Intangible assets 9 28 37 Construction in process 2,771 261 3,032 Less accumulated depreciation (3,493) (73) (5,820) (9,386) Total capital assets (net of accumulated depreciation) 7,154 191 7,994 15,339 Total noncurrent assets 7,154 191 20,826 28,171 Total assets 7,574$ 291$ 23,180$ 31,045$
City of Boise, IdahoNonmajor Proprietary Funds
September 30, 2012Combining Statement of Net Assets
(amounts expressed in thousands)
NONMAJOR PROPIETARY FUND
H-2

Municipal Housing Total NonmajorGeothermal Irrigation Rehabilitation Business-type Funds
LIABILITIESCurrent liabilities: Accounts payable 199$ 2$ 74$ 275$ Other accrued liabilities 10 179 189 Compensated absences 1 5 6 Interfund payables 207 3 437 647 Unearned revenue 300 8 308 Current portion of long-term debt 140 140 Total current liabilities 707 23 835 1,565
Noncurrent liabilities: Compensated absences and and OPEB 12 83 95 Interfund payables 112 112 Other long-term debt, non-current 560 560 Total noncurrent liabilities 124 643 767 Total liabilities 831 23 1,478 2,332
NET ASSETSInvested in capital assets, net of related debt 7,154 191 7,294 14,639 Restricted for loans 14,408 14,408 Unrestricted (deficit) (411) 77 (334) Total net assets 6,743$ 268$ 21,702$ 28,713$
Combining Statement of Net Assets (continued)September 30, 2010
(amounts expressed in thousands)
Nonmajor Proprietary FundsCity of Boise, Idaho
NONMAJOR PROPIETARY FUND
H-3

Municipal Housing Total NonmajorGeothermal Irrigation Rehabilitation Business-type Funds
Operating revenues: Charges for services: Program income $ $ 1,346$ 1,346$ Interest income 508 508 User fees 590 29 619 Total charges for services 590 29 1,854 2,473 Miscellaneous revenues 14 14 Total operating revenues 590 29 1,868 2,487
Operating expenses: Personal services 78 920 998 Contractual services and utilities 265 28 2,934 3,227 Supplies and materials (9) 26 17 Depreciation 163 8 419 590 Total operating expenses 497 36 4,299 4,832
Operating income (loss) 93 (7) (2,431) (2,345)
Nonoperating revenues (expenses) Operating grants 1,517 1,517 Interest revenue 55 55 Interest expense (45) (45) Total nonoperating revenues (expenses) 1,527 1,527
Income before interfund transfers and contributions 93 (7) (904) (818) Interfund transfers in 13 35 48 Interfund transfers out (100) (30) (130) Capital contributions 479 180 659 Change in net assets 472 6 (719) (241)
Total net assets - beginning of year 6,271 262 22,421 28,954
Total net assets - end of year 6,743$ 268$ 21,702$ 28,713$
(amounts expressed in thousands)
City of Boise, IdahoCombining Statement of Revenues, Expenses, and Changes in Fund Net Assets
Nonmajor Proprietary FundsFor the Fiscal Year Ended September 30, 2012
NONMAJOR PROPIETARY FUND
H-4

This page intentionally left blank
NONMAJOR PROPIETARY FUND
H-5

MunicipalGeothermal Irrigation
CASH FLOWS FROM OPERATING ACTIVITIES Receipts from customers and users 634$ 31$ Receipts from interfund services provided 2 Receipts from interfund services used 116 Payments to suppliers (344) (27) Payments to employees (79) Payments for interfund services provided (1) Payments for interfund services used (2) Other operating revenue received Other operating payments Net cash provided (used) by operating activities 326 4 CASH FLOWS FROM NONCAPITAL FINANCING ACTIVITIES Interfund transfers to other funds (100) Operating grants received Interfund transfers from other funds 13 Net cash provided (used) by noncapital financing activities (100) 13 CASH FLOWS FROM CAPITAL AND RELATED FINANCING ACTIVITIES Acquisition and construction of capital assets (937) Proceeds from property sales NSP refurbishments Principal paid on debt Interest paid on financing Capital contributions 675 Net cash provided (used) by capital and related financing activities (262) CASH FLOWS FROM INVESTING ACTIVITIES Purchase of investment securities (167) Proceeds from sale and maturities of investment securities 150 Interest on investments and advances Net cash provided (used) by investing activities (17) Net increase (decrease) in cash (36) Cash beginning of year 36 Cash end of year $ $
City of Boise, IdahoCombining Statement of Cash Flows
Nonmajor Proprietary FundsFor the Fiscal Year Ended September 30, 2012
(amounts expressed in thousands)
NONMAJOR PROPIETARY FUND
H-6

Rehabilitation Totals
2,681$ 3,346$ 16 18 89 205
(3,210) (3,581) (931) (1,010)
(1) (2)
243 243 (602) (602)
(1,714) (1,384)
(30) (130)
1,774 1,774 35 48
1,779 1,692
(438) (1,375) 145 145 508 508
(140) (140) (51) (51)
675
24 (238)
(1,082) (1,249) 940 1,090 53 53
(89) (106) (36)
36 $ $
Housing
NONMAJOR PROPIETARY FUND
H-7

MunicipalGeothermal Irrigation
Reconciliation of operating income to net cashprovided (used) by operating activities: Operating income (loss) 93$ (7)$ Adjustments to reconcile operating income (loss) to net cash provided (used) by operating activities: Depreciation 163 8 (Increase) decrease in accounts receivable 109 (Increase) decrease in assessments (2) (Increase) decrease in mortgage loans receivable (Increase) decrease in mortgage loans in process (Increase) decrease in inventory (10) (Increase) decrease in interfund receivables (1) 2 (Increase) decrease in prepaid items (4) Increase (decrease) in accounts payable (79) 1 Increase (decrease) in compensated absences 4 Increase (decrease) in other accrued liabilities Increase (decrease) in interfund payables 116 (2) Increase (decrease) in unearned revenue (65) 4 Total adjustments 233 11 Net cash provided by operating activities 326$ 4$
Noncash investing, capital and financing activities: Contributions of capital assets from government Increase (decrease) in fair value of investments (1)
Nonmajor Proprietary FundsCombining Statement of Cash Flows (continued)
City of Boise, Idaho
(amounts expressed in thousands)For the Fiscal Year Ended September 30, 2012
NONMAJOR PROPIETARY FUND
H-8

Rehabilitation Totals
(2,431)$ (2,345)$
419 590 818 927
(2) (357) (357) 366 366
(10) 16 17
(4) (284) (362)
22 26 (372) (372)
89 203 (61)
717 961 (1,714)$ (1,384)$
32 32 3 2
Housing
NONMAJOR PROPIETARY FUND
H-9

This page intentionally left blank
NONMAJOR PROPIETARY FUND
H-10
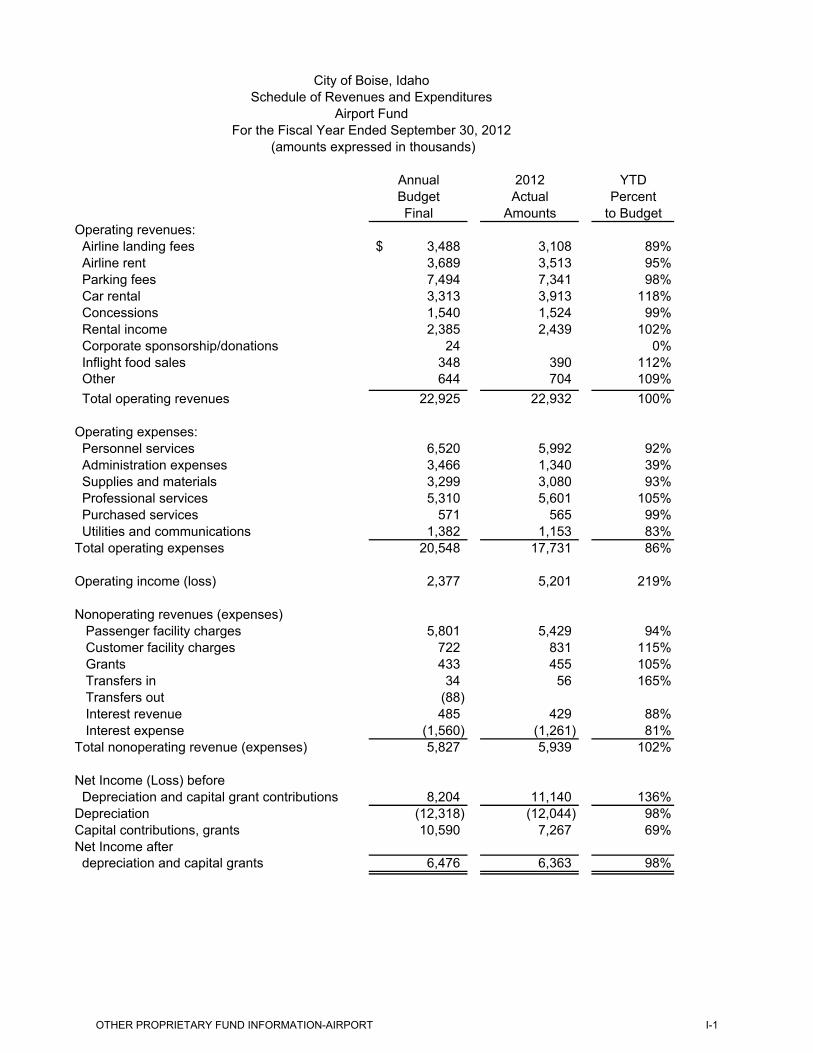
City of Boise, IdahoSchedule of Revenues and Expenditures
Airport FundFor the Fiscal Year Ended September 30, 2012
(amounts expressed in thousands)
Annual 2012 YTDBudget Actual PercentFinal Amounts to Budget
Operating revenues: Airline landing fees 3,488$ 3,108 89% Airline rent 3,689 3,513 95% Parking fees 7,494 7,341 98% Car rental 3,313 3,913 118% Concessions 1,540 1,524 99% Rental income 2,385 2,439 102% Corporate sponsorship/donations 24 0% Inflight food sales 348 390 112% Other 644 704 109% Total operating revenues 22,925 22,932 100%
Operating expenses: Personnel services 6,520 5,992 92% Administration expenses 3,466 1,340 39% Supplies and materials 3,299 3,080 93% Professional services 5,310 5,601 105% Purchased services 571 565 99% Utilities and communications 1,382 1,153 83%Total operating expenses 20,548 17,731 86%
Operating income (loss) 2,377 5,201 219%
Nonoperating revenues (expenses) Passenger facility charges 5,801 5,429 94% Customer facility charges 722 831 115% Grants 433 455 105% Transfers in 34 56 165% Transfers out (88) Interest revenue 485 429 88% Interest expense (1,560) (1,261) 81%Total nonoperating revenue (expenses) 5,827 5,939 102%
Net Income (Loss) before Depreciation and capital grant contributions 8,204 11,140 136%Depreciation (12,318) (12,044) 98%Capital contributions, grants 10,590 7,267 69%Net Income after depreciation and capital grants 6,476 6,363 98%
OTHER PROPRIETARY FUND INFORMATION-AIRPORT
I-1
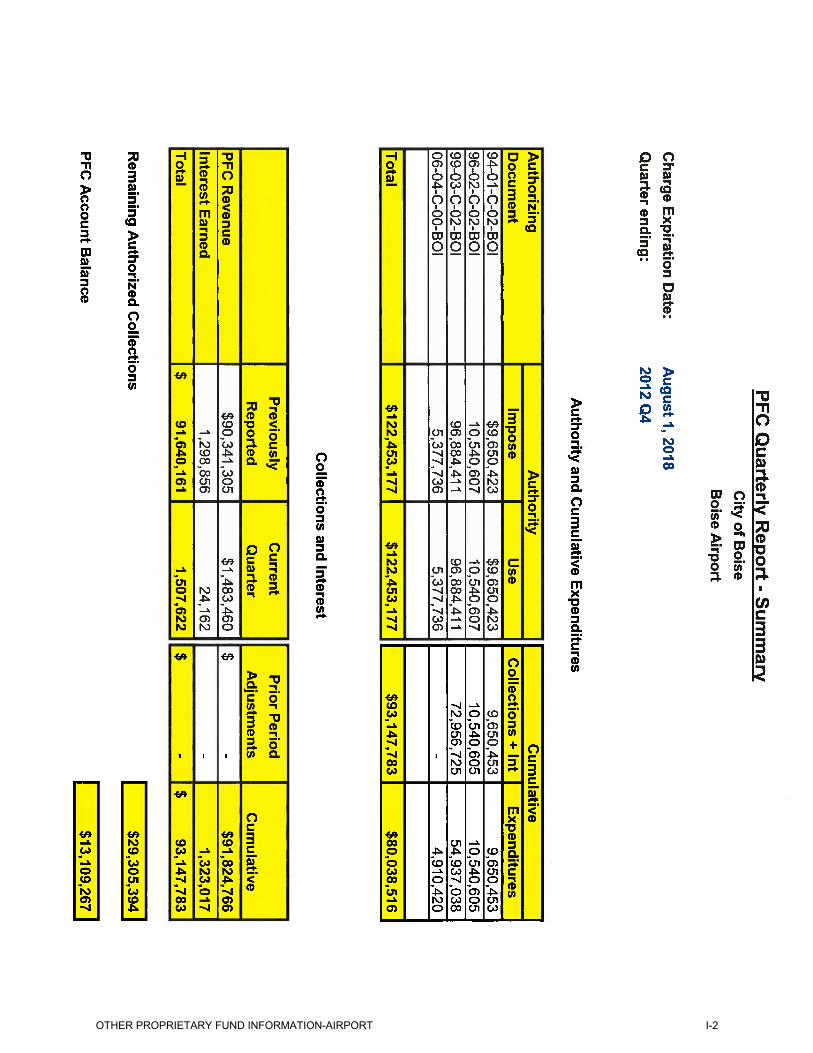
OTHER PROPRIETARY FUND INFORMATION-AIRPORT
I-2

This page intentionally left blank
INTERNAL SERVICE FUND
J-1
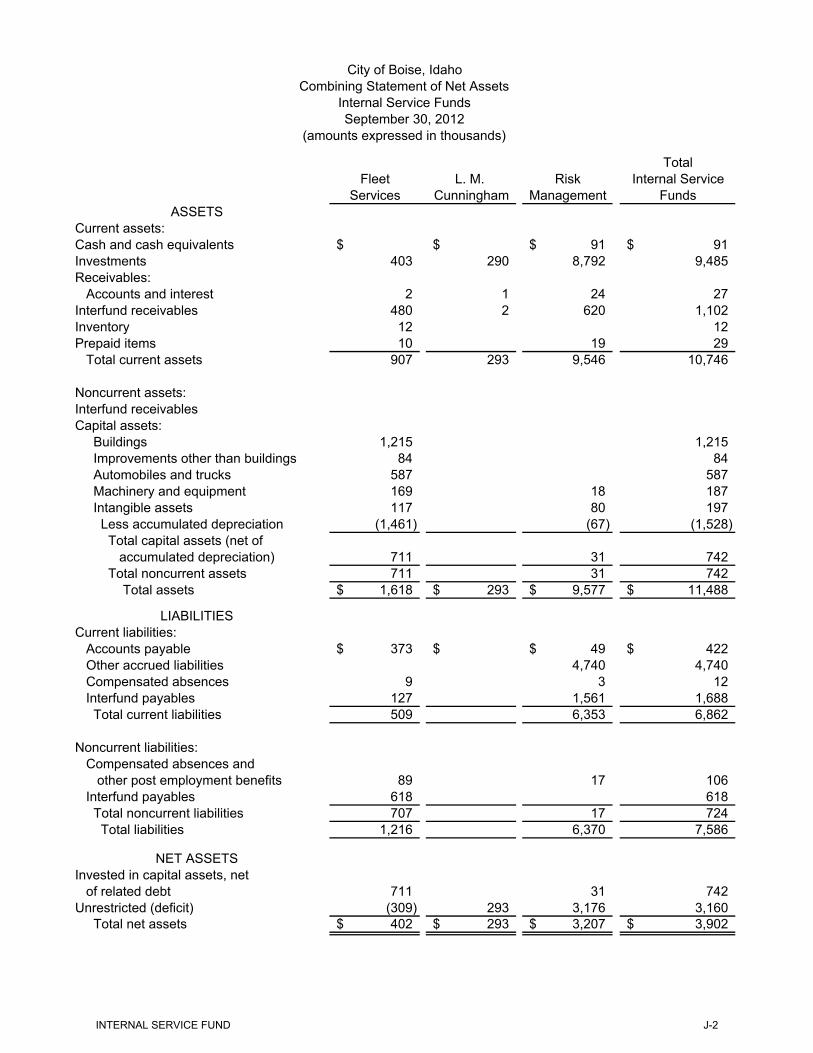
TotalFleet L. M. Risk Internal Service
Services Cunningham Management FundsASSETS
Current assets:Cash and cash equivalents $ $ 91$ 91$ Investments 403 290 8,792 9,485 Receivables: Accounts and interest 2 1 24 27 Interfund receivables 480 2 620 1,102 Inventory 12 12 Prepaid items 10 19 29 Total current assets 907 293 9,546 10,746
Noncurrent assets:Interfund receivables Capital assets: Buildings 1,215 1,215 Improvements other than buildings 84 84 Automobiles and trucks 587 587 Machinery and equipment 169 18 187 Intangible assets 117 80 197 Less accumulated depreciation (1,461) (67) (1,528) Total capital assets (net of accumulated depreciation) 711 31 742 Total noncurrent assets 711 31 742 Total assets 1,618$ 293$ 9,577$ 11,488$
LIABILITIESCurrent liabilities: Accounts payable 373$ $ 49$ 422$ Other accrued liabilities 4,740 4,740 Compensated absences 9 3 12 Interfund payables 127 1,561 1,688 Total current liabilities 509 6,353 6,862
Noncurrent liabilities: Compensated absences and other post employment benefits 89 17 106 Interfund payables 618 618 Total noncurrent liabilities 707 17 724 Total liabilities 1,216 6,370 7,586
NET ASSETSInvested in capital assets, net of related debt 711 31 742 Unrestricted (deficit) (309) 293 3,176 3,160 Total net assets 402$ 293$ 3,207$ 3,902$
(amounts expressed in thousands)
City of Boise, IdahoCombining Statement of Net Assets
Internal Service FundsSeptember 30, 2012
INTERNAL SERVICE FUND
J-2

TotalInternal Service
Services Cunningham Management FundsOperating revenues: Charges for services: User fees 2,777$ 7$ 3,830$ 6,614$ Total charges for services 2,777 7 3,830 6,614 Miscellaneous revenues 9 1 10 20 Donations 6 6 Total operating revenues 2,786 14 3,840 6,640
Operating expenses: Personal services 954 463 1,417 Contractual services and utilities 1,052 6 3,374 4,432 Supplies and materials 726 12 15 753 Depreciation 99 18 117 Total operating expenses 2,831 18 3,870 6,719
Operating income (loss) (45) (4) (30) (79)
Nonoperating revenues (expenses) Interest revenue 4 79 83 Interest expense (9) (9) Total nonoperating revenues (expenses) (9) 4 79 74
Income before interfund transfers and contributions (54) 49 (5) Interfund transfers in 8 1 9 Interfund transfers out (790) (790) Change in net assets (46) (740) (786)
Total net assets - beginning of year 448 293 3,947 4,688
Total net assets - end of year 402$ 293$ 3,207$ 3,902$
Fleet L. M. Risk
(amounts expressed in thousands)
City of Boise, IdahoCombining Statement of Revenues, Expenses, and Changes in Fund Net Assets
Internal Service FundsFor the Fiscal Year Ended September 30, 2012
INTERNAL SERVICE FUND
J-3

Shop CunninghamCASH FLOWS FROM OPERATING ACTIVITIES Receipts from customers and users 2,777$ 7$ Receipts from interfund services used 78 Other operating receipts 7 Other operating payments (5) Payments to suppliers (1,733) (18) Payments to employees (1,002) Payments for interfund services provided (115) (2) Payments for interfund services used Net cash provided (used) by operating activities (6) CASH FLOWS FROM NONCAPITAL FINANCING ACTIVITIES Interfund transfers to other funds Interfund transfers from other funds 8 Payments for advances from other funds (65) Net cash provided (used) by noncapital financing activities (57) CASH FLOWS FROM CAPITAL AND RELATED FINANCING ACTIVITIES Interest paid on financing (10) Net cash provided (used ) by capital and related financing activities (10) CASH FLOWS FROM INVESTING ACTIVITIES Purchase of investment securities (100) (250) Proceeds from sale and maturities of investment securities 167 252 Interest on investments 4 Net cash provided (used) by investing activities 67 6 Net increase (decrease) in cash and cash equivalents
Cash and cash equivalents at beginning of year Cash and cash equivalents at end of year $ $
City of Boise, IdahoCombining Statement of Cash Flows
Internal Service FundsFor the Fiscal Year Ended September 30, 2012
(amounts expressed in thousands)
L. M.
INTERNAL SERVICE FUND
J-4

RiskManagement Totals
3,830$ 6,614$ 38 116 10 17
(5) (2,604) (4,355)
(481) (1,483) (117)
(250) (250) 543 537
(790) (790)
1 9 (65)
(789) (846)
(10) (10)
(7,779) (8,129) 7,950 8,369
106 110 277 350 31 31
60 60
91$ 91$
INTERNAL SERVICE FUND
J-5
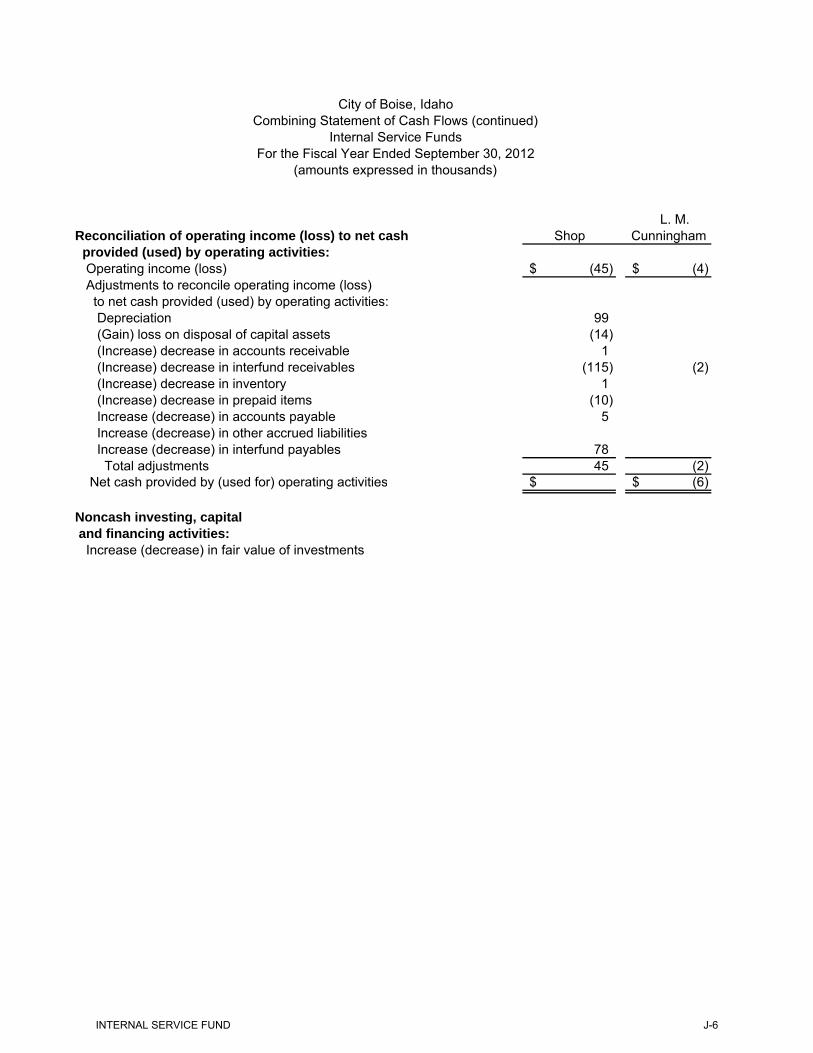
Reconciliation of operating income (loss) to net cash Shop Cunningham provided (used) by operating activities: Operating income (loss) (45)$ (4)$ Adjustments to reconcile operating income (loss) to net cash provided (used) by operating activities: Depreciation 99 (Gain) loss on disposal of capital assets (14) (Increase) decrease in accounts receivable 1 (Increase) decrease in interfund receivables (115) (2) (Increase) decrease in inventory 1 (Increase) decrease in prepaid items (10) Increase (decrease) in accounts payable 5 Increase (decrease) in other accrued liabilities Increase (decrease) in interfund payables 78 Total adjustments 45 (2) Net cash provided by (used for) operating activities $ (6)$
Noncash investing, capital and financing activities: Increase (decrease) in fair value of investments
L. M.
(amounts expressed in thousands)
City of Boise, IdahoCombining Statement of Cash Flows (continued)
Internal Service FundsFor the Fiscal Year Ended September 30, 2012
INTERNAL SERVICE FUND
J-6

RiskManagement Totals
(30)$ (79)$
18 117 (14) 1
38 (79) 1
15 5 (27) (22) 779 779
(250) (172) 573 616 543$ 537$
(16) (16)
INTERNAL SERVICE FUND
J-7

Balance BalanceSeptember 30, September 30,
2011 Additions Deletions 2012
Boise City Agency Fund
ASSETS
Cash and cash equivalents 25$ 7,296$ 7,311$ 10$ Investments 701 4,443 4,051 1,093
Total assets 726$ 11,739$ 11,362$ 1,103$
LIABILITIES
Accounts and interest payable 130$ 3,239$ 3,030$ 339$ Refunds payable and other 596 2,566 2,398 764
Total liabilities 726$ 5,805$ 5,428$ 1,103$
(amounts expressed in thousands)
Boise City, Idaho Statement of Changes in Assets and Liabilities
Agency FundFor the Fiscal Year Ended September 30, 2012
INTERNAL SERVICE FUND
J-8
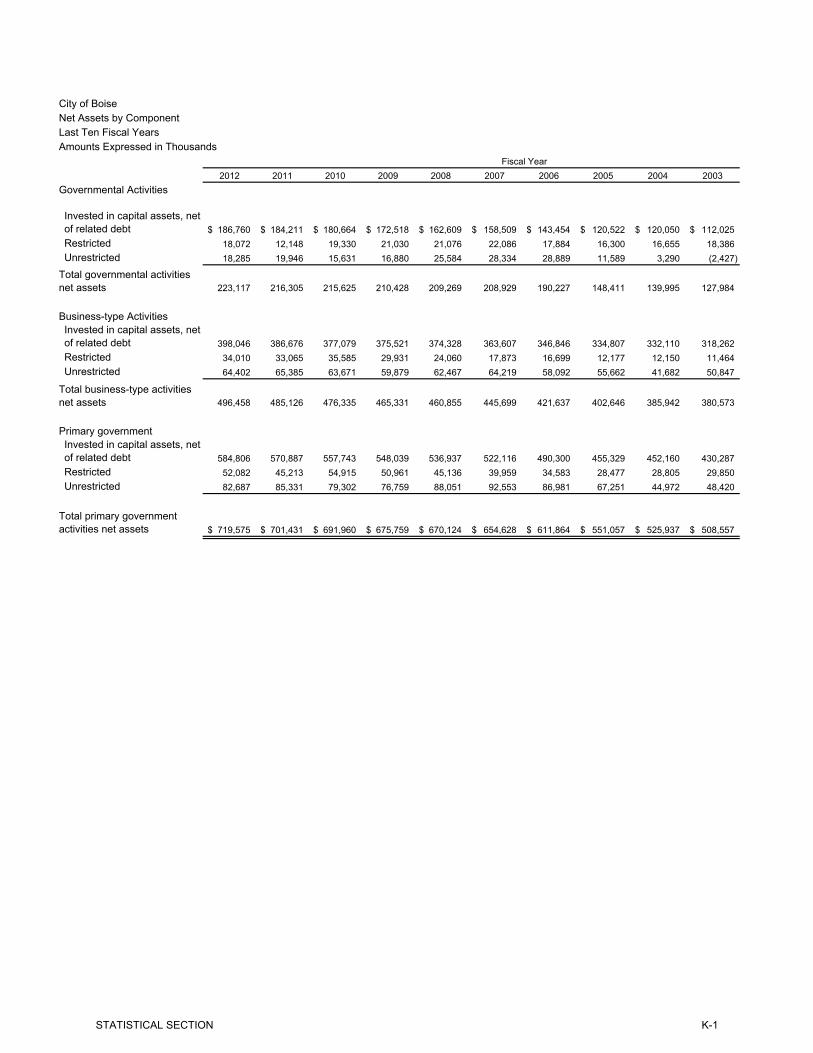
Fiscal Year2012 2011 2010 2009 2008 2007 2006 2005 2004 2003
Invested in capital assets, net of related debt 186,760$ 184,211$ 180,664$ 172,518$ 162,609$ 158,509$ 143,454$ 120,522$ 120,050$ 112,025$ Restricted 18,072 12,148 19,330 21,030 21,076 22,086 17,884 16,300 16,655 18,386 Unrestricted 18,285 19,946 15,631 16,880 25,584 28,334 28,889 11,589 3,290 (2,427)
223,117 216,305 215,625 210,428 209,269 208,929 190,227 148,411 139,995 127,984
Invested in capital assets, net of related debt 398,046 386,676 377,079 375,521 374,328 363,607 346,846 334,807 332,110 318,262 Restricted 34,010 33,065 35,585 29,931 24,060 17,873 16,699 12,177 12,150 11,464 Unrestricted 64,402 65,385 63,671 59,879 62,467 64,219 58,092 55,662 41,682 50,847
496,458 485,126 476,335 465,331 460,855 445,699 421,637 402,646 385,942 380,573
Invested in capital assets, net of related debt 584,806 570,887 557,743 548,039 536,937 522,116 490,300 455,329 452,160 430,287 Restricted 52,082 45,213 54,915 50,961 45,136 39,959 34,583 28,477 28,805 29,850 Unrestricted 82,687 85,331 79,302 76,759 88,051 92,553 86,981 67,251 44,972 48,420
719,575$ 701,431$ 691,960$ 675,759$ 670,124$ 654,628$ 611,864$ 551,057$ 525,937$ 508,557$ Total primary government activities net assets
Total governmental activities net assets
Total business-type activities net assets
Governmental Activities
Business-type Activities
City of Boise
Amounts Expressed in ThousandsLast Ten Fiscal YearsNet Assets by Component
Primary government
STATISTICAL SECTION
K-1

Fiscal Year2012 2011 2010 2009 2008 2007 2006 2005 2004 2003(1)
28,255$ 33,915$ 28,881$ 28,838$ 27,997$ 22,019$ 16,217$ 17,634$ 14,452$ 13,977$ 58,333
Fire 43,876 41,485 40,486 35,655 35,364 31,644 31,063 30,057 26,797 Police 47,591 46,051 47,125 47,181 45,958 40,340 36,415 34,874 32,681
22,362 22,634 22,158 22,283 22,624 21,199 19,155 18,092 17,682 15,141 10,253 10,471 9,477 9,642 9,002 7,333 7,266 6,798 5,310 6,207 13,287 13,674 13,803 13,849 14,437 13,758 12,066 11,401 11,545 10,845
842 935 1,663 1,137 1,384 1,437 585 567 743 757 1,195 1,549 1,528 1,667 1,803 1,872 1,929 1,999 2,064 2,209
167,661 170,714 165,121 160,252 158,569 139,602 124,696 121,422 111,274 107,469
Business-type activitiesAirport 30,983 31,934 30,796 31,492 32,829 32,880 28,622 27,414 26,268 21,450 Sewer 31,853 30,468 29,909 30,355 30,297 27,599 27,580 26,204 25,312 25,570 Solid waste 24,406 24,044 23,712 23,763 23,728 20,203 18,971 16,207 14,534 13,918 Other 4,875 3,977 3,518 3,288 3,125 3,927 3,193 4,313 4,133 6,790
Total business-type activies expenses 92,117 90,423 87,935 88,898 89,979 84,609 78,366 74,138 70,247 67,728 Total primary government expenses 259,778$ 261,137$ 253,056$ 249,150$ 248,548$ 224,211$ 203,062$ 195,560$ 181,521$ 175,197$
Program RevenuesGovernmental activities
Charges for services:General government 6,697$ 8,296$ 6,599$ 6,561$ 6,490$ 5,324$ 4,285$ 3,342$ 1,719$ 2,643$ Public Safety:(1) 5,634 Fire 7,149 7,366 7,751 4,731 3,519 3,471 3,819 3,263 3,218 Police 5,171 4,941 5,290 5,361 5,698 3,707 3,235 2,974 2,344 Parks and recreation 6,203 6,129 6,647 6,529 7,088 7,654 7,634 7,055 5,957 5,320 Community services 8,103 6,661 6,408 6,395 9,122 10,357 10,261 8,510 7,382 351 Other activities 639 734 1,187 880 520 484 485 528 486 6,339
Operation grants and contributions 19,221 20,085 22,040 19,715 20,916 22,459 19,507 18,350 17,808 16,802 Capital grants and contributions 4,027 5,069 4,057 2,763 2,406 5,055 23,647 2,226 6,822 3,490
Total governmental activities revenues 57,210 59,281 59,979 52,935 55,759 58,511 72,873 46,248 45,736 40,579
Business-type activitiesCharges for services:
Airport 22,824 22,980 22,221 21,125 23,683 23,624 22,242 20,269 17,611 15,745 Sewer 28,625 28,019 26,908 25,174 25,781 25,570 24,201 23,066 22,168 20,399 Solid Waste 23,976 23,386 23,563 24,157 23,508 19,707 18,698 15,623 14,589 13,123 Other 2,473 2,470 2,361 2,717 2,712 2,604 2,275 2,523 2,450 3,259
Operation grants and contributions 5,610 6,512 5,899 4,927 5,600 4,389 2,401 2,177 1,939 1,508 Capital grants and contributions 18,715 15,844 15,976 12,228 20,571 27,845 24,336 27,757 21,860 31,192
102,223 99,211 96,928 90,328 101,855 103,739 94,153 91,415 80,617 85,226
159,433$ 158,492$ 156,907$ 143,263$ 157,614$ 162,250$ 167,026$ 137,663$ 126,353$ 125,805$
Net (Expense)/RevenueGovernmental activities (110,451)$ (111,433)$ (105,142)$ (107,317)$ (102,810)$ (81,091)$ (51,823)$ (75,174)$ (65,538)$ (66,890)$ Business-type activities 10,106 8,788 8,993 1,430 11,876 19,130 15,787 17,277 10,370 17,498 Total primary government net expense (100,345)$ (102,645)$ (96,149)$ (105,887)$ (90,934)$ (61,961)$ (36,036)$ (57,897)$ (55,168)$ (49,392)$
General Revenues and Other Changes in Net AssetsGovernmental activities
Taxes 109,314$ 105,534$ 102,097$ 98,807$ 92,769$ 88,121$ 83,484$ 76,350$ 71,660$ 71,388$ Franchise fees 7,189 6,849 6,998 7,527 7,343 6,940 6,937 5,992 5,253 5,031 Investment earnings 941 854 1,085 1,705 2,975 4,572 3,266 1,532 733 810 Special itemsMiscellaneous (1,948) (160) Transfers 108 (56) 159 437 63 24 (48) 1,664 (97) (503)
Total governmental activities 117,552 113,181 110,339 108,476 103,150 99,657 93,639 83,590 77,549 76,566
Business-type activitiesInvestment earnings 1,334 1,367 2,170 3,483 3,343 4,380 3,153 1,581 897 1,478 Gain on sale of capital assets - - - 3 99 Special items (589) (5,996) (16,534) Transfers (108) 56 (159) (437) (63) (24) 48 (1,664) 97 503
Total business-type activities 1,226 1,423 2,011 3,046 3,280 4,356 3,204 (573) (5,002) (14,553) Total primary government 118,778$ 114,604$ 112,350$ 111,522$ 106,430$ 104,013$ 96,843$ 83,017$ 72,547$ 62,013$
Changes in Net AssetsGovernmental activities 7,101$ 1,748$ 5,197$ 1,159$ 340$ 18,566$ 41,816$ 8,416$ 12,011$ 9,676$ Business-type activities 11,332 10,211 11,004 4,476 15,156 23,486 18,991 16,704 5,368 2,945 Total primary government 18,433$ 11,959$ 16,201$ 5,635$ 15,496$ 42,052$ 60,807$ 25,120$ 17,379$ 12,621$
(1) For FY 2003 the breakdown between Police and Fire was not available in the CAFR statements
Governmental activities
City of BoiseChanges in Net AssetsLast Ten Fiscal YearsAmounts Expressed in Thousands
Expenses
Interest and fiscal chargesTotal governmental activities expenses
Total business-type activities and program revenues
Total primary governement program revenues
General GovernmentPublic Safety: (1)
Parks and recreationCultureCommunity ServicesCommunity Development
STATISTICAL SECTION
K-2
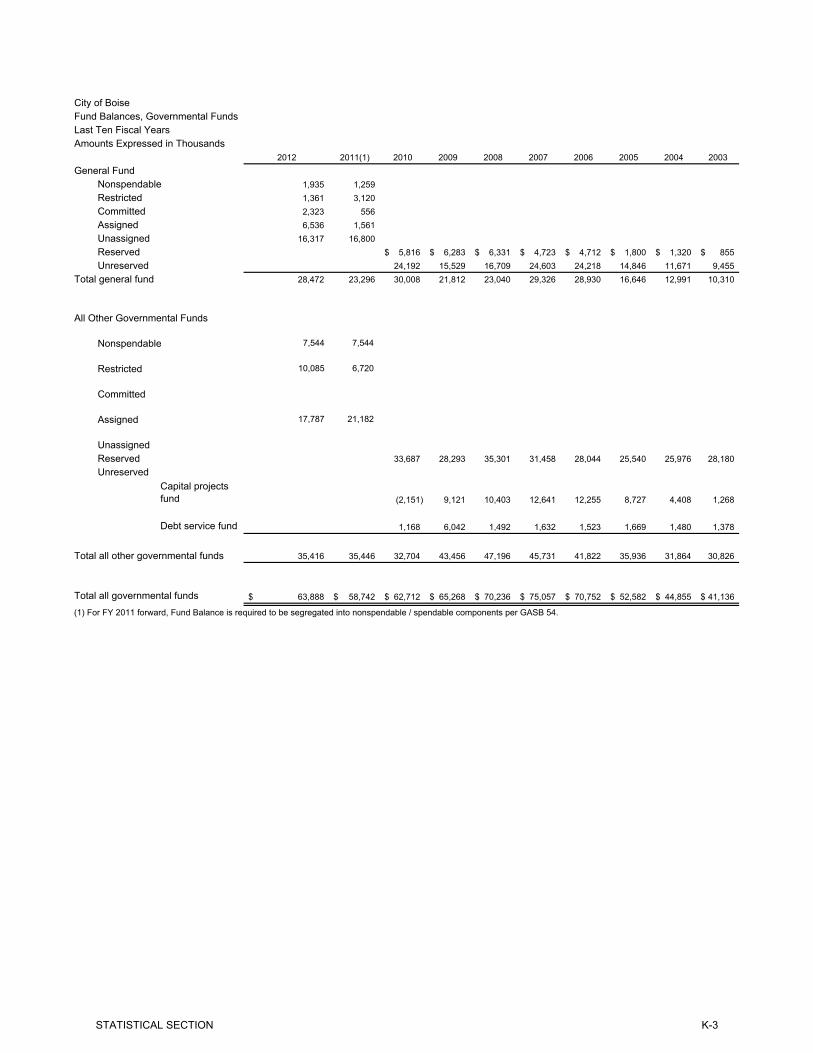
City of BoiseFund Balances, Governmental FundsLast Ten Fiscal YearsAmounts Expressed in Thousands
2012 2011(1) 2010 2009 2008 2007 2006 2005 2004 2003General Fund
Nonspendable 1,935 1,259 Restricted 1,361 3,120 Committed 2,323 556 Assigned 6,536 1,561 Unassigned 16,317 16,800 Reserved 5,816$ 6,283$ 6,331$ 4,723$ 4,712$ 1,800$ 1,320$ 855$ Unreserved 24,192 15,529 16,709 24,603 24,218 14,846 11,671 9,455
Total general fund 28,472 23,296 30,008 21,812 23,040 29,326 28,930 16,646 12,991 10,310
Nonspendable 7,544 7,544
Restricted 10,085 6,720
Committed
Assigned 17,787 21,182
Unassigned33,687 28,293 35,301 31,458 28,044 25,540 25,976 28,180
Capital projects fund (2,151) 9,121 10,403 12,641 12,255 8,727 4,408 1,268
Debt service fund 1,168 6,042 1,492 1,632 1,523 1,669 1,480 1,378
35,416 35,446 32,704 43,456 47,196 45,731 41,822 35,936 31,864 30,826
63,888$ 58,742$ 62,712$ 65,268$ 70,236$ 75,057$ 70,752$ 52,582$ 44,855$ 41,136$
(1) For FY 2011 forward, Fund Balance is required to be segregated into nonspendable / spendable components per GASB 54.
All Other Governmental Funds
Total all governmental funds
Total all other governmental funds
UnreservedReserved
STATISTICAL SECTION
K-3

City of BoiseChanges in Fund Balances, Governmental FundsLast Ten Fiscal YearsAmounts Expressed in Thousands
2012 2011 2010 2009 2008 2007 2006 2005 2004 2003
Revenues
Property taxes 108,733$ 105,925$ 101,822$ 97,573$ 92,500$ 88,087$ 83,635$ 76,446$ 71,761$ 71,382$ Franchise fees 7,189 6,849 6,998 7,527 7,343 6,940 6,937 5,992 5,253 5,031 Licenses and permits 6,548 4,928 4,469 4,720 6,687 8,183 8,522 7,182 5,826 6,099 Intergovernmental revenues 18,441 17,875 19,696 18,644 20,553 20,107 19,101 17,161 17,186 16,028 Program income 144 67 637 370 12 9 Charges for services 29,632 28,889 28,542 25,535 25,406 22,346 21,072 18,999 16,521 14,574 Fines and forfeitures 3,348 3,422 3,793 3,329 3,717 4,019 3,501 3,005 3,079 2,946 Donations 539 868 1,591 723 906 844 589 400 1,315 329 Investment income 858 736 893 1,324 2,549 4,022 2,904 1,366 649 710 Miscellaneous revenue 1,183 2,918 3,649 921 1,072 4,894 947 1,565 1,375 1,051
Total Revenue 176,615 172,477 172,090 160,666 160,745 159,442 147,208 132,116 122,974 118,150
ExpendituresGeneral government 29,039 32,078 26,838 26,737 27,919 23,108 17,935 17,275 15,960 15,644 Public safetyFire 41,755 40,265 38,489 34,153 32,296 29,931 29,646 27,364 25,388 23,693 Police 46,421 45,150 46,249 46,326 45,053 39,289 35,828 33,628 31,615 29,709 Parks and recreation 18,731 18,816 18,198 17,968 17,999 18,576 16,767 14,760 14,148 12,715 Culture 9,234 9,294 8,969 8,563 7,923 6,650 6,386 5,631 5,532 5,005 Community services 13,330 12,854 13,035 13,346 13,884 13,223 11,583 11,100 11,080 11,080 Community development 811 925 1,656 1,125 1,368 1,442 588 589 767 742 Capital outlay 16,205 17,561 18,874 19,361 14,519 20,389 7,531 10,895 9,974 15,318 Debt sevicePrincipal 539 1,136 1,084 1,033 2,968 1,038 999 950 2,877 1,208 Interest 1,462 1,497 1,418 1,465 1,568 1,645 1,714 1,751 1,847 1,925 Issuance costs 732 333
Total expenditures 178,259 179,909 174,810 170,077 165,497 155,291 128,977 123,943 119,188 117,039 Excess of revenues over (under) expenditures (1,644) (7,432) (2,720) (9,411) (4,752) 4,151 18,231 8,173 3,786 1,111
Other financing sources usesBonds issued 25,223 3,995 Payments to refunded bond escrow agent (23,850) Capital asset sale proceeds 4,447 Transfers in 10,505 19,905 2,929 9,438 15,270 20,714 11,514 9,277 8,570 5,483 Transfers out (9,662) (18,954) (2,765) (7,857) (15,339) (20,696) (11,575) (9,723) (8,637) (6,001) Total other financing sources (uses) 6,663 4,946 164 1,581 (69) 18 (61) (446) (67) (518)
Net change in fund balance 5,019$ (2,486)$ (2,556)$ (7,830)$ (4,821)$ 4,169$ 18,170$ 7,727$ 3,719$ 593$
Debt service as a percentage of noncapital expenditures 1.12% 1.51% 1.50% 1.54% 2.74% 1.73% 2.10% 2.18% 3.96% 2.68%
STATISTICAL SECTION
K-4

This page intentionally left blank
STATISTICAL SECTION
K-5
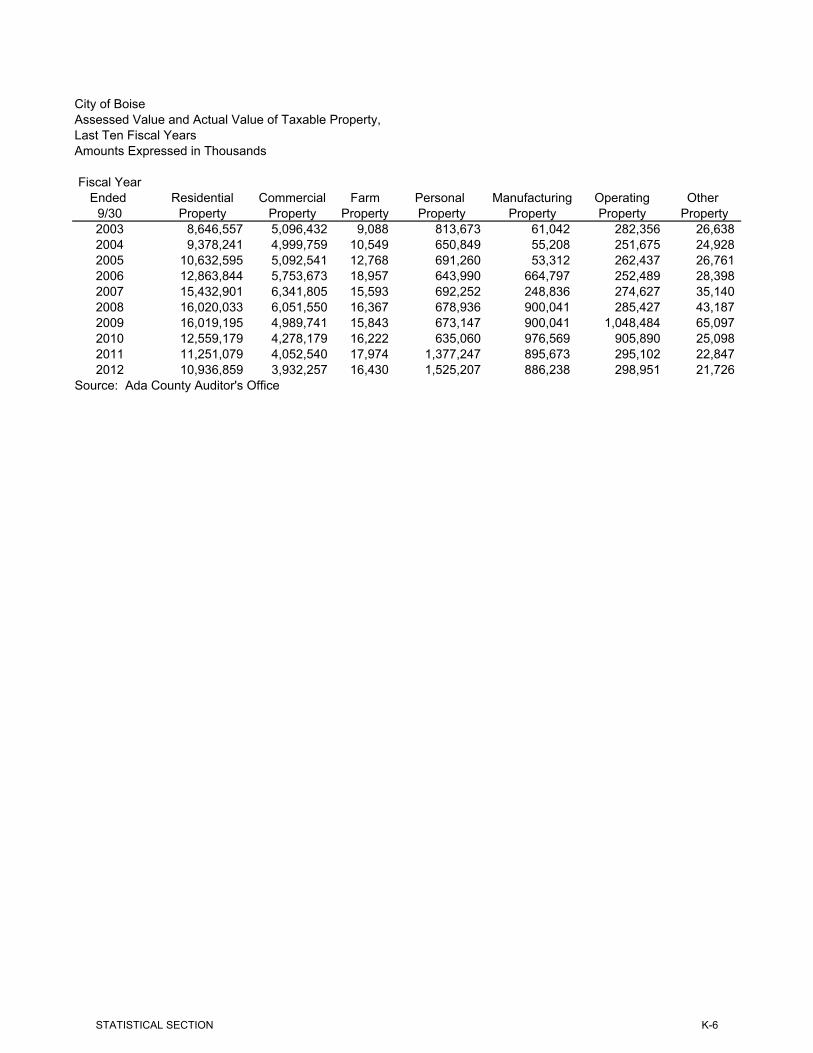
City of BoiseAssessed Value and Actual Value of Taxable Property,Last Ten Fiscal YearsAmounts Expressed in Thousands
Fiscal YearEnded Residential Commercial Farm Personal Manufacturing Operating Other
9/30 Property Property Property Property Property Property Property2003 8,646,557 5,096,432 9,088 813,673 61,042 282,356 26,638 2004 9,378,241 4,999,759 10,549 650,849 55,208 251,675 24,928 2005 10,632,595 5,092,541 12,768 691,260 53,312 262,437 26,761 2006 12,863,844 5,753,673 18,957 643,990 664,797 252,489 28,398 2007 15,432,901 6,341,805 15,593 692,252 248,836 274,627 35,140 2008 16,020,033 6,051,550 16,367 678,936 900,041 285,427 43,187 2009 16,019,195 4,989,741 15,843 673,147 900,041 1,048,484 65,097 2010 12,559,179 4,278,179 16,222 635,060 976,569 905,890 25,098 2011 11,251,079 4,052,540 17,974 1,377,247 895,673 295,102 22,847 2012 10,936,859 3,932,257 16,430 1,525,207 886,238 298,951 21,726
Source: Ada County Auditor's Office
STATISTICAL SECTION
K-6

Less Total Taxable TotalTax-Exempt Assessed Direct Tax
Property Value Rate2,069,032 12,866,754 0.0562,153,601 13,217,608 0.0582,323,792 14,447,882 0.5704,340,545 15,885,603 0.0554,693,702 18,347,452 0.0504,761,985 19,233,556 0.0515,042,294 18,669,254 0.0594,118,269 15,277,928 0.0704,058,033 13,854,429 0.0783,985,975 13,631,693 0.083
STATISTICAL SECTION
K-7
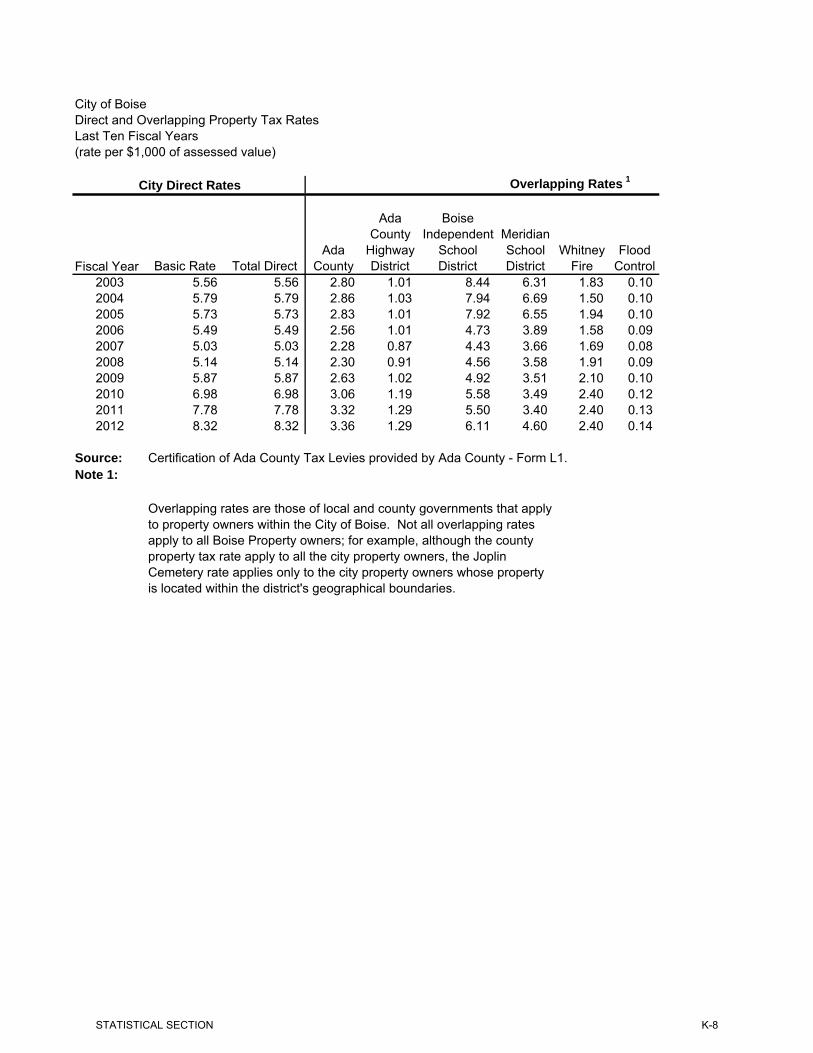
City of BoiseDirect and Overlapping Property Tax RatesLast Ten Fiscal Years(rate per $1,000 of assessed value)
Overlapping Rates 1
Fiscal Year Basic Rate Total DirectAda
County
Ada County
Highway District
Boise Independent
School District
Meridian School District
Whitney Fire
Flood Control
2003 5.56 5.56 2.80 1.01 8.44 6.31 1.83 0.10 2004 5.79 5.79 2.86 1.03 7.94 6.69 1.50 0.10 2005 5.73 5.73 2.83 1.01 7.92 6.55 1.94 0.10 2006 5.49 5.49 2.56 1.01 4.73 3.89 1.58 0.09 2007 5.03 5.03 2.28 0.87 4.43 3.66 1.69 0.08 2008 5.14 5.14 2.30 0.91 4.56 3.58 1.91 0.09 2009 5.87 5.87 2.63 1.02 4.92 3.51 2.10 0.10 2010 6.98 6.98 3.06 1.19 5.58 3.49 2.40 0.12 2011 7.78 7.78 3.32 1.29 5.50 3.40 2.40 0.13 2012 8.32 8.32 3.36 1.29 6.11 4.60 2.40 0.14
Source: Certification of Ada County Tax Levies provided by Ada County - Form L1.Note 1:
Overlapping rates are those of local and county governments that apply to property owners within the City of Boise. Not all overlapping rates apply to all Boise Property owners; for example, although the county property tax rate apply to all the city property owners, the Joplin Cemetery rate applies only to the city property owners whose property is located within the district's geographical boundaries.
City Direct Rates
STATISTICAL SECTION
K-8

City of BoiseDirect and Overlapping Property Tax RatesLast Ten Fiscal Years (Continued)(rate per $1,000 of assessed value)
Overlapping Rates 1
Emergency Medical/ North Ada Search &
RescueDry Creek Cemetery
Joplin Cemetery
Meridian Cemetery
NW Sewer
West Sewer
Mosquito Abatement
West Ada Recreation
Harris Ranch 1
0.12 0.01 0.01 0.08 0.16 - 0.03 0.08 0.12 0.01 0.01 0.15 - 0.03 0.08 0.12 0.01 0.01 0.14 - 0.03 0.07 0.11 0.01 0.01 0.05 0.14 - 0.03 0.07 0.10 0.01 0.01 0.04 0.12 - 0.03 0.06 0.11 0.01 0.01 0.04 0.12 - 0.03 0.07 0.13 0.03 0.01 0.04 0.14 - 0.01 0.08 2.29 0.04 0.01 0.03 0.17 - 0.03 0.10 2.41 0.05 0.01 0.03 0.19 - 0.04 0.11 0.09 2.41 0.05 0.01 0.05 0.19 - 0.04 0.11 3.08
STATISTICAL SECTION
K-9

City of BoisePrincipal Property Tax PayersCurrent Year and Nine Years PriorAmount Expressed in Thousands
2012 2003
Market Valuation Rank
Percentage of Total Market
Valuation Market Valuation Rank
Percentage of Total Market
Valuation
Micron Technology 299,756$ 1 2.20% 1,065,786$ 1 8.28%Boise Mall LLC 127,010 2 0.93% 103,486 4 0.80%Hewlett Packard 116,014 3 0.85% 220,906 2 1.72%Idaho Power 111,725 4 0.82% 80,172 6 0.62%MP Mask Technology Center 97,774 5 0.72% 0.00%United Water 75,184 6 0.55% 61,849 7 0.48%CenturyLink (Qwest) 64,128 7 0.47% 110,908 3 0.86%Albertsons (Supervalu) 55,618 8 0.41% 103,046 5 0.80%New Albertson's Inc 44,635 9 0.33%Winco Foods LLC 39,784 10 0.29%Sundance Investments 46,757 8 0.36%MK Plaza Trust 41,794 9 0.32%S-16 Limited Partnership 40,529 10 0.31%
1,031,628$ 7.57% 1,875,233$ 14.55%
Total Market Valuation 13,631,693 12,866,754
Source: 2012 Ada County Report of Highest 25 Taxpayers / Idaho Department of Commerce
STATISTICAL SECTION
K-10

City of BoiseProperty Tax Levies and Collections,Last Ten Fiscal YearsAmount Expressed in Thousands
Fiscal Year Ended
September 30Taxes Levied for the Fiscal Year Amount
Percentage of Levy
Collections in Subsequent
Years AmountPercentage
of Levy2003 73,162 70,373 96.2% 711 71,084 97.2%
2004 (1) 72,458 70,828 97.8% 672 71,500 98.7%2005 76,583 75,921 99.1% 662 76,583 100.0%2006 82,905 82,516 99.5% 389 82,905 100.0%2007 87,442 87,269 99.8% 173 87,442 100.0%2008 92,364 91,523 99.1% 841 92,364 100.0%2009 97,703 96,076 98.3% 1,675 97,751 100.0%2010 101,639 99,904 98.3% 1,785 101,689 100.0%2011 105,839 103,832 98.1% 979 104,811 99.0%2012 108,073 107,027 99.0% 107,027 99.0%
Sources: Ada County Tax Auditor's Office and Boise City Treasury and Accounting Departments
Collected within the Fiscal Year of the Levy
Total Collection to Date
(1) Ada County miscalculated the rate for the tax levy, therefore a special remittance was made to correct this error. This amount was added to the levy and to the amount collected for the year. The amount of the correction was $767,146.
STATISTICAL SECTION
K-11

City of BoiseRatio of Outstanding Debt By TypeLast Ten Fiscal YearsAmounts Expressed in Thousands
Governmental Activities
Fiscal YearRevenue
Bonds Capital LeasesTotal Debt1
Debt per Capita
Debt to Personal Income Population
Personal Income
2003 32,315 5,305 37,620 0.192 0.0054 195,931 6,921,067 2004 29,830 4,913 34,743 0.174 0.0046 200,062 7,481,118 2005 29,285 4,508 33,793 0.162 0.0041 208,219 8,244,015 2006 28,710 4,084 32,794 0.155 0.0038 211,473 8,605,365 2007 28,115 3,641 31,756 0.150 0.0036 212,188 8,751,111 2008 25,605 3,183 28,788 0.142 0.0034 202,412 8,347,926 2009 25,050 2,705 27,755 0.135 0.0032 206,258 8,563,239 2010 24,465 2,206 26,671 0.127 0.0030 210,177 8,754,831 2011 23,850 1,685 25,535 0.124 0.0036 206,470 7,048,060 2012 24,665 1,147 25,812 0.124 0.0036 207,730 7,119,738
(1) Does not include Harris Ranch CID Debt.
Ratio of Net General Bonded Debt Outstanding
The City has had no general bonded debt from fiscal years 2003 to 2012.
Business-type Activities
Fiscal YearRevenue
Bonds Capital LeasesInstallment
LoansOther Long-Term
Obligations Total DebtDebt per Capita
Debt to Personal Income Population
Personal Income
2003 11,414 49,630 3,845 64,889 0.331 0.0094 195,931 6,921,067 2004 26,679 48,780 7,898 83,357 0.417 0.0111 200,062 7,481,118 2005 24,699 47,890 9,143 5,080 86,812 0.417 0.0105 208,219 8,244,015 2006 22,650 46,955 9,727 1,540 80,872 0.382 0.0094 211,473 8,605,365 2007 20,534 45,975 9,302 1,400 77,211 0.364 0.0088 212,188 8,751,111 2008 18,341 44,950 8,894 1,260 73,445 0.363 0.0088 202,412 8,347,926 2009 16,069 43,865 8,470 1,120 69,524 0.337 0.0081 206,258 8,563,239 2010 13,649 42,705 8,062 980 65,396 0.311 0.0075 210,177 8,754,831 2011 43,051 - 7,574 840 51,465 0.249 0.0073 206,470 7,048,060 2012 44,919 - 700 45,619 0.220 0.0064 207,730 7,119,738
STATISTICAL SECTION
K-12
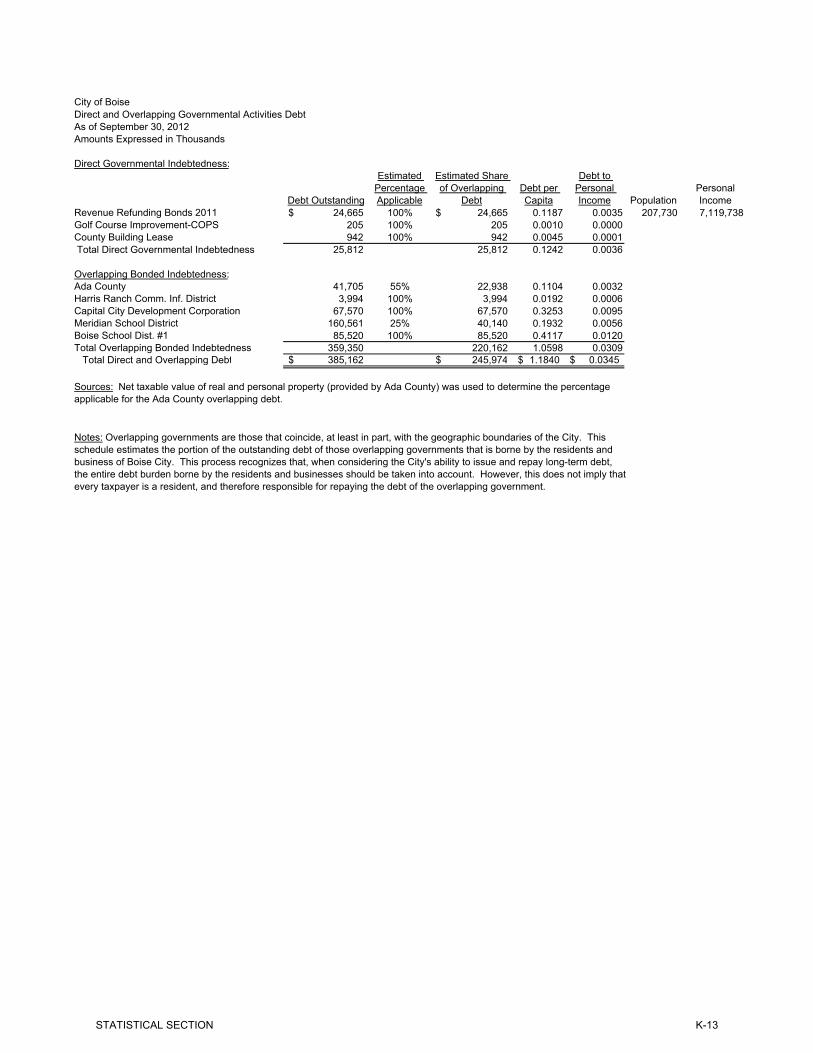
City of BoiseDirect and Overlapping Governmental Activities DebtAs of September 30, 2012Amounts Expressed in Thousands
Direct Governmental Indebtedness:
Debt Outstanding
Estimated Percentage Applicable
Estimated Share of Overlapping
DebtDebt per Capita
Debt to Personal Income Population
Personal Income
Revenue Refunding Bonds 2011 24,665$ 100% 24,665$ 0.1187 0.0035 207,730 7,119,738 Golf Course Improvement-COPS 205 100% 205 0.0010 0.0000County Building Lease 942 100% 942 0.0045 0.0001 Total Direct Governmental Indebtedness 25,812 25,812 0.1242 0.0036
Overlapping Bonded Indebtedness:Ada County 41,705 55% 22,938 0.1104 0.0032Harris Ranch Comm. Inf. District 3,994 100% 3,994 0.0192 0.0006Capital City Development Corporation 67,570 100% 67,570 0.3253 0.0095Meridian School District 160,561 25% 40,140 0.1932 0.0056Boise School Dist. #1 85,520 100% 85,520 0.4117 0.0120Total Overlapping Bonded Indebtedness 359,350 220,162 1.0598 0.0309 Total Direct and Overlapping Debt 385,162$ 245,974$ 1.1840$ 0.0345$
Sources: Net taxable value of real and personal property (provided by Ada County) was used to determine the percentage applicable for the Ada County overlapping debt.
Notes: Overlapping governments are those that coincide, at least in part, with the geographic boundaries of the City. This schedule estimates the portion of the outstanding debt of those overlapping governments that is borne by the residents and business of Boise City. This process recognizes that, when considering the City's ability to issue and repay long-term debt, the entire debt burden borne by the residents and businesses should be taken into account. However, this does not imply that every taxpayer is a resident, and therefore responsible for repaying the debt of the overlapping government.
STATISTICAL SECTION
K-13

Boise CityLegal Debt Margin InformationLast Ten Fiscal YearsAmounts Expressed in Thousands
Fiscal Year Debt Limit
Total Net Debt Applicable to the limit Legal Debt Margin
Total net debt applicable to the limit as a percentage of the debt
limit2003 257,915 118,289 139,626 45.86%2004 264,660 117,548 147,112 44.41%2005 289,120 120,043 169,077 41.52%2006 318,412 116,426 201,986 36.56%2007 367,050 107,890 259,160 29.39%2008 379,619 101,372 278,247 26.70%2009 346,403 96,437 249,966 27.84%2010 303,232 91,238 211,994 30.09%2011 277,693 77,000 200,693 27.73%2012 273,229 71,256 201,973 26.08%
Note: A municipality in Idaho is allowed a debt limit of two percent of the market valuation of real and personal property.
STATISTICAL SECTION
K-14

City of BoisePledged Revenue CoverageLast Ten Fiscal YearsAmounts Expressed in Thousands
Golf Course Certificates of Participation
Fiscal YearPledged Revenue
Operating Expenses Net Available Revenue Principal Interest Coverage
2003 1,461 1,461 65 46 13.16 2004 1,431 1,431 70 43 12.66 2005 1,456 1,456 70 40 13.24 2006 1,441 1,441 75 37 12.84 2007 1,550 1,550 80 34 13.63 2008 1,499 1,499 80 30 13.61 2009 1,399 1,399 85 26 12.60 2010 1,341 1,341 90 22 11.97 2011 1,317 1,317 95 18 11.65 2012 1,418 1,418 95 13 13.13
Revenue Refunding Bonds, Series 2011
Fiscal YearOperating Revenue
15% of General Fund
Revenue
Debt Service for All Outstanding General Fund Obligations (1)
Available for Future Debt
Service2012 170,632 25,595 523 25,072
Airport Revenue Refunding Bonds, Series 2011--Air Terminal Project
Fiscal YearPledged
Revenue (1)Operating
Expenses (2) Net Available Revenue Principal Interest Coverage2011 29,158$ 17,369 11,789 1,400 815 5.32
2012 (With PFC) 28,790$ 17,731 11,059 2,860 1560 2.50
Wastewater Facility Refunding Bonds, Series 2012Debt Service
Fiscal YearPledged
Revenue (1)Operating
Expenses (2) Net Available Revenue Principal * Interest * Coverage2012 32,455 22,379 10,076 - - N/A
(1) Includes Operating Revenue, and Interest Income.(2) Excludes Interest Expense, Depreciation, Gain or Loss on Property Sale/Exchange/Disposal.* The initial debt service payments are not due until fiscal year 2013.
(2) Excludes Interest Expense, Depreciation, Gain or Loss on Property Sale/Exchange/Disposal.
Debt Service
(1) Parity debt is allowed so long as the maximum annual principal and interest requirements on all outstanding obligations constituting a lien upon General Fund Revenues, and on the obligations proposed to be issued does not exceed 15% of the General Fund Revenues and any other revenues available to pay such obligations as set forth on the most recent audited financial statement. (Trust indenture section 2.11)
Debt Service
(1) Includes Operating Revenue, Interest Income, and Passenger Facilities Charges. Excludes Interest Expense, Depreciation, Gain or Loss on Property Sale/Exchange/Disposal.
STATISTICAL SECTION
K-15

City of BoiseDemographic and Economic StatisticsLast Ten Calendar Years
Year Population 2/3
Personal Income (in
thousands) 1
Per Capita Personal Income4
Median Age2
Education Level in Years of
SchoolingK-12 School Enrollment5
Unemployment Rate4
2003 195,931 6,921,067 35,324 34.3 13.8 25,634 4.5%2004 200,062 7,481,118 37,394 34.5 13.8 25,572 4.6%2005 194,934 7,718,032 39,593 34.7 13.8 25,680 3.2%2006 198,638 8,083,077 40,693 35.1 13.8 25,287 2.9%2007 202,412 8,347,926 41,242 35.1 13.8 25,000 2.0%2008 206,258 8,563,239 41,517 35.1 13.8 24,800 6.8%2009 210,177 8,754,831 41,655 35.1 13.8 25,000 6.8%2010 205,671 8,581,269 41,723 35.1 13.8 25,251 9.0%2011 206,470 7,048,060 34,136 34.1 13.8 25,430 8.5%2012 207,730 7,119,738 34,274 34.1 13.8 25,565 6.5%
Sources1 Idaho Department of Commerce and Labor2 Community Planning Association of Southwest Idaho3 US Census Bureau4 US Bureau of Labor Statistics (Boise MSA)5 Boise Independent School District
STATISTICAL SECTION
K-16

City of BoisePrincipal Employers,Current Year and 9 Years ago
2012 2003
Employer Employees 1 Rank1
Percentage of Total City
Employment1 Employees2 Rank2
Percentage of Total City
Employment2
State of Idaho (Includes BSU) 18,750 1 7.07% 14,100 1 5.94%St Luke's Regional Medical Center 6,250 2 2.36% 4,300 3 1.81%Micron Technology 5,250 3 1.98% 10,000 2 4.22%Meridian School District #2 4,251 4 1.60%St Alphonsus Regional Medical Center 4,250 5 1.60% 3,500 7 1.48%Boise School District #1 3,750 6 1.41% 3,300 8 1.39%Albertsons 2,750 7 1.04% 3,801 4 1.60%Walmart 2,251 8 0.85%Hewlett Packard 2,250 9 0.85% 3,700 6 1.56%Boise City 1,605 10 0.61% 1,400 10 0.59%JR Simplot 3,800 5 1.60%Directv 1,700 9 0.72%
51,357 19.37% 47,901 20.91%Total Employment in Boise MSA 3 265,200 237,200
Source:1 - 2012 Boise Valley Economic Partnership-Avg./ State of Idaho 2012 CAFR.2 - FY2003 City of Boise Audit CAFR3 - Idaho Dept. of Labor Boise MSA (September)
STATISTICAL SECTION
K-17
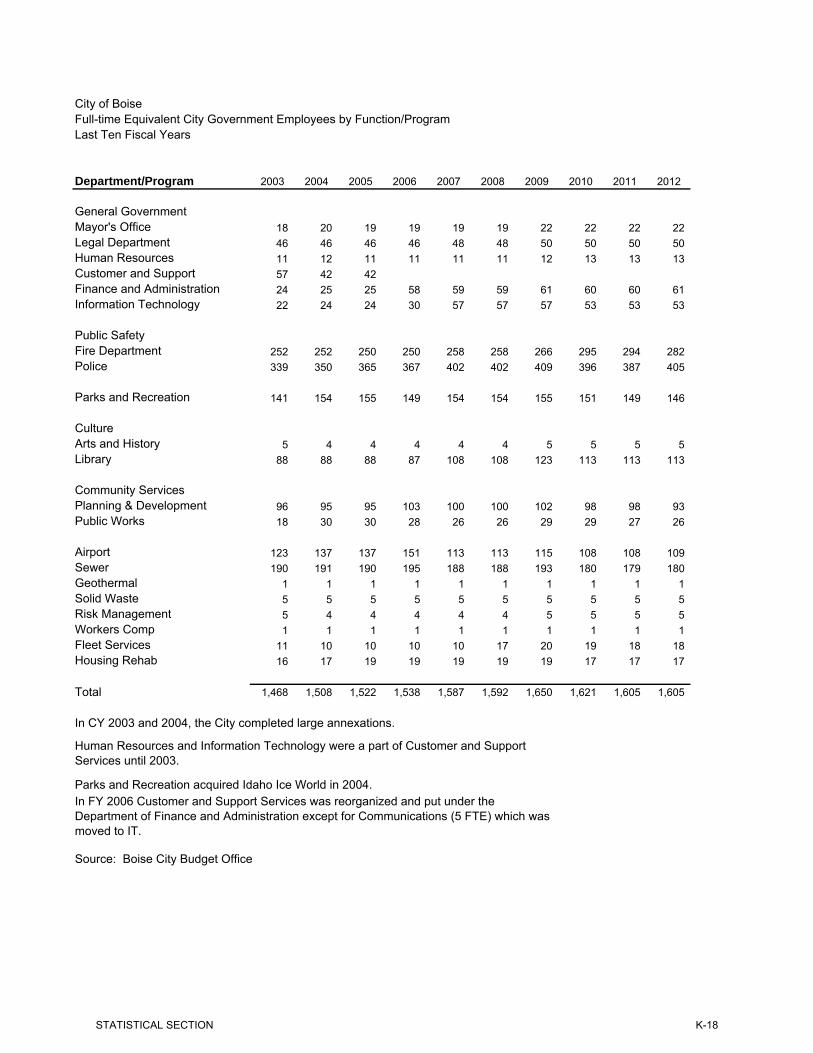
City of BoiseFull-time Equivalent City Government Employees by Function/ProgramLast Ten Fiscal Years
Department/Program 2003 2004 2005 2006 2007 2008 2009 2010 2011 2012
General GovernmentMayor's Office 18 20 19 19 19 19 22 22 22 22 Legal Department 46 46 46 46 48 48 50 50 50 50 Human Resources 11 12 11 11 11 11 12 13 13 13 Customer and Support 57 42 42 Finance and Administration 24 25 25 58 59 59 61 60 60 61 Information Technology 22 24 24 30 57 57 57 53 53 53
Public SafetyFire Department 252 252 250 250 258 258 266 295 294 282 Police 339 350 365 367 402 402 409 396 387 405
Parks and Recreation 141 154 155 149 154 154 155 151 149 146
CultureArts and History 5 4 4 4 4 4 5 5 5 5 Library 88 88 88 87 108 108 123 113 113 113
Community ServicesPlanning & Development 96 95 95 103 100 100 102 98 98 93 Public Works 18 30 30 28 26 26 29 29 27 26
Airport 123 137 137 151 113 113 115 108 108 109 Sewer 190 191 190 195 188 188 193 180 179 180 Geothermal 1 1 1 1 1 1 1 1 1 1 Solid Waste 5 5 5 5 5 5 5 5 5 5 Risk Management 5 4 4 4 4 4 5 5 5 5 Workers Comp 1 1 1 1 1 1 1 1 1 1 Fleet Services 11 10 10 10 10 17 20 19 18 18 Housing Rehab 16 17 19 19 19 19 19 17 17 17
Total 1,468 1,508 1,522 1,538 1,587 1,592 1,650 1,621 1,605 1,605
Source: Boise City Budget Office
In FY 2006 Customer and Support Services was reorganized and put under the Department of Finance and Administration except for Communications (5 FTE) which was moved to IT.
Human Resources and Information Technology were a part of Customer and Support Services until 2003.
Parks and Recreation acquired Idaho Ice World in 2004.
In CY 2003 and 2004, the City completed large annexations.
STATISTICAL SECTION
K-18

City of BoiseOperating Indicators by Function/ProgramLast Eight Fiscal Years (Note 1)
2005 2006 2007 2008 2009 2010 2011 2012General Government Mayor and City Council Number of Neighborhood Reinvestment project grants awarded 12 19 29 19 10 17 18 28 Number of active Neighborhood Reinvestment project grants 35 41 58 60 59 49 24 27 Ordinances and resolutions adopted 525 568 681 560 420 526 468 482
General Government Administration Number of children in licensed daycare facilities (City Clerk) 32,900 19,000 19,500 9,500 9,728 9,234 9,255 9,400 Number of square feet of facilities maintained (Facilities Maintenance) 263,059 253,477 405,671 396,797 457,868 473,379 504,979 537,317 Legal Criminal matters processed (Boise only) 60,620 64,059 58,211 7,970 21,451 19,637 17,972 17,296 Criminal matters processed (other than Boise) 4,064 4,689 5,372 6,655 Human Resources Days from requisition to applicant referral (HR Control) 27 22 n/a n/a n/a n/a n/a Information and Technology Number of supported PCs and printers n/a 1,150 1,843 1,900 1,915 1,942 2,060 2,100 Number of help desk calls 2,143 3,537 6,483 20,532 18,824 18,968 20,436 25,410 Average number of mapping requests per month (internet) 19,132 30,300 31,400 15,150 29,379 14,631 15,037 n/a Monthly avg. # of GIS Map Image, ArcGIS Server and Geocode requests 181,297 Financial Services Number of purchase orders issued 1,650 2,060 1,785 1,377 1,099 1,173 1,130 1,123
Number of dollars recovered by Collections (thousands) $ 1,226 $ 1,963 $ 2,141 $ 2,395 $ 2,732 $ 2,969 $ 2,982 $ 3,166 Ratio of interest earned vs. interest expense 0.49 1.07 1.54 1.21 0.71 0.53 0.39 0.36 Ratio of Portfolio Yield vs. Fed Funds 0.925 0.957 1.087 1.569 7.348 5.716 3.796 2.860 Number of loans internally serviced (sewer & housing) 763 808 726 765 806 824 849 803
Public Safety Fire 90th Percentile Response Time (Note 2) 6:06 6:09 6:14 6:01 6:09 6:12 6:10 6:18 Number of fires investigated 110 100 127 114 97 108 85 119 Number of plans reviewed 1,500 912 659 376 362 313 276 Police Number of police reports taken 41,403 42,156 46,634 38,603 34,992 32,790 32,435 29,409 Number of crime scenes processed 3,148 967 359 309 334 326 339 316 Number of citations for hazardous moving violations 21,118 22,061 23,373 n/a n/a n/a n/a n/a Number of DUI arrests 1,865 2,240 2,031 2,098 1,824 1,537 1,395 1,251
Parks and Recreation Miles of trails maintained 95 97 125 129 129 137 148 148 Number of adaptive programs offered 143 200 216 188 224 256 286 282 Number of acres maintained 15,776 14,800 15,200 1,386 1,386 1,892 1,739 1,739 Zoo attendance 259,223 270,850 295,543 279,687 362,925 332,230 323,741 322,771 Idaho Ice World attendance 203,514 232,436 550,442 629,773 574,247 525,202 365,729 373,541 Number of rounds at Warm Springs Golf course 46,590 47,959 48,745 46,685 51,353 48,344 49,242 46,828 Average youth scholarship amount $ 37.46 $ 41.73 $ 34.02 $ 40.25 $ 40.97 $42.37 $50.00 $40.72 Number of youth scholarships awarded 277 606 771 1,051 1,668 2,344 3,006 3,302 Number of youth served 559,865 619,201 650,447 670,618 732,557 702,911 655,492 511,724
STATISTICAL SECTION
K-19

City of BoiseOperating Indicators by Function/ProgramLast Eight Fiscal Years (Note 1)
2005 2006 2007 2008 2009 2010 2011 2012Culture Arts Number of public art pieces owned by City 180 180 225 Estimated # of citizens participating/exposed to programs and publications 25,448 58,333 60,000 55,000 49,700 487,700 1,218,365 1,310,000 Number of print and electronic publications 10 10 325
Number of public program series (Note 3) 16 18 25 Number of projects completed 10 2 8 18 46 n/a n/a 52 Number of A&H cultural/facility plans completed 5 n/a Number of A&H studies completed 2 n/a Number of A&H presentations, facilitations, and consultations 7 11 Number of citizens who received public art walking tours 1,679 2,168 5,500 n/a n/a 850 Library Annual circulation 1,510,530 1,448,423 1,571,639 1,694,089 1,998,057 2,313,307 2,340,898 2,297,905 Reference questions per capita 0.90 0.23 0.65 1.05 1.23 1.27 1.30 1.31 Number of special programs 1,499 1,154 1,282 1,513 1,988 2,843 2,711 2,719
Community Service Planning and Development Services Total construction permit value (millions) $ 465 $ 654 $ 657 $ 369 $ 259 $ 160 $ 297 $ 399 Total number of permits 16,593 16,623 16,292 15,044 11,601 13,734 14,378 15,328 Percent of commercial plans reviewed <30 days 63% 58% 50% 82% 85% 88% 87% 83% Number of affordable housing units available 273 273 273 274 274 274 274 281 Parking Control Parking tickets issued 72,506 63,502 63,318 67,364 69,233 74,632 68,458 62,474 Cemetery Number of burials 174 159 157 192 173 152 161 159
Airport Airline cost per enplaned passenger $ 3.35 $ 3.28 $ 3.34 $ 3.49 $ 3.87 $ 4.81 $ 4.81 4.36 Number of enplanements 1,545,268 1,623,438 1,668,834 1,649,491 1,404,321 1,394,670 1,393,611 1,328,767
Public Works Total number of street lights 9,757 10,011 10,193 10,762 10,853 10,933 10,693 10,885 Number of Geothermal customers n/a 55 55 57 58 59 66 73 Sewer Dollars per foot of constructed 8" sewer pipe $ 64.21 $ 92.84 $ 100.48 $ 101.69 $ 104.63 $109.93 $110.25 $111.88 Number of sewer backups per 100 miles of pipe 3.35 3.34 3.73 4.00 4.33 2.58 4.42 4.71 Miles of sewer pipe 638 659 675 685 694 697 702 704 Gallons of sewage treated per Capita 27 28 27 26 25 25 27 27 Tons of solid waste per Capita 7,363 7,500 7,643 8,390 7,715 12,802 12,496 12,602 Percentage of solid waste recycled 8% 13% 11% 14% 14% 15%
Note 1: Operating indicator data was not available in all cases prior to 2005.Note 2: 90th percentile of 3 fire and 3 EMS codes reported for FY2012.Note 3: # of public program series with four or more separate projects/presentations.
STATISTICAL SECTION
K-20

City of BoiseCapital Asset Statistics by Function/ProgramLast Ten Fiscal Years
Function/Program 2012 2011 2010 2009 2008 2007 2006 2005 2004 2003Primary Government Governmental activities: Fire Fire trucks 4 4 4 4 4 4 4 4 4 4 Fire engines 19 17 17 17 16 16 21 21 21 21 Rescue/utility vehicles 14 14 13 13 13 13 12 10 11 11 Fire facilities 19 17 17 16 16 16 15 14 14 14 Fire hydrants 6,490 6,491 6,987 6,747 7,209 7,183 6,913 6,791 6,674 6,583
Police Vehicles 268 278 275 279 253 242 251 232 214 213 Motorcycles 14 14 10 14 13 12 12 12 13 13
Police station (non city owned) 1 1 1 1 1 1 1 1 1 1 Police mobile substation 1 1 1 1 1 1 1 1 1 1 Parks and recreation Park sites 129 129 137 111 111 111 110 108 107 105 Picnic areas 67 67 67 66 64 62 62 58 58 58
Recreation/community centers 6 6 7 8 6 4 4 4 3 3 Ice skating facilities 1 1 1 1 1 1 1 1 1 Playgrounds 77 73 73 74 73 72 71 71 71 69 Basketball courts 25 25 25 26 26 26 26 26 26 Cultural/historical sites 4 4 4 4 4 4 4 4 4 4 Golf courses 1 1 1 1 1 1 1 1 1 1 Tennis courts 85 81 81 77 77 77 77 76 76 76 Youth baseball fields 35 35 35 35 35 35 35 35 35 34 Soccer fields 48 49 48 54 49 44 44 44 44 44 Skate parks 3 3 3 3 3 3 3 3 3 2 Pools 7 7 7 7 7 7 7 7 7 7 Zoo 1 1 1 1 1 1 1 1 1 1 Bike, walking or hiking trails 148 148 148 130 129 125 108 108 106 103 Foothills-special levy (acres) 3,582 3,428 3,428 1,529 1,519 1,199 1,199 1,199 1,079 820
Governmental activities: Culture Public art investments 200 172 170 147 143 116 106 60 59 51 Library Locations 4 4 4 4 3 2 2 2 2 2 Items in library collection (thousands) 424 418 413 408 372 356 361 376 361 355
Community Services Cemeteries 3 3 3 3 3 3 3 3 3 3 Streetlights 7,754 7,874 7,804 7,705 7,593 7,425 7,111 6,918 6,463 6,314
Business-type activities: Airport Runways (commercial) 2 2 2 2 2 2 2 2 2 2 Total parking spaces 3,600 3,600 3,600 3,600 2,882 2,831 2,141 2,141 2,141 2,141
Sewer
Wastewater treatment plants 2 2 2 2 2 2 2 3 3 3
Other
Single family home rental units 14 12 12 12 12 14 28 18 18 33 Apartment rental units 267 260 260 260 260 260 255 255 255 244
STATISTICAL SECTION
K-21

This page intentionally left blank
STATISTICAL SECTION
K-22

CITY OF BOISE, IDAHOSCHEDULE OF EXPENDITURES OF FEDERAL AWARDS AND
PFC FUNDSFOR THE FISCAL YEAR ENDED SEPTEMBER 30, 2012
FederalCFDA Identifying Current Year
Federal Grantor / Program Title Number Number Disbursements
U.S. DEPARTMENT OF AGRICULTURE
Passed Through Idaho Department of Education: Child and Adult Care Food Program 10.558 2012IN109947 9$ Summer Food Service Program for Children 10.559 2012IN109947 12 Cooperative Extension Service 10.500 USDA-NIFA-SLBCD-002652 13
TOTAL DEPARTMENT OF AGRICULTURE 34$
U.S. FOREST SERVICE
Direct Programs: Cooperative Forestry Assistance 10.664 08-CS-11040201-003 4$
TOTAL U.S. FOREST SERVICE 4$
U.S. DEPARTMENT OF HUD - NON ARRA
Direct Programs: Community Development Block Grant-Entitlement Grants 14.218 (Note 1) B-10-MC-16-0001 869$ HOME Investment Partnerships Programs 14.239 M-06-MC-16-0200 2 HOME Investment Partnerships Programs 14.239 M-09-MC-16-0200 362 HOME Investment Partnerships Programs 14.239 M-10-MC-16-0200 198 HOME Investment Partnerships Programs 14.239 M-11-MC-16-0200 99 Neighborhood Initiative and Miscellaneous Grants 14.251 B-09-SP-ID-0091 268
TOTAL U.S. DEPARTMENT OF HUD - NON ARRA 1,798
U.S. DEPARTMENT OF HUD - ARRA FUNDS
Direct Programs: Community Development Block Grant ARRA Entitlement Grants (CDBG-R) 14.253 (Note 1) B-09-MY-16-0001 47$ Homelessness Prevention and Rapid Re-Housing Program (HPRP) 14.257 S09-MY-16-0001 48
Total Direct Programs 95
Passed-Through Idaho Housing and Finance Association: Neighborhood Stabilization Program 14.228 B-08-DN-16-0001 328 Homelessness Prevention and Rapid Re-Housing Program (HPRP) 14.257 HPRP 09-10 41
Total Passed-Through Programs 369
TOTAL U.S. DEPARTMENT OF HUD - ARRA FUNDS 464
TOTAL U.S. DEPARTMENT OF HUD 2,262$
U.S. DEPARTMENT OF INTERIOR
Direct Programs: Recreation Resource Management 15.225 L12AC20398 46$
Passed-Through Idaho State Historical Society: Historic Preservation Fund Grants-In-Aid 15.904 16-12-31919 7
TOTAL U.S. DEPARTMENT OF INTERIOR 53$
FEDERALLY FUNDED GRANTS
L-1

CITY OF BOISE, IDAHOSCHEDULE OF EXPENDITURES OF FEDERAL AWARDS AND
PFC FUNDSFOR THE FISCAL YEAR ENDED SEPTEMBER 30, 2012
FederalCFDA Identifying Current Year
Federal Grantor / Program Title Number Number Disbursements
U.S. DEPARTMENT OF JUSTICE
Direct Programs - Non ARRA Funds: Bulletproff Vest Partnership Program 16.607 BOBX-11056597 4$ Public Safety Partnership and Community Policing Grants 16.710 2007CKWX0032 128 Public Safety Partnership and Community Policing Grants 16.710 2010CSWX0012 10
Total Direct Programs - Non ARRA Funds: 142
Direct Programs - ARRA Funds: Public Safety Partnership and Community Policing Grants 16.710 2009RJWX0042 767
Total Direct Programs 909
Passed Through Ada County FACES: Violence Against Women Act Court Training and Improvement Grants 16.013 8344-2-11 35
Passed Through Idaho State Office of Attorney General: Missing Children's Assistance 16.543 2010-MC-CX-K017 30
Passed Through the Idaho State Police: Enforcing Underage Drinking Laws Program 16.727 (2012)-10-LE42-02 4
Total Passed Through Programs 69
TOTAL U.S. DEPARTMENT OF JUSTICE 978$
U.S. DEPARTMENT OF TRANSPORTATION
Direct Programs: Airport Improvement Program 20.106 3-16-0003-55 1,099$ Airport Improvement Program 20.106 3-16-0003-56 2,160 Airport Improvement Program 20.106 3-16-0003-57 2,914
Total Direct Programs 6,173
Passed Through Idaho Department of Transportation: Highway Planning and Construction 20.205 A009(935) 8 Highway Planning and Construction 20.205 A010(660) 88 State and Community Highway Safety 20.600 CP-2012-02-00-00 10 State and Community Highway Safety 20.600 OP-2012-01-00-00 25 State and Community Highway Safety 20.600 AL2012-01-00-00 5 State and Community Highway Safety 20.600 PT2012-21-00-00 55 Alcohol traffic Safety & Drunk Driving Prevention 20.601 K8-2012-01-00-00 21 Training and Planning Grants 20.703 HMHMP0165100100 (7) Training and Planning Grants 20.703 HMHMP0245110100 8
Total Passed Through Programs 213
TOTAL U.S. DEPARTMENT OF TRANSPORTATION 6,386$
FEDERALLY FUNDED GRANTS
L-2

CITY OF BOISE, IDAHOSCHEDULE OF EXPENDITURES OF FEDERAL AWARDS AND
PFC FUNDSFOR THE FISCAL YEAR ENDED SEPTEMBER 30, 2012
FederalCFDA Identifying Current Year
Federal Grantor / Program Title Number Number DisbursementsNATIONAL ENDOWMENT FOR THE ARTS
Passed Through Idaho Commission on the Arts: Promotion of the Arts-Partnership Agreement 45.025 1161002042 1$
TOTAL NATIONAL ENDOWMENT FOR THE ARTS 1$
NATIONAL ENDOWMENT FOR THE HUMANITIES
Passed Through Idaho Commission on the Arts: Promotion of the Humanities_Federal/State Partnership 45.129 2011031 2$ Promotion of the Humanities_Federal/State Partnership 45.129 2012028 3
TOTAL NATIONAL ENDOWMENT FOR THE HUMANITIES 5$
INSTITUTE OF MUSEUM AND LIBRARY SERVICES
Passed Through the Idaho Commission for Libraries: State Library Program 45.310 LS-0010001310 11$
TOTAL INSTITUTE OF MUSEUM AND LIBRARY SERVICES 11$
NATIONAL SCIENCE FOUNDATION
Passed Through the Boise State University: Education and Human Resources 47.076 N/A 5$
TOTAL NATIONAL SCIENCE FOUNDATION 5$
DEPARTMENT OF VETERANS AFFAIRS
Passed Through United States Olympic committee 64.034 23$
TOTAL DEPARTMENT OF VETERANS AFFAIRS 23$
ENVIRONMENTAL PROTECTION AGENCY
Direct Programs: Congressionally Mandated Projects 66.202 XP-83334201 612$
TOTAL ENVIRONMENTAL PROTECTION AGENCY 612$
U.S. DEPARTMENT OF ENERGY - NON ARRA FUNDS
Direct Programs: Renewable Energy Research and Development 81.087 DE-EE0000318 212$
TOTAL DEPARTMENT OF ENERGY - NON ARRA FUNDS 212
U.S. DEPARTMENT OF ENERGY - ARRA FUNDS
Direct Programs: Energy Efficiency and Conservation Block Grant Program (EECBG) 81.128 DE-EE000813 90
TOTAL DEPARTMENT OF ENERGY - ARRA FUNDS 90
TOTAL DEPARTMENT OF ENERGY 302$
FEDERALLY FUNDED GRANTS
L-3
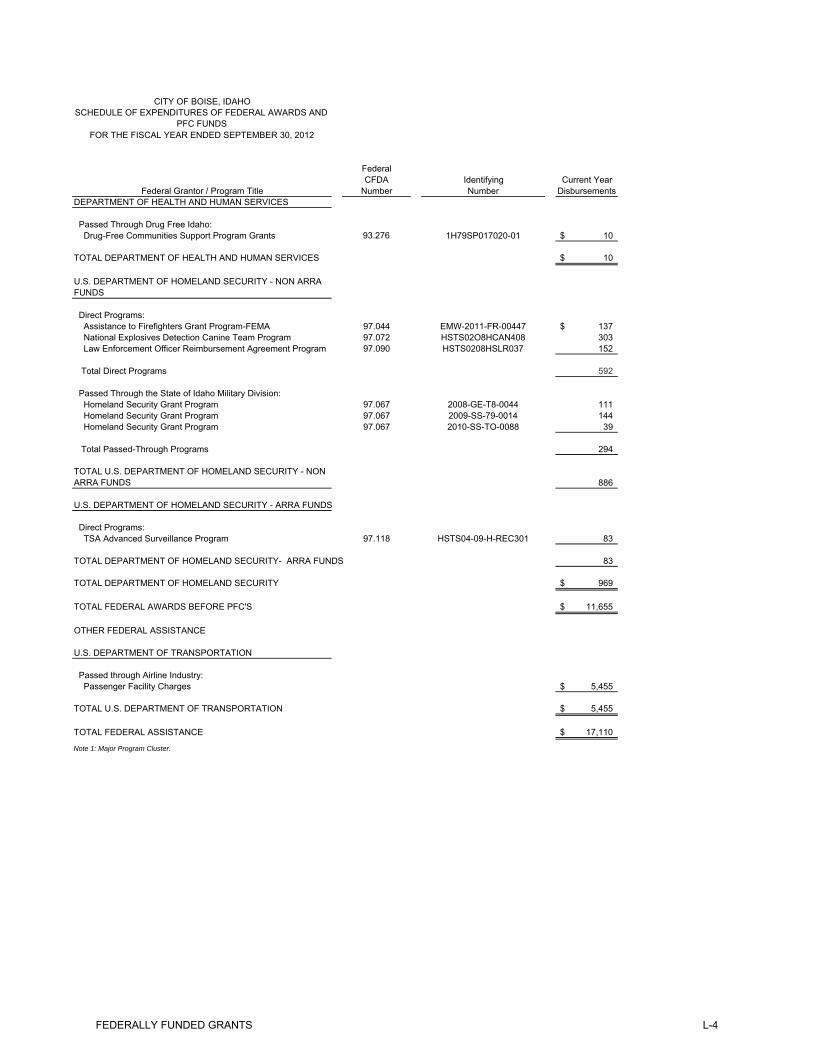
CITY OF BOISE, IDAHOSCHEDULE OF EXPENDITURES OF FEDERAL AWARDS AND
PFC FUNDSFOR THE FISCAL YEAR ENDED SEPTEMBER 30, 2012
FederalCFDA Identifying Current Year
Federal Grantor / Program Title Number Number DisbursementsDEPARTMENT OF HEALTH AND HUMAN SERVICES
Passed Through Drug Free Idaho: Drug-Free Communities Support Program Grants 93.276 1H79SP017020-01 10$
TOTAL DEPARTMENT OF HEALTH AND HUMAN SERVICES 10$
U.S. DEPARTMENT OF HOMELAND SECURITY - NON ARRA FUNDS
Direct Programs: Assistance to Firefighters Grant Program-FEMA 97.044 EMW-2011-FR-00447 137$ National Explosives Detection Canine Team Program 97.072 HSTS02O8HCAN408 303 Law Enforcement Officer Reimbursement Agreement Program 97.090 HSTS0208HSLR037 152
Total Direct Programs 592
Passed Through the State of Idaho Military Division: Homeland Security Grant Program 97.067 2008-GE-T8-0044 111 Homeland Security Grant Program 97.067 2009-SS-79-0014 144 Homeland Security Grant Program 97.067 2010-SS-TO-0088 39
Total Passed-Through Programs 294
TOTAL U.S. DEPARTMENT OF HOMELAND SECURITY - NON ARRA FUNDS 886
U.S. DEPARTMENT OF HOMELAND SECURITY - ARRA FUNDS
Direct Programs: TSA Advanced Surveillance Program 97.118 HSTS04-09-H-REC301 83
TOTAL DEPARTMENT OF HOMELAND SECURITY- ARRA FUNDS 83
TOTAL DEPARTMENT OF HOMELAND SECURITY 969$
TOTAL FEDERAL AWARDS BEFORE PFC'S 11,655$
OTHER FEDERAL ASSISTANCE
U.S. DEPARTMENT OF TRANSPORTATION
Passed through Airline Industry: Passenger Facility Charges 5,455$
TOTAL U.S. DEPARTMENT OF TRANSPORTATION 5,455$
TOTAL FEDERAL ASSISTANCE 17,110$
Note 1: Major Program Cluster.
FEDERALLY FUNDED GRANTS
L-4

www.eidebai l ly.com
877 W. Main St., Ste. 800 | Boise, ID 83702-5858 | T 208.344.7150 | F 208.344.7435 | EOE
Report on Internal Control over Financial Reporting and on Compliance and Other Matters Based
on an Audit of Financial Statements Performed in Accordance with Government Auditing Standards
To the Honorable Mayor and
Members of the City Council
Boise, Idaho
We have audited the financial statements of the governmental activities, the business-type activities, the
discretely presented component unit, each major fund, and the aggregate remaining fund information, and
the budgetary comparison of the general fund of the City of Boise, Idaho (the City), as of and for the year
ended September 30, 2012, which collectively comprise the City’s basic financial statements and have
issued our report thereon dated March 11, 2013. Our report was modified noting that management noted
an error in reporting payables in the prior year for which the beginning net assets and fund balance as of
September 30, 2011 were adjusted. We conducted our audit in accordance with auditing standards
generally accepted in the United States of America and the standards applicable to financial audits
contained in Government Auditing Standards, issued by the Comptroller General of the United States.
Internal Control over Financial Reporting
In planning and performing our audit, we considered the City’s internal control over financial reporting as
a basis for designing our auditing procedures for the purpose of expressing our opinions on the financial
statements, but not for the purpose of expressing an opinion on the effectiveness of the City’s internal
control over financial reporting. Accordingly, we do not express an opinion on the effectiveness of the
City’s internal control over financial reporting.
Our consideration of internal control over financial reporting was for the limited purpose described in the
preceding paragraph and was not designed to identify all deficiencies in internal control over financial
reporting that might be significant deficiencies, or material weaknesses and therefore, there can be no
assurance that all deficiencies, significant deficiencies, or material weaknesses have been identified.
However, as described in the accompanying schedule of findings and questioned costs, we identified a
deficiency in internal control over financial reporting that we consider to be a material weakness.
A deficiency in internal control exists when the design or operation of a control does not allow
management or employees, in the normal course of performing their assigned functions, to prevent, or
detect and correct misstatements on a timely basis. A material weakness is a deficiency, or a combination
of deficiencies, in internal control such that there is a reasonable possibility that a material misstatement
of the City’s financial statements will not be prevented, or detected and corrected on a timely basis. We
consider the deficiency described in the accompanying schedule of findings and questioned costs 2012-01
to be a material weakness.
L-5
Compliance and Other Matters
As part of obtaining reasonable assurance about whether the City’s financial statements are free of material
misstatement, we performed tests of its compliance with certain provisions of laws, regulations, contracts, and
grant agreements, noncompliance with which could have a direct and material effect on the determination of
financial statement amounts. However, providing an opinion on compliance with those provisions was not an
objective of our audit, and accordingly, we do not express such an opinion. The results of our tests disclosed no
instances of noncompliance or other matters that are required to be reported under Government Auditing
Standards.
The City’s response to the findings identified in our audit is described in the accompanying schedule of findings
and questioned costs. We did not audit the City’s response and, accordingly, we express no opinion on it.
This report is intended solely for the information and use of the Mayor, City Council, the audit committee,
management, and federal awarding agencies and pass-through entities and is not intended to be and should not be
used by anyone other than these specified parties.
Boise, Idaho
March 11, 2013
L-6

www.eidebai l ly.com
877 W. Main St., Ste. 800 | Boise, ID 83702-5858 | T 208.344.7150 | F 208.344.7435 | EOE
Independent Auditor’s Report on Compliance with Requirements
Applicable to the Passenger Facility Charge Program an on Internal Control over Compliance
To the Honorable Mayor,
Members of the City Council, and
Federal Aviation Administration
Boise, Idaho
Compliance
We have audited the Boise Airport’s (the Airport’s) compliance with the types of compliance requirements
described in the Passenger Facility Charge Audit Guide for Public Agencies, issued by the Federal Aviation
Administration (Guide), for its passenger facility charge program for the quarters and year ended September 30,
2012. Compliance with the requirements of laws and regulations applicable to its passenger facility charge
program is the responsibility of the Airport’s management. Our responsibility is to express an opinion on Boise
Airport’s compliance based on our audit.
We conducted our audit of compliance in accordance with auditing standards generally accepted in the United
States of America; the standards applicable to financial audits contained in Government Auditing Standards,
issued by the Comptroller General of the United States and the Guide. Those standards and the Guide require that
we plan and perform the audit to obtain reasonable assurance about whether noncompliance with the types of
compliance requirements referred to above that could have a direct and material effect on the passenger facility
charge program occurred. An audit includes examining, on a test basis, evidence about the Airport’s compliance
with those requirements and performing such other procedures as we considered necessary in the circumstances.
We believe that our audit provides a reasonable basis for our opinion. Our audit does not provide a legal
determination of the Airport’s compliance with those requirements.
In our opinion, the Boise Airport complied, in all material respects, with the compliance requirements referred to
above that could have a direct and material effect on its passenger facility charge program for the quarters and
year ended September 30, 2012.
Internal Control over Compliance
Management of the Airport is responsible for establishing and maintaining effective internal control over
compliance with the requirements of laws and regulations applicable to the passenger facility charge program. In
planning and performing our audit, we considered the Airport’s internal control over compliance with the
requirements that could have a direct and material effect on a major federal program to determine the auditing
procedures for the purpose of expressing our opinion on compliance and to test and report on internal control over
compliance in accordance with the Guide, but not for the purpose of expressing an opinion on the effectiveness of
internal control over compliance. Accordingly, we do not express an opinion on the effectiveness of the Airport’s
internal control over compliance.
L-7

A deficiency in internal control over compliance exists when the design or operation of a control over compliance
does not allow management or employees, in the normal course of performing their assigned functions, to prevent,
or detect and correct, noncompliance with a type of compliance requirement of the passenger facility charge
program on a timely basis. A material weakness in internal control over compliance is a deficiency, or
combination of deficiencies, in internal control over compliance, such that there is a reasonable possibility that
material noncompliance with a type of compliance requirement of the passenger facility charge program will not
be prevented, or detected and corrected, on a timely basis.
Our consideration of internal control over compliance was for the limited purpose described in the first paragraph
of this section and was not designed to identify all deficiencies in internal control over compliance that might be
deficiencies, significant deficiencies, or material weaknesses. We did not identify any deficiencies in internal
control over compliance that we consider to be material weaknesses, as defined above.
This report is intended solely for the information and use of the Mayor, City Council, audit committee,
management, and the Federal Aviation Administration and is not intended to be and should not be used by anyone
other than these specified parties.
Boise, Idaho
March 11, 2013
L-8

www.eidebai l ly.com
877 W. Main St., Ste. 800 | Boise, ID 83702-5858 | T 208.344.7150 | F 208.344.7435 | EOE
Independent Auditor’s Report on Compliance with Requirements
that Could Have a Direct and Material Effect on Each Major Program and on Internal Control over
Compliance in Accordance with OMB Circular A-133
To the Honorable Mayor and
Members of the City Council
Boise, Idaho
Compliance
We have audited the City of Boise, Idaho’s (the City’s) compliance with the types of compliance requirements
described in the OMB Circular A-133 Compliance Supplement that could have a direct and material effect on each
of the City’s major federal programs for the year ended September 30, 2012. The City’s major federal programs
are identified in the summary of auditor’s results section of the accompanying schedule of findings and
questioned costs. Compliance with the requirements of laws, regulations, contracts, and grants applicable to each
of its major federal programs is the responsibility of the City’s management. Our responsibility is to express an
opinion on the City’s compliance based on our audit.
We conducted our audit of compliance in accordance with auditing standards generally accepted in the United
States of America; the standards applicable to financial audits contained in Government Auditing Standards,
issued by the Comptroller General of the United States; and OMB Circular A-133, Audits of States, Local
Governments, and Non-Profit Organizations. Those standards and OMB Circular A-133 require that we plan and
perform the audit to obtain reasonable assurance about whether noncompliance with the types of compliance
requirements referred to above that could have a direct and material effect on a major federal program occurred.
An audit includes examining, on a test basis, evidence about the City’s compliance with those requirements and
performing such other procedures as we considered necessary in the circumstances. We believe that our audit
provides a reasonable basis for our opinion. Our audit does not provide a legal determination of the City’s
compliance with those requirements.
In our opinion, the City, complied, in all material respects, with the compliance requirements referred to above
that could have a direct and material effect on each of its major federal programs for the year ended September 30,
2012.
Internal Control over Compliance
Management of the City, is responsible for establishing and maintaining effective internal control over
compliance with the requirements of laws, regulations, contracts, and grants applicable to federal programs. In
planning and performing our audit, we considered the City’s internal control over compliance with the
requirements that could have a direct and material effect on a major federal program to determine the auditing
procedures for the purpose of expressing our opinion on compliance and to test and report on internal control over
compliance in accordance with OMB Circular A-133, but not for the purpose of expressing an opinion on the
effectiveness of internal control over compliance. Accordingly, we do not express an opinion on the effectiveness
of the City’s internal control over compliance.
L-9

A deficiency in internal control over compliance exists when the design or operation of a control over compliance
does not allow management or employees, in the normal course of performing their assigned functions, to prevent,
or detect and correct, noncompliance with a type of compliance requirement of a federal program on a timely
basis. A material weakness in internal control over compliance is a deficiency, or combination of deficiencies, in
internal control over compliance, such that there is a reasonable possibility that material noncompliance with a
type of compliance requirement of a federal program will not be prevented, or detected and corrected, on a timely
basis.
Our consideration of internal control over compliance was for the limited purpose described in the first paragraph
of this section and was not designed to identify all deficiencies in internal control over compliance that might be
deficiencies, significant deficiencies, or material weaknesses. We did not identify any deficiencies in internal
control over compliance that we consider to be material weaknesses, as defined above, however we consider the
deficiency in internal control over compliance described in the accompanying schedule of findings and questioned
costs 2012-02 to be a significant deficiency. A significant deficiency in internal control over compliance is a
deficiency, or a combination of deficiencies, in internal control over compliance with a type of compliance
requirement of a federal program that is less severe than a material weakness in internal control over compliance,
yet important enough to merit attention by those charged with governance.
The City’s responses to the findings identified in our audit are described in the accompanying schedule of
findings and questions costs. We did not audit the City’s responses and, accordingly, we express no opinion on
the responses.
This report is intended solely for the information and use of the Mayor, City Council, audit committee,
management, federal awarding agencies, and pass-through entities and is not intended to be and should not be
used by anyone other than these specified parties.
Boise, Idaho
March 11, 2013
L-10

City of Boise, Idaho Schedule of Findings and Questioned Costs
Year Ended September 30, 2012
Section I - Summary of Auditor’s Results
Financial Statements
Type of auditor’s report issued: Unqualified
Internal control over financial reporting:
Material weaknesses identified? Yes
Significant deficiencies identified not considered to
be material weaknesses? None Reported
Noncompliance material to financial statements noted? No
Federal Awards
Internal control over major programs:
Material weaknesses identified? No
Significant deficiencies identified not considered to
be material weaknesses? Yes
Type of auditor’s report issued on compliance for
major programs: Unqualified
Any audit findings disclosed that are required to be
reported in accordance with Circular A-133, Section 510(a)? Yes
Identification of major programs:
Name of Federal Program CFDA Number
U.S. Department of Housing and Urban Development
Community Service Block Grant 14.218
Community Service Block Grant – ARRA 14.253
HOME Investment Partnership Program 14.239
Public Safety and Community Policing Grants – ARRA 16.710
Airport Improvement Program 20.106
Congressionally Mandated Projects 66.202
Dollar threshold used to distinguish between
Type A and Type B programs: $ 349,751
Auditee qualified as low-risk auditee? No
L-11

Section II - Financial Statement Findings
2012-01
Criteria
The City should design and implement internal controls to prevent and detect material misstatements in a
timely manner.
Condition/context There were two material adjustments during the audit process related to year end accruals for revenues
and expenses in the Solid Waste Fund. The City also identified a prior period adjustment to correct
accounts payable balance in the Capital Projects Fund relating to the prior period financial statements.
Effect
Revenue and expenses in the Solid Waste Fund were reported incorrectly and the City’s equity balance in
the Capital Projects Fund in the prior year had been misstated.
Cause
The process established to include all year end accrual entries was not followed for the Solid Waste Fund
and the prior period adjustment was due to an improper accrual reversal in 2005.
Recommendation The City needs to follow its current closing procedures to insure all year end accrual entries have been
entered and all subsidiary ledgers properly agree to the general ledger.
Management’s Response The Department of Finance and Administration concurs with this audit finding and has established
additional control procedures and that will be performed throughout the fiscal year and at year end in order
to address this audit finding. Additionally, at fiscal year end the Controller will confirm with departmental
accounting personnel that to the best of their knowledge, all revenues and expenditures have been
recognized correctly during the fiscal year.
Section III - Federal Award Findings and Questioned Costs
2012-02
Grant Agency
U.S. Department of Justice
CFDA#
16.710
Program Name
Public Safety Partnership and Community Policing Grants
Grant Year
2012
Criteria
L-12

A requirement of the grant is to have a control system in place to ensure all draw submissions are
reviewed prior to submittal.
Condition
Several grant draw submissions were not reviewed timely as well as several grant draw submissions
which were not reviewed prior to submission.
Questioned costs
None
Effect
Although none of the draw requests tested contained errors, there is potential for request of funds that are
not allowable or not expended prior to requesting the funds which could result in a material questioned
cost.
Cause The City has a control established for the review of all the draw submissions; however this control
process was not being followed.
Recommendation
The City should follow the control structure for reviews of all future draw requests. Management should
also perform periodic monitoring of the review process to determine if the control is working properly.
Management’s response
The Boise Police Department has a new structure in place to follow the review process and will perform
periodic monitoring of the grants and draw requests.
L-13

This page intentionally left blank
L-14


![Novel Algorithms for Protein Interaction Networks · ñ ò ó ô õ÷ö øÎù÷ú û4ù÷ü ù÷ôþýíÿ ê¹ØsÙ |êsë bê¦ÜÞÝ2Ù ÝQëbÙ]Ú Ãêsë bê Ù Û aë ÜGë](https://static.documents.pub/doc/80x56/5e7a7aaf5b6a9a1695664318/novel-algorithms-for-protein-interaction-networks-.jpg)


![>ÀÌÊEÊ Àii Ê Õ ` }Ê Ê Ê ÊÊÊÊ ià } ]Ê ÃÌÀÕVÌ ÊEÊ > >}i i Ì · PDF file- >ÀÌÊEÊ Àii Ê Õ ` }Ê Ê Ê ÊÊÊÊ ià } ]Ê ÃÌÀÕVÌ ÊEÊ > >}i i Ì Registration](https://static.documents.pub/doc/80x56/5aba34ed7f8b9aa6018ec7de/-e-ii-i-v-e-i-i-e-ii-i-v-e-i-i-registration-form-the-hkie-.jpg)


