89
1 Challenging Start to FY18 – Recovery Well Underway Results for the period ended 31 December 2017 14 February 2018 Change picture Need to change picture KLG to source new photo

1
Challenging Start to FY18 – Recovery Well UnderwayResults for the period ended 31 December 2017
14 February 2018
Change pictureNeed to change pictureKLG to source new photo

2
Agenda
1. Overview
2. Financial Results and Capital Management
3. Retirement
4. Non-Retirement
5. Outlook
6. Appendices
i. Sector Information
ii. Strategy
iii. Retirement Information
iv. Non-Retirement Information
v. Profit and Loss
vi. Balance Sheet
vii. Capital Management
viii. Other Information

33
Overview

4
Challenging Start to FY18
Aveo’s vision is to be Australia’s leading and most innovative senior living provider
We will achieve that commitment by continuing to provide enhanced freedom of choice and quality of service delivery, in whatever form consumers desire it
In August last year, having listened to the needs of our consumers, we announced a package of key initiatives to serve them better and to regain their trust
The initiatives we initially identified have largely been implemented with some final steps to be taken by 30 June 2018
The package included:
- Better pre-contract disclosure
- An improved consumer offer – money back guarantees and shortened buyback terms
- A commitment to shorter and clearer contracts
- Improved complaint and incident handling procedures
- Independent mediation for all outstanding serious complaints
- Listening more closely to residents’ views – both in Aveo communities and across the industry
As a member of its leadership committee, Aveo has continued to work on the Property Council of Australia’s Retirement Living Council on implementing all eight resolutions adopted by our peak industry body aiming at raising standards in the industry. Aveo has moved to implement a number of these resolutions unilaterally

5
BetterPre-Contract
Disclosure
Aveo now encourages all purchasers to obtain independent legal advice and insists that non-represented purchasers confirm in writing that they have made a conscious decision to that effect
Aveo also encourages new purchasers to obtain independent financial advice and discuss the proposed acquisition with their family
ImprovedContract
Terms
Strong positive market response to contract improvements made in August - the six month money back guarantee (on entry) and six month buyback guarantee (on departure) for Aveo Way contracts
Contracts provide market leading terms well in excess of legislative requirements e.g. buyback terms are significantly better than new Qld and SA legislation
SimplifiedResident Contracts
Currently finalising new, shorter and more user friendly lease and contractual documentation
Targeting a roll out of the first phase of the simplified contracts in Qld by end of March 2018, with a rollout elsewhere to be done by the end of FY18
New Contract
Inclusions
A major new benefit for all residents – a Retail Discounts Program - offering savings with discounts at a wide range of retailers, including shopping discounts at many major retailers
This new program comes at no cost to residents and will be rolled out all communities over coming months
Business Improvement Initiatives

6
Business Improvement Initiatives
Risk Management
Aveo has improved and strengthened its own complaint and incident handling procedures
Full implementation of the Riskman risk and incident management tracking system was completed in December 2017
All tracking and management of operational complaints and incidents are now being undertaken through one consolidated reporting system
All but one of the 14 media related complaints have been resolved either through independent mediation or buyback
The number of current complaints rated “Critical” is less than five
Resident Surveys
Aveo’s annual Resident Satisfaction Survey was undertaken during October 2017
Satisfaction rates were stable on last year but willingness to recommend to others has fallen
Improvement plans have been created with community specific actions to address resident concerns, with implementation to commence by March 2018
Aveo has committed to quarterly “pulse” surveys to more regularly measure resident satisfaction
Aveo has committed to and participated in an industry wide resident satisfaction survey – full results due in March 2018

7
Regulatory Update
Queensland Legislation
New retirement village legislation was assented to in November 2017
Provisions requiring 18 month buyback have commenced, with the balance of the provisions to commence on a date yet to be proclaimed
No significant adverse impact has been experienced nor is it expected from the legislation
SouthAustralian Legislation
New retirement village legislation came into effect on 1 January 2018
No significant adverse impact has been experienced nor is it expected from the legislation
New South Wales Inquiry
The Kathryn Greiner led inquiry into the NSW retirement village sector was conducted between August and December 2017
The NSW Government is considering the final report and recommendations from the inquiry, but given the terms of reference, it is not expected there will be any material impact from its outcomes to the Aveo business model
Victorian Parliamentary
Inquiry
New legislation regarding temporary funding of aged care came into effect in July 2017
No other legislation has been flagged at this time
No significant adverse impact has been experienced nor is it expected from the legislation

8
Legal Class Action Update
Aveo filed its defence in the class action on 24 November 2017 generally denying the lead applicant’s allegations
The number of residents who have signed up to the class action remains unclear
Aveo has obtained security for costs of $185k for the first stage of the action and will be applying for further securities as the action proceeds
The proceeding is before the Federal Court for a status hearing in March 2018

9
The Way Forward – Delivering to Consumers
Going forward, the strategy to realise our vision is all about empowering our residents and customers through greater living choices
Aveo will continue to innovate as it has done over the past four years, to provide better products and services, as we address the emerging and increasingly complex needs of Australian seniors
As an important demonstration of our commitment, in June 2018 we will open our $200m project at Aveo Newstead – Australia’s leading integrated retirement community and a bold blueprint of the future for retirement in this country

1010
Financial Results and Capital Management
11
Key Financial Outcomes For The First Half
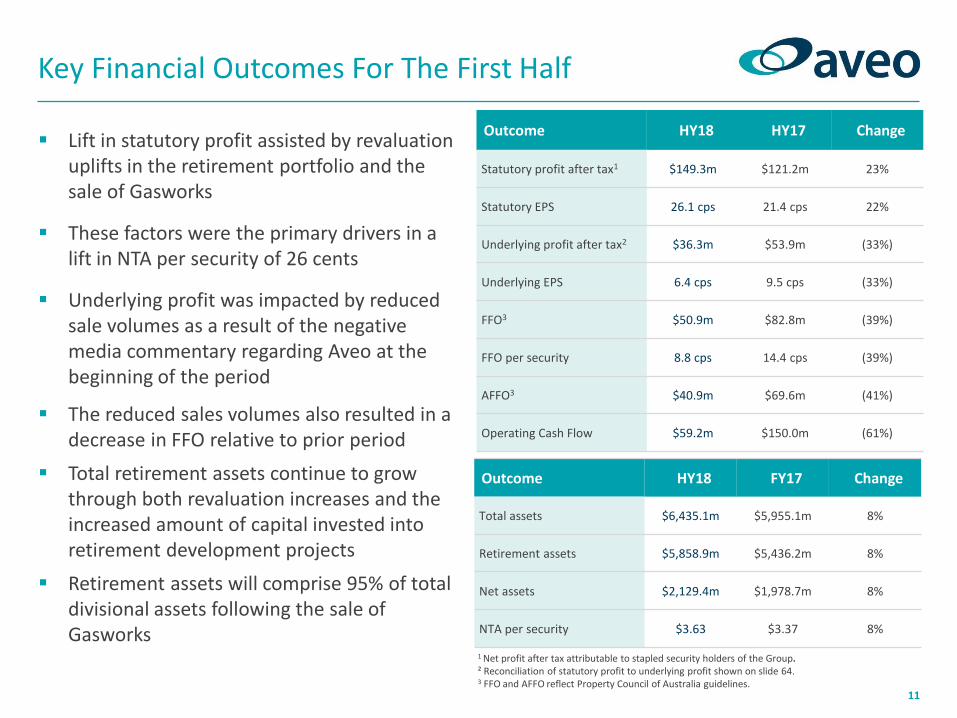
Lift in statutory profit assisted by revaluation uplifts in the retirement portfolio and the sale of Gasworks
These factors were the primary drivers in a lift in NTA per security of 26 cents
Underlying profit was impacted by reduced sale volumes as a result of the negative media commentary regarding Aveo at the beginning of the period
The reduced sales volumes also resulted in a decrease in FFO relative to prior period
Total retirement assets continue to grow through both revaluation increases and the increased amount of capital invested into retirement development projects
Retirement assets will comprise 95% of total divisional assets following the sale of Gasworks
Outcome HY18 HY17 Change
Statutory profit after tax1 $149.3m $121.2m 23%
Statutory EPS 26.1 cps 21.4 cps 22%
Underlying profit after tax2 $36.3m $53.9m (33%)
Underlying EPS 6.4 cps 9.5 cps (33%)
FFO3 $50.9m $82.8m (39%)
FFO per security 8.8 cps 14.4 cps (39%)
AFFO3 $40.9m $69.6m (41%)
Operating Cash Flow $59.2m $150.0m (61%)
1 Net profit after tax attributable to stapled security holders of the Group.² Reconciliation of statutory profit to underlying profit shown on slide 64.3 FFO and AFFO reflect Property Council of Australia guidelines.
Outcome HY18 FY17 Change
Total assets $6,435.1m $5,955.1m 8%
Retirement assets $5,858.9m $5,436.2m 8%
Net assets $2,129.4m $1,978.7m 8%
NTA per security $3.63 $3.37 8%
12
Profit and Loss
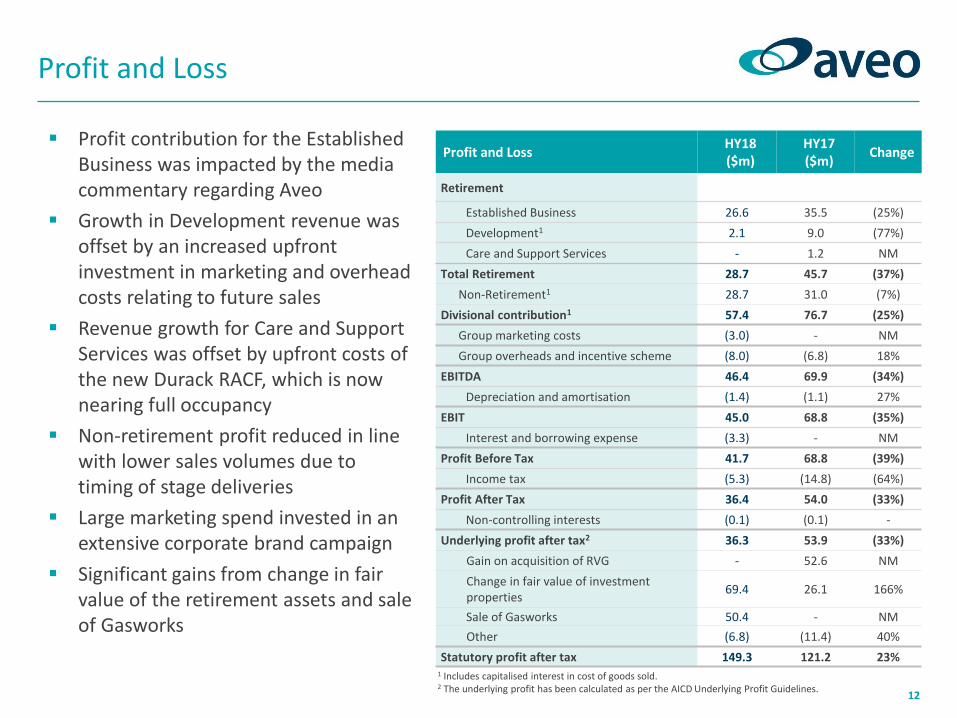
Profit and LossHY18($m)
HY17($m)
Change
Retirement
Established Business 26.6 35.5 (25%)
Development1 2.1 9.0 (77%)
Care and Support Services - 1.2 NM
Total Retirement 28.7 45.7 (37%)
Non-Retirement1 28.7 31.0 (7%)
Divisional contribution1 57.4 76.7 (25%)
Group marketing costs (3.0) - NM
Group overheads and incentive scheme (8.0) (6.8) 18%
EBITDA 46.4 69.9 (34%)
Depreciation and amortisation (1.4) (1.1) 27%
EBIT 45.0 68.8 (35%)
Interest and borrowing expense (3.3) - NM
Profit Before Tax 41.7 68.8 (39%)
Income tax (5.3) (14.8) (64%)
Profit After Tax 36.4 54.0 (33%)
Non-controlling interests (0.1) (0.1) -
Underlying profit after tax2 36.3 53.9 (33%)
Gain on acquisition of RVG - 52.6 NM
Change in fair value of investment properties
69.4 26.1 166%
Sale of Gasworks 50.4 - NM
Other (6.8) (11.4) 40%
Statutory profit after tax 149.3 121.2 23%1 Includes capitalised interest in cost of goods sold.2 The underlying profit has been calculated as per the AICD Underlying Profit Guidelines.
Profit contribution for the Established Business was impacted by the media commentary regarding Aveo
Growth in Development revenue was offset by an increased upfront investment in marketing and overhead costs relating to future sales
Revenue growth for Care and Support Services was offset by upfront costs of the new Durack RACF, which is now nearing full occupancy
Non-retirement profit reduced in line with lower sales volumes due to timing of stage deliveries
Large marketing spend invested in an extensive corporate brand campaign
Significant gains from change in fair value of the retirement assets and sale of Gasworks

13
Retirement business remains on
track to achieve its ROA targets
In the first half, significant
investments were made in
marketing, business improvement
and other overhead, to position
Aveo for the future
The second half of FY18 will have
- Support of the continued
increase in trend sales rates
seen through Q2 and into
Q3 of FY18
- 456 of the 506 major
developments expected in FY18
delivering in the second half
- Full contribution from the
Durack RACF which only
commenced in early FY18
Retirement Asset Returns on Target
HY18A To Go FY18 Target
RetirementEarnings
Composition1
EstablishedBusiness
26.4 45.1 – 50.1 71.5 – 76.5
Development 2.3 67.7 – 71.7 70.0 – 74.0
Care and Support Services
(0.7) 2.2 – 2.7 1.5 – 2.0
Retirement EBIT2,3 ($m)
28.0 115.0 – 124.5 143.0 – 152.5
Target Range 7.5% – 8.0%1 Targeting a long term retirement earnings mix (based on EBIT) of 70%-80% recurring (Established Business and Care and
Support Services) and 20%-30% active (Development). 2 Excludes capitalised interest in cost of goods sold.3 See slide 42 for further detail regarding target retirement return metrics and reconciliation of Retirement EBIT to
Retirement Profit Contribution.
50%49%
1%
92%
8%

14
Capital Management Metrics
Capital Management Metrics HY18 FY17 Change
Reported gearing1,4 21.6% 16.9% 5%
Proforma reported gearing1,2 16.3% NA NA
Group ICR (>1.5) 4.7x 7.2x (2.5x)
Gross interest bearing liabilities $800m $573m 40%
Less: cash $48m $47m 2%
Net debt $752m $526m 43%
Undrawn committed lines and cash at bank1,2,3 $80m $196m (59%)
Proforma undrawn committed lines and cash at bank1,2,3 $163m NA NA
Weighted average borrowing cost 3.8% 3.4% 0.4%
Weighted average debt maturity 2.5 years 2.8 years (0.3) years
1 Adjusted for The Milton 50% cash at bank.2 Adjusted for sale of Gasworks.3 Undrawn facilities is dependant on having sufficient security.4 Reported gearing excluding US Senior Living debt was 21.0%.
First tranche of the settlement of Gasworks sale (Gasworks 1 & 2) occurred on 8 February 2018 for $220.5m less sale adjustments
Positive intent on both sides enabled the transaction with AMP Capital to complete earlier than the original contract date of 28 February 2018
The Gasworks 3 component ($28m less sale adjustments) is expected to settle in September 2018
Proforma reported gearing reduces to 16.3% post settlement of Gasworks 1 & 2
Proforma undrawn committed lines and cash at bank increases to $163m
Debt remains unhedged
HY18 includes US Senior Living debt of $33m following acquisition in August 2017
15
Retirement Development Capital Requirements
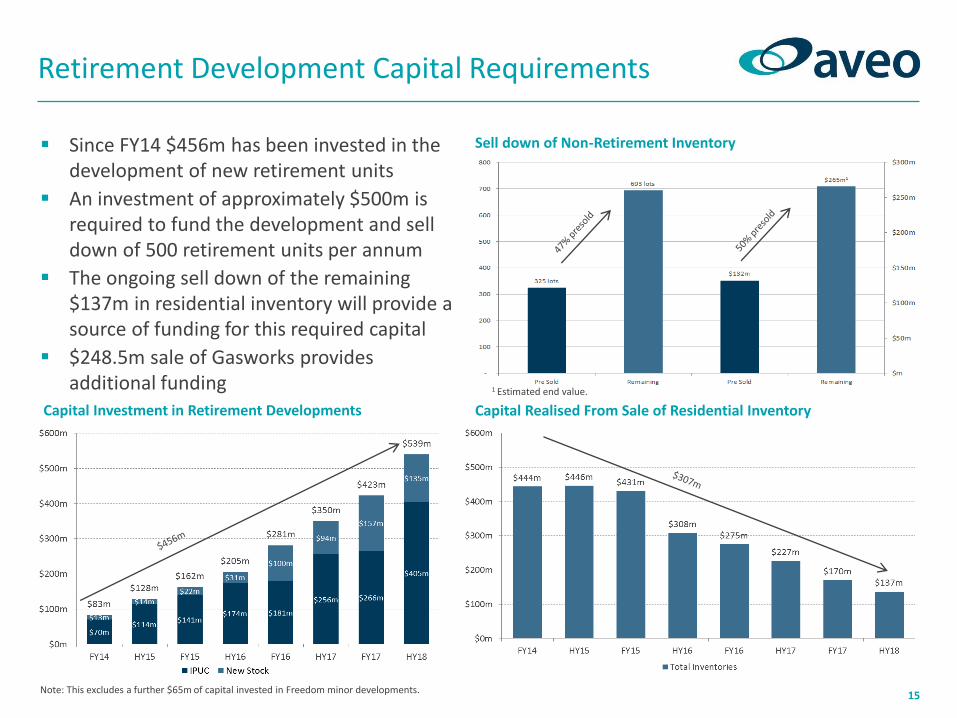
Since FY14 $456m has been invested in the development of new retirement units
An investment of approximately $500m is required to fund the development and sell down of 500 retirement units per annum
The ongoing sell down of the remaining $137m in residential inventory will provide a source of funding for this required capital
$248.5m sale of Gasworks provides additional funding
Capital Investment in Retirement Developments Capital Realised From Sale of Residential Inventory
Sell down of Non-Retirement Inventory
Note: This excludes a further $65m of capital invested in Freedom minor developments.
1 Estimated end value.

16
Retirement Portfolio Revaluation of $82m
$23m uplift in value associated with an additional eight ILU communities and one SA community now being valued using Aveo Way as the standard contract
$21m uplift from one additional community (Albany Creek SAs) now valued assuming Freedom unit price and contract assumptions
$7m uplift from the new DMF stream associated with the delivery of 50 new units at Newcastle (further 456 new units will deliver in the second half)
Remaining $31m valuation uplift resulted from a combination of
- Unit price increases
- Updated resident profile and mix
- Updating of various cost assumptions
No adjustment has been made to discount rates even though risks continue to reduce as the amount of freehold tenure and Freedom original stock both continue to decrease
Portfolio Enhancements HY18 FY17 Comment
Retirement Portfolio Valuation ($m) 1,798 1,695Refer to slide 57 for further detail
Aveo Way rollout (units) 2,143 1,870Aveo Way adopted as standard contract
Valued with Aveo Way as standard contract (ILU communities)1 27 19
Out of total 70 ILU communities
Valued with Aveo Way as standard contract (SA communities)1 18 17
Out of total 30 SA communities
Valued as converted Freedom communities2 2 1
12 communities being converted
New units delivered 50 266 Target of 500 units p.a.
1 Aveo Way assumed as standard contract at communities with over 20% of residents on Aveo Way 2 Communities with over 20% of residents adopting the Freedom product are valued as Freedom
communities
Expected valuation movement from continued roll out of AveoWay contracts, Freedom conversions and new unit deliveries3
3 Assumes no change to reported discount rates, current and future property price growth and current and subsequent resident tenure

1717
Retirement
Need to change pictureKLG to source new photo

18
Retirement Results
Key Performance Indicators HY18 HY17 Change
Segment revenue
Established Business $72.3m $90.7m (20%)
Development $62.5m $38.1m 64%
Care and Support Services $18.4m $6.4m 188%
Total Retirement revenue $153.2m $135.2m 13%
Profit contribution
Established Business $26.6m $35.5m (25%)
Development1 $2.1m $9.0m (77%)
Care and Support Services - $1.2m NM
Total Retirement contribution $28.7m $45.7m (37%)
EBIT contribution2
Established Business $26.4m $35.0m (25%)
Development $2.3m $9.0m (74%)
Care and Support Services ($0.7m) $0.9m (179%)
Total Retirement EBIT $28.0m $44.9m (38%)
Sales Volumes (units)
Established Business sales 299 513 (42%)
Development sales 164 108 52%
Total 463 621 (25%)
Total value of units transacted $196.1m $232.3m (16%)
Total retirement revenue increased 13% driven by higher revenue contributions from both the Development and Care and Support Services segments
Development sales increased as Freedom minor development units, major development stock delivered in FY17, and new units delivered at Newcastle during the period, all continued to sell down
However Development profit was impacted by a large upfront investment in marketing and overhead costs relating to future sales
Decrease in the Established Business volumes and revenue was negated by a focus on expense levels
Initial costs associated with the opening and ramp up of the new Durack RACF, which is now nearing full occupancy, offset a solid performance across the other RACFs in the Care and Support Services segment 1 Development profit is accounted for in the change in fair value of the investment property.
2 Full year FY18 target EBIT is in the range of $143.0m - $152.5m.

19
Established Business Results
Established Business HY18 HY17 Change
Revenue
DMF/CG revenue
Resales $24.0m $45.0m (47%)
Operating buyback purchases $13.3m $12.0m 11%
Gross DMF/CG $37.3m $57.0m (35%)
Other Revenue
Buyback sales $25.9m $24.3m 7%
Other1 $9.1m $9.4m (4%)
Total other revenue $35.0m $33.7m 4%
Total revenue $72.3m $90.7m (20%)
Profit contribution
Net DMF/CG2 $34.6m $53.5m (35%)
Net buyback sales $2.4m $2.7m (11%)
Other income $9.1m $9.4m (4%)
Marketing/commission expenses ($6.5m) ($9.5m) (31%)
Other expenses ($13.0m) ($20.6m) (37%)
Total profit contribution $26.6m $35.5m (25%)
Depreciation and amortisation ($0.2m) ($0.5m) (53%)
EBIT $26.4m $35.0m (25%)
Improved buyback sales revenues facilitated the ongoing release of invested capital, despite the overall sales volume drop
This allowed proceeds to be reinvested in an ongoing program of buyback and refurbishment of older units
Lower resales volumes translated directly to lower DMF/CG revenue and profit contribution
Addressing this decrease going forward will be assisted by the significant investment in the corporate marketing campaign during the period, which is supporting the continued acceleration of sales rates across the portfolio
Lower expense amounts were in part a result of lower sales commission costs (in line with reduced sales volumes), but also a continued focus on general cost control
1 Includes resident commissions and community administration fees.2 Relates to resales and operating buyback purchases.

20
Lower resale volumes provided opportunities to increase the number of units bought back as part of the ongoing buyback and refurbishment program
This was offset by reduced Freedom transition buybacks which were lower given sufficient stock on hand already existed
Despite the lower volumes, realised average transaction price point for resales continued to grow, which also flowed through to higher DMF/CG amounts per transaction
The portfolio sales rate of 7.5% is expected to trend back towards 9%-10% range by the end of FY18 on the back of current unit sales rates
Long term still expected to be 10%-12%
Occupancy dropped marginally in line with the temporary decrease in portfolio sales rate
Established Business Sales and Margins
Sales and Margins HY18 HY17 Change
Sales volumes (units)
Resales 209 422 (50%)
Buyback sales 90 91 (1%)
Total 299 513 (42%)
Recurring operating buyback purchases 153 111 38%
Freedom transition buyback purchases 36 50 (28%)
Total operating buyback purchases 189 161 17%
DMF/CG generating transactions 398 583 (32%)
Deposits on hand 61 184 (67%)
Resales
Avg DMF/CG transaction price point $409k $379k 8%
Avg DMF/CG per transaction $115k $107k 8%
DMF/CG margin per transaction 28% 28% -
Operating Buyback Purchases
Avg DMF/CG transaction price point $308k $273k 13%
Avg DMF/CG per transaction $71k $75k (5%)
DMF/CG margin per transaction 23% 27% (4%)
Portfolio sales rate1 7.5% 10.3% (3%)
Occupancy 92% 93% (1%)
1 Excludes new units sold within the last five years and includes Freedom minor development sales.

21
Development Results
Significant lift in revenue and gross profit associated with the delivery of 50 new major development units and an increased sale rate of minor development Freedom original and conversion units
However Development EBIT was impacted by a large upfront investment in marketing and overhead costs relating to future sales
Majority of marketing costs incurred related to the pre-completion promotion of the 456 new units to be delivered in the second half
Significant additional overhead was also incurred to facilitate the accelerated rollout of the successful Freedom conversion program
Retirement development team now fully resourced to deliver 500 units per annum with a reduction in costs allocated to non-retirement
Development HY18 HY17 Change
Revenue $62.5m $38.1m 64%
COGS ($40.5m) ($25.8m) 57%
Gross profit $22.0m $12.3m 79%
Marketing expenses ($8.5m) ($2.7m) 215%
Other expenses ($11.4m) ($0.6m) NM
Profit contribution $2.1m $9.0m (77%)
Interest in COGS $0.3m - NM
Depreciation ($0.1m) - NM
EBIT $2.3m $9.0m (74%)

22
Development Sales and Margins
Delivery of 50 new major development units in the first stage of the Newcastle community
More major development units were sold (89) than delivered (50), as stock completed at the end of FY17 continued to sell down
Major development margins were at the top of the targeted 16%-20% (pre interest) range
Ramp up in sale of Freedom minor development conversion and original stock continued with 75 sales during the period
Continues to provide evidence of the market appeal of the Freedom product and the future potential of expanding this offering
Minor development margins decreased to more normalised levels
Lower margin levels were offset by significant increases in transaction pricing to $506k per unit, indicative of the pricing premium attached to units with comprehensive care services
Development HY18 HY17 Change
Major Development
Units delivered 50 58 (14%)
Units sold 89 75 19%
Revenue $24.6m $26.5m (7%)
Gross profit (including interest)1 $7.5m $5.5m 37%
Gross profit (excluding interest)1 $7.8m $5.5m 42%
Average margin (including interest) 18% 21% (3%)
Average margin (excluding interest) 20% 21% (1%)
Average transaction value $492k $457k 8%
Deposits on hand 44 29 52%
Redevelopment buyback purchases 24 74 (68%)
Minor Development
Units sold 75 33 127%
Revenue $37.9m $11.6m 227%
Gross profit (including interest) $14.5m $6.8m 111%
Gross profit (excluding interest) $14.5m $6.8m 111%
Average margin (including interest) 38% 59% (21%)
Average margin (excluding interest) 38% 59% (21%)
Average transaction value $506k $352k 44%
Deposits on hand 9 25 (64%)
1 Includes profit adjustments from FY17 deliveries where actual sales price were higher/lower than expected and/or actual expenses were higher/lower than expected.

23
Construction is on schedule for the remaining development units delivering in FY18, with work at the biggest projects at Bella Vista and Newstead topped out and internal work well progressed
Development Projects Update
Community H1 Delivery H2 Delivery Total FY18 Units Development Status
Bella Vista - 64 64Building topped out (level 11) with waterproofing and sheeting completed to level 8, and kitchen and joinery installation to level 5
Hunters Green - 25 25Piling now complete, with 60% of slab pours finished and framing work now underway across the development site
Island Point - 15 15All slabs have been poured with 11 of the 15 villas now having frames and trusses fully erected
Mingarra - 19 19Piling complete and slab pours to commence shortly, with framing to commence shortly afterwards
Newcastle 50 - 50FY18 units already delivered. Civils works have commenced on site for delivery of FY19 product
Newstead - 199 199Structure now completed with scaffolding largely removed and internal work progressing well, with ILU defecting to begin this month
Robertson Park - 34 34Plasterboard lining, window installation and waterproofing are nearing completion with internal works (tiling, joinery, etc) also well progressed
Springfield - 38 38Top floor (level 2) slab and blockwork is completed with mechanical and electrical services work having commenced on level 1
Tanah Merah - 62 62Buildings in various stages of progress from completion of initial slab pour through to partition framing and roof sheeting complete on others
Total Major 50 456 506
Minor 75 105 180 Being delivered progressively throughout the year
Total 125 561 686

24
FY18 Development Projects Under Construction
Springfield – 38 units under construction Island Point – 15 units under construction
Tanah Merah – 62 units under construction Hunters Green – 25 units under construction

25
FY18 Development Projects Under Construction
Bella Vista – 64 units under construction
Robertson Park – 34 units under construction
Mingarra – 19 units under construction
Newstead – 199 units under construction

26
Major Development Delivery Forecast – Units
1 New units delivered for redevelopment projects is a gross figure which includes existing units that are subsequently redeveloped.2 Further information provided on slide 53.
Community Category State Density Units1,2 FY18 FY19 FY20+
Mingarra Brownfield VIC Low 19 19
Newstead Greenfield QLD High 199 199
Hunters Green Brownfield VIC Low 74 25 49
Tanah Merah Brownfield QLD Medium 82 62 20
Island Point Brownfield NSW Low 85 15 37 33
Newcastle Greenfield NSW Low 300 50 65 185
Robertson Park Redevelopment QLD Medium 204 34 32 138
Bella Vista Greenfield NSW High 464 64 68 332
Springfield Greenfield QLD Medium 2,290 38 48 2,204
Morayfield Brownfield QLD Low 40 40
Carindale Redevelopment QLD High 432 97 335
Redland Bay Brownfield QLD Low 90 38 52
Palmview Greenfield QLD Low 138 38 100
Tamworth Brownfield NSW Low 20 20
Launceston Brownfield TAS Low 45 45
Mingarra redevelopment Redevelopment VIC Medium 144 144
Newmarket Redevelopment QLD Medium 264 264
Rochedale Greenfield QLD Low 150 150
Sanctuary Cove Greenfield QLD Low 163 163
Southport Redevelopment QLD Medium 215 215
Major Development 5,418 506 512 4,400
Minor Development 843 180 180 483
Total Retirement Community Product 6,261 686 692 4,883

27
Care and Support Services Results
Upfront costs associated with the ramp up of
the new Durack RACF impacted the overall
RACF contribution
Occupancy at Durack is now at 104 beds (of
123 available) and targeting full occupancy by
end of March 2018
Increase in depreciation and amortisation due
to higher depreciation charges also associated
with the new Durack RACF
Allied health and food and nutrition services
continue to operate at around break even
levels, while improving the overall resident
experience
Care offering to be complemented by the start
of the Aveo Care at Home business which will
expand the availability of traditional home care
services to all Aveo communities
Care and Support Services HY18 HY17 Change
Revenue
RACF $7.6m $5.5m 38%
Allied health $0.2m $0.5m (61%)
Food and Nutrition $9.7m - NM
Other $0.9m $0.4m 131%
Total revenue $18.4m $6.4m 188%
Profit contribution
RACF $0.8m $1.5m (47%)
Allied health ($0.1m) - NM
Food and Nutrition $0.1m - NM
Other $0.3m $0.3m 9%
Expenses ($1.1m) ($0.6m) 79%
Total profit contribution - $1.2m NM
Depreciation and amortisation ($0.7m) ($0.3m) 133%
EBIT ($0.7m) $0.9m (183%)

28
Delivery Forecast – Aged Care Beds
Construction remains on schedule for the delivery of the Newstead RACF as part of the new integrated retirement community at that site
First residents targeted to have moved into the RACF by the end of FY18
Planning approval recently received for the proposed new RACF at Mingarra
1 Inclusive of 184 existing beds
Community State Total Beds1 FY18 FY19+
Newstead QLD 99 99
Bella Vista NSW 144 144
Carindale QLD 100 100
Clayfield QLD 105 105
Mingarra VIC 108 108
Minkara / Bayview NSW 124 124
Newcastle NSW 123 123
Springfield QLD 144 144
Total Aged Care Product 947 99 848

2929
Non-Retirement
Need to change picture

30
Key Performance Indicators HY18 FY17 Change
Contracts on hand 325 396 (18%)
Contracts on hand ($m) $132.0m $160.0m (18%)
Investment properties held - 2 NM
Land lots held 1,041 1,265 (18%)
Inventories $137.0m $170.3m (20%)
Assets held for sale $219.4m - NM
Investment properties - $181.5m NM
Property, plant and equipment $3.3m $3.8m NM
Total non-retirement assets $359.7m $355.6m 1%
Non-retirement assets as percentage of divisional assets
12% 13% (1%)
Pro-forma non-retirement assets as percentage of divisional assets
5% 13% (8%)
Non-Retirement Results
Change in profit contribution primarily related to lower numbers of land lot sales
Change in sales was related wholly to timing of stage deliveries
This business still has a high number of remaining contracts on hand for future sales
Focus for the remainder of FY18 will be to ensure delivery of stages to allow conversion of contracts on hand to settled transactions
Sale of Gasworks now leaves the residential land estates as the last material non-retirement assets
Non-Retirement HY18 HY17 Change
Sales revenue $85.4m $117.3m (27%)
COGS ($58.7m) ($84.3m) (30%)
Gross profit $26.7m $33.0m (19%)
Marketing expenses ($0.8m) ($2.3m) (63%)
Other expenses ($2.9m) ($4.2m) (33%)
Development profit contribution $23.0m $26.5m (13%)
Net rental income $5.7m $4.5m 27%
Total profit contribution $28.7m $31.0m (7%)
Residential land lot sales 229 309 (26%)
Average margin 31% 28% 3%

3131
Outlook
KLG to source new photo

32
Outlook
Retirement sales volumes continue to recover from the challenging start to FY18
Deposits taken in Q1 of FY18 were significantly below that for the same period of FY17
Though still lower than during FY17, deposit activity increased in Q2 of FY18 on the back of an improved resident offering and a strong and targeted marketing campaign
Deposits taken to date in Q3 of FY18 are now tracking back in line with sales activity seen during the corresponding period of FY17
A high profile “Getting it right for the journey ahead” television campaign continued over the Christmas/New Year period
This has been complemented by an increased digital marketing thrust and an increased focus on industry, placement partners and respite activity for sales, especially in the Freedom business
Net Deposit Comparison

33
Outlook
Targeting completion of implementation of the range of business improvement initiatives that have been introduced by the end of FY18
Ongoing resident listening campaign will continue to monitor the effectiveness of these initiatives
Reaffirming financial guidance for FY18 that was provided with the FY17 results of 20.4 cps (7.9% growth on 18.9 cps delivered in FY17)
FY18 was always going to have a second half skew to full year results, driven by the timing of new development deliveries, but this is now exacerbated by the improving sales rates and volumes
The retirement development results are expected to be toward the higher end of the guidance range, due to higher margins expected on second half major development deliveries
This is anticipated to offset the established business result which is expected to be at the lower end of the guidance range
Targeting full year distribution amount based on 40%-60% of underlying profit payout range
Retirement business remains on track to achieve its ROA targets

3434
Appendices
Need to change pictureKLG to source new photo
35
Appendices
Appendix i. Sector Information
Appendix ii. Strategy
Appendix iii. Retirement Information
Appendix iv. Non-Retirement Information
Appendix v. Profit and Loss
Appendix vi. Balance Sheet
Appendix vii. Capital Management
Appendix viii. Other Information

36
7.5% 8.1million
382.2thousand
of Australians over the age of 65 are forecast to live in retirement villages in 2025, increasing from 5.7% in 2014
Australians will be aged over 65in 2050
People will be seeking accommodation in a retirement village by 2025
Retirement Accommodation Demand
The Australian population aged over 65 is expected to grow by more than double over the next 30 years
The Property Council of Australia estimates that between 2014 and 2025, approximately 198,000 additional senior Australians will be seeking retirement village accommodation
Even taking into account that some of these will be couples and therefore only need one dwelling (the current resident per dwelling ratio is approximately 1.3), this still implies an additional accommodation need of just over 150,000 units
While costs vary by product and location, assuming an average development cost of $500,000 per unit, this implies a capital investment requirement of $75 billion over that period
Aveo has a target rate of delivering 500 new units per annum from FY18 onwards
3.7
4.9
6.2
7.4
8.9
-
1
2
3
4
5
6
7
8
9
10
2016 2025 2035 2045 2055
mill
ion
s
Source: Property Council of Australia - National Overview of the retirement
village sector
1 ABS July 2017 Census, 2016.2 Treasury 2015 Intergenerational Report.
Population over 65 – Projections1, 2

37
Australian Retirement Sector
An estimated 184,000 retirees live in retirement communities throughout Australia representing approximately 5.7% of the population over 65
Aveo residents make up 7.3% of the total estimated retirees in retirement communities
For-profit operators make up circa 60% of the market while the other 40% is operated by non-profit organisations
Majority of accommodation is single-level or low-rise villas with community facilities
Most common title structure is leasehold with DMF (circa 70% of Aveo portfolio is leasehold)
The typical ILU costs less than 70% of the median house price in the same postcode
The industry average age of residents is 80 compared to an average of 82.9 at Aveocommunities
Market share ~23% ~38% ~39%
Retirement Village Operators by Units Managed
1 Includes Aveo’s Australian portfolio only2 Ingenia Gardens - seniors rental accommodationSources: Company Announcements 2017; PriceWaterhouseCoopers, Property Council Retirement Census 2017; Retirement Living Council, Grant Thornton, National Overview of the Retirement Village Sector 2014
56
,80
0
47
,40
0
Retirement Village Units by State
30%
23%
21%
13%
11%2%
New South Wales and ACT
Victoria
Queensland
South Australia
Western Australia
Tasmania
12
,62
6
11
,26
7
9,6
10
5,1
00
Len
d L
ease
Ave
o
Sto
ckla
nd
Re
tire
Au
stra
lia
Inge
nia
Oth
er
for-
pro
fit
No
t-fo
r-p
rofi
t
1,6
28
48
,20
0
56
,80
0
1
2

38
Appendices
Appendix i. Sector Information
Appendix ii. Strategy
Appendix iii. Retirement Information
Appendix iv. Non-Retirement Information
Appendix v. Profit and Loss
Appendix vi. Balance Sheet
Appendix vii. Capital Management
Appendix viii. Other Information

39
Business Components of the Aveo Strategy
Established Business
Existing DMF/CG generating retirement communities and associated non-DMF fee revenue
Ongoing unit buyback and subsequent resale program
Continue to achieve portfolio sales rates at levels of 10%-12%
Introducing Freedom care offering to selected communities in the Aveo portfolio
Increase unit pricing in line with residential market price growth
Improve Aveo contract terms
Maintain cost efficient operational structures
Aveo share of equity accounted investments in Aveo China
Acquired partner’ s interest in US Senior Living in August 2017
Development
Major development projects comprising a mix of brownfield, greenfield and redevelopments
Minor redevelopment of Freedom conversion and Freedom original units to assist in rolling out Freedom product (targeting 180 units in FY18)
Existing major development pipeline of over 5,000 units to be developed over 5-10 years
Delivery planned for 506 new units in FY18
Delivery target of over 500 new units from major developments p.a. onwards from FY18
Continue to expand pipeline through selected new site acquisitions
Future acquisitions of new sites must meet required investment return metrics
Care and Support Services
Existing high care income from four co-located aged care facilities owned by Aveo
Low care in-home services to residents via Aveo Care at Home offering
Aveo owned allied health care providers integrated into retirement community operations
Existing pipeline of 947 aged care beds
Delivery planned for 99 aged care beds in FY18
Increase penetration rate for Aveo Care at Home within communities
Continual delivery of new aged care facilities to support an increase in the integrated retirement community offering

40
ROA Enhancement Strategy (FY14 to FY18)
Earnings Assets Employed ROA
Established Business EBIT
Retirement Development EBIT
Care & Support Services EBIT
Retirement EBIT2
NPV of DMF/CG Annuity Streamat 30 June 20131
Equity Accounted Investments1
Aged Care Assets, Intangibles
Retirement Assets Employed
Future Net Working Capital
Transitional Period
1 Excludes any future retirement asset revaluations after 30 June 2013 from the calculation of retirement ROA.2 Excludes non-allocated overheads.
Existing or new projects that are forecast to be delivered post FY18 will not be included in the retirement assets employed for the periods FY14 to FY18 for the purposes of the ROA calculation
4.0% 4.6%
6.3%
6.0%
7.5-8.0%
0.0%
2.0%
4.0%
6.0%
8.0%
FY14A FY15A FY16A FY17A FY18F

41
Retirement business remains on track to achieve its ROA targets
Retirement Asset Returns on Target
FY14A FY15A FY16A FY17A FY18 Target
RetirementEarnings Composition1
Established Business 42.6 47.6 57.6 71.7 71.5 – 76.5
Development 0.4 4.3 20.6 33.0 70.0 – 74.0
Care and Support Services
0.7 1.0 1.3 1.1 1.5 – 2.0
Retirement EBIT2 ($m) 43.7 52.9 79.5 105.8 143.0 – 152.5
Retirement Assets Employed ($m)
1,092 1,155 1,267 1,776 1,904
Target Range 6.0% – 6.5% 5.5% – 6.3% 7.5% – 8.0%
Actual ROA 4.0% 4.6% 6.3% 6.0%1 Long term retirement earnings mix (based on EBIT) will likely be 70%-80% recurring (Established Business and Care and Support Services) and 20%-30% active (Development) post FY21. 2 Excludes capitalised interest in cost of goods sold.
72%
26%
2%
90%
8% 2%
66%
33%
1%
50%49%
1%
97%
1% 2%

42
Reconciliation of Retirement EBIT
42
$m FY14A FY15A FY16A1 FY17A FY18FRetirement EBIT
Established Business 42.6 47.6 57.6 71.7 71.5 – 76.5
Development 0.4 4.3 20.6 33.0 70.0 – 74.0
Care and Support Services 0.7 1.0 1.3 1.1 1.5 – 2.0
Retirement EBIT 43.7 52.9 79.5 105.8 143.0 – 152.5
Development Adjustments
Capitalised Interest in COGS - (1.1) (1.3) (1.9) (12.0) – (10.0)
Development profit on aged care facilities2 - - - (5.9) (4.0) – (3.0)
Total - (1.1) (1.3) (7.8) (16.0) – (13.0)
Depreciation & Amortisation
Established Business 0.5 0.7 1.0 2.1 1.0 – 1.5
Care and Support Services 0.6 0.5 0.6 0.6 1.5 – 2.0
Total 1.1 1.2 1.6 2.7 2.5 – 3.5
Retirement Profit Contribution
Established Business 43.1 48.3 58.6 73.8 72.5 – 78.0
Development 0.4 3.2 19.3 25.2 54.0 – 61.0
Care and Support Services 1.3 1.5 2.0 1.7 3.0 – 4.0
Retirement profit contribution 44.8 53.0 79.9 100.7 129.5 – 143.0
Retirement EBIT figures used in determining Retirement ROA exclude capitalised interest in COGS to remove the impact of leverage
A reconciliation of the Retirement EBIT figures to the Retirement profit contribution is shown in the table below
1 Excludes Freedom.2 FY17A Durack, FY18F Newstead.

43
1,018 1,105
1,231 1,421 1,421
62 82
138
168 168
18
26
33
84 84
218 218
13
850
1,100
1,350
1,600
1,850
2,100
FY14A FY15A FY16A FY17A FY18F
Re
tire
me
nt
Ass
ets
Em
plo
yed
($
m)
Established Business Development Care and Support Services Freedom Additional Net Investment
Indicative Retirement Assets
Composition of Retirement Assets
1 NPV of DMF/CG annuity stream at FY13 plus capital expenditure on the established portfolio as future revaluations are excluded for the purpose of calculating Retirement ROA.2 The effect of the Freedom acquisition was excluded from the FY16 measurement and is included in the FY17 measurement.3 Reported investment property under construction adjusted to include only those projects completing before or during FY18.4 Weighted average reflecting timing of significant cash flows that occur unevenly during the year.
$m FY16A FY17A Average3,4
Average Assets Employed Established Business1
Opening balance 1,105 1,231Acquisition of Freedom Aged Care2 - 197Change in net working capital 126 190Closing balance 1,231 1,618
Development2
Opening balance 82 138Acquisition of Freedom Aged Care2 - 21Change in net working capital 56 30Closing balance 138 189
Care & Support Services Opening balance 26 33Change in net working capital 7 51Closing balance 33 84
Total Retirement2
Opening balance 1,213 1,402Acquisition of Freedom Aged Care2 - 218Change in net working capital 189 271Closing balance 1,402 1,891 1,776
Average retirement assets for measuring ROA in FY14 was just under $1.1bn
This has increased to $1,891m in FY17 and is expected to increase to $1,904m by FY18
The primary reasons for the increase in the asset levels by FY18 will be:
– Acquisitions of Freedom and RVG (already acquired)
– Expanding and accelerating the new retirement unit development pipeline
– Capital expenditure on the established retirement community portfolio
– Investment in additional aged care facilities
Future revaluations are excluded for the purpose of calculating the retirement ROA
FY18F retirement assets employed balances have no allowance for new development site acquisitions
1 Actual balance at point in time, refer table below for reconciliation.2 Balance at end of FY16 (excludes Freedom). 3 Average balance incorporating opening and closing balance for financial year (including Freedom).
Retirement Asset Profile
1,098 1
1,213 1
1,402 2
1,904 3
Average 1,267
Average 1,155
Average 1,776
1,891

44
Appendices
Appendix i. Sector Information
Appendix ii. Strategy
Appendix iii. Retirement Information
Appendix iv. Non-Retirement Information
Appendix v. Profit and Loss
Appendix vi. Balance Sheet
Appendix vii. Capital Management
Appendix viii. Other Information
Need to change picture KLG to source new photo

45
Units
Co
mm
un
itie
s
ILU
s
SAs
Fre
ed
om
SAs
Exis
tin
gTo
tal
Pip
elin
e3
–U
nit
s
Tota
l Un
its
Age
d C
are
B
ed
s
Pip
elin
e
–B
ed
s
Tota
l Un
its
an
d B
ed
s
Aveo1 86 7,259 1,403 1,076 9,738 5,007 14,745 184 658 15,587
Aveo Healthcare2 5 1,277 169 83 1,529 - 1,529 123 105 1,757
Total Australia 91 8,536 1,572 1,159 11,267 5,007 16,274 307 763 17,344
Aveo – US 5 - 275 - 275 - 275 - - 275
Total Aveo 96 8,536 1,847 1,159 11,542 5,007 16,549 307 763 17,619
LegendAveo Group communities
Aveo Healthcare communities
Aveo owns 91 existing communities across the east coast and Adelaide, with two new greenfield communities to be completed by the end of FY18
Aveo also owns five existing communities in the south-east of the United States of America
Communities predominantly located in prime metropolitan locations
Australian portfolio characterised by mature communities with 62 communities more than 20 years old, with established resident communities
Aveo Community Locations
Retirement – Our Portfolio
Portfolio Snapshot
27%
2%
21%
40%
10%
1 Includes 39 units not offered for accommodation purposes e.g. managers’ units.2 Includes 10 units not offered for accommodation purposes e.g. managers’ units; AEH is 86% owned by Aveo.3 Development pipeline net of 361 units to be redeveloped.
48%
23%29%
US Senior Living Locations
LegendUS Senior communities

46
Retirement Community Portfolio – Aveo
Aveo Communities Location ILUs SAsFreedom
SAsExisting
Total
Aged Care Beds
Existing Units &
Beds
Pipeline- Units
Pipeline- Beds
Total Units (Future)
Queensland Communities
Amity Gardens Ashmore, Qld 119 - - 119 - 119 - - 119
Aspley Court Aspley, Qld 118 44 - 162 - 162 - - 162
Bridgeman Downs Bridgeman Downs, Qld 113 73 - 186 - 186 - - 186
Carindale Carindale, Qld 66 41 - 107 - 107 325 100 532
Clayfield Clayfield, Qld - - 39 39 - 39 - - 39
Cleveland Gardens Ormiston, Qld 154 - 66 220 - 220 - - 220
Lindsay Gardens Buderim, Qld 122 52 - 174 - 174 - - 174
Manly Gardens Manly, Qld 168 - - 168 - 168 - - 168
Morayfield Caboolture South, Qld - - 64 64 - 64 40 - 104
Newmarket Newmarket, Qld 75 - - 75 - 75 189 - 264
Peregian Springs Peregian Springs, Qld 189 48 - 237 - 237 - - 237
Redland Bay Redland Bay, Qld - - 46 46 - 46 90 - 136
Robertson Park Robertson, Qld 35 38 - 73 - 73 131 - 204
Robina Robina, Qld 126 - - 126 - 126 - - 126
Rochedale Rochedale, Qld - - 110 110 - 110 - - 110
Southport Gardens Southport, Qld 90 - - 90 - 90 125 - 215
Springfield Springfield, Qld 66 - - 66 - 66 2,290 144 2,500
Sunnybank Green Sunnybank, Qld 56 - - 56 - 56 - - 56
Tanah Merah Slacks Creek, Qld - - 62 62 - 62 82 - 144
The Domain Country Club
Ashmore, Qld 323 52 - 375 - 375 - - 375
The Parks Earlville, Qld 157 - - 157 - 157 - - 157
Toowoomba Bridge St Toowoomba, Qld - - 58 58 - 58 - - 58

47
Retirement Community Portfolio – Aveo (Cont’d)
Aveo Communities Location ILUs SAsFreedom
SAsExisting
Total
Aged Care Beds
Existing Units &
Beds
Pipeline– Units
Pipeline– Beds
Total Units (Future)
Queensland Communities (Cont.)
Toowoomba Taylor St Toowoomba, Qld - - 103 103 - 103 - - 103
Tranquility Gardens Helensvale, Qld 115 - - 115 - 115 - - 115
Brightwater Brightwater, Qld - - - - - - - - -
Newstead Newstead, Qld - - - - - - 199 99 298
Palmview Palmview, Qld - - - - - - 138 - 138
Sanctuary Cove Sanctuary Cove, Qld - - - - - - 163 - 163
The Rochedale Estates Rochedale, Qld - - - - - - 150 - 150
Total QLD 2,092 348 548 2,988 - 2,988 3,922 343 7,253
New South Wales Communities
Banora Point Banora Point, NSW 125 - - 125 - 125 - - 125
Banora Point Banora Point, NSW - - 84 84 - 84 - - 84
Bayview Gardens Bayview, NSW 262 38 - 300 73 373 - - 373
Camden Downs Camden South, NSW 65 - - 65 - 65 - - 65
Coffs Harbour Coffs Harbour, NSW - - 50 50 - 50 - - 50
Fernbank St Ives, NSW 156 38 - 194 - 194 - - 194
Heydon Grove ILUs Mosman, NSW 31 - - 31 - 31 - - 31
Island Point St Georges Basin, NSW 70 - - 70 - 70 85 - 155
Lindfield Gardens East Lindfield, NSW 138 40 - 178 - 178 - - 178
Manors of Mosman Mosman, NSW 133 21 - 154 - 154 - - 154
Maple Grove Casula, NSW 112 - - 112 - 112 - - 112
Minkara Bayview, NSW 159 43 - 202 51 253 - - 253
Mosman Grove SAs Mosman, NSW - 37 - 37 - 37 - - 37
Mountain View Murwillumbah, NSW 220 51 - 271 - 271 - - 271

48
Retirement Community Portfolio – Aveo (Cont’d)
Aveo Communities Location ILUs SAsFreedom
SAsExisting
Total
Aged Care Beds
Existing Units &
Beds
Pipeline– Units
Pipeline– Beds
Total Units (Future)
New South Wales Communities (Cont.)
Newcastle Newcastle, NSW 50 - - 50 - 50 250 123 423
Peninsula Gardens Bayview, NSW 77 34 - 111 - 111 - - 111
Pittwater Palms Avalon, NSW 127 41 - 168 - 168 - - 168
Tamworth Tamworth, NSW - - 56 56 - 56 20 - 76
Tweed Heads Tweed Heads, NSW - - 70 70 - 70 - - 70
Southern Gateway Bella Vista, NSW - - - - - - 464 144 608
Total NSW 1,725 343 260 2,328 124 2,452 819 267 3,538
Victoria Communities
Balwyn Manor Balwyn, Vic - 54 - 54 - 54 - - 54
Bendigo Bendigo, Vic - - 96 96 - 96 - - 96
Bentleigh Bentleigh, Vic 27 43 - 70 - 70 - - 70
Botanic Gardens Cranbourne, Vic 157 - - 157 - 157 - - 157
Cherry Tree Grove Croydon, Vic 354 36 - 390 - 390 - - 390
Concierge Balwyn Balwyn, Vic 71 - - 71 - 71 - - 71
Concierge Bayside Hampton, Vic 86 - - 86 - 86 - - 86
Domaine Doncaster, Vic 167 - - 167 - 167 - - 167
Dromana Safety Beach, Vic - - 67 67 - 67 - - 67
Edrington Park Berwick, Vic 149 35 - 184 - 184 - - 184
Fountain Court Burwood, Vic 130 41 - 171 - 171 - - 171
Geelong Grovedale, Vic - - 48 48 - 48 - - 48
Hampton Heath Hampton Park, Vic 53 - - 53 - 53 - - 53
Hunters Green Cranbourne, Vic 136 - - 136 - 136 74 - 210
Kingston Green Cheltenham, Vic 108 40 - 148 - 148 - - 148

49
Retirement Community Portfolio – Aveo (Cont’d)
Aveo Communities Location ILUs SAsFreedom
SAsExisting
Total
Aged Care Beds
Existing Units &
Beds
Pipeline- Units
Pipeline- Beds
Total Units (Future)
Victoria Communities (Cont.)
Lisson Grove Hawthorn, Vic - 39 - 39 - 39 - - 39
Mingarra Croydon, Vic 155 - - 155 60 215 147 48 410
Oak Tree Hill Glen Waverley, Vic 147 47 - 194 - 194 - - 194
Pinetree Donvale, Vic 73 - - 73 - 73 - - 73
Roseville Doncaster East, Vic 111 38 - 149 - 149 - - 149
Sackville Grange Kew, Vic 97 - - 97 - 97 - - 97
Springthorpe Macleod, Vic 88 - - 88 - 88 - - 88
Sunbury Sunbury, Vic 102 - - 102 - 102 - - 102
The George Sandringham, Vic 75 36 - 111 - 111 - - 111
Toorak Place Toorak, Vic 54 - - 54 - 54 - - 54
Veronica Gardens Northcote, Vic 58 54 - 112 - 112 - - 112
Total VIC 2,398 463 211 3,072 60 3,132 221 48 3,401
South Australia Communities
Ackland Park Everard Park, SA 30 20 - 50 - 50 - - 50
Carisfield Seaton, SA 103 - - 103 - 103 - - 103
Crestview Hillcrest, SA 88 - - 88 - 88 - - 88
Fulham Fulham, SA 68 27 - 95 - 95 - - 95
Glynde Lodge Glynde, SA 80 - - 80 - 80 - - 80
Gulf Point North Haven, SA 55 - - 55 - 55 - - 55
Kings Park Kings Park, SA 19 31 - 50 - 50 - - 50
Leabrook Lodge Rostrevor, SA 62 - - 62 - 62 - - 62
Leisure Court Fulham Gardens, SA 43 - - 43 - 43 - - 43

50
Retirement Community Portfolio – Aveo (Cont’d)
Aveo Communities Location ILUs SAsFreedom
SAsExisting
Total
Aged Care Beds
Existing Units &
Beds
Pipeline- Units
Pipeline- Beds
Total Units (Future)
South Australia Communities (Cont.)
Manor Gardens Salisbury East, SA 40 32 - 72 - 72 - - 72
Melrose Park Melrose Park, SA 90 35 - 125 - 125 - - 125
Riverview Elizabeth Vale, SA 53 - - 53 - 53 - - 53
The Braes Reynella, SA 103 28 - 131 - 131 - - 131
The Haven North Haven, SA 36 31 - 67 - 67 - - 67
Westport Queenstown, SA 62 - - 62 - 62 - - 62
Total SA 932 204 - 1,136 - 1,136 - - 1,136
Tasmania Communities
Derwent Waters Claremont, Tas 112 45 - 157 - 157 - - 157
Launceston Mowbray, Tas - - 57 57 - 57 45 - 102
Total TAS 112 45 57 214 - 214 45 - 259
Total Australian Communities 7,259 1,403 1,076 9,738 184 9,922 5,007 658 15,587

51
Retirement Community Portfolio – Aveo (Cont’d)
US Seniors Communities
Location ILUs SAsFreedom
SAsExisting
Total
Aged Care Beds
Existing Units &
Beds
Pipeline- Units
Pipeline- Beds
Total Units (Future)
US Communities
Fort Walton Beach Fort Walton Beach, Florida
- 58 - 58 - 58 - - 58
Sun City Center Ruskin, Florida - 42 - 42 - 42 - - 42
Tampa Tampa, Florida - 32 - 32 - 32 - - 32
Seneca Seneca, South Carolina - 62 - 62 - 62 - - 62
Franklin Franklin, Tennessee - 81 - 81 - 81 - - 81
Total US Communities - 275 - 275 - 275 - - 275
Total All Communities 7,259 1,678 1,076 10,013 184 10,197 5,007 658 15,862

52
Retirement Community Portfolio – Aveo Healthcare
Aveo Healthcare Communities
Location ILUs SAsFreedom
SAsExisting
Total
Aged Care Beds
Existing Units &
Beds
Pipeline- Units
Pipeline- Beds
Total Units (Future)
Queensland Communities
Albany Creek Albany Creek, Qld 304 - 83 387 - 387 - - 387
Clayfield Albion, Qld 236 - - 236 - 236 - 105 341
Cleveland Cleveland, Qld 110 28 - 138 - 138 - - 138
Durack Durack, Qld 525 104 - 629 123 752 - - 752
Taringa Taringa, Qld 102 37 - 139 - 139 - - 139
Total 1,277 169 83 1,529 123 1,652 - 105 1,757

53
Retirement Major Development – Further Information
Record level of 506 major new units to be delivered in FY18
To date 50 of those units have been delivered with all other projects on track
Continue to target development margins for major development of 16%-20% (before funding costs)
Timing of stock delivery has historically been in second half of the financial year
Delivery target of over 500 new units from major developments per annum onwards from FY18
FY19 will be the first year where 500+ units are delivered and 500+ units are targeted to be sold
Major Development HY18 FY17 Change
Opening major units available 289 174 66%
Add: units delivered 50 266 (81%)
Add: units reconfigured - 3 NM
Less: development units sold (89) (154) (42%)
Closing major units available 250 289 (13%)
Total value of units available for sale $134.6m $156.6m (14%)
Average price of units available for sale $538k $542k (1%)

54
Minor Development – Further Information
The sell down rate of Freedom minor developments continued to increase in HY18
769 minor development units are forecast to be sold down over the next four to five years
Development HY18 FY17 Change
Opening minor development units 392 258 52%
Additional minor development units acquired - 128 NM
Add: Freedom conversion units bought back 36 86 (58%)
Less: minor development units sold (75) (80) (6%)
Less: Other stock movements (2) - NM
Closing minor development units available 351 392 (10%)
Units to be converted 418 451 (7%)
Total minor development forecast to be sold 769 843 (9%)
Carrying value of units available for sale $64.6m $66.4m (3%)
Average carrying value of units available for sale $184k $169k 9%

55
Minor Development – Further Information
Community Total unitsSold under Freedom
% Sold under Freedom
Units under refurbishment or
available
Units to be converted
Total Minor Developments
Forecast to be sold
Conversion Villages
Albany Creek1 78 22 28% 4 52 56
Cleveland Gardens1 66 18 27% - 48 48
The George 111 11 10% 20 80 100
Edrington Park 35 6 17% 7 22 29
Lisson Grove 39 6 15% 18 15 33
Balwyn Manor 54 2 4% 32 20 52
Roseville 38 3 8% 13 22 35
Fountain Court 41 5 12% 18 18 36
Kingston Green 40 2 5% 11 27 38
Oak Tree Hill 47 6 13% 24 17 41
Concierge Balwyn 72 2 3% 31 39 70
Concierge Bayside 86 1 1% 27 58 85
Original Freedom Villages
Freedom Banora Point1 15 10 5 - 5
Freedom Bendigo1 52 22 30 - 30
Freedom Bridge Street1 5 3 2 - 2
Freedom Clayfield1 4 4 - - -
Freedom Coffs Harbour1 27 10 17 - 17
Freedom Dromana1 53 14 39 - 39
Freedom Geelong1 5 4 1 - 1
Freedom Launceston1 31 2 29 - 29
Freedom Morayfield1 10 6 4 - 4
Freedom Redland Bay1 9 - 9 - 9
Freedom Rochedale1 - - - - -
Freedom Tamworth1 5 4 1 - 1
Freedom Tanah Merah1 1 - 1 - 1
Freedom Taylor Street1 16 8 8 - 8
Freedom Tweed Heads1 1 1 - - -
Total 941 172 351 418 7691 Community valued on Freedom unit price and contract assumptions (see slide 16 and 57 for further detail).

56
Retirement – Investment Property Valuation
Discount rate range of 12.5% - 14.5% represents the various risk characteristics of different communities within the portfolio eg: location, age, tenure structure, etc.
Property price growth ranges primarily reflect the variances assumed for metropolitan versus more regional locations
For conservatism lower property price growth is assumed in the short to medium term
Average age, historical resident length of stay and resident entry age support current long term tenure assumptions
Average resident age in the portfolio is 82.9
Total portfolio real estate value of $4.6bn
$1,230m of embedded DMF/CG has been accrued under current contracts, which represents the DMF/CG to be paid to Aveo if all residents sold their units at balance date
Key Assumptions and Portfolio Metrics
HY18 FY17
Discount rate 12.5% - 14.5% 12.5% - 14.5%
Future property price growth
Medium term 3.5% - 4% 3.5% - 4%
Long term 3.5% - 4.25% 3.5% - 4.25%
Subsequent resident tenure (years)
ILUs 10 10
SAs 4 4
NPV of annuity streams $1,798.0m $1,695.3m
Current average resident length of stay (years)
ILUs 7.6 7.7
SAs 3.9 3.9
Current average age of residents (years)
ILUs 82.1 82.0
SAs 86.8 86.7
Overall 82.9 82.8
Average age of resident entry – Last 12 months
ILUs 77.1 77.2
SAs 83.9 84.2
Overall 79.1 79.4
Average Unit Pricing
ILUs $456k $433k
Freedom SAs $368k $360k
Aveo SAs $182k $178k

57
-
20
40
60
80
100
120
140
160
Resident Data /Unit Pricing
Aveo Way FreedomConversion
DMF Impact -Delivery of new
units
DMF ValuationGain
Fair value gain -new and BB
stock
Change inRetirement IP
Non-retirementgain
Change in IP FairValue
Mill
ion
s
31
7
23
2182
24 106
32 138
Retirement Portfolio Revaluation Components
Components of the change in fair value of investment property are highlighted in the chart below
These figures can be reconciled to the statutory accounts as the sum of change in fair value of investment properties ($160.8m), change in fair value of resident loans (-$64.9m) and the difference between DMF cash and accruals ($42.3m)

58
Retirement – Investment Property Sensitivities
Valuation sensitivities analysis on the key assumptions were conducted and outlined below
− Long term property price growth depends on various factors including the age, location, quality of facilities, residential property market, etc. The valuation is sensitive to this assumption as the DMF and CG earned per resale is based on the forecast unit price.
− Subsequent Tenure depends on the characteristics of new residents who replace existing residents. Increased tenure will decrease sales rates due to a reduced rate of units being made available while decreased tenure will have the reverse effect.
− Discount rates reflect a combination of portfolio investment characteristics and risks. As resident tenures can be relatively long, discount rates can have a strong impact on the valuation.
− Unit Prices are set based on the current level of demand and vacancy at Aveo’s communities and are forecast based on the assumed property price growth rate. This impacts the forecast DMF and CG generated and in turn the valuation.
Retirement Investment Property Annuity Stream Sensitivity ($m)
Long term property price growth +1.0% +0.5% 3.50% - 4.25% (0.5%) (1.0%)
Value of established portfolio 2,046 1,916 1,798 1,690 1,591
Subsequent tenure – ILUs (years) 8 9 10 11 12
Value of established portfolio 1,937 1,862 1,798 1,742 1,694
Discount rate (1.0%) (0.5%) 12.50% - 14.50% +0.5% +1.0%
Value of established portfolio 2,018 1,902 1,798 1,703 1,617
Market value of units (Change) 5.0% 2.5% - (2.5%) (5.0%)
Value of established portfolio 1,915 1,858 1,798 1,737 1,679

59
Appendices
Appendix i. Sector Information
Appendix ii. Strategy
Appendix iii. Retirement Information
Appendix iv. Non-Retirement Information
Appendix v. Profit and Loss
Appendix vi. Balance Sheet
Appendix vii. Capital Management
Appendix viii. Other Information
60
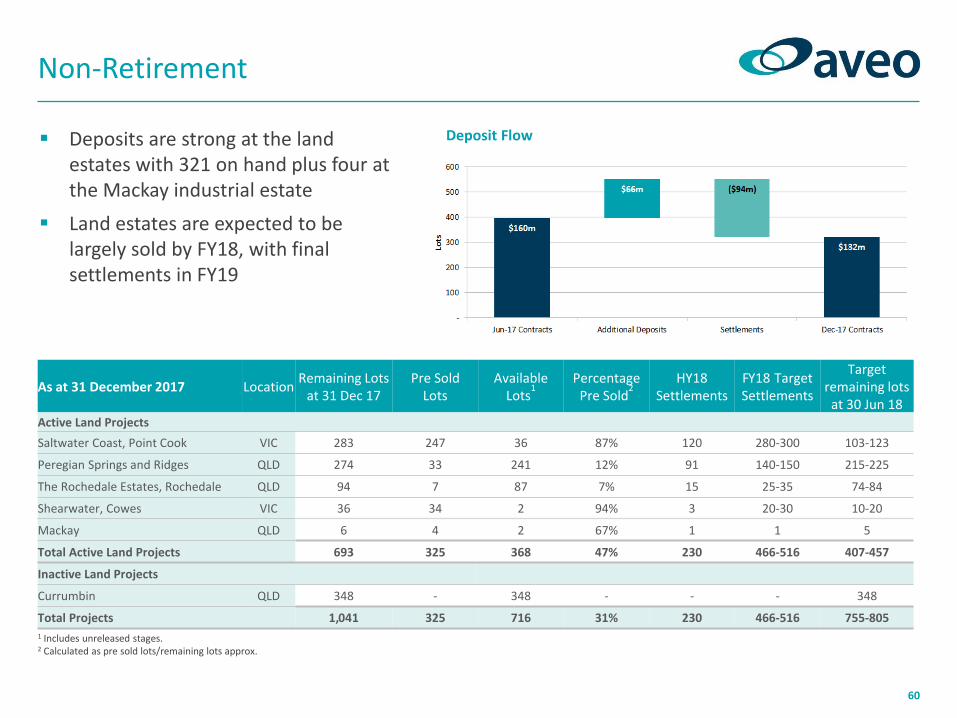
Non-Retirement
Deposits are strong at the land estates with 321 on hand plus four at the Mackay industrial estate
Land estates are expected to be largely sold by FY18, with final settlements in FY19
1 Includes unreleased stages.2 Calculated as pre sold lots/remaining lots approx.
Deposit Flow
As at 31 December 2017 LocationRemaining Lots
at 31 Dec 17Pre Sold
LotsAvailable
Lots1
PercentagePre Sold
2HY18
SettlementsFY18 TargetSettlements
Target remaining lots
at 30 Jun 18Active Land Projects
Saltwater Coast, Point Cook VIC 283 247 36 87% 120 280-300 103-123
Peregian Springs and Ridges QLD 274 33 241 12% 91 140-150 215-225
The Rochedale Estates, Rochedale QLD 94 7 87 7% 15 25-35 74-84
Shearwater, Cowes VIC 36 34 2 94% 3 20-30 10-20
Mackay QLD 6 4 2 67% 1 1 5
Total Active Land Projects 693 325 368 47% 230 466-516 407-457
Inactive Land Projects
Currumbin QLD 348 - 348 - - - 348
Total Projects 1,041 325 716 31% 230 466-516 755-805

61
Non-Retirement Assets Sell Down and Composition
Non-Retirement Asset Balance Sheet Movement HY18($m)
FY17($m)
Change
Non-Retirement Assets at beginning of period 355.6 430.6 (17%)
Asset sales announced during the period (30 June 2017 carrying value) (181.5) 17.6 NM
Assets held for sale 219.4 - NM
Net Development Activity during the period (33.8) (109.1) (69%)
Change in Fair Value of Non-Retirement Assets - 16.5 NM
Closing Non-Retirement assets at end of period 359.7 355.6 1%
Represented by
Inventories: Residential communities1 102.7 131.4 (22%)
Commercial2 34.3 38.9 (12%)
Total inventories 137.0 170.3 (20%)
Assets held for sale 219.4 - NM
Investment properties - 181.5 NM
Property, plant and equipment 3.3 3.8 (13%)
Non-Retirement assets at end of period 359.7 355.6 1%
Non-Retirement assets as percentage of total divisional assets3 12% 13% (1%)
Non-Retirement assets as percentage of pro-forma total divisional assets4 5% 13% (8%)
1 HY18 includes Point Cook, Rochedale, Peregian Springs, Ridges, Currumbin and Shearwater.2 HY18 includes Mackay, Milton commercial and Albion.3 Net of resident loans and deferred revenue and excludes non-allocated assets4 Adjusted for sale of Gasworks 1 and 2.

62
Appendices
Appendix i. Sector Information
Appendix ii. Strategy
Appendix iii. Retirement Information
Appendix iv. Non-Retirement Information
Appendix v. Profit and Loss
Appendix vi. Balance Sheet
Appendix vii. Capital Management
Appendix viii. Other Information
Need to change picture KLG to source new photo

63
Statutory Income Statement
HY18($m)
HY17($m)
Change
Profit from continuing operations before income tax 149.3 143.5 4%
Income tax expense (1.1) (24.1) (95%)
Profit after tax 148.2 119.4 24%
Non-controlling interest 1.1 1.8 (39%)
Net profit after tax attributable to stapled security holders of the Group 149.3 121.2 23%

64
Reconciliation of Statutory Profit to Underlying Profit
1 The tax adjustment in relation to the change in fair value of the retirement investment properties includes tax and NCI.
HY18 HY17
Gross ($m)
Tax & NCI ($m)
Net ($m)
Gross ($m)
Tax & NCI ($m)
Net ($m)
Statutory profit after tax and non-controlling interest 149.3 121.2
Retirement
Change in fair value of retirement investment properties (81.8) 12.3 (69.4) (19.7) (3.2) (22.9)
Gain on acquisition of RVG - - - (52.6) - (52.6)
De-recognition of deferred tax asset - - - - 8.9 8.9
Gain on acquisition of US Seniors (1.5) - (1.5) - - -
Other 7.6 0.6 8.2 (5.3) 2.5 (2.8)
Total Retirement (75.7) 13.0 (62.8) (77.6) 8.2 (69.4)
Non-Retirement
Change in fair value of non-retirement investment properties (32.2) (18.2) (50.4) (4.5) 1.3 (3.2)
Other 0.3 (0.1) 0.2 7.2 (1.9) 5.3
Total Non-Retirement (31.9) (18.3) (50.2) 2.7 (0.6) 2.1
Underlying profit after tax and non-controlling interest 36.3 53.9

65
Reconciliation of Underlying Profit to Segment Notes
HY18 ($m)Underlying
Profit
Change in Fair Value of RetirementInvestmentProperties
US Seniors acquisition
Change in Fair Value of
Non-Retirement Investment Properties
OtherStatutory
Result
Retirement
Established Business 26.6 81.8 1.5 - (7.6) 102.3
Development 2.1 - - - - 2.1
Care and Support Services - - - - - -
Total Retirement 28.7 81.8 1.5 - (7.6) 104.4
Total Non-Retirement 28.7 - - 32.2 (0.3) 60.6
Group marketing costs (3.0) - - - - (3.0)
Group overheads and incentive scheme (8.0) - - - - (8.0)
EBITDA 46.4 81.8 1.5 32.2 (7.9) 154.0
Depreciation and amortisation (1.4) - - - - (1.4)
EBIT 45.0 81.8 1.5 32.2 (7.9) 152.6
Interest and borrowing expense (3.3) - - - - (3.3)
Profit before tax 41.7 81.8 1.5 32.2 (7.9) 149.3
Income tax (5.3) (11.8) - 18.2 (2.3) (1.1)
Profit after tax 36.4 70.0 1.5 50.4 (10.2) 148.2
Non-controlling interests (0.1) (0.5) - - 1.7 1.1
NPAT attributable to Aveo Group 36.3 69.4 1.5 50.4 (8.4) 149.3

66
Statutory Profit and Loss by Consolidated Segment
Retirement 1Non-
Retirement Other Total HY18 Retirement
Non-Retirement Other
Total HY17
($m) ($m) ($m) ($m) ($m) ($m) ($m) ($m)
Sale of goods revenue - 85.9 - 85.9 - 117.7 - 117.7
Revenue from rendering of services 110.5 8.1 - 118.6 102.7 7.7 - 110.4
Other revenue 4.1 1.0 (1.6) 3.5 4.5 0.6 (0.8) 4.3
Cost of sales (14.7) (58.6) - (73.3) (9.3) (91.9) - (101.2)
Change in fair value of investment properties 128.9 32.2 - 160.8 172.6 4.5 - 177.1
Change in fair value of resident loans (64.9) - - (64.9) (165.8) - - (165.8)
Change in fair value of financial assets and financial liabilities
5.2 - - 5.2 5.6 - - 5.6
Employee expenses (29.3) - (6.2) (35.5) (18.5) (0.3) (5.4) (24.2)
Marketing expenses (13.4) (1.0) (3.0) (17.4) (8.3) (2.0) - (10.3)
Occupancy expenses (0.6) - (1.1) (1.7) (0.2) - (0.7) (0.9)
Property expenses - (1.8) - (1.8) - (1.6) (1.6)
Administration expenses (6.2) - (2.9) (9.1) (6.2) - (2.2) (8.4)
Other expenses (4.6) (4.9) 2.8 (6.7) (4.3) (6.4) 1.7 (9.0)
Net gain on business combination 1.5 - - 1.5 52.6 - - 52.6
Finance costs 4.5 - (7.9) (3.4) - - - -
Impairment of equity accounted investments (12.8) - - (12.8) - - - -
Share of net gain of equity-accounted investments
0.4 - - 0.4 (2.8) - - (2.8)
Profit/(loss) from continuing operations before income tax
121.1 60.9 (32.7) 149.3 122.6 28.3 (7.4) 143.5
Income tax (expense) - - (1.1) (1.1) - - (24.1) (24.1)
Profit/(loss) for the period 121.1 60.9 (33.8) 148.2 122.6 28.3 (31.5) 119.4
Non-controlling interests - - 1.1 1.1 - - 1.8 1.8
Net profit/(loss) attributable to stapled security holders of the Group
121.1 60.9 (32.7) 149.3 122.6 28.3 (29.7) 121.2
1 In the statutory accounts, Retirement has been segmented into Established Business, Development, and Care and Support.

67
Reconciliation of Retirement Segment Revenue to Segment Notes
HY18($m)
HY17($m)
Change
Segment revenue
Established Business 72.3 90.7 (20%)
Development 62.5 38.1 64%
Care and Support Services 18.4 6.4 188%
Total Retirement segment revenue 153.2 135.2 13%
Adjustments
Established Business
Sales revenue – buyback sales (25.9) (24.3) 7%
Equity-accounted profits (1.5) 2.8 (155%)
Other1 9.2 (4.4) 309%
Development
Deferred management fee – cash vs accrual 42.3 36.1 17%
Development revenue (62.5) (38.1) 64%
Care and Support Services
Equity-accounted profits (0.2) (0.1) 200%
Retirement revenue per segment note 114.6 107.2 7%
1 Other includes US Seniors revenue in HY18 and RVG pre-acquisition revenue eliminated on consolidation in HY17.

68
Interest Expense Reconciliation
HY18($m)
HY17($m)
Change
Interest expense1 12.5 9.6 30%
Less: Capitalised Interest
Retirement
Greenfield communities (5.6) (3.6) 56%
Brownfield communities (0.4) (1.8) (80%)
Redevelopment (1.7) (0.5) 232%
Non-Retirement
Residential communities (1.3) (3.7) (64%)
Commercial (0.2) - NM
Total capitalised interest1 (9.2) (9.6) (5%)
Net finance costs 3.3 - NM
Add: Capitalised interest expenses in COGS
Retirement 0.3 - NM
Residential communities 14.7 23.2 (37%)
Residential apartments - 0.7 NM
Total capitalised interest in COGS 15.0 23.9 (37%)
Finance costs including capitalised interest expensed in COGS 18.4 23.9 (23%)
1 Interest expense paid and total capitalised interest represents only those amounts recognised in underlying profit after tax.

69
Income Tax Reconciliation
HY18($m)
HY17($m)
Change
Statutory profit from continuing operations before tax 149.3 143.5 4%
Less: Aveo Group Trust Contribution (15.4) (6.7) 130%
Corporation profit before tax 133.9 136.8 (2%)
Plus/(less):
Non-assessable loss/(gain) on business combination 5.2 (52.6) NM
Recognition of previously unrecognised tax losses on income account utilised during the period
(62.5) (10.2) NM
Benefit of previously unrecognised tax losses on capital account utilised during the period
(92.0) - NM
Impairment of equity-accounted investment 12.8 - NM
Other non-deductible items (net of non-assessable items) 6.4 6.3 2%
Corporation adjusted taxable profit 3.8 80.3 (95%)
Tax expense 1.1 24.1 (95%)
Statutory effective tax rate1 1% 18% (17%)
Underlying profit before tax 41.7 68.8 (39%)
Income tax expense 5.3 14.8 (64%)
Underlying effective tax rate 13% 22% (9%)
1 Calculated as adjusted tax expense or benefit divided by statutory profit/(loss) before tax.

70
Management Expense Ratio and Management Expenses
• Increase in employee expenses in HY18 is to support growth in retirement activity and ramp up in development pipeline
1 Management expenses excludes STI/LTI, sales and marketing related costs and property related costs.
Management Expenses1
by Category ($m)HY18 HY17 Change
Employee expenses 23.7 19.1 24%
Occupancy expenses 1.2 0.9 40%
Administration expenses 7.5 6.4 18%
Other expenses 1.1 4.3 (74%)
Total 33.5 30.6 9%
Divisional expenses 26.1 24.4 7%
Corporate expenses 7.4 6.2 19%
Total 33.5 30.6 9%

71
Appendices
Appendix i. Sector Information
Appendix ii. Strategy
Appendix iii. Retirement Information
Appendix iv. Non-Retirement Information
Appendix v. Profit and Loss
Appendix vi. Balance Sheet
Appendix vii. Capital Management
Appendix viii. Other Information
Need to change picture KLG to source new photo

72
Summary Statutory Balance Sheet
HY18($m)
FY17($m)
Change
Assets
Retirement
Investment properties 5,748.6 5,324.0 8%
Equity-accounted investments - 23.2 NM
Property, plant and equipment 106.2 85.2 25%
Intangibles 4.1 3.8 8%
Total Retirement 5,858.9 5,436.2 8%
Non-Retirement
Inventories 137.0 170.3 (20%)
Investment properties/assets held-for-sale 219.4 181.5 21%
Property, plant and equipment 3.3 3.8 (13%)
Total Non-Retirement 359.7 355.6 1%
Cash/receivables/other 216.5 163.3 33%
Total assets 6,435.1 5,955.1 8%
Liabilities
Resident loans and retirement deferred revenue 3,135.0 3,001.9 5%
Interest bearing liabilities 799.8 573.1 40%
Deferred tax 156.5 154.9 1%
Other liabilities (including payables, provisions, deferred revenue) 214.4 246.5 (14%)
Total liabilities 4,305.7 3,976.4 8%
Net assets 2,129.4 1,978.7 8%
NTA per stapled security $3.63 $3.37 8%

73
Management Balance Sheet
%HY18($m)
%FY17($m)
Change
Assets
Retirement
Retirement investment properties1 2,555.1 2,259.6 13%
Equity-accounted investments - 23.2 NM
Property, plant, equipment and intangibles 110.3 88.9 24%
Total Retirement 88% 2,665.4 87% 2,371.7 12%
Non-Retirement
Inventories – Commercial 34.3 38.9 (12%)
Inventories – Residential communities 102.7 131.4 (22%)
Assets held for sale 219.4 - NM
Investment property - 181.5 NM
Property, plant, equipment and intangibles 3.3 3.8 (13%)
Total Non-Retirement 12% 359.7 13% 355.6 1%
Total Divisional Assets 100% 3,025.1 100% 2,727.3 11%
Other assets (including cash and trade receivables) 216.5 163.4 32%
Total assets 3,241.6 2,890.7 12%
Liabilities
Interest bearing liabilities 799.8 573.1 40%
Deferred tax liabilities 156.5 154.9 1%
Other liabilities (including payables, and provisions) 155.9 184.0 (15%)
Total liabilities 1,112.2 912.0 22%
Net assets 2,129.4 1,978.7 8%
1 Net of resident loans, deferred income and deferred payment for development land.

74
Proforma Management Balance Sheet
%Proforma HY181
($m)%
HY18($m)
Change
Assets
Retirement
Retirement investment properties2 2,555.1 2,555.1 -
Property, plant, equipment and intangibles 110.3 110.3 -
Total Retirement 95% 2,665.4 88% 2,665.4 -
Non-Retirement
Inventories – Commercial 34.3 34.3 -
Inventories – Residential communities 102.7 102.7 -
Assets held for sale 0.9 219.4 (100%)
Property, plant, equipment and intangibles 3.3 3.3 -
Total Non-Retirement 5% 141.2 12% 359.7 (61%)
Total Divisional Assets 100% 2,806.6 100% 3,025.1 (7%)
Other assets (including cash and trade receivables) 216.5 216.5 -
Total assets 3,023.1 3,241.6 (7%)
Liabilities
Interest bearing liabilities 581.3 799.8 (27%)
Deferred tax liabilities 156.5 156.5 -
Other liabilities (including payables, and provisions) 155.9 155.9 -
Total liabilities 893.7 1,112.2 (20%)
Net assets 2,129.4 2,129.4 -
Gearing3 16.3% 21.6% (5%)1 Proforma for sale of Gasworks 1 and 2.2 Net of resident loans, deferred income and deferred payment for development land.3 Total assets used in gearing calculation includes development land on a gross basis.

75
Retirement Management Balance Sheet
HY18 ($m)
FY17 ($m)
Change
Established Business
NPV of annuity streams 1,797.8 1,695.3 6%
US Seniors 54.5 - NM
Equity accounted investments - 23.2 NM
Buyback units (operating) 98.8 75.3 31%
Total 1,951.1 1,793.8 9%
Development
Major:
Investment property under construction 404.8 266.0 52%
New units available for first occupancy 134.6 156.6 (14%)
Total 539.4 422.6 28%
Minor development units
Freedom conversion development units 51.8 52.6 (2%)
Freedom original development units1 12.8 13.8 (7%)
Total 64.6 66.4 (3%)
Total 604.0 489.0 24%
Care and Support Services
Property, plant, equipment and intangibles 110.3 88.9 24%
Total Retirement assets 2,665.4 2,371.7 12%
1 Freedom original development units represent the original units that were part of the Freedom Aged Care acquisition.

76
Investment Property Summary
HY18 ($m)
FY17 ($m)
Change
Retirement
NPV of annuity streams 1,797.8 1,695.3 6%
Investment properties under construction 404.8 266.0 52%
New units available for first occupancy 134.6 156.6 (14%)
Buyback units:
Operating 98.8 75.3 31%
Freedom conversion development units 51.8 52.6 (2%)
Freedom original development units 12.8 13.8 (7%)
Total 163.4 141.6 15%
Retirement (domestic) net valuation 2,500.6 2,259.6 11%
Resident loans 2,896.9 2,797.7 4%
Deferred income 238.1 204.2 17%
Deferred payment for development land 58.5 62.5 (6%)
US Seniors 54.5 - NM
Total Retirement Investment property 5,748.6 5,324.0 8%
Non-Retirement
Investment properties - 181.5 NM
Total investment properties per balance sheet 5,748.6 5,505.5 4%

77
Non-Retirement Inventories Summary
HY18 ($m)
FY17 ($m)
Change
Inventories
Residential communities1 102.7 131.4 (22%)
Commercial2 34.3 38.9 (12%)
Total Inventories 137.0 170.3 (20%)
Residential Communities
($m)
Commercial($m)
Total($m)
Impairment
Balance as at 30 June 2017 114.7 3.5 118.2
Impairment reclassification (2.1) 2.1 -
Amounts utilised in relation to impairments– effecting underlying profit after tax
(10.6) (0.2) (10.8)
Balance as at 31 December 2017 102.0 5.4 107.4
1 HY18 includes Point Cook, Rochedale, Peregian Springs, Ridges, Currumbin and Shearwater.2 HY18 includes Milton, Albion and Mackay.

78
Movement in Net Tangible Assets per Security
Net Tangible Assets ($m)
No. of Securities (m)
NTA per Security ($)
As at 30 June 2017 1,943.3 577.3 3.37
Statutory net profit 149.3 - 0.26
Other comprehensive income 3.2 - 0.01
Increase in intangible assets1 0.2 - -
Movements in reserves2 (3.2) - (0.01)
On-market buyback of securities (1.3) (0.5) -
Equity settled employee benefits 0.6 0.2 -
As at 31 December 2017 2,092.1 577.0 3.63
1 Principally software licences.2 Acquisition of non-controlling interests and equity settled employee benefits.

79
Appendices
Appendix i. Sector Information
Appendix ii. Strategy
Appendix iii. Retirement Information
Appendix iv. Non-Retirement Information
Appendix v. Profit and Loss
Appendix vi. Balance Sheet
Appendix vii. Capital Management
Appendix viii. Other Information
Need to change picture KLG to source new photo

80
Funds from Operations and Adjusted Funds from Operations
HY18 ($m)
HY17 ($m)
Change
Underlying profit after tax 36.3 53.9 (33%)
Retirement Development: Profit adjustment on settled basis 1.6 (0.3) NM
Tax impact (0.5) 0.1 NM
Adjusted underlying profit after tax 37.5 53.7 30%
Other Adjustments:
Profit from equity-accounted investments (0.1) (2.1) (96%)
Depreciation 1.4 1.1 32%
Capitalised interest (9.2) (9.6) (5%)
Capitalised interest Included in COGS 15.0 23.9 (37%)
Amortisation of leasing incentives 1.0 1.1 (12%)
Deferred income tax expense 5.3 14.8 (64%)
Funds From Operations (FFO)1 50.9 82.8 (39%)
Retirement capex (7.0) (4.7) 52%
Community facility capex (2.0) (6.9) (71%)
Non-Retirement leasing commissions, tenant incentives and maintenance capital expenditure
(0.9) (1.7) (47%)
Adjusted Funds From Operations (AFFO)1 40.9 69.6 (41%)
1 FFO and AFFO reflect Property Council of Australia guidelines.

81
Distributions
HY18($m)
HY17($m)
Change
Underlying Profit After Tax 36.3 53.9 (33%)
Funds from operations1 50.9 82.8 (39%)
Adjusted funds from operations1 40.9 69.6 (41%)
Distribution declared - - NM
Distribution as a % of UPAT - - NM
Distribution as a % of FFO - - NM
Distribution as a % of AFFO - - NM
Consistent with prior periods, no distribution was declared at thehalf-year
Targeting full year distribution amount based on 40%-60% of FY18 underlying profit payout range (Board may adjust payout range for securities bought back during the period)
Full year distribution to be announced in June 2018 and paid on or before 28 September 2018
1 FFO and AFFO for reflect Property Council of Australia guidelines.

82
Cash Flow Reconciliation ($m)
47
16
62
190
48
(15)
(190)(10)
(52)
0
50
100
150
200
250
300
350
Opening cash Retirementoperating
Non-Retirement Debt drawn Corporate &working capital
Retirementinvesting
Interest paid Distribution paid Closing cash
$m

83
Financial Covenants
All financial covenants met
Covenant HY18 Required
Aveo Group Syndicated Facility
EBITDA to interest expense of the consolidated group (12 months rolling) Group ICR 4.7x > 1.5x
Total assets less cash and resident loans / net debt Group Gearing Ratio 21.6% < 30%
Established Business, Care and Support Services and unallocated overheads to
interest expense (12 months rolling)Retirement ICR (Core)1 2.7x > 2.0x
Drawn debt (excluding facility E) less cash / retirement valuation and non-
retirement valuation (excluding facility E)LVR 26.2% < 30%
Gasworks net rental income to facility E interest expense Gasworks ICR 4.0x > 2.0x
Facility E drawn debt / Gasworks valuation Gasworks LVR 48.0% < 60%
Aveo Healthcare Facility
Total assets less cash and resident loans / Bank debt less cash Gearing Ratio 29.1% < 30%
EBIT (adjusted for fair value of assets and resident loans ) / Finance Charges ICR 3.6x > 1.5x
1 Includes net cashflow from retirement established business and care and support, offset by unallocated overheads to interest expense of facility A and B only.

84
Summary of Debt Facilities
1 Excluding bank guarantee and surety bond limits.2 Undrawn facilities are dependent upon having sufficient security.3 US Seniors debt USD$25.6m.
Summary of Debt Facilities1 Facility Limit($m)
Maturity ($m)
Maturity Date
Maturity ($m)
Maturity Date
Maturity ($m)
Maturity Date
Aveo Group Syndicated Facility 653 50 31 Dec 2018 603 1 Jul 2020 - -
US Seniors3 33 33 29 Nov 2027 - - - -
Aveo Healthcare Facility 148 20 30 Jun 2018 100 30 Mar 2019 28 19 Oct 2019
Total Facilities 832
Drawn 800
% Drawn 96%
Undrawn1,2 32

85
Appendices
Appendix i. Sector Information
Appendix ii. Strategy
Appendix iii. Retirement Information
Appendix iv. Non-Retirement Information
Appendix v. Profit and Loss
Appendix vi. Balance Sheet
Appendix vii. Capital Management
Appendix viii. Other Information
Need to change picture KLG to source new photo
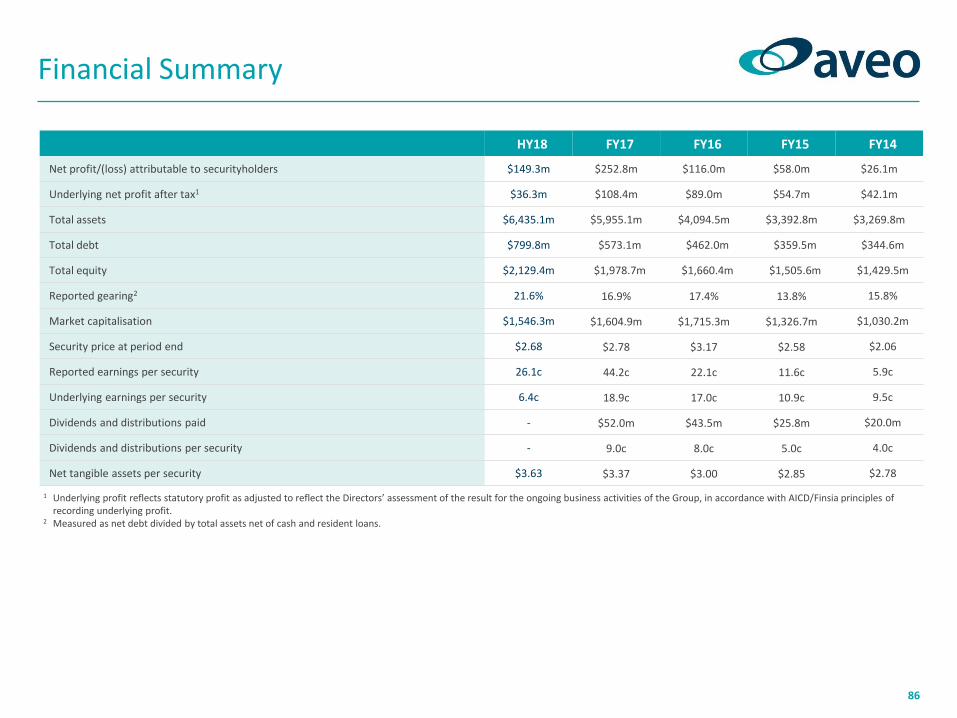
86
Financial Summary
HY18 FY17 FY16 FY15 FY14
Net profit/(loss) attributable to securityholders $149.3m $252.8m $116.0m $58.0m $26.1m
Underlying net profit after tax1 $36.3m $108.4m $89.0m $54.7m $42.1m
Total assets $6,435.1m $5,955.1m $4,094.5m $3,392.8m $3,269.8m
Total debt $799.8m $573.1m $462.0m $359.5m $344.6m
Total equity $2,129.4m $1,978.7m $1,660.4m $1,505.6m $1,429.5m
Reported gearing2 21.6% 16.9% 17.4% 13.8% 15.8%
Market capitalisation $1,546.3m $1,604.9m $1,715.3m $1,326.7m $1,030.2m
Security price at period end $2.68 $2.78 $3.17 $2.58 $2.06
Reported earnings per security 26.1c 44.2c 22.1c 11.6c 5.9c
Underlying earnings per security 6.4c 18.9c 17.0c 10.9c 9.5c
Dividends and distributions paid - $52.0m $43.5m $25.8m $20.0m
Dividends and distributions per security - 9.0c 8.0c 5.0c 4.0c
Net tangible assets per security $3.63 $3.37 $3.00 $2.85 $2.78
1 Underlying profit reflects statutory profit as adjusted to reflect the Directors’ assessment of the result for the ongoing business activities of the Group, in accordance with AICD/Finsia principles of recording underlying profit.
2 Measured as net debt divided by total assets net of cash and resident loans.

87
FY18 Calendar
Date Event Location
14 February HY18 Results Announcement Sydney
14-16 February Private Roadshow Sydney
19-20 February Private Roadshow Melbourne
6-7 March Private Roadshow New Zealand
15 August FY18 Results Announcement @ 10:30am Sydney

88
Glossary
Term Definition Term Definition Term Definition
AFFO Adjusted Funds From Operations EPS Earnings Per Security NPV Net Present Value
AGM Annual General Meeting Established BusinessExisting revenue generating
retirement communitiesNTA Net Tangible Assets
AICDAustralian Institute of
Company DirectorsFreedom Freedom Aged Care Occupancy
Ratio of units occupied to units available for occupancy
ASX Australian Stock Exchange FFO Funds From OperationsOperating Buyback
Purchases
Units that are bought back by Aveo from exiting retirement residents
Average margin Ratio of gross profit to revenue GSC General Service Charge Portfolio Sales RateSum of unit resales and
buyback sales divided by total available units
Buyback SalesSales of units that have
previously been bought back by Aveo to new residents
Gross Profit Revenue less cost of goods sold RACF Residential Aged Care Facility
COGS Cost of Goods Sold ICR Interest Cover Ratio RADRefundable Accommodation
Deposit
CPS Cents Per Security ILU Independent Living UnitRedevelopment
Buyback Purchases
Repurchase of units from exiting residents for the
purpose of redevelopment
DAP Daily accommodation payments Long term Six years plus ResalesResident to resident retirement unit sale
Deposits on HandNumber of deposits held for contracts yet to settle
LVR Loan to value ratio RLC Retirement Living Council
Development Type (Low)
Detached or semi-detached broad-acre development
Major developmentConstruction of new units on
vacant land or airspaceROA Return On Assets
Development Type (Med)
Apartment (up to 3 floors) development
Medium term Less than or equal to six years RVG Retirement Villages Group
Development Type (High)
Apartment (over 3 floors) development
Minor developmentReconfiguration of existing saleable
product into new product different in nature
SA Serviced Apartment
DMF / CGDeferred Management Fee /
Capital GainsNCI Non-controlling interest STI / LTI
Short term incentive / Long term incentive
EBIT Earnings Before Interest and Taxes NM Not Meaningful UPAT Underlying Profit After Tax
EBITDAEarnings Before Interest, Taxation,
Depreciation and AmortisationNPAT Net Profit After Tax

89
Aveo
Level 5, 99 Macquarie Street, Sydney NSW 2000
T +61 2 9270 6100
F +61 2 9270 6199
aveo.com.au
Need to change picture
Disclaimer
The content of this presentation is for general information only. Information in this presentation including, without limitation, any forward-looking statements or opinions (Information) may be subject to change without notice. To the maximum extent permitted by law, Aveo Group Limited, its officers and employees do not make any representation or warranty, express or implied, as to the currency, accuracy, reliability or completeness of the Information and disclaim all responsibility and liability for the Information (including, without limitation, liability for negligence).
The information contained in this presentation should not be considered to be comprehensive or to comprise all the information which a security holder or potential investor in Aveo may require in order to determine whether to deal in Aveo securities. This presentation does not take into account the financial situation, investment objectives and particular needs of any particular person.
This presentation contains “forward-looking statements” including indications of, and guidance on, future earnings, financial position and performance. Such forward looking statements are not guarantees of future performance and involve known and unknown risks, uncertainties and other factors, many of which are beyond the control of Aveo and its officers and employees, that may cause actual results to differ materially from those predicted or implied by any forward-looking statements. You should not place undue reliance on these forward-looking statements. There can be no assurance that actual outcomes will not differ materially from these forward-looking statements.
All dollar values are in Australian dollars (A$) unless otherwise stated.


