Characterization of Most Promising Sequestration Formations in the Rocky Mountain Region DE-FE0001812 Brian J. McPherson University of Utah U.S. Department of Energy National Energy Technology Laboratory Carbon Storage R&D Project Review Meeting Developing the Technologies and Infrastructure for CCS August 20-22, 2013
Transcript
Characterization of Most Promising Sequestration Formations in the Rocky
Mountain Region DE-FE0001812
Brian J. McPherson University of Utah
U.S. Department of Energy National Energy Technology Laboratory
Carbon Storage R&D Project Review Meeting Developing the Technologies and
Infrastructure for CCS August 20-22, 2013
2
Acknowledgements
• NETL • Shell • Tri-State • Trapper Mining • State of Colorado
3
Presentation Outline
• Program Benefits • Project / Program Goals • Technical Status: Finalizing 10-Point
Protocol for CO2 Storage Site Characterization
• Key Accomplishments • Summary
4
Presentation Outline
• Program Benefits • Project / Program Goals • Technical Status: Finalizing 10-Point
Protocol for CO2 Storage Site Characterization
• Key Accomplishments • Summary
5
Benefit to the Program Program Goals Being Addressed by this Project (1) Support industry’s ability to predict CO2 storage capacity in geologic formations to within ±30 percent. (2) Develop and validate technologies to ensure 99 percent storage permanence. (3) Develop technologies to improve reservoir storage efficiency while ensuring containment effectiveness. (4) Develop Best Practice Manual for risk analysis and simulation.
Project Benefits Statement The main outcome of this study is a 10-point Protocol for CO2 Storage Site Characterization. Although this protocol is applied to one region (the Rocky Mountains), we’ve generalized it to be applicable anywhere, and this protocol will support and contribute directly to goals (1), (2) and (3) above (especially (1)).
6
Presentation Outline
• Program Benefits • Project / Program Goals • Technical Status: Finalizing 10-Point
Protocol for CO2 Storage Site Characterization
• Key Accomplishments • Summary
7
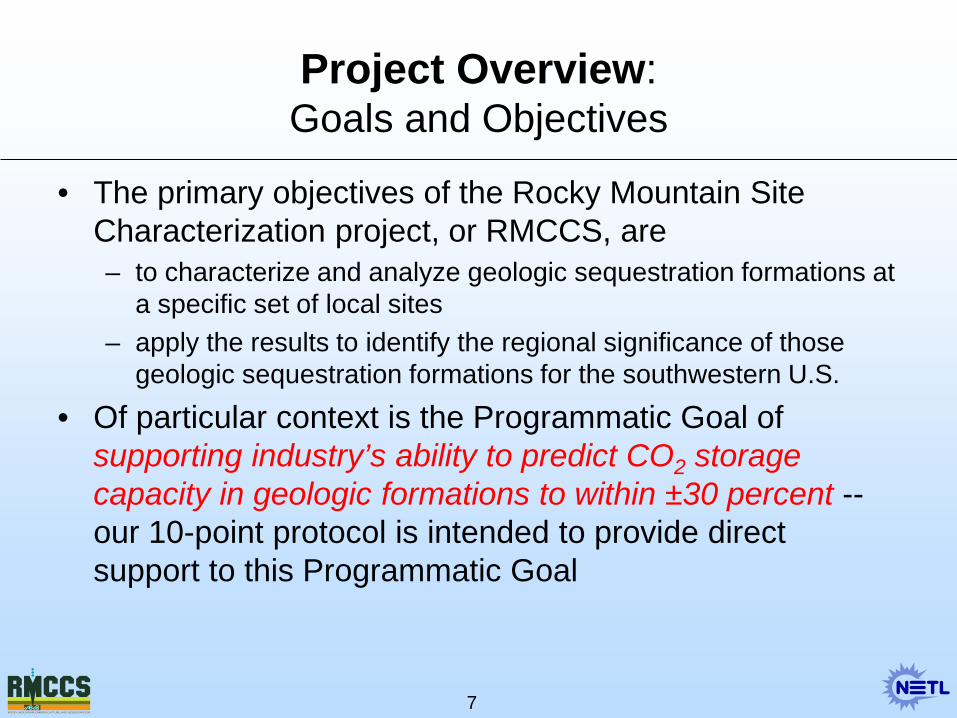
Project Overview: Goals and Objectives
• The primary objectives of the Rocky Mountain Site Characterization project, or RMCCS, are – to characterize and analyze geologic sequestration formations at
a specific set of local sites – apply the results to identify the regional significance of those
geologic sequestration formations for the southwestern U.S.
• Of particular context is the Programmatic Goal of supporting industry’s ability to predict CO2 storage capacity in geologic formations to within ±30 percent -- our 10-point protocol is intended to provide direct support to this Programmatic Goal
8
Presentation Outline
• Program Benefits • Project / Program Goals • Technical Status: Finalizing 10-Point
Protocol for CO2 Storage Site Characterization
• Key Accomplishments • Summary
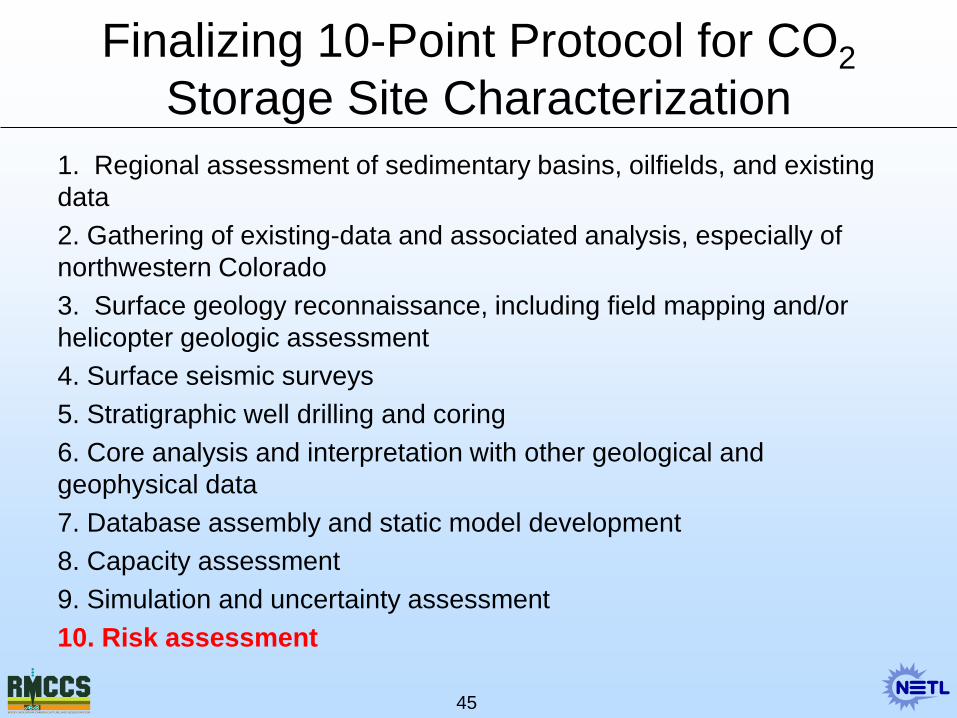
Finalizing 10-Point Protocol for CO2 Storage Site Characterization
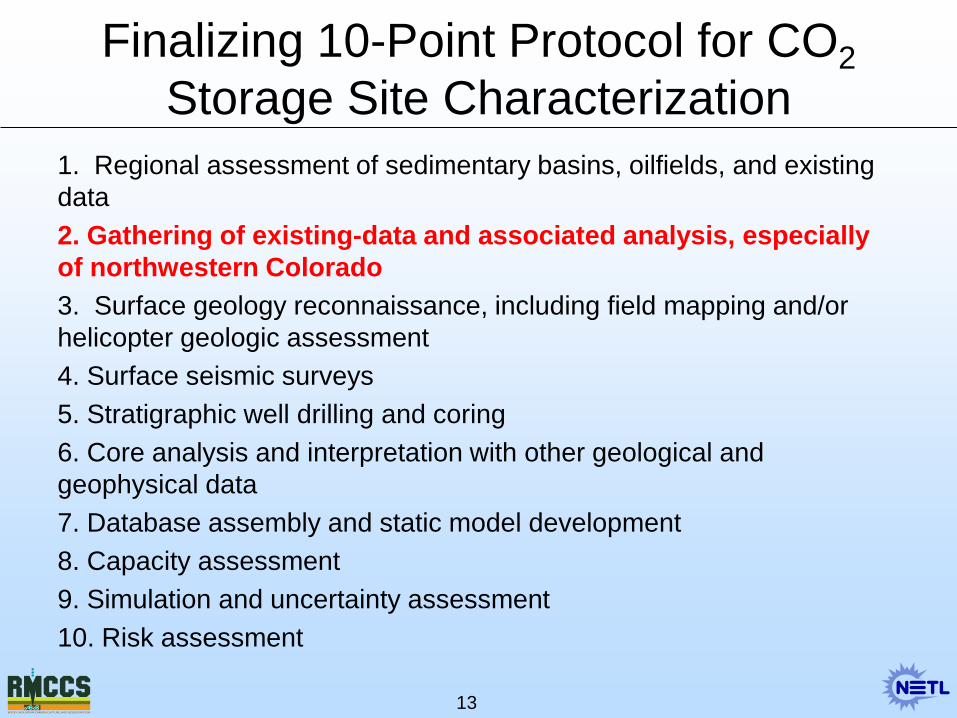
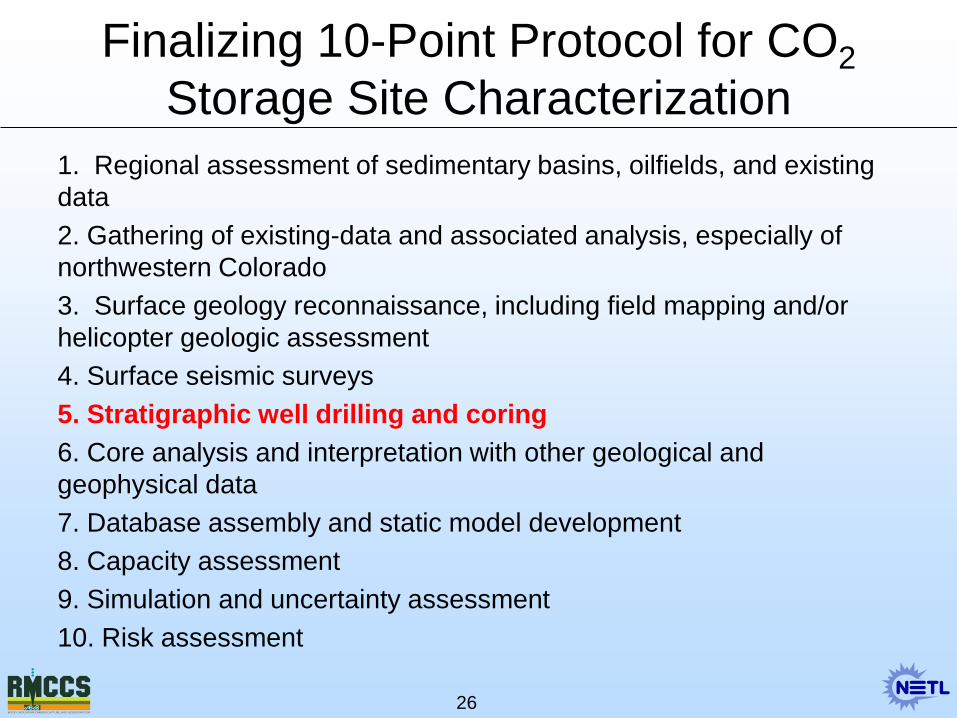
1. Regional assessment of sedimentary basins, oilfields, and existing data 2. Gathering of existing-data and associated analysis, especially of northwestern Colorado 3. Surface geology reconnaissance, including field mapping and/or helicopter geologic assessment 4. Surface seismic surveys 5. Stratigraphic well drilling and coring 6. Core analysis and interpretation with other geological and geophysical data 7. Database assembly and static model development 8. Capacity assessment 9. Simulation and uncertainty assessment 10. Risk assessment
9
Finalizing 10-Point Protocol for CO2 Storage Site Characterization
1. Regional assessment of sedimentary basins, oilfields, and existing data 2. Gathering of existing-data and associated analysis, especially of northwestern Colorado 3. Surface geology reconnaissance, including field mapping and/or helicopter geologic assessment 4. Surface seismic surveys 5. Stratigraphic well drilling and coring 6. Core analysis and interpretation with other geological and geophysical data 7. Database assembly and static model development 8. Capacity assessment 9. Simulation and uncertainty assessment 10. Risk assessment
10
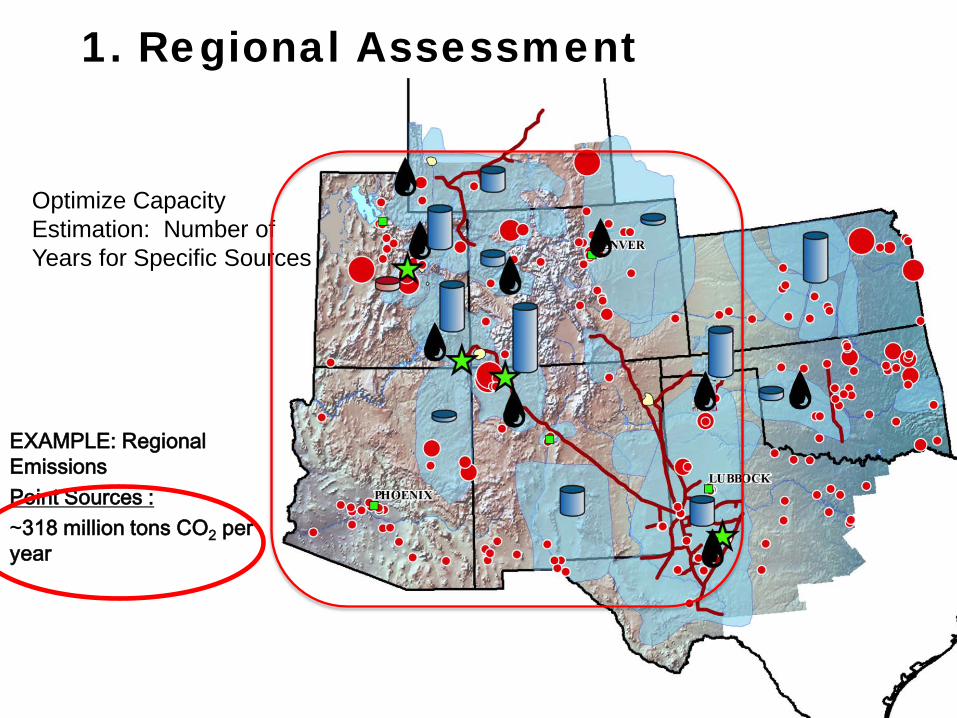
1. Regional Assessment
Optimize Capacity Estimation: Number of Years for Specific Sources
EXAMPLE: Regional Emissions Point Sources : ~318 million tons CO2 per year
1. Regional Assessment
Optimize Capacity Estimation: Number of Years for Specific Sources
EXAMPLE: Regional Emissions Point Sources : ~318 million tons CO2 per year
Case Study Area: Sand Wash Basin
Finalizing 10-Point Protocol for CO2 Storage Site Characterization
1. Regional assessment of sedimentary basins, oilfields, and existing data 2. Gathering of existing-data and associated analysis, especially of northwestern Colorado 3. Surface geology reconnaissance, including field mapping and/or helicopter geologic assessment 4. Surface seismic surveys 5. Stratigraphic well drilling and coring 6. Core analysis and interpretation with other geological and geophysical data 7. Database assembly and static model development 8. Capacity assessment 9. Simulation and uncertainty assessment 10. Risk assessment
13
[Acquire and interpret new seismic]
2. Gather/Analyze Existing Data Identify and incorporate existing data
(e.g. previous geologic studies, maps, well logs and cores)
Purchase, process, and interpret existing seismic
[Map surface structure] [Map regional rock property
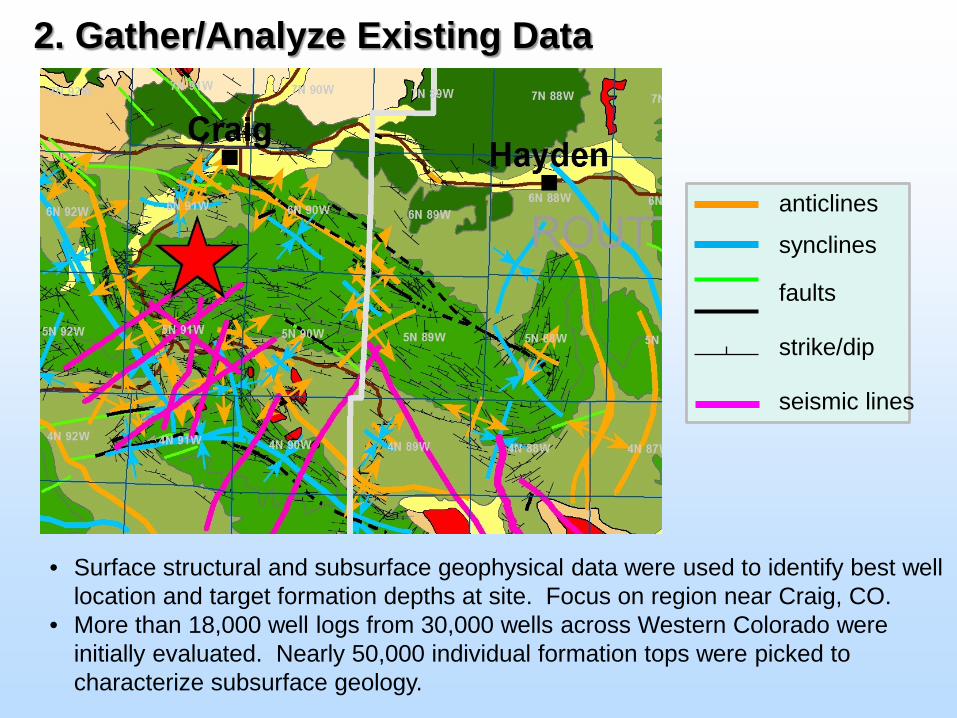
• Surface structural and subsurface geophysical data were used to identify best well location and target formation depths at site. Focus on region near Craig, CO.
• More than 18,000 well logs from 30,000 wells across Western Colorado were initially evaluated. Nearly 50,000 individual formation tops were picked to characterize subsurface geology.
2. Gather/Analyze Existing Data
Wells with raster and/or digital geophysical logs
in western Colorado
Porosity estimation for Entrada Formation in
western Colorado
Finalizing 10-Point Protocol for CO2 Storage Site Characterization
1. Regional assessment of sedimentary basins, oilfields, and existing data 2. Gathering of existing-data and associated analysis, especially of northwestern Colorado 3. Surface geology reconnaissance, including field mapping and/or helicopter geologic assessment 4. Surface seismic surveys 5. Stratigraphic well drilling and coring 6. Core analysis and interpretation with other geological and geophysical data 7. Database assembly and static model development 8. Capacity assessment 9. Simulation and uncertainty assessment 10. Risk assessment
17
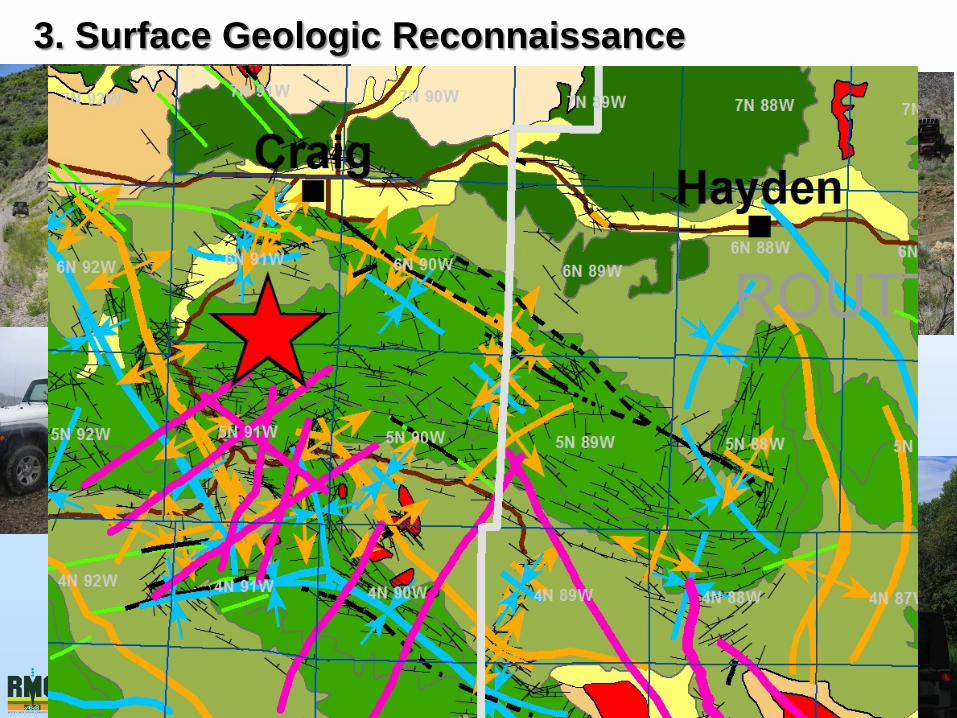
3. Surface Geologic Reconnaissance
Finalizing 10-Point Protocol for CO2 Storage Site Characterization
1. Regional assessment of sedimentary basins, oilfields, and existing data 2. Gathering of existing-data and associated analysis, especially of northwestern Colorado 3. Surface geology reconnaissance, including field mapping and/or helicopter geologic assessment 4. Surface seismic surveys 5. Stratigraphic well drilling and coring 6. Core analysis and interpretation with other geological and geophysical data 7. Database assembly and static model development 8. Capacity assessment 9. Simulation and uncertainty assessment 10. Risk assessment
19
Quantitative Seismic Interpretation through Seismic-Well Ties (SWT)
Using sonic and density well logs along with intersecting seismic data to calibrate a time-depth relationship (TDR) for use in depth conversion of seismic interpretations.
4. Surface Seismic Surveys
SWT based Interpretation Process 1. Wherever available sonic and density well log data are
calibrated to nearby seismic data, creating a TDR for the well. 2. Geologists picks for the well are converted to time using the
TDR. 3. Time converted well picks are posted on the seismic data and
used as kick-off points for seismic interpretations. 4. TDR’s for one or more wells are interpolated to create a 3D
velocity model. 5. The 3D velocity model then used to convert seismic time
interpretations to depth. 6. Depth converted seismic interpretations are then used, along
with well tops, in construction of the 3D geologic model grid.
4. Surface Seismic Surveys
Example: Seismic Line Coverage and Wells in SWT
Wells used for this SWT analysis
4. Surface Seismic Surveys
Seismic to Well Tie
Log Data (sonic, density)
Computed Reflectivity
Series
Seismic Data
Synthetic
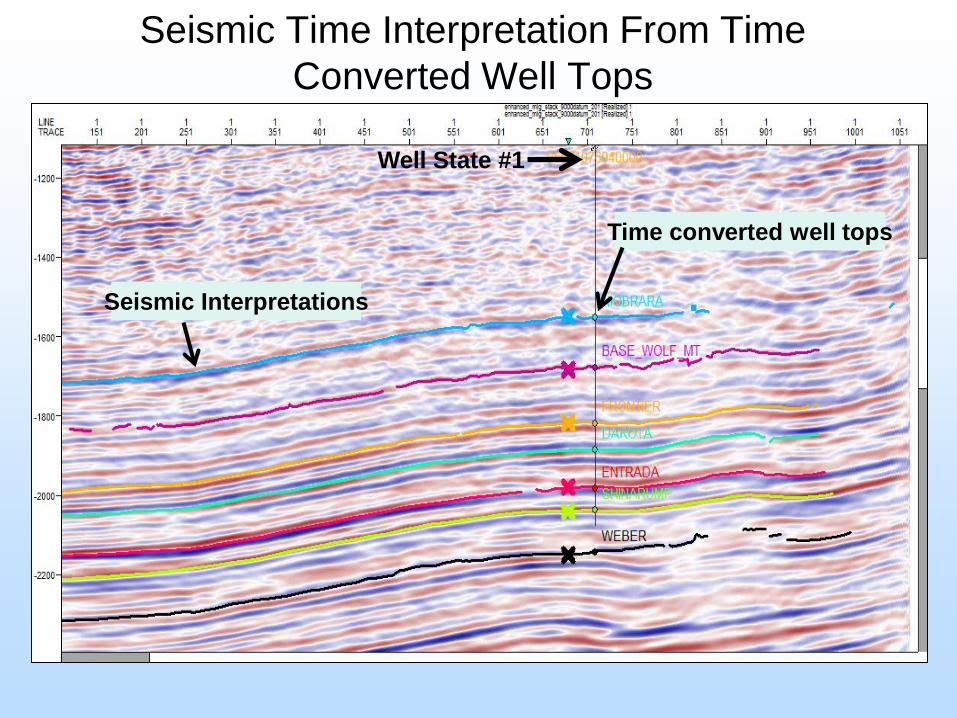
Seismic Time Interpretation From Time Converted Well Tops
Computed Reflectivity
Series
Well State #1
Time converted well tops
Seismic Interpretations
Seismic Time Interpretation Ultimately Serves as Basis for Reservoir Model Grid
Finalizing 10-Point Protocol for CO2 Storage Site Characterization
1. Regional assessment of sedimentary basins, oilfields, and existing data 2. Gathering of existing-data and associated analysis, especially of northwestern Colorado 3. Surface geology reconnaissance, including field mapping and/or helicopter geologic assessment 4. Surface seismic surveys 5. Stratigraphic well drilling and coring 6. Core analysis and interpretation with other geological and geophysical data 7. Database assembly and static model development 8. Capacity assessment 9. Simulation and uncertainty assessment 10. Risk assessment
26
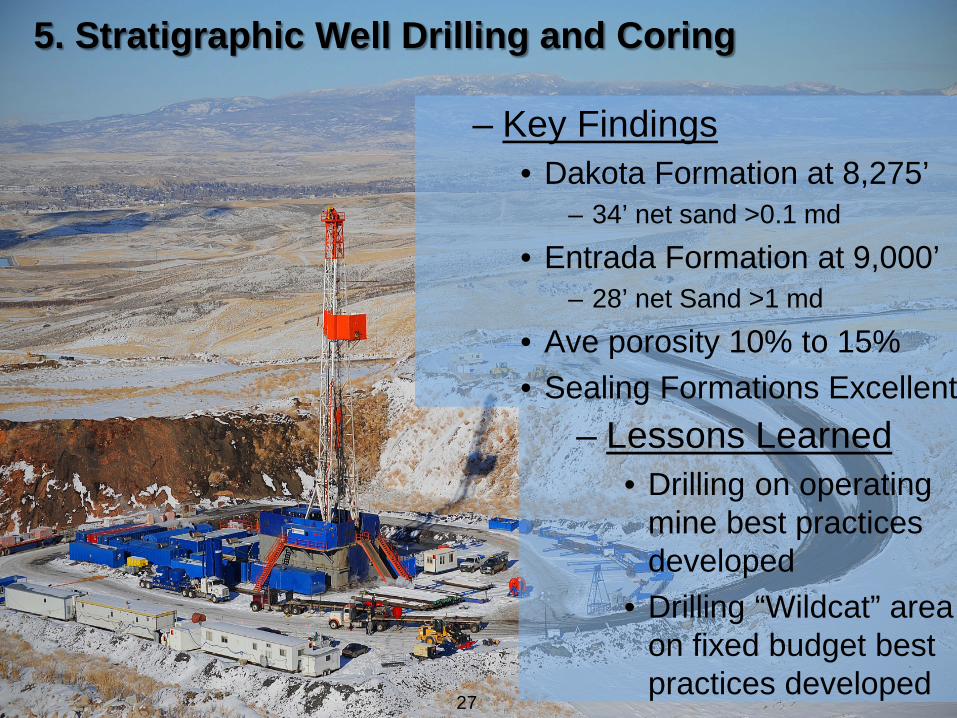
– Key Findings • Dakota Formation at 8,275’
– 34’ net sand >0.1 md
• Entrada Formation at 9,000’ – 28’ net Sand >1 md
• Ave porosity 10% to 15% • Sealing Formations Excellent
27
– Lessons Learned • Drilling on operating
mine best practices developed
• Drilling “Wildcat” area on fixed budget best practices developed
5. Stratigraphic Well Drilling and Coring
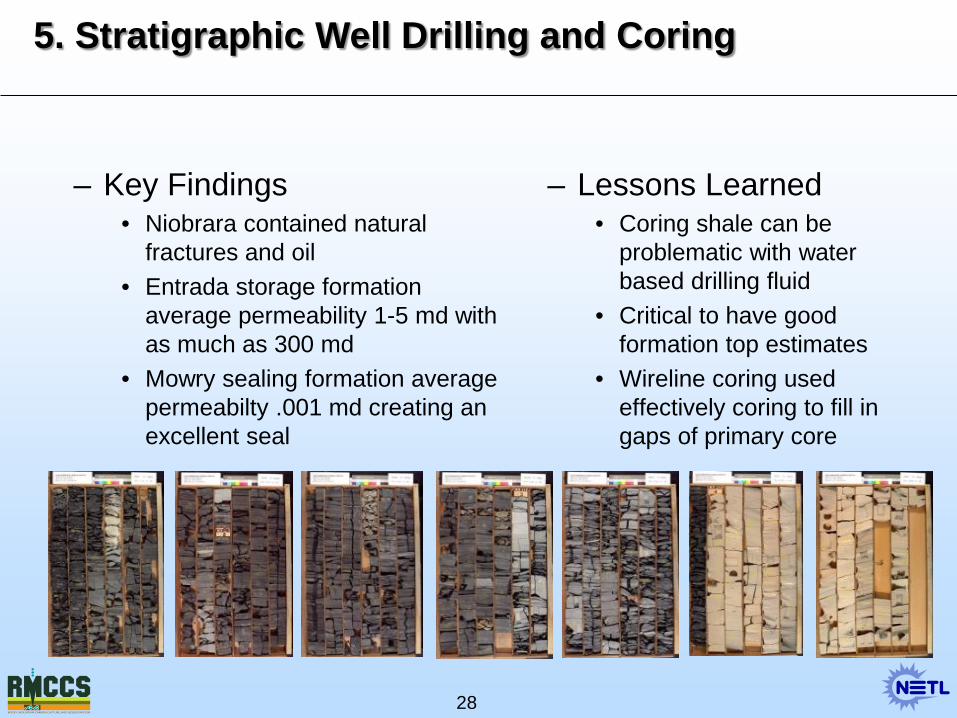
– Lessons Learned • Coring shale can be
problematic with water based drilling fluid
• Critical to have good formation top estimates
• Wireline coring used effectively coring to fill in gaps of primary core
28
– Key Findings • Niobrara contained natural
fractures and oil • Entrada storage formation
average permeability 1-5 md with as much as 300 md
• Mowry sealing formation average permeabilty .001 md creating an excellent seal
5. Stratigraphic Well Drilling and Coring
29
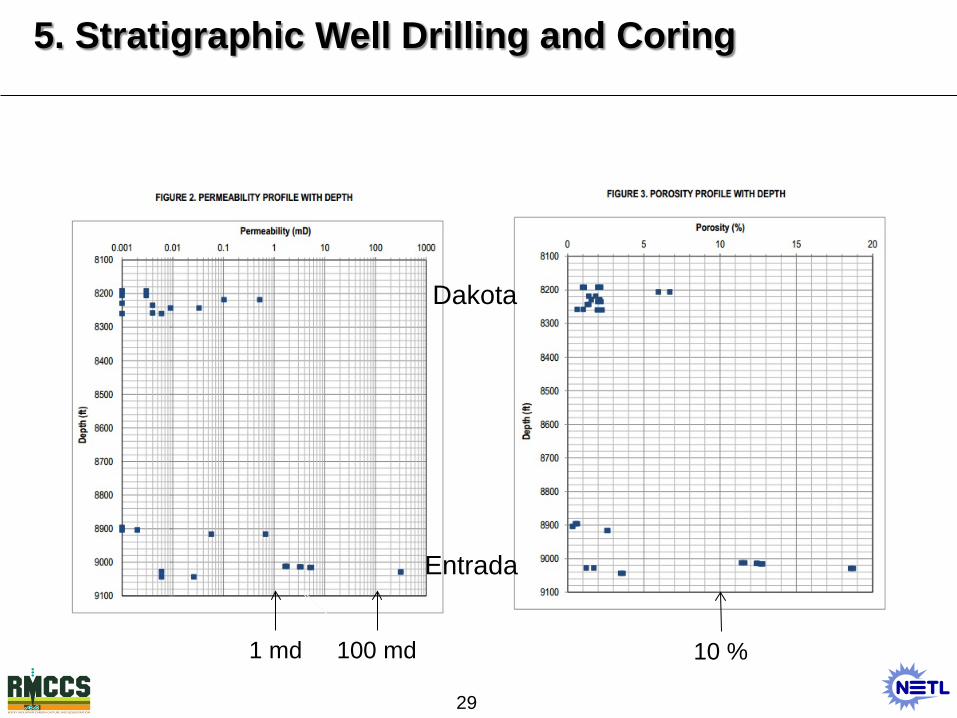
1 md 10 %
Dakota
Entrada
100 md
5. Stratigraphic Well Drilling and Coring
Finalizing 10-Point Protocol for CO2 Storage Site Characterization
1. Regional assessment of sedimentary basins, oilfields, and existing data 2. Gathering of existing-data and associated analysis, especially of northwestern Colorado 3. Surface geology reconnaissance, including field mapping and/or helicopter geologic assessment 4. Surface seismic surveys 5. Stratigraphic well drilling and coring 6. Core analysis and interpretation with other geological and geophysical data 7. Database assembly and static model development 8. Capacity assessment 9. Simulation and uncertainty assessment 10. Risk assessment
• 22 XRD (bulk and clay) for reactive transport simulation
• 42 Petrographic descriptions for fundamental lithologic characterization
• 55 Porosity analyses for calibration of downhole geophysical logs (see left), model development and CO2 capacity
• 55 Permeability analyses for model development and simulation
• 6 Relative Permeability analyses for multiphase simulations (see right)
• 13 Capillary Pressure tests for multiphase simulations
Core & Plugs analyzed
6. Core Analysis and Interpretation
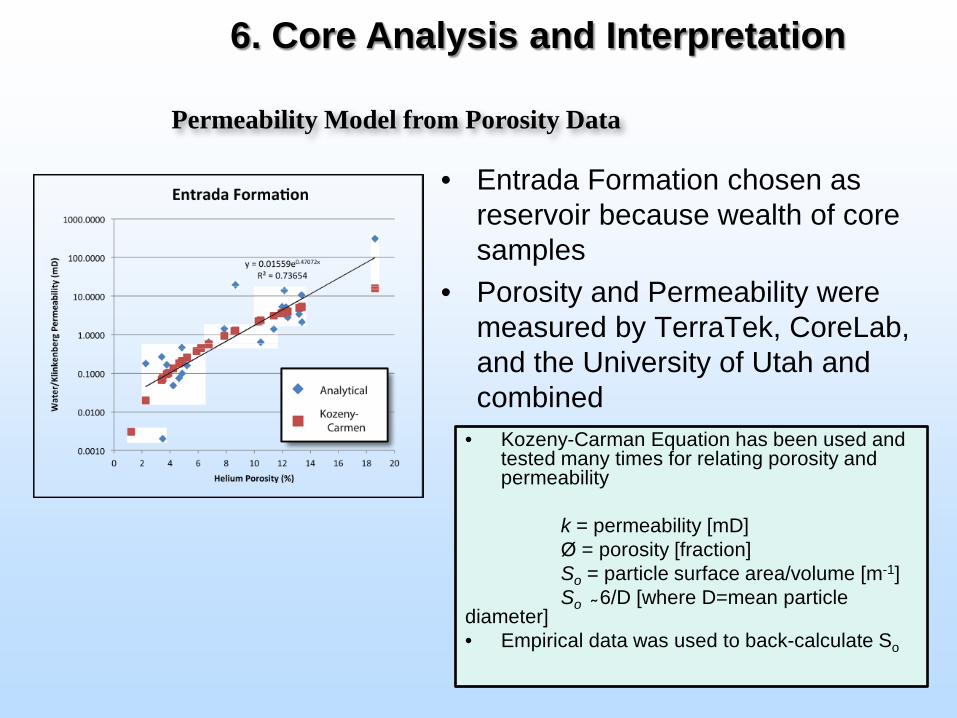
• Entrada Formation chosen as reservoir because wealth of core samples
• Porosity and Permeability were measured by TerraTek, CoreLab, and the University of Utah and combined
Permeability Model from Porosity Data
• Kozeny-Carman Equation has been used and tested many times for relating porosity and permeability
k = permeability [mD] Ø = porosity [fraction] So = particle surface area/volume [m-1] So ̴ 6/D [where D=mean particle diameter] • Empirical data was used to back-calculate So
6. Core Analysis and Interpretation
Finalizing 10-Point Protocol for CO2 Storage Site Characterization
1. Regional assessment of sedimentary basins, oilfields, and existing data 2. Gathering of existing-data and associated analysis, especially of northwestern Colorado 3. Surface geology reconnaissance, including field mapping and/or helicopter geologic assessment 4. Surface seismic surveys 5. Stratigraphic well drilling and coring 6. Core analysis and interpretation with other geological and geophysical data 7. Database assembly and static model development 8. Capacity assessment 9. Simulation and uncertainty assessment 10. Risk assessment
34
35
• Collect all available well, core, seismic and other geoscience data from a large region of Northwestern Colorado and Southwestern Wyoming focusing on the Sand Wash Basin;
• Assemble comprehensive database of all pre-existing data, new seismic data, and new well data (Petrel);
• With all data in place, continue interpretation of these data for stratigraphic and structural elements important to project storage and containment goals;
• Identify gaps, or borehole and surface geological and geophysical data in-fill needs (if possible to acquire);
• Integrate all available data into a geologically-representative 3D geocellular model grid;
7. Database and Model (Grid) Development
• 4000+ regionally distributed public domain wells with geologic formation top picks
• 200+ wells within the Sand Wash Basin model area with geologic formation top picks
• 20 public wells within the Sand Wash model area with petrophysical analysis
• New logs and core from the RMCCS strat test well. • 14 reprocessed legacy 2D seismic lines and 2 new
acquisition 2D seismic lines. • Extensive field geological outcrop studies
36
7. Database and Model (Grid) Development
37
7. Database and Model (Grid) Development
Finalizing 10-Point Protocol for CO2 Storage Site Characterization
1. Regional assessment of sedimentary basins, oilfields, and existing data 2. Gathering of existing-data and associated analysis, especially of northwestern Colorado 3. Surface geology reconnaissance, including field mapping and/or helicopter geologic assessment 4. Surface seismic surveys 5. Stratigraphic well drilling and coring 6. Core analysis and interpretation with other geological and geophysical data 7. Database assembly and static model development 8. Capacity assessment 9. Simulation and uncertainty assessment 10. Risk assessment
38
– CO2 Regional Storage Capacity Assessment:
• Focus on saline formations: Dakota, Entrada and Weber sandstones occurring mainly on the northern Colorado Plateau
• Stratigraphic equivalent formations occurring in the southern part of the Colorado Plateau: Hermosa, De Chelly, Cedar Mesa and Leadville
CO2 Storage Capacity - metric Tonnes/km2
Data prepared by the AGS, CGS, NMBMR, UGS and UU
8. Storage Capacity Assessment
– CO2 Regional Storage Capacity Assessment – Atlas V
40
8. Storage Capacity Assessment
41
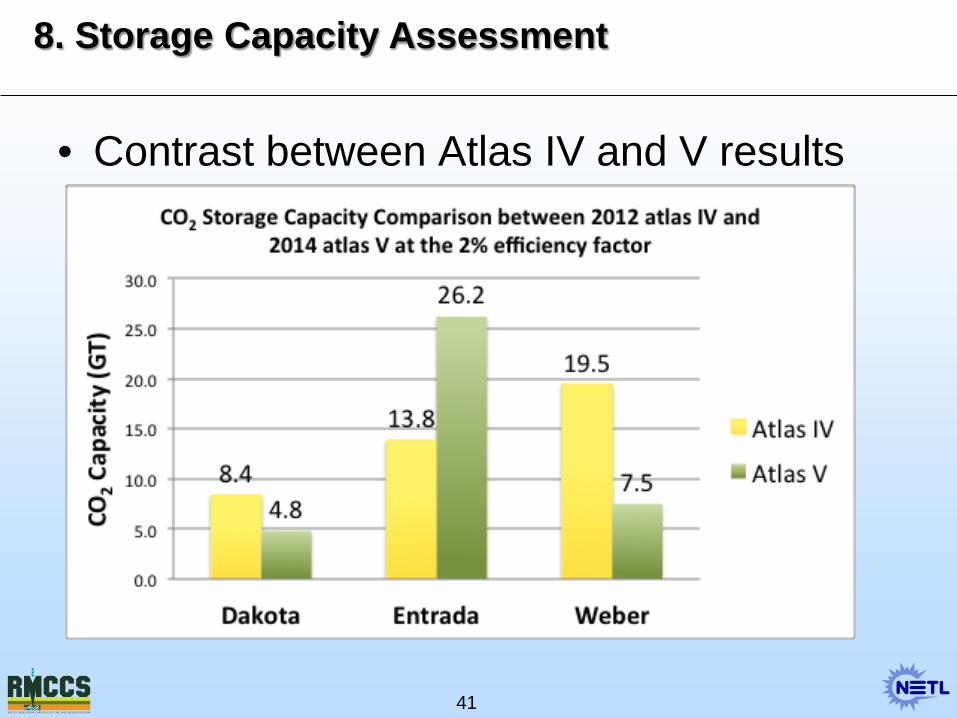
8. Storage Capacity Assessment
• Contrast between Atlas IV and V results
Finalizing 10-Point Protocol for CO2 Storage Site Characterization
1. Regional assessment of sedimentary basins, oilfields, and existing data 2. Gathering of existing-data and associated analysis, especially of northwestern Colorado 3. Surface geology reconnaissance, including field mapping and/or helicopter geologic assessment 4. Surface seismic surveys 5. Stratigraphic well drilling and coring 6. Core analysis and interpretation with other geological and geophysical data 7. Database assembly and static model development 8. Capacity assessment 9. Simulation and uncertainty assessment 10. Risk assessment
42
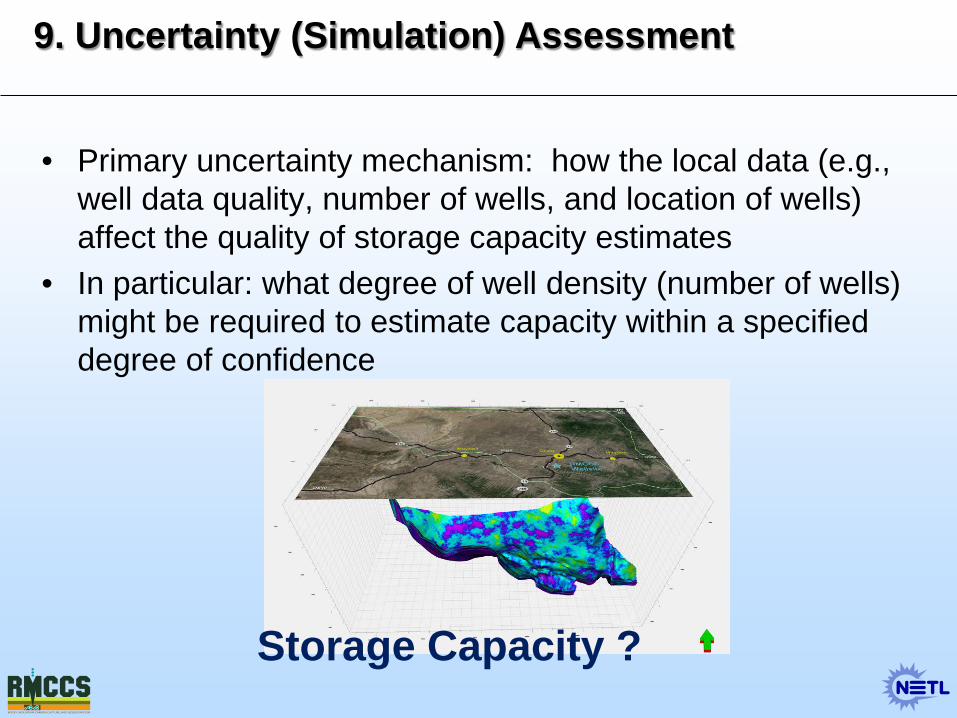
• Primary uncertainty mechanism: how the local data (e.g., well data quality, number of wells, and location of wells) affect the quality of storage capacity estimates
• In particular: what degree of well density (number of wells) might be required to estimate capacity within a specified degree of confidence
Storage Capacity ?
9. Uncertainty (Simulation) Assessment
• Developed new workflow for evaluating storage capacity estimation and associated uncertainty
• Completed the application of the workflow to the Sand Wash Basin geocellular model for estimation of capacity (and associated uncertainty) of the Dakota, Entrada, and Weber formations
Dakota Entrada Weber
9. Uncertainty (Simulation) Assessment
Plots of variance versus well density:
5 10 5 10 5 10
Finalizing 10-Point Protocol for CO2 Storage Site Characterization
1. Regional assessment of sedimentary basins, oilfields, and existing data 2. Gathering of existing-data and associated analysis, especially of northwestern Colorado 3. Surface geology reconnaissance, including field mapping and/or helicopter geologic assessment 4. Surface seismic surveys 5. Stratigraphic well drilling and coring 6. Core analysis and interpretation with other geological and geophysical data 7. Database assembly and static model development 8. Capacity assessment 9. Simulation and uncertainty assessment 10. Risk assessment
45
• Apply a response-surface method – combined Monte Carlo sampling – to quantify major risk features, events, processes (FEPs)
• Example: Delineate the spatiotemporal responses (such as injection-induced pressure buildup and associated AOR) due to the CO2 injection
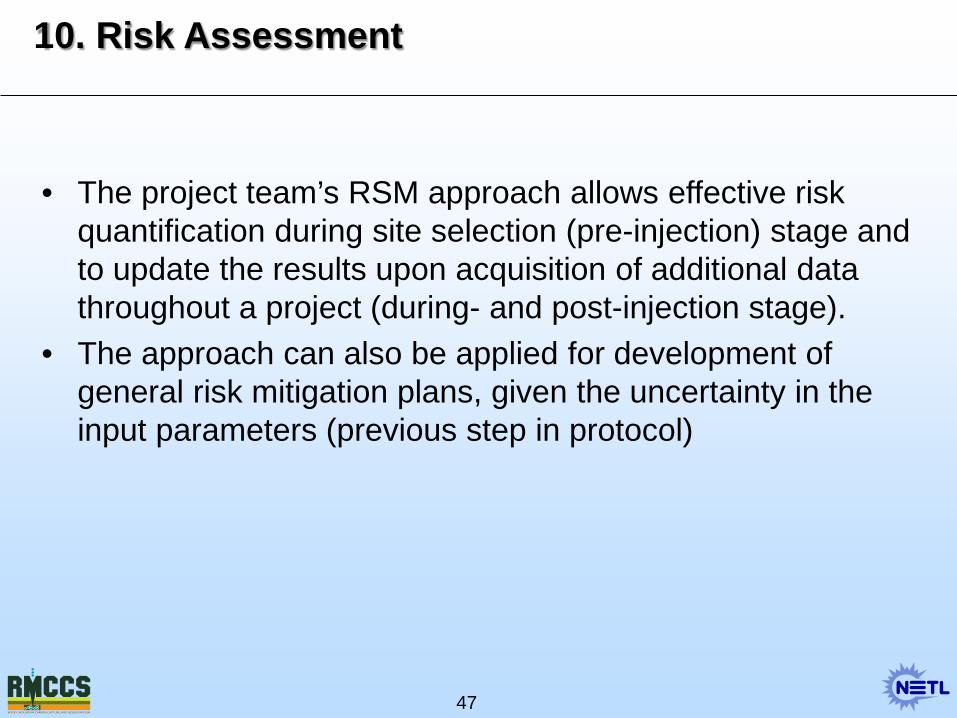
• The project team’s RSM approach allows effective risk quantification during site selection (pre-injection) stage and to update the results upon acquisition of additional data throughout a project (during- and post-injection stage).
• The approach can also be applied for development of general risk mitigation plans, given the uncertainty in the input parameters (previous step in protocol)
10. Risk Assessment
• Developed probability distributions that characterize uncertainty of specific risks events;
• Shown below are CDFs for the AOR and pressure build-up south of the injection well
CDF: Pressure build-up @ 500 m south of inj. well CDF: Area of Review (ft2)
Tim
e (y
rs)
Area (ft2)
10. Risk Assessment: Example of Results
49
Presentation Outline
• Program Benefits • Project / Program Goals • Technical Status: Finalizing 10-Point
Protocol for CO2 Storage Site Characterization
• Key Accomplishments • Summary
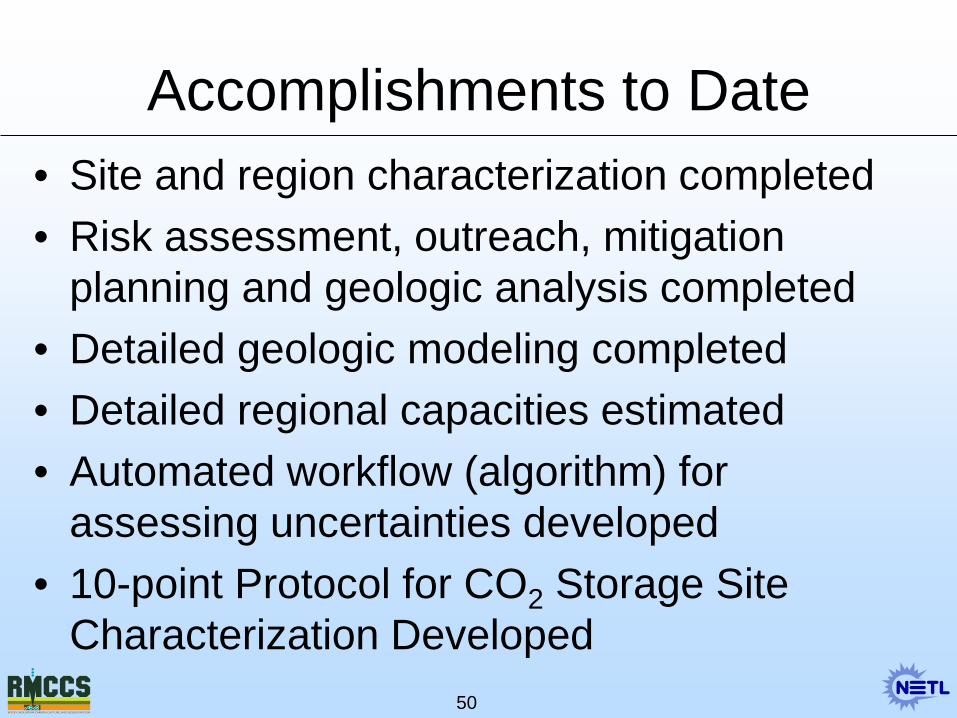
Accomplishments to Date • Site and region characterization completed • Risk assessment, outreach, mitigation
planning and geologic analysis completed • Detailed geologic modeling completed • Detailed regional capacities estimated • Automated workflow (algorithm) for
assessing uncertainties developed • 10-point Protocol for CO2 Storage Site
Characterization Developed 50
51
Presentation Outline
• Program Benefits • Project / Program Goals • Technical Status: Finalizing 10-Point
Protocol for CO2 Storage Site Characterization
• Key Accomplishments • Summary
Summary
– Key Findings: a 10-Point Protocol for Site Characterization
– Primary Lesson Learned: Uncertainty and project risk both depend data density and quality
– Future Plans: deliver the formal 10-point protocol to NETL in October
52
Appendix – These slides will not be discussed during the
presentation, but are mandatory
53
54
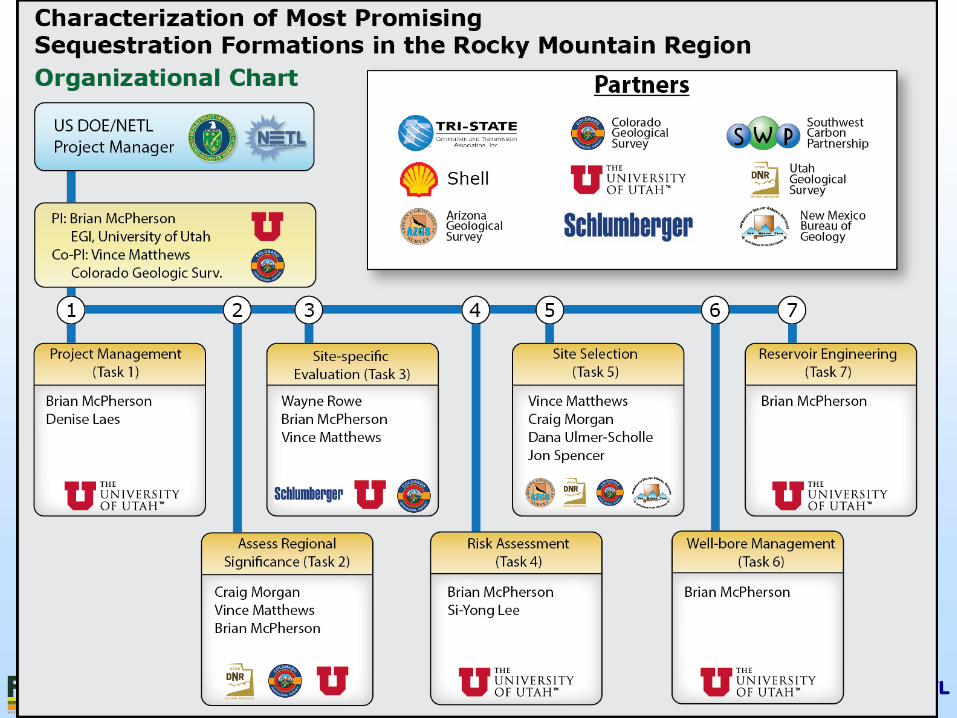
Organization Chart
Bibliography Selected references (additional references are pending publication): • Harston, W.A., and Morris, T.A., 2013, Facies analysis of the Permian White Rim Sandstone, Black Box
Dolomite, and Black Dragon Member of the Triassic Moenkopi Formation for CO2 Sequestration at Woodside field, San Rafael Swell, Utah, Part I, in Morris, T.H., and Ressetar, R., editors, The San Rafael Swell and Henry Mountains basin—geologic centerpiece of Utah: Utah Geological Association Publication 42, in press.
• Morgan, C.D., Carney, S., Nielsen, P., 2013, Recent characterization of Gordon Creek, Farnham Dome, and Woodside fields, Carbon and Emery Counties, Utah, in Morris, T.H., and Ressetar, R., editors, The San Rafael Swell and Henry Mountains basin—geologic centerpiece of Utah: Utah Geological Association Publication 42, in press.
• Morgan, C.D., and Waanders, G., 2013, Paleozoic correlations in the northern San Rafael Swell area, Carbon and Emery Counties, Utah, in Morris, T.H., and Ressetar, R., editors, The San Rafael Swell and Henry Mountains basin—geologic centerpiece of Utah: Utah Geological Association Publication 42, in press.
• Morgan, C.D., and Waanders, G., 2013, Paleozoic correlations in the northern San Rafael Swell area, Carbon and Emery Counties, Utah, [abs]. American Association of Petroleum Geologist Rocky Mountain Section program with abstracts.
• Nielsen, P., Carney, S., and Morgan, C., 2012, Geologic and structural controls for the CO2 sequestration potential of the Permian Cutler Group White Rim and De Chelly Sandstones in southeastern, Utah [abs.]: American Association of Petroleum Geologists Rocky Mountain Section program with abstracts, p.49.
• Morgan, C., Carney, S., and Nelsen, P., 2012, Gordon Creek field, Carbon County Utah: Methane, CO2 and potential carbon storage unit [abs.]: American Association of Petroleum Geologists Rocky Mountain Section program with abstracts, p.29.