1
Date: 11/20/2012
Analyst Name: Ryan Ellingsen
CIF Stock Recommendation Report (Fall 2012)
Company Name and Ticker: Dr Pepper Snapple Group, Inc. (DPS)
Section (A) Summary
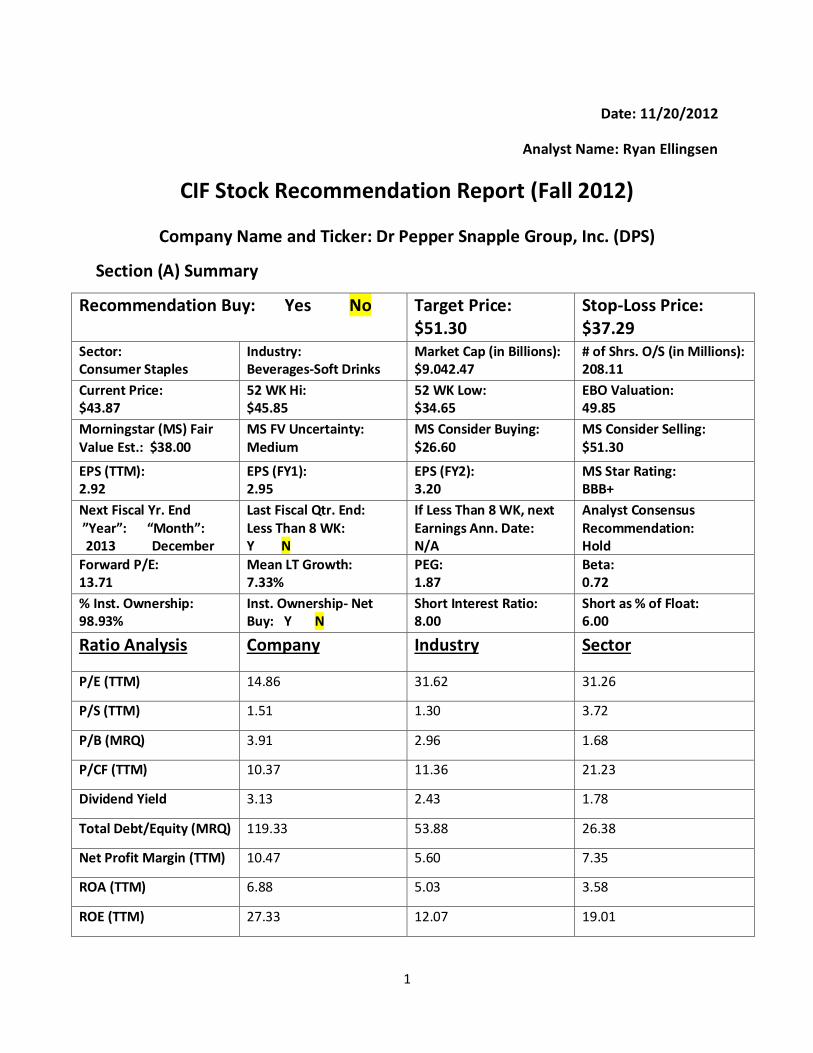
Recommendation Buy: Yes No Target Price: $51.30
Stop-Loss Price: $37.29
Sector: Consumer Staples
Industry: Beverages-Soft Drinks
Market Cap (in Billions): $9.042.47
# of Shrs. O/S (in Millions): 208.11
Current Price: $43.87
52 WK Hi: $45.85
52 WK Low: $34.65
EBO Valuation: 49.85
Morningstar (MS) Fair Value Est.: $38.00
MS FV Uncertainty: Medium
MS Consider Buying: $26.60
MS Consider Selling: $51.30
EPS (TTM): 2.92
EPS (FY1): 2.95
EPS (FY2): 3.20
MS Star Rating: BBB+
Next Fiscal Yr. End ”Year”: “Month”: 2013 December
Last Fiscal Qtr. End: Less Than 8 WK: Y N
If Less Than 8 WK, next Earnings Ann. Date: N/A
Analyst Consensus Recommendation: Hold
Forward P/E: 13.71
Mean LT Growth: 7.33%
PEG: 1.87
Beta: 0.72
% Inst. Ownership: 98.93%
Inst. Ownership- Net Buy: Y N
Short Interest Ratio: 8.00
Short as % of Float: 6.00
Ratio Analysis Company Industry Sector
P/E (TTM) 14.86 31.62 31.26
P/S (TTM) 1.51 1.30 3.72
P/B (MRQ) 3.91 2.96 1.68
P/CF (TTM) 10.37 11.36 21.23
Dividend Yield 3.13 2.43 1.78
Total Debt/Equity (MRQ) 119.33 53.88 26.38
Net Profit Margin (TTM) 10.47 5.60 7.35
ROA (TTM) 6.88 5.03 3.58
ROE (TTM) 27.33 12.07 19.01
2
Investment Thesis Overall, Dr Pepper Snapple Group is a very strong stock with some very attractive ratios. Their P/E, P/S, and P/S being low compared to their industry and sector shows that the stock could be undervalued and therefore an attractive stock. On top of that, their high dividend yields, net profit margin, ROA, and ROE in comparison to their industry and sector also show that the company is profitable and will produce good returns. On top of these ratios, they also are managed well, maintain a strong portfolio of brands that are number one or two in their categories, and Morningstar bulls have said that it has untapped growth potential that they have been investing heavily to increase their coverage. However, my recommendation for Dr Pepper Snapple Group is to not buy for many reasons. My first reason is that they had pretty disappointing third quarter performance numbers and a very high debt/equity ratio which concerns me if they can manage this debt financing. Another big reason is that they really lack geographic diversity especially in comparison with Coca-Cola and PepsiCo, which in turn is why Morningstar gave them a relatively high risk rating. I also was alarmed by the fact there was not a convincing consensus by analysts recommendations, and the majority said to hold rather than buy or outperform. Last but not least, many Morningstar analysts said that if you were an investor trying to gain entryway to the soft-drink industry, they recommended that Coca-Cola and PepsiCo would be better options, two that we have already analyzed and do not have holdings in.
Summary Provide brief summary of your analysis in each section that follows
Company Profile: Dr Pepper Snapple Group is a beverage manufacturer and distributor based in North America. Their primary competitors include PepsiCo & Coca-Cola, their cycle is in the mature stage and they are non-cyclical in nature.
Fundamental Valuation: The EBO valuation yielded an implied price of $49.85 with an abnormal growth rate of 7 years.
Relative Valuation: In terms of key metrics in comparison to their competitors, Dr Pepper Snapple Group had the lowest forward P/E, P/S, P/B, and P/CF, with also second lowest PEG ratio.
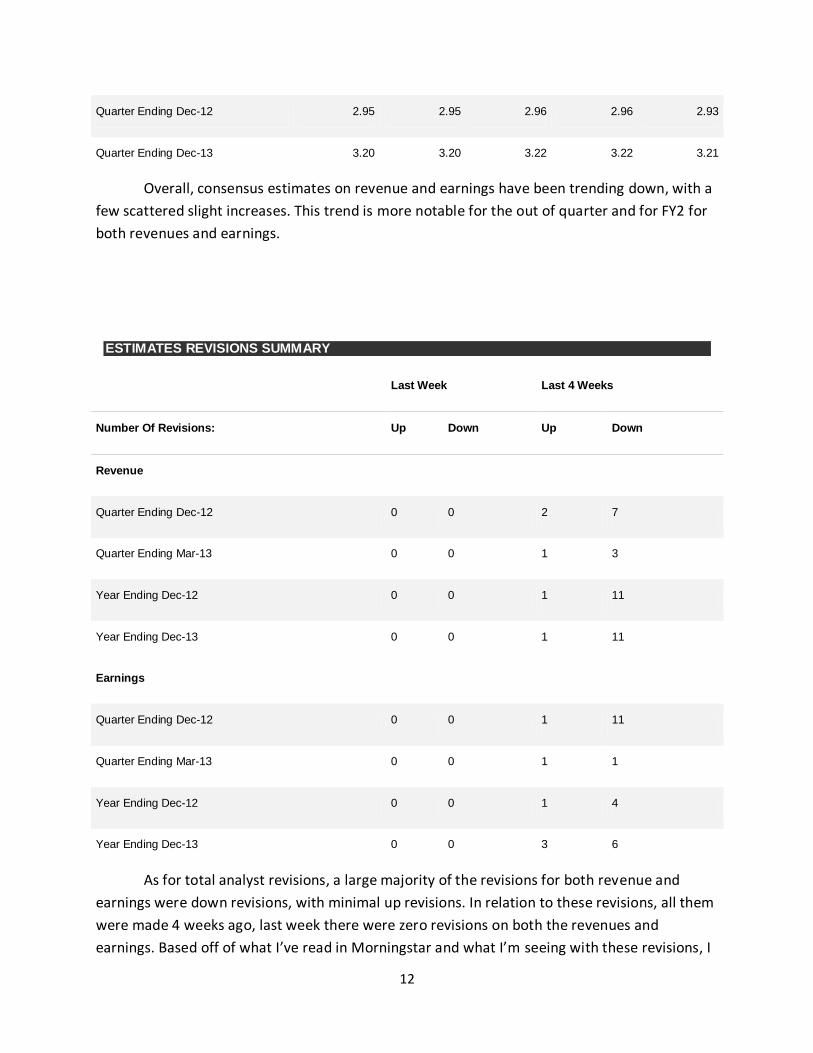
Revenue and Earnings Estimates: There was not really any visible pattern in terms of historical surprises, however for consensus estimates on revenues and earnings, they have been trending down
Analyst Recommendations: In almost all sources, there was a consensus hold recommendation, however, there was relatively large dispersion between the buy, outperform, and underperform option.
Institutional Ownership: Institutional ownership is currently at 98.93%, with 17.4% of shares outstanding belonging to four institutions each with a stake of over 5% in Dr Pepper Snapple Group
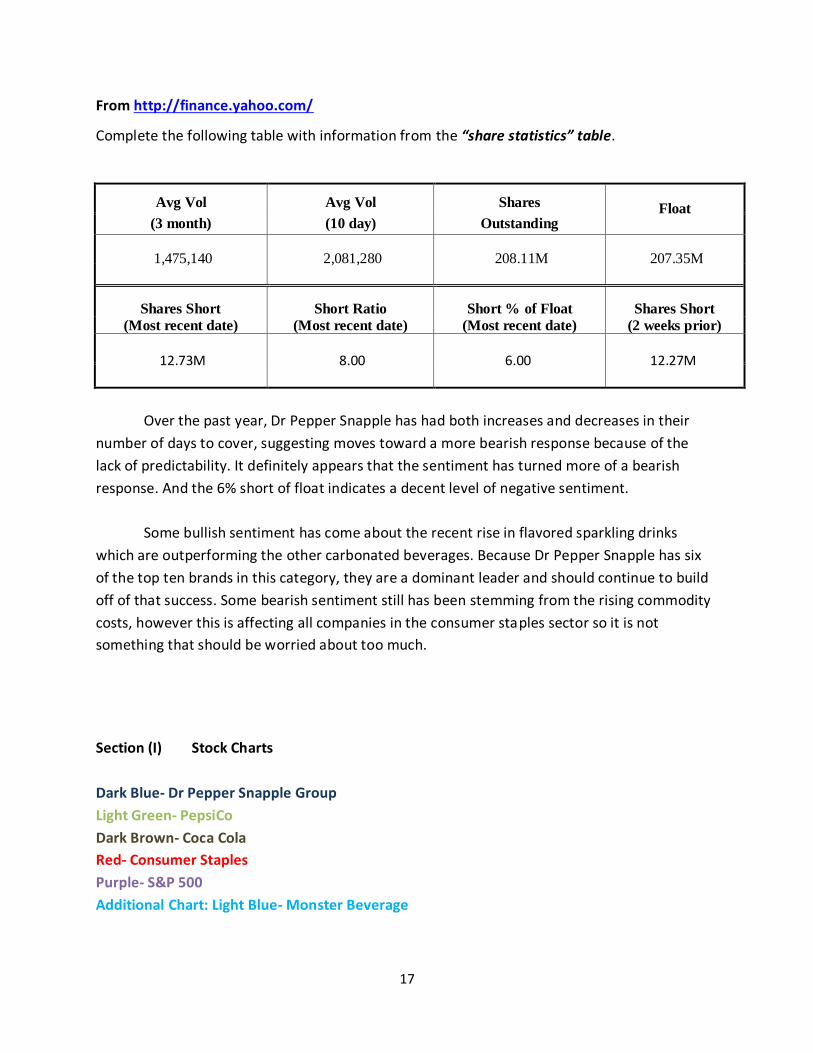
Short Interest: Short interest is on the relatively high side at a short ratio of 8.00, and has continued to trend upwards in the recent months
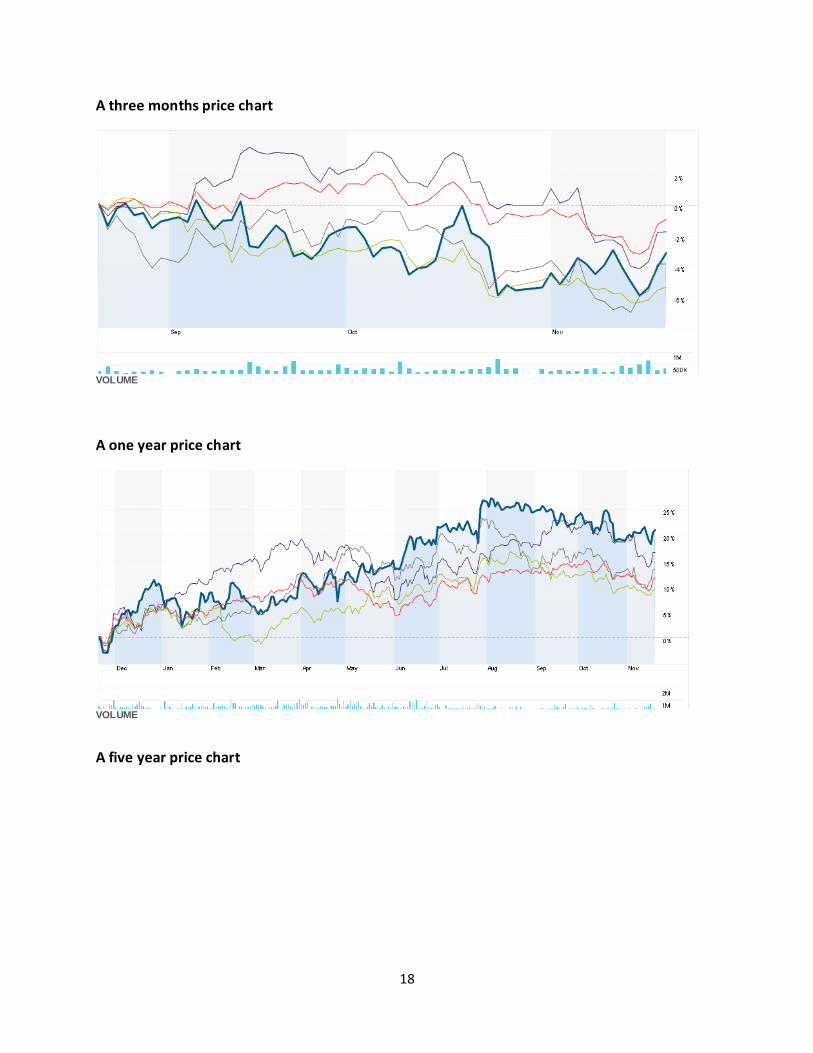
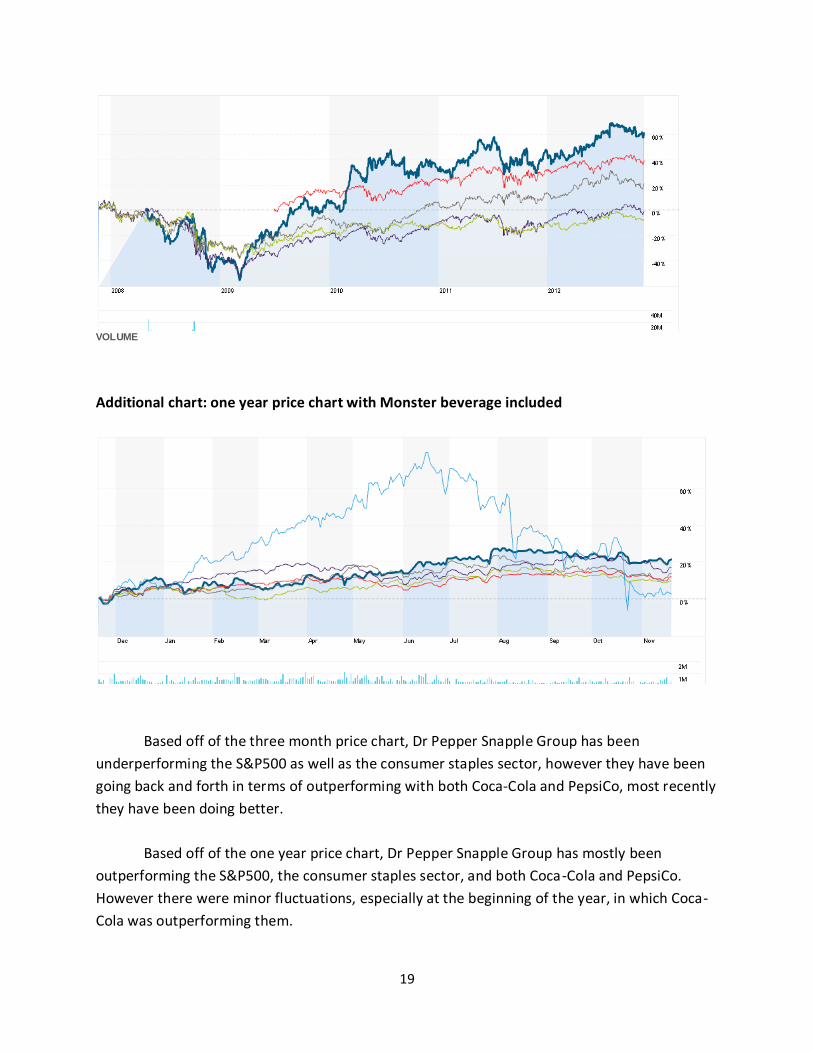
Stock Price Chart: In comparison with their main competitors, the S&P500, and consumer staples sector, they have been outperforming in the one and five year price charts, but in the three month have been underperforming.
3
Section (B) Company Profile (two pages maximum)
Company Summary
Dr Pepper Snapple Group, Inc. is non-alcoholic beverage manufacturer and distributor
based out of Plano, Texas. They operate in the U.S., Canada, and Mexico and have a large range
of beverages from flavored carbonated soft drinks as well as non-carbonated beverages like
juices, mixers, and readymade teas. Their company is broken down into three segments, the
Packaged Beverages, their Beverage Concentrates, and their Latin America Beverages. Some
examples of their beverage concentrates that are used to for beverage retailers include their
popular brands Dr Pepper, Sunkist, 7UP, A&W, Canada Dry, Crush, Squirt, and Schweppes.
Examples of their packaged beverages and Latin American beverages include Hawaiian Punch,
Snapple, Mott’s Yoo-Hoo, Clamato, AriZona, FIJI as well as the brands in the beverage
concentrate section.
As for the breakdown in revenues and earnings, roughly 93% of Dr Pepper Snapple
Groups revenue came from developed markets in the U.S. and Canada while the remaining 7%
came from Mexico and the Caribbean. Therefore in comparison to some of their big
competitors like Coca-Cola and PepsiCo, they are lacking in being geographically diverse. They
also don’t operate in many other industries which also puts them at a disadvantage in
comparison with Coca-Cola and PepsiCo which have focused on branching out to other
industries in recent years.
Business Model, Competition, Environment and Strategy
Dr Pepper Snapple Group’s two major competitors are Coca-Cola and PepsiCo, however
they also compete with companies like Monster Energy, Nestle, and Kraft Foods Inc. One way
they’ve managed to differentiate themselves from the competition is that they have been able
to gain control of brands that are either number one or number two within their category and
taken advantage of unique flavors not touched by many competitors. On top of that, they have
been outperforming in the diet line extensions as well as they own six of the top ten brands in
4
the flavored sparkling drinks section, a part of the carbonated beverage industry that has grown
significantly the past decade with rising health conscious consumers.
Dr Pepper Snapple Group is currently in the mature stage of its life cycle, like many
consumer staples especially in the drinks industry. Many beverage companies like Dr Pepper
Snapple have been around for hundreds of years and are already well established, therefore
they may see rapid growth at their beginning stages, however it has now slowed down quite a
bit and they rely on their strong well-established brand equity for future sales. The beverage
industry is not cyclical, therefore they are a very defensive company and don’t alter much by
season. However, in times of drought or economic hardship, their commodity costs may raise
which may take a toll on the company’s finances, so therefore there are circumstances where
they could be affected by economic and natural disasters. On top of that, the potential for
greater government regulation of beverages could influence their company’s strategy and how
they operate.
Revenue and Earnings History
REVENUE
Periods 2010 2011 2012
March 1248.0 1331.0 1362.0
June 1519.0 1582.0 1621.0
September 1457.0 1529.0 1528.0
December 1412.0 1461.0
Note: Units in Millions of U.S. Dollars
TOTALS: 5636 5903 4511
EARNINGS PER SHARE
Periods 2010 2011 2012
5
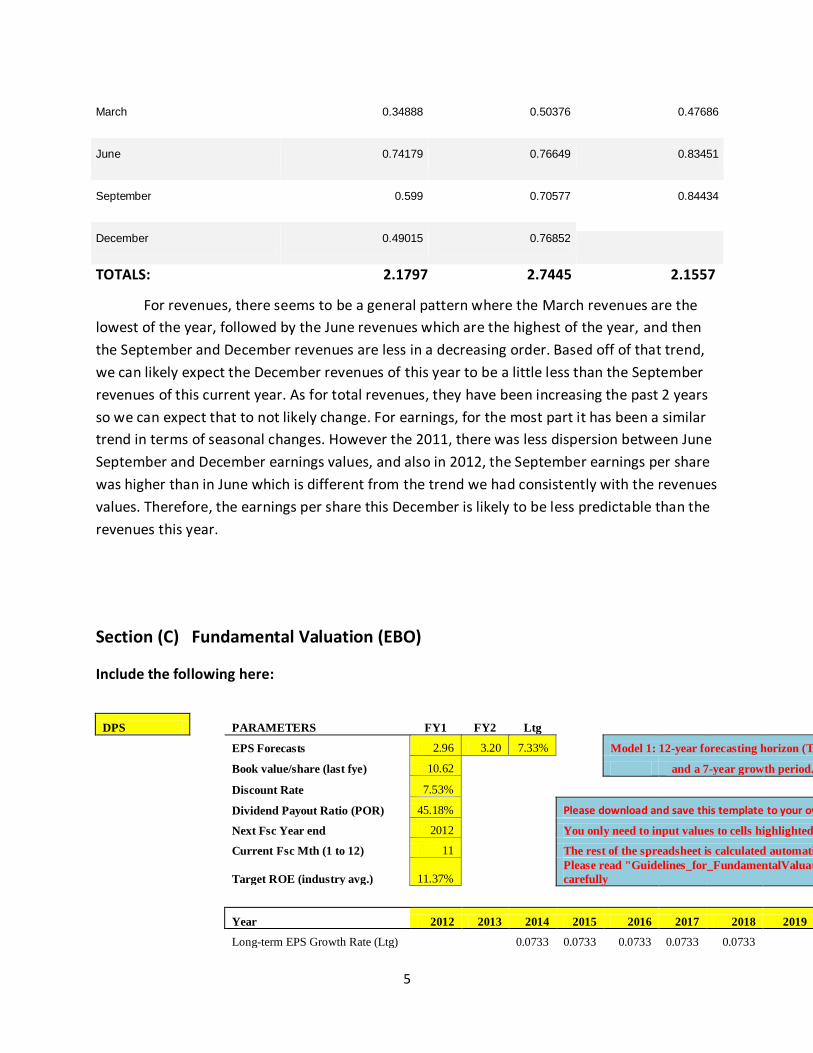
March 0.34888 0.50376 0.47686
June 0.74179 0.76649 0.83451
September 0.599 0.70577 0.84434
December 0.49015 0.76852
TOTALS: 2.1797 2.7445 2.1557
For revenues, there seems to be a general pattern where the March revenues are the
lowest of the year, followed by the June revenues which are the highest of the year, and then
the September and December revenues are less in a decreasing order. Based off of that trend,
we can likely expect the December revenues of this year to be a little less than the September
revenues of this current year. As for total revenues, they have been increasing the past 2 years
so we can expect that to not likely change. For earnings, for the most part it has been a similar
trend in terms of seasonal changes. However the 2011, there was less dispersion between June
September and December earnings values, and also in 2012, the September earnings per share
was higher than in June which is different from the trend we had consistently with the revenues
values. Therefore, the earnings per share this December is likely to be less predictable than the
revenues this year.
Section (C) Fundamental Valuation (EBO)
Include the following here:
DPS
PARAMETERS FY1 FY2 Ltg
EPS Forecasts 2.96 3.20 7.33%
Model 1: 12-year forecasting horizon (T=12).
Book value/share (last fye) 10.62
and a 7-year growth period.
Discount Rate 7.53%
Dividend Payout Ratio (POR) 45.18%
Please download and save this template to your own storage device
Next Fsc Year end 2012
You only need to input values to cells highlighted in "yellow"
Current Fsc Mth (1 to 12) 11
The rest of the spreadsheet is calculated automatically
Target ROE (industry avg.) 11.37%
Please read "Guidelines_for_FundamentalValuation_ProfLee_Spreadsheet" file
carefully
Year 2012 2013 2014 2015 2016 2017 2018 2019 2020 2021 2022 2023
Long-term EPS Growth Rate (Ltg)
0.0733 0.0733 0.0733 0.0733 0.0733
6
Forecasted EPS 2.96 3.20 3.44 3.69 3.96 4.25 4.56
Beg. of year BV/Shr 10.618 12.239 13.994 15.877 17.899 20.068 22.397
Implied ROE
0.262 0.246 0.232 0.221 0.212 0.204
ROE
(Beg. ROE, from EPS forecasts) 0.278 0.262 0.246 0.232 0.221 0.212 0.204 0.186 0.168 0.150 0.132 0.114
Abnormal ROE
(ROE-k) 0.203 0.186 0.170 0.157 0.146 0.136 0.128 0.110 0.092 0.074 0.056 0.038
growth rate for B
(1-POR)*(ROEt-1) 0.000 0.153 0.143 0.135 0.127 0.121 0.116 0.112 0.102 0.092 0.082 0.072
Compounded growth
1.000 1.153 1.318 1.495 1.686 1.890 2.109 2.345 2.583 2.821 3.052 3.272
growth*AROE
0.203 0.215 0.224 0.235 0.246 0.258 0.271 0.259 0.238 0.210 0.172 0.126
required rate (k)
0.075 0.075 0.075 0.075 0.075 0.075 0.075 0.075 0.075 0.075 0.075 0.075 0.075
Compound discount rate 1.075 1.156 1.243 1.337 1.438 1.546 1.662 1.788 1.922 2.067 2.223 2.390
div. payout rate (k)
0.452
Add to P/B
PV(growth*AROE) 0.19 0.19 0.18 0.18 0.17 0.17 0.16 0.14 0.12 0.10 0.08 0.05
Cum P/B
1.19 1.37 1.55 1.73 1.90 2.07 2.23 2.38 2.50 2.60 2.68 2.73
Add: Perpetuity beyond current
yr
(Assume this yr's AROE forever) 2.51 2.46 2.40 2.33 2.27 2.21 2.16 1.92 1.65 1.35 1.03 0.70
Total P/B
(P/B if we stop est. this period) 3.70 3.84 3.95 4.06 4.17 4.28 4.39 4.30 4.15 3.95 3.71 3.43
Implied price 41.97 43.58 44.84 46.09 47.35 48.60 49.85 48.76 47.07 44.81 42.06 38.92
Check:
Beg. BV/Shr
10.62 12.24 13.99 15.88 17.90 20.07 22.40 24.90 27.43 29.95 32.41 34.75
Implied EPS
2.96 3.20 3.44 3.69 3.96 4.25 4.56 4.62 4.60 4.48 4.27 3.95
Implied EPS
growth
0.083 0.073 0.073 0.073 0.073 0.073 0.013 -0.005 -0.025 -0.048
-
0.074
Inputs (provide below input values used in your analysis)
EPS forecasts (FY1 & FY2): ___2.96 & 3.20________
Long-term growth rate: _______7.33%________
Book value /share (along with book value and number of shares outstanding):
Book value: ________2263________
# of shares outstanding: _______213.13________
Book value / share: ________10.62_________
Dividend payout ratio: ________45.18_________
Next fiscal year end: _______2012___________
Current fiscal month: _________11___________
7
Target ROE: ________11.37%________
Output
Above normal growth period chosen: ________7 years__________
EBO valuation (Implied price from the spreadsheet): ______49.85_________
Sensitivity Analysis
EBO valuation would be (you can include more than one scenario in each of the following):
____48.76______ if changing above normal growth period to ____8 years______
_____51.25______ if changing growth rate from mean (consensus) to the highest estimate
______8.00%____
______48.76_________ if changing growth rate from mean (consensus) to the lowest estimate
______6.80%____
_____46.45______ if changing discount rate to ______8%______
____49.85_______if changing target ROE to _____12%_______
Section (D) Relative Valuation
DPS
Mean FY2
Earnings
Estimate Forward
Mean
LT PEG P/B ROE Value P/S P/CF
Ticker Name Mkt Cap Current
Price (next fiscal
year) P/E Growth
Rate (MRQ) 5 yr ave Ratio TTM TTM
1 KO Coca-Cola $ 167,027.41 $ 37.25
$ 2.19 17.01 8.16% 2.08 5.03 31.88% 0.16 3.51 54
2 PEP PepsiCo $ 106,392.60 $ 68.91 $
4.41 15.63 6.18% 2.53 4.95 34.38% 0.14 1.62 12.31
3 MNST Monster $ 7,751.06 $ 44.91 $
2.33 19.27 19.00% 1.01 8.71 33.56% 0.26 3.88 21.73
DPS
Dr Pepper Snapple $ 9,042.47 $43.87
$ 3.20 13.71 7.33% 1.87 3.91 11.69% 0.33 1.51 10.37
Implied Price based on: P/E PEG P/B Value P/S P/CF
1 KO Coca-Cola
$54.43
$48.89 $56.44
$20.69 $101.98 $228.45
2 PEP PepsiCo
$50.00
$59.31 $55.54
$18.88 $47.07 $52.08
3 MNST Monster
$61.68
$23.80 $97.73
$34.04 $112.73 $91.93
High $61.68 $59.31 $97.73 $34.04 $112.73 $228.45
Low
$50.00
$23.80 $55.54
$18.88 $47.07 $52.08
Median $54.43 $48.89 $56.44 $20.69 $101.98 $91.93
8
From the top panel
Dr Pepper Snapple Group’s multiples in comparison to their competitors varied across
the board, however they tended to be lowest in many key metrics. Their forward P/E ratio was
the lowest in comparison with their competitors implying that earnings are expected to grow.
For PEG, this value was lower than that of both PepsiCo and Coca-Cola showing that it’s a less
expensive stock with higher earnings and growth which is good; however it was higher than
Monster. As for P/B (MRQ), Dr Pepper Snapple was also the lowest, signaling that its book value
is larger in comparison to its price showing that it may be undervalued. For P/S (TTM), they
were also the lowest, which is also good because it shows that they have large sales growth in
comparison with price. Finally, their P/CF (TTM) was also lowest, which says they have great
cash flows in comparison to their price. Based off of these low key metrics in the relative
valuation, it appears that Dr Pepper Snapple could be quite undervalued, therefore being of
great value for its price. I chose to only compare them to three companies in this analysis
because I thought there were no other competitors that were quite comparable to Dr Pepper
Snapple’s product line and corporate structure. Their current price compared to Morningstar’s
fair value is high, however it is closer to its 52 week high than its low.
From the bottom panel
The implied prices vary pretty widely here from one another, which I attributed to
growth rates of the companies. Monster definitely was the outlier from the rest in many
metrics, particularly implied prices based on PEG and P/B which was significantly lower based
on PEG and significantly higher based on P/B. Another outlier was their implied price based on
P/CF of Coca-Cola, it was nearly double to triple what it was based on Monster & PepsiCo’s
P/CF. As a whole the implied prices based on Coca-Cola and PepsiCo’s various metrics were very
similar which I think is due to Coca-Cola and PepsiCo being the most similar to each other in
terms of market cap and overall structure. Of all the valuation tools used for my stock, I think
that the P/E is most useful because its valuation of the company’s current share price compared
to its per-share earnings, meaning that if it’s lower then it’s a more attractive security. Dividend
payout is also huge with companies in the consumer staples sector because if you have a higher
ratio, then that means that the company pays more in dividends and therefore less of its
earnings into the company which is good for investors.
9
Section (E) Revenue and Earnings Estimates
HISTORICAL SURPRISES
Sales and Profit Figures in US Dollar (USD)
Earnings and Dividend Figures in US Dollar (USD)
Estimates vs Actual Estimate Actual Difference Surprise %
SALES (in millions)
Quarter Ending Sep-12 1,562.78 1,528.00 34.78 -2.23
Quarter Ending Jun-12 1,627.37 1,621.00 6.37 -0.39
Quarter Ending Mar-12 1,358.25 1,362.00 3.75 +0.28
Quarter Ending Dec-11 1,447.06 1,461.00 13.94 +0.96
Quarter Ending Sep-11 1,530.82 1,529.00 1.82 -0.12
Earnings (per share)
Quarter Ending Sep-12 0.77 0.79 0.02 +2.49
Quarter Ending Jun-12 0.82 0.85 0.03 +3.85
Quarter Ending Mar-12 0.48 0.46 0.02 -3.54
Quarter Ending Dec-11 0.74 0.82 0.08 +10.13
Quarter Ending Sep-11 0.70 0.71 0.01 +0.85
In terms of their historical surprises for sales and earnings, I did not really see any visible
patterns; there were both positive and negative surprises for both earnings and sales. In
general, the earnings per share had less dispersion of positive and negative surprises, with only
one negative surprise and the rest positive surprises. Of the ten comparisons, the actual total
was that there were 6 positive surprises and 4 negative surprises, although none of these
appeared to be too drastic besides the quarter ending Dec-11 earnings per share being a
positive 10% surprise. This is not too shocking though considering that fact that surprises as a
whole were more notable in the earnings per share. In terms of stock price, the price did
appear to jump with the positive surprises, especially the positive 10% surprise which would
make sense because the earnings per share was much higher than expected.
10
CONSENSUS ESTIMATES ANALYSIS
Sales and Profit Figures in US Dollar (USD) Earnings and Dividend Figures in US Dollar (USD)
# of Estimates Mean High Low 1 Year
Ago
SALES (in millions)
Quarter Ending Dec-12 10 1,500.01 1,517.00 1,476.20 1,512.24
Quarter Ending Mar-13 5 1,391.02 1,403.00 1,370.51 1,420.11
Year Ending Dec-12 13 6,012.15 6,079.00 5,979.79 6,081.53
Year Ending Dec-13 13 6,183.34 6,317.00 6,098.88 6,297.60
Earnings (per share)
Quarter Ending Dec-12 13 0.85 0.88 0.84 0.80
Quarter Ending Mar-13 7 0.51 0.54 0.48 0.58
Year Ending Dec-12 14 2.95 2.98 2.94 2.93
Year Ending Dec-13 14 3.20 3.30 3.10 3.21
LT Growth Rate (%) 3 7.33 8.00 6.80 8.95
1. % Difference of High from Mean
Sales Quarter Ending: Dec 12- 1.1%, Mar 13- 0.86%
Sales Year Ending: Dec 12- 1.11% , Dec 13-2.16%
Earnings Quarter Ending: Dec 12- 3.53%, Mar 13- 5.88%
11
Earnings Year Ending: Dec 12-1.02% , Dec 13-9.14%
2. % Difference of Low from Mean
Sales Quarter Ending: Dec 12- -1.59% , Mar 13- -1.47%
Sales Year Ending: Dec 12- -0.54% , Dec 13- -1.37%
Earnings Quarter Ending: Dec 12- -1.18%, Mar 13- -5.88%
Earnings Year Ending: Dec 12- -0.34% , Dec 13- -3.13%
3. For sales, the divergence is more notable current quarter, and for FY2. For the earnings per
share, the divergence is more notable for the out of quarter and FY2.
4. The number of analysts providing LT growth rates is much lower than the number of analysts
providing revenue and earnings estimates.
CONSENSUS ESTIMATES TREND
Sales and Profit Figures in US Dollar (USD)
Earnings and Dividend Figures in US Dollar (USD)
Current 1 Week
Ago 1 Month
Ago 2 Month
Ago 1 Year
Ago
SALES (in millions)
Quarter Ending Dec-12 1,500.01 1,500.01 1,507.86 1,510.10 1,512.24
Quarter Ending Mar-13 1,391.02 1,391.02 1,398.67 1,398.36 1,420.11
Year Ending Dec-12 6,012.15 6,012.15 6,063.82 6,066.91 6,081.53
Year Ending Dec-13 6,183.34 6,183.34 6,250.19 6,251.95 6,297.60
Earnings (per share)
Quarter Ending Dec-12 0.85 0.85 0.88 0.88 0.80
Quarter Ending Mar-13 0.51 0.51 0.51 0.51 0.58
12
Quarter Ending Dec-12 2.95 2.95 2.96 2.96 2.93
Quarter Ending Dec-13 3.20 3.20 3.22 3.22 3.21
Overall, consensus estimates on revenue and earnings have been trending down, with a
few scattered slight increases. This trend is more notable for the out of quarter and for FY2 for
both revenues and earnings.
ESTIMATES REVISIONS SUMMARY
Last Week Last 4 Weeks
Number Of Revisions: Up Down Up Down
Revenue
Quarter Ending Dec-12 0 0 2 7
Quarter Ending Mar-13 0 0 1 3
Year Ending Dec-12 0 0 1 11
Year Ending Dec-13 0 0 1 11
Earnings
Quarter Ending Dec-12 0 0 1 11
Quarter Ending Mar-13 0 0 1 1
Year Ending Dec-12 0 0 1 4
Year Ending Dec-13 0 0 3 6
As for total analyst revisions, a large majority of the revisions for both revenue and
earnings were down revisions, with minimal up revisions. In relation to these revisions, all them
were made 4 weeks ago, last week there were zero revisions on both the revenues and
earnings. Based off of what I’ve read in Morningstar and what I’m seeing with these revisions, I
13
don’t believe that they will beat analyst consensus estimate based off of their poor third
quarter results as well as their medium default risk. They also are not very geographically
diversified which is something that I know PepsiCo and Coca-Cola are both taking advantage of
right now.
Section (F) Analysts’ Recommendations
ANALYST RECOMMENDATIONS AND REVISIONS
1-5 Linear Scale Current 1 Month
Ago 2 Month
Ago 3 Month
Ago
(1) BUY 3 3 3 3
(2) OUTPERFORM 2 2 2 2
(3) HOLD 8 8 8 8
(4) UNDERPERFORM 2 2 2 2
(5) SELL 0 0 0 0
No Opinion 0 0 0 0
Mean Rating 2.60 2.60 2.60 2.60
Over the last three months, there hasn’t been a single change of analysts of opinions.
Their current mean rating is 2.60, which signals a very slightly bullish opinion. Hold has the
current majority at 8 total recommendations, however buy, outperform, and underperform all
have 2 to 3 recommendations which gives me kind of a bearish perspective on the stock with
very close numbers all across the spectrum of options. Based off of Morningstar’s analyst
reports, Reuters results are pretty consistent with, there are both many bullish and bearish
opinions which gives me doubts on whether the stock could potentially be too risky.
14
Section (G) Institutional Ownership
DPS
Ownership Activity # of Holders % Beg. Holders Shares % Shares
Shares Outstanding
208,110,989 100.00%
# of Holders/Tot Shares Held 561 100.90% 205,884,201 98.93%
# New Positions 48 8.63%
# Closed Positions 43 7.73%
# Increased Positions 225 40.47%
# Decreased Positions 231 41.55%
Beg. Total Inst. Positions 556 100.00% 207,341,883 99.63%
# Net Buyers/3 Mo. Net Chg -6 49.34% -1,457,682 -0.70%
Ownership Information %
Outstanding
Top 10 Institutions % Ownership 47.50%
Mutual Fund % Ownership 1.74%
Float % 99.93%
> 5% Ownership
Holder Name
% Outstanding Report Date
Fidelity Management & Research Company 8.7 9/30/2012
Morgan Stanley Investment Management Ltd. (UK)
6.4 9/30/2012
Cedar Rock Capital Ltd. 6.4 9/30/2012
Vanguard Group, Inc. 5.9 9/30/2012
15
On a net basis, there has been a decrease in net buyers of about 6 buyers, accounting
for a 0.70% change in shares since March. This could indicate a move towards a bearish
attitude; however analysts have continued to take a hold standpoint on Dr Pepper Snapple
Group. There are four institutions that make up the owners with more than a 5% stake in the
company, them being Fidelity Management & Research Company, Morgan Stanley Investment
Management Ltd., Cedar Rock Capital Ltd., and Vanguard Group, Inc. Together, they make up
about 17.4% of shares outstanding. Overall, institutional ownership above 5% does not appear
to have a large impact on Dr Pepper Snapple Group, even though there are relatively a large
amount of holders.
Section (H) Short Interest (two pages)
From http://www.nasdaq.com/ (NASDAQ’s website)
17
From http://finance.yahoo.com/
Complete the following table with information from the “share statistics” table.
Avg Vol Avg Vol Shares Float (3 month) (10 day) Outstanding
1,475,140 2,081,280 208.11M 207.35M
Shares Short Short Ratio Short % of Float Shares Short
(Most recent date) (Most recent date) (Most recent date) (2 weeks prior)
12.73M 8.00 6.00 12.27M
Over the past year, Dr Pepper Snapple has had both increases and decreases in their
number of days to cover, suggesting moves toward a more bearish response because of the
lack of predictability. It definitely appears that the sentiment has turned more of a bearish
response. And the 6% short of float indicates a decent level of negative sentiment.
Some bullish sentiment has come about the recent rise in flavored sparkling drinks
which are outperforming the other carbonated beverages. Because Dr Pepper Snapple has six
of the top ten brands in this category, they are a dominant leader and should continue to build
off of that success. Some bearish sentiment still has been stemming from the rising commodity
costs, however this is affecting all companies in the consumer staples sector so it is not
something that should be worried about too much.
Section (I) Stock Charts
Dark Blue- Dr Pepper Snapple Group
Light Green- PepsiCo
Dark Brown- Coca Cola
Red- Consumer Staples
Purple- S&P 500
Additional Chart: Light Blue- Monster Beverage
19
VOLUME
Additional chart: one year price chart with Monster beverage included
Based off of the three month price chart, Dr Pepper Snapple Group has been
underperforming the S&P500 as well as the consumer staples sector, however they have been
going back and forth in terms of outperforming with both Coca-Cola and PepsiCo, most recently
they have been doing better.
Based off of the one year price chart, Dr Pepper Snapple Group has mostly been
outperforming the S&P500, the consumer staples sector, and both Coca-Cola and PepsiCo.
However there were minor fluctuations, especially at the beginning of the year, in which Coca-
Cola was outperforming them.
20
Based off of the five year chart, its apparent that Dr Pepper Snapple Group has
noticeably been outperforming the S&P500, the consumer staples sector and it’s competitors,
which I believe is highly attributed to their high growth rates over this period.
Another additional chart I chose to use was the one year price chart with another
competitor Monster included. I found that when I initially included them in all three charts, the
graphs were much skewed and misleading which I believe is apparent in this chart. This is
largely due to their overly large growth over the past year, so much that I believe it is at an
unsustainable rate which is why in the past few months (as apparent in the graph) they have
been outperformed by their competitors, the S&P500, and the consumer staples sector. Also
they have received some recent negative publicity regarding their caffeine toxicity in their
energy drinks.