1 Date: April 12 th , 2014 Analyst Name: Trevor Russell CIF Stock Recommendation Report (Spring 2014) Company Name and Ticker: CVS Caremark Corporation (CVS) Section (A) Investment Summary Recommendation Buy: Yes No Target Price: $83.47 (15%) Stop-Loss Price: $63.87 (12%) Sector: Consumer Staples Industry: Retail Staples Sub: Pharmacies and Drug Stores Market Cap (in Billions): 86.5 # of Shrs. O/S (in Millions): 1180.0 Current Price: $72.58 52 WK Hi: $76.36 52 WK Low: $55.21 EBO Valuation: $73.07 Morningstar (MS) Fair Value Est.: $68.00 MS FV Uncertainty: Medium MS Consider Buying: $47.60 MS Consider Selling: $91.80 EPS (TTM): 3.76 EPS (FY1): 4.47 EPS (FY2): 5.02 MS Star Rating: 3 Stars Next Fiscal Yr. End ”Year”: 2014 “Month”: 4 Last Fiscal Qtr. End: Dec 31 st , 2014 Less Than 8 WK: Y N If Less Than 8 WK, next Earnings Ann. Date: Analyst Consensus Recommendation: Reuters 1.81 Forward P/E: 14.58 Mean LT Growth: 13.61% PEG: 1.07 Beta: 0.89 % Inst. Ownership: 88.72% Inst. Ownership- Net Buy: Y N Short Interest Ratio: 2.40 Short as % of Float: N/A Ratio Analysis Company Industry Sector P/E (TTM) 19.66 17.26 33.71 P/S (TTM) 0.69 0.39 4.92 P/B (MRQ) 2.30 1.91 31.36 P/CF (TTM) 13.56 9.89 21.17 Dividend Yield 1.49 1.30 2.50 Total Debt/Equity (MRQ) 35.33 17.99 31.03 Net Profit Margin (TTM) 3.63 2.19 13.70 ROA (TTM) 6.68 4.79 31.23 ROE (TTM) 12.17 11.37 84.49
Transcript
1
Date: April 12th, 2014 Analyst Name: Trevor Russell
CIF Stock Recommendation Report (Spring 2014) Company Name and Ticker: CVS Caremark Corporation (CVS)
Section (A) Investment Summary Recommendation Buy: Yes No Target Price:
$83.47 (15%) Stop-Loss Price: $63.87 (12%)
Sector: Consumer Staples Industry: Retail Staples Sub: Pharmacies and Drug Stores
Market Cap (in Billions): 86.5
# of Shrs. O/S (in Millions): 1180.0
Current Price: $72.58 52 WK Hi: $76.36
52 WK Low: $55.21 EBO Valuation: $73.07
Morningstar (MS) Fair Value Est.: $68.00
MS FV Uncertainty: Medium
MS Consider Buying: $47.60
MS Consider Selling: $91.80
EPS (TTM): 3.76 EPS (FY1): 4.47 EPS (FY2): 5.02 MS Star Rating: 3 Stars
Next Fiscal Yr. End ”Year”: 2014 “Month”: 4
Last Fiscal Qtr. End: Dec 31st, 2014 Less Than 8 WK: Y N
If Less Than 8 WK, next Earnings Ann. Date:
Analyst Consensus Recommendation: Reuters 1.81
Forward P/E: 14.58 Mean LT Growth: 13.61%
PEG: 1.07 Beta: 0.89
% Inst. Ownership: 88.72%
Inst. Ownership- Net Buy: Y N
Short Interest Ratio: 2.40 Short as % of Float: N/A
Ratio Analysis Company Industry Sector
P/E (TTM) 19.66 17.26 33.71
P/S (TTM) 0.69 0.39 4.92
P/B (MRQ) 2.30 1.91 31.36
P/CF (TTM) 13.56 9.89 21.17
Dividend Yield 1.49 1.30 2.50
Total Debt/Equity (MRQ) 35.33 17.99 31.03
Net Profit Margin (TTM) 3.63 2.19 13.70
ROA (TTM) 6.68 4.79 31.23
ROE (TTM) 12.17 11.37 84.49
2
Investment Thesis Based off of the analysis of CVS Caremark, I am recommending a buy.
Consistently beating the estimates for both revenues and earnings.
Meeting and exceeding goals while always pushing to better enhance pharmacy and health of customers.
Very positive analyst ratings and recommendations.
Affordable Care Act with high smoking premiums will help off-set no tobacco sales.
Dominant force in their respective industry.
Price charts and moving average charts show great history.
Summary Provide brief summary of your analysis in each section that follows
Company Profile: CVS Caremark is a retailer and health care company that operates through 3 primary segments and vertically integrates its operations as the line between the 2 main segments are blurred.
Fundamental Valuation: 7-year growth plan puts the price at $73.07, below what the stock is currently trading at. Adjusting beta was able to get much higher numbers, as CVS is a “consumer staple.”
Relative Valuation: With CVS’s forward P/E ratio calculated to 14.58, lower than their current P/E ratio (TTM) of 19.32, it can be a good indicator that earnings will grow in the future. Good looking PEG and P/B.
Revenue and Earnings Estimates: The past 4 quarters shows CVS beating all of their revenue and earnings estimates. The last 4 weeks also shows multiple upwards revisions with none going down.
Analyst Recommendations: Reuters mean rating of 1.81 shows strong analyst believe in a buy and outperform. Morningstar rating of 4.0 (5=buy, 1=sell) lands exactly on outperform.
Institutional Ownership: 88.72% of stock is held by institutional ownership. Recently there haven’t really been any big increases or decreases in positions. Major holders seem to be selling off more than buying.
Short Interest: CVS has all of their shares outstanding as float and available for trading. Their days to cover seems to have recently peaked and is going down slightly.
Stock Price Chart: Very strong stock prices showing CVS beating the S&P500 and XLP through all 3 time frames. 6-month moving showing golden cross mid-February and maintaining and short-term constantly above in 2-year.
3
Section (B) Company Profile (B-1) Profile Company Description: CVS Caremark Corporation is a retailer and health care company that has operations primarily in the United States, with small operations in the District of Columbia, Puerto Rico, and Brazil. They provide pharmacy services through their more than 7,000 CVS Pharmacy and Longs Drugs (name only in Hawaii) stores. They are focused on giving greater access to care, lowering the overall costs for of health care plans for members and payers, and overall improving the health outcomes of their customers. In 2013, CVS filled 734 million retail prescriptions, approximately 21% of the U.S. retail pharmacy market (10-k). Major Business Units and Revenue Breakdown: CVS Caremark has 3 operating segments and a Corporate Segment: CVS Retail Pharmacy, CVS Caremark Pharmacy Services, and MinuteClinic. CVS Retail Pharmacy: one of nation’s largest retail pharmacy chains with ~7,660 stores nation-wide, of which ~7,603 operated a pharmacy as of December 31, 2013 with over 40 years in the business. All of this leads the Pharmacy to account for 69.5% of net revenues (10-K). CVS Pharmacy Services: Provides full range of pharmacy benefit management services to their clients consisting primarily of employers, insurance companies, unions, government employee groups, managed care organizations, and other sponsors of health benefit plans. This boils down to providing comprehensive prescription benefit management services to over 2,000 health plans. They operate 25 retail specialty pharmacy stores, 11 specialty mail order pharmacies and four mail service dispensing pharmacies. Minute Clinic: The Nation’s largest walk-in clinic which is a division of CVS that are open 7 days a week, specialize in family health care for common family illnesses, minor wounds, and common vaccinations, and accepts most insurance plans. This is not a reportable segment currently. Business Model and Strategy: CVS is unique as its operations are integrated vertically as it processes claims as an independent PBM while it also runs one of the largest retail pharmacy chains. The role of their retail pharmacist is shifting from mainly only dispensing prescriptions to also providing services such as vaccinations and face-to-face patient counseling. Their services segment is striving towards more innovative pharmaceutical solutions and better client services in order to better enhance the clinical outcomes for the members of the clients health benefit plans (10-k). Competition and Competitors: The main competitor who most resembles CVS is Walgreen Co. (WAG). When looking at the Consumer Staples sector as an index, CVS weighs in for ~5.52% of the whole and WAG accounts for 3.73%. When it comes to the retail segment of what CVS does, another listed competitor is Wal-Mart, who is a powerhouse. These two don’t compete head to head as much as CVS and Walgreen might. Morningstar lists Walgreen Company as the only true peer to CVS Caremark,
4
as the next closest competitor they list is Shanghai Pharmaceuticals Holding CO Ltd, which has a market cap roughly $80,000 million less than CVS. CVS say that the retail pharmacy business is highly competitive and they compete mainly on store location and convenience, customer service and satisfaction, product selection and variety, and price (10-k). Sensitivity to Business Cycle and Macro Environment: As a part of the consumer staples sector this company has lower sensitivity than other companies but definitely a high sensitivity than those in their industry and segment as a whole. Their beta resides at .89 while their industry and sector both show betas of .58 (Reuters). Since CVS deals with so many drugs they can be affected by government regulations and the FDA. Something that seems to be very positive is that the Affordable Care Act now seems to be CVS’ best chance to grow its business (Moore). Merger/Acquisition/Joint Ventures CVS has not been actively involved in any mergers or acquisitions of late, with the most recent of note being back in 2008 when they acquired Longs Drugs Stores Corp. in a $2.9 billion deal. This drug store operated ~521 stores in the Western United States with 41 of these operating in Hawaii, the only state which retained the name of the store for recognition purposes since CVS did not previously operate in Hawaii. Pending Litigation There were 11 items listed on CVS’ most current 10-k. Of them, 2 are already settled and 1 has a payment of a $20 million civil penalty due to public disclosures in 2009 regarding transactions during the purchase of Longs Drug Stores which has been accounted for on the books. The remaining litigation are currently being dealt with and CVS is cooperating and providing all necessary documents. Risk Factors:
1. The health of the economy in general and the markets CVS serves 2. The possibility of PBM client loss and/or failure to win new PBM business 3. Risks of declining gross margins in the PBM industry 4. Possible change in industry pricing benchmarks 5. Extremely competitive business environment
These are only 5 of the ~13 listed risk factors on CVS’ most recent 10-k report. Developments: Something major that happened is that back in February 2014 CVS announced that they would stop selling tobacco products in all of their ~7,600 stores across the United States. They have predicted that they will lose ~$2 billion in annual revenues but the company believes that while they won’t be able to recoup all of those revenues, they will be able to hold their earnings consistent. Less than a week after the announcement, its stock began to rise again. One other major factor that will affecting the industry is the Affordable Care Act (Obamacare). Since its plan to get as many people as possible that are eligible to get health insurance covered
5
and it will charge as much as 50% higher premiums to people who smoke compared who don’t smoke, the decision doesn’t look as crazy. CVS is aiming their sights on new profits from public exchanges and from the Affordable Care Act. CVS has also promised to spend $6 billion of their $40 billion cash to buy back its own stock in order to raise its share price (Moore). (B-2) Revenue and Earnings History (Refer to the guidelines document for revenue and earnings data to be included)
Since 2011 CVS’ revenues and earnings per share have a pretty consistent upward trend, with only Quarter 1 of 2013 showing a very slight decrease in year-over-year revenue. Besides that, revenue along with earnings-per-share and dividends have been up year-over-year since 2011 across the board. It seems that over the past 3 years the revenue has seemed to have its greatest growth from Q-3 to Q-4. (B-3) Most Recent Quarterly Earnings Release
1) When was the company’s most recent earning release? CVS’s most recent earnings release was on February 11th, 2014 for the fiscal quarter ending December 31st, 2013.
2) In that earnings report, was reported revenue a (1) beat, (2) match, or (3) miss from consensus estimate? Revenues beat the estimates with $32.8 billion actual compared to Thompson Reuters consensus estimates of $32.67 billion
3) Likewise, was reported earnings a (1) beat, (2) match, or (3) miss from consensus estimate? Reported earnings also beat estimates with $1.12 actual compared to $1.11 estimated.
4) What did the management attribute the beat/miss to Management mainly attributed the slight beating of the estimates mainly to drug cost inflation, a few new products, and the new clients they were able to obtain through the quarter.
5) Did the management provide guidance about their current quarter and their outlook for the year? What were the key points of the guidance? Their 2014 guidance estimates were based on the assumption of the completion of $4.0 billion in share repurchases.
6) How did the stock react to that earnings release? The day after the release the stock dropped ~$0.20 and then had steady growth until March 26th, 2014 peaking at $76.36.
7
Section (C) Fundamental Valuation (EBO) Include the following here: Copy/paste completed Fundamental Valuation (EBO) Spreadsheet
Inputs (provide below input values used in your analysis) EPS forecasts (FY1 & FY2): _______4.47 and 5.02______________ Long-term growth rate: _______13.61%______________ *** Indicate next to the number if you made an adjustment to the consensus LTG estimate. Justify at the bottom of this panel how you derive the adjusted value, if any *** Book value /share (along with book value and number of shares outstanding): Book value: _______37938m______________ # of shares outstanding: _______1180m______________ Book value / share: _______32.151______________ Dividend payout ratio: _______23.67%_______________ Next fiscal year end: _______2014_______________ Current fiscal month: _______4_______________ Target ROE: _______8.33%_______________ *** Indicate next to the number if you made an adjustment to the target ROE estimate. Justify at the bottom of this panel how you derive the adjusted value, if any ***
Output Above normal growth period chosen: ______7 years_______________ *** Justify at the bottom of this panel your choice of abnormal growth period *** EBO valuation (Implied price from the spreadsheet): ______$73.07____________
1) Comment on the fundamental value obtained in relation to the stock’s current price and its 52-week price range.
2) What might be the “soft spots” of the inputs? And why? The EBO valuation shows a stock price of 51.99 for the end of the 2014 fiscal year. At the time of writing this CVS Caremark stock closed the day out at $73.18. This price is $3.18 under the 52-week high and the EBO valuation is $3.22 under the 52-week low. Despite the very low implied price, Morningstar analysts have continued to raise their fair value estimate $15 over the past year. CVS has shown very positive research growth and beat out estimates for the most recent quarter end. A growth period of 7 years because of the constant and growing need for pharmacies to provide the aging with medication and the new changes to health care looking positive for CVS even though the implied price for 2020 would then be $73.07. Something that I believe really affects these numbers is the beta. With the numbers that CVS shows in this spreadsheet, give them the industry and the sector beta of 0.58 and their implied prices skyrocket to a 2020 estimate of $99.17. I know that beta is formulaic and derived, but I believe the company has a structure for the future that should allow it to be less volatile. Sensitivity Analysis
1) Explain the input values used in sensitivity analysis. Compare the fundamental values obtained here in relation to the value from the base case
2) Other observations worth noting
EBO valuation would be (you can include more than one scenario in each of the following): _____$65.23__________ if changing above normal growth period to ___5 years__________ ______$77.38_________ if changing growth rate from mean (consensus) to the highest estimate ______15.00_________ ______$66.49_________ if changing growth rate from mean (consensus) to the lowest estimate ______11.35_________ ______$99.58_________ if changing discount rate to ____7%__________ ______$73.07_________if changing target ROE to ____10.30%___________
9
Section (D) Relative Valuation Copy/paste your completed relative valuation spreadsheet here
When looking at Wal-Mart Stores, Inc. (WMT), Walgreen Company (WAG), Express Scripts Holding Company (ESRX), GNC Holdings Inc (GNC), and CVS Caremark Corporation (CVS), their numbers and valuations are in line and comparable to the rest of the industry for the most part, and nothing was omitted or cast aside. The highest of the forward P/E ratios is WAG with 16.28 and lowest is GNC with 11.99, while CVS is sitting right at 14.58. Considering CVS’s estimated forward P/E (14.58) is lower than their current P/E ratio TTM (19.32), earnings can be expected to grow in the future. This is just one indicator and many other factors must be taken into consideration, but it is definitely a good sign and a good place to start.
P/S ratios (TTM) vary from GNC at 1.61 at the highest and WMT at 0.52 to be the lowest. CVS is sitting neatly near the middle of those two at 0.69, more towards the lower end. CVS’s price-to-sales ratio is above the industry average which is currently at 0.38 which might suggest slight overvaluation, but is tough since CVS is quite different than its competitors and could also suggest a premium valuation. This is much better looking than GNC’s ratio of 1.61, which much more strongly suggests overvaluation. Having a PEG ratio under 1 is always favorable because it can further show that a firm is undervalued. All companies in this valuation are either under that mark or very close to it besides WAG which is at 1.62 and CVS is at 1.07, close to the magic number. The Price/Cash Flow (TTM) is another tool to determine if a stock in undervalued or overvalued, but only in context with the rest of their ratios, numbers, and predicting values. Sometimes a higher than industry average P/CF ratio shows that a company is trading at a higher price than they are capable of cash flows sufficient to support the multiple. This is simply not the case with
10
CVS (13.33) as they generate cash flows in such large sums. It also doesn’t hurt that they beat the sector average (21.67) for P/CF by roughly 8.34%.
Once again having a low price-to-book ratio can provide knowledge that a stock in undervalued. CVS looked the best in this regard as their P/B ratio was down at 2.30 with the next closest being ESRX at 2.58 and GNC capping off the top at 5.19. According to Reuters the industry average is a mere 1.85 which does not make these stocks look the best, but should be taken lightly as the sector P/B ratio average is a massive 31.86. The average implied price when calculated off of the 4 company’s forward P/E ratio is $68.74, a mere $4.44 less than what CVS traded at the time of valuation (73.18). GNC gave a few implied prices that were astronomically higher than the rest of the group. Namely when based off of their price/book and price/sales which gave prices of $165.13 and $170.75, respectively. The only ratio that really gave inaccurately high estimates was the P/B ratio which had an average implied price of $111.68.
11
Section (E) Revenue and Earnings Estimates (E-1)
When looking at sales and earnings per-share, CVS has done well to beat the estimates, even if only by small amounts. None of the surprise %’s for sales are above 1.4%, but none of them are negative either, consistently beating out the estimates. The same goes for earnings as all of their actual numbers were better than the estimates except for the quarter ending dec-12. The estimate was 1.10 and actual was 0.97, resulting in -12.02% negative surprise. The % sounds great simply because the numbers are so small, and as the only negative surprise was for the end of 2012, I wouldn’t have it cause any alarm.
12
(E-2) Copy/paste “Consensus Estimates Analysis” Table from http://www.reuters.com/, “Analysts” tab (include both revenue and earnings)
The consensus estimates analysis table shows a very intense difference between the mean, high, and low for sales for the year ending Dec-2015. The estimate seems to be in close relation to the year ending Dec-2014, so there must be one estimate that is the very low number, since the mean is not dragged down very low below the high for the same time period. Sales: Quarter Ending Jun-14: High is 1.59% above the mean, low is 1.76% below the mean. Quarter Ending Sep-14: High is 1.08% above the mean, low is .81% below the mean. Year Ending Dec-14: High is .85% above the mean, low is .81% below the mean. Year Ending Dec-15: High is 7.5% above the mean, low is 50.31% below the mean. One of the estimates just has to be ridiculously low, why, I cannot say. It is for the year ending Dec-15, which is FY2, but that low estimate still seems insane. Earnings: Quarter Ending Jun-14: High is 2.75% above the mean, low is 3.67% below the mean. Quarter Ending Sep-14: High is 7.97% above the mean, low is 7.97% below the mean. Year Ending Dec-14: High is 1.34% above the mean, low is 1.12% below the mean. Year Ending Dec-15: High is 3.59% above the mean, low is 4.58% below the mean. Many less analysts providing estimates for LT Growth Rate % with only 6 compared to the average of 22.5 for the rest. LT Growth Rate (%): High is 10.21% above the mean, low is 16.61% below the mean.
(E-3) Copy/paste “Consensus Estimates Trend” Table from http://www.reuters.com/, “Analysts” tab (include both revenue and earnings)
When looking at the trends, it would be hard for CVS’s estimates to become any steadier from even 1 year ago. For both sales and earnings (per share), all numbers are slightly up from 1 year ago. The only slight hiccup seems to be from 2 months ago when sales for quarter ending sep-2014, year ending dec-2015, and earnings for quarter ending sep-14 and quarter ending dec-15 were estimated to be higher than the current estimations, but it is such a small difference that there is absolutely no worry to be found.
(E-4) Copy/paste the “Estimates Revisions Summary” Table from http://www.reuters.com/, “Analysts” tab (include both revenue and earnings)
During the last week and the last 4 weeks there have been no downwards revisions for either revenues or earnings, and 2 upward revisions, both for earnings. One is for the quarter ending September 2014 and the other is for the year ending December 2015. (E-5) “Consensus Earnings Revisions” from CNBC
The last reported earnings was on February 11th, 2014 for the quarter ending Dec-2013 and the next expected date to report earnings is on May 2nd, 2014 for the quarter ending Mar-2014. There were no consensus revisions reported on CNBC.com for the latest month on CVS Caremark.
Over the past three months the opinions of the analysts have changed very little. The current mean rating is at 1.81, showing that on average the analysts believe CVS is between (1) buy and (2) outperform, leaning more towards (2) outperform. The ratings for 1 month ago was also 1.81, 2 months ago was 1.86, and 3 months ago it was 1.78. 3 months ago was the best rating, jumping up (bad) by 0.08, but then dropping down by 0.05 the next month and then staying put. Current: Buy 11, Outperform 10, Hold 6, Underperform 0, Sell 0. 1 Month Ago: Buy 11, Outperform 10, Hold 6, Underperform 0, Sell 0. 2 Months Ago: Buy 11, Outperform 10, Hold 7, Underperform 0, Sell 0. 3 Months Ago: Buy 11, Outperform 11, Hold 5, Underperform 0, Sell 0.
Morningstar has an average analyst opinion rating for CVS of 4.0 (Buy=5, Sell=0). This average rating falls exactly on an outperform rating, showing positive ratings. There are 3 that are for a buy, 0 for outperform, and 3 for hold. There are none for underperform or sell. This lines up decently well with the analysts from Reuters, helping cement the idea that it is looking like a good time to buy.
(F-2) Most Recent One Month Analysts Upgrades/Downgrades from CNBC The last reported earnings was on February 11th, 2014 for the quarter ending Dec-2013 and the next expected date to report earnings is on May 2nd, 2014 for the quarter ending Mar-2014. Within the last month there were no analyst revisions for CVS Caremark. Because of this, there are no upgrades or downgrades to report, nor were there any clusters of changes.
Cougar Investment Fund Institutional Ownership Template
CVS
Ownership Activity # of Holders % Beg. Holders Shares %
Shares
Shares Outstanding 1,188,564,137 100.00%
# of Holders/Total Shares Held/% Shares 1,523 100.66% 1,025,968,563 86.32%
# New Positions 16 1.06%
# Closed Positions 6 0.40%
# Increased Positions 72 4.76%
# Decreased Positions 63 4.16%
Beg. Total Inst. Positions 1,513 100.00% 1,025,968,554 86.32%
# Net Buyers/3 Mo. Net Chg 9 53.33% 3,787,571 0.32%
Ownership Information %
Outstanding
% Institutional Ownership 88.72
Top 10 Institutions % Ownership 30.57%
Mutual Fund % Ownership 46.81%
5%/Insider Ownership 0.33%
Float % 100.00%
17
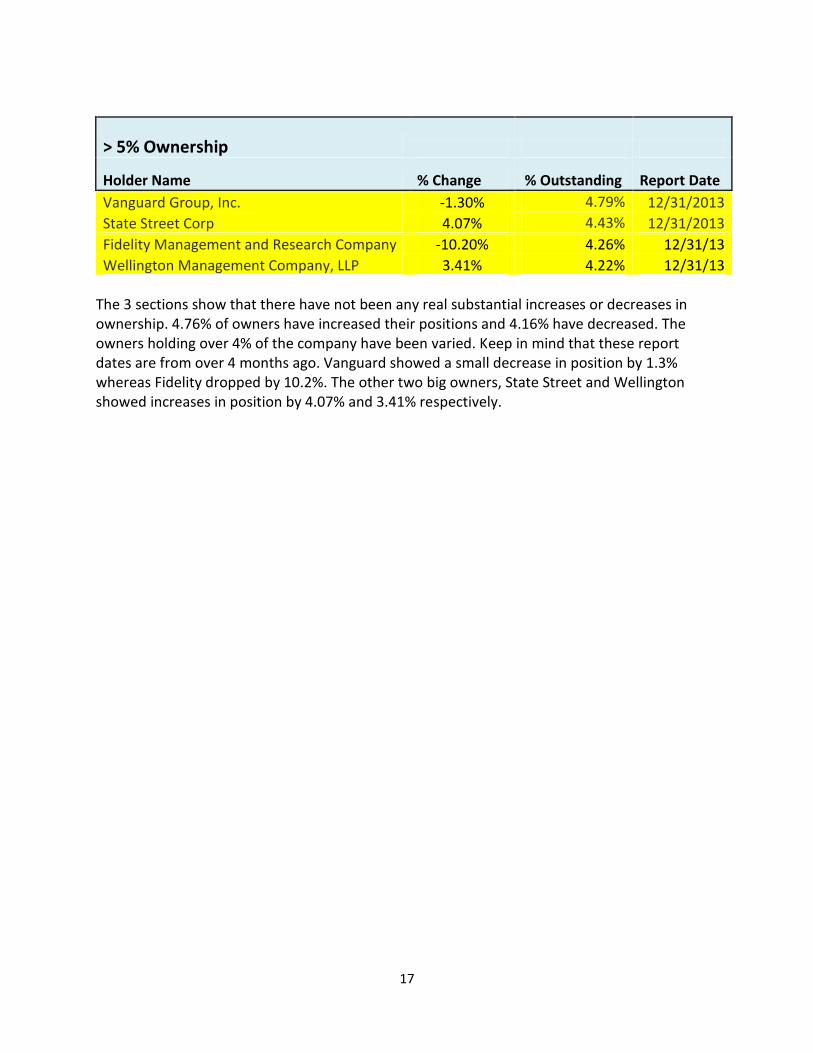
> 5% Ownership
Holder Name % Change % Outstanding Report Date
Vanguard Group, Inc. -1.30% 4.79% 12/31/2013
State Street Corp 4.07% 4.43% 12/31/2013
Fidelity Management and Research Company -10.20% 4.26% 12/31/13
Wellington Management Company, LLP 3.41% 4.22% 12/31/13 The 3 sections show that there have not been any real substantial increases or decreases in ownership. 4.76% of owners have increased their positions and 4.16% have decreased. The owners holding over 4% of the company have been varied. Keep in mind that these report dates are from over 4 months ago. Vanguard showed a small decrease in position by 1.3% whereas Fidelity dropped by 10.2%. The other two big owners, State Street and Wellington showed increases in position by 4.07% and 3.41% respectively.
18
Section (H) Short Interest (H-1) Short Interest Data from http://www.nasdaq.com/ (NASDAQ’s website) CVS Caremark
(H-2) Short Interest Data From http://finance.yahoo.com/ Copy/paste required data from the “share statistics” table to the following table for (1) your stock, and (2) two competitors (in separate tables). CVS Caremark
The last reported earnings was on February 11th, 2014 for the quarter ending Dec-2013 and the next expected date to report earnings is on May 2nd, 2014 for the quarter ending Mar-2014. Seems that CVS has all of the their shares outstanding as float and readily available for tradin.g For CVS the market sentiment based on short interest statistics has had its slight ups and downs in the most recent year according to NASDAQ’s short interest table. Days-to-cover stayed between about 1.68 and 3.7. The 3.7 came back in October of 2013. The most recent month seems to show days to cover peaking at 2.64 and has most recently dropped back down to 2.61 hopefully showing a good sign that it’s becoming more bullish than bearish (Fink). CVS’s days-to-cover is currently 2.61, therefor taking those who shorted the stock 2.61 days to close out their position if they wish when a stock price increase begins to happen. The short interest rate is low enough to indicate a bullish signal. The days to cover for WMT and GNC are 3.74 and 1.72 respectively. CVS is showing better than WMT when it comes to signals from these ratios, and GNC is looking surprisingly good. All of the ratios are low enough though that there isn’t much that can be differentiated from them alone.
23
Section (I) Stock Charts For (I-1) – (I-3), the stock price charts should include (1) your stock, (2) 1 competitor, (3) sector ETF, and (4) SP500 (I-1) 3 Month Price Chart
(I-2) 1 Year Price Chart
24
(I-3) 5 Year Price Chart
Looking back towards the beginning of 2014, CVS, WAG, S&P500, and XLP seemed to be right about even with each other finishing up January. Around February though, CVS and WAG took off upwards and hit the +5% quickly while WAG continued to grow until it peaked at about +14% at the beginning of March. WAG came back down to earth but it still right with CVS at about +6-7% growth. The 3-month chart shows roughly the same thing for the recent months with CVS and WAG spiking above the others, but looking a little bit farther back shows that WAG had good growth about mid-September, 2013 and continued to stay up there until it took a slight drop and CVS caught up in terms of growth around the beginning of December, 2013. When looking at the 1-year price chart, CVS is shown to have outperformed both WAG and the consumer staples sector since around the beginning of 2012. CVS was over and under the S&P500 in that same time frame and has been on top of it since late 2013. CVS has shown good, steady growth over the past 5 years with few times of substantial deceases.
25
(I-4) Technical Indicators (“Moving Average” and “Relative Strength Index” from http://finance.yahoo.com/) 6-Month Moving Average Price Chart
Looking at the 6-month moving average price chart it is visible that there has been a very, very slight downward trend in the last week or so of April. Mid to late February looked great as a golden cross occurred and has not come back down since. For the majority of the past 6 months the 10 day average has stayed above the 50 day average, showing very good signs for the company and how the market interprets it.
The 2-year moving average price chart shows the 50-day average staying above the 200-day average for the entirety of the chart. Going back even farther shows that the golden cross that started this run was back right at the end of 2011. With the averages from the 2-year, it doesn’t seem like there will be as death cross anytime soon.
RSI ratings for both the 6-month and 2-year charts are looking positive to the future performance of CVS. When the RSI approaches 70 it can mean that the stock might be overvalued and could be a good time to pull back. Whereas if the RSI is approaching 30, it can be a possible indicator that the stock is being oversold and can indicate that the stock may become undervalued in the short future. Both charts show that the RSI is right about 40 or perhaps just slightly below.