1 Date: 10/12/12 Analyst Name: Trevor Boren CIF Stock Recommendation Report (Fall 2012) Company Name and Ticker: PepsiCo Inc. PEP Section (A) Summary Recommendation Buy: Yes Target Price: $75.69 Stop-Loss Price: $62.00 Sector: Consumer Staples (XLP) Industry: Food and beverage industry Market Cap (in Billions): $109.390 # of Shrs. O/S (in Millions): 1,556.28 Current Price: $70.11 52 WK Hi: $73.66 52 WK Low: $61.50 EBO Valuation: $78.63 Morningstar (MS) Fair Value Est.: $72.00 MS FV Uncertainty: LOW MS Consider Buying: $57.60 MS Consider Selling: $90.00 EPS (TTM): 3.80 EPS (FY1): 4.06 EPS (FY2): 4.41 MS Star Rating: AA- Next Fiscal Yr. End ”Year”: 2012 “Month”: December Last Fiscal Qtr. End: Less Than 8 WK: N If Less Than 8 WK, next Earnings Ann. Date: Analyst Consensus Recommendation: Buy Forward P/E: 15.88 Mean LT Growth: 6.21 PEG: 3.68 Beta: 0.33 % Inst. Ownership: 67% Inst. Ownership- Net Buy: N Short Interest Ratio: 2.61 Short as % of Float: 0.75 Ratio Analysis Company Industry Sector P/E (TTM) 18.51 27.35 40.39 P/S (TTM) 1.64 1.38 3.66 P/B (MRQ) 5.32 3.05 2.05 P/CF (TTM) 12.44 22.23 23.11 Dividend Yield 3.06 2.57 1.71 Total Debt/Equity (MRQ) 138.50 60.51 23.45 Net Profit Margin (TTM) 9.08 5.72 7.62 ROA (TTM) 8.17 5.16 4.05 ROE (TTM) 22.98 12.45 12.31
Transcript
1
Date: 10/12/12
Analyst Name: Trevor Boren
CIF Stock Recommendation Report (Fall 2012)
Company Name and Ticker: PepsiCo Inc. PEP
Section (A) Summary
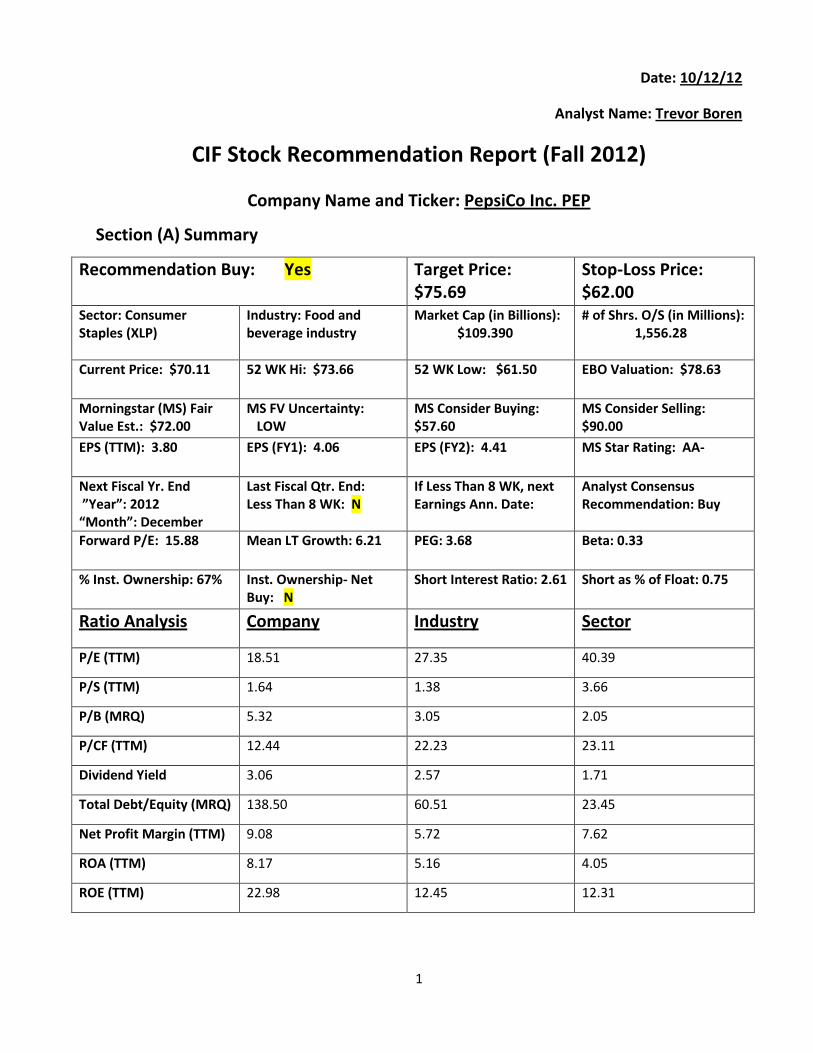
Recommendation Buy: Yes Target Price: $75.69
Stop-Loss Price: $62.00
Sector: Consumer Staples (XLP)
Industry: Food and beverage industry
Market Cap (in Billions): $109.390
# of Shrs. O/S (in Millions): 1,556.28
Current Price: $70.11
52 WK Hi: $73.66
52 WK Low: $61.50 EBO Valuation: $78.63
Morningstar (MS) Fair Value Est.: $72.00
MS FV Uncertainty: LOW
MS Consider Buying: $57.60
MS Consider Selling: $90.00
EPS (TTM): 3.80 EPS (FY1): 4.06 EPS (FY2): 4.41 MS Star Rating: AA-
Next Fiscal Yr. End ”Year”: 2012 “Month”: December
% Inst. Ownership: 67% Inst. Ownership- Net Buy: N
Short Interest Ratio: 2.61 Short as % of Float: 0.75
Ratio Analysis Company Industry Sector
P/E (TTM) 18.51 27.35 40.39
P/S (TTM) 1.64 1.38 3.66
P/B (MRQ) 5.32 3.05 2.05
P/CF (TTM) 12.44 22.23 23.11
Dividend Yield 3.06 2.57 1.71
Total Debt/Equity (MRQ) 138.50 60.51 23.45
Net Profit Margin (TTM) 9.08 5.72 7.62
ROA (TTM) 8.17 5.16 4.05
ROE (TTM) 22.98 12.45 12.31
2
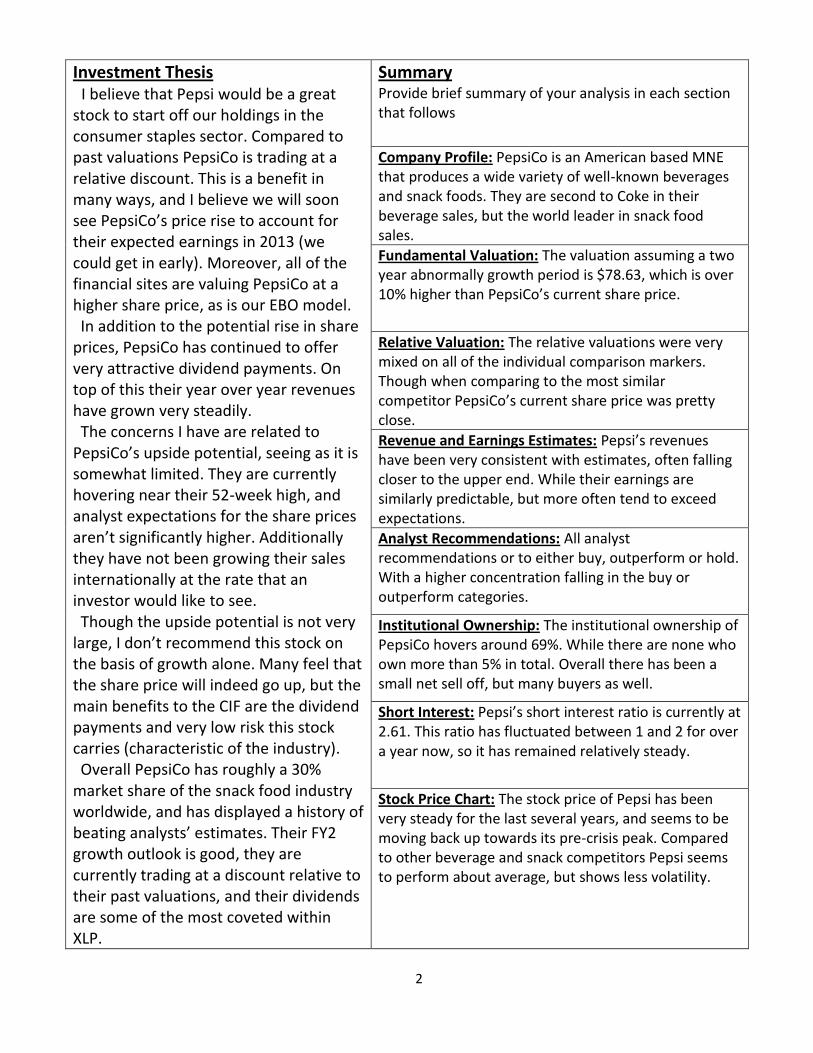
Investment Thesis I believe that Pepsi would be a great stock to start off our holdings in the consumer staples sector. Compared to past valuations PepsiCo is trading at a relative discount. This is a benefit in many ways, and I believe we will soon see PepsiCo’s price rise to account for their expected earnings in 2013 (we could get in early). Moreover, all of the financial sites are valuing PepsiCo at a higher share price, as is our EBO model. In addition to the potential rise in share prices, PepsiCo has continued to offer very attractive dividend payments. On top of this their year over year revenues have grown very steadily. The concerns I have are related to PepsiCo’s upside potential, seeing as it is somewhat limited. They are currently hovering near their 52-week high, and analyst expectations for the share prices aren’t significantly higher. Additionally they have not been growing their sales internationally at the rate that an investor would like to see. Though the upside potential is not very large, I don’t recommend this stock on the basis of growth alone. Many feel that the share price will indeed go up, but the main benefits to the CIF are the dividend payments and very low risk this stock carries (characteristic of the industry). Overall PepsiCo has roughly a 30% market share of the snack food industry worldwide, and has displayed a history of beating analysts’ estimates. Their FY2 growth outlook is good, they are currently trading at a discount relative to their past valuations, and their dividends are some of the most coveted within XLP.
Summary Provide brief summary of your analysis in each section that follows
Company Profile: PepsiCo is an American based MNE that produces a wide variety of well-known beverages and snack foods. They are second to Coke in their beverage sales, but the world leader in snack food sales.
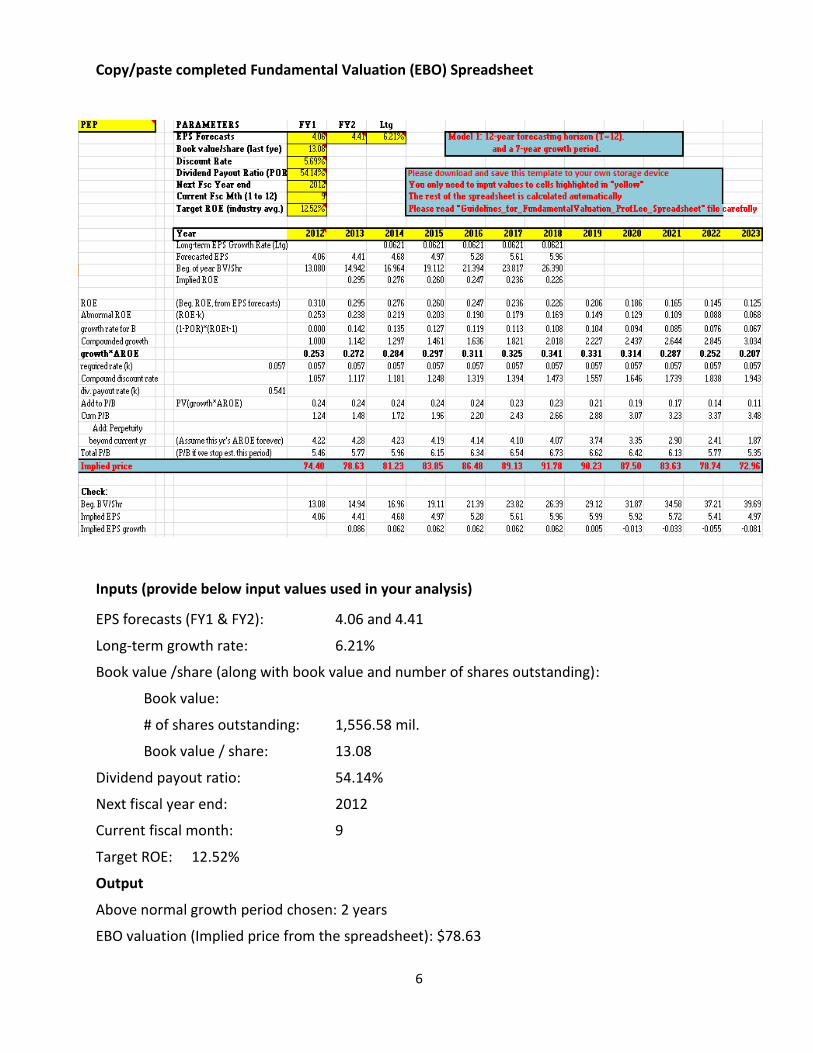
Fundamental Valuation: The valuation assuming a two year abnormally growth period is $78.63, which is over 10% higher than PepsiCo’s current share price.
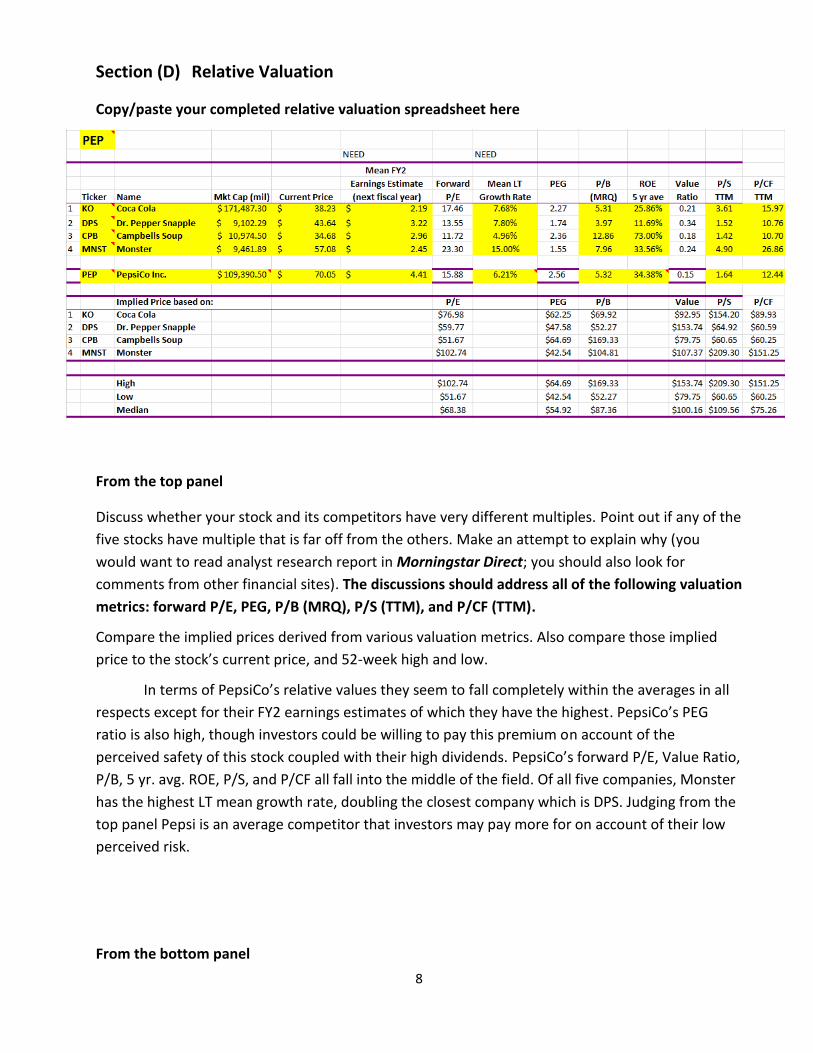
Relative Valuation: The relative valuations were very mixed on all of the individual comparison markers. Though when comparing to the most similar competitor PepsiCo’s current share price was pretty close.
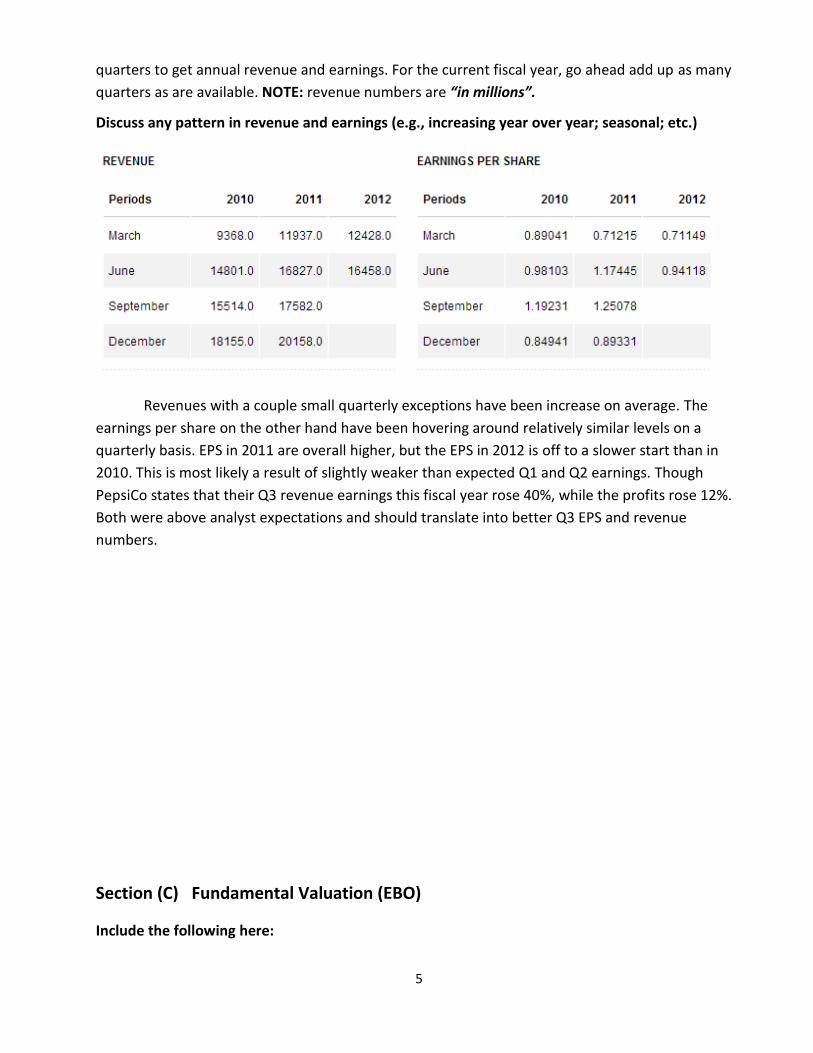
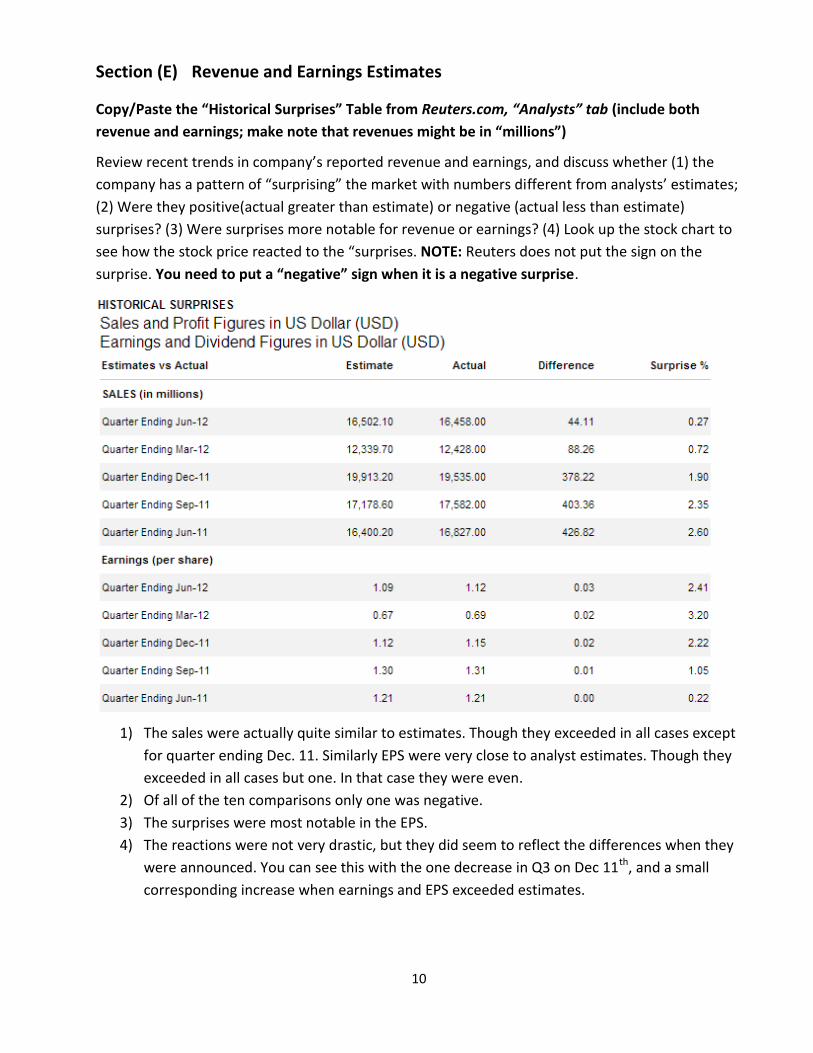
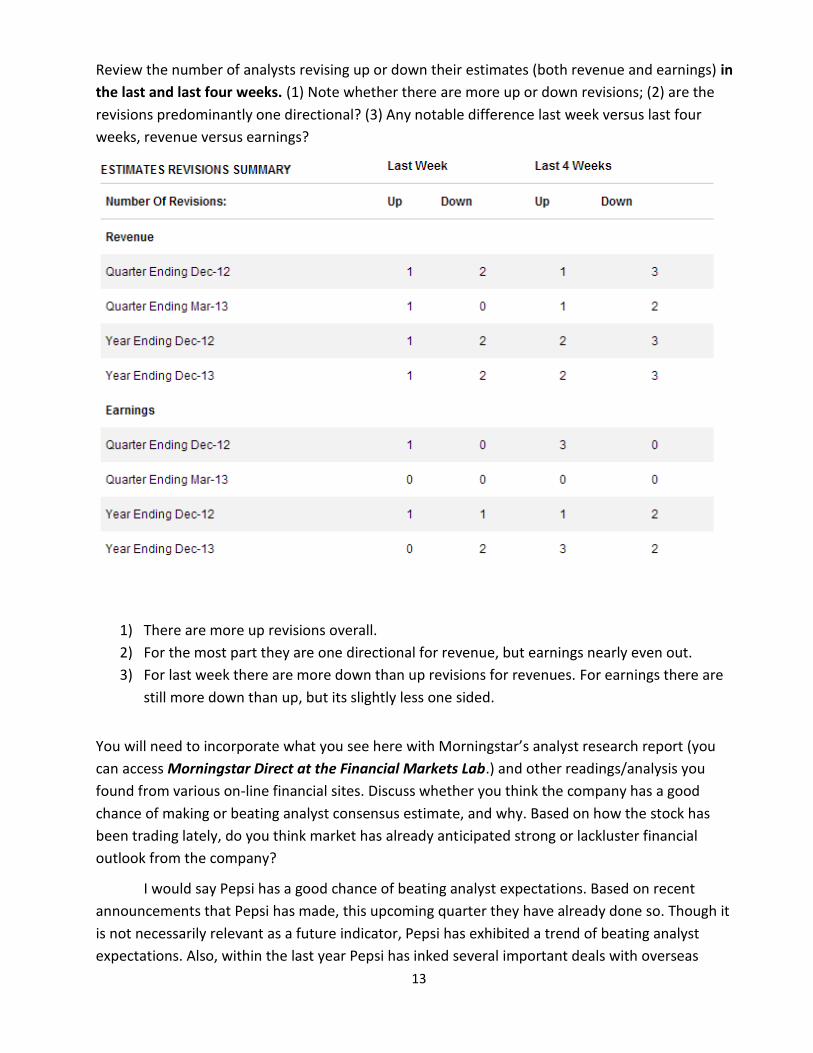
Revenue and Earnings Estimates: Pepsi’s revenues have been very consistent with estimates, often falling closer to the upper end. While their earnings are similarly predictable, but more often tend to exceed expectations.
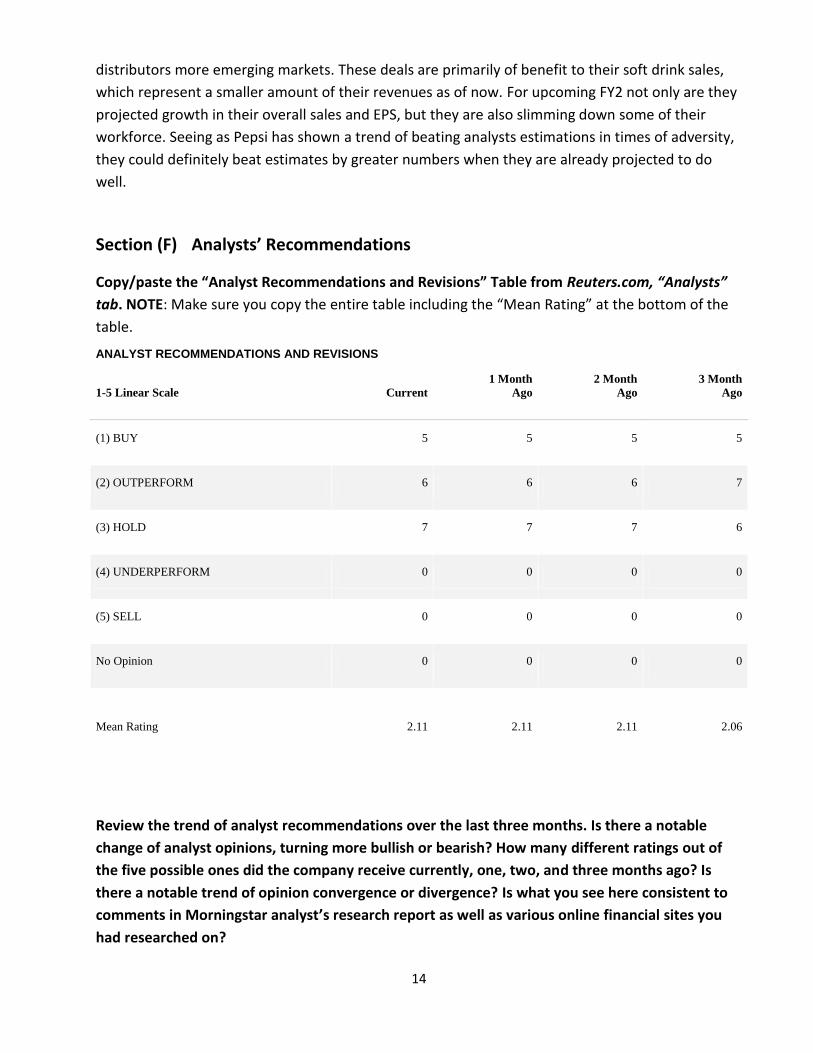
Analyst Recommendations: All analyst recommendations or to either buy, outperform or hold. With a higher concentration falling in the buy or outperform categories.
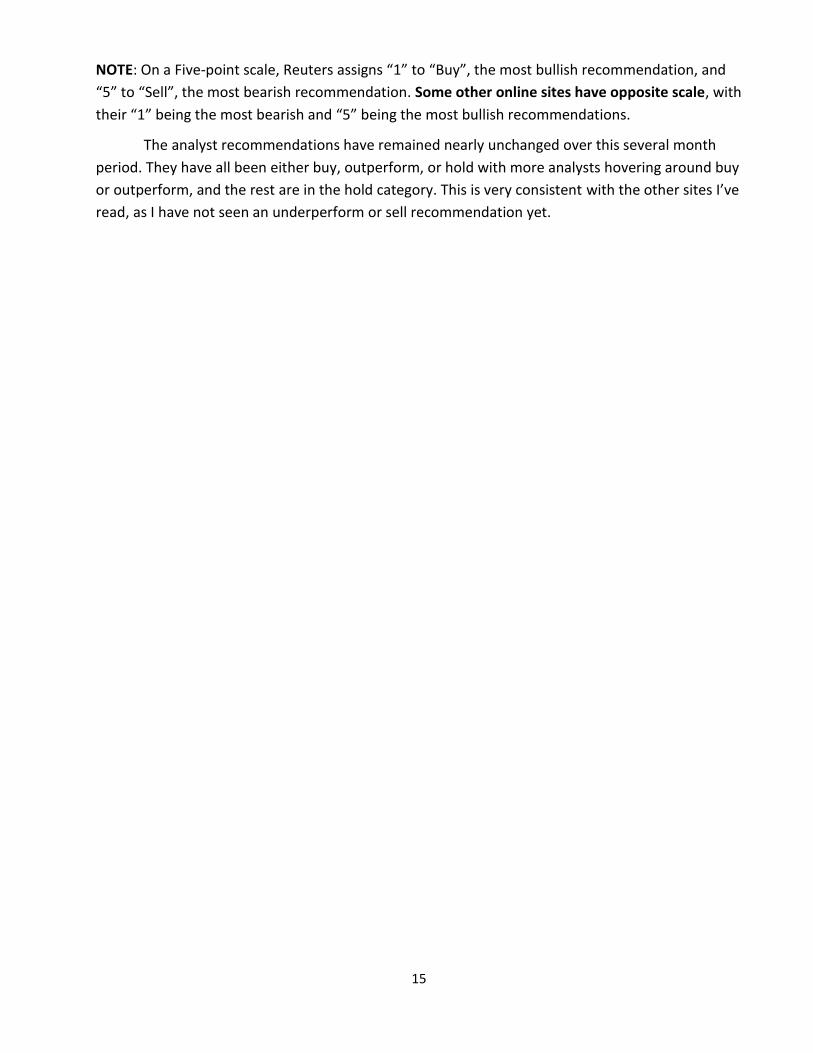
Institutional Ownership: The institutional ownership of PepsiCo hovers around 69%. While there are none who own more than 5% in total. Overall there has been a small net sell off, but many buyers as well.
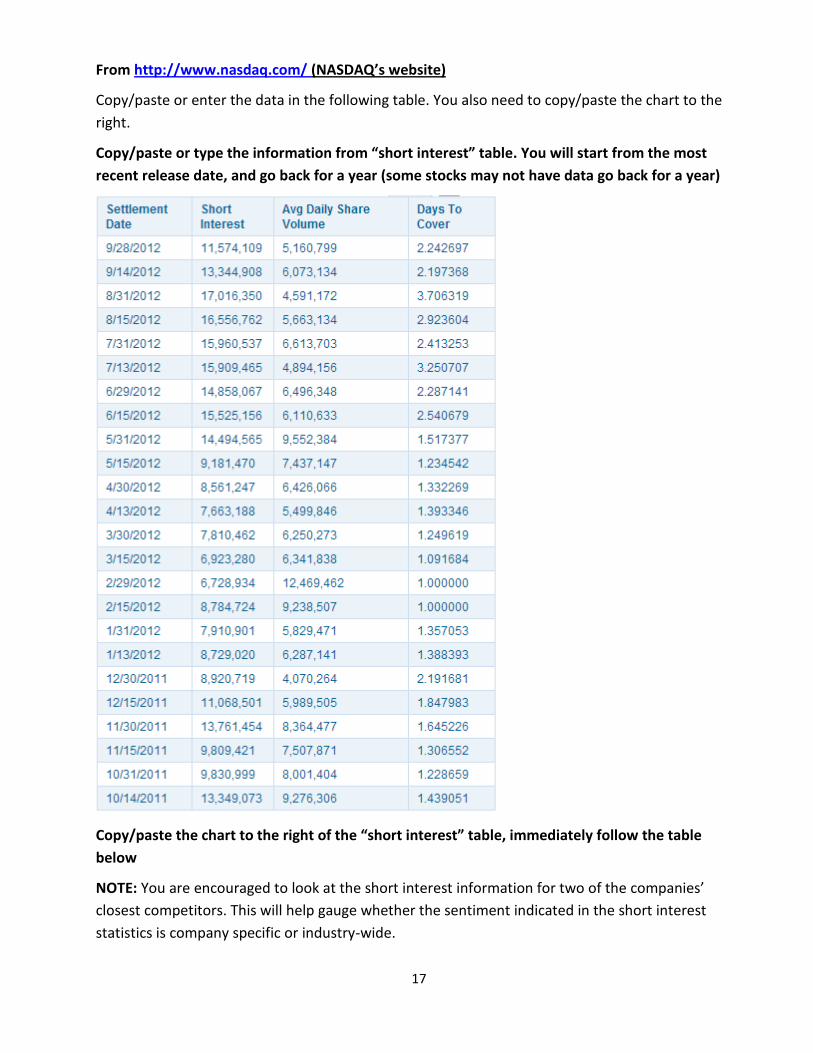
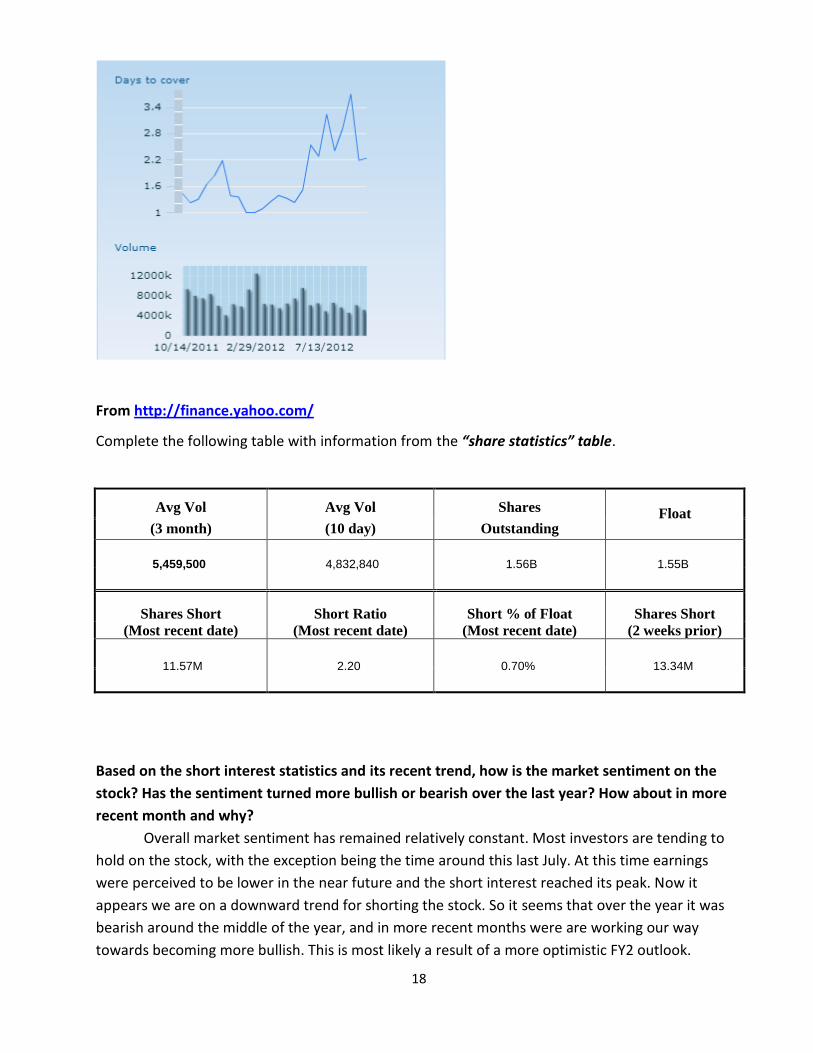
Short Interest: Pepsi’s short interest ratio is currently at 2.61. This ratio has fluctuated between 1 and 2 for over a year now, so it has remained relatively steady.
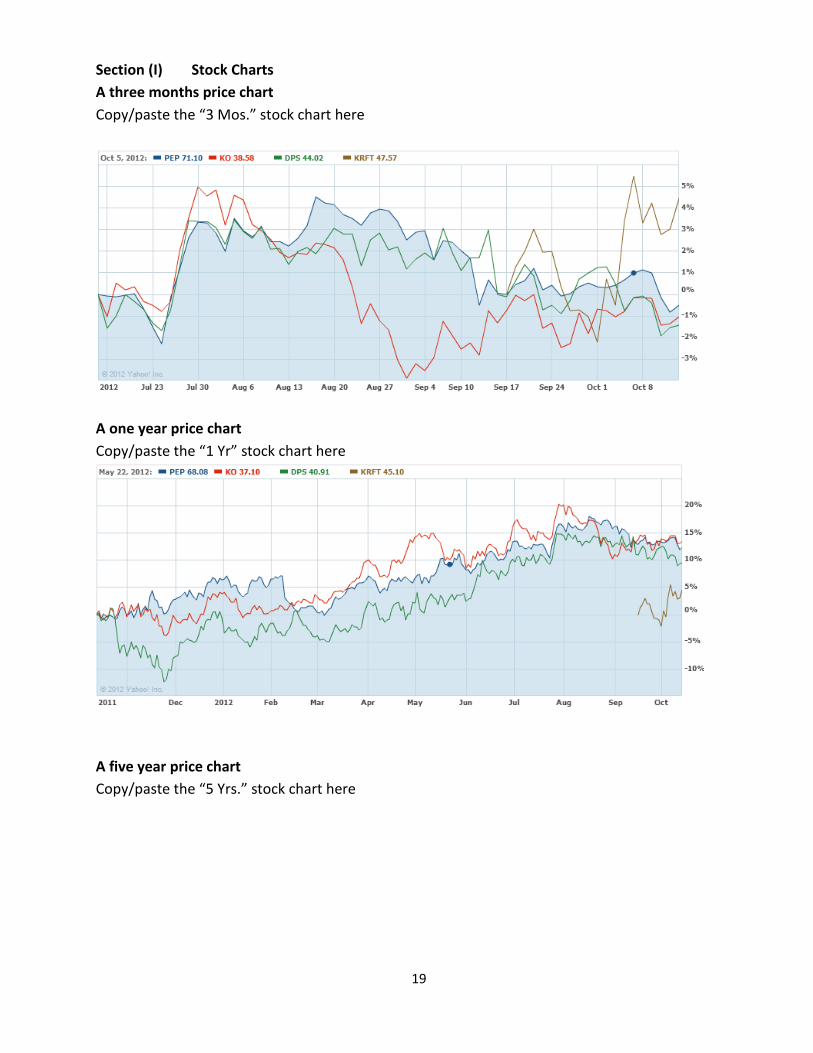
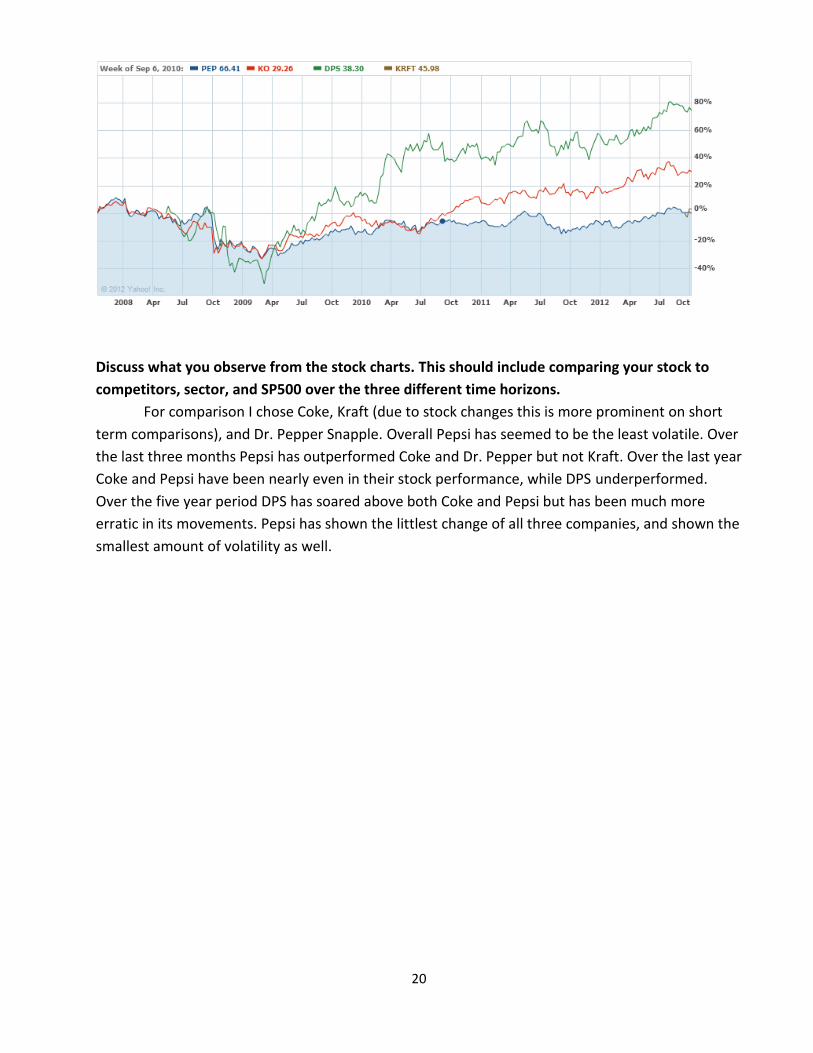
Stock Price Chart: The stock price of Pepsi has been very steady for the last several years, and seems to be moving back up towards its pre-crisis peak. Compared to other beverage and snack competitors Pepsi seems to perform about average, but shows less volatility.
3
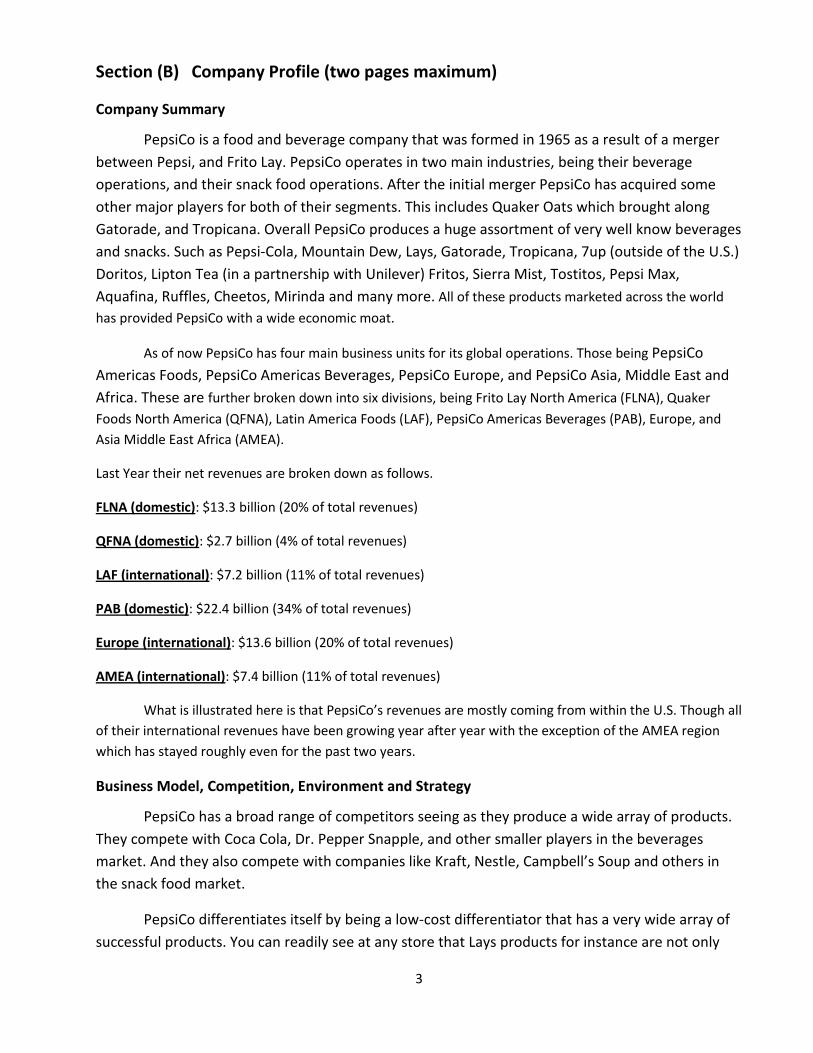
Section (B) Company Profile (two pages maximum)
Company Summary
PepsiCo is a food and beverage company that was formed in 1965 as a result of a merger
between Pepsi, and Frito Lay. PepsiCo operates in two main industries, being their beverage
operations, and their snack food operations. After the initial merger PepsiCo has acquired some
other major players for both of their segments. This includes Quaker Oats which brought along
Gatorade, and Tropicana. Overall PepsiCo produces a huge assortment of very well know beverages
and snacks. Such as Pepsi-Cola, Mountain Dew, Lays, Gatorade, Tropicana, 7up (outside of the U.S.)
Doritos, Lipton Tea (in a partnership with Unilever) Fritos, Sierra Mist, Tostitos, Pepsi Max,
Aquafina, Ruffles, Cheetos, Mirinda and many more. All of these products marketed across the world
has provided PepsiCo with a wide economic moat.
As of now PepsiCo has four main business units for its global operations. Those being PepsiCo
Americas Foods, PepsiCo Americas Beverages, PepsiCo Europe, and PepsiCo Asia, Middle East and
Africa. These are further broken down into six divisions, being Frito Lay North America (FLNA), Quaker
Foods North America (QFNA), Latin America Foods (LAF), PepsiCo Americas Beverages (PAB), Europe, and
Asia Middle East Africa (AMEA).
Last Year their net revenues are broken down as follows.
FLNA (domestic): $13.3 billion (20% of total revenues)
QFNA (domestic): $2.7 billion (4% of total revenues)
LAF (international): $7.2 billion (11% of total revenues)
PAB (domestic): $22.4 billion (34% of total revenues)
Europe (international): $13.6 billion (20% of total revenues)
AMEA (international): $7.4 billion (11% of total revenues)
What is illustrated here is that PepsiCo’s revenues are mostly coming from within the U.S. Though all
of their international revenues have been growing year after year with the exception of the AMEA region
which has stayed roughly even for the past two years.
Business Model, Competition, Environment and Strategy
PepsiCo has a broad range of competitors seeing as they produce a wide array of products.
They compete with Coca Cola, Dr. Pepper Snapple, and other smaller players in the beverages
market. And they also compete with companies like Kraft, Nestle, Campbell’s Soup and others in
the snack food market.
PepsiCo differentiates itself by being a low-cost differentiator that has a very wide array of
successful products. You can readily see at any store that Lays products for instance are not only