Page 1
1
CO2 Abatement Strategies for Polygeneration Systems: Process Integration and
Analysis
Kok Siew Ng1, Nan Zhang
1 and Jhuma Sadhukhan
*2
1Centre for Process Integration, School of Chemical Engineering and Analytical Science, The University of Manchester,
Manchester, M13 9PL, UK.
2Centre for Environmental Strategy, University of Surrey, Guildford, GU2 7XH, UK.
Abstract
Several decarbonised polygeneration systems exploiting carbon capture and storage (CCS)
or CO2 reuse technologies for the conversion of primary resources into clean fuels, chemicals,
electricity and heat are systematically analysed for techno-economic feasibility. A process
simulation, energy integration and economic analysis based approach has been employed to arrive
at a representative set of performance indicators for the trade-off analysis of polygeneration systems.
These indicators include the effect of process configurations and operating conditions on the
economic potential (EP), energy efficiency, decarbonisation potential, economic risks, value of
products and sensitivity in EP due to carbon taxations. The systems under consideration include
coal gasification systems with cogeneration and polygeneration, integrated with various CO2
abatement systems. Transforming a CCS based polygeneration Scheme A producing electricity,
hydrogen, acetic acid and methanol, into an equivalent Scheme B additionally producing methane
from the captured CO2 does not necessarily enhance efficiency, economic and emission
performances. Upgrading cogeneration Scheme C into a polygeneration Scheme D additionally
producing methanol clearly improves all performance indicators. While bio-oil based
polygeneration system (Scheme E) creates environmental incentives, its economic competitiveness
is uncertain and can be enhanced by introducing credits on product prices. Promising results in
terms of improved energy efficiency from 36% in IGCC with CCS scheme to above 70% in
Page 2
2
polygeneration schemes, viable EP and a minimum of 75% of plant-wide CO2 emission reduction
demonstrate that the polygeneration Schemes A, D and E can become low carbon technologies of
choice.
Keywords: chemical and transportation fuel production; CO2 reuse, recycling and carbon capture
and storage; clean coal technology; bioenergy and biorefinery; low carbon energy, low carbon
technology roadmap; hydrogen, methanol, acetic acid and methane production from power plant
expansion.
* Author/s to whom correspondence should be addressed:
E-mail: [email protected]
1. Introduction
Dwindling global oil reserves, environmental concerns and the need for energy security
have generated strong research and development focus in clean coal, natural gas and biomass
polygeneration technologies, producing transportation fuels, chemicals, heat and electricity.
Polygeneration systems incorporating CCS and CO2 recycling and reuse technologies provide low
plant emission, enhanced and flexible switching capability between a diverse range of feedstocks
and products and thus providing security of supply and economic drives (Li et al., 2010; Macdowell
et al., 2010; Adams and Barton, 2011; Pires et al., 2011). Amongst various fossil resources and
technologies, coal with CCS has been recognised to make a significant contribution to the
increasing demand for electricity (Ng et al., 2010). The ScottishPower (2008) has engaged into a
demonstration project that uses Scottish coal and biomass co-firing technology integrated with
advanced CCS options. A large scale co-processing plant planned in Scotland is an example of
UK’s energy security goals. However, considering the uncertainty in storing CO2, its recycling and
reuse for chemical production has started to receive high priorities in some regions, US, Denmark,
Australia, etc. (Rihko-Struckmann et al., 2010). CO2 can be reused for enhanced oil recovery in oil
Page 3
3
extraction process; microalgae production; production of urea, methanol, dimethyl ether, Fischer-
Tropsch liquids, methane (Sabatier’s reaction), syngas (tri-reforming process) and hydrogen (Song
and Pan, 2004; Li et al., 2006; Barbarossa et al., 2009; Rihko-Struckmann et al., 2010). A recent
breakthrough in the area of CO2 reuse is the launching of the George Olah Plant in Iceland in 2010,
for the production of methanol from captured CO2 from industrial flue gases (CRI, 2010). Further,
the Annex I countries have realised that switching to fossil resources with CCS or CO2 reuse alone
cannot bring in the carbon saving needed to restrict the temperature rise up to below 2-3oC over this
century and their exploitation must be in combination with biomass feedstocks. The Non-Annex I
countries have also committed towards adaptation to alternative technologies to combat against
climate change (UNFCCC, 2010). Thus, in parallel to CCS and CO2 reuse technologies,
lignocellulosic biomass must be co-processed for achieving realistic carbon reduction. Bio-oil, a
higher energy density liquid, from biomass fast pyrolysis processes can be converted to methanol or
liquid transportation fuels (diesel and gasoline) (Bridgwater, 2009; Venderbosch and Prins, 2010;
Ng and Sadhukhan, 2011a, 2011b; Sadhukhan and Ng, 2011). This study further looks into the
creation of polygeneration flowsheet options incorporating gasification of coal and bio-oil,
alternative CO2 abatement technologies and creating a whole range of processing-production
possibilities.
Error! Reference source not found. provides overall integrated and cleaner polygeneration
schemes with gasification and carbon capture technology as well as CO2 reuse strategies. The CCS
and with CO2 pre-combustion capture (Scheme A) and reuse in methane synthesis by Sabatier’s
reaction (Scheme B) are proposed to produce methanol, acetic acid, electricity and hydrogen.
Scheme C includes the coal IGCC system with CCS. In Scheme D, post-combustion CO2 from gas
turbine (after hydrogen recovery) is tri-reformed using natural gas. The product gas from tri-
reforming is conditioned by the addition of recovered hydrogen for the synthesis of methanol.
Page 4
4
Considering the co-processing potential of bio-oil in Scheme A, the Scheme E similar to Scheme A
is evaluated for bio-oil as a feedstock. The products and processes selected are representative,
exploiting process integration and conditional synergies, for comparative analysis between
polygeneration systems exploiting CCS and / or CO2 reuse.
Figure 1Further, there are clear and strengthening imperatives for adopting process
integration strategies, otherwise undermined subject, for developing sustainable polygeneration
systems. This work takes a systematic process integration approach using heat integration (Smith,
2005), value analysis (Sadhukhan et al., 2004; Sadhukhan et al., 2008), biorefinery systems
synthesis (Kokossis and Yang, 2010) and systems methodologies for CCS design (MacDowell et al.,
2010) etc., for enhancing overall energy and decarbonisation efficiencies. Adams and Barton (2011)
have addressed systems questions such as how a rising CO2 tax incentivises the production of more
liquid fuels instead of electricity due to the tax implication on the latter product. The study by
Rihko-Struckmann et al. (2010) evaluated the thermodynamic limitations, the energy and exergy
efficiencies of a number of CO2 usage routes for the storage of electrical energy into chemicals.
Studies by Ng and Sadhukhan (2011a, 2011b) and Sadhukhan and Ng (2011) have demonstrated
comprehensive techno-economic performance analyses of a number of bio-oil based biofuel
platforms, utilising indirect gasification route or direct upgrading route, for the production of
methanol, Fischer-Tropsch liquids, gasoline and diesel alongside heat and electricity. Venderbosch
and Prins (2010) have studied characterisation of functionalities and chemical constituents of bio-
oils based on target chemicals and biofuels to be generated. Their approach includes efficient heat
integration, control and reliability analysis of a number of pyrolysis reactors, e.g. fluid bed, rotating
cone and vacuum pyrolysis at a demonstration scale and ablative and twin screw at a pilot scale, for
the production and characterisation of bio-oils.
Page 5
5
The current study draws on the above analysis to identify systems internal and external
variables to propose effective, integrated production planning and process operation strategies,
considering a wide range of market price fluctuation and implication of the emission trading scheme
and taxation (Postnote, 2010). With the recognition that industrialisation will even be at a faster
pace, the process integration tools, built upon basic principles of the most efficient use of raw
materials, energy and capital, would be fundamental to the design of fully integrated
environmentally and economically sustainable polygeneration technologies.
The process
integration tools have been applied for optimal utilisation of internal and external opportunities and
to suggest appropriate indicators for polygeneration systems trade-off analyses. These performance
indicators include the effect of process configurations and operating conditions on the economic
potential (EP), plant-wide decarbonisation potential, economic risks, product values and sensitivity
in EP due to carbon taxations, discussed in the methodology in Section 2. Further, the case studies
effectively demonstrate whether there is any room for improvement in a highly capital and energy
intensive polygeneration system, such as inserting an additional production pathway through CO2
reuse while eliminating the need for a CO2 storage system; the effect of revamping a cogeneration
system into a polygeneration system through CO2 reuse while eliminating the need for a CO2
capture system; comparative performances between fossil and biomass based polygeneration
systems, in Section 3.
2. Methodology
The methodology in Figure 2 comprises of:
1. Process simulation in section 2.1. Process configurations and operating conditions were
selected based on scaled up and industrially relevant values. In addition, the generation of
flowsheets embraced various logical, cost-effective and energy efficient modifications.
ASPEN Plus simulation has been adopted to model the processes, e.g. Gibbs reaction
Page 6
6
modelling for gasifier; equilibrium reaction modelling for water-gas shift, methanol
synthesis, acetic acid synthesis and tri-reforming reactors. Validation of the gasifier model –
the core part of the systems has been undertaken against literature results.
2. Energy integration in section 2.2. Systematic energy integration through data extraction,
screening and classification of heat integration task, composite curve analysis, CHP network
design and heat and power balance has been performed on the systems to attain high energy
efficiency.
3. Economic evaluation in section 2.3. Comprehensive economic analysis framework using
economic potential as the indicator has been established, which comprises the evaluation of
capital and operating costs as well as the product costs. Other assessment includes the
analysis of production portfolio and process operations for minimising the economic risk
due to price fluctuation of products, through a classification by chances of occurrence.
Final analysis is done by the comparison of energy efficiency, economic and emission
performances between cases under consideration in order to derive the technological preferences.
The impact of and sensitivity to the carbon tax on the economics of the systems has also been
another criterion for technology ranking.
A selection of five case studies with schemes shown in Error! Reference source not found.
based on the criteria discussed in the introduction has been carried out using the proposed
methodology. Scheme A with coal polygeneration and CCS is presented in detail to explain the
methodology (sections 2.1-2.3).
Figure 2
Page 7
7
2.1 Process Simulation
Scheme A processing 2000 t/d of coal into methanol, acetic acid, electricity and hydrogen is
simulated in ASPEN Plus, using Non-Random Two-Liquid (NRTL) property method. The
simulation results are illustrated in Figure 3. The basis of modelling the process units is summarised
in Table 1.
Figure 3
Table 1
The coal-water slurry is gasified at 75 bar and 1371°C in entrained flow gasifier
(GASIFIER), using oxygen-enriched air (93.4% O2, 1% N2 and 5.6% Ar) as the gasification
medium. The coal-water slurry and oxygen-enriched air are preheated to 121°C and 83°C,
respectively prior to gasification. The coal gasification model validated against literature results
(Larson and Tingjin, 2003) is used in this study. The product gas (stream 3), containing a mixture of
H2, CO, CO2, H2O as major components with H2/CO molar ratio of 0.7 is cooled down to 430°C in
SYNGCOOL, followed by ash removal in CYCLONE. The gas is further expanded in SYNGEXP
in order to meet the operating conditions of water-gas shift (WGS) reaction, i.e. 25 bar and 250°C.
The outlet temperature of the product gas from SYNGCOOL, operating conditions of WGS and the
steam requirement by WGS are decided to achieve desired H2/CO molar ratio of 2.1 in the product
gas. Furthermore, numerous gas clean-up steps such as water (H2OREM), H2S (H2SREM) and
Rectisol process (Xie, 2001) for CO2 removal (CO2SEP) processes are deployed to attain a target
stoichiometric ratio of (H2−CO2) / (CO+CO2) = 2.07 of the gas for methanol production (Ng and
Sadhukhan, 2011a).
The clean product gas is compressed to 100 bar (SYNGCOMP) to meet the high operating
pressure requirement by the methanol synthesis reactor (METHANOL). The methanol synthesis
reactions in equations (1)-(3) take place in gaseous phase at 100 bar and 250°C (Hamelinck and
Page 8
8
Faaij, 2002), with a CO conversion of 75%. The gaseous product from METHANOL is expanded to
24 bar in METGEXP. A flash column (METSEP) is further used to separate the gaseous and liquid
products at 40°C and 24 bar. 98% recovery (molar basis) of methanol from liquid stream 22 from
METSEP is attained. The offgas containing unreacted gases such as H2, CO, CH4 etc. (stream 21) is
utilised in power generation through gas turbine (GASTURB) and acetic acid (ACEREACT)
production. The offgas distribution can be adjusted through sensitivity analysis, discussed in section
2.3.1.
CO + 2H2 ↔ CH3OH kJ/mol 6.90 RH (1)
CO2 + 3H2 ↔ CH3OH + H2O kJ/mol 7.49 RH (2)
CO + H2O ↔ H2 + CO2 kJ/mol 5.41 RH (3)
Hydrogen is separated via a H2/CO separation process (H2COSEP), such as cryogenic
separation (technology developer such as Linde), e.g. partial condensation and liquid methane wash
(Gunardson, 1998). Liquid methanol is sent to distillation units (METDISTL) to further recover
99.5% of methanol coming from METSEP (Uhde, 2008). A portion of the liquid methanol,
depending on the availability of CO in the offgas after separation from the product gas, is used in
acetic acid synthesis. The primary acetic acid synthesis route is via methanol carbonylation
(equation (4)) at 150°C and 30 bar (Yoneda et al., 2001). This process technology is available from
BP, Monsanto, Chiyoda and UOP.
CH3OH + CO ↔ CH3COOH kJ/mol 6.136 RH (4)
Three main products obtained are hydrogen (54.5 t/d, 75.7 MW, stream H2), acetic acid
(583.7 t/d, 88.5 MW, stream ACOH) and methanol (716.2 t/d, 166.6 MW, stream MEOH). The site
has a net deficit of power of 14.4 MW, even though the gas turbine produces 2.6 MW of power.
Page 9
9
Additional power can be generated through combined heat and power (CHP) production followed
by heat recovery from SYNGCOOL, heat recovery steam generator (HRSG) and reactors’ cooling
units, analysed in section 2.2.
2.2 Heat Integration and CHP Network Design
A systematic heat integration methodology and CHP network design for the recovery of
maximum heat and power as a product enhancing the energy efficiency of an overall system is
presented in Error! Reference source not found.. The design procedures encompass the
fundamental pinch analysis for heat exchanger network design and a series of heuristic and
experience based methodology for classifying the level of heat within the system. The design
procedures have the advantage of generating the layout of a reasonably high efficiency CHP system
in a systematic manner, detailed in previous publication by Ng et al., 2010.
Figure 4
Important data such as temperature and heat duties across process units are extracted from
ASPEN Plus flowsheet simulation results in Error! Reference source not found., for screening
and classification in high and low level heat integration tasks. The heat supply and demand of
individual units are categorised in high and low level tasks based on the temperature levels and the
amount of heat duties. The high level tasks involve CHP network design for steam generation and
consumption based on composite curve and energy balance analyses, whilst the low level tasks
indicate process-to-process heat exchanger network design based on pinch analysis (Smith, 2005;
Ng et al., 2010). The low grade heat utilisation into hot water generation is also considered in heat
exchanger network design.
The results of data extraction and classification of heat integration tasks in Scheme A
(Figure 3) are summarised in Error! Reference source not found. and discussed as follows.
Page 10
10
Low level task: The heat from HRSG (3312 MW) though available at high temperature range
(742°C-100°C) is negligible for steam generation (< 1 kg/s steam) and thus it is used for hot water
generation, very relevant in the UK context. The heat demands by HE1, HE2 and HE5 at low
temperature ranges are satisfied by the sensible heat available in H2OREM. The demand for LP
steam (5 bar) is 4 MJ/kmol syngas by Rectisol (Xie, 2001) and 0.45 t/t methanol by METDISTL
process (Uhde, 2008), respectively.
High level task: The MP steam (14 bar) required by WGS is determined based on desired output
condition of the product gas. Three levels of steam mains are considered according to the system
requirement: VHP (80 bar, superheated to 500°C) that can be generated utilising exothermic heat of
reaction from GASIFIER and sensible cooling duty of SYNGCOOL, MP (14 bar, superheated to
230°C) (sources are METHANOL and WGS reactors) and LP (5 bar and 152°C). It can be noted
that the modelling of GASIFIER as RGibbs reactor (Table 1) may adequately present the product
gas composition (Larson and Tingjin, 2003), but predict an optimistic amount of exothermic heat of
reaction due to the consideration of coal analysis at an elemental level. Therefore, Tables 2-3
highlight only the useful heat obtainable from GASIFIER, compared to the value presented in
simulation Figure 3.
Table 2
Heat and power balances: Following the systematic screening and classification of high level and
low level heat integration tasks the amounts of steam generation, process to process heat recovery
and hot water recovery are decided. The heat sources (SYNGCOOL, GASIFIER, WGS and
METHANOL) provide steam to the steam mains and the heat sinks (WGS, Rectisol and
METDISTL) consume steam from the steam mains. The remaining steam is expanded through
steam turbines (ST1, ST2 and ST3) for power generation. For the maximum amount of steam
generation at the required levels from the heat sources, a minimum temperature approach of 20°C
Page 11
11
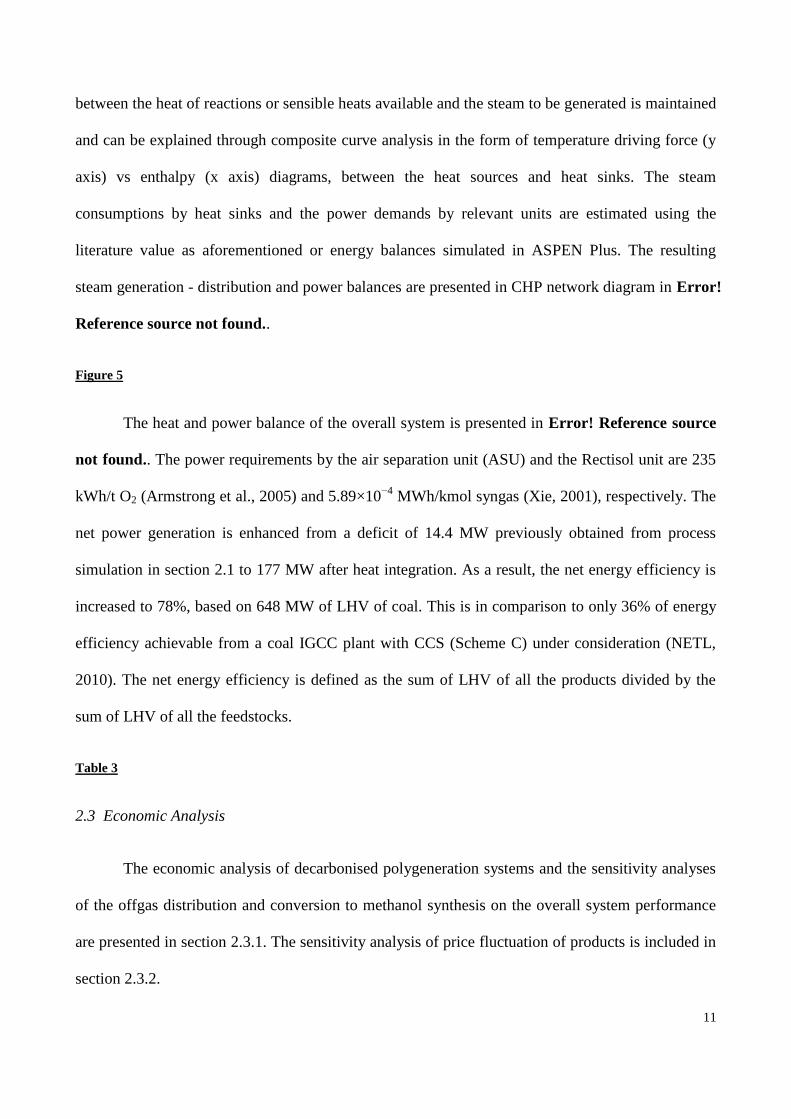
between the heat of reactions or sensible heats available and the steam to be generated is maintained
and can be explained through composite curve analysis in the form of temperature driving force (y
axis) vs enthalpy (x axis) diagrams, between the heat sources and heat sinks. The steam
consumptions by heat sinks and the power demands by relevant units are estimated using the
literature value as aforementioned or energy balances simulated in ASPEN Plus. The resulting
steam generation - distribution and power balances are presented in CHP network diagram in Error!
Reference source not found..
Figure 5
The heat and power balance of the overall system is presented in Error! Reference source
not found.. The power requirements by the air separation unit (ASU) and the Rectisol unit are 235
kWh/t O2 (Armstrong et al., 2005) and 5.89×10⁻⁴
MWh/kmol syngas (Xie, 2001), respectively. The
net power generation is enhanced from a deficit of 14.4 MW previously obtained from process
simulation in section 2.1 to 177 MW after heat integration. As a result, the net energy efficiency is
increased to 78%, based on 648 MW of LHV of coal. This is in comparison to only 36% of energy
efficiency achievable from a coal IGCC plant with CCS (Scheme C) under consideration (NETL,
2010). The net energy efficiency is defined as the sum of LHV of all the products divided by the
sum of LHV of all the feedstocks.
Table 3
2.3 Economic Analysis
The economic analysis of decarbonised polygeneration systems and the sensitivity analyses
of the offgas distribution and conversion to methanol synthesis on the overall system performance
are presented in section 2.3.1. The sensitivity analysis of price fluctuation of products is included in
section 2.3.2.
Page 12
12
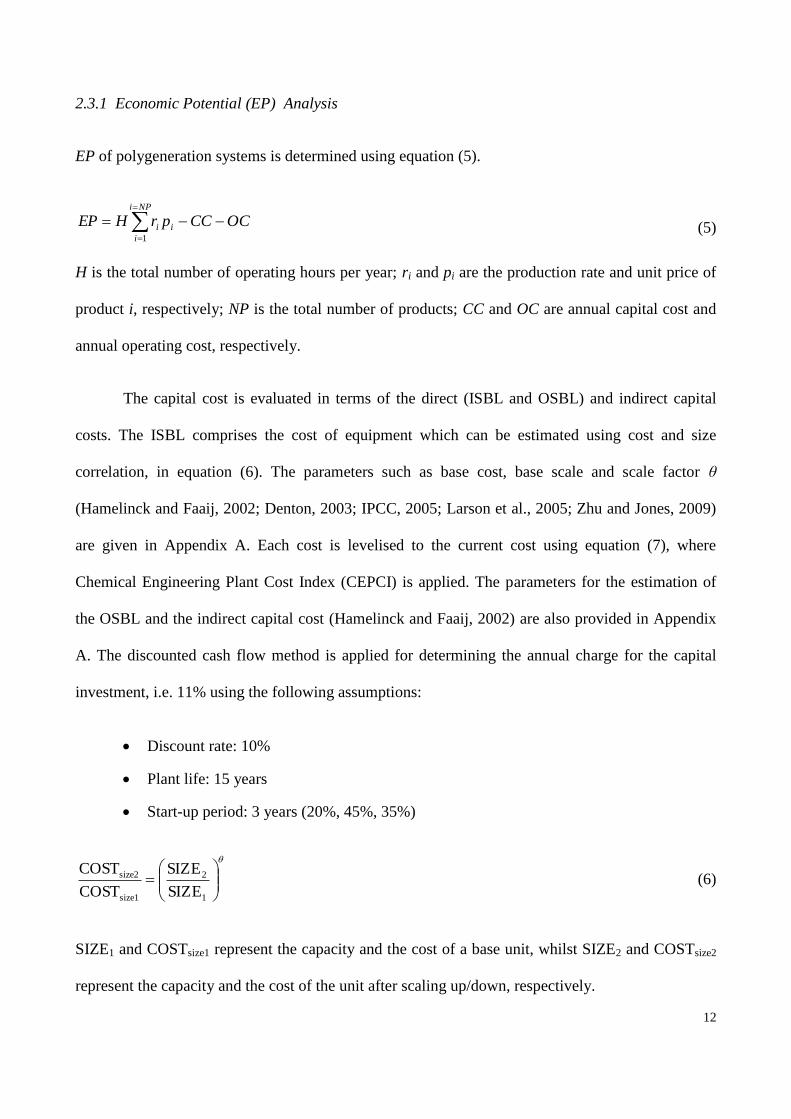
2.3.1 Economic Potential (EP) Analysis
EP of polygeneration systems is determined using equation (5).
NPi
i
ii OCCCprHEP1
(5)
H is the total number of operating hours per year; ri and pi are the production rate and unit price of
product i, respectively; NP is the total number of products; CC and OC are annual capital cost and
annual operating cost, respectively.
The capital cost is evaluated in terms of the direct (ISBL and OSBL) and indirect capital
costs. The ISBL comprises the cost of equipment which can be estimated using cost and size
correlation, in equation (6). The parameters such as base cost, base scale and scale factor θ
(Hamelinck and Faaij, 2002; Denton, 2003; IPCC, 2005; Larson et al., 2005; Zhu and Jones, 2009)
are given in Appendix A. Each cost is levelised to the current cost using equation (7), where
Chemical Engineering Plant Cost Index (CEPCI) is applied. The parameters for the estimation of
the OSBL and the indirect capital cost (Hamelinck and Faaij, 2002) are also provided in Appendix
A. The discounted cash flow method is applied for determining the annual charge for the capital
investment, i.e. 11% using the following assumptions:
Discount rate: 10%
Plant life: 15 years
Start-up period: 3 years (20%, 45%, 35%)
1
2
size1
size2
SIZE
SIZE
COST
COST (6)
SIZE1 and COSTsize1 represent the capacity and the cost of a base unit, whilst SIZE2 and COSTsize2
represent the capacity and the cost of the unit after scaling up/down, respectively.
Page 13
13
obtained cost was original Index when
presentat Index cost Originalcost Present (7)
The operating cost comprising of the fixed and variable costs is evaluated. The parameters
for estimating the operating costs (Tijmensen et al., 2002; Sinnott, 2006; DECC, 2010) are given in
Appendix A. The economic assumptions are as follows:
Operating hours per year (H): 8000 hours
Current CEPCI: 555.2 (April, 2010)
The current market prices / estimated cost of production are identified for evaluating the
total value of the products, i.e. electricity (74.14 Euro/MWh (DECC, 2010)), hydrogen (1104 Euro/t
(Stiegel and Ramezan, 2006)), acetic acid (550 Euro/t (ICIS Pricing, 2010)) and methanol (255
Euro/t (Methanex, 2010)).
The offgas from methanol synthesis reaction can be distributed into electricity, hydrogen
and acetic acid production. The effect of split fractions of 0.9, 0.5 and 0.1 of stream 28 in Figure 3
on overall EP prior to the heat integration is presented in Table 4(a). A split fraction of 0.9 means
90% of the offgas is used for hydrogen and acetic acid production while 10% is used for power
generation through gas turbine. The scenario with a split fraction of 0.9 is the most economically
favourable case, EP = 33.7 million Euro/y. The other two scenarios with split fractions of 0.5 (EP =
−6.6 million Euro/y) and 0.1 (EP = −46.8 million Euro/y) are not economically viable. There is no
net electricity generation from all these scenarios. Lowering the split fraction of the offgas from 0.9
to 0.1 increases the electricity generation from the gas turbine. This in turn reduces the plant’s
operating cost by 10%. However, the value of products is reduced significantly by 87% due to the
reduction in the split fraction. Thus, overall a higher level of diversion into added value production
Page 14
14
is desired. High added value production is however accompanied with a higher level of economic
risk, discussed in section 2.3.2.
Two different values of conversion of CO in methanol synthesis, 75% and 50%, after heat
integration and for an offgas split fraction of 0.9, producing 43.7 t/h and 28 t/h of methanol,
respectively, are also taken into consideration to select preferred operating scenario in terms of EP
(Table 4(b)). The trends suggest that lower conversion of CO in methanol synthesis reaction results
in higher EP, 211.7 million Euro/y at 50% conversion and 139.9 million Euro/y at 75% conversion,
respectively. This is primarily due to the higher value acetic acid production, 49.9 t/h at 50%
conversion compared to 24.3 t/h at 75% conversion, respectively. A portion of methanol, 27.1 t/h
for 50% conversion and 13.8 t/h for 75% conversion, respectively is utilised in carbonylation
process for the formation of acetic acid (equation (4)).
The sensitivity studies of the distribution of the offgas from the methanol synthesis reactor
as well as the conversion in methanol synthesis reaction explain the importance of manipulation of
operating conditions on polygeneration system performance. The manipulation of these operating
conditions serves as a low cost modification option for the mitigation of moderate level of
economic risks, discussed in section 2.3.2. The increased EP presented in Table 4(a) and (b) also
demonstrates the importance of energy integration and efficiency studies. The power generating
from gas and steam turbines is sufficient for the whole system supply, leading to a considerable
reduction in operating cost by 19% and an increase in product value by 56%.
Table 4
2.3.2 Sensitivity Analysis of Price Fluctuation of Polygeneration Products
Uncertainty in price of chemicals is due to instability in supply and demand, oil prices and
unforeseen circumstances such as natural disaster and oil spill etc. Further complication arises
Page 15
15
particularly in a polygeneration plant wherein there are competing productions. Therefore, the effect
of price fluctuations of products on EP, through classification by chances of occurrence has been
introduced as follows.
There are four products under consideration: electricity, hydrogen, acetic acid and methanol.
The unit prices of products, pw, px, py and pz, respectively, are considered as variables. Three sets of
prices are assumed for each product: base price (pi,0), a price lower than the base price by a
difference of ∆% (pi,−∆%) and a price higher than the base price by a difference of ∆% (pi,+∆%).
Based on Counting Principle, there are 81 (n) combinations due to three sets of prices for four
individual products (3×3×3×3), (equation (8)).
1 14 4
%,%,%,%,
%,%,%,%,
0,0,0,0,
%,%,%,%,
%,%,%,%,
0,0,0,0,
nn
prprprpr
prprprpr
prprprpr
r
r
r
r
pppp
pppp
pppp
zzyyxxww
zzyyxxww
zzyyxxww
z
y
x
w
zyxw
zyxw
zyxw
(8)
The EP (equation (5)) due to the market price combinations for a constant ∆% and variable
∆% in equation (8) is predicted in Matlab environment. The CC and OC are 85.7 million Euro/y and
67.4 million Euro/y, respectively. The value of products and EP of the base case in Figure 3 on a
basis of 8000 operating hours per year are 293.0 million Euro/y and 139.9 million Euro/y,
respectively (Table 4(b)). By assuming that the system results in an acceptable EP at the current
market scenario, any variation in EP due to price fluctuation may lead to an economic risk. An
“economic risk” refers to a loss in revenue due to any event (a combination of product prices). It is
important to predict and classify the potential economic risk in various ranges, e.g. ≥ 0%, 0% to
−20%, −20% to −50% and < −50% (− indicates reduction in revenue compared to the base case
revenue). The frequency of having a particular class of economic risk (e.g. ≥ 0%) is determined by
counting the number of events resulted into the given class of economic risk. The probability of
Page 16
16
occurrence of a particular class of economic risk is obtained by the ratio of the frequency of events
resulting into the given class of economic risk to the total number of events.
Case 1: Constant ∆%
Table 5(a) summarises the classification of economic risks, the frequency of events resulting
into each class of economic risk, probability of occurrence of each event and the decision to be
taken, based on 50% variation in individual product price fluctuation. All scenarios with positive
variation in EP are in safe EP region, and the probability of having such scenario is approximately
51%. Thus, the probability of having moderate to critical economic risk is significant.
Case 2: Variable ∆%
Table 5(b) takes account of individual product price fluctuations over a certain period
discussed as follows, in order to assess the economic risk, frequency of events within each class of
economic risk, probability of occurrence of each event and the modification requirement.
Table 5
The contract price of methanol from January 2006 to September 2010 (Methanex, 2010) is
presented in Figure 6(a). The price fluctuation of acetic acid is not published, and thus the price
fluctuation of methanol is used as a benchmark for its price. The price of hydrogen is often kept
proprietarily by organisation. The price fluctuation of hydrogen is thus inferred from the price of
natural gas (DECC, 2010) (Figure 6(b)). The price of electricity (Figure 6(b)) is also obtained from
DECC (2010). Table 6 presents the percentage price variation from the base case unit price of
products.
Figure 6
Table 6
Page 17
17
It is evident that 41 events in case of constant ∆% and 52 events in case of variable ∆% out
of a total of 81 events (combinations of prices) result in higher EP or no economic risk. Table 5(b)
indicates 64% probability of having no economic risk and 7% probability of having critical
economic risk. However, the probability of having moderate to high economic risks is also within a
range of 28% and comparable to 32% probability in the constant ∆% case. This suggests that a
significant reduction in revenue due to product price fluctuation may be encountered, and hence,
various levels of cost modification strategies must be analysed as a part of detailed system design
exercise. To mitigate moderate to high economic risk, the low to high cost modification in Table 5
may be achieved by diversion to lower impact (generally lower value) products (e.g. by the
manipulation of operating conditions) discussed in section 2.3.1, while the critical economic risk
may only be mitigated by plant retrofitting. The product with the highest market price fluctuation is
likely to result in the highest economic risk and vice versa. Thus the sequence of the highest to the
lowest impact products (or the reverse order of preference in terms of product diversion) in Table 6
is as follows, acetic acid / methanol > hydrogen > electricity. Polygeneration framework provides
flexibility in product diversion and thereby ways of mitigating various levels of economic risks.
3. CO2 Emission Minimisation through Process Modification
The simulation of other polygeneration schemes is outlined in section 3.1. The
thermodynamic efficiency, EP and environmental impact of the various process schemes are
presented in section 3.2. The CO2 mitigation options and future deployment potential of
polygeneration systems are discussed in section 3.3.
3.1 Simulation of Polygeneration Schemes
All schemes, A-E, under consideration have the same coal or bio-oil input processing
capacity, i.e. 648 MW. Schemes A-D have a throughput of 2000 t/d of coal, while 3102 t/d of bio-
Page 18
18
oil is used in Scheme E to achieve 648 MW (LHV of bio-oil is 18 MJ/kg). Additional operating
parameters of Schemes C-E used in ASPEN Plus simulation are given in Appendix B. Heat
integration strategy illustrated in Error! Reference source not found. is undertaken for all systems
under consideration.
Scheme B-Coal polygeneration with CO2 methanation (Error! Reference source not found.(b))
CCS is included in Scheme A in order (i) to obtain a suitable stoichiometric ratio in the
product gas for methanol production; (ii) to reduce CO2 emission from the system. Whilst carbon
capture unit is essential, storage is optional, however. CO2 captured can be utilised into other
chemical production, such as methane, benzene, methanol etc. An alternative process Scheme B
that utilises CO2 into methane production in Sabatier’s reaction (equation (9)) is introduced. The
operating condition of the Sabatier’s reaction is set at 2 bar and 300°C (Barbarossa et al., 2009).
2.56 kmol/s of hydrogen is required and 96% conversion of CO2 by mole is achieved for the
production of 35.5 t/h of methane. CO2 is released with the exhaust gas from gas turbine and
unreacted gases from acetic acid synthesis and Sabatier’s reactions. The Sabatier’s reaction has
been successful in space-based applications. These include production of water in International
Space Station and the In-Situ Resource Utilisation for space exploration to Mars by NASA (Curie,
2010).
CO2 + 4H2 ↔ CH4 + 2H2O kJ/mol 167 RH (9)
Scheme C-Coal IGCC with CCS (Error! Reference source not found.(c))
In this scheme, coal is gasified into syngas and heat and power, with CCS in pre-combustion
process (Ng et al., 2010). CO2 may be emitted with the exhaust gas from the gas turbine.
Page 19
19
Scheme D-Coal IGCC with tri-reforming and methanol synthesis (Error! Reference source not
found.(d))
The cost of CCS and the degree of decarbonisation pose an important trade-off in coal IGCC
system with CCS (Ng et al., 2010). Scheme D producing methanol by the reuse of CO2 generated
from the gas turbine in tri-reforming process (equations (10)-(12)) (Song and Pan, 2004) can
potentially replace the cogeneration Scheme C. Tri-reforming of methane using CO2 for the
production of valuable syngas with desired ratio and reduction of carbon formation on catalyst was
first implemented by Song and Pan (2004). The tri-reforming process fed with CH4, CO2, H2O and
O2 with a molar ratio of 1: 0.475: 0.475: 0.1 is operated at 1 bar and 850°C (Song and Pan, 2004).
The product gas contains H2 to CO at a molar ratio of 1.68.
CH4 + CO2 ↔ 2CO + 2H2 kJ/mol 3.247 RH (10)
CH4 + H2O ↔ CO + 3H2 kJ/mol 3.206 RH (11)
CH4 + 0.5O2 ↔ CO + 2H2 kJ/mol 6.35 RH (12)
98% H2 (1.5 kmol/s in this case) is separated from the product gas from gasification using
pressure swing adsorption (PSA), which is then combined with the product gas from tri-reforming
process. The remaining CO enriched gas from PSA is sent to gas turbine for electricity generation.
A small amount of natural gas is needed to maintain an acceptable Wobbe Index for the gas turbine
(Ng et al., 2010). Oxygen is used in an oxy-fuel gas turbine combustor, avoiding dilution of the fuel
gas with nitrogen, and thereby reducing nitrogen in the downstream tri-reforming and methanol
synthesis processes. A highly concentrated CO2 stream is resulted from gas turbine combustion.
The exhaust gas from gas turbine is then routed to the tri-reforming process. 95% of the unreacted
offgas from methanol synthesis are recycled to enhance the production of methanol, while the rest is
Page 20
20
purged. The proposed integrated scheme meets the desired H2/CO molar stoichiometric ratio in the
feed gas to the methanol synthesis without any use of CCS.
Scheme E-Bio-oil polygeneration with CCS (Error! Reference source not found.(e))
Bio-oil derived from fast pyrolysis of poplar wood is used as a feedstock in polygeneration
Scheme E (similar to Scheme A that uses coal). The bio-oil is modelled using acetic acid, acetol and
guaiacol. The results of bio-oil gasification performance were validated elsewhere (Ng and
Sadhukhan, 2011a, 2011b). The operating conditions of some of the process units in Scheme A are
adjusted to tailor for the bio-oil system. These include the temperature and pressure of the gasifier
set at 1112°C and 30 bar. This is to attain thermally neutral gasification reaction condition. The
product gas from the gasification contains 31% H2, 25% H2O, 32% CO and 12% CO2 by mole.
Steam is not required in WGS due to high water content in the product gas attributed to the high
moisture content in bio-oil. The gas cleaning process excluded cyclone and H2S removal units since
bio-oil is free from contaminants. Pre-combustion CCS is used to capture 85% of CO2 in order to
attain a stoichiometric ratio (H2−CO2) / (CO+CO2) = 2.05, desired for high yield of methanol (Ng
and Sadhukhan, 2011a).
3.2 Polygeneration Scheme Performance Trade-offs
The analyses of process schemes A-E in terms of thermodynamic efficiency and net plant-
wide emission and EP are presented in Table 7 and Table 8, respectively.
Table 7
Table 8
A comparison between Schemes A and B (polygeneration with CCS and with reuse,
respectively) demonstrates that increasing the total value of products does not necessarily enhance
an overall systems performance. Numerous trade-offs need to be considered. The total LHV of the
Page 21
21
products from Scheme B is 85% higher than that from Scheme A (on the basis of Scheme A product
LHV), due to the additional production of methane from captured CO2. In spite of this, the energy
efficiency of Scheme B is lower than that in Scheme A attributed to the hydrogen requirement in
the Sabatier’s reaction (equation (9)) (Table 7). Scheme B has higher CO2 emission per unit product
than Scheme A, 8.3 t CO2/GWh compared to 7.7 t CO2/GWh, respectively (Table 7). The on-site
generation of hydrogen in Scheme B is not sufficient to meet the entire requirement and thus
additional hydrogen is imported. This leads to 3.8 times higher operating cost for Scheme B
compared to Scheme A, on the basis of a price of hydrogen of 1104 Euro/t (Stiegel and Ramezan,
2006). Compared to the operating cost, the product value due to methane production in Scheme B is
only increased by 1.2 times from Scheme A. As a result, the EP of Scheme B is lower than that of
Scheme A, 16.2 million Euro/y and 139.9 million Euro/y, respectively (Table 8). Scheme A would
thus be more desirable in terms of energy and emission performance improvement. If the value of
methane increases to 51.3 Euro/MWh, both schemes would be cost-competitive (on the basis of
139.9 million Euro/y).
The negative EP from Scheme C suggests that the value of electricity generated does not
offset the cost of CCS (Table 8). A price of 81 Euro/MWh of electricity has been estimated in order
to achieve an economically viable Scheme C (EP > 0). Modification of a cogeneration system
Scheme C into a polygeneration system Scheme D is likely to improve systems performances. The
CO2 emission per unit product from Scheme D (17 t CO2/GWh) is lower than that from Scheme C
(128 t CO2/GWh) (Table 7). The advantage of Scheme D is that a substantial amount of methanol is
produced by the integration of the post-combustion flue gas and natural gas in the tri-reforming
process, increasing the overall value of the products that can compensate for the increased operating
cost. There is a prominent improvement in the EP, from −13.1 million Euro/y in Scheme C to 317.2
million Euro/y in Scheme D (Table 8). As also observed from the study of Adams and Barton
(2011), diverting captured CO2 into liquid product is energetically more efficient and economically
Page 22
22
more favourable under the current policy context, though the CO2 reuse schemes do not save the
total emission across life cycle, because eventually the products are consumed.
Scheme E, bio-oil polygeneration into methanol, acetic acid, hydrogen and electricity, is
less efficient compared to analogous Scheme A using coal. This is primarily due to the lower LHV
of bio-oil of 18 MJ/kg than 28 MJ/kg of coal and higher moisture content, i.e. 30 wt% of bio-oil and
12 wt% of coal, respectively (Larson and Tingjin, 2003; Ng and Sadhukhan, 2011a). Due to the
thermal neutrality of the bio-oil gasification process, no excess steam is available for power
production. Scheme E results in higher methanol production (CO conversion of 82%) (Ng and
Sadhukhan, 2011a) than that from Scheme A (75%), however the acetic acid production from
Scheme E is only half of that from Scheme A. Considering carbon sequestration during biomass
growth, 66 t CO2/GWh emission from Scheme E can be eliminated. The netback of bio-oil in
Scheme E, that indicates the maximum buy-in price of bio-oil (81.6 million Euro/y or 8.1 Euro/GJ),
is lower than the EP of Scheme A (139.9 million Euro/y) (Table 8). The bio-oil polygeneration
system may still compete with the coal based schemes, if renewable products from bio-oil are given
credits. The overall bio-oil based product value must at least be increased by 5.8 Euro/GJ, for cost-
competitive performance against coal. Banding of price structure at various levels is introduced
under the Renewables Obligation in the UK. This is to ensure that the technologies at a
demonstration stage receive support and incentives for further exploitation at a larger scale (DECC,
2011). Our previous studies have also indicated mechanisms to create economic incentives for bio-
oil based polygeneration systems (Ng and Sadhukhan, 2011a, 2011b; Sadhukhan and Ng, 2011).
3.3 Ranking of Polygeneration Schemes
Which design is superior? Capture and store, capture and reuse or reuse without capturing CO2?
Page 23
23
Figure 7 presents the comparison of performances amongst Schemes A-D with respect to
thermodynamic efficiency, CO2 emission level and economic potential. Based on the performance
analyses of Schemes A-D (Figure 1) detailed in section 3.2, the following ranking in the order of
preference for these schemes can be established.
Highest to lowest thermodynamic efficiency: D > A > B > C
Lowest to highest emission: A < B < D < C
Highest to lowest EP per unit output energy: A > D > B > C
Figure 7
The analyses suggest that modification of a cogeneration system into a polygeneration
system is likely to improve the systems performances, whilst revamping a polygeneration system by
adding more products does not necessarily relate to a significant improvement.
The CO2 reuse cases, i.e. Schemes B and D represent the direct and indirect utilisation of
CO2, respectively. Scheme D, wherein post-combustion CO2 without capture is converted into
methanol through syngas platform has a more flexible configuration compared to Scheme B
(polygeneration with CO2 capture and reuse). It provides flexibility in syngas conditioning for the
generation of other products, e.g. Fischer-Tropsch liquid, dimethyl ether etc. Most of the CO2 reuse
processes require hydrogen. A CO2 reuse system self-sufficient in cost-effective hydrogen supply
(without requiring any import or without including expensive hydrogen production technique) is
highly envisaged, shown in Scheme D. The plant-wide emissions from reuse Schemes B and D are
lower than that from CCS Schemes A and C. However, from whole system life cycle perspectives,
reuse schemes can only slow down CO2 release to the atmosphere. In contrast, 96% and 76% of
CO2 from Schemes A and C (Table 7), respectively, are captured and stored underground, where the
CO2 life cycle can be prolonged. Considering all these aspects, Scheme A is regarded as the ‘winner’
Page 24
24
attributed to its high efficiency, low CO2 emission from a whole system life cycle perspective and
high EP per unit output energy.
The impact of carbon tax
Based on the emission analysis of Schemes A-D (Error! Reference source not found.) in
Table 7, the order of sensitivity of EP to carbon tax can be established as follows (from the lowest
to the highest slope in Figure 8(a)).
Lowest to highest sensitivity to carbon tax: A < B < D < C
Scheme A is able to withstand higher carbon tax rate, due to its high EP and low CO2
emission. The EP only reduces to 102 million Euro/y for as high a carbon tax as 1000 Euro/t.
Although less sensitive to carbon tax, levying carbon tax poses a great impact on Scheme B in view
of its low EP that reduces to zero for a carbon tax of 235 Euro/t. Scheme D is more sensitive to
carbon taxation than Schemes A and B, due to its higher CO2 emission rate at 52.1 t/h compared to
8.7 t/h and 4.7 t/h from Schemes B and A, respectively. The carbon tax rate should be as high as
468 Euro/t, in order for Scheme D (best performance in reuse cases) to compete against Scheme A
(best performance in CCS cases). At this point, the EP vs. carbon tax lines for Schemes A and D
intercept, providing an EP of 122 million Euro/y. Negative EP for Scheme D is incurred above 762
Euro/t of carbon tax. There is no direct economic competition due to carbon tax between reuse
Schemes B and D, unless the tax rate is as high as 900 Euro/t. It is recognised that based on the
consideration of both the sensitivity to carbon tax as well as EP, a scheme with low EP and with
high environmental emission can be penalised by carbon tax (e.g. Scheme B). Broadly speaking,
Page 25
25
schemes with low EP and low emission are more likely to be susceptible to carbon tax than
schemes with high EP and high emission (e.g. Scheme D). Obviously, schemes with high EP and
low emission are the best options (Scheme A).
The maximum limit on CO2 emission for EP = 0 for various carbon tax rates is investigated,
using Scheme D as the base case, in Figure 8(b). The maximum limit on the CO2 emission
decreases exponentially from 32 million t/y to 6 million t/y with increasing carbon tax rate from 10
Euro/t to 50 Euro/t. Thus higher carbon tax rate lowers the total CO2 emission and the economics of
a system. Nevertheless, higher carbon tax rate at 40-50 Euro/t has shown 25% difference in the
maximum limit, and it is expected that the difference will eventually become insignificant beyond
carbon tax rate of 50 Euro/t due to the flattening of the exponential function. This forms a
bottleneck with no further possibility of CO2 emission reduction, even when the carbon tax rate is
increased and thus carbon taxation essentially receded into the background.
The capital intensive CCS is likely to be realisable in industrialised nations. Annex I
countries (UNFCCC, 2011) with high energy consumption per capita, stringent emission target,
carbon tax and trading uncertainties, may opt for CCS in polygeneration schemes, such as Scheme
A, whilst the reuse polygeneration schemes can become technologies of choice for developing
economy in the interim period.
Figure 8
Bioenergy with carbon capture and storage
The integration of carbon capture and storage in the biomass based energy systems, known
as bioenergy carbon capture and storage technology, has recently generated significant interest
(IPCC, 2005; Rhodes and Keith, 2008; McGlashan et al., 2010). Such a technology is capable of
producing useful product while achieving negative net atmospheric carbon emissions and hence
Page 26
26
generating more carbon credits. However, the prospect of this technology is unforeseeable due to a
number of reasons such as the potential of utilisation of biomass in large scale production of fuels,
chemicals and power; lack of experience and analysis (IPCC, 2005). In this study, Scheme E
presents such an example. This scheme uses bio-oil instead of biomass as the feedstock. It has been
found that Scheme E is less compelling compared to Scheme A with respect to the efficiency and
the economic performance (Table 7 and Table 8). This imposes a greater challenge on the potential
of bio-oil in substituting fossil fuels. However, by comparing between a conventional coal IGCC
system (Scheme C) and a bio-oil polygeneration system (Scheme E), the latter can be beneficial,
provided that the cost of bio-oil can be reduced to a significant extent.
One may argue that CO2 storage is not necessary since biomass is regarded as carbon neutral
source, because the CO2 emitted can be re-captured by plants and crops. This is true as long as the
rate of absorption of CO2 by biomass crops is almost equal to the rate of emission of CO2, and
assuming that the amount of crops is more than sufficient to absorb the CO2. This could be difficult
if biomass crops within a particular area are largely harvested for the utilisation in a large scale
system, and the plantation of biomass crops is not rapid enough to cope with the emission of CO2
from large scale polygeneration systems. IPCC pointed out that bioenergy with carbon capture and
storage technology is realisable once the economies of scale are improved, via three possibilities
(IPCC, 2005):
Nearby CO2 pipeline is available
Co-processing of biomass with coal
Scaling up the biomass energy plant for larger production
4. Conclusions
Page 27
27
This paper presents performance evaluation of decarbonised polygeneration systems
primarily exploiting gasification routes, in terms of energy efficiency, economic, CO2 emission and
economic sensitivity to carbon tax, through systematic techno-economic studies which embraced
process simulation, energy integration and economic evaluation approaches. Various capital and
energy intensive CO2 emission minimisation processes such as CCS, capture and reuse producing
methane using Sabatier’s reaction as well as reuse without capture producing methanol using
syngas tri-reforming based platform have been investigated for the techno-economic feasibility of
integration into primarily power production facilities utilising coal, biomass / bio-oil feedstocks.
With an aim of investigation whether increasing product portfolio, such as, hydrogen, acetic acid,
methanol, methane etc. from a power plant or converting a cogeneration plant into a polygeneration
plant by CO2 reuse eliminating the need for CO2 storage, makes any economic sense, the following
conclusions are made.
Highest to lowest thermodynamic efficiency of the schemes: D > A > B > C
Lowest to highest emission: A < B < D < C
Highest to lowest EP per unit output energy: A > D > B > C
Lowest to highest sensitivity to carbon tax: A < B < D < C
Scheme A = Coal CCS producing electricity, hydrogen, acetic acid and methanol according to
demands.
Scheme B = Production of electricity, hydrogen, acetic acid and methanol and methane from the
captured carbon dioxide utilising coal
Scheme C = Coal integrated gasification combined cycle with CCS.
Scheme D = Production of electricity from combined cycle and methanol from natural gas tri-
reforming utilising coal.
Scheme E, similar to Scheme A, processes bio-oil as an alternative low carbon feedstock. While
bio-oil creates environmental incentives, its economic competitiveness is uncertain and can be
Page 28
28
enhanced by introducing credits on product prices. Promising results in terms of improved energy
efficiency from 36% in IGCC with CCS scheme to above 70% in polygeneration schemes, viable
EP and a minimum of 75% of plant-wide CO2 emission reduction demonstrate that the
polygeneration Schemes A, D and E can become low carbon technologies of choice.
The present study has contributed some distinguished concepts on synthesising favourable
energy production routes which can be realised in the near future. The design of these advanced
technologies embraced several important aspects: high energy efficiency, economically compelling
and environmentally benign. The consideration of incorporating CO2 reuse pathway has been
demonstrated to be a viable option, subject to the design and integration strategies as well as the
nature of the parent system. Modification of an existing polygeneration system by including more
products may not always create economic incentives, while the performance of a cogeneration
system can be improved by converting it into a polygeneration system. The reuse of CO2 can be
beneficial depending upon the overall integration strategies as well as the nature of the CO2
conversion process. The processes under consideration such as Sabatier’s and reforming reaction
processes, evolved from thermodynamic and process integration synergies, show higher
thermodynamic efficiencies and economic potential compared to their counterpart based CCS
schemes. The polygeneration schemes not dependent on external market for hydrogen supply or
manufacturing player, show better economic incentives. Obviously, the CO2 reuse pathways less
effectively slow down CO2 emission to atmosphere and are more sensitive to CO2 taxation,
compared to CCS.
Polygeneration system exploiting a low carbon feedstock (as exemplified using bio-oil) may
still compete with the coal based polygeneration systems, if renewable products from bio-oil are
given credits. Given that industrialisation will even be at a faster pace and that there will be an
unmet need for fully integrated environmental and economic policies in the interim phase, flexible
CO2 reuse into fuel and chemical productions will be part of low carbon technology roadmap for
Page 29
29
some countries in the interim period before the risks associated with CCS are more holistically
addressed. For moving the low carbon technology forward, thus polygeneration by symbiotic CO2
reuse strategies will be an efficient way.
Nomenclatures
CC Annual capital cost
EP Economic potential
H Total number of operating hours per year
RH Standard enthalpy change of reaction
N Number of events derived from Counting Principle
NP Total number of products
OC Annual operating cost
pi Unit price of product i
ri Production rate of product i
θ Scale factor, equation (6)
Appendix A
The economic parameters required for evaluating capital and operating costs are presented in Table
A.1 and Table A.2, respectively.
Table A.1
Table A.2
Appendix B
Additional data are provided for modelling systems in Schemes C, D and E in ASPEN Plus,
summarised in Table B.1.
Page 30
30
Table B.1
Acknowledgement
The authors express their gratitude to The University of Manchester Alumni Fund and Process
Integration Research Consortium for financial aid to support this research.
References
Adams, T. A. II, Barton, P. I., 2011. Combining coal gasification and natural gas reforming for
efficient polygeneration. Fuel Process. Technol. 92(3), 639-655.
Armstrong, P. A., Bennett, D. L., Foster, E. P., Stein, V. E., 2005. ITM oxygen: the new oxygen
supply for the new IGCC market. In Gasification Technologies, San Francisco, California, 9-12
October.
Barbarossa, V., Capriccioli, A., Sardella, B., Tosti, S., 2009. Carbon dioxide utilisation for methane
production by renewable energy sources. In Sustainable Fossil Fuel for Future Energy, Rome, 8-11
July.
Bridgwater, A. V., 2009. Technical and economic assessment of thermal processes for biofuels,
NNFCC project 08/018, COPE Ltd.
Carbon Recycling International (CRI), 2010. CRI breaks ground for the George Olah Renewable
Methanol Plant. http://www.carbonrecycling.is/
Curie, M., 2010. International space station water system successfully activated, 26th October.
NASA. http://www.nasa.gov/home/hqnews/2010/oct/HQ_10-275_Sabatier_prt.htm.
Page 31
31
Department of Energy and Climate Change (DECC), 2010. Quarterly energy prices: June 2010.
http://www.decc.gov.uk/
Department of Energy and Climate Change (DECC). Renewables Obligation.
http://www.decc.gov.uk/.
Denton, D. L., 2003. Coal gasification–today's technology of choice and tomorrow's bright promise.
In AIChE, East Tennessee Section.
Gunardson, H., 1998. Industrial gases in petrochemical processes. Marcel Dekker, Inc., New York.
Hamelinck, C. N., Faaij, A. P. C., 2002. Future prospects for production of methanol and hydrogen
from biomass. J. Power Sources. 111(1), 1-22.
ICIS Pricing, 2010. http://www.icispricing.com/il_shared/Samples/SubPage95.asp.
Intergovernmental Panel on Climate Change (IPCC), 2005. IPCC special report on carbon dioxide
capture and storage,
http://www.ipcc.ch/publications_and_data/publications_and_data_reports.shtml
Kokossis, A. C., Yang, A., 2010. On the use of systems technologies and a systematic approach for
the synthesis and the design of future biorefineries. Comput. Chem. Eng. 34(9), 1397-1405.
Larson, E. D., Tingjin, R., 2003. Synthetic fuel production by indirect coal liquefaction. Energy for
Sustainable Development. 7(4), 79-102.
Larson, E. D., Jin, H., Celik, F. E., 2005. Gasification-based fuels and electricity production from
biomass, without and with carbon capture and storage, Princeton Environmental Institute, Princeton
University. http://www.princeton.edu/pei/energy/publications/texts/
Page 32
32
Li, Y., Markley, B., Mohan, A. R., Rodriguez-Santiago, V., Thompson, D., Niekerk, D. V., 2006.
Utilization of carbon dioxide from coal-fired power plant for the production of value-added
products, Penn State College of Earth and Mineral Sciences.
http://www.ems.psu.edu/~elsworth/courses/egee580/Utilization_final_report.pdf
Li, Z., Gao, D., Chang, L., Liu, P., Pistikopoulos, E. N., 2010. Coal-derived methanol for hydrogen
vehicles in China: Energy, environment, and economic analysis for distributed reforming. Chem.
Eng. Res. Des. 88(1), 73-80.
MacDowell, N., Florin, N., Buchard, A., Hallett, J., Galindo, A., Jackson, G., Adjiman, C. S.,
Williams, C. K., Shah, N., Fennell, P., 2010. An overview of CO2 capture technologies. Energy &
Environmental Science. 3(11), 1645-1669.
McGlashan, N., Shah, N., Workman M., 2010. The potential for the deployment of negative
emissions technologies in the UK. Work stream 2, Report 18 of the AVOID programme
(AV/WS2/D1/R18). www.avoid.uk.net
Methanex, 2010. Methanol price. www.methanex.com.
National Energy Technology Laboratory (NETL), 2010. Cost and performance baseline for fossil
energy plants volume 1: bituminous coal and natural gas to electricity, DOE/NETL-2010/1397.
Ng, K. S., Lopez, Y., Campbell, G. M., Sadhukhan, J., 2010. Heat integration and analysis of
decarbonised IGCC sites. Chem. Eng. Res. Des. 88(2), 170-188.
Ng, K. S., Sadhukhan, J., 2011a. Process integration and economic analysis of bio-oil platform for
the production of methanol and combined heat and power. Biomass Bioenergy. 35(3), 1153-1169.
Page 33
33
Ng, K. S., Sadhukhan, J., 2011b. Techno-economic performance analysis of bio-oil based Fischer-
Tropsch and CHP synthesis platform. Biomass Bioenergy, 35(7), 3218-3234.
Pires, J. C. M., Martins, F. G., Alvim-Ferraz, M. C. M., Simões, M., 2011. Recent developments on
carbon capture and storage: An overview. Chem. Eng. Res. Des., 89(9), 1446-1460.
Postnote, 2010. Global carbon trading, Number 354. Parliament Office of Science and Technology.
http://www.parliament.uk/documents/documents/upload/postpn354.pdf
Rhodes, J., Keith, D., 2008. Biomass with capture: negative emissions within social and
environmental constraints: an editorial comment. Climatic Change 87(3), 321-328.
Rihko-Struckmann, L. K., Peschel, A., Hanke-Rauschenbach, R., Sundmacher, K., 2010.
Assessment of methanol synthesis utilizing exhaust CO2 for chemical storage of electrical energy.
Ind. Eng. Chem. Res. 49 (21), 11073-11078.
Sadhukhan, J., Zhang, N., Zhu, X. X., 2004. Analytical optimisation of industrial systems and
applications to refineries, petrochemicals. Chem. Eng. Sci. 59 (20), 4169-4192.
Sadhukhan, J., Mustafa, M. A., Misailidis, N., Mateos-Salvador, F., Du, C., Campbell, G. M., 2008.
Value analysis tool for feasibility studies of biorefineries integrated with value added production.
Chem. Eng. Sci. 63(2), 503-519.
Sadhukhan, J., Ng, K. S., 2011. Economic and European Union environmental sustainability criteria
assessment of bio-oil based biofuel systems: refinery integration cases. Ind. Eng. Chem. Res.,
50(11), 6794-6808.
ScottishPower, 2008. ScottishPower announces major coal contract with Scottish coal.
http://www.scottishpower.com/PressReleases_1725.htm
Page 34
34
Sinnott, R. K., 2006. Coulson & Richardson's chemical engineering design volume 6, 4th ed.
Butterworth-Heinemann, Oxford.
Song, C., Pan, W., 2004. Tri-reforming of methane: a novel concept for catalytic production of
industrially useful synthesis gas with desired H2/CO ratios. Catal. Today 98(4), 463-484.
Smith, R., 2005. Chemical process design and integration. John Wiley and Sons Ltd., Chichester,
UK.
Stiegel, G. J., Ramezan, M., 2006. Hydrogen from coal gasification: an economical pathway to a
sustainable energy future. Int. J. Coal. Geol. 65(3-4), 173-190.
Tijmensen, M. J. A., Faaij, A. P. C., Hamelinck, C. N., van Hardeveld, M. R. M., 2002. Exploration
of the possibilities for production of Fischer-Tropsch liquids and power via biomass gasification.
Biomass Bioenergy 23(2), 129-152.
Uhde, 2008. Methanol. http://www.uhde.eu/
United Nations Framework Convention on Climate Change (UNFCCC). Parties & Observers.
http://unfccc.int/parties_and_observers/items/2704.php
United Nations Framework Convention on Climate Change (UNFCCC), 2010. Report of the
conference of the parties on its fifteenth session. Part two: action taken by the conference of the
parties, FCCC/CP/2009/11/Add.1.
http://unfccc.int/resource/docs/2009/cop15/eng/11a01.pdf
Venderbosch, R. H., Prins, W., 2010. Fast pyrolysis technology development. Biofuels, Bioproducts
and Biorefining 4(2), 178-208.
Page 35
35
Xie, C., 2001. Modeling the performance and emissions of integrated gasification combined cycle
based Lurgi ammonia synthesis system. North Carolina State University, US.
http://repository.lib.ncsu.edu/ir/handle/1840.16/1837
Yoneda, N., Kusano, S., Yasui, M., Pujado, P., Wilcher, S., 2001. Recent advances in processes and
catalysts for the production of acetic acid. Appl. Catal. A. 221(1-2), 253-265.
Zhu, Y., Jones, S., 2009. Techno-economic analysis for the thermochemical conversion of
lignocellulosic biomass to ethanol via acetic acid synthesis, PNNL-18483, US DOE.