38
U.S. Fish and Wildlife Service Cognos PowerPlay - User Guide July 2005
U.S. Fish and Wildlife Service Cognos PowerPlay - User Guide July 2005
U.S. Fish and Wildlife Service Submitted by Grant Thornton LLP 333 John Carlyle Street, #500 Alexandria, VA 22314 July 2005

U.S. Fish and Wildlife Service i
Table of contents
Section 1: Cognos PowerPlay......................................................................... 1
1.1 Accessing the ABM PowerPlay Cubes ...............................................1 1.2 Becoming familiar with the layout of the screen..................................2
1.2.1 Using the Dimension Line and Dimension Viewer ..................2 1.2.1.1 Dimension Line............................................................................. 3 1.2.1.2 Dimension Viewer......................................................................... 3
1.2.2 Familiarizing yourself with the PowerPlay Web Explorer Toolbar................................................................................................5 1.2.3 Accessing Cognos PowerPlay Web Help ...............................7
1.3 Applying Basic Functionality with Cognos PowerPlay ........................8 1.3.1 Replacing Rows and Columns in the Crosstab.......................8 1.3.2 Drilling down and drilling up within the Crosstab ..................12 1.3.3 Resetting Dimensions ...........................................................13 1.3.4 Filtering data .........................................................................15 1.3.5 Sorting and Ranking Data.....................................................17
1.3.5.1 Sorting data ................................................................................ 17 1.3.5.2 Ranking data............................................................................... 19
1.3.6 Changing display types.........................................................21 1.3.7 Exporting and Saving Data ...................................................23
1.3.7.1 Exporting Data from Cognos PowerPlay Web Explorer ............. 23 1.3.7.2 Saving Cognos PowerPlay Web Explorer Data.......................... 24
1.4 Exploring More Advanced Functionality with Cognos PowerPlay.....25 1.4.1 Nesting columns and rows in the crosstab ...........................25 1.4.2 Adding a Calculation .............................................................28 1.4.3 Exception Highlighting ..........................................................29 1.4.4 Get Data Function.................................................................31 1.4.5 Custom Subsets....................................................................32
1.4.5.1 Category selection...................................................................... 32 1.4.5.2 Search criteria............................................................................. 34
Use or disclosure of information contained on this page is subject to the restrictions on the title page of this document.
U.S. Fish and Wildlife Service 1
Section 1: Cognos PowerPlay
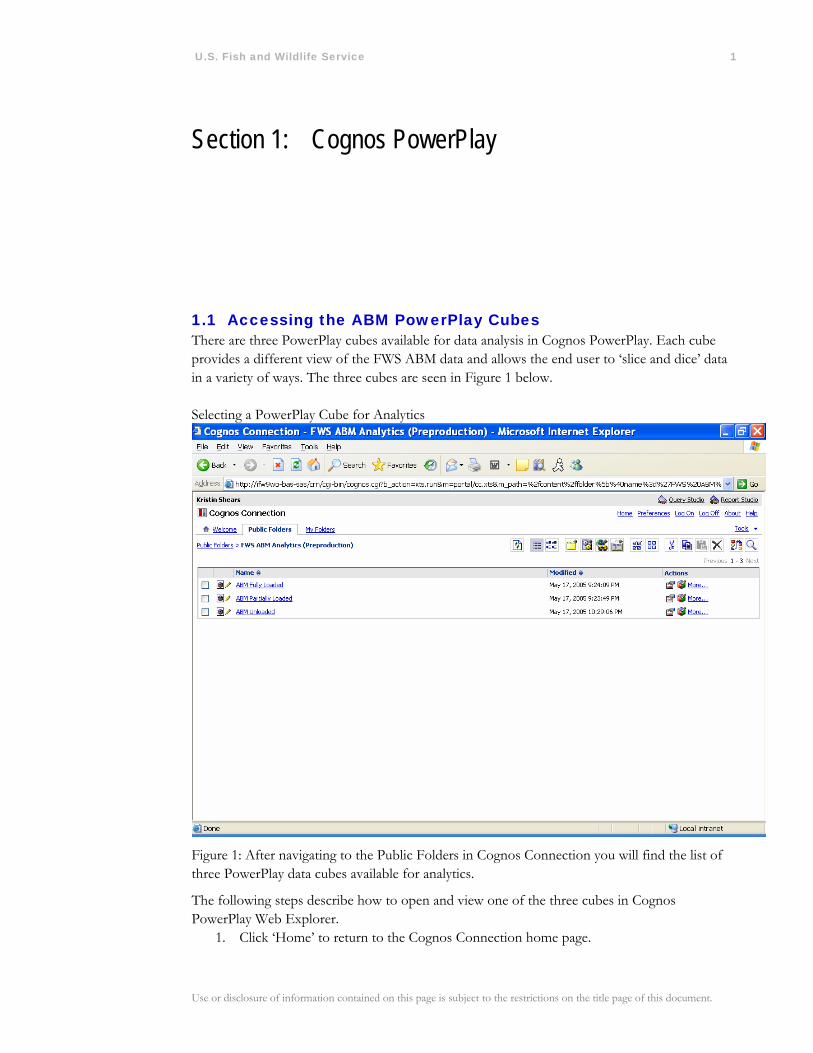
1.1 Accessing the ABM PowerPlay Cubes There are three PowerPlay cubes available for data analysis in Cognos PowerPlay. Each cube provides a different view of the FWS ABM data and allows the end user to ‘slice and dice’ data in a variety of ways. The three cubes are seen in Figure 1 below. Selecting a PowerPlay Cube for Analytics
Figure 1: After navigating to the Public Folders in Cognos Connection you will find the list of three PowerPlay data cubes available for analytics.
The following steps describe how to open and view one of the three cubes in Cognos PowerPlay Web Explorer.
1. Click ‘Home’ to return to the Cognos Connection home page.
Use or disclosure of information contained on this page is subject to the restrictions on the title page of this document.
U.S. Fish and Wildlife Service 2
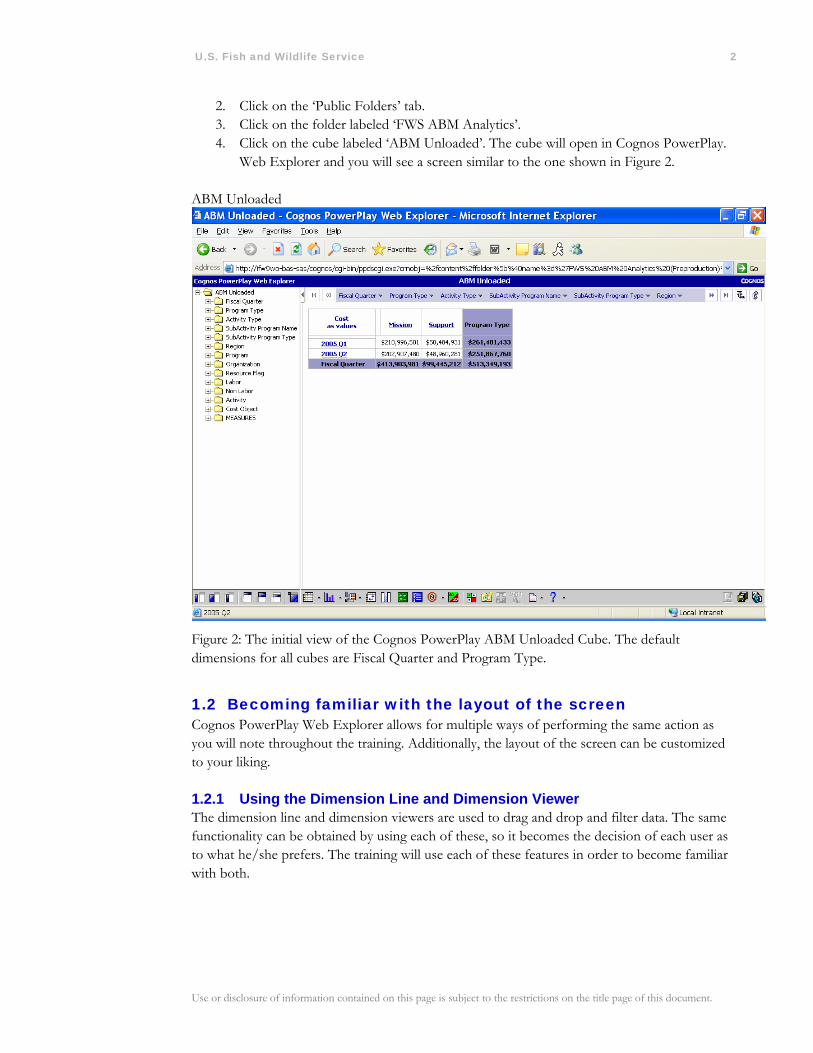
2. Click on the ‘Public Folders’ tab. 3. Click on the folder labeled ‘FWS ABM Analytics’. 4. Click on the cube labeled ‘ABM Unloaded’. The cube will open in Cognos PowerPlay. Web Explorer and you will see a screen similar to the one shown in Figure 2.
ABM Unloaded
Figure 2: The initial view of the Cognos PowerPlay ABM Unloaded Cube. The default dimensions for all cubes are Fiscal Quarter and Program Type.
1.2 Becoming familiar with the layout of the screen Cognos PowerPlay Web Explorer allows for multiple ways of performing the same action as you will note throughout the training. Additionally, the layout of the screen can be customized to your liking.
1.2.1 Using the Dimension Line and Dimension Viewer The dimension line and dimension viewers are used to drag and drop and filter data. The same functionality can be obtained by using each of these, so it becomes the decision of each user as to what he/she prefers. The training will use each of these features in order to become familiar with both.
Use or disclosure of information contained on this page is subject to the restrictions on the title page of this document.
U.S. Fish and Wildlife Service 3
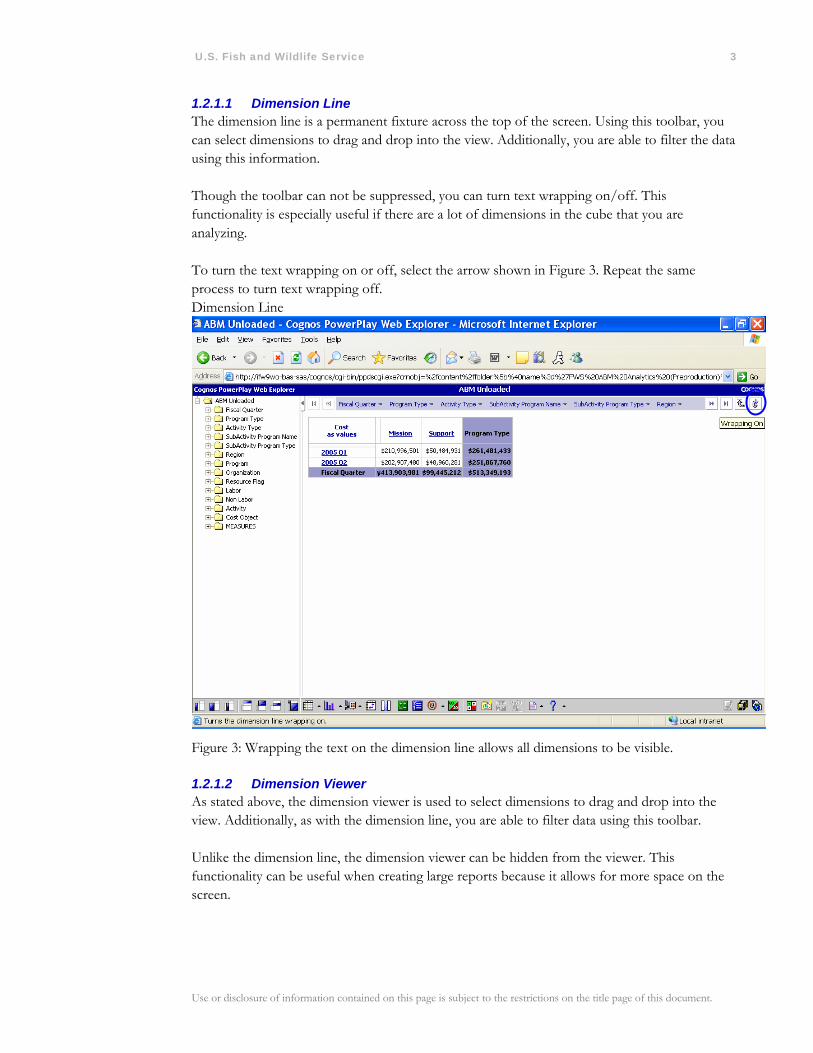
1.2.1.1 Dimension Line The dimension line is a permanent fixture across the top of the screen. Using this toolbar, you can select dimensions to drag and drop into the view. Additionally, you are able to filter the data using this information. Though the toolbar can not be suppressed, you can turn text wrapping on/off. This functionality is especially useful if there are a lot of dimensions in the cube that you are analyzing. To turn the text wrapping on or off, select the arrow shown in Figure 3. Repeat the same process to turn text wrapping off. Dimension Line
Figure 3: Wrapping the text on the dimension line allows all dimensions to be visible.
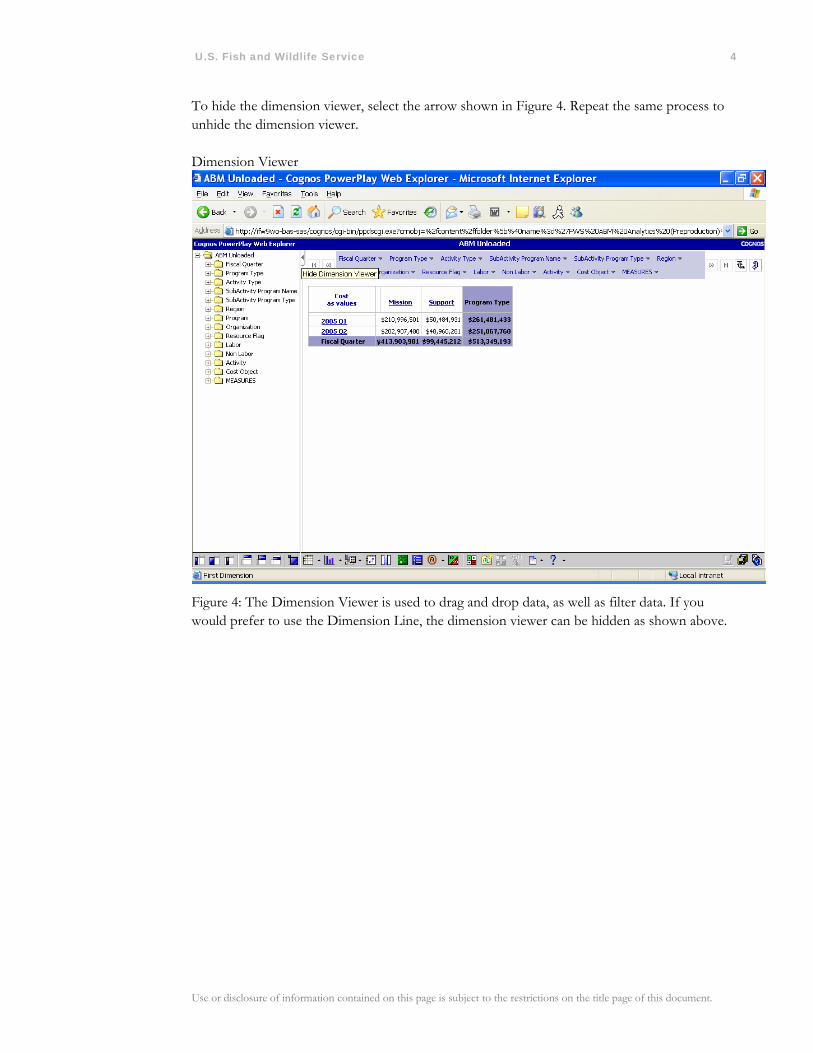
1.2.1.2 Dimension Viewer As stated above, the dimension viewer is used to select dimensions to drag and drop into the view. Additionally, as with the dimension line, you are able to filter data using this toolbar. Unlike the dimension line, the dimension viewer can be hidden from the viewer. This functionality can be useful when creating large reports because it allows for more space on the screen.
Use or disclosure of information contained on this page is subject to the restrictions on the title page of this document.
U.S. Fish and Wildlife Service 4
To hide the dimension viewer, select the arrow shown in Figure 4. Repeat the same process to unhide the dimension viewer. Dimension Viewer
Figure 4: The Dimension Viewer is used to drag and drop data, as well as filter data. If you would prefer to use the Dimension Line, the dimension viewer can be hidden as shown above.
Use or disclosure of information contained on this page is subject to the restrictions on the title page of this document.
U.S. Fish and Wildlife Service 5
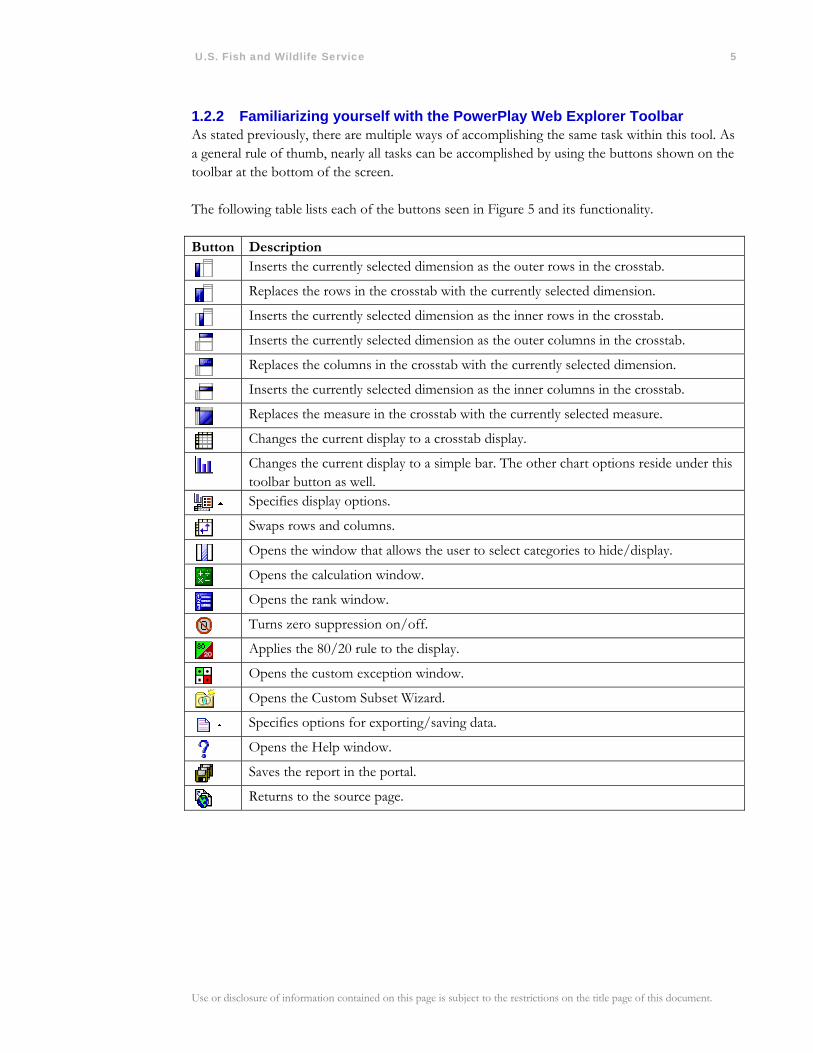
1.2.2 Familiarizing yourself with the PowerPlay Web Explorer Toolbar As stated previously, there are multiple ways of accomplishing the same task within this tool. As a general rule of thumb, nearly all tasks can be accomplished by using the buttons shown on the toolbar at the bottom of the screen. The following table lists each of the buttons seen in Figure 5 and its functionality. Button Description
Inserts the currently selected dimension as the outer rows in the crosstab.
Replaces the rows in the crosstab with the currently selected dimension.
Inserts the currently selected dimension as the inner rows in the crosstab.
Inserts the currently selected dimension as the outer columns in the crosstab.
Replaces the columns in the crosstab with the currently selected dimension.
Inserts the currently selected dimension as the inner columns in the crosstab.
Replaces the measure in the crosstab with the currently selected measure.
Changes the current display to a crosstab display.
Changes the current display to a simple bar. The other chart options reside under this toolbar button as well.
Specifies display options.
Swaps rows and columns.
Opens the window that allows the user to select categories to hide/display.
Opens the calculation window.
Opens the rank window.
Turns zero suppression on/off.
Applies the 80/20 rule to the display.
Opens the custom exception window.
Opens the Custom Subset Wizard.
Specifies options for exporting/saving data.
Opens the Help window.
Saves the report in the portal.
Returns to the source page.
Use or disclosure of information contained on this page is subject to the restrictions on the title page of this document.

U.S. Fish and Wildlife Service 6
Web Explorer Toolbar
Figure 5: The Web Explorer toolbar allows the end user one-click access to specific functions within the tool.
Use or disclosure of information contained on this page is subject to the restrictions on the title page of this document.

U.S. Fish and Wildlife Service 7
1.2.3 Accessing Cognos PowerPlay Web Help If there is additional functionality that you are interested in, or if you have problems with any of the features, Cognos provides a robust Online Help tool.
To access the Online Help, click the Help button on the toolbar. The Online Help menu, shown in Figure 6, will appear. Cognos PowerPlay Web Help
Figure 6: The PowerPlay Web Help menu allows the end user to search through the contents, index, or glossary to find additional information on PowerPlay Web Explorer.
Use or disclosure of information contained on this page is subject to the restrictions on the title page of this document.

U.S. Fish and Wildlife Service 8
1.3 Applying Basic Functionality with Cognos PowerPlay Cognos PowerPlay Web Explorer offers a great deal of functionality for reporting and analysis. During this section, you will become familiar with the following basic functions:
• Replacing rows and columns • Drilling down/drilling up • Resetting dimensions • Filtering data • Sorting/Ranking data • Changing display types • Exporting and Saving data
These functions are essential in navigating throughout each of the cubes. After mastering these techniques, you will be able to advance to the other techniques depicted in 1.4: Exploring More Advanced Functionality with Cognos PowerPlay
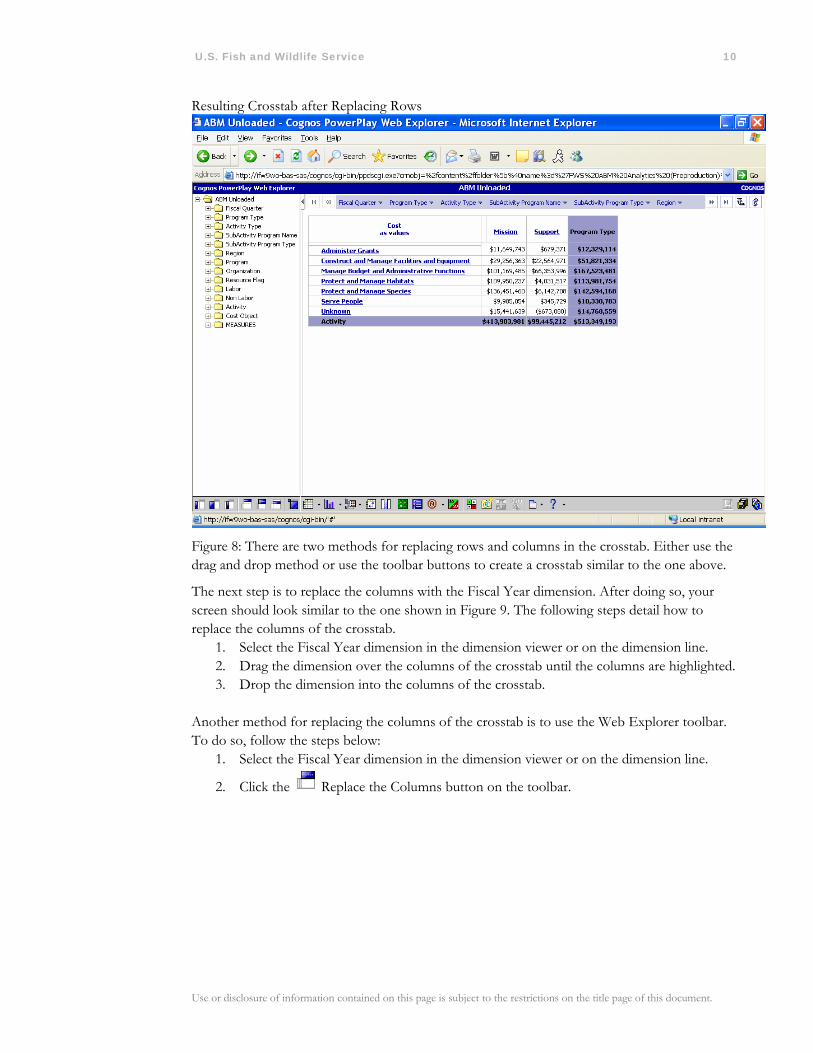
1.3.1 Replacing Rows and Columns in the Crosstab As you may have noticed when opening the ABM Unloaded PowerPlay cube, there are default dimensions that appear as rows and columns within the crosstab. Each time you access one of the cubes, the rows will contain Fiscal Quarter and the Columns will contain Program Type. Please refer to Figure 5 to view the default dimensions. One of the main functions of the PowerPlay tool is being able to ‘slice and dice’ data. This is done by selecting the dimensions you wish to analyze and replacing the rows and columns in the crosstab. For this exercise, we will perform this action using the dimension viewer. You can accomplish the same task by using the dimension line.
Use or disclosure of information contained on this page is subject to the restrictions on the title page of this document.

U.S. Fish and Wildlife Service 9
Replacing Rows of the Crosstab
Figure 7: When using the drag and drop functionality of Cognos PowerPlay, you will notice that the dimension and destination is highlighted. This allows you to determine exactly where you would like to place the data.
The following steps detail how to replace the rows of the crosstab:
1. Select the Activity dimension in the dimension viewer or on the dimension line. 2. Drag the dimension over the rows of the crosstab until the rows are highlighted. 3. Drop the dimension into the rows of the crosstab.
Another method for replacing the rows of the crosstab is to use the Web Explorer toolbar. To do so, follow the steps below:
1. Select the Activity dimension in the dimension viewer or on the dimension line.
2. Click the Replace the Rows button on the toolbar. The resulting crosstab should look like the one shown in Figure 8.
Use or disclosure of information contained on this page is subject to the restrictions on the title page of this document.
U.S. Fish and Wildlife Service 10
Resulting Crosstab after Replacing Rows
Figure 8: There are two methods for replacing rows and columns in the crosstab. Either use the drag and drop method or use the toolbar buttons to create a crosstab similar to the one above.
The next step is to replace the columns with the Fiscal Year dimension. After doing so, your screen should look similar to the one shown in Figure 9. The following steps detail how to replace the columns of the crosstab.
1. Select the Fiscal Year dimension in the dimension viewer or on the dimension line. 2. Drag the dimension over the columns of the crosstab until the columns are highlighted. 3. Drop the dimension into the columns of the crosstab.
Another method for replacing the columns of the crosstab is to use the Web Explorer toolbar. To do so, follow the steps below:
1. Select the Fiscal Year dimension in the dimension viewer or on the dimension line.
2. Click the Replace the Columns button on the toolbar.
Use or disclosure of information contained on this page is subject to the restrictions on the title page of this document.

U.S. Fish and Wildlife Service 11
Resulting Crosstab after Replacing Columns
Figure 9: There are two methods for replacing rows and columns in the crosstab. Use either the drag and drop method or the toolbar buttons to create a crosstab similar to the one above.
Use or disclosure of information contained on this page is subject to the restrictions on the title page of this document.

U.S. Fish and Wildlife Service 12
1.3.2 Drilling down and drilling up within the Crosstab Cognos PowerPlay allows you to drill down to a lower level of detail within the data cube. Additionally, if you prefer to view a higher level of detail, you are able to drill up through the data. To drill down within a data cube, simply click on the hyperlink on each dimension. For this example we will drill into the Administer Grants process. To do so, click on ‘Administer Grants’. Resulting crosstab after drilling down into Administer Grants
Figure 10: By clicking on the Administer Grants hyperlink, we are now exposed to a lower level of detail. Instead of viewing all process costs, we are now viewing the costs of Administer Grant activities.
Drilling up through the data is just as simple as drilling down into the data. To drill back up to the highest level, click on Administer Grants. You will return to the original view shown in Figure 9.
Use or disclosure of information contained on this page is subject to the restrictions on the title page of this document.
U.S. Fish and Wildlife Service 13
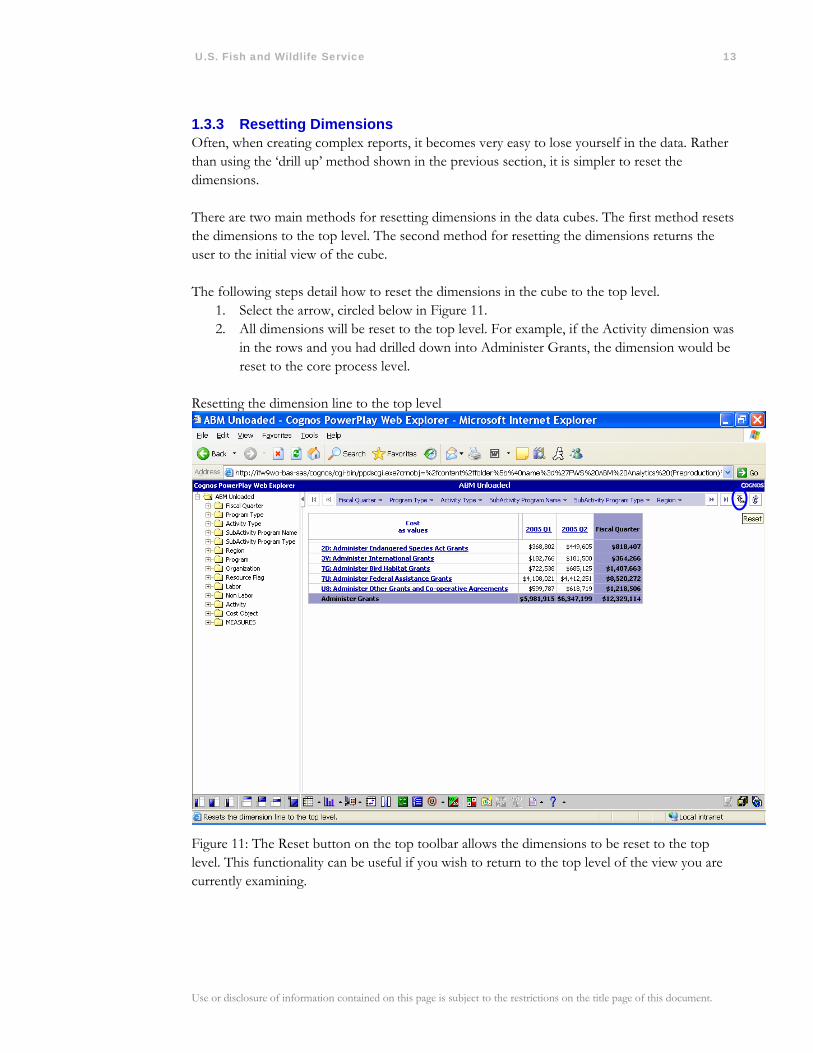
1.3.3 Resetting Dimensions Often, when creating complex reports, it becomes very easy to lose yourself in the data. Rather than using the ‘drill up’ method shown in the previous section, it is simpler to reset the dimensions. There are two main methods for resetting dimensions in the data cubes. The first method resets the dimensions to the top level. The second method for resetting the dimensions returns the user to the initial view of the cube. The following steps detail how to reset the dimensions in the cube to the top level.
1. Select the arrow, circled below in Figure 11. 2. All dimensions will be reset to the top level. For example, if the Activity dimension was
in the rows and you had drilled down into Administer Grants, the dimension would be reset to the core process level.
Resetting the dimension line to the top level
Figure 11: The Reset button on the top toolbar allows the dimensions to be reset to the top level. This functionality can be useful if you wish to return to the top level of the view you are currently examining.
Use or disclosure of information contained on this page is subject to the restrictions on the title page of this document.
U.S. Fish and Wildlife Service 14
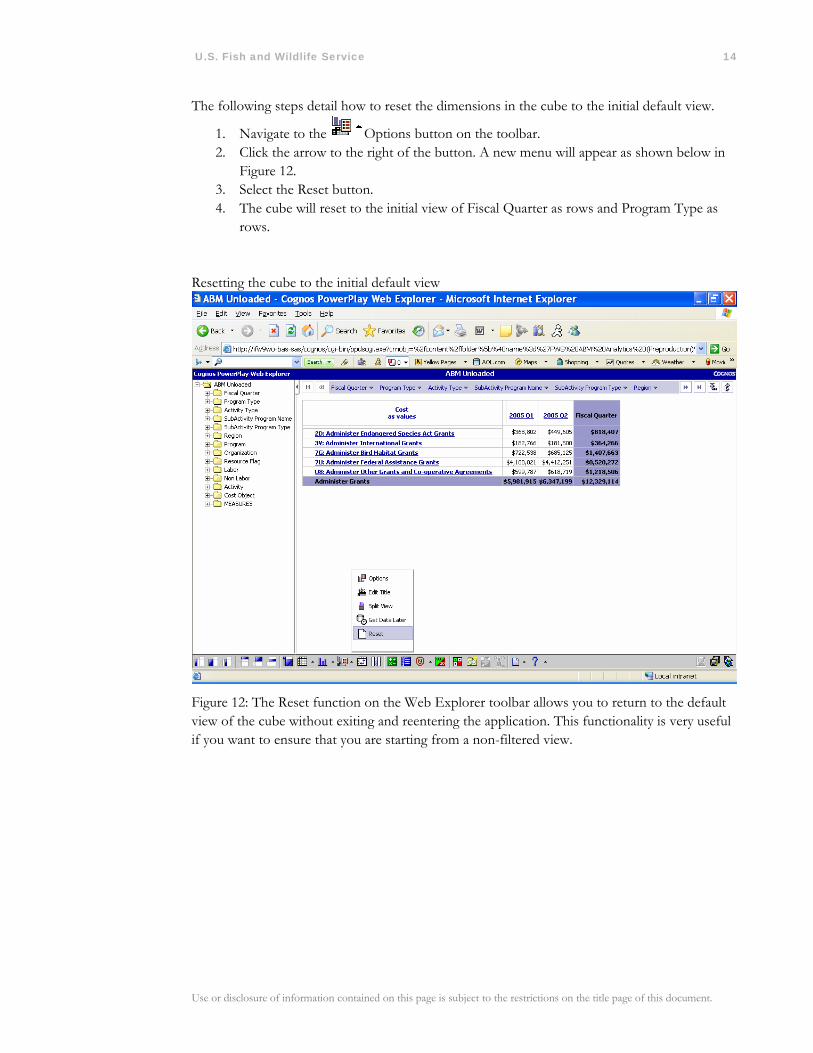
The following steps detail how to reset the dimensions in the cube to the initial default view.
1. Navigate to the Options button on the toolbar. 2. Click the arrow to the right of the button. A new menu will appear as shown below in
Figure 12. 3. Select the Reset button. 4. The cube will reset to the initial view of Fiscal Quarter as rows and Program Type as
rows.
Resetting the cube to the initial default view
Figure 12: The Reset function on the Web Explorer toolbar allows you to return to the default view of the cube without exiting and reentering the application. This functionality is very useful if you want to ensure that you are starting from a non-filtered view.
Use or disclosure of information contained on this page is subject to the restrictions on the title page of this document.

U.S. Fish and Wildlife Service 15
1.3.4 Filtering data One of the most common functions in Cognos PowerPlay is filtering, or excluding, specific pieces of the data. Filtering allows you to ‘slice’ the data on a specific dimension member. For example, if you are interested in viewing costs for one specific region, you can filter your reports on that region. As with all of the functions in Cognos PowerPlay Web Explorer, filtering data can be accomplished in multiple ways. For this task we will be using the dimension line. The same result can be obtained by using the dimension viewer. Filtering data using the dimension line
Figure 13: After selecting the dimension that you wish to filter on, the list of all dimension members will load. Select the specific dimension member from this list. Note: You can filter on as many dimensions as you see fit.
The following steps specify how to filter data using the dimension line.
1. Use the reset function on the Cognos PowerPlay Web Explorer toolbar to return to the default view of the cube.
2. Click the Region dimension on the dimension line. The dimension members, or regions, will load beneath the Region as shown in Figure 13.
3. Select Region 1 and the crosstab will refresh.
Use or disclosure of information contained on this page is subject to the restrictions on the title page of this document.

U.S. Fish and Wildlife Service 16
4. Ensure that you are filtered on Region 1 data by looking at the dimension line. Instead of seeing Region as a dimension, you should see Region 1 – Pacific. Your screen should look like the one in Figure 14.
Resulting crosstab after filtering on Region 1
Figure 14: After filtering on a specific dimension member, the dimension title will be replaced with the dimension member in the dimension line. Notice that the Region dimension has been replaced with Region 1 – Pacific.
Another method for filtering data is to use the Dimension Viewer. To do so, follow the steps below:
1. Expand the Region folder in the Dimension Viewer on the left-hand side of the screen. 2. Right-click on ‘Region 1 – Pacific’. 3. Select Filter from the menu that appears and the crosstab will refresh. 4. Ensure that you are filtered on Region 1 data by looking at the dimension line. Instead
of seeing Region as a dimension, you should see Region 1 – Pacific. Your screen should look like the one in Figure 14.
To remove the filters, either reset the dimensions to your cube or follow the steps above, substituting Region for Region 1 – Pacific, to filter on the dimension.
Use or disclosure of information contained on this page is subject to the restrictions on the title page of this document.

U.S. Fish and Wildlife Service 17
1.3.5 Sorting and Ranking Data Often times, the end user will want the ability to sort and rank data. Cognos PowerPlay Web Explorer allows for this functionality.
1.3.5.1 Sorting data For this example, we will sort core process costs by total cost. Before beginning this exercise, place the Activity dimension as rows and Program Type as columns. The subsequent steps describe how to sort data.
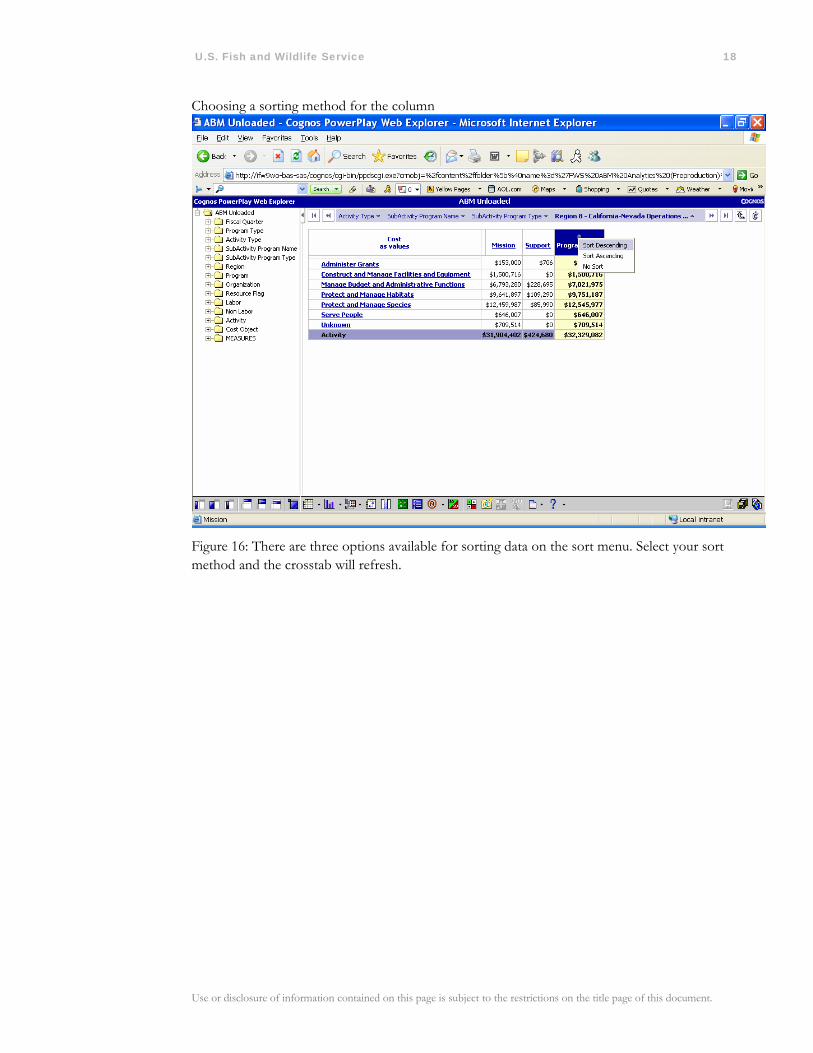
1. Select the column that you wish to sort. To do so, click in the column heading. The entire column should now be highlighted as shown in Figure 15.
2. Click the arrows that are now displayed above the column heading. A new menu will appear.
3. Select the sort method that you wish to use. For this example, we will sort descending. This selection is shown in Figure 16.
Selecting the column to sort
Figure 15: In order to sort data, you must first select the column that you wish to sort. Ensure that the entire column is highlighted prior to proceeding.
Use or disclosure of information contained on this page is subject to the restrictions on the title page of this document.
U.S. Fish and Wildlife Service 18
Choosing a sorting method for the column
Figure 16: There are three options available for sorting data on the sort menu. Select your sort method and the crosstab will refresh.
Use or disclosure of information contained on this page is subject to the restrictions on the title page of this document.
U.S. Fish and Wildlife Service 19
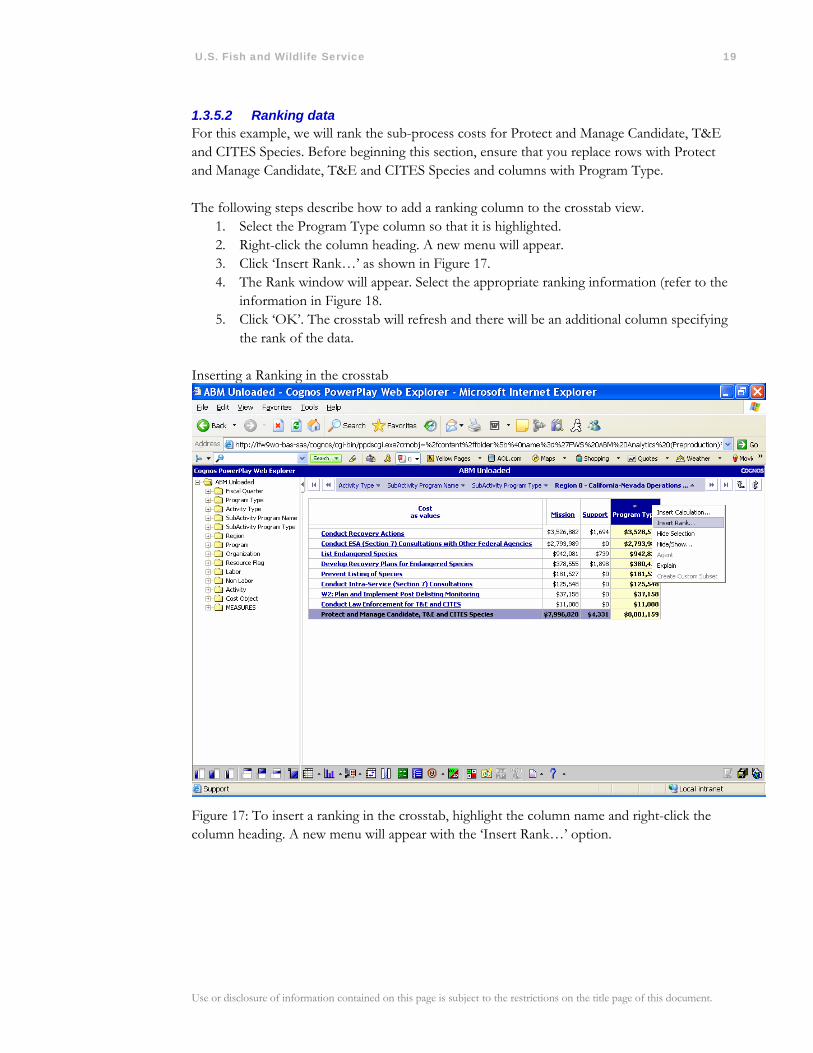
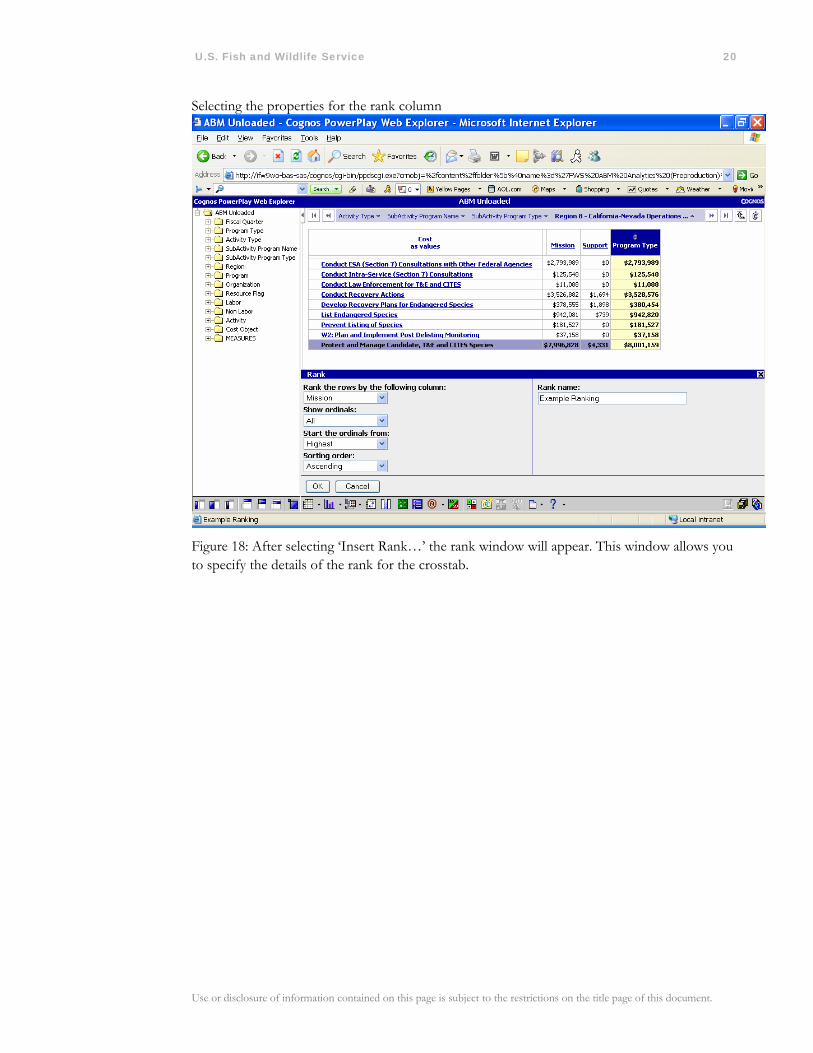
1.3.5.2 Ranking data For this example, we will rank the sub-process costs for Protect and Manage Candidate, T&E and CITES Species. Before beginning this section, ensure that you replace rows with Protect and Manage Candidate, T&E and CITES Species and columns with Program Type. The following steps describe how to add a ranking column to the crosstab view.
1. Select the Program Type column so that it is highlighted. 2. Right-click the column heading. A new menu will appear. 3. Click ‘Insert Rank…’ as shown in Figure 17. 4. The Rank window will appear. Select the appropriate ranking information (refer to the
information in Figure 18. 5. Click ‘OK’. The crosstab will refresh and there will be an additional column specifying
the rank of the data. Inserting a Ranking in the crosstab
Figure 17: To insert a ranking in the crosstab, highlight the column name and right-click the column heading. A new menu will appear with the ‘Insert Rank…’ option.
Use or disclosure of information contained on this page is subject to the restrictions on the title page of this document.
U.S. Fish and Wildlife Service 20
Selecting the properties for the rank column
Figure 18: After selecting ‘Insert Rank…’ the rank window will appear. This window allows you to specify the details of the rank for the crosstab.
Use or disclosure of information contained on this page is subject to the restrictions on the title page of this document.
U.S. Fish and Wildlife Service 21
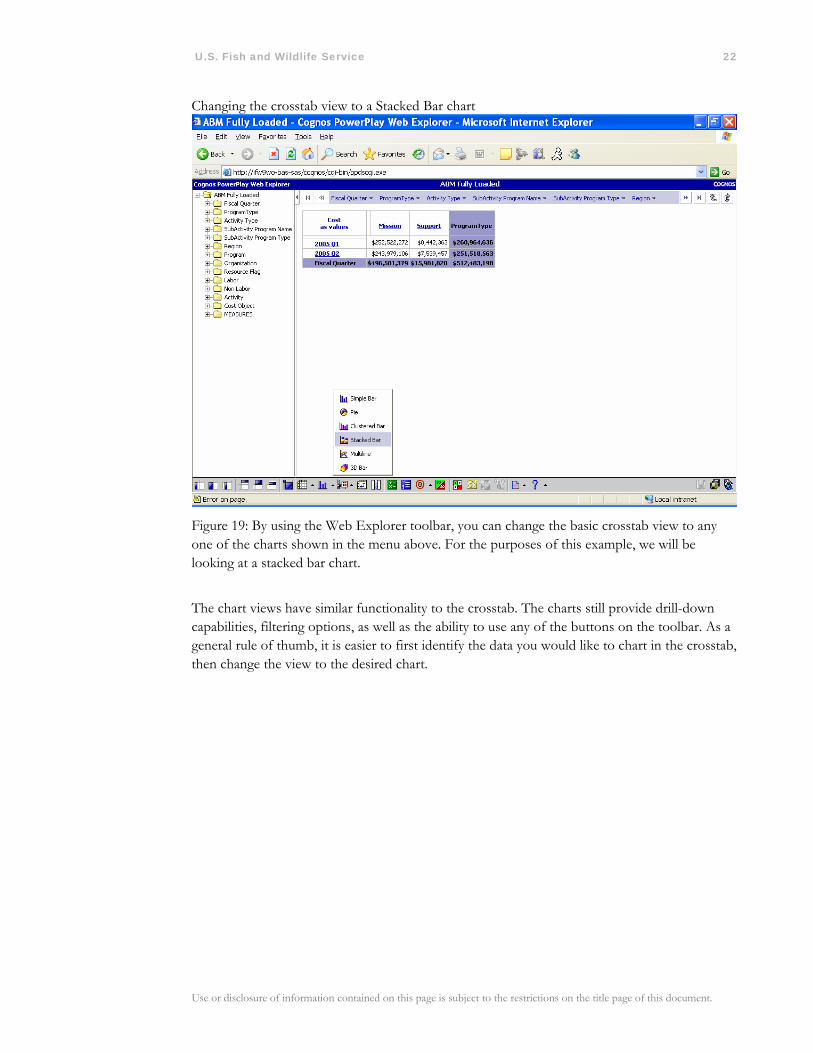
1.3.6 Changing display types Cognos PowerPlay Web Explorer allows users to not only view the cube data in a crosstab format, but also allows for users to view the following types of charts:
• Simple Bar
• Pie
• Clustered Bar
• Stacked Bar
• Multiline
• 3D Bar In this example, we will change the initial default crosstab view to a stacked bar. The subsequent steps describe how to change from a crosstab view to a stacked bar chart. Additionally, we will create a Split View to show both the crosstab and the chart in the same screen.
1. Reset the dimensions of the cube to the initial view by using the reset function on the Web Explorer toolbar. Refer to Section 1.3.3.
2. Find the Simple Bar icon on the toolbar. Click the arrow next to the icon and a new menu will appear. Refer to Figure 19.
3. Select Stacked Bar from the menu. The crosstab will change to a Stacked Bar chart. 4. Now you are only able to view the chart. To view the crosstab and the chart in the
same pane, click the arrow next to Display Options. You will see ‘Split View’ on the menu.
5. Click ‘Split View’ and the chart and crosstab will both be visible.
Use or disclosure of information contained on this page is subject to the restrictions on the title page of this document.
U.S. Fish and Wildlife Service 22
Changing the crosstab view to a Stacked Bar chart
Figure 19: By using the Web Explorer toolbar, you can change the basic crosstab view to any one of the charts shown in the menu above. For the purposes of this example, we will be looking at a stacked bar chart.
The chart views have similar functionality to the crosstab. The charts still provide drill-down capabilities, filtering options, as well as the ability to use any of the buttons on the toolbar. As a general rule of thumb, it is easier to first identify the data you would like to chart in the crosstab, then change the view to the desired chart.
Use or disclosure of information contained on this page is subject to the restrictions on the title page of this document.

U.S. Fish and Wildlife Service 23
1.3.7 Exporting and Saving Data Cognos PowerPlay provides two options for saving data. The ability to Export the data to another program, such as Microsoft Excel, is inherent in the product. Additionally, you are able to save the view to the portal.
1.3.7.1 Exporting Data from Cognos PowerPlay Web Explorer Cognos PowerPlay provides three options for exporting:
• .PDF • .CSV • .XLS
For the purpose of this example, we will export to Excel (.XLS). All of the exports will work in the same manner as the Excel example. The following steps detail how to export data to Excel.
1. Click File on the toolbar. 2. Select ‘Export XLS’ from menu. 3. Click ‘Open’ when the File Download window appears. 4. The data will open in MS Excel as shown in Figure 20. Now you can use MS Excel’s
functionality and save the file to your hard drive. Exporting Data to MS Excel
Figure 20: Results of data export to MS Excel. Note that when you export from PowerPlay, the resulting Excel file is already formatted.
Use or disclosure of information contained on this page is subject to the restrictions on the title page of this document.
U.S. Fish and Wildlife Service 24
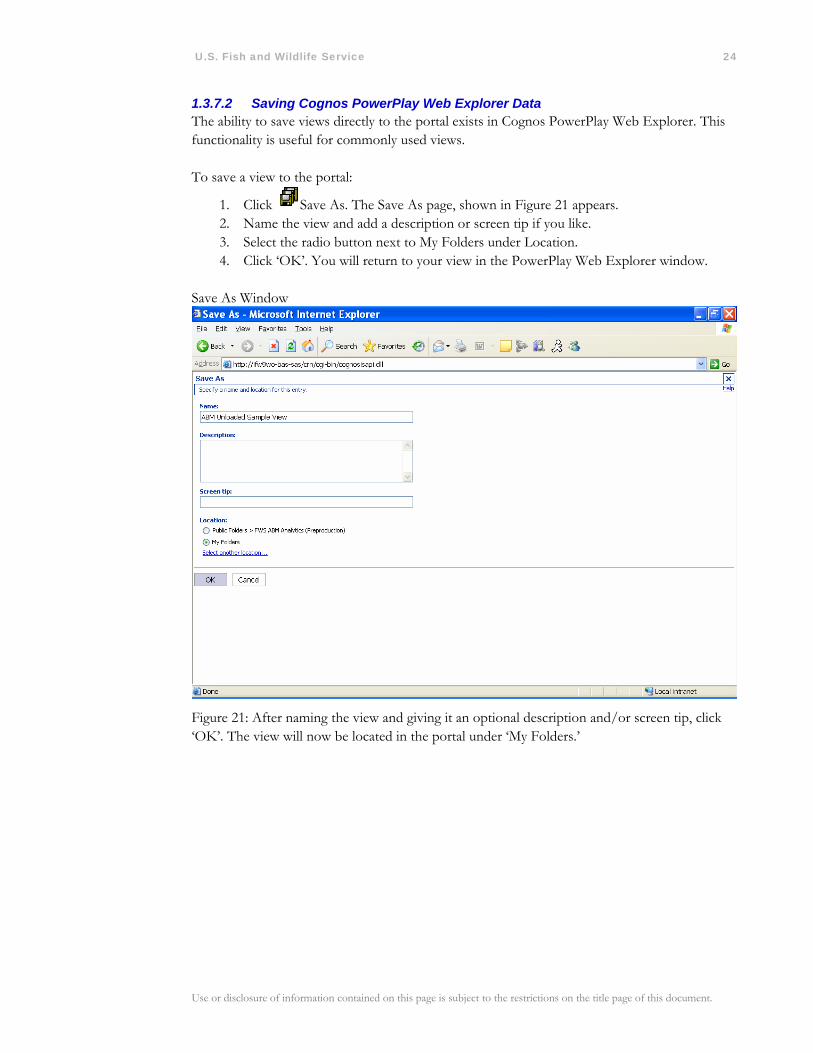
1.3.7.2 Saving Cognos PowerPlay Web Explorer Data The ability to save views directly to the portal exists in Cognos PowerPlay Web Explorer. This functionality is useful for commonly used views. To save a view to the portal:
1. Click Save As. The Save As page, shown in Figure 21 appears. 2. Name the view and add a description or screen tip if you like. 3. Select the radio button next to My Folders under Location. 4. Click ‘OK’. You will return to your view in the PowerPlay Web Explorer window.
Save As Window
Figure 21: After naming the view and giving it an optional description and/or screen tip, click ‘OK’. The view will now be located in the portal under ‘My Folders.’
Use or disclosure of information contained on this page is subject to the restrictions on the title page of this document.
U.S. Fish and Wildlife Service 25
1.4 Exploring More Advanced Functionality with Cognos PowerPlay
Cognos PowerPlay is truly a robust analytic tool, allowing the end user endless ways of analyzing data. We have explored the basic functionality of the tool; therefore we will now apply the functions to create more complex views of the data. In this section, we will review the following:
• Nesting • Adding a Calculation • Designing Exception Highlighting • Using the Get Data Function • Creating Custom Subsets
o Category Selection o Search Criteria
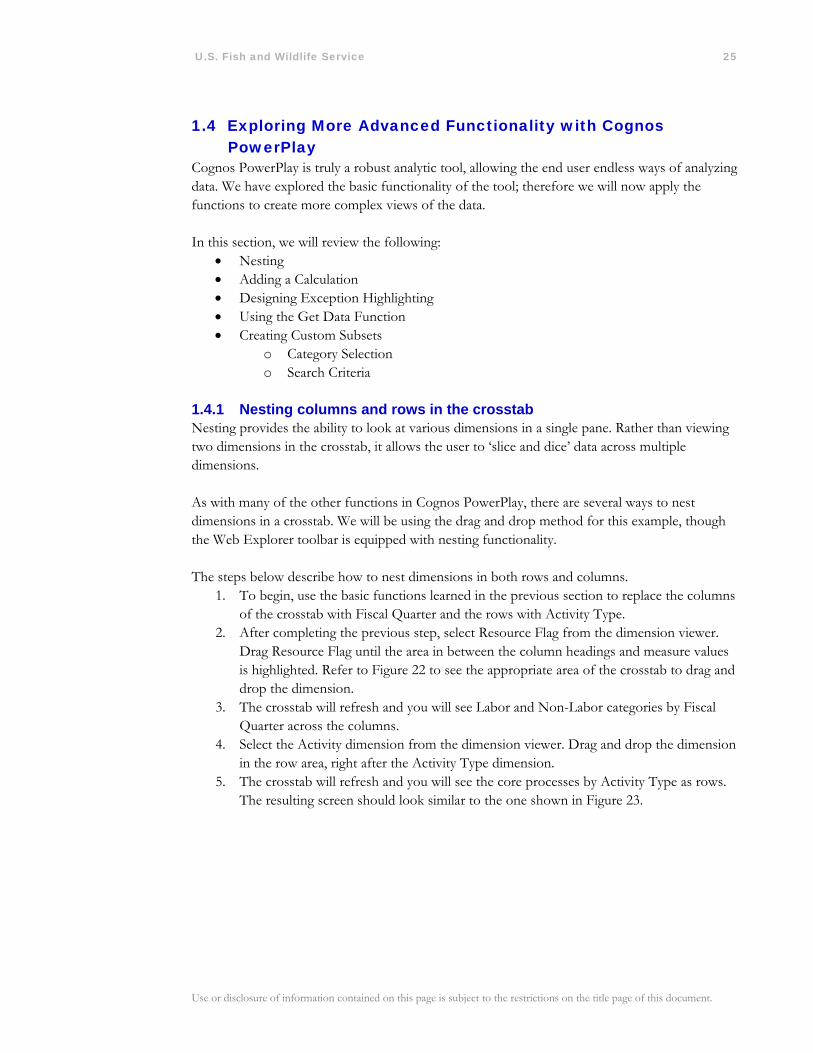
1.4.1 Nesting columns and rows in the crosstab Nesting provides the ability to look at various dimensions in a single pane. Rather than viewing two dimensions in the crosstab, it allows the user to ‘slice and dice’ data across multiple dimensions. As with many of the other functions in Cognos PowerPlay, there are several ways to nest dimensions in a crosstab. We will be using the drag and drop method for this example, though the Web Explorer toolbar is equipped with nesting functionality. The steps below describe how to nest dimensions in both rows and columns.
1. To begin, use the basic functions learned in the previous section to replace the columns of the crosstab with Fiscal Quarter and the rows with Activity Type.
2. After completing the previous step, select Resource Flag from the dimension viewer. Drag Resource Flag until the area in between the column headings and measure values is highlighted. Refer to Figure 22 to see the appropriate area of the crosstab to drag and drop the dimension.
3. The crosstab will refresh and you will see Labor and Non-Labor categories by Fiscal Quarter across the columns.
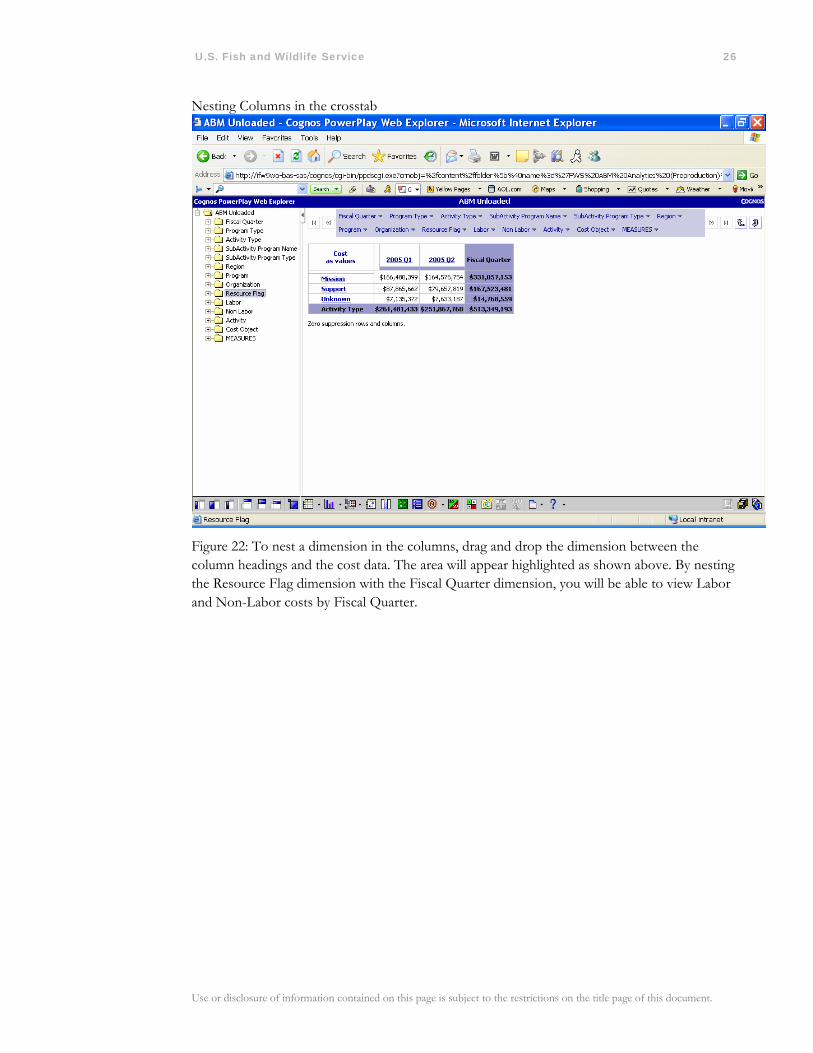
4. Select the Activity dimension from the dimension viewer. Drag and drop the dimension in the row area, right after the Activity Type dimension.
5. The crosstab will refresh and you will see the core processes by Activity Type as rows. The resulting screen should look similar to the one shown in Figure 23.
Use or disclosure of information contained on this page is subject to the restrictions on the title page of this document.
U.S. Fish and Wildlife Service 26
Nesting Columns in the crosstab
Figure 22: To nest a dimension in the columns, drag and drop the dimension between the column headings and the cost data. The area will appear highlighted as shown above. By nesting the Resource Flag dimension with the Fiscal Quarter dimension, you will be able to view Labor and Non-Labor costs by Fiscal Quarter.
Use or disclosure of information contained on this page is subject to the restrictions on the title page of this document.
U.S. Fish and Wildlife Service 27
Resulting crosstab after nesting column data
Figure 23: The resulting crosstab provides quarterly labor and non-labor costs by activity type. Nesting provides a multi-dimensional view of the data.
In order to accomplish this same task with the Web Explorer toolbar, follow the steps listed below.
1. Ensure that the Activity Type dimension is in the rows and the Fiscal Quarter is in the columns.
2. Select the Resource Flag dimension in the dimension viewer.
3. Click Insert After Columns. 4. Select the Activity dimension in the dimension viewer.
5. Click Insert After Rows.
Use or disclosure of information contained on this page is subject to the restrictions on the title page of this document.
U.S. Fish and Wildlife Service 28
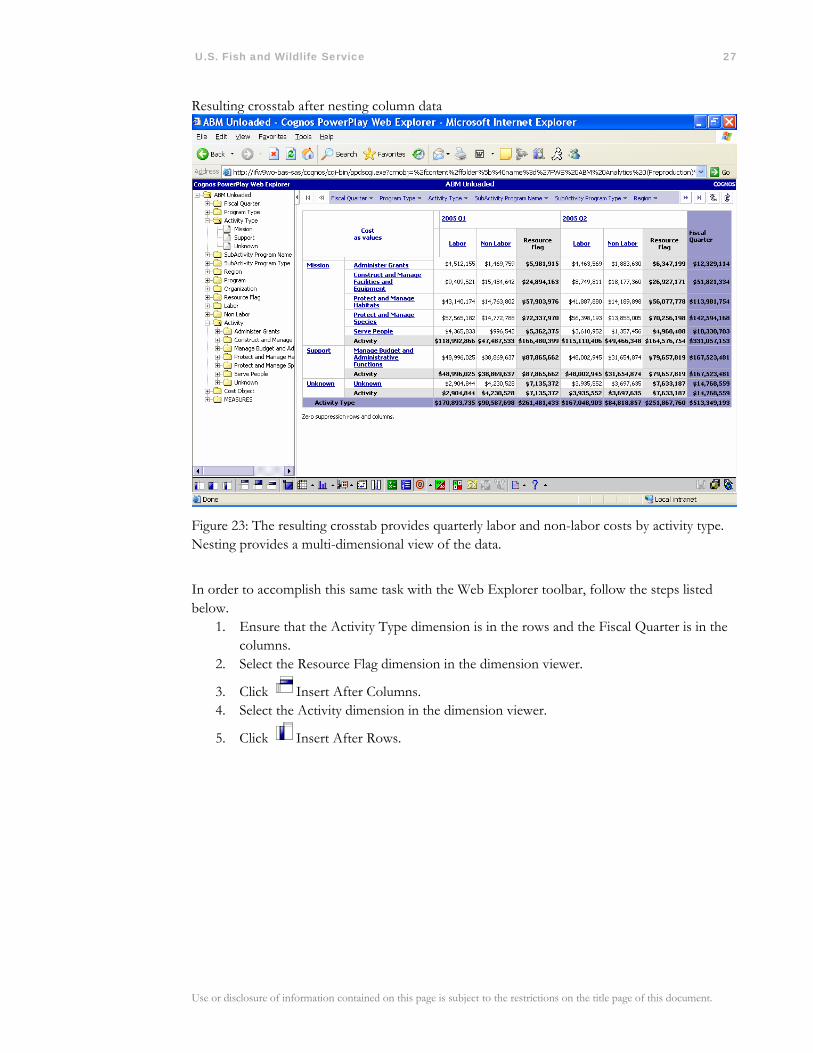
1.4.2 Adding a Calculation Often times, the user will want to insert a calculation within the crosstab. PowerPlay provides the user with the option of inserting a calculation as a row or a column. The following steps describe how to add a calculation to the crosstab. We will be working with the example crosstab shown in Figure 23. Ensure that your crosstab looks similar to the one shown in the previous example.
1. Click in the Mission row so that it is highlighted.
2. Select the Calculation button on the Web Explorer toolbar. 3. Change the Operation drop-down menu to ‘Percent of base.’ 4. Enter a Calculation Name. For the purpose of this example, an appropriate name for
the percentage is Mission Percentage. Your screen should look similar to the one seen in Figure 24.
5. Ensure that Mission is selected as the Category. Click ‘OK’. You will notice a new row appear beneath the Mission row identifying Mission costs as a percentage.
Adding a Calculation to the Crosstab
Figure 24: When inserting a calculated row or column in the crosstab, PowerPlay offers ten predefined operations to choose from. This figure shows the Mission process costs as a percentage of total Mission costs.
Use or disclosure of information contained on this page is subject to the restrictions on the title page of this document.

U.S. Fish and Wildlife Service 29
1.4.3 Exception Highlighting Another useful function found on the Web Explorer toolbar is Exception Highlighting. This is useful if you are analyzing a large data set and are looking for outliers in the data. To add exception highlighting to the crosstab, follow the steps listed below. We will be using the crosstab created in Section 1.4.2.
1. Right-click on the Mission Percentage row that was previously added in the last exercise. Click Delete to remove the calculated percentage.
2. Click Custom Exception Highlighting on the Web Explorer toolbar. 3. Click Add… to create a defined exception. 4. For this example, we will highlight all costs that are above $50,000,000. To do so, type
$50,000,000 in the From field. Select Maximum from the drop-down menu in the To field. Select the desired text and cell color for the exception. Click ‘OK’.
5. Once you have returned to the Exceptions window, ensure that the exception you just created is highlighted. If you did not rename the exception, the name will be Exception1.
6. Click in the cell of the crosstab labeled Cost as Values. You will notice that the row and column headings are now highlighted.
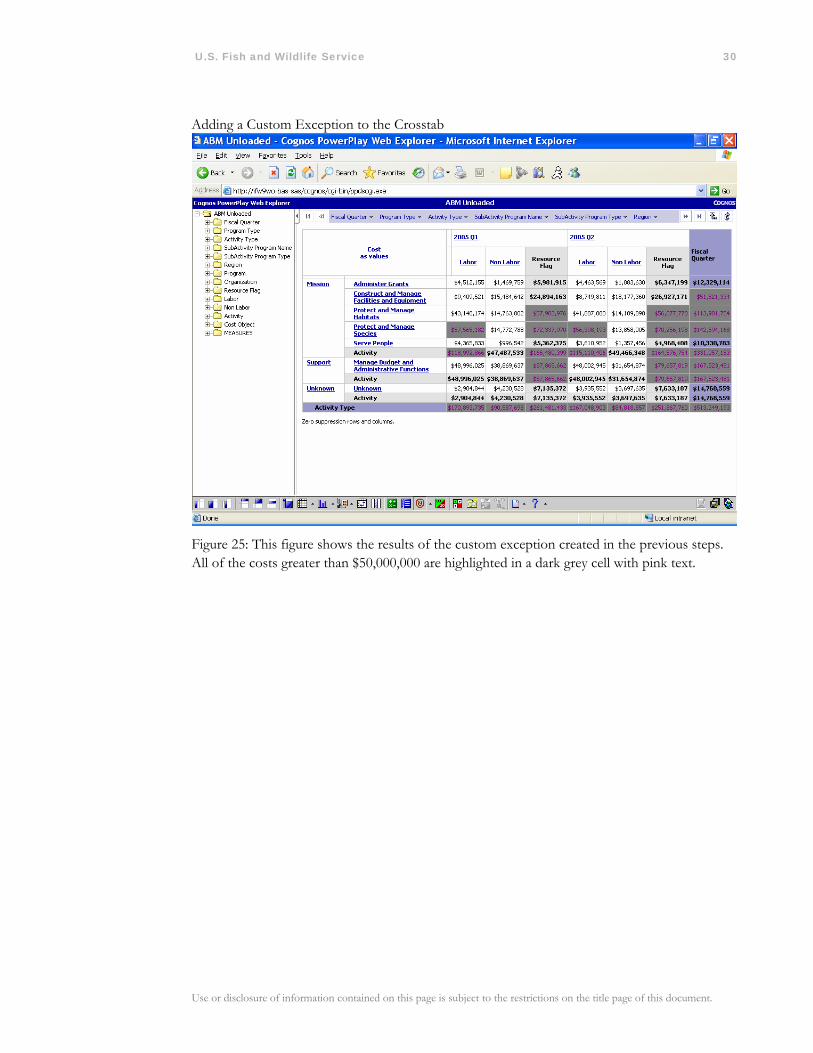
7. Click Apply to apply the custom exception to the crosstab, then click ‘OK’. The crosstab will refresh and you should be able to view the custom exceptions in the crosstab. The results of this particular exception are shown in Figure 25.
Use or disclosure of information contained on this page is subject to the restrictions on the title page of this document.
U.S. Fish and Wildlife Service 30
Adding a Custom Exception to the Crosstab
Figure 25: This figure shows the results of the custom exception created in the previous steps. All of the costs greater than $50,000,000 are highlighted in a dark grey cell with pink text.
Use or disclosure of information contained on this page is subject to the restrictions on the title page of this document.
U.S. Fish and Wildlife Service 31
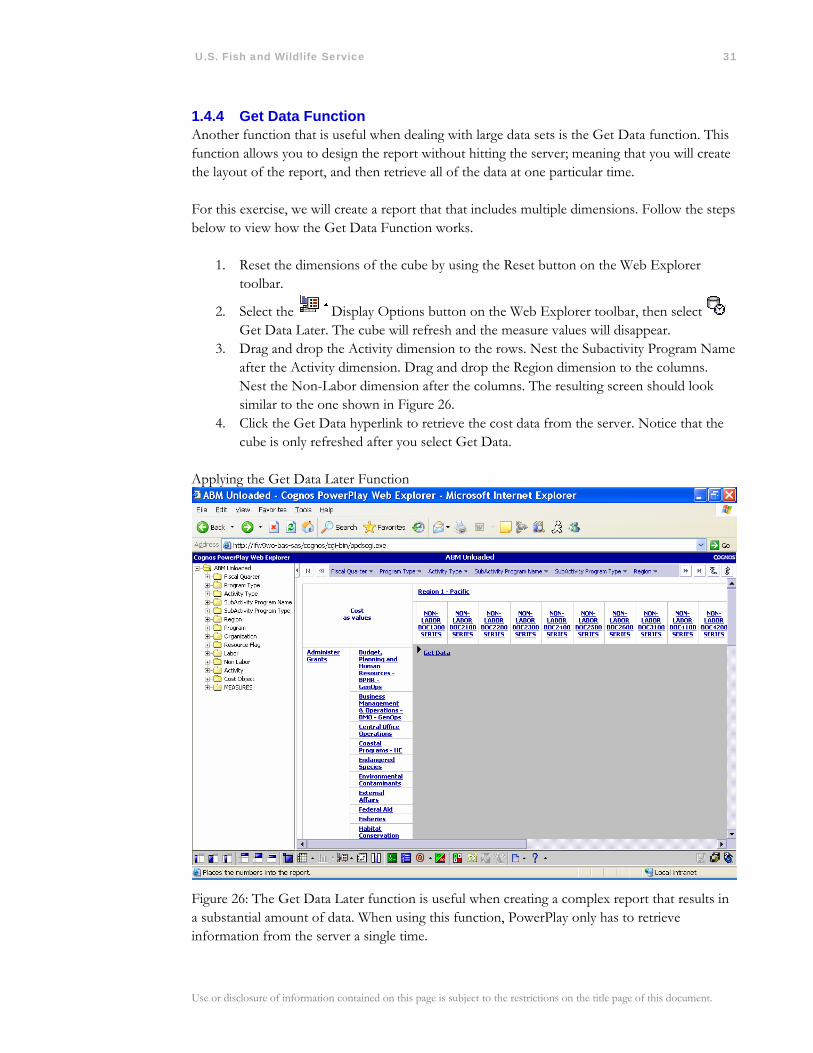
1.4.4 Get Data Function Another function that is useful when dealing with large data sets is the Get Data function. This function allows you to design the report without hitting the server; meaning that you will create the layout of the report, and then retrieve all of the data at one particular time. For this exercise, we will create a report that that includes multiple dimensions. Follow the steps below to view how the Get Data Function works.
1. Reset the dimensions of the cube by using the Reset button on the Web Explorer toolbar.
2. Select the Display Options button on the Web Explorer toolbar, then select Get Data Later. The cube will refresh and the measure values will disappear.
3. Drag and drop the Activity dimension to the rows. Nest the Subactivity Program Name after the Activity dimension. Drag and drop the Region dimension to the columns. Nest the Non-Labor dimension after the columns. The resulting screen should look similar to the one shown in Figure 26.
4. Click the Get Data hyperlink to retrieve the cost data from the server. Notice that the cube is only refreshed after you select Get Data.
Applying the Get Data Later Function
Figure 26: The Get Data Later function is useful when creating a complex report that results in a substantial amount of data. When using this function, PowerPlay only has to retrieve information from the server a single time.
Use or disclosure of information contained on this page is subject to the restrictions on the title page of this document.
U.S. Fish and Wildlife Service 32
1.4.5 Custom Subsets A custom subset is an advanced technique that will allow each user to create a subset of data based on any dimension. This is especially useful if you will need to select specific items for multiple reports. There are several ways to create custom subsets. We will review the following:
• Category Selection • Search Criteria
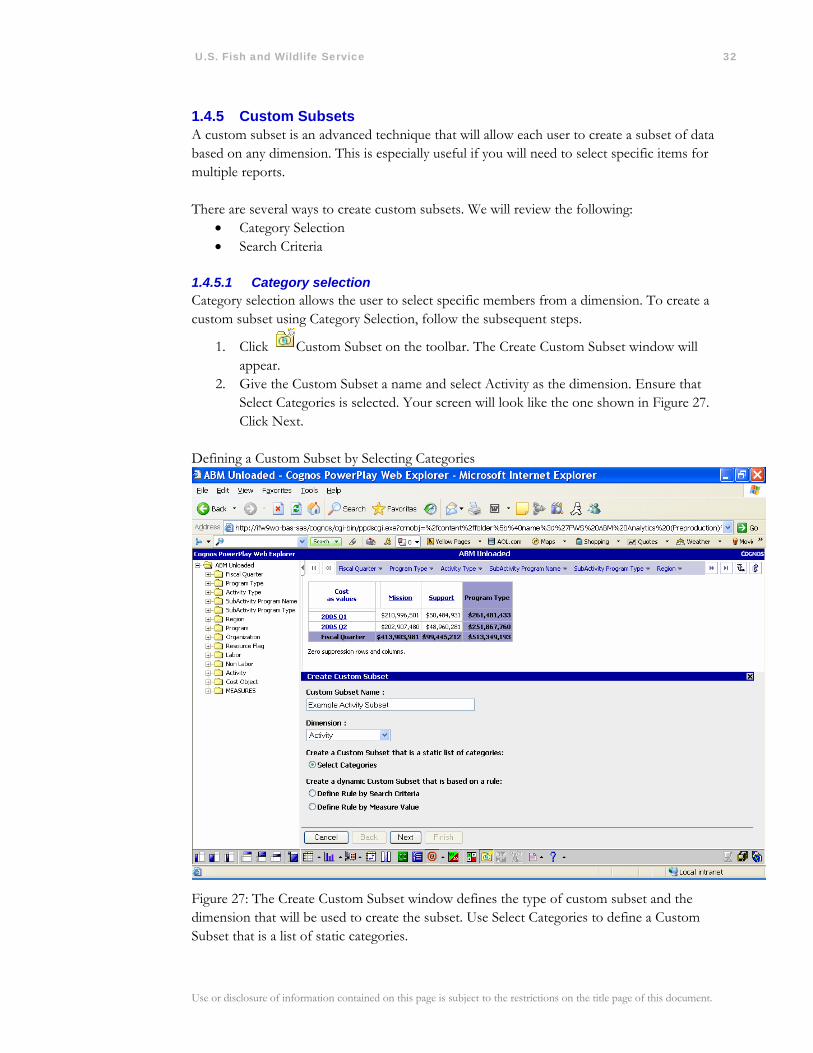
1.4.5.1 Category selection Category selection allows the user to select specific members from a dimension. To create a custom subset using Category Selection, follow the subsequent steps.
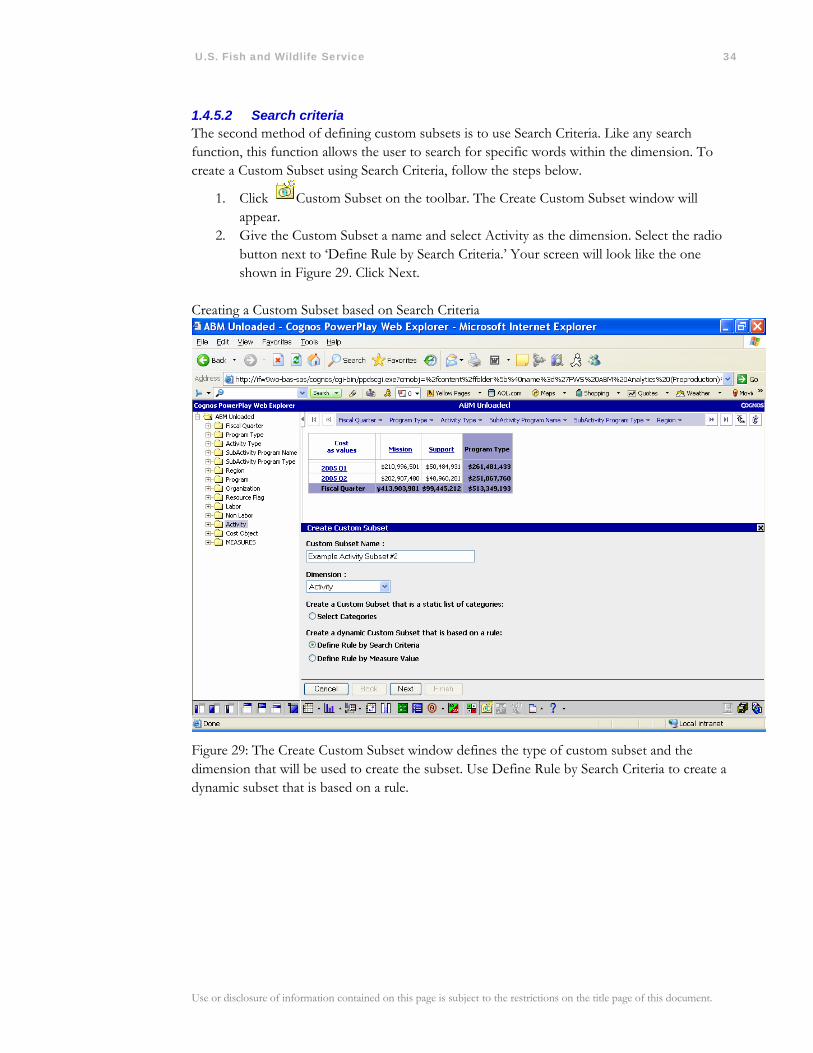
1. Click Custom Subset on the toolbar. The Create Custom Subset window will appear.
2. Give the Custom Subset a name and select Activity as the dimension. Ensure that Select Categories is selected. Your screen will look like the one shown in Figure 27. Click Next.
Defining a Custom Subset by Selecting Categories
Figure 27: The Create Custom Subset window defines the type of custom subset and the dimension that will be used to create the subset. Use Select Categories to define a Custom Subset that is a list of static categories.
Use or disclosure of information contained on this page is subject to the restrictions on the title page of this document.
U.S. Fish and Wildlife Service 33
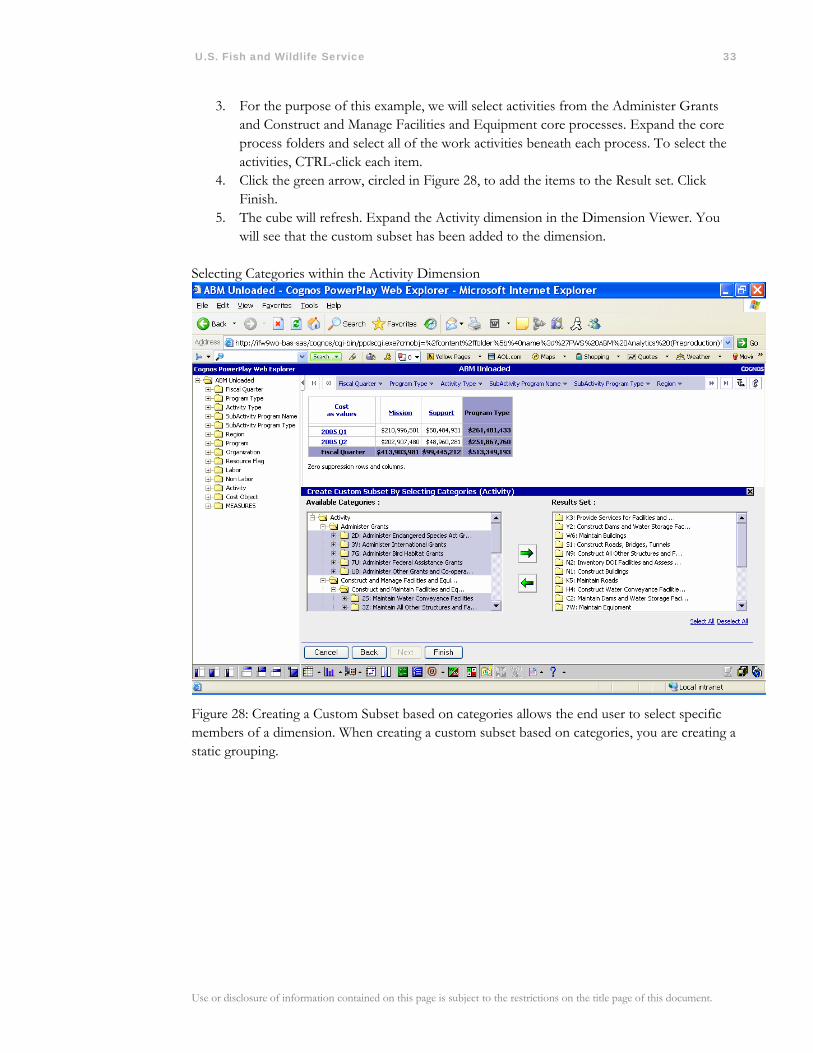
3. For the purpose of this example, we will select activities from the Administer Grants and Construct and Manage Facilities and Equipment core processes. Expand the core process folders and select all of the work activities beneath each process. To select the activities, CTRL-click each item.
4. Click the green arrow, circled in Figure 28, to add the items to the Result set. Click Finish.
5. The cube will refresh. Expand the Activity dimension in the Dimension Viewer. You will see that the custom subset has been added to the dimension.
Selecting Categories within the Activity Dimension
Figure 28: Creating a Custom Subset based on categories allows the end user to select specific members of a dimension. When creating a custom subset based on categories, you are creating a static grouping.
Use or disclosure of information contained on this page is subject to the restrictions on the title page of this document.
U.S. Fish and Wildlife Service 34
1.4.5.2 Search criteria The second method of defining custom subsets is to use Search Criteria. Like any search function, this function allows the user to search for specific words within the dimension. To create a Custom Subset using Search Criteria, follow the steps below.
1. Click Custom Subset on the toolbar. The Create Custom Subset window will appear.
2. Give the Custom Subset a name and select Activity as the dimension. Select the radio button next to ‘Define Rule by Search Criteria.’ Your screen will look like the one shown in Figure 29. Click Next.
Creating a Custom Subset based on Search Criteria
Figure 29: The Create Custom Subset window defines the type of custom subset and the dimension that will be used to create the subset. Use Define Rule by Search Criteria to create a dynamic subset that is based on a rule.
Use or disclosure of information contained on this page is subject to the restrictions on the title page of this document.
U.S. Fish and Wildlife Service 35
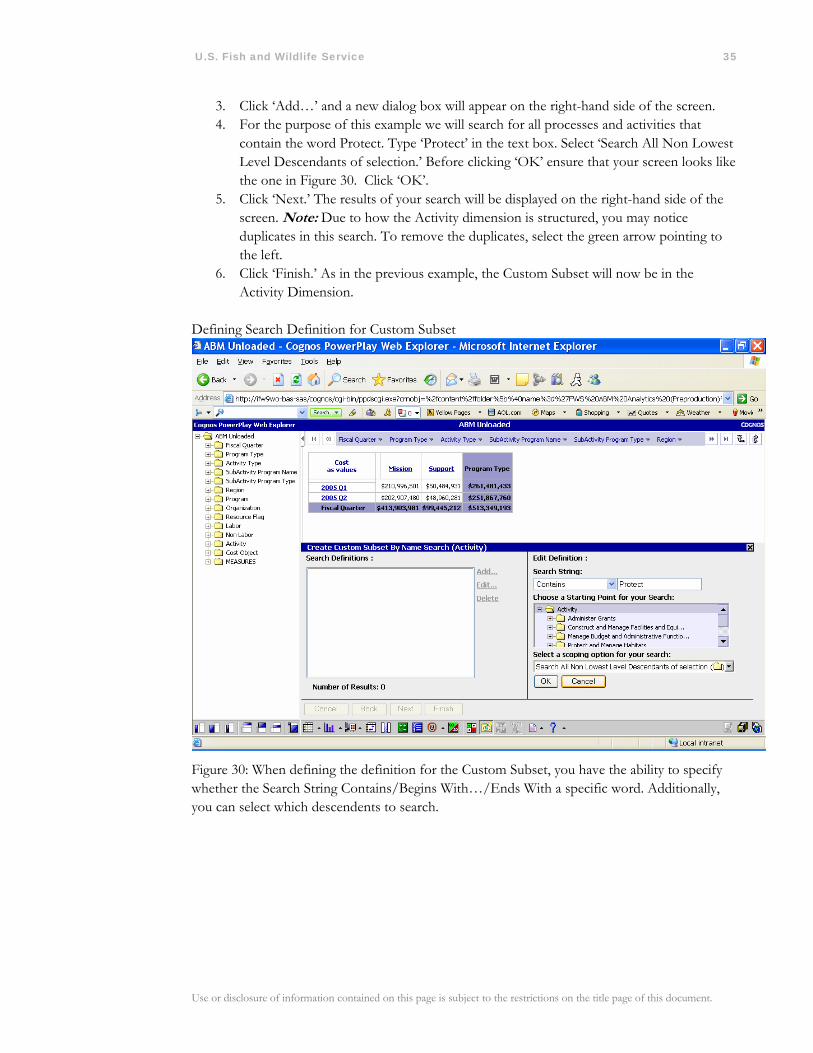
3. Click ‘Add…’ and a new dialog box will appear on the right-hand side of the screen. 4. For the purpose of this example we will search for all processes and activities that
contain the word Protect. Type ‘Protect’ in the text box. Select ‘Search All Non Lowest Level Descendants of selection.’ Before clicking ‘OK’ ensure that your screen looks like the one in Figure 30. Click ‘OK’.
5. Click ‘Next.’ The results of your search will be displayed on the right-hand side of the screen. Note: Due to how the Activity dimension is structured, you may notice duplicates in this search. To remove the duplicates, select the green arrow pointing to the left.
6. Click ‘Finish.’ As in the previous example, the Custom Subset will now be in the Activity Dimension.
Defining Search Definition for Custom Subset
Figure 30: When defining the definition for the Custom Subset, you have the ability to specify whether the Search String Contains/Begins With…/Ends With a specific word. Additionally, you can select which descendents to search.
Use or disclosure of information contained on this page is subject to the restrictions on the title page of this document.


