Geomatics Indaba Proceedings 2015 – Stream 1 14 Combining different technologies for better assessing slope stability on a mine by Ian du Toit, Optron Abstract One of the areas of great technological advancement in recent years has been in the deformation monitoring field with related software. There is currently a range of sensors available for monitoring various aspects of slope stability for mines, but the data from these sensors is still very disparate. This paper aims to provide a brief overview of the sensors available for deformation monitoring, as well as examples of the output. While the output examples are many, the author then intends to demonstrate that the next phase of development will be to integration of these disparate systems, or the output from these systems in to a single graphical user interface that is easy to use. This will help ensure that decisions on slope stability are more effective and accurate, and the behaviour of different soil and rock types is better understood. Keywords slope stability monitoring, geotechnical monitoring, prism monitoring, terrestrial radar, satellite radar, InSAR Introduction Over the past few decades, monitoring has become an important and integral part of mining best practices worldwide. On a working mine, the benefits are multifold. Typically, the primary objectives of monitoring on a mine are: First and foremost for safety, to prevent loss of life. Asset protection – slope failure or sink holes may cause the destruction of very valuable assets such as buildings, the plant on a mine for instance or the resource itself. Monitoring enables better maintenance of areas that are being observed. Deformation analysis – to determine if the object being monitored, whether it is soil, a rock-face or manmade structure, is behaving in the way that was predicted. Preventative maintenance – if the object isn’t behaving as predicted, determining whether mitigation measures can be taken. Legislative compliance – specifically on mines, there is very strict legislation in place governing safety in the workplace. Often a slope stability monitoring system is required by law, for instance in open pits. Research – to provide data to fulfil pre-defined research objectives or deformation models. Today, there are a number of technologies available to assist geotechnical engineers and mine surveyors to better understand the slopes in open pit mines, thereby mitigating costly slope failures. These technologies are not limited to the slopes in the pit, but can also be employed on retaining walls, embankments, structures on the mine and tailings dumps and dams. These technologies are now also able to be read in real-time, automatically and often remotely. As the technology improves, so too does the functionality, usability and benefits. The various monitoring technologies to be discussed in this paper are geotechnical sensors, total station and prisms, levelling, global navigation satellite systems (GNSS) monitoring systems, terrestrial radar and satellite radar. The data from these sensors and instruments can be collected manually or automatically, a decision often dictated by the size of the mine or area to be monitored. An automatic deformation monitoring system is defined as a group of interacting, interrelated, or interdependent software and hardware elements forming a complex whole for deformation monitoring that, once set up, requires very little human input to function, if any. This is increasingly more possible as WiFi networks on mines become more commonplace, in addition to the wider- scale availability of global system for mobile (GSM) communications coverage. An automatic data acquisition system is best suited when the following conditions apply: There is a need for real-time monitoring and automatic alarms. Sensors are located at a remote site or in a location that prevents easy access. There are too many sensors for timely manual readings. And/or qualified technicians are not available.
Transcript
Geomatics Indaba Proceedings 2015 – Stream 1
14
Combining different technologies for better assessing slope stability on a mine by Ian du Toit, Optron Abstract
One of the areas of great technological advancement in recent years has been in the deformation monitoring field with related software. There is currently a range of sensors available for monitoring various aspects of slope stability for mines, but the data from these sensors is still very disparate. This paper aims to provide a brief overview of the sensors available for deformation monitoring, as well as examples of the output. While the output examples are many, the author then intends to demonstrate that the next phase of development will be to integration of these disparate systems, or the output from these systems in to a single graphical user interface that is easy to use. This will help ensure that decisions on slope stability are more effective and accurate, and the behaviour of different soil and rock types is better understood.
Over the past few decades, monitoring has become an important and integral part of mining best practices worldwide. On a working mine, the benefits are multifold.
Typically, the primary objectives of monitoring on a mine are:
First and foremost for safety, to prevent loss of life. Asset protection – slope failure or sink holes may cause the destruction of very valuable assets such as
buildings, the plant on a mine for instance or the resource itself. Monitoring enables better maintenance of areas that are being observed.
Deformation analysis – to determine if the object being monitored, whether it is soil, a rock-face or manmade structure, is behaving in the way that was predicted.
Preventative maintenance – if the object isn’t behaving as predicted, determining whether mitigation measures can be taken.
Legislative compliance – specifically on mines, there is very strict legislation in place governing safety in the workplace. Often a slope stability monitoring system is required by law, for instance in open pits.
Research – to provide data to fulfil pre-defined research objectives or deformation models.
Today, there are a number of technologies available to assist geotechnical engineers and mine surveyors to better understand the slopes in open pit mines, thereby mitigating costly slope failures. These technologies are not limited to the slopes in the pit, but can also be employed on retaining walls, embankments, structures on the mine and tailings dumps and dams. These technologies are now also able to be read in real-time, automatically and often remotely. As the technology improves, so too does the functionality, usability and benefits.
The various monitoring technologies to be discussed in this paper are geotechnical sensors, total station and prisms, levelling, global navigation satellite systems (GNSS) monitoring systems, terrestrial radar and satellite radar. The data from these sensors and instruments can be collected manually or automatically, a decision often dictated by the size of the mine or area to be monitored. An automatic deformation monitoring system is defined as a group of interacting, interrelated, or interdependent software and hardware elements forming a complex whole for deformation monitoring that, once set up, requires very little human input to function, if any. This is increasingly more possible as WiFi networks on mines become more commonplace, in addition to the wider-scale availability of global system for mobile (GSM) communications coverage.
An automatic data acquisition system is best suited when the following conditions apply:
There is a need for real-time monitoring and automatic alarms.
Sensors are located at a remote site or in a location that prevents easy access.
There are too many sensors for timely manual readings.
And/or qualified technicians are not available.
Geomatics Indaba Proceedings 2015 – Stream 1
15
The potential of such systems represents a significant opportunity for mine surveyors to get more involved in the collection and presentation of this data, particularly as all of it has a fundamentally important positional component. There is also an increasing undertaking among mining companies to combine and analyse data from these sensors together, rather than each one in isolation.
The various sensors and the context to which they are best suited will be explored in the following sections in more detail.
Geotechnical instrumentation
Geotechnical instrumentation is a vital tool to assist the geotechnical engineers on a mine in understanding the behaviour of different rock and soil types, and often the effects of de-watering. Again, the data acquisition from these sensors may be manual, but there is a growing trend towards collecting this data automatically.
Once the need for a data acquisition system has been established, the choice of instruments can then be narrowed to those that can be connected to the existing system easily and inexpensively.
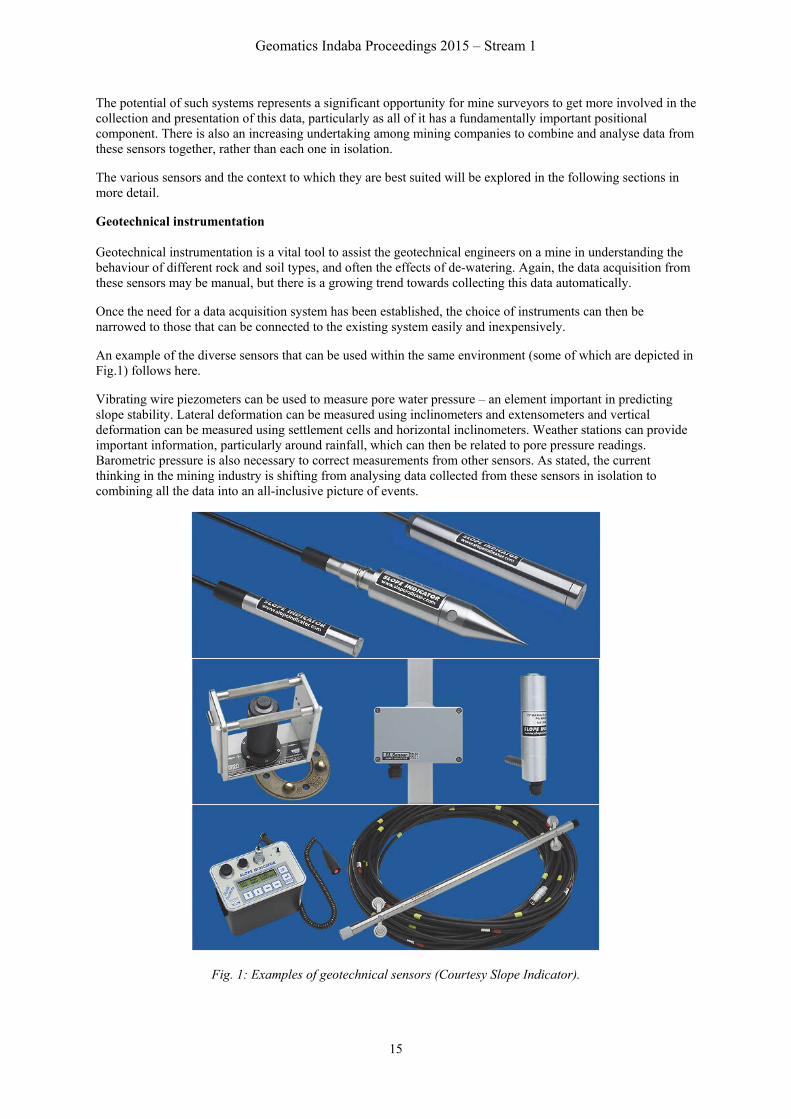
An example of the diverse sensors that can be used within the same environment (some of which are depicted in Fig.1) follows here.
Vibrating wire piezometers can be used to measure pore water pressure – an element important in predicting slope stability. Lateral deformation can be measured using inclinometers and extensometers and vertical deformation can be measured using settlement cells and horizontal inclinometers. Weather stations can provide important information, particularly around rainfall, which can then be related to pore pressure readings. Barometric pressure is also necessary to correct measurements from other sensors. As stated, the current thinking in the mining industry is shifting from analysing data collected from these sensors in isolation to combining all the data into an all-inclusive picture of events.
Fig. 1: Examples of geotechnical sensors (Courtesy Slope Indicator).
Geomatics Indaba Proceedings 2015 – Stream 1
16
Fig. 2: Graph of geotechnical data, rainfall vs. no. of landslides (Courtesy UK Met. Office).
Fig. 3: Graph of geotechnical data, pore water pressure vs. time (Courtesy Slope Indicator).
Fig. 4: Graph of geotechnical data, tilt meter vs. temperature.
Geomatics Indaba Proceedings 2015 – Stream 1
17
Leveling
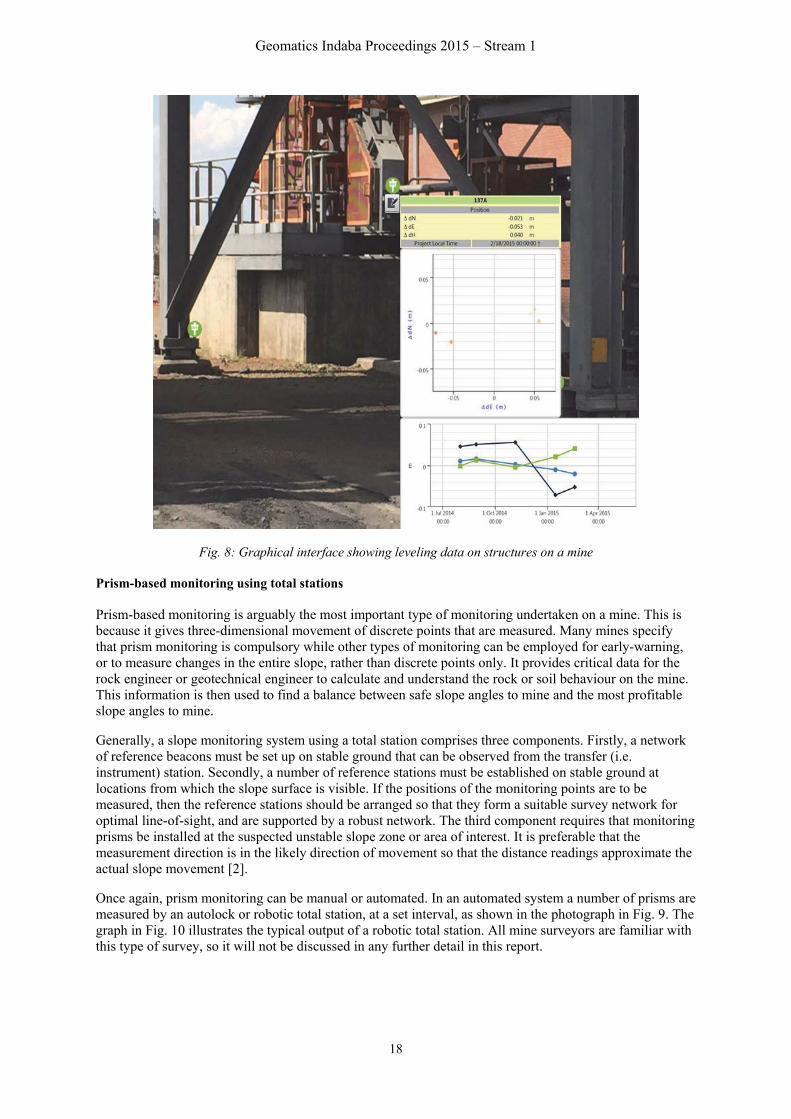
Leveling remains one of the simplest and most effective ways of monitoring subsidence. The use of new generation digital levels makes data capture and computations far more reliable, almost fool-proof. Fig. 5 shows an image of a state-of-the-art digital level and staff. The screenshot in Fig. 6 shows a typical user interface of leveling data aquired on a mine. The data is automatically processed into a graph, as shown in Fig. 7. Leveling data can also be applied to structures on a mine, as demonstrated in the image and supporting graphs in Fig. 8, as follows below.
Fig. 5: Example of digital level and staff.
Fig. 6: Graphical user interface of level data on a mine.
Fig. 7: Typical graph of leveling data.
Geomatics Indaba Proceedings 2015 – Stream 1
18
Fig. 8: Graphical interface showing leveling data on structures on a mine
Prism-based monitoring using total stations
Prism-based monitoring is arguably the most important type of monitoring undertaken on a mine. This is because it gives three-dimensional movement of discrete points that are measured. Many mines specify that prism monitoring is compulsory while other types of monitoring can be employed for early-warning, or to measure changes in the entire slope, rather than discrete points only. It provides critical data for the rock engineer or geotechnical engineer to calculate and understand the rock or soil behaviour on the mine. This information is then used to find a balance between safe slope angles to mine and the most profitable slope angles to mine.
Generally, a slope monitoring system using a total station comprises three components. Firstly, a network of reference beacons must be set up on stable ground that can be observed from the transfer (i.e. instrument) station. Secondly, a number of reference stations must be established on stable ground at locations from which the slope surface is visible. If the positions of the monitoring points are to be measured, then the reference stations should be arranged so that they form a suitable survey network for optimal line-of-sight, and are supported by a robust network. The third component requires that monitoring prisms be installed at the suspected unstable slope zone or area of interest. It is preferable that the measurement direction is in the likely direction of movement so that the distance readings approximate the actual slope movement [2].
Once again, prism monitoring can be manual or automated. In an automated system a number of prisms are measured by an autolock or robotic total station, at a set interval, as shown in the photograph in Fig. 9. The graph in Fig. 10 illustrates the typical output of a robotic total station. All mine surveyors are familiar with this type of survey, so it will not be discussed in any further detail in this report.
Geomatics Indaba Proceedings 2015 – Stream 1
19
Fig. 9: An example of an automated total station installation on a mine.
Fig. 10: Graph of data collected with a total station installed on a mine.
GPS or GNSS monitoring
GPS or GNSS monitoring systems are becoming more prevalent on mines around the globe, especially when used in combination with total stations. The reason for this is twofold:
Often, on a mine, it is difficult to find a stable point to install the reference beacons, which need to have a direct line-of-sight to the total station being used. As these reference beacons are usually close to the open pit, there is the risk that they may also be situated on potentially unstable ground. With GNSS receivers it is possible to have a network of receivers outside the area of influence, monitoring these reference beacons. The GNSS stations do not have to be intervisible, as is the case with prism reference beacons.
When measuring prisms using total stations, atmospheric corrections need to be applied to distances measured by the total station. These are done by correcting for temperature and barometric pressure. Normally, temperature and barometric pressure are measured and used to correct the distance measurements by the total station. These measurements are taken at the total station. It does not take into account the changes in barometric pressure and temperature over the pit, which will usually be very different from the readings taken at the instrument. As the GNSS signals are not affected by the changes in temperature and pressure over the pit, they could be used to correct the total station measurements on long rays. This feature requires further investigation, which is beyond the scope of this paper.
Geomatics Indaba Proceedings 2015 – Stream 1
20
As an aside, GNSS monitoring is becoming more and more prevalent and is being used on many dam monitoring projects to determine seasonal variation and behaviour of the dam wall, as can be seen in the photograph of a monitoring installation on a large dam wall in the Eastern Cape (see Fig. 11). Fig. 12 shows a 3D graph of the dam wall’s behaviour – this is done without any total station measurements.
Fig. 11: An example of a GNSS monitoring installation on a dam in the Eastern Cape.
Fig. 12: Graph of 3D GNSS data from dam monitoring.
Terrestrial radar
Slope monitoring radar has emerged in the last ten years as a leading-edge tool for monitoring movements in natural and engineered slopes, largely due to its ability to rapidly measure slope movements with millimetre-level accuracy over wide areas in any weather conditions, avoiding the need to install artificial reflectors.
The first type of slope monitoring radar introduced into the mining market was based on parabolic dish-antenna radars (real aperture radar – RAR), which exploit a fine radar beam that illuminates the target over a series of small footprint areas. Various generations of ground-based real aperture radars (RARs) have been developed for the monitoring of slope movements, an example of which is shown in Fig. 13.
In recent years, slope monitoring radar for mining applications has experienced significant improvement in its performances through the introduction of a different interferometric radar technology such as synthetic aperture radar (SAR) [3]. SAR is able to overcome some of the limitations of the first generation of radar and to provide higher spatial resolution, longer working distances and faster acquisition times. Several prominent international mining groups now employ slope monitoring radar, based either on real aperture radar or SAR technology, for active and background monitoring of open-pit walls.
Geomatics Indaba Proceedings 2015 – Stream 1
21
Fig. 13: An example of a real-aperture radar (RAR) (Courtesy Reutech Mining).
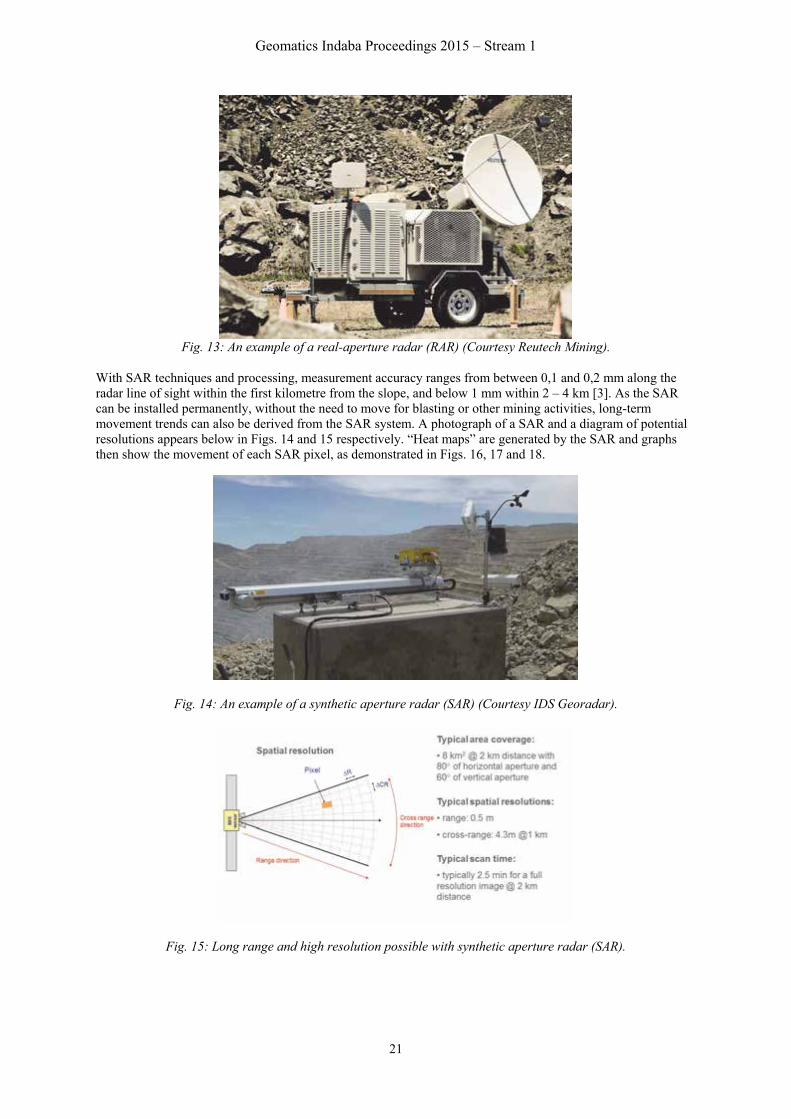
With SAR techniques and processing, measurement accuracy ranges from between 0,1 and 0,2 mm along the radar line of sight within the first kilometre from the slope, and below 1 mm within 2 – 4 km [3]. As the SAR can be installed permanently, without the need to move for blasting or other mining activities, long-term movement trends can also be derived from the SAR system. A photograph of a SAR and a diagram of potential resolutions appears below in Figs. 14 and 15 respectively. “Heat maps” are generated by the SAR and graphs then show the movement of each SAR pixel, as demonstrated in Figs. 16, 17 and 18.
Fig. 14: An example of a synthetic aperture radar (SAR) (Courtesy IDS Georadar).
Fig. 15: Long range and high resolution possible with synthetic aperture radar (SAR).
Geomatics Indaba Proceedings 2015 – Stream 1
22
Fig. 16: Display of radar data showing “heat-map” of areas of movement.
Fig. 17: Two or more radar units can be combined to give over coverage or full pit monitoring (FPM).
Fig. 18: Graph showing movement of each SAR pixel.
Satellite radar
Advanced InSAR techniques are capable of measuring and accurately characterising ground deformation due to their unique capacity to provide dense point clouds of deformation measurements coupled with a history of movement over time. Recently, remote monitoring of ground deformation from radar satellites has become an operational tool for mines world-wide.
Satellite radar is similar to terrestrial radar in that the same SAR technology is used from satellite positions. A microwave signal is transmitted from a radar satellite and reflects off a point on the ground. If this point on the ground moves, the distance between the sensor and the point on the ground also changes and so the phase value recorded by a SAR satellite flying along a fixed orbit will be affected too. As a consequence, any displacement of a radar target along the satellite line-of-sight creates a phase shift in the radar signal that can be detected by comparing the phase values of two or more SAR images acquired at different times. Fig. 19 shows the
Geomatics Indaba Proceedings 2015 – Stream 1
23
relationship between ground movement and the corresponding shift in signal phase between two SAR signals acquired over the same area [4].
Fig. 19: Graph showing movement of each SAR pixel.
All satellites equipped with SAR sensors orbit the Earth on a near-polar orbit at an altitude ranging from 500 to 800 km above the earth’s surface, depending on the satellite platform hosting the SAR sensor. While these InSAR techniques have long been able to provide accurate deformation rates over a mine’s total surface assets, results were not presented at a frequency to meet operational planning and monitoring needs. Satellite observations were limited to 24, 35, or even 46-day time intervals. Now, with 16, 11, 8 and even four day revisit times of the current modern satellites, the data collection cycle has vastly improved. The reporting time cycle has also improved with advanced InSAR techniques and tools that can process the increased data loads and provide critical deformation information to the geotechnical departments on operational planning time schedules.
Fig. 20 shows the SAR satellites that can be used for this. The important point to note is the orbit period of these satellites. This technology may not be suitabe for alarming, but rather for determining longer-term trends over an area. The satellite footprint is around 30 by 30 km, making it ideal for deformation monitoring over the entire mining area. The more radar images over the same area that are processed simultaneously, the better the accuracy. Subsidence of a few millimetres can be detected using this technology. A comparison with existing GPS data over the same field showed an agreement within 1,8 mm per year (standard deviation) for the horizontal component and 4,8 mm per year for the vertical component [5].
Fig. 20: Synthetic aperture radar (SAR) satellites and their orbital periods.
Geomatics Indaba Proceedings 2015 – Stream 1
24
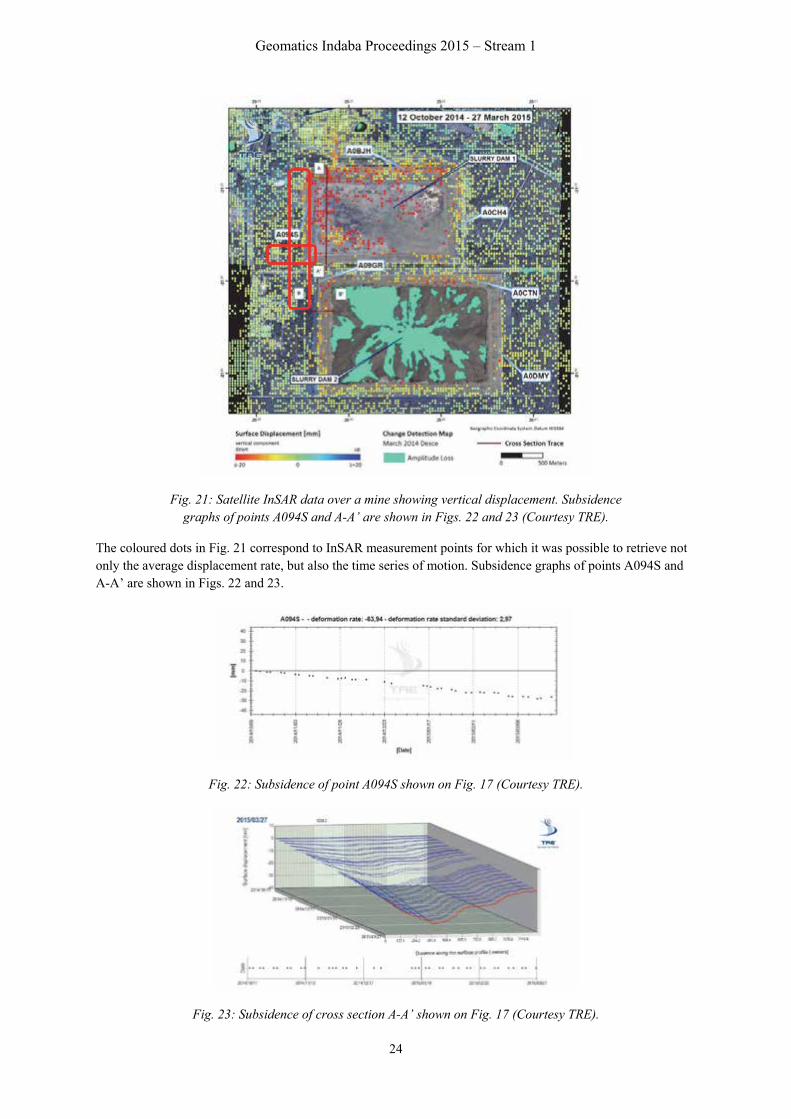
Fig. 21: Satellite InSAR data over a mine showing vertical displacement. Subsidence graphs of points A094S and A-A’ are shown in Figs. 22 and 23 (Courtesy TRE).
The coloured dots in Fig. 21 correspond to InSAR measurement points for which it was possible to retrieve not only the average displacement rate, but also the time series of motion. Subsidence graphs of points A094S and A-A’ are shown in Figs. 22 and 23.
Fig. 22: Subsidence of point A094S shown on Fig. 17 (Courtesy TRE).
Fig. 23: Subsidence of cross section A-A’ shown on Fig. 17 (Courtesy TRE).
Geomatics Indaba Proceedings 2015 – Stream 1
25
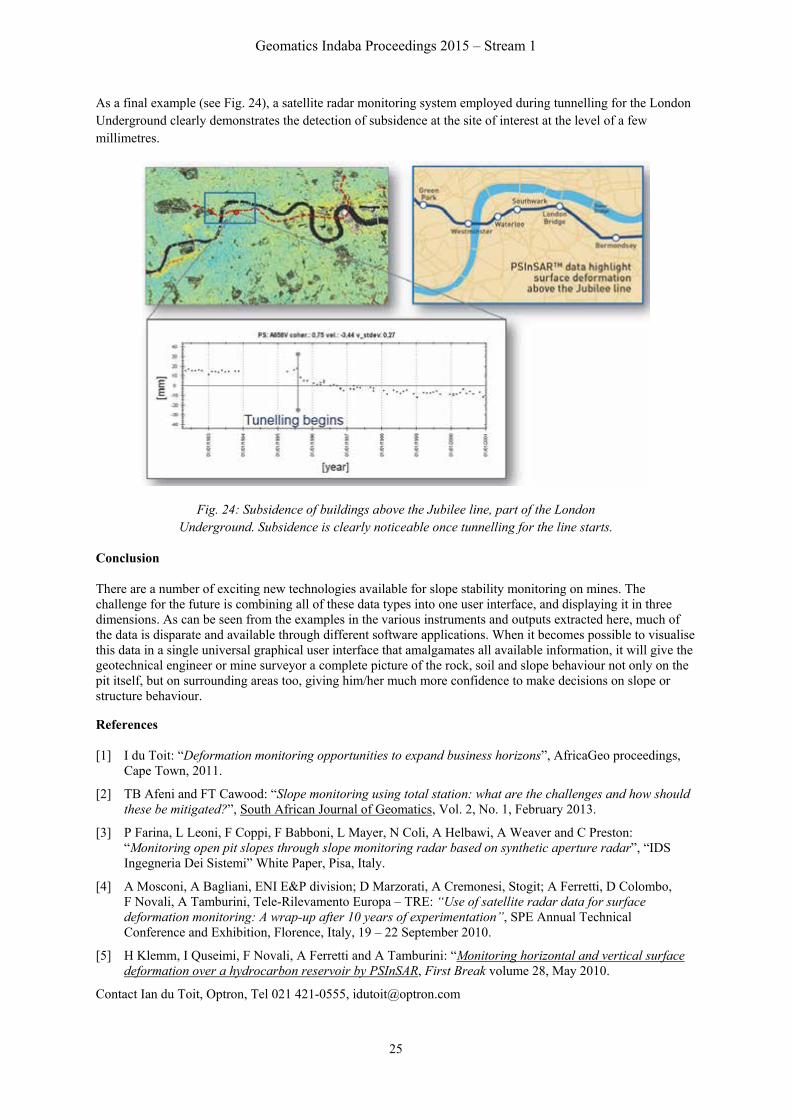
As a final example (see Fig. 24), a satellite radar monitoring system employed during tunnelling for the London Underground clearly demonstrates the detection of subsidence at the site of interest at the level of a few millimetres.
Fig. 24: Subsidence of buildings above the Jubilee line, part of the London Underground. Subsidence is clearly noticeable once tunnelling for the line starts.
Conclusion
There are a number of exciting new technologies available for slope stability monitoring on mines. The challenge for the future is combining all of these data types into one user interface, and displaying it in three dimensions. As can be seen from the examples in the various instruments and outputs extracted here, much of the data is disparate and available through different software applications. When it becomes possible to visualise this data in a single universal graphical user interface that amalgamates all available information, it will give the geotechnical engineer or mine surveyor a complete picture of the rock, soil and slope behaviour not only on the pit itself, but on surrounding areas too, giving him/her much more confidence to make decisions on slope or structure behaviour.
References
[1] I du Toit: “Deformation monitoring opportunities to expand business horizons”, AfricaGeo proceedings, Cape Town, 2011.
[2] TB Afeni and FT Cawood: “Slope monitoring using total station: what are the challenges and how should these be mitigated?”, South African Journal of Geomatics, Vol. 2, No. 1, February 2013.
[3] P Farina, L Leoni, F Coppi, F Babboni, L Mayer, N Coli, A Helbawi, A Weaver and C Preston: “Monitoring open pit slopes through slope monitoring radar based on synthetic aperture radar”, “IDS Ingegneria Dei Sistemi” White Paper, Pisa, Italy.
[4] A Mosconi, A Bagliani, ENI E&P division; D Marzorati, A Cremonesi, Stogit; A Ferretti, D Colombo, F Novali, A Tamburini, Tele-Rilevamento Europa – TRE: “Use of satellite radar data for surface deformation monitoring: A wrap-up after 10 years of experimentation”, SPE Annual Technical Conference and Exhibition, Florence, Italy, 19 – 22 September 2010.
[5] H Klemm, I Quseimi, F Novali, A Ferretti and A Tamburini: “Monitoring horizontal and vertical surface deformation over a hydrocarbon reservoir by PSInSAR, First Break volume 28, May 2010.