Korean J Radiol 12(3), May/Jun 2011 kjronline.org 297 Comparison of Usual Interstitial Pneumonia and Nonspecific Interstitial Pneumonia: Quantification of Disease Severity and Discrimination between Two Diseases on HRCT Using a Texture-Based Automated System Sang Ok Park, MD 1 , Joon Beom Seo, MD 1 , Namkug Kim, PhD 1 , Young Kyung Lee, MD 2 , Jeongjin Lee, PhD 3 , Dong Soon Kim, MD 4 1 Department of Radiology and Research Institute of Radiology, University of Ulsan College of Medicine, Asan Medical Center, Seoul 138-736, Korea; 2 Department of Radiology, East-West Neo Medical Center of Kyung Hee University, Seoul 134-727, Korea; 3 Department of Digital Media, The Catholic University of Korea, Seoul 150-101, Korea; 4 Division of Pulmonary and Critical Care Medicine, Department of Internal Medicine, Asan Medical Center, Seoul 138-736, Korea Objective: To evaluate the usefulness of an automated system for quantification and discrimination of usual interstitial pneumonia (UIP) and nonspecific interstitial pneumonia (NSIP). Materials and Methods: An automated system to quantify six regional high-resolution CT (HRCT) patterns: normal, NL; ground-glass opacity, GGO; reticular opacity, RO; honeycombing, HC; emphysema, EMPH; and consolidation, CONS, was developed using texture and shape features. Fifty-four patients with pathologically proven UIP (n = 26) and pathologically proven NSIP (n = 28) were included as part of this study. Inter-observer agreement in measuring the extent of each HRCT pattern between the system and two thoracic radiologists were assessed in 26 randomly selected subsets using an interclass correlation coefficient (ICC). A linear regression analysis was used to assess the contribution of each disease pattern to the pulmonary function test parameters. The discriminating capacity of the system between UIP and NSIP was evaluated using a binomial logistic regression. Results: The overall ICC showed acceptable agreement among the system and the two radiologists (r = 0.895 for the abnormal lung volume fraction, 0.706 for the fibrosis fraction, 0.895 for NL, 0.625 for GGO, 0.626 for RO, 0.893 for HC, 0.800 for EMPH, and 0.430 for CONS). The volumes of NL, GGO, RO, and EMPH contribute to forced expiratory volume during one second (FEV 1 ) (r = 0.72, ß values, 0.84, 0.34, 0.34 and 0.24, respectively) and forced vital capacity (FVC) (r = 0.76, ß values, 0.82, 0.28, 0.21 and 0.34, respectively). For diffusing capacity (DL co ), the volumes of NL and HC were independent contributors in opposite directions (r = 0.65, ß values, 0.64, -0.21, respectively). The automated system can help discriminate between UIP and NSIP with an accuracy of 82%. Conclusion: The automated quantification system of regional HRCT patterns can be useful in the assessment of disease severity and may provide reliable agreement with the radiologists’ results. In addition, this system may be useful in differentiating between UIP and NSIP. Index terms: UIP; NSIP; HRCT; automated, quantification, texture, shape Original Article DOI: 10.3348/kjr.2011.12.3.297 pISSN 1229-6929 · eISSN 2005-8330 Korean J Radiol 2011;12(3):297-307 Received October 6, 2010; accepted after revision January 3, 2011. This work was supported by a Korea Research Foundation Grant funded by the Korean Government (MOEHRD, Basic Research Promotion Fund) (no. KRF-2007-313-D00980). Corresponding author: Joon Beom Seo, MD, Department of Radiology and Research Institute of Radiology, University of Ulsan College of Medicine, Asan Medical Center, 86 Asanbyeongwon-gil, Songpa-gu, Seoul 138-736, Korea. • Tel: (822) 3010-4388 or (82070) 7678-6261 • Fax: (822) 476-4719 • E-mail: [email protected]This is an Open Access article distributed under the terms of the Creative Commons Attribution Non-Commercial License (http:// creativecommons.org/licenses/by-nc/3.0) which permits unrestricted non-commercial use, distribution, and reproduction in any medium, provided the original work is properly cited.
Transcript
Korean J Radiol 12(3), May/Jun 2011kjronline.org 297
Comparison of Usual Interstitial Pneumonia and Nonspecific Interstitial Pneumonia: Quantification of Disease Severity and Discrimination between Two Diseases on HRCT Using a Texture-Based Automated SystemSang Ok Park, MD1, Joon Beom Seo, MD1, Namkug Kim, PhD1, Young Kyung Lee, MD2, Jeongjin Lee, PhD3, Dong Soon Kim, MD4
1Department of Radiology and Research Institute of Radiology, University of Ulsan College of Medicine, Asan Medical Center, Seoul 138-736, Korea; 2Department of Radiology, East-West Neo Medical Center of Kyung Hee University, Seoul 134-727, Korea; 3Department of Digital Media, The Catholic University of Korea, Seoul 150-101, Korea; 4Division of Pulmonary and Critical Care Medicine, Department of Internal Medicine, Asan Medical Center, Seoul 138-736, Korea
Objective: To evaluate the usefulness of an automated system for quantification and discrimination of usual interstitial pneumonia (UIP) and nonspecific interstitial pneumonia (NSIP). Materials and Methods: An automated system to quantify six regional high-resolution CT (HRCT) patterns: normal, NL; ground-glass opacity, GGO; reticular opacity, RO; honeycombing, HC; emphysema, EMPH; and consolidation, CONS, was developed using texture and shape features. Fifty-four patients with pathologically proven UIP (n = 26) and pathologically proven NSIP (n = 28) were included as part of this study. Inter-observer agreement in measuring the extent of each HRCT pattern between the system and two thoracic radiologists were assessed in 26 randomly selected subsets using an interclass correlation coefficient (ICC). A linear regression analysis was used to assess the contribution of each disease pattern to the pulmonary function test parameters. The discriminating capacity of the system between UIP and NSIP was evaluated using a binomial logistic regression.Results: The overall ICC showed acceptable agreement among the system and the two radiologists (r = 0.895 for the abnormal lung volume fraction, 0.706 for the fibrosis fraction, 0.895 for NL, 0.625 for GGO, 0.626 for RO, 0.893 for HC, 0.800 for EMPH, and 0.430 for CONS). The volumes of NL, GGO, RO, and EMPH contribute to forced expiratory volume during one second (FEV1) (r = 0.72, ß values, 0.84, 0.34, 0.34 and 0.24, respectively) and forced vital capacity (FVC) (r = 0.76, ß values, 0.82, 0.28, 0.21 and 0.34, respectively). For diffusing capacity (DLco), the volumes of NL and HC were independent contributors in opposite directions (r = 0.65, ß values, 0.64, -0.21, respectively). The automated system can help discriminate between UIP and NSIP with an accuracy of 82%.Conclusion: The automated quantification system of regional HRCT patterns can be useful in the assessment of disease severity and may provide reliable agreement with the radiologists’ results. In addition, this system may be useful in differentiating between UIP and NSIP.Index terms: UIP; NSIP; HRCT; automated, quantification, texture, shape
Original ArticleDOI: 10.3348/kjr.2011.12.3.297pISSN 1229-6929 · eISSN 2005-8330Korean J Radiol 2011;12(3):297-307
Received October 6, 2010; accepted after revision January 3, 2011.This work was supported by a Korea Research Foundation Grant funded by the Korean Government (MOEHRD, Basic Research Promotion Fund) (no. KRF-2007-313-D00980). Corresponding author: Joon Beom Seo, MD, Department of Radiology and Research Institute of Radiology, University of Ulsan College of Medicine, Asan Medical Center, 86 Asanbyeongwon-gil, Songpa-gu, Seoul 138-736, Korea.• Tel: (822) 3010-4388 or (82070) 7678-6261 • Fax: (822) 476-4719 • E-mail: [email protected] is an Open Access article distributed under the terms of the Creative Commons Attribution Non-Commercial License (http://creativecommons.org/licenses/by-nc/3.0) which permits unrestricted non-commercial use, distribution, and reproduction in any medium, provided the original work is properly cited.
Korean J Radiol 12(3), May/Jun 2011 kjronline.org298
Texture-Based Automated System for Quantification of Disease Severity and Discrimination in Interstitial Pulmonary Fibrosis
and informed consent was not required because of the retrospective nature of our study.
PatientsBetween May 1998 and August 2007, we reviewed the
HRCT images of 834 patients that had interstitial lung diseases as well as 652 patients that had visible UIP or NSIP patterns on images. We assigned an UIP pattern for predominantly basal and peripheral reticular opacities with honeycombing, traction bronchiectasis on HRCT images, and a NSIP pattern for predominantly basal ground-glass opacities rather than reticular opacities. Of the 652 patients with UIP or NSIP patterns on images, 286 underwent surgical lung biopsies including video-assisted thoracoscopic surgery, open lung biopsy, and a lobectomy. Further, 195 patients had UIP or NSIP on HRCT images and pathologic specimens. Of these 195 patients, 83 underwent PFT. Several previous studies noted that texture-based quantification was largely dependent on training data sets (10, 13, 17, 18). Therefore, we decided to include patients with CT images from the same type of CT scanner (i.e., a 16-channel multi-detector CT - Sensation 16, Siemens, Forchheim, Germany). Among the patients who underwent PFT, 54 underwent HRCT scans using the same Siemens CT scanner.
Consequently, a total of 54 patients (M:F = 27:27; mean age, 52 years ± 9.7 standard deviation [SD]) were included in our study. Twenty-six patients (M:F = 18:8; mean age, 55 years ± 9.9 SD) had pathologically proven UIP, and 28 patients (M:F = 9:19; mean age, 53 years ± 9.7 SD) had pathologically proven NSIP. All patients had incremental HRCT scans using 0.75-mm collimation, 1-mm slice thickness, 10-mm intervals and a sharp kernel (B70f) on a 16-channel multi-detector CT (Sensation 16; Siemens, Forchheim, Germany). The matrix size was 512 × 512 and the window settings were center, -750 and width, 1500, respectively.
Automatic Classification SystemWe developed the automatic classification system using
Visual C++ and the Insight ToolKit (ITK). Lung segmentation was performed automatically, and inaccurate segmentation was modified by one resident radiologist. Histogram, gradient features, run-length encoding, Grey Level Co-occurrence Matrix (GLCM), and ITK-GLCM, were used as texture features. For shape analysis, the size and number of low attenuation areas and means with standard deviations
INTRODUCTION
High-resolution CT (HRCT) is known to be useful for determining the extent of diffuse interstitial lung disease (DILD), especially idiopathic interstitial pneumonias (1-3). In addition, HRCT is useful for predicting the clinical outcomes of idiopathic pulmonary fibrosis (IPF) as the HRCT scoring of fibrosis correlates well with the mortality rate (4, 5). However, in most cases, the disease extent seen on HRCT has been subjectively and qualitatively evaluated by radiologists who analyze a medical image by searching for specific disease patterns. Typically, a correct global diagnosis of parenchymal lung disease can only be made 40-70% of the time and by two experienced readers on 76-85% of the global diagnoses (2, 6). Such variation has been confirmed in other studies examining lung pattern type, with an interobserver variation of 81% (kappa of 0.48) and a similar intraobserver variation (kappa of 0.37 to 0.78) (7). Other visual scoring system have been suggested by Remy-Jardin et al. (8) or Copley et al. (9). However, in their studies, the reproducibility of the scoring systems was not assessed and their scoring systems were semi-quantitative methods. Therefore, an automated classification system is necessary for objective and reproducible assessment of disease extent.
To objectively evaluate the extent of IPF, several automated classification systems have been developed based on the specific features of texture or shape such as a histogram, gradient, run-length matrix, Top-hat transformation and so on, as seen on HRCT images (10-15). We developed an automated classification and quantification system for chronic obstructive pulmonary disease and DILD using HRCT images (5, 16). We thought that the basic algorithm of these studies can be applied for a quantitative assessment of HRCT in patients with usual interstitial pneumonia (UIP) and nonspecific interstitial pneumonia (NSIP). The purposes of this study are to evaluate the usefulness of quantifying UIP and NSIP in terms of the agreement with the radiologist’s interpretation, the contribution of regional patterns to pulmonary function test (PFT) variables, and the ability to discriminate between UIP and NSIP.
MATERIALS AND METHODS
Our study was approved by the Asan Medical Center Institutional Review Board for Human Investigation
Korean J Radiol 12(3), May/Jun 2011kjronline.org 299
Park et al.
of white and black Top-Hat transformations of the original images were used. The detailed information of each feature was reported in previous papers (5, 19, 20).
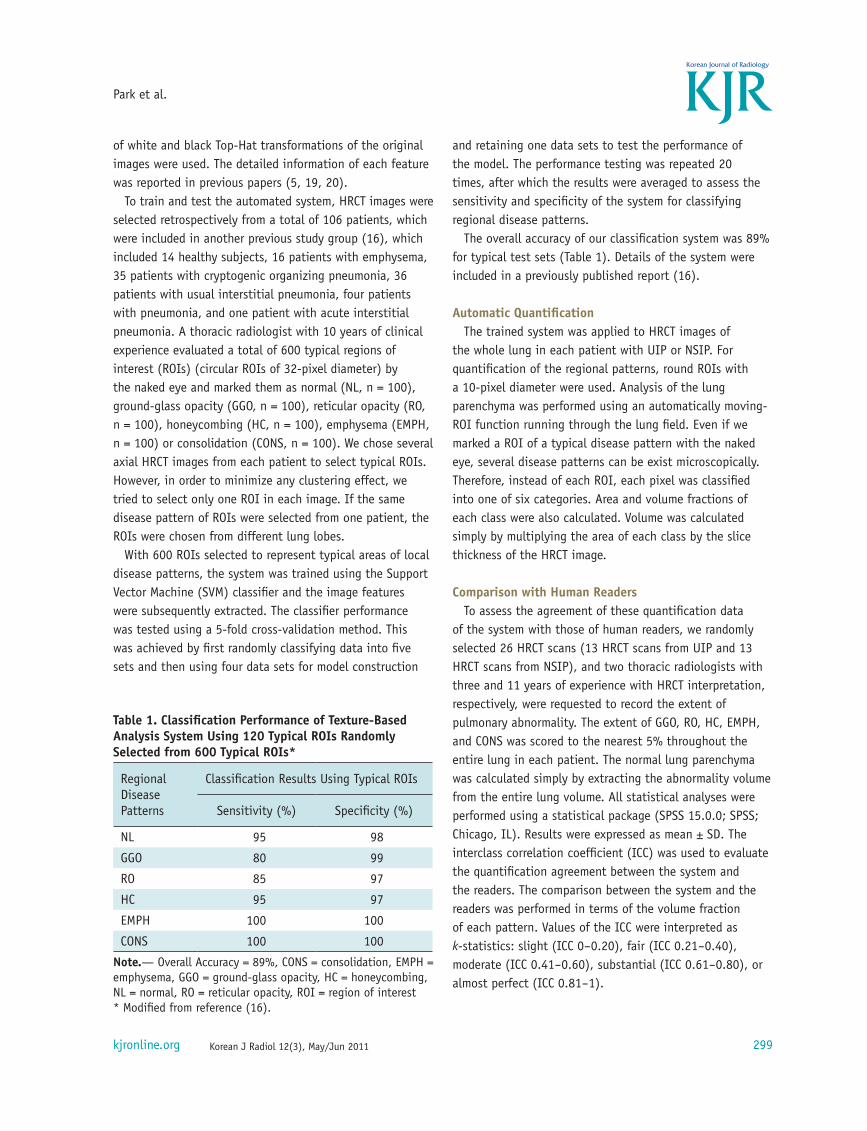
To train and test the automated system, HRCT images were selected retrospectively from a total of 106 patients, which were included in another previous study group (16), which included 14 healthy subjects, 16 patients with emphysema, 35 patients with cryptogenic organizing pneumonia, 36 patients with usual interstitial pneumonia, four patients with pneumonia, and one patient with acute interstitial pneumonia. A thoracic radiologist with 10 years of clinical experience evaluated a total of 600 typical regions of interest (ROIs) (circular ROIs of 32-pixel diameter) by the naked eye and marked them as normal (NL, n = 100), ground-glass opacity (GGO, n = 100), reticular opacity (RO, n = 100), honeycombing (HC, n = 100), emphysema (EMPH, n = 100) or consolidation (CONS, n = 100). We chose several axial HRCT images from each patient to select typical ROIs. However, in order to minimize any clustering effect, we tried to select only one ROI in each image. If the same disease pattern of ROIs were selected from one patient, the ROIs were chosen from different lung lobes.
With 600 ROIs selected to represent typical areas of local disease patterns, the system was trained using the Support Vector Machine (SVM) classifier and the image features were subsequently extracted. The classifier performance was tested using a 5-fold cross-validation method. This was achieved by first randomly classifying data into five sets and then using four data sets for model construction
and retaining one data sets to test the performance of the model. The performance testing was repeated 20 times, after which the results were averaged to assess the sensitivity and specificity of the system for classifying regional disease patterns.
The overall accuracy of our classification system was 89% for typical test sets (Table 1). Details of the system were included in a previously published report (16).
Automatic QuantificationThe trained system was applied to HRCT images of
the whole lung in each patient with UIP or NSIP. For quantification of the regional patterns, round ROIs with a 10-pixel diameter were used. Analysis of the lung parenchyma was performed using an automatically moving-ROI function running through the lung field. Even if we marked a ROI of a typical disease pattern with the naked eye, several disease patterns can be exist microscopically. Therefore, instead of each ROI, each pixel was classified into one of six categories. Area and volume fractions of each class were also calculated. Volume was calculated simply by multiplying the area of each class by the slice thickness of the HRCT image.
Comparison with Human ReadersTo assess the agreement of these quantification data
of the system with those of human readers, we randomly selected 26 HRCT scans (13 HRCT scans from UIP and 13 HRCT scans from NSIP), and two thoracic radiologists with three and 11 years of experience with HRCT interpretation, respectively, were requested to record the extent of pulmonary abnormality. The extent of GGO, RO, HC, EMPH, and CONS was scored to the nearest 5% throughout the entire lung in each patient. The normal lung parenchyma was calculated simply by extracting the abnormality volume from the entire lung volume. All statistical analyses were performed using a statistical package (SPSS 15.0.0; SPSS; Chicago, IL). Results were expressed as mean ± SD. The interclass correlation coefficient (ICC) was used to evaluate the quantification agreement between the system and the readers. The comparison between the system and the readers was performed in terms of the volume fraction of each pattern. Values of the ICC were interpreted as k-statistics: slight (ICC 0-0.20), fair (ICC 0.21-0.40), moderate (ICC 0.41-0.60), substantial (ICC 0.61-0.80), or almost perfect (ICC 0.81-1).
Table 1. Classification Performance of Texture-Based Analysis System Using 120 Typical ROIs Randomly Selected from 600 Typical ROIs*
Regional Disease Patterns
Classification Results Using Typical ROIs
Sensitivity (%) Specificity (%)
NL 95 98
GGO 80 99
RO 85 97
HC 95 97
EMPH 100 100
CONS 100 100
Note.— Overall Accuracy = 89%, CONS = consolidation, EMPH = emphysema, GGO = ground-glass opacity, HC = honeycombing, NL = normal, RO = reticular opacity, ROI = region of interest* Modified from reference (16).
Korean J Radiol 12(3), May/Jun 2011 kjronline.org300
Texture-Based Automated System for Quantification of Disease Severity and Discrimination in Interstitial Pulmonary Fibrosis
Correlation Study between Pulmonary Function Test and Automated Quantification
Spirometry was performed as recommended by the American Thoracic Society (Vmax 22, SensorMedics, CA; PFDX, MedGraphics, MN) in all 54 patients (21). The following values were evaluated: the forced expiratory volume during one second (FEV1); and the forced vital capacity (FVC). The diffusing capacity (DLco) was measured according to the single-breath carbon monoxide uptake (Vmax 22, SensorMedics, CA; PFDX, MedGraphics, MN) (22). All values were expressed both as a percentage of measured to predicted values and as measured values. A linear regression analysis (LRA) with backward elimination was used to evaluate the contribution of regional patterns (NL, GGO, RO, HC, EMPH, and CONS) to the PFT parameters (FEV1, FVC, and DLco). This analysis was performed using a volume of each pattern and a measured value of the PFT parameter.
Discrimination between Usual Interstitial Pneumonia and Nonspecific Interstitial Pneumonia
The discriminating ability of the automated system between UIP and NSIP was evaluated using a binary (or binomial) logistic regression. The best set of regional patterns for differentiating between UIP and NSIP was found by trial and error. A p-value less than 0.05 was considered to be statistically significant. The analysis was performed according to the volume fraction of each pattern.
To test the performance of the human reader in the same data sets, a thoracic radiologist with 11-years of experience
was requested to review the whole 54 HRCT scans and decide the likelihood of diagnosis. The characteristic HRCT findings in UIP are predominantly basal and peripheral reticular opacities with honeycombing and traction bronchiectasis. In NSIP, basal ground-glass opacities tend to predominate over reticular opacities, with traction bronchiectasis present only in advanced disease (23). According to these criteria, the probability of UIP or NSIP in each patient was estimated using a five-point rating scale: 1, definite NSIP; 2, probably NSIP; 3, possible UIP; 4, probable UIP; and 5, definite UIP.
RESULTS
Texture- and shape-based quantification was successfully performed on all images, and the quantification results were displayed using color-coded overlays of the original DICOM images (Figs. 1-3).
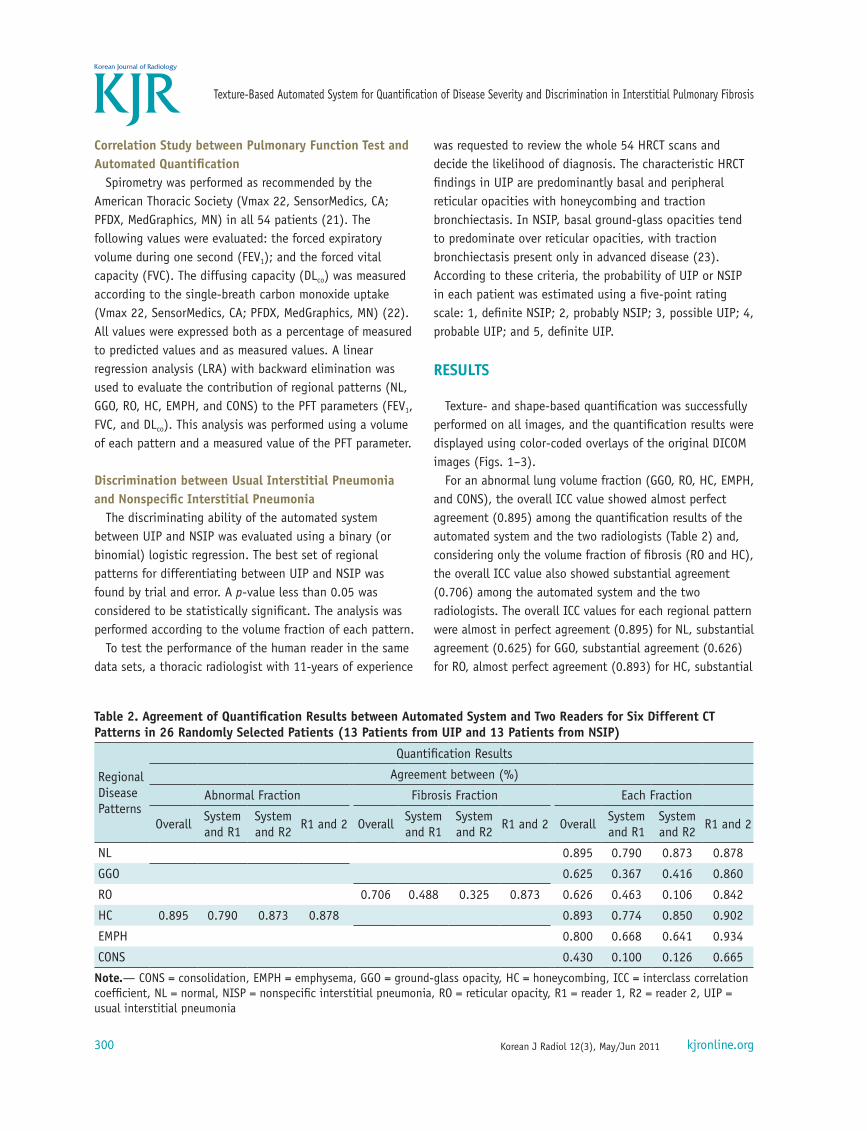
For an abnormal lung volume fraction (GGO, RO, HC, EMPH, and CONS), the overall ICC value showed almost perfect agreement (0.895) among the quantification results of the automated system and the two radiologists (Table 2) and, considering only the volume fraction of fibrosis (RO and HC), the overall ICC value also showed substantial agreement (0.706) among the automated system and the two radiologists. The overall ICC values for each regional pattern were almost in perfect agreement (0.895) for NL, substantial agreement (0.625) for GGO, substantial agreement (0.626) for RO, almost perfect agreement (0.893) for HC, substantial
Table 2. Agreement of Quantification Results between Automated System and Two Readers for Six Different CT Patterns in 26 Randomly Selected Patients (13 Patients from UIP and 13 Patients from NSIP)
Korean J Radiol 12(3), May/Jun 2011kjronline.org 301
Park et al.
A
B
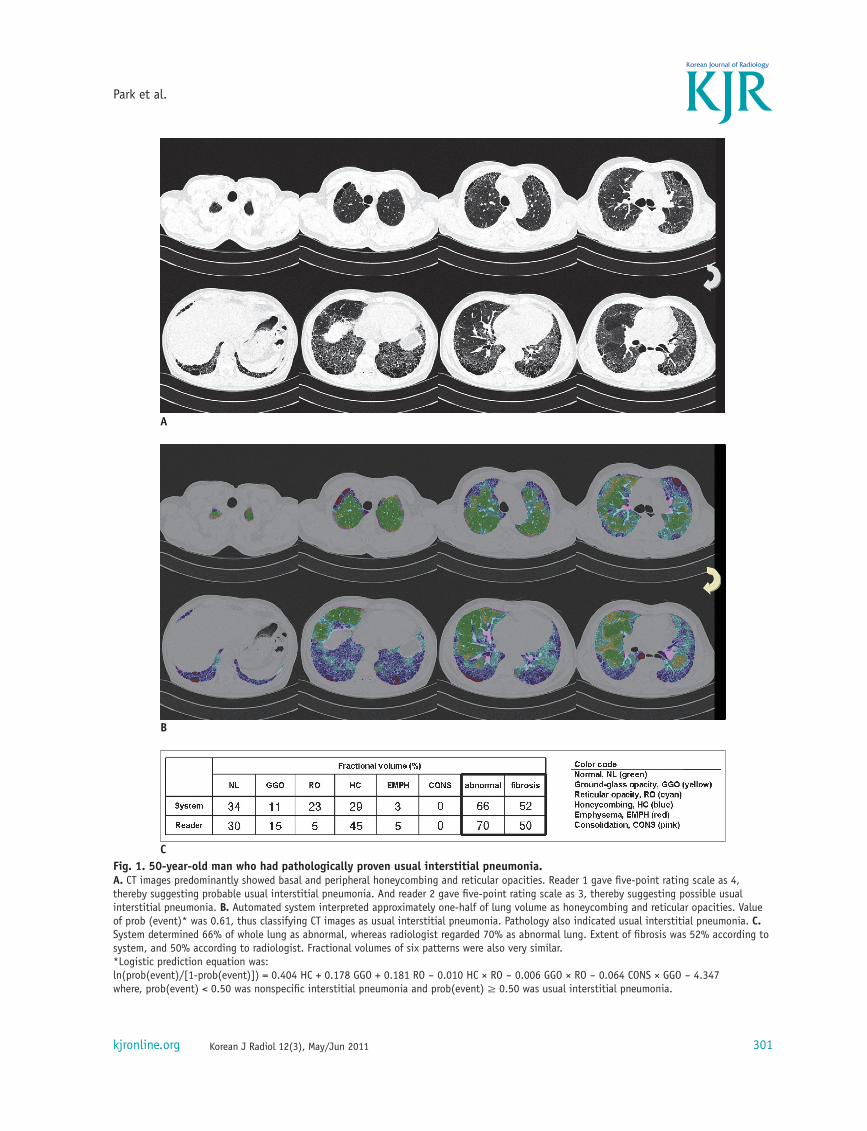
CFig. 1. 50-year-old man who had pathologically proven usual interstitial pneumonia.A. CT images predominantly showed basal and peripheral honeycombing and reticular opacities. Reader 1 gave five-point rating scale as 4, thereby suggesting probable usual interstitial pneumonia. And reader 2 gave five-point rating scale as 3, thereby suggesting possible usual interstitial pneumonia. B. Automated system interpreted approximately one-half of lung volume as honeycombing and reticular opacities. Value of prob (event)* was 0.61, thus classifying CT images as usual interstitial pneumonia. Pathology also indicated usual interstitial pneumonia. C. System determined 66% of whole lung as abnormal, whereas radiologist regarded 70% as abnormal lung. Extent of fibrosis was 52% according to system, and 50% according to radiologist. Fractional volumes of six patterns were also very similar.*Logistic prediction equation was:ln(prob(event)/[1-prob(event)]) = 0.404 HC + 0.178 GGO + 0.181 RO - 0.010 HC × RO - 0.006 GGO × RO - 0.064 CONS × GGO - 4.347where, prob(event) < 0.50 was nonspecific interstitial pneumonia and prob(event) ≥ 0.50 was usual interstitial pneumonia.
Korean J Radiol 12(3), May/Jun 2011 kjronline.org302
Texture-Based Automated System for Quantification of Disease Severity and Discrimination in Interstitial Pulmonary Fibrosis
A
B
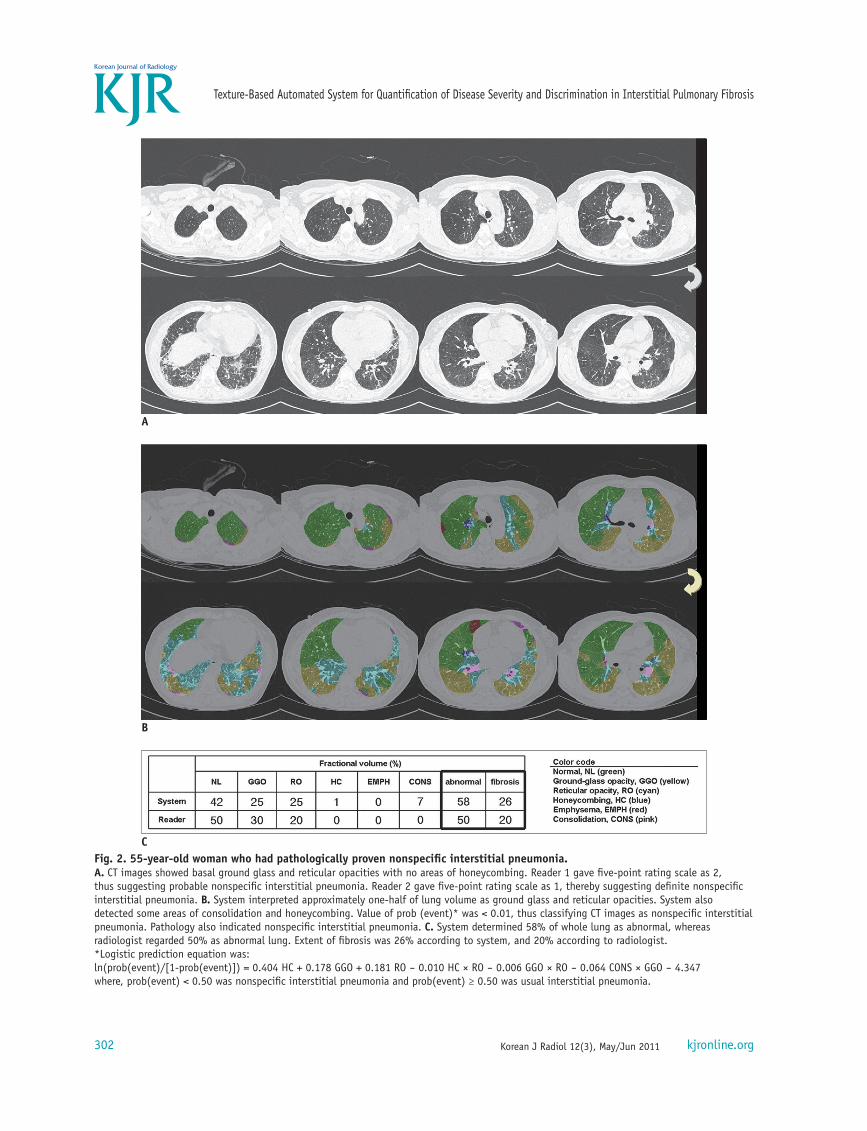
CFig. 2. 55-year-old woman who had pathologically proven nonspecific interstitial pneumonia.A. CT images showed basal ground glass and reticular opacities with no areas of honeycombing. Reader 1 gave five-point rating scale as 2, thus suggesting probable nonspecific interstitial pneumonia. Reader 2 gave five-point rating scale as 1, thereby suggesting definite nonspecific interstitial pneumonia. B. System interpreted approximately one-half of lung volume as ground glass and reticular opacities. System also detected some areas of consolidation and honeycombing. Value of prob (event)* was < 0.01, thus classifying CT images as nonspecific interstitial pneumonia. Pathology also indicated nonspecific interstitial pneumonia. C. System determined 58% of whole lung as abnormal, whereas radiologist regarded 50% as abnormal lung. Extent of fibrosis was 26% according to system, and 20% according to radiologist.*Logistic prediction equation was:ln(prob(event)/[1-prob(event)]) = 0.404 HC + 0.178 GGO + 0.181 RO - 0.010 HC × RO - 0.006 GGO × RO - 0.064 CONS × GGO - 4.347where, prob(event) < 0.50 was nonspecific interstitial pneumonia and prob(event) ≥ 0.50 was usual interstitial pneumonia.
Korean J Radiol 12(3), May/Jun 2011kjronline.org 303
Park et al.
A
B
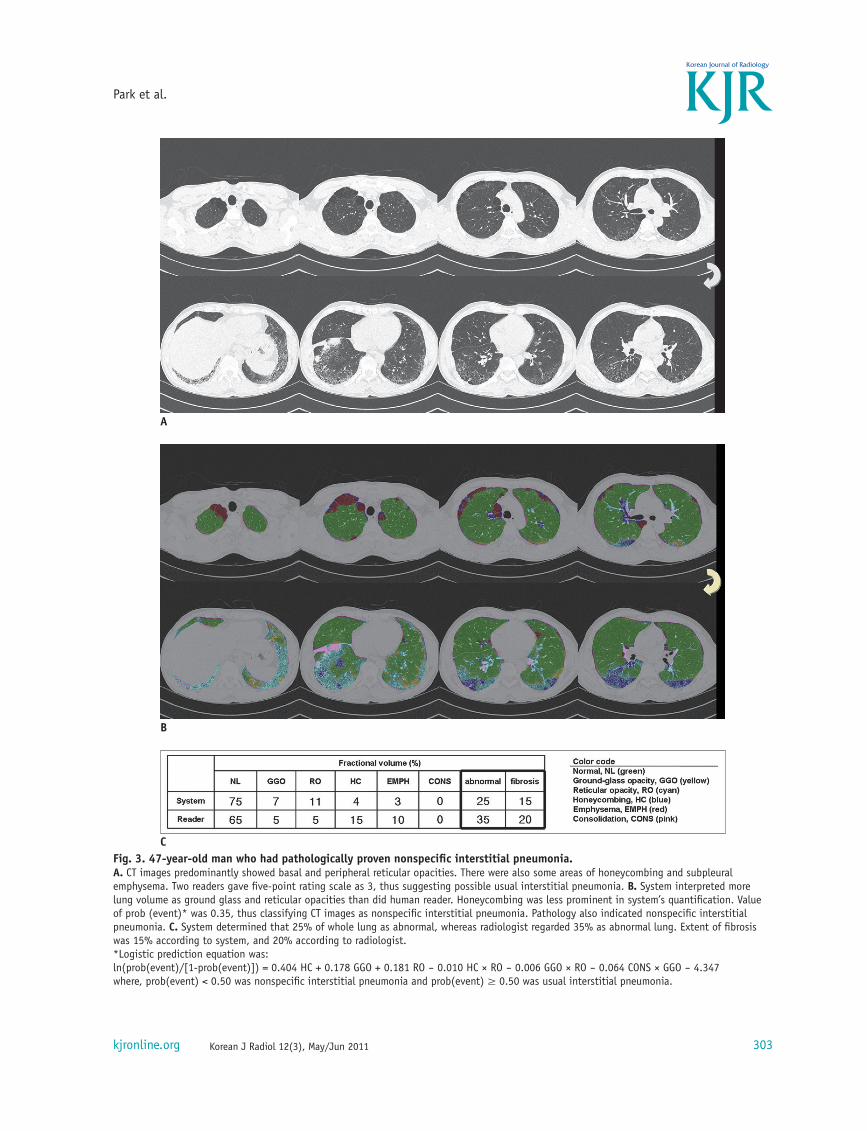
CFig. 3. 47-year-old man who had pathologically proven nonspecific interstitial pneumonia.A. CT images predominantly showed basal and peripheral reticular opacities. There were also some areas of honeycombing and subpleural emphysema. Two readers gave five-point rating scale as 3, thus suggesting possible usual interstitial pneumonia. B. System interpreted more lung volume as ground glass and reticular opacities than did human reader. Honeycombing was less prominent in system’s quantification. Value of prob (event)* was 0.35, thus classifying CT images as nonspecific interstitial pneumonia. Pathology also indicated nonspecific interstitial pneumonia. C. System determined that 25% of whole lung as abnormal, whereas radiologist regarded 35% as abnormal lung. Extent of fibrosis was 15% according to system, and 20% according to radiologist.*Logistic prediction equation was:ln(prob(event)/[1-prob(event)]) = 0.404 HC + 0.178 GGO + 0.181 RO - 0.010 HC × RO - 0.006 GGO × RO - 0.064 CONS × GGO - 4.347where, prob(event) < 0.50 was nonspecific interstitial pneumonia and prob(event) ≥ 0.50 was usual interstitial pneumonia.
Korean J Radiol 12(3), May/Jun 2011 kjronline.org304
Texture-Based Automated System for Quantification of Disease Severity and Discrimination in Interstitial Pulmonary Fibrosis
agreement (0.800) for EMPH, and moderate agreement (0.430) for CONS. The agreement between the two readers was almost perfect except for CONS in which there was substantial agreement. The agreement between the system and readers 1 or 2 was lower than that between the two readers, particularly for GGO, RO, and CONS.
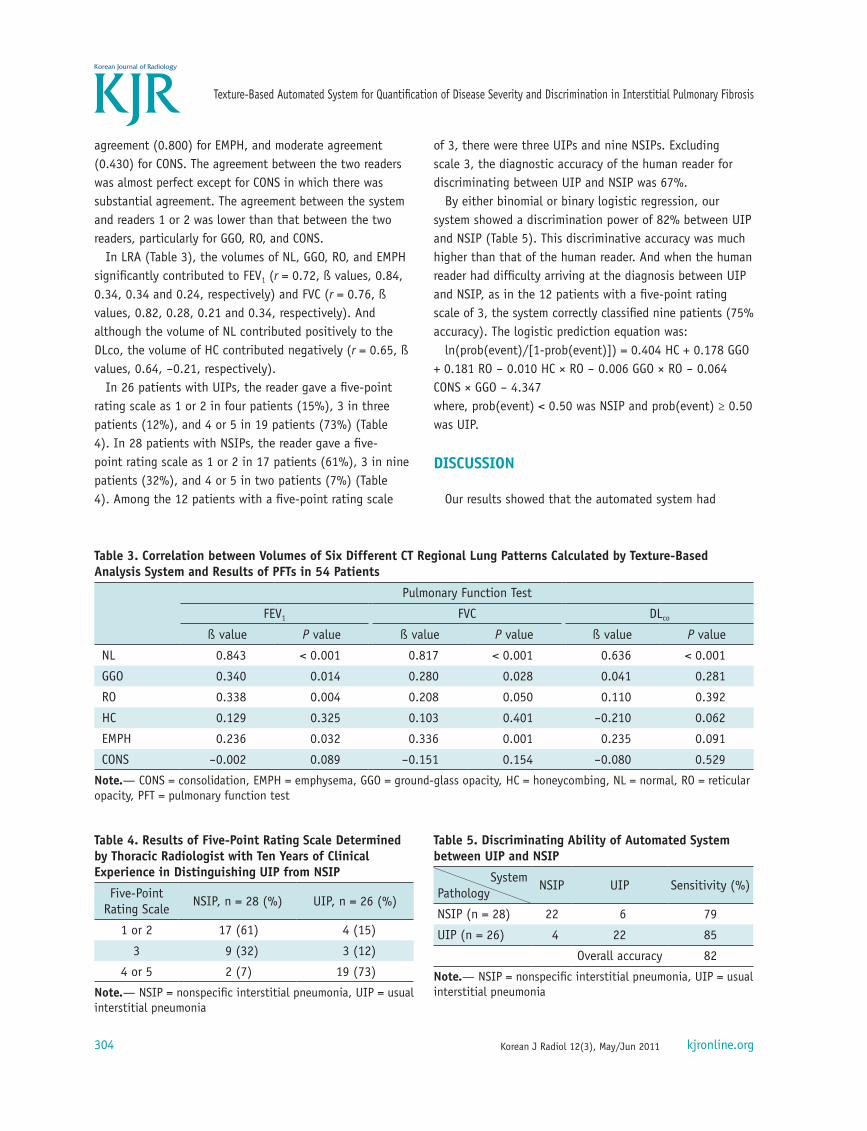
In LRA (Table 3), the volumes of NL, GGO, RO, and EMPH significantly contributed to FEV1 (r = 0.72, ß values, 0.84, 0.34, 0.34 and 0.24, respectively) and FVC (r = 0.76, ß values, 0.82, 0.28, 0.21 and 0.34, respectively). And although the volume of NL contributed positively to the DLco, the volume of HC contributed negatively (r = 0.65, ß values, 0.64, -0.21, respectively).
In 26 patients with UIPs, the reader gave a five-point rating scale as 1 or 2 in four patients (15%), 3 in three patients (12%), and 4 or 5 in 19 patients (73%) (Table 4). In 28 patients with NSIPs, the reader gave a five-point rating scale as 1 or 2 in 17 patients (61%), 3 in nine patients (32%), and 4 or 5 in two patients (7%) (Table 4). Among the 12 patients with a five-point rating scale
of 3, there were three UIPs and nine NSIPs. Excluding scale 3, the diagnostic accuracy of the human reader for discriminating between UIP and NSIP was 67%.
By either binomial or binary logistic regression, our system showed a discrimination power of 82% between UIP and NSIP (Table 5). This discriminative accuracy was much higher than that of the human reader. And when the human reader had difficulty arriving at the diagnosis between UIP and NSIP, as in the 12 patients with a five-point rating scale of 3, the system correctly classified nine patients (75% accuracy). The logistic prediction equation was:
ln(prob(event)/[1-prob(event)]) = 0.404 HC + 0.178 GGO + 0.181 RO - 0.010 HC × RO - 0.006 GGO × RO - 0.064 CONS × GGO - 4.347where, prob(event) < 0.50 was NSIP and prob(event) ≥ 0.50 was UIP.
DISCUSSION
Our results showed that the automated system had
Table 3. Correlation between Volumes of Six Different CT Regional Lung Patterns Calculated by Texture-Based Analysis System and Results of PFTs in 54 Patients
Pulmonary Function Test
FEV1 FVC DLco
ß value P value ß value P value ß value P value
NL 0.843 < 0.001 0.817 < 0.001 0.636 < 0.001
GGO 0.340 0.014 0.280 0.028 0.041 0.281
RO 0.338 0.004 0.208 0.050 0.110 0.392
HC 0.129 0.325 0.103 0.401 -0.210 0.062
EMPH 0.236 0.032 0.336 0.001 0.235 0.091
CONS -0.002 0.089 -0.151 0.154 -0.080 0.529
Note.— CONS = consolidation, EMPH = emphysema, GGO = ground-glass opacity, HC = honeycombing, NL = normal, RO = reticular opacity, PFT = pulmonary function test
Table 4. Results of Five-Point Rating Scale Determined by Thoracic Radiologist with Ten Years of Clinical Experience in Distinguishing UIP from NSIP
Korean J Radiol 12(3), May/Jun 2011kjronline.org 305
Park et al.
reliable agreement with the radiologist’s interpretation and that several regional patterns contributed to the PFT parameters. Unlike the previous quantification system of UIP using only the density and texture features (10, 11, 13-15, 24), we used shape features as well as the density and texture features to perform objective quantification of UIP and NSIP. The SVM classifier afforded highly sensitive and specific discrimination of the six typical, radiologic tissue types (Table 1). The results of this study are similar to or better than those of previous studies (7, 9). Even more importantly, our system can discriminate between UIP and NSIP with an 82% accuracy, which was superior to that of the human reader. To the best of our knowledge, there has been no previous report pertaining to the automated discrimination between UIP and NSIP.
There are several studies existing, which highlight the density histograms for the quantification of UIP (10, 11, 15, 24). And Do et al. (24) reported that a density histogram may be helpful for differentiating NSIP from UIP, without the definite presence of HC. Therefore, the system based on histograms had been used more extensively than the multiple feature method for the quantification of UIP. However, Uppaluri et al. (17) showed that the overall accuracy of the adaptive multiple feature method (AMFM) as 81%, which was 25% more successful than the histogram analysis. Uppaluri et al. (17) also showed that the samples comparing NL and the IPF samples had a discriminatory accuracy of 86% using the AMFM. Delorme et al. (13) developed a texture-based pattern recognition and segmentation for the quantification of HRCT findings in UIP. The overall accuracy of their study was 71%; however, they did not include HC, which is an important component of UIP. Rodriguez et al. (14) also showed that the automatic discrimination and quantification of IPF from normal lung parenchyma was possible using generalized fractal dimensions on HRCT images. However, they did not attempt to differentiate between UIP and NSIP, which is important for the treatment option and the patient prognosis. We demonstrated that our system had good agreement for determining the fibrosis extent between the system and the human reader, as well as a discriminating power of 82% between UIP and NSIP. Furthermore, when the human reader had difficulty distinguishing between UIP and NSIP, the system classified it correctly with an accuracy of 75%. In the logistic prediction equation of our system, HC was the largest component for discriminating between UIP and NSIP. GGO and RO also contributed to the power of
discrimination.Delorme et al. (13) showed that the identification of
small anatomic structures such as vessels and bronchi was difficult and, our system similarly misclassified some normal vessels and bronchi as reticular opacity, ground-glass opacity, or honeycombing. The basic logic used to differentiate disease patterns may differ between the system and human readers. The system was trained using ROIs representing typical disease patterns. In addition, the best combination of features and parameter settings was selected by the classifier to most effectively discriminate typical areas. However, on clinical HRCT images of DILD, many lung areas do not have such typical compositions as there are always transitional zones between disease patterns, where an area can develop from one class to another as the disease progresses. Therefore, there is no clear method to discriminate among such borderline patterns. This fundamental problem may be overcome or minimized by adjusting the system using ROIs of normal vessels and relatively atypical or borderline patterns. Therefore, the quantification result of our system will be further improved if we include normal bronchovascular bundles and borderline patterns in our training data sets.
Our study showed that the volumes of the NL, GGO, RO, and EMPH contributed to FEV1 (r = 0.72, ß values, 0.84, 0.34, 0.34 and 0.24, respectively) and FVC (r = 0.76, ß values, 0.82, 0.28, 0.21 and 0.34, respectively). For DLco, the volumes of the NL and HC were independent contributors in opposite directions (r = 0.65, ß values, 0.64, -0.21, respectively). This result indicated that the functional components of the lung, such as NL, had the greatest influence on FEV1 and FVC. HC corresponds to end-stage lung disease, and GGO reflects disease activity (25, 26). RO represents the disease spectrum between GGO and HC. In this context, our results showed that GGO and RO had a greater influence on FEV1 and FVC than did HC. On DLco, normal lung parenchyma was positively influenced, although the influence of HC was negative. These study results were well correlated with our previous knowledge.
Idiopathic pulmonary fibrosis is the most common idiopathic interstitial pneumonias (IIPs). With a median survival period ranging from two to four years, IPF has a substantially poorer prognosis than other IIPs (27, 28). NSIP is less common than UIP, but is still one of the most common histologic findings in patients with IIPs (29). As NSIP is associated with a variety of imaging and histologic findings, the diagnostic approach is highly
Korean J Radiol 12(3), May/Jun 2011 kjronline.org306
Texture-Based Automated System for Quantification of Disease Severity and Discrimination in Interstitial Pulmonary Fibrosis
challenging. However, the distinction between NSIP and UIP is more than academic, given the greater response to corticosteroids seen in a subgroup of patients with NSIP (30, 31). Especially, UIP with HC have a worse prognosis than NSIP or UIP without HC (26). Therefore, it is important to differentiate between NSIP and UIP for the purpose of determining both the treatment and the prognosis. Our system had good agreement in determining the fibrosis extent between the system and the human reader and a discriminating power of 82% between UIP and NSIP. Furthermore, when the human reader had difficulty determining the diagnosis between UIP and NSIP, the system classified it correctly with an accuracy of 75%. As we used only clinic-radiologic-pathologically proven cases, the results of the human reader might be lower than those of a clinician. Despite these factors, the system showed very good discriminating ability between UIP and NSIP, by combining the quantification results of several regional patterns. If we added additional information such as the distribution of the regional patterns throughout the entire lung, it may be possible to provide a second opinion provided by the system, for differentiating UIP from NSIP.
There are several limitations to this study. First, we included only pathologically proven UIPs and NSIPs. As a general rule, a pathologic specimen is obtained when there is difficulty differentiating between UIP and NSIP on HRCT images. Therefore, it was possible that we included many atypical cases in our study. In this case, our correlation results between PFT parameters and regional patterns may differ from those of typical UIP and NSIP cases. There is also a limitation derived from the nature of the automatic classification system. Texture-based quantification is largely dependent on the training data sets (10, 13, 17, 18). To simplify our task, we used CT images from a single machine (a Siemens scanner). However, applying this system to images from other CT scanners may yield unreliable results as the texture and shape features may be sensitive to the noise patterns and machine resolution of each individual scanner. Therefore, further system development which is less influenced by machines or noise patterns created by testing as well as comparison of various scanners will be necessary. Third, we used a sample of typical ROIs selected among images from the population of patients included into the study. This may induce a selection bias. Finally, agreement between the system and the two readers was evaluated in only 26 randomly selected cases. Therefore, this aspect will require further study, including more cases.
In conclusion, the quantification results of the automated system on HRCT images of UIP and NSIP, showed good agreement with those of the radiologist’s interpretation, and several regional disease patterns contributed to the PFT variables. The system was able to successfully discriminate UIP from NSIP. Therefore, it may be used for the objective and reproducible assessment of regional disease severity in cases of UIP and NSIP.
REFERENCES
1. Muller NL. Clinical value of high-resolution CT in chronic diffuse lung disease. AJR Am J Roentgenol 1991;157:1163-1170
2. Nishimura K, Izumi T, Kitaichi M, Nagai S, Itoh H. The diagnostic accuracy of high-resolution computed tomography in diffuse infiltrative lung diseases. Chest 1993;104:1149-1155
3. Scatarige JC, Diette GB, Haponik EF, Merriman B, Fishman EK. Utility of high-resolution CT for management of diffuse lung disease: results of a survey of U.S. pulmonary physicians. Acad Radiol 2003;10:167-175
4. Gay SE, Kazerooni EA, Toews GB, Lynch JP 3rd, Gross BH, Cascade PN, et al. Idiopathic pulmonary fibrosis: predicting response to therapy and survival. Am J Respir Crit Care Med 1998;157:1063-1072
5. Park YS, Seo JB, Kim N, Chae EJ, Oh YM, Lee SD, et al. Texture-based quantification of pulmonary emphysema on high-resolution computed tomography: comparison with density-based quantification and correlation with pulmonary function test. Invest Radiol 2008;43:395-402
6. Padley SP, Hansell DM, Flower CD, Jennings P. Comparative accuracy of high resolution computed tomography and chest radiography in the diagnosis of chronic diffuse infiltrative lung disease. Clin Radiol 1991;44:222-226
7. Collins CD, Wells AU, Hansell DM, Morgan RA, MacSweeney JE, du Bois RM, et al. Observer variation in pattern type and extent of disease in fibrosing alveolitis on thin section computed tomography and chest radiography. Clin Radiol 1994;49:236-240
8. Remy-Jardin M, Remy J, Wallaert B, Bataille D, Hatron PY. Pulmonary involvement in progressive systemic sclerosis: sequential evaluation with CT, pulmonary function tests, and bronchoalveolar lavage. Radiology 1993;188:499-506
9. Copley SJ, Lee YC, Hansell DM, Sivakumaran P, Rubens MB, Newman Taylor AJ, et al. Asbestos-induced and smoking-related disease: apportioning pulmonary function deficit by using thin-section CT. Radiology 2007;242:258-266
10. Best AC, Lynch AM, Bozic CM, Miller D, Grunwald GK, Lynch DA. Quantitative CT indexes in idiopathic pulmonary fibrosis: relationship with physiologic impairment. Radiology 2003;228:407-414
11. Best AC, Meng J, Lynch AM, Bozic CM, Miller D, Grunwald
Korean J Radiol 12(3), May/Jun 2011kjronline.org 307
Park et al.
GK, et al. Idiopathic pulmonary fibrosis: physiologic tests, quantitative CT indexes, and CT visual scores as predictors of mortality. Radiology 2008;246:935-940
12. Castellano G, Bonilha L, Li LM, Cendes F. Texture analysis of medical images. Clin Radiol 2004;59:1061-1069
13. Delorme S, Keller-Reichenbecher MA, Zuna I, Schlegel W, Van Kaick G. Usual interstitial pneumonia. Quantitative assessment of high-resolution computed tomography findings by computer-assisted texture-based image analysis. Invest Radiol 1997;32:566-574
14. Rodriguez LH, Vargas PF, Raff U, Lynch DA, Rojas GM, Moxley DM, et al. Automated discrimination and quantification of idiopathic pulmonary fibrosis from normal lung parenchyma using generalized fractal dimensions in high-resolution computed tomography images. Acad Radiol 1995;2:10-18
15. Zavaletta VA, Bartholmai BJ, Robb RA. High resolution multidetector CT-aided tissue analysis and quantification of lung fibrosis. Acad Radiol 2007;14:772-787
16. Park SO, Seo JB, Kim N, Park SH, Lee YK, Park BW, et al. Feasibility of automated quantification of regional disease patterns depicted on high-resolution computed tomography in patients with various diffuse lung diseases. Korean J Radiol 2009;10:455-463
17. Uppaluri R, Hoffman EA, Sonka M, Hunninghake GW, McLennan G. Interstitial lung disease: a quantitative study using the adaptive multiple feature method. Am J Respir Crit Care Med 1999;159:519-525
18. Xu Y, van Beek EJ, Hwanjo Y, Guo J, McLennan G, Hoffman EA. Computer-aided classification of interstitial lung diseases via MDCT: 3D adaptive multiple feature method (3D AMFM). Acad Radiol 2006;13:969-978
19. Kim N, Seo JB, Lee Y, Lee JG, Kim SS, Kang SH. Development of an automatic classification system for differentiation of obstructive lung disease using HRCT. J Digit Imaging 2009;22:136-148
20. Lee Y, Seo JB, Lee JG, Kim SS, Kim N, Kang SH. Performance testing of several classifiers for differentiating obstructive lung diseases based on texture analysis at high-resolution computerized tomography (HRCT). Comput Methods Programs Biomed 2009;93:206-215
21. Standardization of Spirometry, 1994 Update. American Thoracic Society. Am J Respir Crit Care Med 1995;152:1107-1136
22. American Thoracic Society. Single-breath carbon monoxide diffusing capacity (transfer factor). Recommendations for a standard technique--1995 update. Am J Respir Crit Care Med 1995;152:2185-2198
23. Mueller-Mang C, Grosse C, Schmid K, Stiebellehner L, Bankier AA. What every radiologist should know about idiopathic interstitial pneumonias. Radiographics 2007;27:595-615
24. Do KH, Lee JS, Colby TV, Kitaichi M, Kim DS. Nonspecific interstitial pneumonia versus usual interstitial pneumonia: differences in the density histogram of high-resolution CT. J Comput Assist Tomogr 2005;29:544-548
25. Akira M, Sakatani M, Ueda E. Idiopathic pulmonary fibrosis: progression of honeycombing at thin-section CT. Radiology 1993;189:687-691
26. Jeong YJ, Lee KS, Muller NL, Chung MP, Chung MJ, Han J, et al. Usual interstitial pneumonia and non-specific interstitial pneumonia: serial thin-section CT findings correlated with pulmonary function. Korean J Radiol 2005;6:143-152
27. American Thoracic Society/European Respiratory Society International Multidisciplinary Consensus Classification of the Idiopathic Interstitial Pneumonias. This joint statement of the American Thoracic Society (ATS), and the European Respiratory Society (ERS) was adopted by the ATS board of directors, June 2001 and by the ERS Executive Committee, June 2001. Am J Respir Crit Care Med 2002;165:277-304
28. King TE Jr, Schwarz MI, Brown K, Tooze JA, Colby TV, Waldron JA Jr, et al. Idiopathic pulmonary fibrosis: relationship between histopathologic features and mortality. Am J Respir Crit Care Med 2001;164:1025-1032
29. Travis WD, Matsui K, Moss J, Ferrans VJ. Idiopathic nonspecific interstitial pneumonia: prognostic significance of cellular and fibrosing patterns: survival comparison with usual interstitial pneumonia and desquamative interstitial pneumonia. Am J Surg Pathol 2000;24:19-33
30. Latsi PI, du Bois RM, Nicholson AG, Colby TV, Bisirtzoglou D, Nikolakopoulou A, et al. Fibrotic idiopathic interstitial pneumonia: the prognostic value of longitudinal functional trends. Am J Respir Crit Care Med 2003;168:531-537
31. Riha RL, Duhig EE, Clarke BE, Steele RH, Slaughter RE, Zimmerman PV. Survival of patients with biopsy-proven usual interstitial pneumonia and nonspecific interstitial pneumonia. Eur Respir J 2002;19:1114-1118