150
CONNECTING HEALTH AND TRANSPORTATION A HEALTH IMPACT ASSESSMENT OF THE MINNESOTA STATEWIDE MULTIMODAL TRANSPORTATION PLAN FINAL REPORT OCTOBER 2016
CONNECTING HEALTH AND TRANSPORTATIONA HEALTH IMPACT ASSESSMENT OF THE MINNESOTA STATEWIDE MULTIMODAL TRANSPORTATION PLANFINAL REPORTOCTOBER 2016

PAGE 2 PAGE 2
This Health Impact Assessment was facilitated by the Minnesota Department of Health Climate and Health Program, which is supported in part through a cooperative agreement with the Centers for Disease Control and Prevention, U.S. Department of Health and Human Services. The views expressed in this report do not necessarily reflect the official policies or views of the MN Department of Transportation.
Cover photos courtesy of the Minnesota Department of Transportation. Used with permission.Access this report on the MDH HIA website at: www.health.mn.gov/mnhia.
CONTRIBUTORSJena Carte | Blue Cross and Blue Shield of Minnesota Center for PreventionSaha Shubhayu | Centers for Disease Control and Prevention Karen Nikolai | Hennepin CountyMark Kinde | Minnesota Department of HealthJessie Shmool | Minnesota Department of HealthAmber Dallman | Minnesota Department of TransportationNathan Drews | Minnesota Department of TransportationRoberta Retzlaff | Minnesota Department of TransportationSarah Rudolf | Minnesota Department of TransportationNoel Shughart | Minnesota Department of TransportationDavid Tomporowski | Minnesota Department of TransportationDorian Kvale| Minnesota Pollution Control AgencyGreg Pratt | Minnesota Pollution Control AgencyJoan Willshire | Minnesota State Council on DisabilityMitzi Baker | Olmstead CountyMultimodal Transportation Committee | MN HIA CoalitionPatrick Hollister | PartnerSHIP 4 Health
PROJECT TEAMMinnesota Department of Health Minnesota Climate and Health Program: Kristin Raab, Director Eamon Flynn, HIA Coordinator Nissa Tupper Chris Kimber Brenda Hoppe
Minnesota Department of TransportationPolicy Planning Unit: Philip Schaffner, Director Kathryn Caskey Jacob Reuter Roberta Retzlaff
ACKNOWLEDGMENTS
Suggested Citation:Connecting Health and Transportation: A Health Impact Assessment of the Minnesota Statewide Multimodal Transportation Plan. Minnesota Department of Health. St. Paul, MN. October 2016.

PAGE 3 PAGE 3
TABLE OF CONTENTSINTRODUCTION .................................................................................5EXECUTIVE SUMMARY.............................................................6
PART I: TRANSPORTATION AND HEALTH CONTEXT1. HIA APPROACH................................................................................132. BASELINE HEALTH ASSESSMENT.................................................20
PART II: IDENTIFYING AND ANALYZING KEY ISSUES3. SMTP ASSESSMENT: TRANSPORTATION SAFETY......................59
3.1 Background.................................................................................593.2 Perceived Traffic Safety...............................................................603.3 Safety from Crime.......................................................................623.4 Enforcement and Engineering Solutions.....................................633.5 Weather and Safety.....................................................................683.6 Conclusion...................................................................................713.7 Recommendations......................................................................72
4. SMTP ASSESSMENT: HEALTHY COMMUNITIES...........................754.1 Background.................................................................................754.2 Community-Sensitive Framework...............................................754.3 Climate Change..........................................................................834.4 Active Transportation...................................................................934.5 Conclusion..................................................................................984.6 Recommendations....................................................................100
5. SMTP ASSESSMENT: CRITICAL CONNECTIONS........ 1025.1 Background................................................................1025.2 Public Transit Service Hours......................................1025.3 Identifying Costs and Benefits....................................1045.4 Conclusion..................................................................1105.5 Recommendations......................................................111
6. SMTP ASSESSMENT: EQUITY........................................1126.1 Equity vs Equality.........................................................1126.2 Recommendations......................................................118
REFERENCES.......................................................120
APPENDIX......................................................................132

PAGE 4 PAGE 4 MDH MNDOT SMTP HEALTH IMPACT ASSESSMENT
INTRODUCTION ANDEXECUTIVE SUMMARY
PH
OTO
CR
ED
IT: M
inne
sota
Dep
artm
ent o
f Tra
nspo
rtatio
n

PAGE 5 PAGE 5
This report represents the assessment and findings from a Health Impact Assessment (HIA) that was completed through a partnership between the Minnesota Department of Health (MDH) and the Minnesota Department of Transportation (MnDOT). The purpose of the project was to inform the revision of the Statewide Multimodal Transportation Plan (SMTP), bringing the important lens of health to the SMTP. The HIA was performed on the August 2016 draft of the SMTP.
The report includes an executive summary, six chapters and an appendix. The first chapter introduces the HIA approach and the SMTP. The second chapter describes baseline environmental and health conditions in Minnesota and lays the groundwork for the HIA assessment. Chapters three through six provide the HIA assessment and recommendations. The third chapter expands the discussion of safety within the Transportation Safety section of the SMTP to include crime and other factors that deter people from active transportation. The fourth chapter on the Healthy Communities section of the SMTP reviews the importance of understanding community context when making transportation-related decisions. The fifth chapter on the Critical Connections section of the SMTP discusses new modeling techniques that can introduce health
variables and other metrics into decision-making processes. The last chapter, chapter six, highlights places within the SMTP that address equity and provides additional recommendations on promoting an equitable transportation system.
INTRODUCTION
HIA is a systematic process that uses an array of data sources and analytic methods and considers input from stakeholders to determine the potential effects of a proposed policy, plan, program, or project on the health of a population and the distribution of those effects within the population. HIA provides recommendations on monitoring and managing those effects.
Source: National Research Council, 2011
WHAT IS A HEALTH IMPACT ASSESSMENT (HIA)?
INTRODUCTION OCTOBER 2016

PAGE 6 PAGE 6
INTRODUCTIONTransportation systems play a critical role in the health of communities by affecting reliable access to jobs, services, health care, healthy foods and recreation. In 2015, the Minnesota Department of Health (MDH) partnered with the Minnesota Department of Transportation (MnDOT) to ensure that health was being considered in the 2017 revision of the Statewide Multimodal Transportation Plan (SMTP). The SMTP is the highest level transportation plan in the state. MDH and MnDOT performed a Health Impact Assessment (HIA, see previous page sidebar) to identify how proposed changes in the SMTP could impact health and offer recommendations that better support health. The HIA represents the next step forward toward a vision of Health in All Policies that began with an Interagency Agreement signed by MnDOT and MDH in 2015, which formalized a collaborative relationship based on improving people’s health through Minnesota transportation system changes.
CONNECTING HEALTH AND TRANSPORTATIONPublic health experts recognize that many factors shape our health. While medicine and health care have received the most attention (and investment), they only contribute a small part to our health status. Other factors, such
as our social and physical environments, play a greater role in shaping our health. The factors that affect our health are collectively known as the Social Determinants of Health (see diagram, page 7). The transportation system influences our ability to access many of these factors.
HIA AREAS OF FOCUSThis HIA examined the health impacts of proposed changes in three SMTP sections:
• Transportation Safety: focuses on safeguarding transportation users and the communities that the systems travel through, along with fostering a culture of transportation safety in Minnesota;
• Healthy Communities: examines fiscally responsible decision making that respects and complements the natural, cultural, social and economic context; and
• Critical Connections: addresses how to maintain and improve multimodal transportation connections to help achieve progress in meeting performance measures and to maximize social, economic and environmental benefits.
The HIA also reviewed these sections for impacts to equity. Following is a brief summary of the findings from each section, along with highlights from the equity review.
MDH MNDOT SMTP HEALTH IMPACT ASSESSMENT
EXECUTIVE SUMMARY

PAGE 7 PAGE 7 EXECUTIVE SUMMARY OCTOBER 2016
HOW IS TRANSPORTATION ONNECTED TO HEALTH? e transportation system influences our ability to access
any factors that determine our health. Applying a health rspective to decisions made by transportation agencies n uncover and articulate the shared goals of promoting uitable health in Minnesota’s communities.
urce: Minnesota Department of Health (MDH), 2016
CThmpecaeq
So

PAGE 8 PAGE 8
TRANSPORTATION SAFETY BACKGROUNDThe Transportation Safety section of the SMTP focuses primarily on safety as it relates to crashes. The HIA expands this discussion by describing other factors that contribute to travelers’ sense of safety and mode choice beyond the risk of a crash.
High crime rates are associated with lower levels of physical activity, including walking, biking, or taking public transit, especially for women, youth and minorities. Severe weather, maintenance of sidewalks and roads, and other issues can also influence travelers’ safety. Addressing other issues related to safety can improve people’s use of active transportation, which can reduce air pollution and increase physical activity levels.
Increasing active modes of transportation, such as biking and walking, can improve health; however, an increased number of bicyclists and pedestrians on the streets can also increase the number of crashes. The HIA found that without better data on mode share it is difficult to compute the rate of crashes, a more accurate indicator of pedestrian and bicyclist safety. With an enhanced understanding of the number of pedestrians and bicyclists within the
transportation system, MnDOT and partners can better assess safety and strategies to prevent crashes.
SELECTED RECOMMENDATIONS
01 Expand our understanding of what it means to be safe while
traveling, especially for bicyclists and pedestrians.
02 Review existing maintenance agreements for sidewalks to
ensure safe travel by all ages and abilities. Track and report maintenance deficiencies, and develop enforcement procedures to ensure compliance.
03 Increase the availability and systematic use of automated
bicycle and pedestrian counters.
SEE ALSO:
Refer to pages 72-73 for the full list of recommendations related to Transportation Safety.
MDH MNDOT SMTP HEALTH IMPACT ASSESSMENT
WHAT DOES SAFETY MEAN TO YOU?
Safeguard transportation users and the communities the system travels through. Apply proven strategies to reduce fatalities and serious injuries for all modes.
TRANSPORTATION Source: 2017 SMTP
Perceived freedom to engage in healthy choices; influenced by crash risk, fear of crime, environmental exposure (e.g., heat, cold, tobacco smoke, pollution), and other stressors.
PUBLIC HEALTH

PAGE 9 PAGE 9
HEALTHY COMMUNITIESBACKGROUNDThe Healthy Communities section of the SMTP identifies a number of initiatives that engage the community and consider the surrounding physical, social and environmental context to inform decisions, including Safe Routes to School, Complete Streets, and Transit-Oriented Development.
As MnDOT contemplates broader guidelines for transportation planners to more systematically consider context, this HIA found that current paradigms (e.g., Context Sensitive Solutions, Context Zones) may fall short in considering the impacts on individuals and their health. Better data and robust community engagement would strengthen project planning and design efforts.
A more comprehensive consideration of the health impacts of decisions regarding environmental trends (e.g., climate change, environmental quality) is also warranted. The SMTP recognizes that transportation accounts for about a quarter of all greenhouse gas emissions that contribute to climate change. As the climate continues to warm, more frequent and severe weather events are likely. For example, increased heavy precipitation due to climate change may put many roads and bridges at risk from flooding.
This poses a threat to access to emergency medical services; the HIA identified over 1,500 health care facilities located in areas that are vulnerable to severe flooding.
Currently one in five traffic fatalities are related to poor weather conditions. Strong efforts to reduce transportation-related greenhouse gas emissions will carry significant public health benefits for Minnesotans today and for generations to come.
SELECTED RECOMMENDATIONS
01 Develop context guidance for transportation projects that
includes health determinant data and community engagement best practices.
02 Continue to work toward shifting travelers to active transportation
modes by providing convenient, safe and connected walking, biking and transit infrastructure.
03 Work with the Minnesota Environmental Quality Board
and the Minnesota Pollution Control Agency to identify effective strategies to reduce air pollution and greenhouse gas emissions to meet the Next Generation Energy Act goals.
SEE ALSO:
Refer to pages 100-101 for the full list of recommendations related to Healthy Communities.
EXECUTIVE SUMMARY OCTOBER 2016
WHAT DOES CONTEXT MEAN TO YOU?
The physical, social, and attitudinal environment
which people live and onduct their lives.
inc
PUBLIC HEALTHSource: World Health Organization
Represents the transportation need, project logistics, naturenvironment, and human environment.
al
TRANSPORTATION Source: Federal Highway Administration

PAGE 10 PAGE 10
CRITICAL CONNECTIONSBACKGROUNDWith limited funding, MnDOT must continuously decide how to allocate limited resources to ensure essential components of the transportation system are prioritized. A common approach is to fund projects with a higher return on investment (ROI), but many health impacts are not included in the ROI calculation.
For example, long-term improvements in health and reductions in chronic diseases due to increased physical activity from active transportation are rarely accounted for, yet may carry significant cost savings to society. Additionally, sometimes decisions to increase revenue can carry unintentional health consequences. Alcohol advertising on transit trains and buses can provide operating revenue, but also can increase alcohol consumption and its related risks, especially for youth.
SELECTED RECOMMENDATIONS
01 Explore the potential utility of new models and tools that capture the
social and health benefits and costs of transportation projects.
02 Work with transit agencies, the Metropolitan Council and cities to
review and revise transit agencies’ formal policies to ban alcohol advertisements on transit property by 2020.
SEE ALSO:
Refer to page 111 for the full list of recommendationsrelated to Critical Connections
MDH MNDOT SMTP HEALTH IMPACT ASSESSMENT
HOW DO WE DEFINE ?RETURN ON INVESTMENT
Terms such as return on investment, cost efficient, and low cost/high benefit belie the underlying assumption about which costs and benefits are being considered. Transportation decisions can have strong impacts on communities’ access to jobs, healthy food, green space, recreation, art, housing, and healthcare facilities, yet these impacts are not always reflected in fiscal terms.
MDH Source: Refer to page 104 for additional information

PAGE 11 PAGE 11
EQUITYBACKGROUNDAdvancing equity is key to helping all Minnesotans reach their full potential. While not an explicit objective, the 2017 SMTP makes significant advancements toward including equity in decision-making processes in order to build transportation systems that are just and fair.
The HIA highlights current health inequities in Minnesota, examines how transportation systems serve its most vulnerable users and encourages MnDOT to continue efforts to address inequities in transportation and health. Applying an equity lens to transportation challenges how decisions are made and who benefits the most.
SELECTED RECOMMENDATIONS
01 Define what equity means in transportation and include
transportation equity in the Minnesota GO Vision.
02 Study, document and report on inequities in Minnesota’s
transportation system and define MnDOT’s role in reducing those inequities.
NEXT STEPS What can you do to make an impact?
• Learn more about the SMTP. Visit the Minnesota GO website at www.MinnesotaGO.org to learn more about the SMTP and other draft plans.
• Make your voice heard! Submit feedback to MnDOT by Oct.14, 2016 about how the transportation system impacts the health of your family and community. What does an equitable transportation system look like to you? How can we better invest in transportation to improve the health of all Minnesotans? Weigh in at www.MinnesotaGO.org.
SEE ALSO:
efer to page 118 for the full list of recommendations elated to Equity.
Rr
EXECUTIVE SUMMARY OCTOBER 2016
WHY DOES EQUITY MATTER?
Our plan stresses the need for us to consider and better understand how transportation decisions can advance equity for low-income communities, communities of color, and persons with disabilities.
COMMISSIONER CHARLES ZELLEMinnesota Department of Transportation
Transportation and health are inextricably linked by our shared goals of equitable opportunities for all Minnesotans. This HIA advances those efforts and is an example of how MDH and MnDOT can promote Health in All Policies for a healthier Minnesota.
COMMISSIONER DR. EDWARD EHLINGERMinnesota Department of Health

PAGE 12 PAGE 12
PART ITRANSPORTATION AND HEALTH CONTEXT
PH
OTO
CR
ED
IT: M
inne
sota
Dep
artm
ent o
f Tra
nspo
rtatio
n
1HIA APPROACH
2BASELINE HEALTH
ASSESSMENT

PAGE 13 PAGE 13
1.1 BACKGROUNDPublic health experts recognize there are many factors that shape our health. While medicine and health care have received the most attention (and investment), they only contribute a small part to our health status. Other factors, such as our social and physical environments, play a greater role in shaping our health. These factors are collectively known as the social determinants of health (Figure 1, below).
Our health is shaped by our ability to access schools, jobs, goods and services, and community assets (i.e., the social determinants of health). As a result,
transportation plans, policies, and projects can have significant impacts on health. This makes the transportation system a key factor in contributing to the public’s health. Applying a health perspective to decisions made by transportation agencies can uncover and articulate the shared goals of promoting equitable health in Minnesota’s communities. To truly integrate health into decision-making processes, health must be incorporated into broad, long-term guidance documents. This report summarizes the collaboration between MDH and MnDOT to do just that – to use a Health Impact Assessment (HIA) to inform the revision of the state’s overall transportation plan.
1. HIA APPROACH
PART I CHAPTER 1: HIA APPROACH OCTOBER 2016
FIG. 1. HOW IS TRANSPORTATION ONNECTED TO HEALTH?
he transportation system influences our ability to access any factors that determine our health. Applying a health erspective to decisions made by transportation agencies an uncover and articulate the shared goals of promoting quitable health in Minnesota’s communities.
ee page 7 for a larger view of this graphic.
ource: Minnesota Department of Health (MDH), 2016
CTmpce
S
S

PAGE 14 PAGE 14
1.2 MINNESOTA’S TRANSPORTATION PLAN – THE SMTPThe Statewide Multimodal Transportation Plan (SMTP) is Minnesota’s highest level policy plan for transportation. It is a 20-year plan based on Minnesota GO — the vision for Minnesota’s transportation system that maximizes the health of people, the environment and the economy. The SMTP addresses all modes of transportation and all transportation partners. It covers more than just roadways and applies to more than just the transportation assets managed by MnDOT. It evaluates the status of the overall transportation system, societal and other trends impacting transportation, and how the state’s transportation system will move forward over the next twenty years. The SMTP is updated approximately every four years, with the last major revision in 2012.
The SMTP comprises five key objectives: 1. Open Decision Making2. Transportation Safety3. Critical Connections4. System Stewardship5. Healthy Communities
Each objective has a set of strategies, indicators, and performance metrics all designed to realize the Minnesota GO vision.
1.3 AN OPPORTUNITY FOR HEALTH IN ALL POLICIESHealth in All Policies (HiAP) is an approach to ensure decisions are made with full consideration of health impacts. While there is no single way to implement HiAP, there are five key elements, that are critical to its success1:
1. Promote health, equity and sustainability
2. Support intersectoral collaboration3. Benefit multiple partners4. Engage stakeholders5. Create structural or procedural change
The 2017 SMTP update is a prime example of putting HiAP into action by incorporating an HIA into the SMTP revision process. Through the HIA collaboration, health professionals were offered a seat at the planning table to share their questions, concerns, and perspectives on the state’s transportation system. This was especially fruitful when considering equity, a topic recently explored and given the highest priority by MDH.2 The HIA also provided a framework for sharing health and transportation data and exploring new tools, such as the Integrated Transport and Health Impacts Model (ITHIM).
MDH MNDOT SMTP HEALTH IMPACT ASSESSMENT
PAGE 15 PAGE 15
1.4 APPLYING THE HIA PROCESSThis health and transportation cross-sector collaboration is not new to Minnesota or to MDH and MnDOT. Projects such as Toward Zero Deaths and Safe Routes to School have long relied upon strong working relationships between the health and transportation sectors. The HIA builds upon the collaborative foundation by applying an HIA to the revised objectives and strategies of the SMTP. An HIA is a six-step process to uncover the connections between a proposed program, policy, or plan and health (Figure 2, following page). An HIA describes the potential health impacts, including the populations most affected, and makes recommendations to maximize the health benefits or minimize potential health risks.
1.5 GOALS OF THE HIAAs an indication of the strong relationship between health and transportation, MnDOT invited MDH to be a part of the 2017 SMTP update. The update focused on the strategies for each of the five SMTP objectives listed earlier. A work group was formed for each objective consisting of staff from MnDOT and its transportation partners across the state. Each work group met five times between Fall 2015 and Spring 2016 to review current progress, identify new trends, develop strategies, and draft a work plan to guide
MnDOT for the next four years. An HIA was conducted alongside the normal revision process with the following goals:
1. Participate in the SMTP work groups.2. Assess selected objectives and
strategies for connections to health.3. Provide recommendations to
maximize health benefits and minimize health risks.
4. Demonstrate the value and feasibility of a HiAP approach.
5. Build capacity among MnDOT staff to conduct and use HIA findings.
1.6 ENGAGING COMMUNITIES AND STAKEHOLDERS The revision of the SMTP required extensive community and stakeholder engagement by MnDOT. Their Public Participation Plan (PPP) included over 125 events, four stakeholder forums, a webinar, a video presentation, and online surveys. The engagement effort lead to over 250,000 Facebook views and 7,500 website sessions. In total, it generated more than 12,000 unique comments from across the state. While not all engagement efforts were effective with all regions or populations, MnDOT also sought input from a few organizations that represent underserved communities for recommended engagement strategies. This led to a pilot partnership with TPT/ECHO (Emergency, Community, Health, and Outreach) to do additional
PART I CHAPTER 1: HIA APPROACH OCTOBER 2016

PAGE 16 PAGE 16 MDH MNDOT SMTP HEALTH IMPACT ASSESSMENT
FIG. 2. WHAT IS THE HEALTH IMPACT ASSESSMENT PROCESS?

PAGE 17 PAGE 17
outreach at specific events and workplaces within cultural communities, generating over 300 survey responses.
Similarly, the HIA methodology also calls for extensive community engagement, particularly with those who would be directly impacted by the proposed decision. Because of the broad nature of the SMTP, potential health impacts are likely to be widely diffused across the state. This made it difficult to identify to what degree specific communities would be impacted. HIA project staff decided to rely on MnDOT’s extensive engagement efforts already in place through their PPP to ensure the HIA was in-line with the public’s priorities.
1.7 THE PUBLIC’S PRIORITIES FOR THE SMTPWhen asked to identify the most important changes for the SMTP to address, the public’s responses revealed the environment, travel behaviors, and population changes as top priorities (Figure 3, below). These top priorities varied somewhat by race and ethnicity. For example, Minnesota’s populations of color consistently ranked economic changes higher compared to Minnesota’s white population.
When asked about specific trends, Minnesotans prioritized aging infrastructure, urban and rural population trends, climate change, environmental quality, and
PART I CHAPTER 1: HIA APPROACH OCTOBER 2016
FIG. 3. WHAT CHANGES ARE MOST IMPORTANT FOR THE SMTP TO ADDRESS?
Result of statewide, public results, n=9,000.
Source: Minnesota Department of Transportation (MnDOT), 2016

PAGE 18 PAGE 18 MDH MNDOT SMTP HEALTH IMPACT ASSESSMENT
FIG. 4. TOP FIVE MINNESOTA TRENDSSource: MnDOT, 2016

PAGE 19 PAGE 19
transportation behavior (Figure 4, at left). The public tended to place greater emphasis on environmental trends (climate change, environmental quality, alternative fuels) while stakeholders emphasized transportation behaviors (aging population, and economy and employment) as top trends to address. Other trends identified by specific groups include racial disparities and equity (Black or African American, Hispanic), health trends (Native Americans), aging population (Native Americans, Ages 66+), and electrification and alternative fuels (Black or African American, Ages 20 and under).
Many of the trend topics are addressed throughout this report, such as climate change adaptation and mitigation, mode shift to active forms of transportation, improving mobility for those with disabilities, and health equity.
1.8 FOCUSING THE HIAThe HIA project team held an initial stakeholder meeting early in the process to help guide the HIA. Fifteen stakeholders from state and local government agencies, foundations, advocacy groups, and planning organizations gathered to discuss how the objectives in the 2012 SMTP connected to health. Many questions were raised, and it was recognized that not all the questions would be able to be answered within the
HIA. The group then discussed the health connections and voted to prioritize the focus of the HIA on issues that were feasible, added value, and could have a strong impact on health. Acknowledgements of the unanswered questions are provided in the Appendix.
Potential changes to the SMTP objectives and strategies were not yet identified at this stage in the revision process. Therefore, a decision was made to focus the HIA on the three SMTP objectives that held the greatest opportunity to impact health:
1. Healthy Communities2. Transportation Safety, and 3. Critical Connections.
PART I CHAPTER 1: HIA APPROACH OCTOBER 2016
PAGE 20 PAGE 20
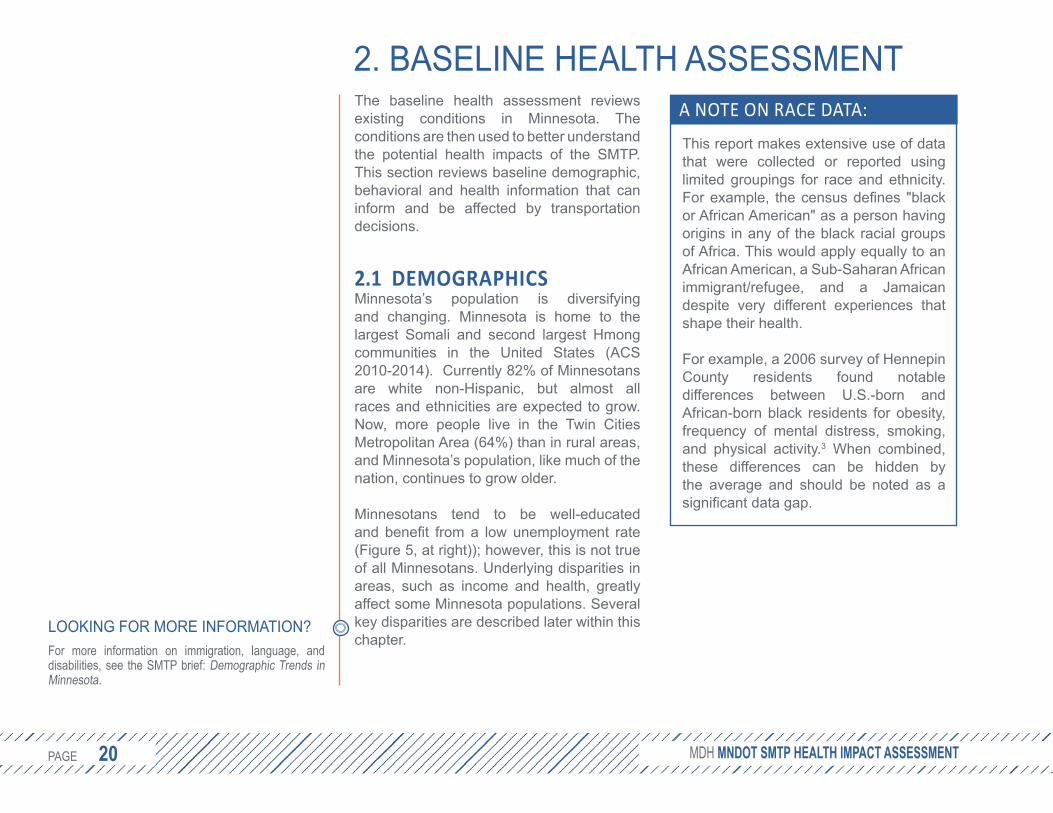
The baseline health assessment reviews existing conditions in Minnesota. The conditions are then used to better understand the potential health impacts of the SMTP. This section reviews baseline demographic, behavioral and health information that can inform and be affected by transportation decisions.
2.1 DEMOGRAPHICSMinnesota’s population is diversifying and changing. Minnesota is home to the largest Somali and second largest Hmong communities in the United States (ACS 2010-2014). Currently 82% of Minnesotans are white non-Hispanic, but almost all races and ethnicities are expected to grow. Now, more people live in the Twin Cities Metropolitan Area (64%) than in rural areas, and Minnesota’s population, like much of the nation, continues to grow older.
Minnesotans tend to be well-educated and benefit from a low unemployment rate (Figure 5, at right)); however, this is not true of all Minnesotans. Underlying disparities in areas, such as income and health, greatly affect some Minnesota populations. Several key disparities are described later within this chapter.
LOOKING FOR MORE INFORMATION?For more information on immigration, language, and disabilities, see the SMTP brief: Demographic Trends in Minnesota.
2. BASELINE HEALTH ASSESSMENT
MDH MNDOT SMTP HEALTH IMPACT ASSESSMENT
A NOTE ON RACE DATA:
This report makes extensive use of data that were collected or reported using limited groupings for race and ethnicity. For example, the census defines "black or African American" as a person having origins in any of the black racial groups of Africa. This would apply equally to an African American, a Sub-Saharan African immigrant/refugee, and a Jamaican despite very different experiences that shape their health.
For example, a 2006 survey of Hennepin County residents found notable differences between U.S.-born and African-born black residents for obesity, frequency of mental distress, smoking, and physical activity.3 When combined, these differences can be hidden by the average and should be noted as a significant data gap.

PAGE 21 PAGE 21 PART I CHAPTER 2: BASELINE HEALTH ASSESSMENT OCTOBER 2016
FIG. 5. SELECT DEMOGRAPHICS
Select information from the 2014 American Community Survey.
Source: 2014 American Community Survey 1-Year Estimates, U.S. Census Bureau
MINNESOTA TWIN CITIES METRO AREA
Total population 5,457,173 3,495,176
65 years old and over 14.3% 12.2%
High school graduate or higher 92.6% 93.2%
Foreign born 7.8% 10.1%
Unemployed 3.3% 3.4%
Median household income $61,481 $69,111
Living in poverty 11.5% 10.3%
No vehicle access 7.4% 7.9%
Broadband internet access 78.3% 82.0%
Race and ethnicity
White 82.1% 77.9%
Black or African American 5.3% 7.3%
American Indian or Alaska Native 1.0% 0.5%
Asian 4.3% 5.9%
Some other race(s) 2.4% 2.9%
Hispanic (any race) 4.9% 5.5%
Non-native English Speaker

PAGE 22 PAGE 22
2.1.1 DIVERSE POPULATION GROWTHFigure 6 (below) shows population projections for regions of the state based on Minnesota’s regional development organizations. Between 2015 and 2035, Minnesota’s population is expected to grow by 13%. Regions 7E and 7W (Central) is expected to grow the most (36%) while Region 8 (Southwest) can expect little to no population growth.4
Each region is also expected to become more racially and ethnically diverse (Figure 7, opposite, top). Among racial and ethnic groups, the Latino population is expected to grow the most (70%), with the number of all people of color increasing by 50%. White populations will grow a modest 4%, while Native American populations may remain at current levels or decline slightly (Figure 8, opposite, bottom).
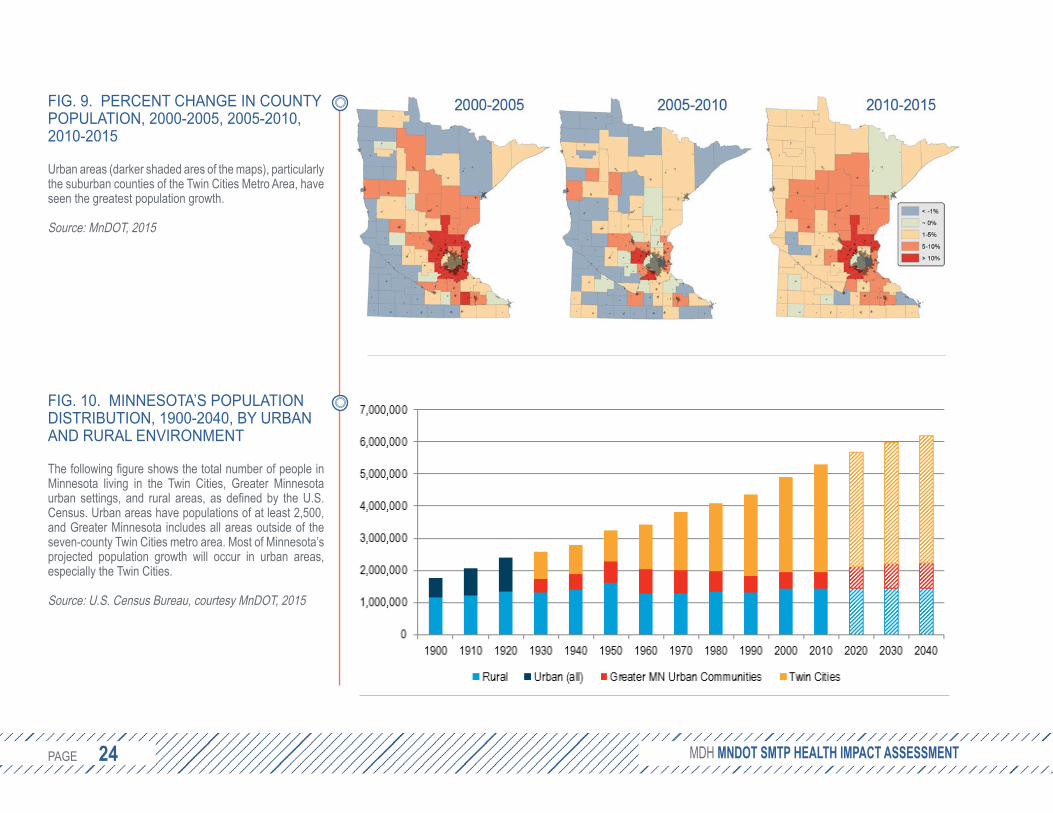
Within each region, urban areas are likely to see the greatest population growth. According to the 2010 census, over 80% of the U.S. population and 73% of the Minnesota population reside in an urban area. Since 2000, Minnesota’s urban – and particularly its suburban – regions have experienced the greatest growth (Figure 9, page 24), a trend that is expected to continue with the Twin Cities Metro Area absorbing much, but not all, of the expected population growth (Figure 10, page 24).
MDH MNDOT SMTP HEALTH IMPACT ASSESSMENT
FIG. 6. MINNESOTA REGIONAL DEVELOPMENT ORGANIZATIONS
Population projections are based on the 11 regionaldevelopment organizations.
Source: Minnesota State Demographic Center

PAGE 23 PAGE 23 PART I CHAPTER 2: BASELINE HEALTH ASSESSMENT OCTOBER 2016
FIG. 7. PROJECTED GROWTH OF INORITY POPULATIONS BY REGION, 015-2035
ll regions in Minnesota will increase in diversity of the ext 20 years.
ource: Minnesota State Demographic Center, 009
M2
An
S2
FIG. 8. PROJECTED POPULATION GROWTH BY RACE, 2015-2035
The state’s estimated 13% growth in total population will be driven by increases in racial and ethnic minority populations, with the stark exception of the Native American community, which is expected to remain at present levels.
Source: Minnesota State Demographic Center, 2009
-10%
0%
10%
20%
30%
40%
50%
60%
70%
80%
White Black Asian NativeAmerican
Mixed/other Latino People ofColor
All
PAGE 24 PAGE 24 MDH MNDOT SMTP HEALTH IMPACT ASSESSMENT
FIG. 9. PERCENT CHANGE IN COUNTY POPULATION, 2000-2005, 2005-2010, 2010-2015
Urban areas (darker shaded ares of the maps), particularly the suburban counties of the Twin Cities Metro Area, have seen the greatest population growth.
Source: MnDOT, 2015
FIG. 10. MINNESOTA’S POPULATION ISTRIBUTION, 1900-2040, BY URBAN ND RURAL ENVIRONMENT
he following figure shows the total number of people iinnesota living in the Twin Cities, Greater Minnesotrban settings, and rural areas, as defined by the U.Sensus. Urban areas have populations of at least 2,500nd Greater Minnesota includes all areas outside of theven-county Twin Cities metro area. Most of Minnesota’rojected population growth will occur in urban areasspecially the Twin Cities.
ource: U.S. Census Bureau, courtesy MnDOT, 2015
DA
T n M a u . C , a e s s p , e
S

PAGE 25 PAGE 25
2.1.2 AGING POPULATIONAs the baby boomer population retires from the workforce and faces increasing health challenges, transportation systems must be prepared to adequately serve what is being described as the “silver tsunami.” Figure 11 (below) shows the population distribution by age and sex for 2015 and 2035. As the distribution shifts to historic
levels of those 65 and older and even 85 and older, transportation systems must balance often competing demands to age in place, live independently but not socially isolated, and access goods and services without dependence on the ability to drive a car.
PART I CHAPTER 2: BASELINE HEALTH ASSESSMENT OCTOBER 2016
FIG. 11. POPULATION GROWTH BY GE AND SEX
s the baby boomer generation grows older, a greater roportion of our population will be over the age of 60.
ource: Minnesota State Demographic Center, 2015
A
Ap
S

PAGE 26 PAGE 26
2.1.3 INCOME INEQUITYNot all Minnesotans benefit equitably from the social, environmental, and political systems, and not all Minnesotans have the opportunities to let them live long, healthy lives. Instead, institutional racism and historical oppression has limited the ability of many Minnesotans from enjoying the same quality of life as more privileged groups. For example, fewer people of color with a high school diploma make at least $15 per hour than do white Minnesotans who did not graduate from high school. Similarly, whites with a high school diploma are more likely to make at least $15 per hour compared to people of color with some college or an associate’s degree (Figure 12, opposite, top).
The ramifications of this inequity in pay are significant for our state’s economic vitality. Figure 13 (opposite, bottom) shows the projected gains in income if all races and ethnicity groups had the same distribution of wages and hours as non-Hispanic whites, adjusted for age (National Equity Atlas, 2012). These lower wages affect an individual’s ability to purchase needed goods and services, and possibly reinvesting that money into the local economy and businesses.
Wealth and poverty tend to be distributed unequally by geography. Figure 14 (page 28) shows households with annual incomes over $200,000 (blue dots) and below $25,000 (yellow dots) for the Twin Cities, Rochester, Duluth, and St. Cloud (Esri, 2015). Figure 15 (page 29) shows the ratio of household incomes at the 80th and 20th percentiles to indicate the divide between high and low-income families. The low ratio (lighter areas) in the suburban counties may be attributed to relatively low levels of overall poverty. Figure 16 (top left, page 30), indicates the percent of county residents living below 185% of the federal poverty level. Nearly a quarter of Minnesotans live below 185% of the federal poverty level..
MDH MNDOT SMTP HEALTH IMPACT ASSESSMENT

PAGE 27 PAGE 27 PART I CHAPTER 2: BASELINE HEALTH ASSESSMENT OCTOBER 2016
FIG. 12. SHARE OF WORKERS EARNING AT LEAST $15 PER HOUR BY RACE AND LEVEL OF EDUCATION
A greater proportion of whites earn at least $15 per hour compared to people of color at the next highest level of education (except for college graduates).
Source: National Equity Atlas, 2012
FIG. 13. INCOMES WITH EQUITY
Actual and projected gains in income if all race and ethnicity groups had the same distribution of wages and hours as non-Hispanic whites, adjusted for age (2012).
Source: National Equity Atlas, 2012

PAGE 28 PAGE 28
FIG. 14. INCOME EXTREMES IN URBAN AREAS
Clockwise from top left, income extremes in the Twin Cities, Rochester, Duluth, and St. Cloud. Each dot represents two households with incomes over $200,000 (blue) or less than $25,000 (yellow).
Source: Map courtesy of Esri’s Living Atlas, 2015, based off data from the 2010 US Census
MDH MNDOT SMTP HEALTH IMPACT ASSESSMENT

PAGE 29 PAGE 29
FIG.15. INCOME INEQUALITY
Ratio of household incomes at the 80th and 20th percentiles. A higher ratio (darker areas) indicates greater gap between the top and bottom ends of the income spectrum.
Source: American Communities Survey 2010-2014
PART I CHAPTER 2: BASELINE HEALTH ASSESSMENT OCTOBER 2016

PAGE 30 PAGE 30
FIG. 16. PERCENT OF COUNTY RESIDENTS LIVING BELOW 185% OF THE FEDERAL POVERTY LEVEL (LEFT)
Nearly a quarter of Minnesotans live below 185% of the federal poverty level, but there are regional variations from approximately 15% in suburban counties to over one-third in some Greater Minnesota counties.
Data Source: Minnesota Environmental Public Health Tracking Program, 2016. https://apps.health.state.mn.us/mndata
FIG. 17. PERCENT OF CHILDREN IN POVERTY, 2011 (RIGHT)
About 15% of children live in poverty, impacting their growth and development. Support services aimed at mothers and children can reduce the harmful effects of poverty.
Data Source: Minnesota Environmental Public Health Tracking Program, 2016. https://apps.health.state.mn.us/mndata
The impacts of poverty are rarely restricted to the impoverished individual. Communities, businesses, and families are also impacted by poverty, including children. In Minnesota, 15% of children were living in poverty, threatening the stability of their housing,
educational opportunities, and access to nutritious food.5 This proportion varies across the state from less than 5% to over 39% (Figure 17). With the notable exception of Hennepin and Ramsey counties, childhood poverty is lower in the Twin Cities Metro Area.
MDH MNDOT SMTP HEALTH IMPACT ASSESSMENT
PAGE 31 PAGE 31
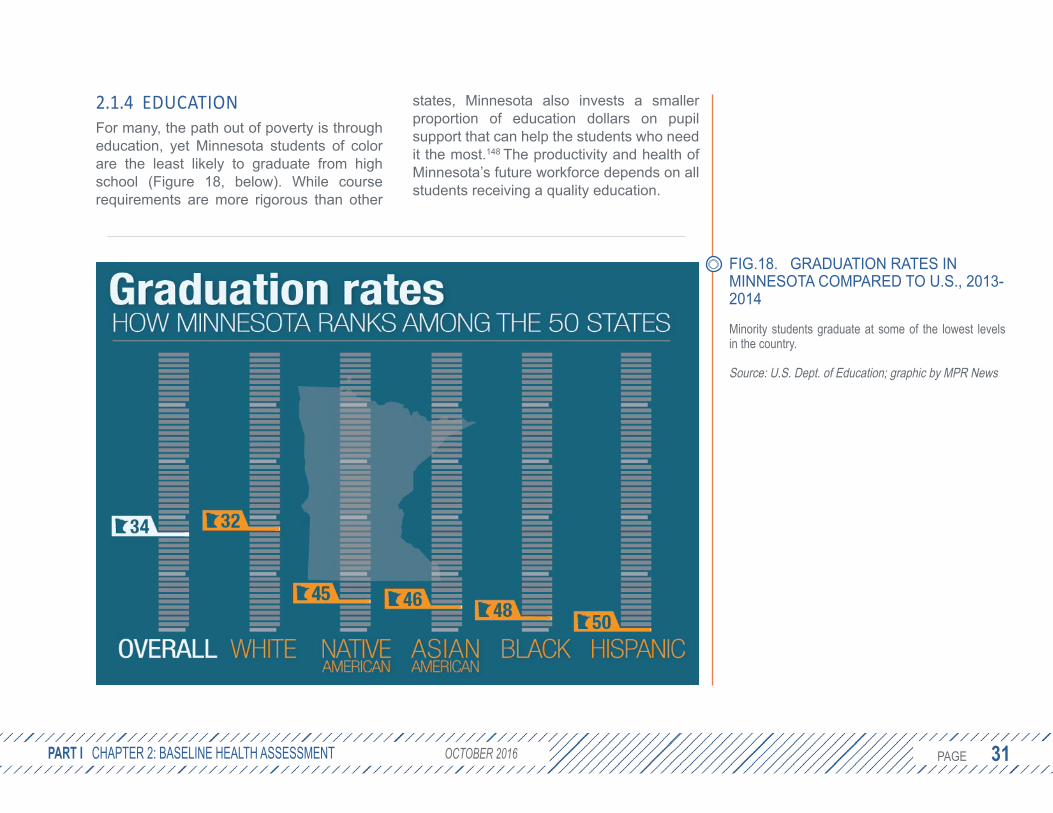
2.1.4 EDUCATIONFor many, the path out of poverty is through education, yet Minnesota students of color are the least likely to graduate from high school (Figure 18, below). While course requirements are more rigorous than other
states, Minnesota also invests a smaller proportion of education dollars on pupil support that can help the students who need it the most.148 The productivity and health of Minnesota’s future workforce depends on all students receiving a quality education.
PART I CHAPTER 2: BASELINE HEALTH ASSESSMENT OCTOBER 2016
FIG.18. GRADUATION RATES IN INNESOTA COMPARED TO U.S., 2013-014
inority students graduate at some of the lowest levels n the country.
ource: U.S. Dept. of Education; graphic by MPR News
M2
Mi
S

PAGE 32 PAGE 32
2.1.5 HOMELESSNESSOne barrier to academic achievement is housing stability. Youth experiencing homelessness or who are highly transient often face significant barriers to attending school. Transportation to and from school can be one of those barriers. The McKinney-Vento Act of 1987 requires school districts to provide transportation services for youth experiencing homelessness to
their school of origin, but coordinating the required transportation can often be difficult. As shown in Figure 19 (below), a 2015 statewide single-night count of all individuals in emergency shelters, domestic violence shelters, and transitional housing estimated at least 9,312 individuals were experiencing homelessness, including 3,296 children with parents.6 While lower than 2012 estimates, these numbers have yet to recover to pre-2008 U.S. recession levels.
MDH MNDOT SMTP HEALTH IMPACT ASSESSMENT
FIG. 19. SINGLE NIGHT COUNT OF PEOPLE EXPERIENCING HOMELESSNESS IN MINNESOTA, 2015
While difficult to measure accurately, homelessness is still a problem for many families in Minnesota.
Source: Wilder Research

PAGE 33 PAGE 33
2.2 TRAVEL BEHAVIOR2.2.1 PRIVATE VEHICLEAfter increasing from 1992-2004, the total annual vehicle miles traveled (VMT) in Minnesota has remained steady at about 57 billion. When considering population growth, the VMT per capita has declined slightly (MnDOT, 2015). Nationally, today’s drivers travel approximately 1,200 fewer miles compared to 2005,7 but some drivers still spend significant time behind the wheel. In particular, there are four suburban counties in Minnesota where over half of all commuters drive alone for over 30 minutes to work each day (Figure 20, at right). Long commutes are associated with increased risk for high blood pressure, obesity, and physical inactivity.8
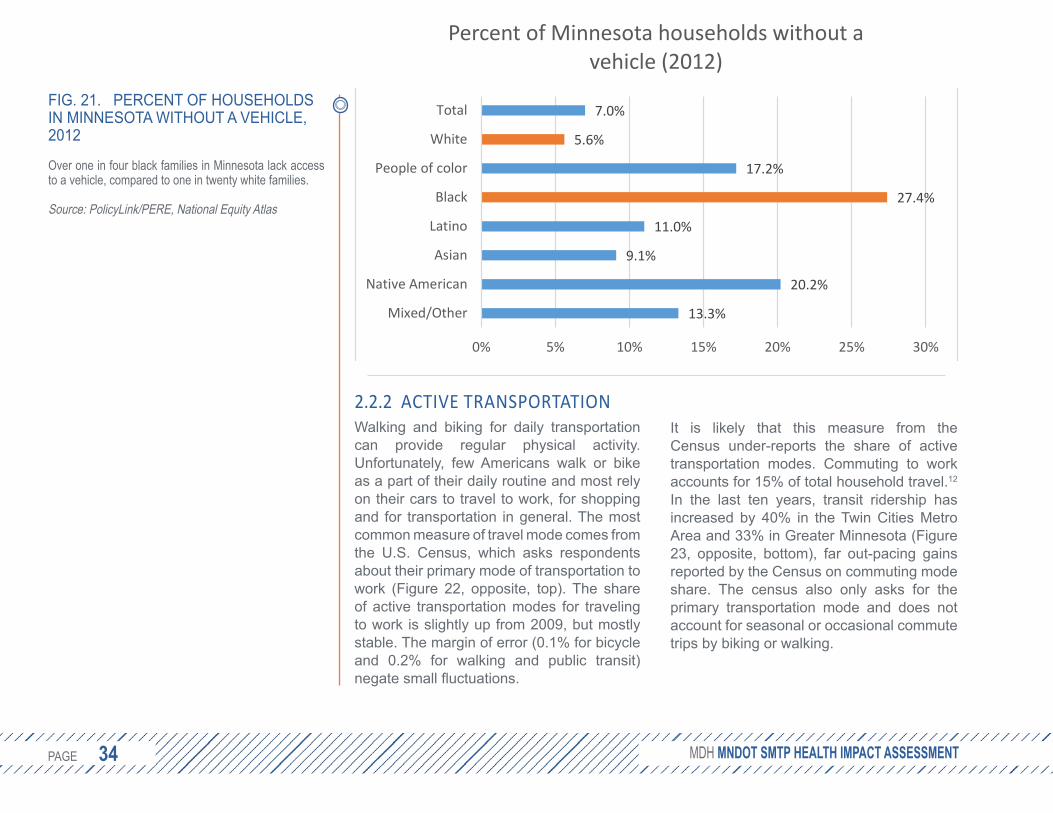
Not everyone has a car. Figure 21 (following page) shows a wide gap in lack of access to a vehicle between white (5.6%) and black (27.4%) Minnesotans.9 Households without a vehicle may struggle to access educational and employment opportunities. A robust multimodal transportation system can reduce household transportation costs and dependence on a vehicle for mobility while providing increased opportunities for health. Active transportation (walking, biking, or taking public transit, which usually includes walking segments) can be a significant source of regular physical activity when
incorporated into daily routines and can contribute to meeting the national physical activity guidelines of at least 150 minutes per week.10, 11
PART I CHAPTER 2: BASELINE HEALTH ASSESSMENT OCTOBER 2016
FIG. 20. PERCENT OF SOLO OMMUTERS DRIVING OVER 30 INUTES
ong commutes are associated with increased health isks.
ource: American Community Survey, 2010-2014
CM
Lr
S
PAGE 34 PAGE 34
2.2.2 ACTIVE TRANSPORTATIONWalking and biking for daily transportation can provide regular physical activity. Unfortunately, few Americans walk or bike as a part of their daily routine and most rely on their cars to travel to work, for shopping and for transportation in general. The most common measure of travel mode comes from the U.S. Census, which asks respondents about their primary mode of transportation to work (Figure 22, opposite, top). The share of active transportation modes for traveling to work is slightly up from 2009, but mostly stable. The margin of error (0.1% for bicycle and 0.2% for walking and public transit) negate small fluctuations.
It is likely that this measure from the Census under-reports the share of active transportation modes. Commuting to work accounts for 15% of total household travel.12 In the last ten years, transit ridership has increased by 40% in the Twin Cities Metro Area and 33% in Greater Minnesota (Figure 23, opposite, bottom), far out-pacing gains reported by the Census on commuting mode share. The census also only asks for the primary transportation mode and does not account for seasonal or occasional commute trips by biking or walking.
MDH MNDOT SMTP HEALTH IMPACT ASSESSMENT
FIG. 21. PERCENT OF HOUSEHOLDS IN MINNESOTA WITHOUT A VEHICLE, 2012
Over one in four black families in Minnesota lack access to a vehicle, compared to one in twenty white families.
Source: PolicyLink/PERE, National Equity Atlas
13.3%
20.2%
9.1%
11.0%
27.4%
17.2%
5.6%
7.0%
0% 5% 10% 15% 20% 25% 30%
Mixed/Other
Native American
Asian
Latino
Black
People of color
White
Total
Percent of Minnesota households without a vehicle (2012)

PAGE 35 PAGE 35
A recent study by the University of Minnesota estimates 2.2% of all trips in the Twin Cities Metro Area in 2012 were by bicycle, up from 1.4% in 2000. Walking similarly increased from 4.5% of trips in 2000 to 6.6% in 2010.13 These estimates are roughly double what is reported by the U.S. Census.
PART I CHAPTER 2: BASELINE HEALTH ASSESSMENT OCTOBER 2016
FIG. 22. PRIMARY TRAVEL MODE TO WORK, 2006-2014
Active transportation still represents a small share of all travel.
Source: American Community Survey 1-year estimates, U.S. Census Bureau
FIG. 23. TRANSIT RIDERSHIP IN TWIN CITIES AND GREATER MINNESOTA, 2004-2013
Significant gains have been made in transit ridership throughout Minnesota.
Source: MnDOT SMTP Trend Analysis, 2016
0
10
20
30
40
50
60
70
80
90
100
Twin Cities Greater MN
2004 2013

PAGE 36 PAGE 36
Racial and ethnic differences in mode shareIn Minnesota, populations of color represent 12.6% of the labor force yet comprise nearly one-third (32.8%) of those who commute to work by public transit.14 This may be due to the gap in vehicle access shown earlier in Figure 21. In addition to a reliance on alternative modes of transportation to work, these communities may face barriers to using active transportation (e.g., walking, biking). A study found that black pedestrians were twice as likely to be passed while in a crosswalk by motorists as white pedestrians.15
A 2012 survey found that 17% of Hispanic pedestrians “felt threatened for their personal safety” the last time they walked compared to 6% of white walkers. The survey also noted 73% of white pedestrians considered it safe to walk in their neighborhood, while only 61% of black pedestrians and 63% of Hispanic walkers felt safe.16 Over one-third (35%) of Native American respondents were dissatisfied with how their community was designed for bicycling, which is above the average of 27%.17 In addition, African American, American Indian and Latina immigrant women cited an increased reluctance to walk in public spaces for safety concerns.18
Gender differences in mode shareAccording to the 2009 National Household Travel Survey, women walk to work in relatively equal proportion to their percentage of all commuters. In fact, women are slightly overrepresented in the 50 most-populous cities making up 49% of walking commuters and only 47% of overall commuters.19 That trend does not hold for biking. Women are greatly underrepresented at just 27.8% of U.S. commuters who bike; in Minnesota, women comprise 33.7% of bike commuters in the state and 31.9% of bike commuters in the Twin Cities Metro Area.20
Income status differences in mode shareCommuters with low income represent a higher percentage of those who walk and use public transit than their percentage in the overall commuter population. On average across the U.S., people of low income represent 14% of the commuter population, but are 31% of commuters who walk to work and 22% of commuters who take transit to work. In Minnesota, those earning less than 150% of the poverty level represent 10.9% of the commuter population but comprise 23.9% of those who commute to work by public transit.14
Trips low-income households make by walking or biking are more likely to be for daily errands, work, school, or church than
MDH MNDOT SMTP HEALTH IMPACT ASSESSMENT

PAGE 37 PAGE 37
for social or recreational purposes. This may be due to safety concerns. One study found that low-income households are less likely to engage in physical activity due to fear of violence.17
Land use density differences in mode shareWhile biking and walking are seeing a modest increase in mode share nationwide, the most noticeable advances are happening in cities, particularly larger cities. Among the most populous cities, the percentage of commuters walking to work has always been higher than the average across states. Large cities have also seen a greater increase in bicycling, growing 71% from 2007 to 2013, compared to 50% for all states.
However, the trend toward active transportation is happening in smaller and mid-sized cities as well, with a number of mid-sized cities out-pacing the largest cities.17 These trends are consistent with research that shows that increased land mix and density at the origin and destination is related to an increase in walking and transit and a decrease in single-occupancy vehicle trips.21, 22 Since Minnesota is becoming increasingly urban,4 this creates an opportunity to support a more multimodal transportation system with more walkable, bikeable and transit-oriented communities.
2.2.3 TRANSPORTATION & HEALTH TOOLThe Transportation & Health Tool was developed by the U.S. Department of Transportation and the Centers for Disease Control and Prevention (CDC) to examine the health impacts of transportation systems. Each indicator is given a score between 0 (bad) and 100 (good) based on how the state, region, or city compares nationally.
Figure 24 (following page) includes the indicators relating to mode share for Minnesota and four urban areas (Minneapolis-St. Paul, Rochester, Duluth, and Mankato) where available. These data show that Rochester residents tend to drive more than the state as a whole, but they also have a large proportion of commuters who use active transportation, suggesting those that do drive tend to drive much further. A high proportion of residents in Mankato and Duluth walk to work, and Minneapolis-St. Paul scores the highest for biking and taking transit to work. Overall, the vehicle miles traveled (VMT) per person is above average for the nation.
PART I CHAPTER 2: BASELINE HEALTH ASSESSMENT OCTOBER 2016

PAGE 38 PAGE 38
Figure 25 (opposite, bottom) shows scores for indicators relating to where people live. Living within 200 meters (219 yards) of a major roadway can expose residents to noise and air pollution and their associated health risks. Even in urban areas, residents living in Greater Minnesota fare better on this indicator than those in the Twin Cities Metro Area. The Land Use Mix indicator looks at the presence of eight different employment types (i.e., office, retail, industrial, service, entertainment, education, health, and public sector) within each block group and computes a population-weighted average of
all block groups within a metropolitan area. A mix of land uses is one factor positively associated with increased physical activity.23 For this indicator, only Mankato fares better than the 50th percentile of U.S. cities. Finally, the Housing and Transportation Affordability Index measures the percent of household income spent on housing and transportation combined. Here we see that two cities with ahigh proportion of transit commuters also have the lowest burden of housing and transportation costs. While direct relationships cannot be inferred, transportation costs are often lower in
MDH MNDOT SMTP HEALTH IMPACT ASSESSMENT
FIG. 24. MODE SHARE INDICATORS (TRANSPORTATION AND HEALTH TOOL)
Compared nationally, Mankato, Duluth, Rochester, Minneapolis, and Minnesota generally score at or above average for indicators relating to active transportation mode share, with the exception of vehicle miles traveled per capita.
Source: Transportation and Health Tool, 2016

PAGE 39 PAGE 39
transit-oriented developments.24 These benefits may not be available to all residents within a city. Walkable, bike- and transit-friendly neighborhoods offer convenient access to jobs, education, social services, and amenities, saving time and money as well as promoting physical activity. These features also make neighborhoods highly desirable, resulting in increased housing costs that could prevent lower-income families from accessing healthy and affordable housing and transportation.
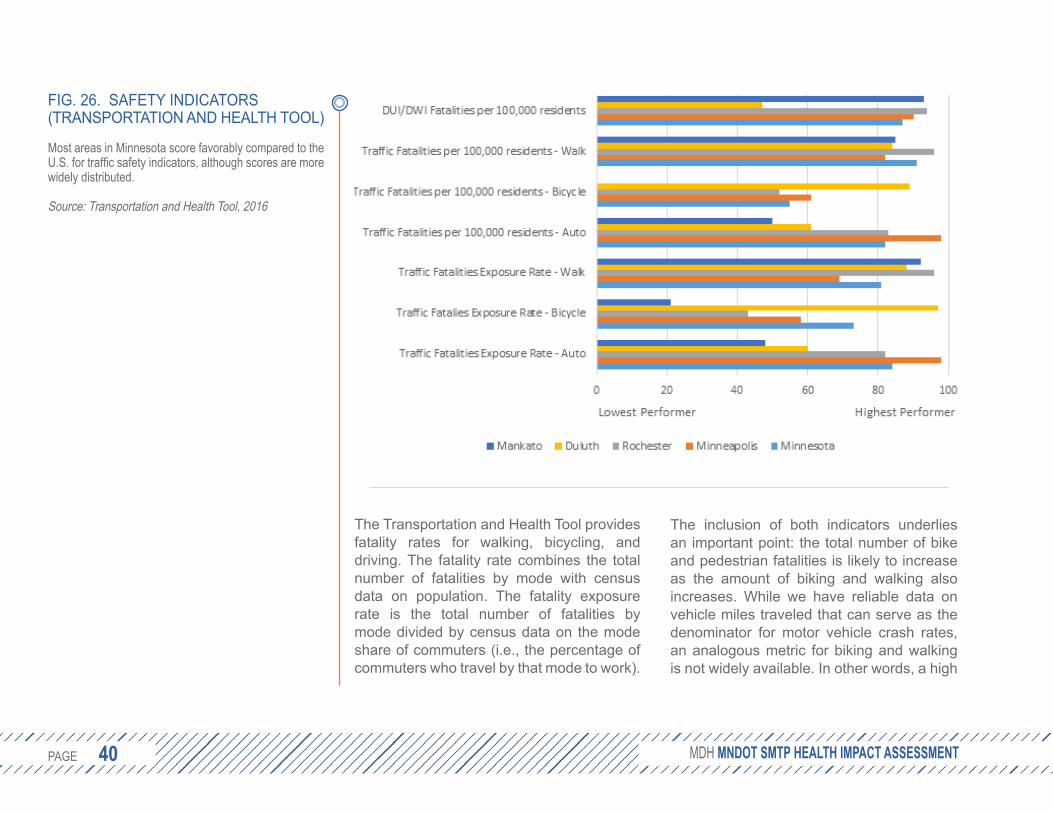
Figure 26 (following page, top) includes indicators for traveler safety. Due to limitations of the data, these indicators should not be
used to compare relative safety of travel modes, but instead offer insights into the variation of safety across urban areas. In 2012 alcohol-impaired motor vehicle crashes accounted for nearly one-third (31%) of all traffic-related deaths in the U.S..25 The first indicator in Figure 26 is the rate per 100,000 population of alcohol-related crash fatalities. Minnesota as a whole and three of the four cities listed compare favorably with national statistics. Figure 27 (page 41) shows the percent of all driving deaths that involved alcohol by county. There is not a strong geographic pattern, suggesting local enforcement policies may play a larger role.
PART I CHAPTER 2: BASELINE HEALTH ASSESSMENT OCTOBER 2016
FIG. 25. LAND USE INDICATORS(TRANSPORTATION AND HEALTH TOOL)
Compared nationally, Mankato, Duluth, and Rochester score highly for proximity to major roadways, while Minneapolis and Minnesota are below average. All areas except Mankato score below average for land use mix, and all areas score at or above average for housing and transportation affordability.
Source: Transportation and Health Tool, 2016
PAGE 40 PAGE 40
The Transportation and Health Tool provides fatality rates for walking, bicycling, and driving. The fatality rate combines the total number of fatalities by mode with census data on population. The fatality exposure rate is the total number of fatalities by mode divided by census data on the mode share of commuters (i.e., the percentage of commuters who travel by that mode to work).
The inclusion of both indicators underlies an important point: the total number of bike and pedestrian fatalities is likely to increase as the amount of biking and walking also increases. While we have reliable data on vehicle miles traveled that can serve as the denominator for motor vehicle crash rates, an analogous metric for biking and walking is not widely available. In other words, a high
MDH MNDOT SMTP HEALTH IMPACT ASSESSMENT
FIG. 26. SAFETY INDICATORS(TRANSPORTATION AND HEALTH TOOL)
Most areas in Minnesota score favorably compared to the U.S. for traffic safety indicators, although scores are more widely distributed.
Source: Transportation and Health Tool, 2016

PAGE 41 PAGE 41
rate of bicycle fatalities per population may be driven more by the number of bicyclists than by policies or environmental factors that create unsafe biking conditions. Given these limitations, these are not strong indicators of performance, particularly if the goal is to balance crash risk with the promotion of active travel modes. Instead, they are included as the best available data that, taken together with local assessments of safety and use for each mode, may help identify cities that are employing – or in need of – best practices to prevent crashes while promoting active transportation options.
Pedestrians may experience a disproportionately higher risk associated with fatal injuries. Awareness of this risk creates an additional barrier to walking and biking.26, 27
FIG. 27. PERCENT OF TRAFFIC DEATHS INFLUENCED BY ALCOHOL, 2010-2014
Alcohol-impaired crash deaths vary widely across the state, from less than 10% of all deaths to over 70%.
Source: Fatality Analysis Reporting System, 2010-2014
PART I CHAPTER 2: BASELINE HEALTH ASSESSMENT OCTOBER 2016

PAGE 42 PAGE 42
2.3 HEALTH STATUS2.3.1 LIFE EXPECTANCYMinnesota has one of the highest life expectancies in the country at 81.1 years,28
but closer analysis reveals significant variation based on income, race, and health behaviors. A recent nationwide study of tax and death records from 1999-2014 found the gap in life expectancy for men between the richest 1% and the poorest 1% is 14.6 years.29 The report also found geographic variation in life expectancy among those with
low incomes but not high incomes. This is consistent with other studies that found large variations in life expectancy by zip code within the Twin Cities Metro Area (Figures 28 and 29, below).
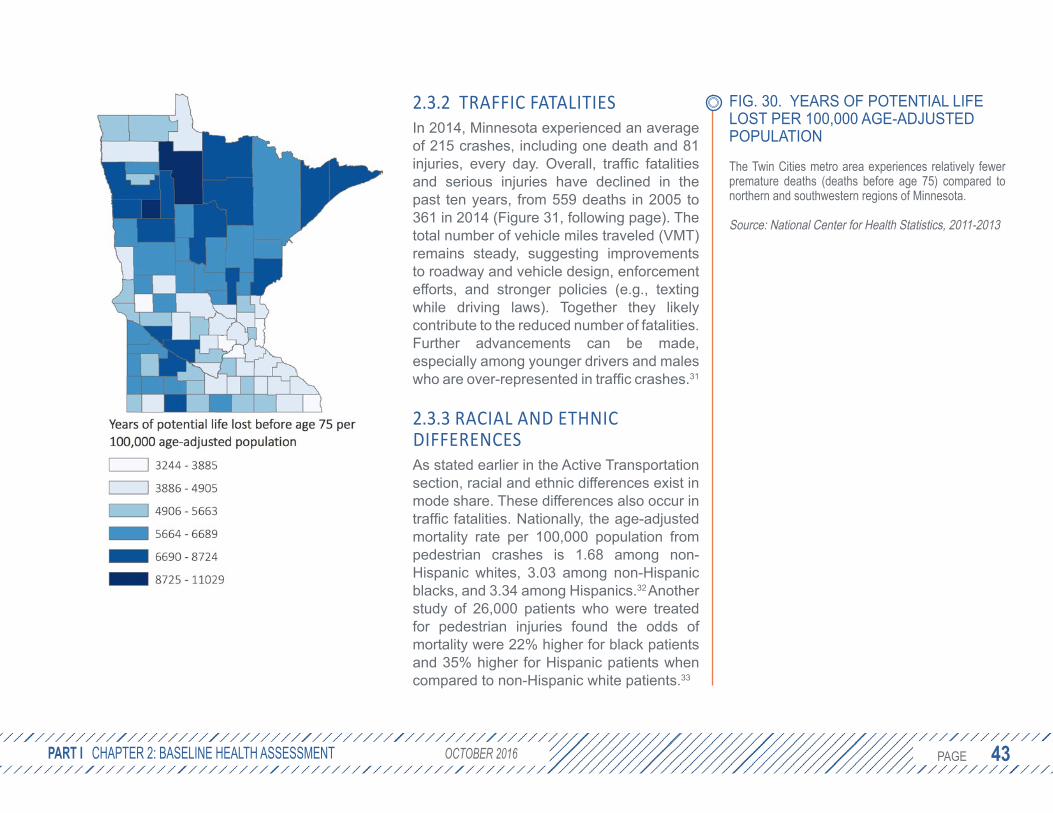
Life expectancy also varies among counties across the state. Figure 30 (opposite) shows the Twin Cities Metro Area experiences relatively fewer premature deaths (deaths before age 75) compared to northern and southwestern regions of Minnesota.
MDH MNDOT SMTP HEALTH IMPACT ASSESSMENT
FIG. 28 (LEFT). LIFE EXPECTANCY VARIATIONS ACROSS THE TWIN CITIES METRO AREA
According to analysis by the Robert Wood Johnson Foundation in 2013, two neighborhoods three miles apart could have as much as 13 years difference in life expectancy.
Source: Robert Wood Johnson Foundation, 2013
FIG. 29 (RIGHT). LIFE EXPECTANCY IN THE TWIN CITIES METRO AREA BY ZIP CODE, 2010
There is greater variation in life expectancy within the urban cores of the Twin Cities Metro Area, varying from 70 to over 83 years.
Source: Wilder Research analysis of Minnesota Department of Health mortality data (2005-2007) and U.S. Census Bureau data (Wilder Research, 2010)
Metro Map: Minneapolis and St. Paul, MN This map shows just a few miles can mean a 13-year diff. in life expectancy for babies born in Minneapolis & St. Paul.
June 13, 2013
City MapsA short distance can mean large disparities in health. Browse this collection of maps that show
dramatic differences in life expectancy for babies in major U.S. cities.
MORE MAPS IN THE SERIES
Read more
LEARN MORE ABOUT
RWJF Commission
Page 1 of 2Minneapolis and St. Paul Area: Life Expectancy Disparities - Robert Wood Johnson Foun...
5/9/2016http://www.rwjf.org/en/library/infographics/minneapolis-map.html
PAGE 43 PAGE 43
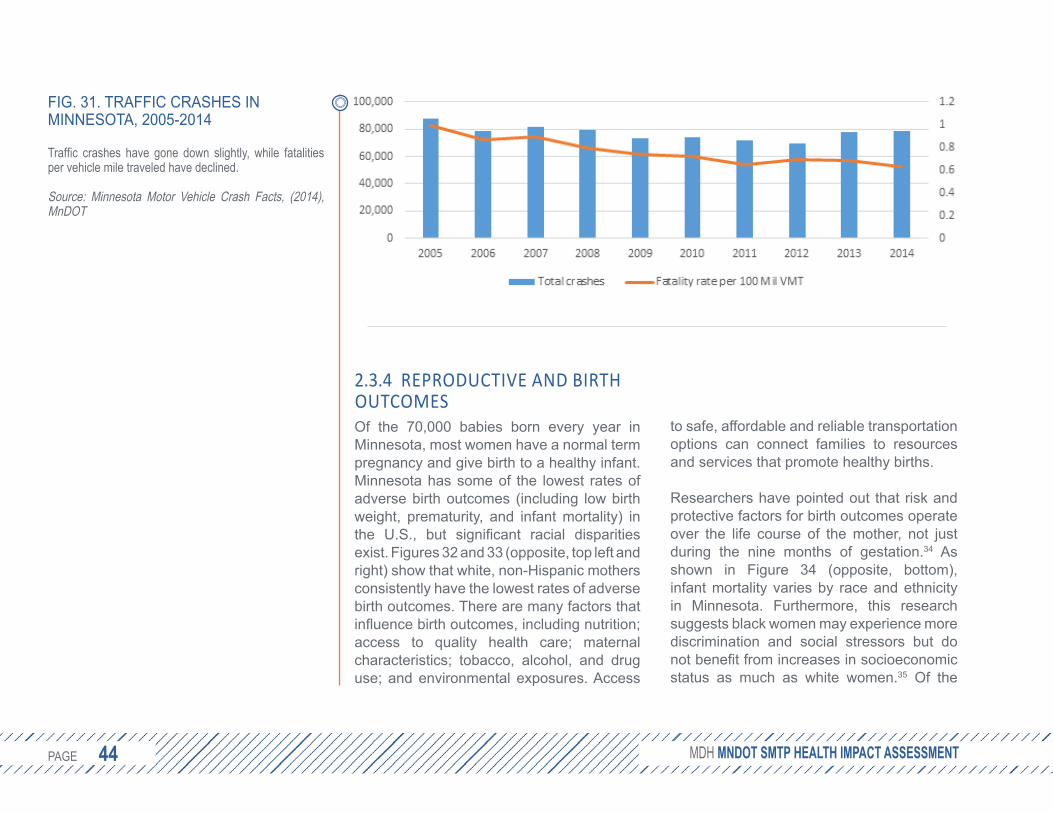
2.3.2 TRAFFIC FATALITIESIn 2014, Minnesota experienced an average of 215 crashes, including one death and 81 injuries, every day. Overall, traffic fatalities and serious injuries have declined in the past ten years, from 559 deaths in 2005 to 361 in 2014 (Figure 31, following page). The total number of vehicle miles traveled (VMT) remains steady, suggesting improvements to roadway and vehicle design, enforcement efforts, and stronger policies (e.g., texting while driving laws). Together they likely contribute to the reduced number of fatalities. Further advancements can be made, especially among younger drivers and males who are over-represented in traffic crashes.31
2.3.3 RACIAL AND ETHNIC DIFFERENCESAs stated earlier in the Active Transportation section, racial and ethnic differences exist in mode share. These differences also occur in traffic fatalities. Nationally, the age-adjusted mortality rate per 100,000 population from pedestrian crashes is 1.68 among non-Hispanic whites, 3.03 among non-Hispanic blacks, and 3.34 among Hispanics.32 Another study of 26,000 patients who were treated for pedestrian injuries found the odds of mortality were 22% higher for black patients and 35% higher for Hispanic patients when compared to non-Hispanic white patients.33
PART I CHAPTER 2: BASELINE HEALTH ASSESSMENT OCTOBER 2016
FIG. 30. YEARS OF POTENTIAL LIFE LOST PER 100,000 AGE-ADJUSTED POPULATION
The Twin Cities metro area experiences relatively fewer premature deaths (deaths before age 75) compared to northern and southwestern regions of Minnesota.
Source: National Center for Health Statistics, 2011-2013
PAGE 44 PAGE 44
2.3.4 REPRODUCTIVE AND BIRTH OUTCOMESOf the 70,000 babies born every year in Minnesota, most women have a normal term pregnancy and give birth to a healthy infant. Minnesota has some of the lowest rates of adverse birth outcomes (including low birth weight, prematurity, and infant mortality) in the U.S., but significant racial disparities exist. Figures 32 and 33 (opposite, top left and right) show that white, non-Hispanic mothers consistently have the lowest rates of adverse birth outcomes. There are many factors that influence birth outcomes, including nutrition; access to quality health care; maternal characteristics; tobacco, alcohol, and drug use; and environmental exposures. Access
to safe, affordable and reliable transportation options can connect families to resources and services that promote healthy births.
Researchers have pointed out that risk and protective factors for birth outcomes operate over the life course of the mother, not just during the nine months of gestation.34 As shown in Figure 34 (opposite, bottom), infant mortality varies by race and ethnicity in Minnesota. Furthermore, this research suggests black women may experience more discrimination and social stressors but do not benefit from increases in socioeconomic status as much as white women.35 Of the
MDH MNDOT SMTP HEALTH IMPACT ASSESSMENT
FIG. 31. TRAFFIC CRASHES IN MINNESOTA, 2005-2014
Traffic crashes have gone down slightly, while fatalities per vehicle mile traveled have declined.
Source: Minnesota Motor Vehicle Crash Facts, (2014), MnDOT
PAGE 45 PAGE 45
twelve recommendations posited to close the black-white gap in birth outcomes, transportation systems play a key role in at least four: increase access to preconception care for black women; invest in community building and urban renewal; reduce poverty among African American families; and support working mothers and fathers.36
PART I CHAPTER 2: BASELINE HEALTH ASSESSMENT OCTOBER 2016
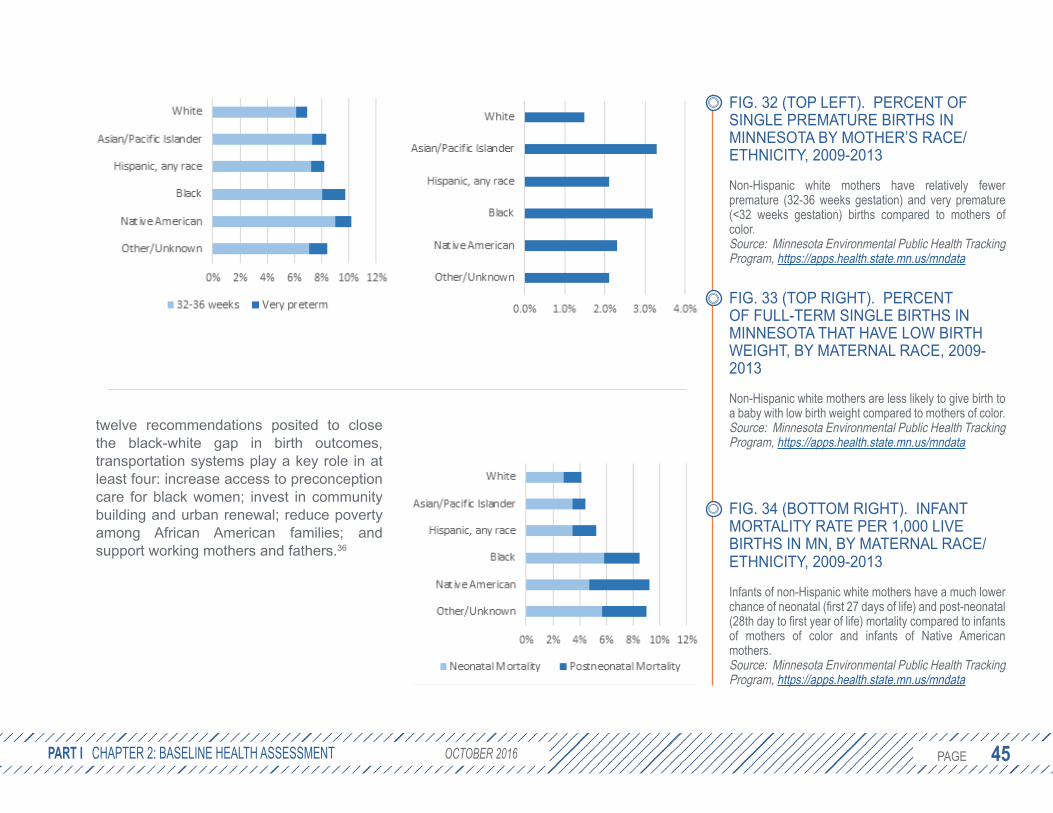
FIG. 32 (TOP LEFT). PERCENT OF SINGLE PREMATURE BIRTHS IN MINNESOTA BY MOTHER’S RACE/ETHNICITY, 2009-2013
Non-Hispanic white mothers have relatively fewer premature (32-36 weeks gestation) and very premature (<32 weeks gestation) births compared to mothers of color.Source: Minnesota Environmental Public Health Tracking Program, https://apps.health.state.mn.us/mndata
FIG. 33 (TOP RIGHT). PERCENT OF FULL-TERM SINGLE BIRTHS IN MINNESOTA THAT HAVE LOW BIRTH WEIGHT, BY MATERNAL RACE, 2009-2013
Non-Hispanic white mothers are less likely to give birth to a baby with low birth weight compared to mothers of color.Source: Minnesota Environmental Public Health Tracking Program, https://apps.health.state.mn.us/mndata
FIG. 34 (BOTTOM RIGHT). INFANT MORTALITY RATE PER 1,000 LIVE BIRTHS IN MN, BY MATERNAL RACE/ETHNICITY, 2009-2013
Infants of non-Hispanic white mothers have a much lower chance of neonatal (first 27 days of life) and post-neonatal (28th day to first year of life) mortality compared to infants of mothers of color and infants of Native American mothers.Source: Minnesota Environmental Public Health Tracking Program, https://apps.health.state.mn.us/mndata

PAGE 46 PAGE 46
2.3.5 CHRONIC DISEASEChronic diseases remain among the top causes of death in Minnesota and nationally (Figure 35, below) and accounted for 83% of all medical spending in the state in 2012. In that year, over a third of insured Minnesotans had at least one chronic disease, half of whom had more than one chronic condition.37
Following cancer, heart disease is the second leading cause of death in Minnesota and is responsible for 18.3% of all deaths. Many of the underlying causes of heart disease (such as physical inactivity, tobacco use, and poor diet) are modifiable behaviors that are influenced by the social and physical
MDH MNDOT SMTP HEALTH IMPACT ASSESSMENT
FIG. 35. RATE OF DEATHS PER 100,000 POPULATION, BY LEADING CAUSE OF DEATH IN THE U.S., 2005-2011
Heart disease and cancer remain the leading causes of death in the United States.
Source: Centers for Disease Control and Prevention National Vital Statistics System. Available at http://www.cdc.gov/nchs/data_access/vitalstatsonline.htm

PAGE 47 PAGE 47
environments in which people live, work, and interact. An avoidable death can be defined as one occurring in persons aged less than 75 years with an underlying cause of heart disease, vascular disease, or hypertension. While the overall rate of avoidable deaths has declined (Figure 36, above), significant health inequities persist.38 Minnesota has the lowest rate of avoidable deaths due to heart disease in the nation (36.3 versus the U.S. average of 60.7 per 100,000), but significant variations by geography exist, most notably between suburban counties and Greater Minnesota (Figure 37, at right).
PART I CHAPTER 2: BASELINE HEALTH ASSESSMENT OCTOBER 2016
FIG. 36. AGE-ADJUSTED RATES OF AVOIDABLE DEATH FROM HEART DISEASE, STROKE, AND HYPERTENSIVE DISEASE AMONG NON-HISPANIC BLACKS AND NON-HISPANIC WHITES, BY SEX, U.S., 2001–2010 (TOP LEFT)
Black males have about three times the death rate due to cardiovascular disease compared to white females.
Source: Centers for Disease Control and Prevention National Vital Statistics System, 2013
FIG. 37. AGE-ADJUSTED RATES OF AVOIDABLE DEATH FROM HEART DISEASE, STROKE, AND HYPERTENSIVE DISEASE, ALL POPULATIONS, 2011-2013 (TOP RIGHT)
Although lowest in the country as a state, many regions in Minnesota struggle with high mortality rates due to heart disease and stroke.
Source: Centers for Disease Control and Prevention, Interactive Atlas of Heart Disease and Stroke
PAGE 48 PAGE 48
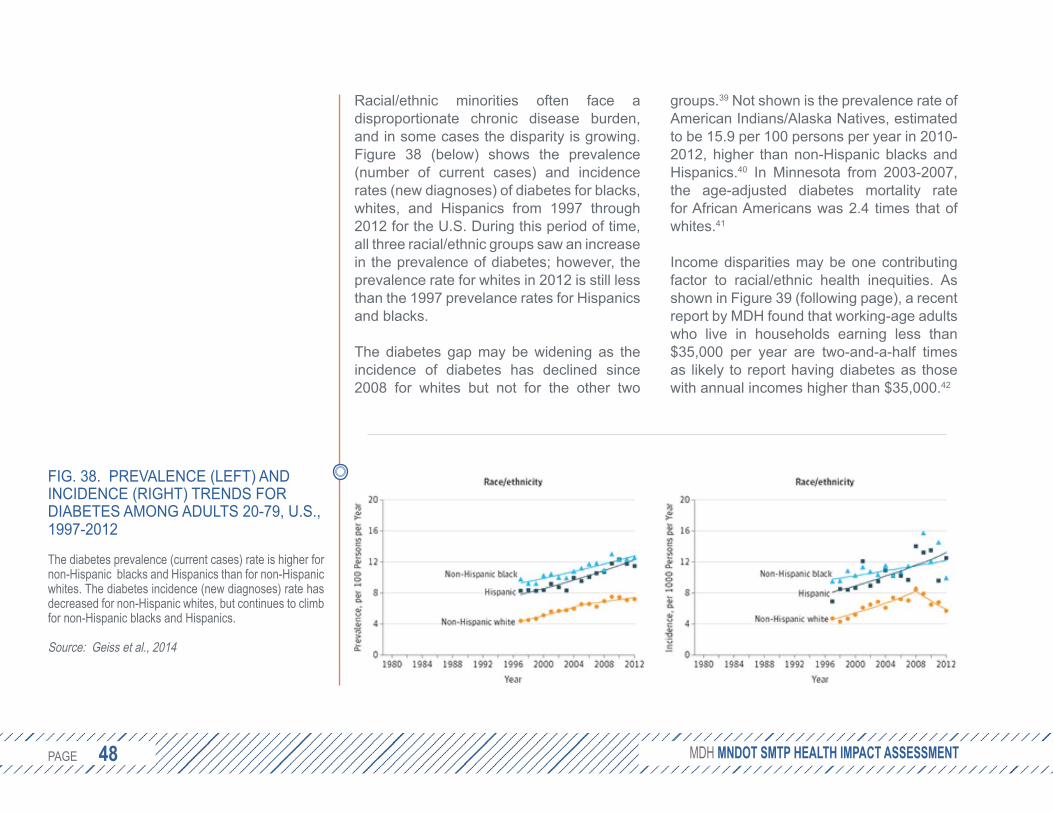
Racial/ethnic minorities often face a disproportionate chronic disease burden, and in some cases the disparity is growing. Figure 38 (below) shows the prevalence (number of current cases) and incidence rates (new diagnoses) of diabetes for blacks, whites, and Hispanics from 1997 through 2012 for the U.S. During this period of time, all three racial/ethnic groups saw an increase in the prevalence of diabetes; however, the prevalence rate for whites in 2012 is still less than the 1997 prevelance rates for Hispanics and blacks.
The diabetes gap may be widening as the incidence of diabetes has declined since 2008 for whites but not for the other two
groups.39 Not shown is the prevalence rate of American Indians/Alaska Natives, estimated to be 15.9 per 100 persons per year in 2010-2012, higher than non-Hispanic blacks and Hispanics.40 In Minnesota from 2003-2007, the age-adjusted diabetes mortality rate for African Americans was 2.4 times that of whites.41
Income disparities may be one contributing factor to racial/ethnic health inequities. As shown in Figure 39 (following page), a recent report by MDH found that working-age adults who live in households earning less than $35,000 per year are two-and-a-half times as likely to report having diabetes as those with annual incomes higher than $35,000.42
MDH MNDOT SMTP HEALTH IMPACT ASSESSMENT
FIG. 38. PREVALENCE (LEFT) AND INCIDENCE (RIGHT) TRENDS FOR DIABETES AMONG ADULTS 20-79, U.S., 1997-2012
The diabetes prevalence (current cases) rate is higher for non-Hispanic blacks and Hispanics than for non-Hispanic whites. The diabetes incidence (new diagnoses) rate has decreased for non-Hispanic whites, but continues to climb for non-Hispanic blacks and Hispanics.
Source: Geiss et al., 2014

PAGE 49 PAGE 49
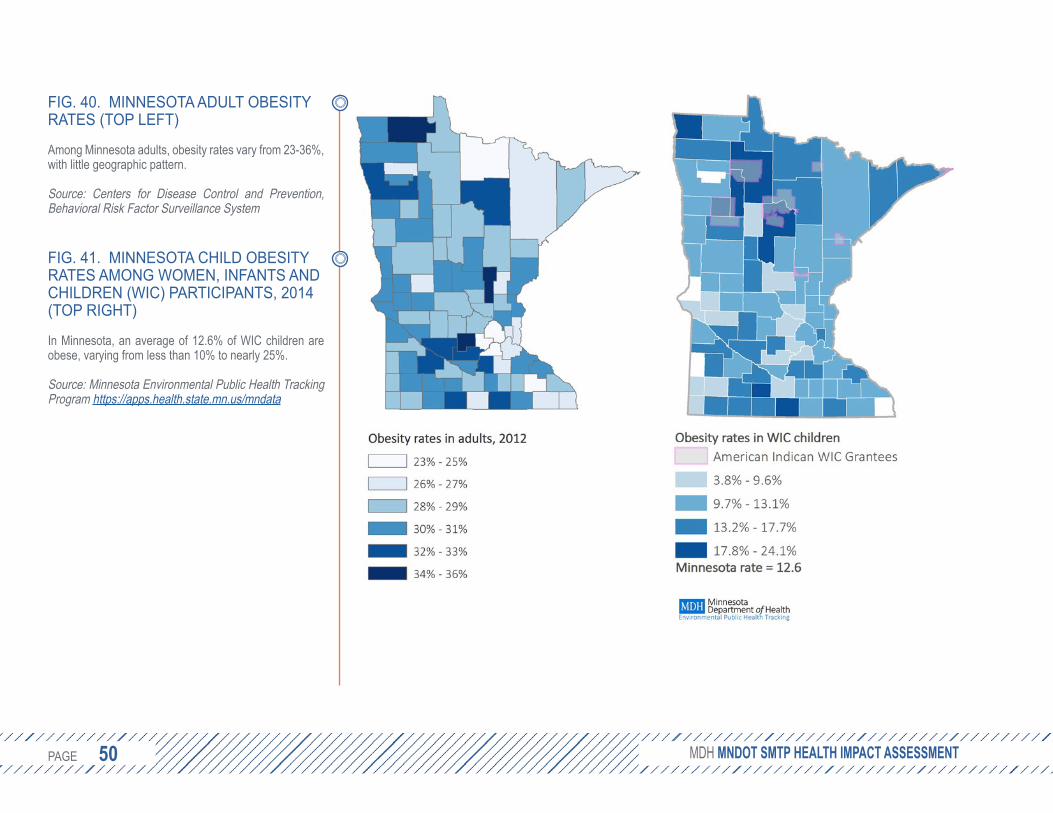
2.3.6 OBESITYAmong U.S. adults aged 40-85, obesity accounts for 18% of all deaths.43 In 2006, the financial burden in Minnesota of obesity was estimated at $2.8 billion in health care costs and lost productivity.44 Minnesota’s adult obesity rate grew to 27.6% in 2014 after remaining steady at about 25.7% from 2011-2013 (Figure 40, following page, left). The rate of Minnesota adults that are overweight or obese varies by race, ranging from 49% among Asians to 73% among Native Americans.45 An average of 12.6%
of Minnesota children participating in the Women, Infants and Children (WIC) program are obese (Figure 41, following page, right).
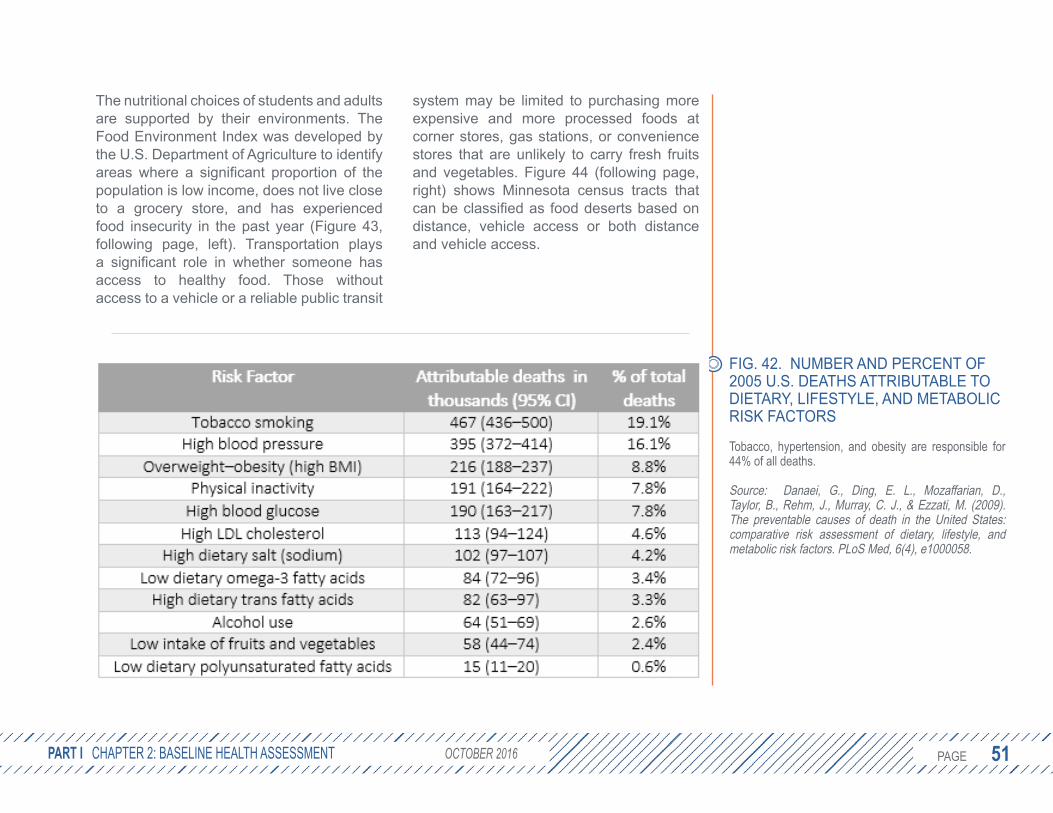
2.3.7 NUTRITIONThe two leading causes of death in the U.S. are heart disease and cancer, as shown earlier in Figure 35. Dietary risk factors, among other risk factors, contribute to these diseases. Figure 42 (page 51) estimates that almost one-third of all 2005 deaths in the U.S. can be attributed to dietary risk factors.46
Over the past two decades, diets have changed. Although people are eating more calories (especially calories from fats and refined sugars), people are not consuming the nutrients necessary for health. In 2013, 38.2% of Minnesota adults ate fruit less than once per day, and 23.6% ate vegetables less than once per day.47 According to the 2013 Minnesota Student Survey, 54.2% of 5th grade students ate fruit less than once per day and 62.2% ate vegetables less than once per day. In addition, 42.3% of 5th graders reported drinking soda the previous day, and 33.1% had a sports drink. Older students in the 11th grade reported similar habits for fruit (55.2%), vegetables (56.7%), soda (44.9%) and sports drinks (31.1%).48
PART I CHAPTER 2: BASELINE HEALTH ASSESSMENT OCTOBER 2016
FIG. 39. INCOME, EMPLOYMENT, & DIABETES IN MINNESOTA
Adults in Minnesota households earning less than $35,000 per year are 2.5 times as likely to have diabetes.
Source: MDH, 2016
PAGE 50 PAGE 50 MDH MNDOT SMTP HEALTH IMPACT ASSESSMENT
FIG. 40. MINNESOTA ADULT OBESITY RATES (TOP LEFT)
Among Minnesota adults, obesity rates vary from 23-36%, with little geographic pattern.
Source: Centers for Disease Control and Prevention,Behavioral Risk Factor Surveillance System
FIG. 41. MINNESOTA CHILD OBESITY RATES AMONG WOMEN, INFANTS AND CHILDREN (WIC) PARTICIPANTS, 2014 (TOP RIGHT)
In Minnesota, an average of 12.6% of WIC children are obese, varying from less than 10% to nearly 25%.
Source: Minnesota Environmental Public Health Tracking Program https://apps.health.state.mn.us/mndata
PAGE 51 PAGE 51
The nutritional choices of students and adults are supported by their environments. The Food Environment Index was developed by the U.S. Department of Agriculture to identify areas where a significant proportion of the population is low income, does not live close to a grocery store, and has experienced food insecurity in the past year (Figure 43, following page, left). Transportation plays a significant role in whether someone has access to healthy food. Those without access to a vehicle or a reliable public transit
system may be limited to purchasing more expensive and more processed foods at corner stores, gas stations, or convenience stores that are unlikely to carry fresh fruits and vegetables. Figure 44 (following page, right) shows Minnesota census tracts that can be classified as food deserts based on distance, vehicle access or both distance and vehicle access.
PART I CHAPTER 2: BASELINE HEALTH ASSESSMENT OCTOBER 2016
FIG. 42. NUMBER AND PERCENT OF 2005 U.S. DEATHS ATTRIBUTABLE TO DIETARY, LIFESTYLE, AND METABOLIC RISK FACTORS
Tobacco, hypertension, and obesity are responsible for 44% of all deaths.
Source: Danaei, G., Ding, E. L., Mozaffarian, D., Taylor, B., Rehm, J., Murray, C. J., & Ezzati, M. (2009). The preventable causes of death in the United States: comparative risk assessment of dietary, lifestyle, and metabolic risk factors. PLoS Med, 6(4), e1000058.

PAGE 52 PAGE 52 MDH MNDOT SMTP HEALTH IMPACT ASSESSMENT
FIG. 43. FOOD ENVIRONMENT, 2012-2013
Index of factors that contribute to a healthy food environment, including availability of nutritious choices, community health, and community characteristics. Suburban counties in Minnesota tend to fare better.
Source: U.S. Department of Agriculture, 2012-2013
FIG. 44. FOOD DESERTS IN MINNESOTA
Reliable and accessible transportation plays an important role in eating fresh and nutritious foods.
Source: USDA Food Environment Atlas, 2012-2013
PAGE 53 PAGE 53
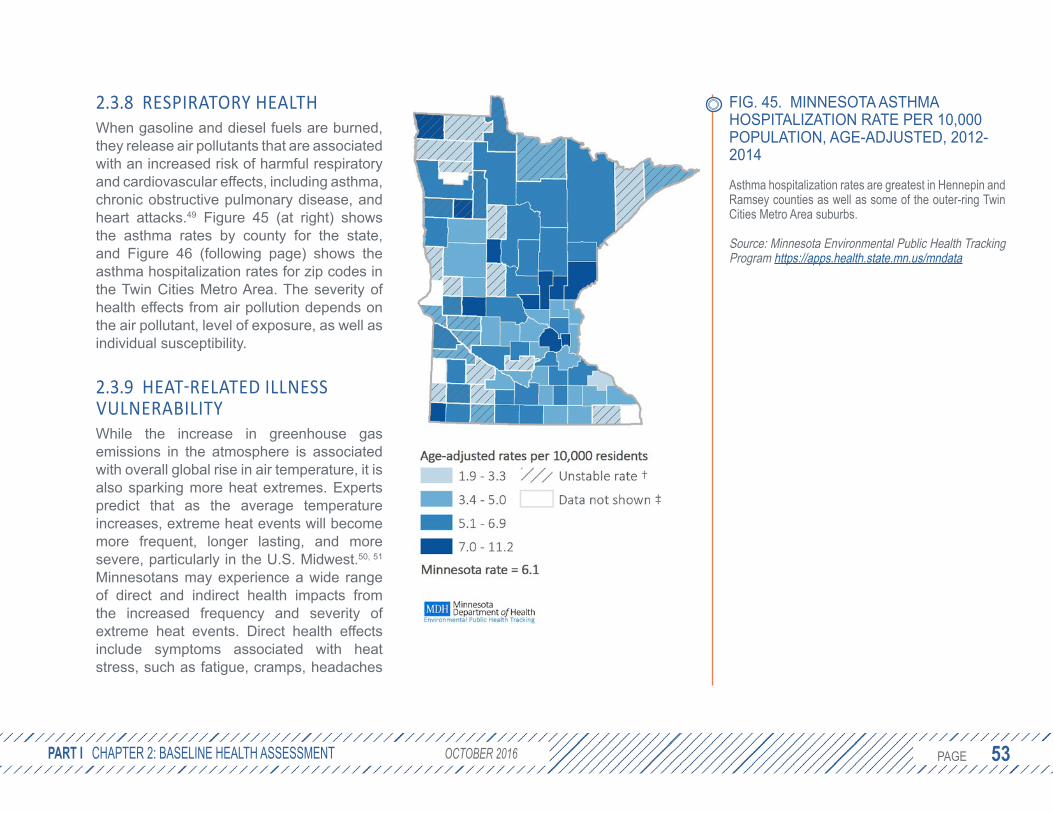
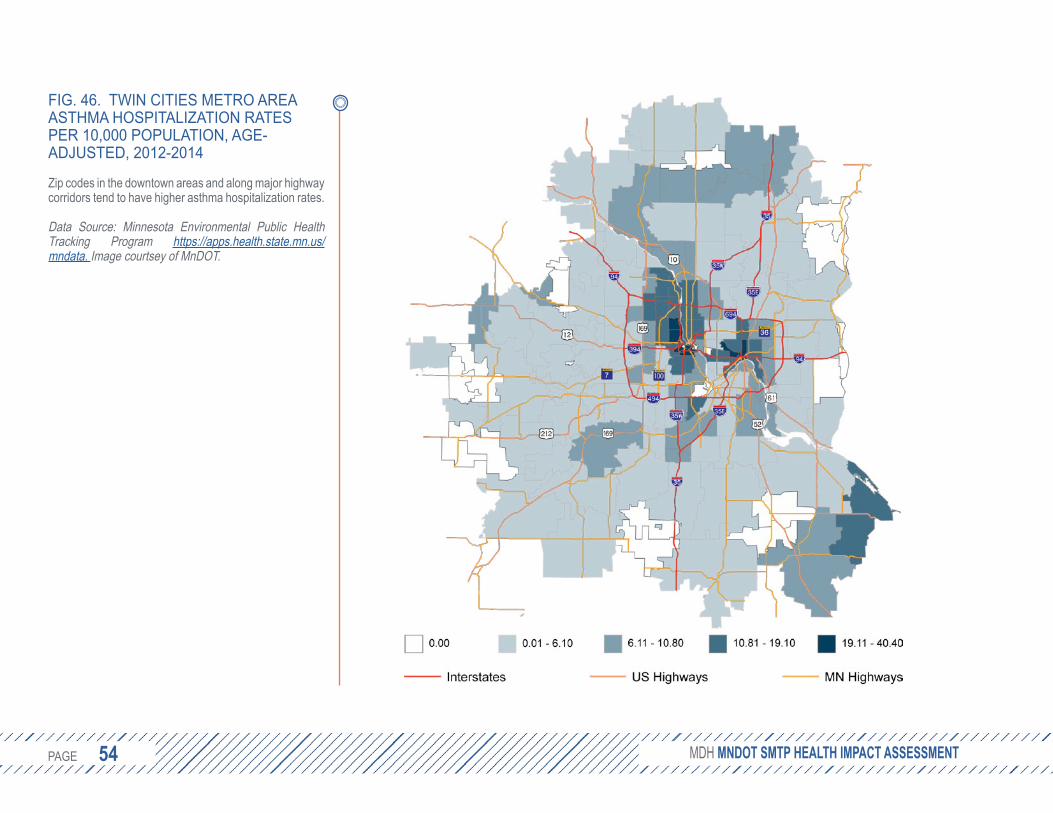
2.3.8 RESPIRATORY HEALTHWhen gasoline and diesel fuels are burned, they release air pollutants that are associated with an increased risk of harmful respiratory and cardiovascular effects, including asthma, chronic obstructive pulmonary disease, and heart attacks.49 Figure 45 (at right) shows the asthma rates by county for the state, and Figure 46 (following page) shows the asthma hospitalization rates for zip codes in the Twin Cities Metro Area. The severity of health effects from air pollution depends on the air pollutant, level of exposure, as well as individual susceptibility.
2.3.9 HEAT-RELATED ILLNESS VULNERABILITYWhile the increase in greenhouse gas emissions in the atmosphere is associated with overall global rise in air temperature, it is also sparking more heat extremes. Experts predict that as the average temperature increases, extreme heat events will become more frequent, longer lasting, and more severe, particularly in the U.S. Midwest.50, 51 Minnesotans may experience a wide range of direct and indirect health impacts from the increased frequency and severity of extreme heat events. Direct health effects include symptoms associated with heat stress, such as fatigue, cramps, headaches
PART I CHAPTER 2: BASELINE HEALTH ASSESSMENT OCTOBER 2016
FIG. 45. MINNESOTA ASTHMA HOSPITALIZATION RATE PER 10,000 POPULATION, AGE-ADJUSTED, 2012-2014
Asthma hospitalization rates are greatest in Hennepin and Ramsey counties as well as some of the outer-ring Twin Cities Metro Area suburbs.
Source: Minnesota Environmental Public Health Tracking Program https://apps.health.state.mn.us/mndata
PAGE 54 PAGE 54
FIG. 46. TWIN CITIES METRO AREA ASTHMA HOSPITALIZATION RATES PER 10,000 POPULATION, AGE-ADJUSTED, 2012-2014
Zip codes in the downtown areas and along major highway corridors tend to have higher asthma hospitalization rates.
Data Source: Minnesota Environmental Public HealthTracking Program https://apps.health.state.mn.us/mndata. Image courtsey of MnDOT.
MDH MNDOT SMTP HEALTH IMPACT ASSESSMENT

PAGE 55 PAGE 55
and nausea, or responses that are much more extreme, including heat stroke, organ failure, and even death. In addition, heat waves can exacerbate pre-existing medical conditions or diseases, such as diabetes, cardiovascular disease, chronic obstructive pulmonary disease, kidney ailments and mental or behavioral disorders. Indirect health effects include infrastructure failures, like power outages; disruption of some occupations (especially those involving outdoor, strenuous labor), schooling, or major events, like athletic competitions or festivals; and a strain on emergency and health care services, in particular 911 response and emergency department operations (Figure
47, below). In addition, extreme heat can contribute to other conditions, such as air contamination and drought, which in turn have direct and indirect effects on the health of Minnesotans.52
Transportation systems, in addition to playing a role in the mitigation of greenhouse gas emissions, are part of the public infrastructure that can be stressed during heat extremes. Travel can be both more hazardous because of exposure to outdoor heat and necessary for those seek refuge in air conditioned buildings. For some, air conditioned buses or trains may even serve as a cooling destination.
PART I CHAPTER 2: BASELINE HEALTH ASSESSMENT OCTOBER 2016
FIG. 47. HEAT-RELATED ILLNESS MERGENCY DEPARTMENT VISITS, GE-ADJUSTED, 2010-2014
he rate of emergency department visits due to heat-elated illnesses somewhat varies with average summer emperatures.
ource: Minnesota Environmental Public Health Tracking rogram https://apps.health.state.mn.us/mndata
EA
Trt
SP
PAGE 56 PAGE 56
2.3.10 COUNTY HEALTH RANKINGSFor a composite measure of health, counties can be reviewed based on health outcomes (length and quality of life) and health factors (health behaviors, clinical care, social and economic factors, and the physical environment). Not surprisingly, the counties that rank high in health factors also tend to experience longer, healthier lives (Figures 49 and 49, opposite). Counties in northern Minnesota rank low. Twin Cities Metro Area suburban counties tend to rank higher for both health factors and outcomes. Within each county there tends to be a wide variation in the health of the residents. Overall, these maps suggest that improvements to the social and environmental determinants of health, including the state’s transportation system, may improve health outcomes.
MDH MNDOT SMTP HEALTH IMPACT ASSESSMENT

PAGE 57 PAGE 57 PART I CHAPTER 2: BASELINE HEALTH ASSESSMENT OCTOBER 2016
FIG. 48 & 49. COUNTY RANKINGS Y HEALTH FACTORS (LEFT) AND UTCOMES (RIGHT)
his ranking demonstrates the relationship between upportive environmental, behavioral, social, and conomic factors and living long, healthy lives.
ource: County Health Rankings & Roadmaps, 2016. ww.countyhealthrankings.org
BO
Tse
Sw

PAGE 58 PAGE 58 4SMTP ASSESSMENT:
HEALTHY COMMUNITIES
3SMTP ASSESSMENT:
TRANSPORTATION SAFETY
5SMTP ASSESSMENT:
CRITICAL CONNECTIONS
6SMTP ASSESSMENT:
EQUITY
PART IIIDENTIFYING AND ANALYZING KEY ISSUES
PH
OTO
CR
ED
IT: M
inne
sota
Dep
artm
ent o
f Tra
nspo
rtatio
n

PAGE 59 PAGE 59
3. SMTP ASSESSMENT: TRANSPORTATION SAFETY
PART II CHAPTER 3: SMTP ASSESSMENT: TRANSPORTATION SAFETY OCTOBER 2016
3.1 BACKGROUNDThe Transportation Safety section of the SMTP reviews both the safety of individual users and the safety of communities. One of the main goals of the section is to reduce fatalities and serious injuries for all travel modes. In 2014, motor vehicle crashes in Minnesota accounted for 361 deaths and 29,439 serious injuries.31 National trends point to a 24% decline in fatal crashes over the last decade, but motor vehicle crashes are still the leading cause of death for people ages 16-24.53 Besides crashes that involve two or more motor vehicles, crashes that involve a motor vehicle and a pedestrian (i.e., pedestrian crashes) are also an important concern. Nationally, the age-adjusted mortality rate per 100,000 population from pedestrian crashes is 1.68 among non-Hispanic whites, 3.03 among non-Hispanic blacks, and 3.34 among Hispanics.32
Reducing transportation fatalities and serious injuries as a result of motor vehicle crashes is a top priority for MnDOT and its partners. Through collaborations with MDH and the Department of Public Safety on the Toward Zero Deaths (TZD) initiative, MnDOT has applied the four E’s of safety – education, enforcement, engineering, and emergency medical and trauma services – to make Minnesota’s roadways safer. However, transportation safety should not be limited to
preventing fatal and serious injury crashes, but also include a broader understanding of what it means to be safe.
A broader perspective on safety allows for the considerations of trade-offs and unintended consequences. For example, engineering solutions designed to make car-bike crashes less likely may inadvertently impose new barriers to bicyclists, dissuading them from choosing the healthier active transportation mode. A common concern among bike sharing programs (e.g., Nice Ride in the Twin Cities) is that helmets are usually not provided. Rather than impose new rules that require helmet use and, consequently, dissuade biking, policy makers decided the benefits to society of more people biking outweighed the benefits of universal helmet use.
Another consideration is the types of measures used to describe the safety and health benefits of the transportation system. For example, increasing the number of people who walk or bike in a community can lead to increased physical activity, which is good for health; however, it is also likely to increase the total number of collisions. By one measure (total crashes), the transportation system may look like it is performing poorly, but by another (i.e., number of people walking and biking) it is performing well. The
TRANSPORTATION Source: 2017 SMTP
FIG. 50. WHAT DOES SAFETY MEAN TO YOU?
Safeguard transportation users and the communities the system travels through. Apply proven strategies to reduce fatalities and serious injuries for all travel modes.
Perceived freedom to engage in healthy choices; influenced by crash risk, fear of crime, environmental exposure (e.g., heat, cold, tobacco smoke, pollution), and other stressors.
PUBLIC HEALTH

PAGE 60 PAGE 60
rate of crashes could be a better indicator of the health and safety of the system because it takes into consideration the increased number of people walking and biking. Typically, when the number of people who bike or walk increase, the number of collisions also increases, but the rate of collisions decreases. The cost of increased collisions may be balanced or outweighed by the long-term benefits of increased walking and biking.
For example, a study of 68 cities in California found that a community that doubled the number of people walking could expect a 32% increase in injuries, but a reduction in the risk to an individual of 66%, demonstrating a “safety in numbers” effect.54 This assumed the number of motor vehicles remains relatively constant. If a large number of trips are made by walking or biking instead of by driving, the number of motor vehicles on the road (exposure) may be fewer, reducing the overall risk to pedestrians and bicyclists.55 Another study from Nashville estimates that ten additional minutes of active transportation per person per week would avert an estimated 188 deaths and 5,662 disability-adjusted life years. While the number of collisions (i.e., involving a vehicle and a pedestrian or a bike) would increase by about 14%, the cardiovascular disease burden alone would drop by 31%.56
3.2 PERCEIVED TRAFFIC SAFETYIndividuals make transportation choices based on considerations of economics, time, convenience, access, and safety. Transportation agencies track safety performance measures on the actual number of reported injuries and deaths by transportation mode. However, transportation choices are made according to the user’s perception of safety, which may or may not align with empirical measures of safety.
A 2012 study of bicyclists in Toronto and Vancouver found that in most cases, the bicyclists’ perception of a route type’s safety corresponded well with the actual crash rate for that route type. However, there were a few notable discrepancies: protected bike lanes were perceived as higher risk despite being the safest route type.57
A 2009 study examined how urban design affected both perceived and actual crash rates for bicyclists and pedestrians. The results showed that residents of low-density residential neighborhoods are more likely to perceive their neighborhood as dangerous to walk or bike in compared to residents of mixed-use compact neighborhoods, despite the latter exhibiting higher actual crash rates.58
MDH MNDOT SMTP HEALTH IMPACT ASSESSMENT
SMTP PROPOSED STRATEGY LANGUAGE
Develop and share critical safety information andsupport educational initiatives to reduce unsafeactions by all transportation users and operators. Educational initiatives help to inform transportationsystem users and operators of the rules and risks related to transportation. This helps to promote safety throughout Minnesota.
HOW TO INTERPRET THE "SMTP PROPOSED STRATEGY LANGUAGE CALL-OUTS:This report includes excerpts of the proposed 2017 SMTP strategies, which largely shaped the questions and topics addressed by this HIA.
• SMTP text is noted in regular and bold gray text.• Key SMTP phrases are noted in orange italics.• Proposed edits by this HIA are blue and bold.
Refer to the full draft SMTP by MnDOT for all strategies and public comment.

PAGE 61 PAGE 61
As reported in the Bicycling and Walking in the United States 2016 Benchmarking Report, women comprise about half of all commuters who walk to work. However, that trend does not hold true for biking. Despite efforts to engage more female riders, women are outnumbered by men, making up just 29% of commuters who bike.17 Gender-based perceptions of safety may help to explain this difference. A study of bicyclists found that men were more likely to rate Minnesota as safe for cycling 77% versus 70% for women.59
Finally, young children are less likely to walk, and parents are less likely to let their children walk, in areas they perceive as unsafe from vehicular traffic.60, 61 Safe Routes to School’s emphasis on educational, programmatic, and environmental approaches is well aligned with addressing perceptions of safety, especially among those families who live close to schools.
These studies may not be generalizable to all communities in Minnesota, but they do suggest perceived safety is linked to environmental design and mode choice. Further exploration is warranted, including defining perceived safety as a distinct concept and incorporating questions on perceived safety into travel behavior inventory surveys.
3.2.1 ADDRESSING PERCEPTIONS OF SAFETY THROUGH EDUCATION In addition to addressing safety through engineering and design solutions, educational campaigns can be a cost-effective approach to maximize the impact of infrastructure investments. Mass media campaigns and educational initiatives can affect both the behaviors and perceptions of transportation users. For example, a better understanding of safety perceptions can help MnDOT identify traffic safety myths to address through mass media campaigns.
MnDOT also has a role in educating decision-makers who are weighing how to invest limited resources. Tools such as the Integrated Transport and Health Impacts Model (ITHIM) can quantify the long-term changes in disease burden, injury risk, and greenhouse gas emissions for a given increase in active transportation.62 This model can help translate the health benefits of transportation decisions to help capture costs and benefits that are otherwise seemingly intangible.
PART II CHAPTER 3: SMTP ASSESSMENT: TRANSPORTATION SAFETY OCTOBER 2016
SEE ALSO:
Refer to Chapter 5: Critical Connections for a more detailed review of the Integrated Transport and Health Impacts Model (ITHIM).

PAGE 62 PAGE 62
3.3 SAFETY FROM CRIMEA person’s sense of safety extends beyond risk of injury due to crashes. Fear of crime can affect mode choice and, in turn, physical activity rates. Transportation systems – including the design of bus stops, station areas, sidewalks, and bike paths – can mitigate this effect. Crime may play a larger role in the travel behaviors of women, minorities, children, and the elderly contributing to disproportionate health burdens and inequities.
Violent crime near one’s home can deter walking and biking to transit stations.63, 64
Other studies support the linkage between perceptions of crime and reduced physical activity. For example, a 2008 study in Oakland, California found that a reduction in violent crimes significantly increased the minutes walked by minority residents,65 and a meta-analysis of the literature found a strong association between high crime rates and low levels of physical activity, particularly among minority populations and youth.66
Fear of victimization is more widespread in women than men. This increased lack of feeling safe creates an expectation that women may be more likely than men to avoid walking after dark and more likely to drive or take a taxi than to walk or use public
transit for safety concerns. Specific settings such as multi-story parking ramps, bus stops, alleys and tunnels may also create a sense of danger for women.18 Survey data from the Chicago Transit Authority show women are less likely than men to take transit due to concerns for personal safety.67 A 2007 study of light rail riders in St. Louis, Missouri found that increased crime rates around stations is likely to lead female riders to be picked up and dropped off at the station rather than walk, bike, or take the bus.68
Age is also an important factor that can affect perceptions of safety and fear of crime on both ends of the age spectrum. Older people tend to be more fearful of crime, and this may lead them to avoid certain routes or public spaces. Parents also have crime and safety concerns for allowing young children to walk and bike to school.
Incorporating crime prevention into transportation plans can improve safety and security, reducing the barriers to choosing active modes of transportation. Improving safety and security requires a multilateral approach through education, enforcement, and engineering. Public education campaigns can address potential gaps in the actual versus perceived crime rate for different modes, as well as empower the public to act and inform authorities of any
MDH MNDOT SMTP HEALTH IMPACT ASSESSMENT

PAGE 63 PAGE 63
risky or threatening behavior. Strategies, such as increased presence of police officers on bicycles and bicycle registration, can improve enforcement for non-motorized modes. Engineering approaches, such as Crime Prevention through Environmental Design (CPTED), can be used to improve lighting and reduce hidden spaces. Security kiosks and monitors in station areas can further enhance the security of transit riders.
While crime can affect transportation behaviors, reliable transportation can deter crime. As has already been mentioned, reliable transportation can connect people to the opportunities and services they need to lead healthy, productive lives. For ex-offenders rejoining society, access to reliable transportation is a major barrier.69, 70 In a randomized control study of 162 offenders from Minnesota state prisons, transportation assistance (free transit passes) reduced the likelihood of supervision revocation by 35% and rearrests by 33% when combined with other supportive services.71
3.4 ENFORCEMENT AND ENGINEERING SOLUTIONSEnforcement is a key strategy to ensuring all users are compliant with transportation safety laws. Given constrained resources, efforts may center on a few specific areas, such as drinking and driving, texting while driving, and speeding. True to the SMTP strategy language, these efforts have proven benefits and should be continued in collaboration with law enforcement. The 2012 SMTP specifically named law enforcement as a partner in the enforcement of transportation safety laws. The proposed revisions broaden this language and mention collaborative efforts among cities, counties, MnDOT, and the Department of Public Safety. Adding users of the transportation system to this list of partners can help identify new enforcement strategies and opportunities to improve the safety and health-promoting behaviors of all users. Taken one step further, it is important to involve users of all modes in the development of the laws to which they will be held accountable.
The following section outlines four additional strategies that may make active transportation safer and more attractive: enhanced enforcement of crosswalk encroachment, city speed limits, reducing unintended consequences of transportation projects, and racial profiling.
PART II CHAPTER 3: SMTP ASSESSMENT: TRANSPORTATION SAFETY OCTOBER 2016
SMTP PROPOSED STRATEGY LANGUAGE
Emphasize enforcement techniques with proven safety benefits. Compliance of users with transportation laws and requirements is one key aspect of improving safety for all modes. ... In addition to proven strategies, new opportunities and methods for improving compliance should also be considered.
SEE ALSO:
Impacts of alcohol advertising and ignition interlock devised on alcohol-related car crashes (Chapter 5: Critical Connections)
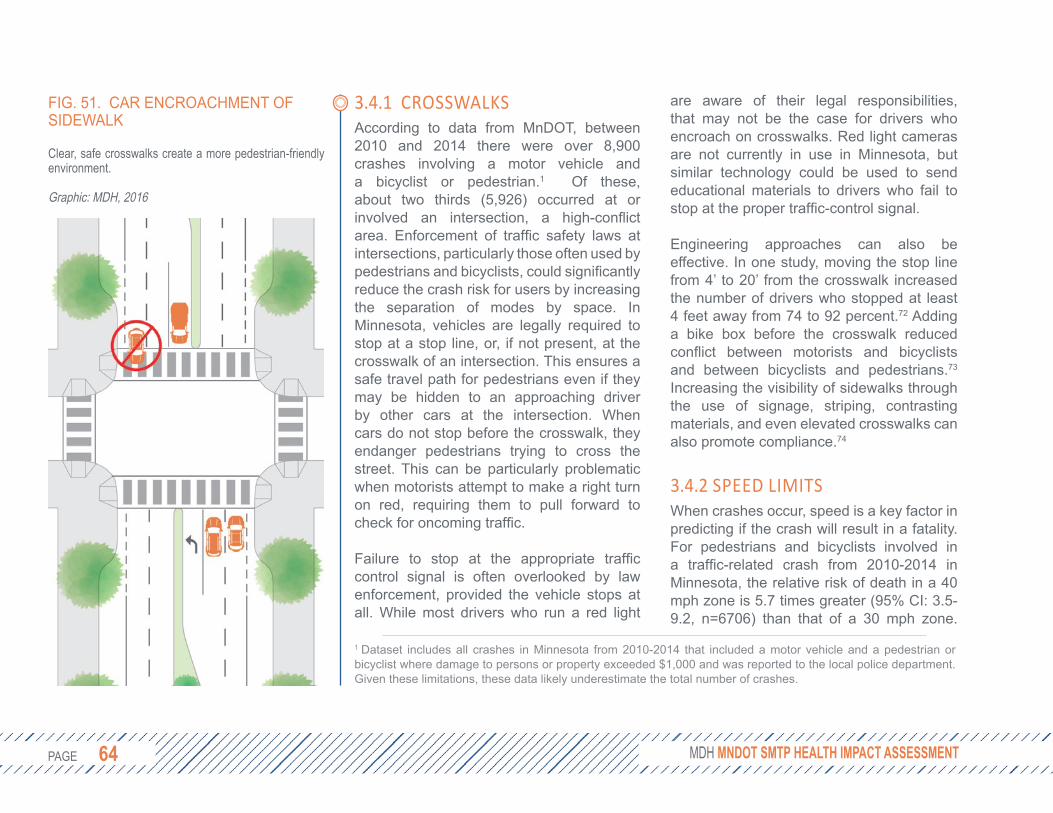
PAGE 64 PAGE 64
3.4.1 CROSSWALKSAccording to data from MnDOT, between 2010 and 2014 there were over 8,900 crashes involving a motor vehicle and a bicyclist or pedestrian.1 Of these, about two thirds (5,926) occurred at or involved an intersection, a high-conflict area. Enforcement of traffic safety laws at intersections, particularly those often used by pedestrians and bicyclists, could significantly reduce the crash risk for users by increasing the separation of modes by space. In Minnesota, vehicles are legally required to stop at a stop line, or, if not present, at the crosswalk of an intersection. This ensures a safe travel path for pedestrians even if they may be hidden to an approaching driver by other cars at the intersection. When cars do not stop before the crosswalk, they endanger pedestrians trying to cross the street. This can be particularly problematic when motorists attempt to make a right turn on red, requiring them to pull forward to check for oncoming traffic.
Failure to stop at the appropriate traffic control signal is often overlooked by law enforcement, provided the vehicle stops at all. While most drivers who run a red light
1 Dataset includes all crashes in Minnesota from 2010-2014 that included a motor vehicle and a pedestrian or bicyclist where damage to persons or property exceeded $1,000 and was reported to the local police department. Given these limitations, these data likely underestimate the total number of crashes.
are aware of their legal responsibilities, that may not be the case for drivers who encroach on crosswalks. Red light cameras are not currently in use in Minnesota, but similar technology could be used to send educational materials to drivers who fail to stop at the proper traffic-control signal.
Engineering approaches can also be effective. In one study, moving the stop line from 4’ to 20’ from the crosswalk increased the number of drivers who stopped at least 4 feet away from 74 to 92 percent.72 Adding a bike box before the crosswalk reduced conflict between motorists and bicyclists and between bicyclists and pedestrians.73
Increasing the visibility of sidewalks through the use of signage, striping, contrasting materials, and even elevated crosswalks can also promote compliance.74
3.4.2 SPEED LIMITSWhen crashes occur, speed is a key factor in predicting if the crash will result in a fatality. For pedestrians and bicyclists involved in a traffic-related crash from 2010-2014 in Minnesota, the relative risk of death in a 40 mph zone is 5.7 times greater (95% CI: 3.5-9.2, n=6706) than that of a 30 mph zone.
MDH MNDOT SMTP HEALTH IMPACT ASSESSMENT
FIG. 51. CAR ENCROACHMENT OF SIDEWALK
Clear, safe crosswalks create a more pedestrian-friendly environment.
Graphic: MDH, 2016

PAGE 65 PAGE 65
Given the limitations of these data (e.g., using speed limit as a proxy for actual speed), it is important to distinguish this association from causality. Still, national and international studies have found similar associations. In one of the largest and most recent studies analyzing nine years of crash data from the German In-Depth Accident Study (GIDAS), (see Case Study, page 66), the fatality risk at 50 km/h (31 mi/h) was twice as high as the risk at 40 km/h (25 mi/h). At 70 km/h (43 mi/h), the fatality risk was approximately 40%, or five times that of 50 km/h (30 mi/h),75 consistent with the findings from Minnesota crash data. Fatality risk was lower than previous studies that were biased toward severe injuries.76 These risk assessments were based on impact speed, estimated from re-creations of the crash scene. In total, 31% of drivers failed to brake, and those that did reduced their travel speed by an average
of 26%. If drivers had 100 crashes where the drivers were traveling at 30 mi/h, the impact speed with a pedestrian will be 30 mi/h in 31 cases and an average of 22 mi/h in the remaining 69 cases. In this scenario, that would lead to approximately four deaths. If the drivers were traveling at a lower speed of 25 mi/h (with 69 braking to 18.5 mi/h), half as many deaths could be expected. This is a conservative approximation that ignores the increased time drivers would have to react. Furthermore, German drivers undergo more intensive driver education and may not be generalizable to U.S. populations. Still, these findings suggest that an enforced reduction in speed from 30 mi/h to 25 mi/h could reduce the risk of fatality for pedestrians. Current Minnesota statute (169.14) sets a 30 mi/h speed limit on streets in urban districts.
PART II CHAPTER 3: SMTP ASSESSMENT: TRANSPORTATION SAFETY OCTOBER 2016
FIG. 52. PEDESTRIAN FATALITYPedestrian fatality risk as a function of impact speed for adult pedestrians hit by the front of a vehicle for speeds up to (a) 120 km/h and (b) 60 km/h. Dotted lines represent 95% confidence intervals.75
PAGE 66 PAGE 66
3.4.3 IDENTIFYING AND WEIGHING TRADE-OFFSThe proposed revisions to the SMTP’s strategy on planning, designing, building, operating, and maintaining transportation infrastructure and facilities make two notable improvements for health. First, the strategy advances equity by considering how safety improvements may benefit some users more than others based on age, race, socioeconomic status, and individual ability. Second, the revisions acknowledge the potential for strategies to have unintentional consequences on the users of other modes.
Rumble strips can help prevent run-off-road crashes, but if the shoulder is not sufficiently wide it can deter bicyclists who wish to use the road. According to the Federal Highway Administration, rumble strips should not be installed on new construction or reconstruction projects where shoulders are used by bicyclists and are less than four feet beyond the rumble strip. However, in many cases it can be difficult to determine how often a shoulder is or would be used by bicyclists. Automatic bike counters are available to each MnDOT district to help measure bicycle usage, but their availability or application may be limited.
In some cases, the trade-off is much less clear. Right turns on red seem to account
MDH MNDOT SMTP HEALTH IMPACT ASSESSMENT
CASE STUDY: POLICY VS. TECHNOLOGY SOLUTIONS
The GIDAS data were used to estimate the effectiveness of autonomous braking systems which apply the brakes automatically when an obstacle is detected. In about half of the fatal crashes, the pedestrian was visible to the driver during the pre-crash phase, but the driver did not brake. With a field of view of 400, an autonomous braking system is estimated to be 40% effective in preventing fatal injuries.77
Ten automakers have already agreed to make autonomous braking systems standard equipment on new cars.78
Both autonomous braking systems and reduced speed limits can improve the chances to avoid or reduce the severity of a potential pedestrian collision. While effective, autonomous braking systems will suffer from a lag in adoption, especially among low-income communities that may not purchase new vehicles as frequently. Reduction of speed limits can have more immediate, low-cost, and universal impact on pedestrian safety.

PAGE 67 PAGE 67
for a small (albeit disproportionate) number of crashes with pedestrians and bicyclists.79
However, cars attempting to take a turn on red often block crosswalks and bicycle lanes in order to better see on-coming traffic. Even if crashes are infrequent, the encroachment blocks the pedestrian’s safest route of travel and may diminish the overall walkability of the area. Some users may be concerned about new safety features, even if there is no measurable change in risk. Motorcyclists have been critical of cable median barriers (dubbed “cheese cutters”), despite little evidence of increased risk when compared to w-beam guardrails.80
There are many engineering strategies that may reduce injury risk to all users. For example, intersection lighting can increase the visibility of cyclists and pedestrians to help reduce collisions. Traffic calming strategies reduce vehicle speeds, which in turn reduces injury risks to motor vehicle drivers and passengers as well as to pedestrians and cyclists.74
Moving forward, it is important that MnDOT provide greater guidance on how to systematically factor trade-offs into safety decision-making. Reducing motor vehicle crashes is critical, but the strategies employed should not deter health-promoting activities like walking and biking that provide
health, economic, and environmental benefits to society. These revisions prompt an opportunity to better understand how transportation engineering interventions can promote safety in a way that both mitigates incidents of injury and promotes healthy behaviors.
3.4.4 RACIAL PROFILINGThe 2016 police shooting of Philando Castile in Falcon Heights, Minnesota was precipitated by a traffic stop for a broken taillight. This raises important questions about enforcement of traffic laws and whether different standards exist depending on one’s race. It is difficult to determine if race was indeed a contributing factor to Mr. Castile’s and other black Minnesotans’ traffic stops, especially since Minnesota does not require police to keep data on the racial breakdown of drivers stopped.81
Still, a 2003 University of Minnesota study of 65 law enforcement agencies who voluntarily participated found that drivers of color were stopped at a greater rate than white drivers. Yet, contraband was found at much lower rates for drivers of color compared to white drivers (9-11% versus 24%). The report concludes that these patterns suggest an implicit racial bias in the traffic policing of Minnesotans of color.82
PART II CHAPTER 3: SMTP ASSESSMENT: TRANSPORTATION SAFETY OCTOBER 2016
SMTP PROPOSED STRATEGY LANGUAGEPlan, design, build, operate, and maintain transportation infrastructure and facilities to improve the safety of all users and the communities they travel through. Transportation infrastructure, facilities, and services should be designed with the goal of improving safety of all users regardless of age, race, socioeconomic status, individual ability, or choice of travel mode. As an example, many units of government adopted complete streets ordinances or policies that direct how roads are designed to enable safe access for drivers, transit users, pedestrians, and bicyclists. However, there may be instances when safety improvements for one mode may have adverse impacts on other forms of transportation. It is important to factor these trade-offs into safety decision-making.
Implement strategic engineering and technology solutions to improve transportation safety. For roadways, this primarily includes systematically implementing cost-effective improvements, such as cable median barriers, rumble strips, intersection lighting, and turn lanes. Systematically consider if trade-offs exist that benefit one mode over another.

PAGE 68 PAGE 68
3.5 WEATHER AND SAFETYMinnesota weather can be challenging for travelers by all modes, but especially for those who use active transportation. This section highlights weather’s impacts on maintenance of pedestrian and bicyclist paths.
3.5.1 MAINTENANCE Safe routes for pedestrians are often impaired during the winter months due to routes that have not been cleared, forcing pedestrians to either use the route in unsafe conditions (potentially resulting in injury) or walk in the street (Figures 53 and 54, opposite). Additionally, crosswalks blocked by snow, due to either road plowing activities or lack of clearing by a homeowner or jurisdiction, can also create unsafe travel conditions. Mounding of snow at cross-walks forces able-bodied pedestrians to put themselves at risk by maneuvering around it, generates a barrier for less able-bodied pedestrians, and can impair both motorist and pedestrian visibility. Coupled with less available daylight from September through January, there is generally a rise in pedestrian fatalities during the winter months.83, 84
MnDOT and its partnering agencies should also consider the growing impacts of severe rain events on the maintenance and usability of streets and sidewalks. Patterns
of precipitation across Minnesota are becoming more extreme, resulting in more frequent, heavier precipitation events. Yearly frequency of the largest rain storms, those with at least three inches of precipitation in one day, have increased by more than 70%.52
More extreme, wet weather has started to impact transportation infrastructure and traveler safety in the state. This is recently evidenced by the 2012 storm in Duluth that resulted in unprecedented damage to the City’s street system and public trails. The June 2014 slope failure along the Mississippi River Parkway in Minneapolis (Figure 55, page 70), resulting from historically heavy and sustained rains, rendered adjacent pedestrian and bike trails unsafe for nearly two years.
Snow removal and maintenance of active-transportation routes is an important component of compliance with the Americans with Disabilities Act and Olmstead Plan. Poorly maintained sidewalks are the cause of about 50% of lawsuits involving a public agency and sidewalk-related injuries — even when the homeowner had primary maintenance responsibilities.83 While a legal obligation to provide an accessible route after a snowfall exists, the responsibility of removing snow is diffused and difficult to manage.
MDH MNDOT SMTP HEALTH IMPACT ASSESSMENT

PAGE 69 PAGE 69 PART II CHAPTER 3: SMTP ASSESSMENT: TRANSPORTATION SAFETY OCTOBER 2016
FIG. 53 & 54. CLEARING SNOW ON ROADS AND SIDEWALKS
These photos show the challenges of keeping sidewalk curb cuts clear and accessible, especially for pedestrians with limited mobility.
Source: Streets.mn, 2014

PAGE 70 PAGE 70 MDH MNDOT SMTP HEALTH IMPACT ASSESSMENT
FIG. 55. MUDSLIDE IN MINNEAPOLIS
This mudslide demonstrates how heavy precipitation can impede travel by motorists, pedestrians, and bicyclists.
Source: Jeffrey Thompson/MPR News, 2014
PAGE 71 PAGE 71
For active-transportation modes in particular, this will become an even more pressing issue in the face of changing demographics. By 2020, the number of Minnesotans aged 65 and older is expected to surpass the K-12 population for the first time in history.4 Older adult pedestrians are much more vulnerable to serious injury or death when struck by a motor vehicle than younger pedestrians and, with many older adults unable or unwilling to drive, older pedestrians often choose walking as the best mobility option.84 As the elderly are often without personal means of transportation, maintaining pedestrian facilities allows for a safe, alternative means of travel.83
Given the outlined safety issues, change in demographics and increased weather challenges, it is imperative that clear maintenance agreements for active-transportation routes are created, managed, and enforced.
3.6 CONCLUSIONThe proposed revisions to the SMTP build off the success of initiatives like Toward Zero Deaths and Safe Routes to School to improve traveler safety. Further progress can be made by expanding what it means to be safe and considering how perceptions of safety can deter active transportation. This broader approach to safety may create
new challenges, such as how to weigh injury risk against the long-term benefits of active transportation. Tools such as the Integrated Transport and Health Impacts Model (ITHIM) may help, as well as greater collaboration with multimodal stakeholders and users. Enforcement of speed limits and distracted driving laws are critical to traveler safety, but crime also plays an important role in the mode choices and behaviors of travelers.
By addressing additional factors that impact safety in the SMTP, revisions could most meaningfully benefit the health of active transportation users. As barriers to walking, biking, and taking public transit are reduced, the resulting mode shift is likely to be small but may have positive implications for air quality and the health of Minnesotans.
PART II CHAPTER 3: SMTP ASSESSMENT: TRANSPORTATION SAFETY OCTOBER 2016
PAGE 72 PAGE 72
3.7 RECOMMENDATIONS
01 Explore the potential utility of the Integrated Transportation
Health Impacts Model to assess, quantify, and message around the health benefits of transportation projects that influence mode choice.
See 2017 SMTP Work Plan: Refine the methodology used for calculating return on investment.
02 Increase the availability and systematic use of automated
bicycle and pedestrian counters. These data can help guide the design of new construction and reconstruction projects by filling significant data gaps in biking and walking trips at a local level. These data can also be used at a state and regional level to track the rate – not just the total number – of bike and pedestrian crashes to create more robust and useful performance metrics. These data can also be incorporated into other performance metrics, such as the five-year rolling averages of safety data required by USDOT federal transportation law MAP-21.
See 2017 SMTP Proposed Performance Measures: Total number of fatalities and serious injuries on Minnesota roadways resulting from crashes involving a motor vehicle, by mode.
03 Apply engineering, educational, and enforcement strategies
to improve the safety of multimodal conflict zones such as crosswalks. These strategies can include high visibility signage, contrasting pavement colors, educational campaigns, priority maintenance, and enforcement of stop lines at intersections. While vehicle speed is critical to the safety of bicyclists and pedestrians, it is one of many factors that creates a safe environment for all modes.
See 2017 SMTP Proposed Strategy: Implement strategic engineering and technology solutions to improve transportation safety.
04 Expand the role of the Non-Motorized Transportation
Advisory Committee to identify and examine how proposed infrastructure improvements may benefit one travel mode over another. While design guidance is available, this committee can provide input on how to expand existing tools and guidelines to more systematically weigh potential trade-offs and ensure compliance with best practices. In addition, this committee can help guide MnDOT’s engagement with multimodal users to guide these efforts.
See 2017 SMTP Proposed Strategy: Explore new opportunities to improve safety for all modes of transportation.
MDH MNDOT SMTP HEALTH IMPACT ASSESSMENT
>>
>>
>>
>>

PAGE 73 PAGE 73
05 Work with cities to reduce traveled speed of motor vehicles in urban
areas. The risk of death to a pedestrian or bicyclist is significantly lower with modest decreases to the speed limit. Both traffic calming designs and policy approaches could be leveraged to create more bike and pedestrian-friendly cities. While MnDOT can provide information, research, and support, further action may require a greater level of dedicated funding for walking and bicycling improvements.
See 2017 SMTP Work Plan: Update MnDOT technical guidance to incorporate new practices and policy direction.
06 Study, document, and address differences in perceived versus
actual safety for different modes, environments, and populations. By identifying perceived safety as a distinct factor that influences travel behavior, MnDOT can better understand and more effectively address the barriers to using active modes of transportation. In particular, various socioeconomic groups are likely to have different perceptions of transportation safety that may not be captured by current empirical measures of safety. Educational campaigns, informed by traditional outreach, may be an effective tool to strengthen community health considerations.
See 2017 SMTP Work Plan: Develop and execute safety education campaigns.
07 Review existing safety brands and messaging campaigns to
incorporate broader considerations of health and safety. Public education campaigns are a critical tool to promote safety. As the view of safety broadens to include crime, severe weather, and individual perceptions, messaging must also evolve. By reviewing current and potential messaging campaigns, MnDOT can ensure consistency across campaigns and brands, identify new opportunities to promote health, further promote a culture of safety in Minnesota, and better communicate the health benefits of a sustainable transportation system.
• Campaigns such as Share the Road and Safe Routes to School can include additional messaging on the benefits of active transportation for mental health, academic performance, and reduced vehicle trips.
• Severe weather and air quality alerts need to be delivered to people prior to their decision to travel and should promote travel modes that reduce their risk of crash or air pollution exposure.
• Messages to decision-makers about the value of transportation should include health considerations, such as long- and short-term costs of inactivity and motor vehicle emissions.
PART II CHAPTER 3: SMTP ASSESSMENT: TRANSPORTATION SAFETY OCTOBER 2016
>>
>>

PAGE 74 PAGE 74
09 Work with law enforcement agencies and the legislature
to systematically collect data on race and ethnicity for transportation-related violations, including traffic stops and public transit violations, and provide annual summaries of the data to the public.
See 2017 SMTP Proposed Strategy: Emphasize enforcement techniques with proved strategy benefits.
• Understanding public perceptions of safety can better inform messaging campaigns and transportation decisions.
See 2017 SMTP Proposed Strategy: Develop and share critical safety information and support educational initiatives to reduce unsafe actions by all transportation users and operators.
See 2017 SMTP Work Plan: Develop and execute safety education campaigns
08 Review existing maintenance agreements for sidewalks
to ensure safe travel by all ages and abilities. Track and report maintenance deficiencies, and develop enforcement procedures to ensure compliance. Safe passage along sidewalks is critical to mobility, especially for individuals with disabilities and the elderly. During and immediately after severe weather, poorly maintained sidewalks, crosswalks, and transit stops can become inaccessible to many, limiting transportation options. MnDOT should work with cities and counties to review the most cost-efficient way to clear and maintain pedestrian and bicyclist facilities, including development of performance metrics (e.g., time to 90% cleared) and enforcement methods.
See 2017 SMTP Proposed Strategy: Plan, design, build, operate, and maintain transportation infrastructure and facilities to improve the safety of all users and the communities they travel through.
>>
>>>>
>>
MDH MNDOT SMTP HEALTH IMPACT ASSESSMENT

PAGE 75 PAGE 75 PART II CHAPTER 4: SMTP ASSESSMENT: HEALTHY COMMUNITIES OCTOBER 2016
4. SMTP ASSESSMENT: HEALTHY COMMUNITIES4.1 BACKGROUNDThere is momentum in the transportation sector to better understand how transportation systems impact health. The Minnesota GO vision emphasizes impacts in three key domains: quality of life, environmental health, and economic competitiveness, all of which have direct ties to health. The Healthy Communities SMTP work group recognized there are many natural, cultural, economic, and social factors that foster healthy communities, and transportation projects influence and are influenced by these factors.
Emphasizing health in the title of this SMTP objective reinforces MnDOT’s goal of creating a transportation system that supports health. This HIA section expands the discussion of health promotion in three areas related to the Healthy Communities objective by considering community context in a way that maximizes community health; the impact of climate change on health and safety; and the benefits of shifting more Minnesotans to the active transportation modes of walking, biking and transit use.
4.2 COMMUNITY-SENSITIVE FRAMEWORKMnDOT is known as a leader in adopting Context Sensitive Solution principles. Context Sensitive Solutions (CSS) is accepted as a collaborative, interdisciplinary, holistic approach to the development of transportation projects. The CSS approach evolved out of the National Environmental Policy Act of 1969, which required transportation agencies to consider the possible effects of transportation projects on the environment.
MnDOT has the opportunity to take this planning and design accountability and responsiveness one step further, by demonstrating the need and benefit of integrating transportation and health through a Community-Sensitive Framework. This approach builds off CSS to ensure that transportation projects reflect the needs and assets of communities across Minnesota. By including community considerations throughout all phases of a project’s design, such a framework can help address negative perceptions and prevent possible negative impacts of transportation-induced neighborhood change.85
FIG. 56. WHAT DOES CONTEXT MEAN TO YOU?
Represents the transportation need, project logistics, natural environment, and human environment.
TRANSPORTATION Source: Federal Highway Administration
The physical, social, and attitudinal environment in which people live and conduct their lives.
PUBLIC HEALTHource: World Health OrganizationS

PAGE 76 PAGE 76 MDH MNDOT SMTP HEALTH IMPACT ASSESSMENT
4.2.1 SETTING THE FRAMEWORKA Community-Sensitive Framework asks transportation planners to start by understanding the needs and assets of a community. This requires a shift in decision-making processes and may include a higher degree of engagement or power-sharing. By starting with the community, the transportation project can better reflect the goals and values of the community and its future users. While other terms have been employed to embody this work, such as Context Zones, framing the discussion first around “Community” guides the definition of context in nuanced ways that consider health. This can include geography (i.e., the physical limits of the project and impact); cultural identity (i.e., unveiling the complex differences of transportation use and benefit based on race, ethnicity, and/or nativity status); and time in neighborhood (i.e., impact of perception and behavior by the community based on length of residency).85
Community engagement is a critical factor in defining and maintaining a Community-Sensitive Framework. Structuring an engagement process that fosters the development of authentic and equitable places provides for a shared sense of ownership, responsibility, and accountability.
4.2.2 INTEGRATING HEALTH DETERMINANTSNationally, the current CSS planning and design approach is largely determined by two factors: development patterns (categorized as urban, suburban, and rural) and land use (categorized as commercial, mixed-use, residential, and single use). See Figure 57, page 77, top. These factors form a logical starting point yet lack a human health component. Overlaying community-specific health determinants can further shape Community-Sensitive planning and design decisions (Figure 58, page 77).86
Health determinant categories include social, environmental, physical, and individual behavior characteristics:
• Social: quality of and connection to community assets; cultural implications on transportation mode use; structural racism
• Environmental: vector-borne disease prevalence; air quality; water quality; noise pollution; parks and greenspace
• Physical: access to employment, shops and support services; school walk and bike zones; crashes between motor vehicles, bicycles, and pedestrians; access to parks and green space; food deserts/swamps
SMTP PROPOSED STRATEGY LANGUAGE
Support economic vitality and create and maintain jobs through transportation infrastructure investments. ... All transportation partners should continue to be actively involved to ensure that the projects selected for funding achieve net equitable economic gains for the state while carefully considering the trade-offs that accompany the economic development opportunities.
Plan, design, develop, and maintain transportation infrastructure and facilities in a way that reflects and is informed by the surrounding context. Transportation partners need to make decisions that are reflective of context the community. Doing this requires having sound information and examples from which to draw, including travel behavior, potential engagement, design, and environmental mitigation strategies. Context considerations A community-sensitive planning and design approach will help strengthen the connections between land use and transportation decisions by providing multiple “starting points” for project-development conversations, depending on the needs of those who use the system and the surrounding community. The principles of context sensitive solutions should guide plans and projects to address environmental, economic, and social needs while involving a broad range of stakeholders, advancing equity and creating lasting value for communities.
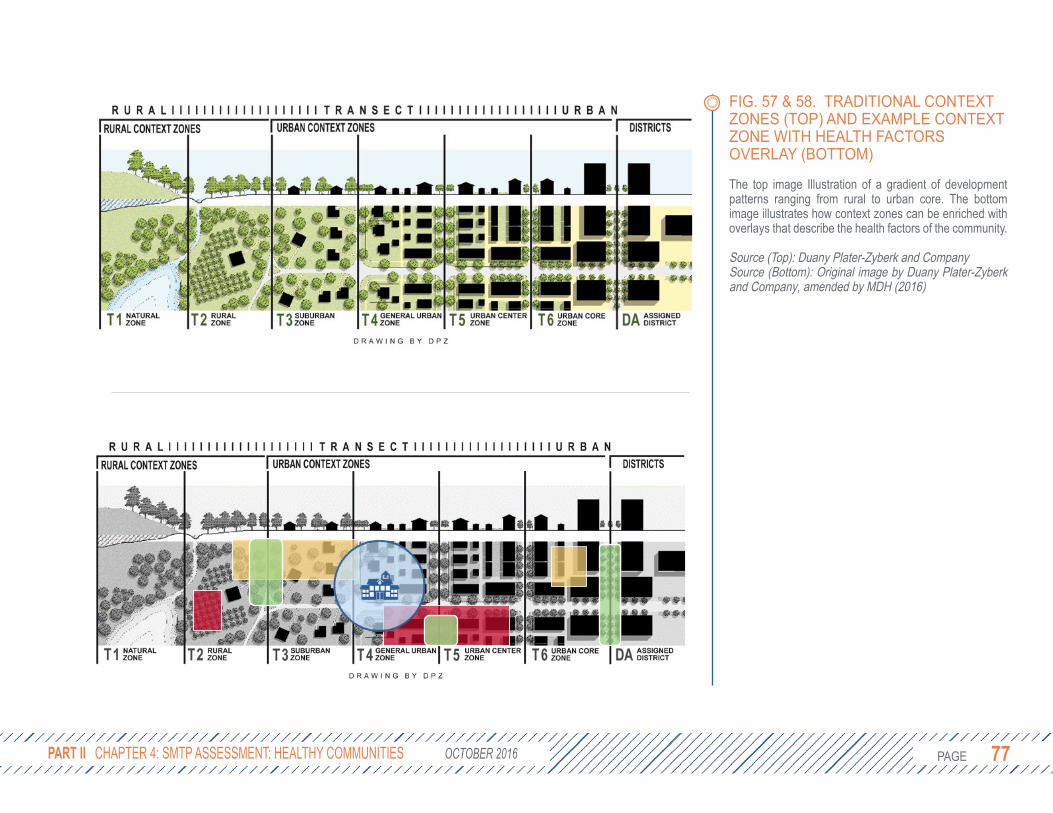
PAGE 77 PAGE 77 PART II CHAPTER 4: SMTP ASSESSMENT: HEALTHY COMMUNITIES OCTOBER 2016
FIG. 57 & 58. TRADITIONAL CONTEXT ZONES (TOP) AND EXAMPLE CONTEXT ZONE WITH HEALTH FACTORS OVERLAY (BOTTOM)
The top image Illustration of a gradient of development patterns ranging from rural to urban core. The bottom image illustrates how context zones can be enriched with overlays that describe the health factors of the community.
Source (Top): Duany Plater-Zyberk and CompanySource (Bottom): Original image by Duany Plater-Zyberk and Company, amended by MDH (2016)

PAGE 78 PAGE 78 MDH MNDOT SMTP HEALTH IMPACT ASSESSMENT
• Individual Behavior: diet, physical activity, stress
For example, including school walk (1/2 mile) and bike (3 mile) zones in contextual guidance can help transportation planners identify intersections that may benefit from improved lighting or signage that help promote walking or biking to school (Figure 59). Other potential overlays include parks, areas of concentrated poverty or wealth, pedestrian priority areas, transit-oriented development areas, or Complete Streets. Reviewing social, environmental, physical, and individual behavior characteristics on project, regional, and system-wide levels will help transportation projects improve community health outcomes.
4.2.3 AREAS OF CONCENTRATED POVERTY/WEALTHA map of concentrated poverty is one tool that could help transportation planners consider the true costs and benefits of a project. Such efforts have already been used in the Twin Cities metro area by the Metropolitan Council. In 2014, identified census tracts where many of the residents were both poor and people of color (Figure 60, at right).
It is not enough to only consider communities that have historically faced disinvestment.
Transportation plans must also consider communities that have concentrated wealth. Wealthier communities tend to have the political, social, and economic clout to advocate for themselves. Without an effective, inclusive community engagement strategy certain voices can dominate the conversation, giving the illusion of consensus for a project that may disproportionately benefit those with a strong voice over those without a voice.
Mapping communities of concentrated wealth can provide transportation planners with the context needed to ensure projects provide equitable benefits. Figure 61 (top of following page) shows statewide concentrations of both poverty and wealth using data from the 2010-2014 American Community Survey and the Department of Employment and Economic Development’s cost of living (COL) estimates for counties. Detailed methodology is provided in the Appendix.
• Orange areas have a median household income (HHI) that is less than the COL for the county and less than 60% of its residents are white, non-Hispanic.
• Green areas have a median HHI that is at least 50% greater than the cost of living and over 95% of residents are white, non-Hispanic.
FIG. 59. SCHOOL WALK AND BIKE ZONES
Considering school locations in transportation projects can help promote walking and biking to school.
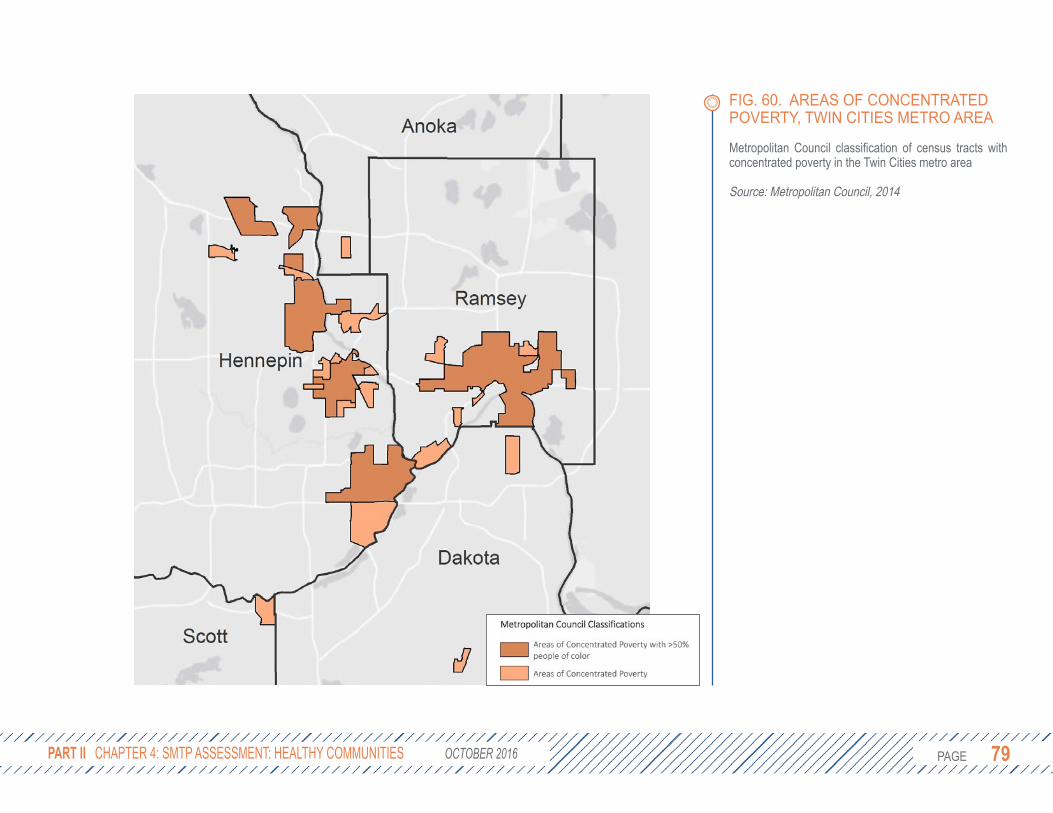
PAGE 79 PAGE 79 PART II CHAPTER 4: SMTP ASSESSMENT: HEALTHY COMMUNITIES OCTOBER 2016
FIG. 60. AREAS OF CONCENTRATED POVERTY, TWIN CITIES METRO AREA
Metropolitan Council classification of census tracts with concentrated poverty in the Twin Cities metro area
Source: Metropolitan Council, 2014

PAGE 80 PAGE 80 MDH MNDOT SMTP HEALTH IMPACT ASSESSMENT
FIG. 61 & 62. AREAS OF CONCENTRATED POVERTY AND WEALTH IN MINNESOTA (LEFT) AND THE TWIN CITIES (RIGHT)
Most areas of concentrated poverty (orange) are in central Northern Minnesota and the Twin Cities. These areas align well with the areas of concentrated poverty identified by the Metropolitan Council. Areas of concentrated wealth (green) are more common in the outer ring suburbs of the seven-county Twin Cities metro area and Greater Minnesota. Detailed methodology is provided in the appendix.
Source: Minnesota Department of Health, 2016

PAGE 81 PAGE 81
4.2.4 COMMUNITY ENGAGEMENTIn addition to adding information on health determinants to contextual guidelines, the second component of a Community-Sensitive Framework is to build relationships with the community through authentic community engagement that is appropriate to the scale and nature of the project. The level of community engagement can be thought of as a spectrum from informing the community of a decision to empowering them to define the project and make the decision themselves (Figure 63, following page). In many cases it may be appropriate to simply inform the community, such as when a bridge is closed on the weekend for repairs. In other cases, empowering the community may lead to more buy-in, transparency, and accountability, such as deciding whether to add more parking or a bike lane to a street. There is currently no guidance or tracking of a project’s level of community engagement. While community engagement varies considerably by project, consultants are often hired to lead the efforts. While MnDOT staff are also involved, the use of consultants may impede relationship-building with communities, further isolating MnDOT.
Strong community engagement requires more time and resources, but it can also create new opportunities. Through
community engagement, transportation planners can understand not just the current state of the community, but its history and vision for its future. For example, a historically dis-invested community may lack the recreational opportunities it needs to be healthy. Likewise, an analysis of travel behavior may show low pedestrian and bicycle counts, which could be interpreted either as an indication of low demand for active transportation facilities or a historic lack of investment in infrastructure that makes it difficult to use active transportation. Through strong community engagement, transportation planners can look not just at existing conditions, but at what should or could be in the surrounding neighborhood. This forward-looking approach will not only improve transportation projects, but will identify new opportunities to serve Minnesota’s communities.
As the stewards of a large amount of publicly-owned land, MnDOT has a responsibility to manage these resources in a way that maximizes the health of residents and the surrounding environment. Careful consideration of all possible uses of under-utilized land, including pocket parks, community gardens, community solar gardens, and pollinator-friendly habitats can identify opportunities to collaborate with or even empower local communities.
PART II CHAPTER 4: SMTP ASSESSMENT: HEALTHY COMMUNITIES OCTOBER 2016

PAGE 82 PAGE 82 MDH MNDOT SMTP HEALTH IMPACT ASSESSMENT
FIG. 63. SPECTRUM OF COMMUNITY ENGAGEMENT
Collaboration requires power sharing and can lead to more equitable outcomes.
Source: Based on the IAP2 Public Participation Spectrum, available at www.iap2.org

PAGE 83 PAGE 83
4.3 CLIMATE CHANGERising levels of greenhouse gas emissions are the primary drivers of recent trends in global climate change. In the U.S. and in Minnesota, transportation is the second largest source of greenhouse gas emissions to the atmosphere after electricity generation.87 Recognizing that transportation is a significant factor in climate change and also a sector vulnerable to its effects, the U.S. Department of Transportation (DOT) has developed an online Transportation and Climate Change Clearinghouse (http://climate.dot.gov/index.html) with information and resources on a wide range of mitigation and adaptation issues. A few of the potential climate change-driven impacts on transportation systems identified by the U.S. DOT include the following:
• More frequent and severe flooding of roads, bridges, and tunnels leading to limited access, congestion, and higher repair/replacement costs.
• Higher temperatures and longer heat waves leading to increased thermal expansion of paved surfaces, degradation, and reduced service life.
• Decreased driver performance during adverse weather events with an increased risk of vehicle crashes.
• Reduced access, increased system downtime, and slower travel times impacting local economies and public transportation.88
MnDOT also provides online information and resources on how Minnesota’s transportation system both contributes to and is affected by climate change (http://www.dot.state.mn.us/climate/index.html).
With regard to impacts, much of MnDOT’s focus is on extreme weather events, particularly increased frequency of heavy rainfall associated with flooding. Climatology experts anticipate that the frequency and magnitude of heavy precipitation events will increase as a consequence of climate change, necessitating stepped-up efforts toward adaptation across the state. MnDOT conducted a vulnerability assessment pilot project in two flood prone areas of the state in order to improve agency understanding of extreme weather impacts on transportation assets and identify options for improving system resiliency. The agency has also voiced its commitment to continue participating in state climate change, climate adaptation and air quality efforts to minimize other impacts, such as those stemming from drought, extreme heat events, and increased freeze/thaw cycles.
PART II CHAPTER 4: SMTP ASSESSMENT: HEALTHY COMMUNITIES OCTOBER 2016
PROPOSED SMTP STRATEGY LANGUAGE
Make transportation decisions that minimize and reduce total greenhouse gas emissions. The transportation sector is the second-largest contributor to greenhouse gas emissions in Minnesota behind only electricity production facilities, and plays a large role in whether the state will meet the emission reduction goals set by the Next Generation Energy Act. Making transportation decisions that minimize and reduce total greenhouse gas emissions will ensure that Minnesota’s transportation systems do their part in combating global climate change.

PAGE 84 PAGE 84
From a public health perspective, some of the major concerns relating to climate change impacts on Minnesota’s transportation system are rooted in driver/passenger safety and secure access to and from essential services. Investigating and preparing for severe weather and ensuring that access routes to and from hospitals and clinics are secure will help improve access to medical
treatment and prevent additional injuries and fatalities.
Reducing vehicle emissions can help mitigate climate change and contribute to better air quality and a healthier breathing environment for all residents and visitors.
MDH MNDOT SMTP HEALTH IMPACT ASSESSMENT
FIG. 64. GREENHOUSE GAS EMISSION CHANGES BY ECONOMIC SECTORS, 2005-2012
The transportation sector has reduced its emissions by 8% from 2005-2012.
Source: Minnesota Department of Commerce & Pollution Control Agency. (2015). Greenhouse Gas Emissions Reductions.

PAGE 85 PAGE 85
4.3.1 MOTOR VEHICLE CRASHESClimate change will likely lead to more frequent, severe weather events including storms and floods. Of the fifteen mega-rain events (at least six inches of rain over 1,000 square miles) since 1866, seven have occurred since 2002.
Severe weather events will increasingly strain Minnesota’s transportation systems. Based on data from the National Highway Traffic Safety Administration’s Fatality Analysis Reporting System, 3,041 traffic deaths occurred in Minnesota between 2006 and 2012. Of those deaths, 21% were linked to poor weather, including snow, ice, storms, fog, and other challenging conditions.89
In January 2015, a snow storm contributed to a reported 654 motor vehicle crashes, including 87 injuries. One year later in February 2016, another snow storm contributed to 679 crashes, including 36 injuries. In both cases advance warning was given and heeded by many, but the volume of crashes suggests that people lack either
a safer alternative or sufficient incentive to change their travel behaviors.
An analogous situation can be drawn with St. Patrick’s Day and New Year’s Eve, two holidays that have seen predictable increases in the number of crashes and deaths due to alcohol-impaired driving. On these days, Metro Transit partnered with private sponsors to provide free transit rides in an effort to remove impaired drivers from the road. According to their own analysis, ridership on St. Patrick’s Day increased by 19.5% from 2012-2016. It is not clear how much of this increase is directly attributable to the price promotion, although research has shown that riders are sensitive to changes in price.90 A similar strategy may be employed for severe weather events. Media campaigns highlighting alternative modes combined with free transit rides during severe weather events may reduce the number of vehicles on the road and ease traffic capacity limitations. It has the added benefit of exposing potential new riders to the benefits of taking transit.
PART II CHAPTER 4: SMTP ASSESSMENT: HEALTHY COMMUNITIES OCTOBER 2016
FIG. 65. TIMELINE OF MINNESOTA’S HISTORIC MEGA-RAIN EVENTS, 1866-PRESENT
These “mega-rain” events documented by the DNR totaled at least six inches of rain over more than 1,000 square miles. These types of storms are occurring more frequently, in part, because warmer air can hold more water.
Data Source: Minnesota Department of Natural Resources, State Climatology. Retrieved from http://www.dnr.state.mn.us/climate/summaries_and_publications/mega_rain_events.html

PAGE 86 PAGE 86
4.3.2 HOSPITAL RESILIENCY TO FLOODINGAccess to emergency medical services, one of the four E’s of traveler safety, can be jeopardized by flooding events. Climate change is expected to affect the frequency, intensity, and duration of severe weather events, such as excessive rainfall and flooding.91 The threat of increased flood events have spiked concerns among administrators of healthcare facilities and other essential services regarding patient and employee access. Flooded roads and bridges, along with disruption to public transit, can make it difficult or impossible for patients to arrive at appointments or receive
emergency care while simultaneously keeping clinicians and support staff from making it into work or to patient homes. Awareness of flood threats has inspired some administrators to address facility infrastructure and innovate around emergency response planning. However, ensuring safe passage to and from healthcare facilities requires support from state and local planners with jurisdiction over potentially impacted segments of the state’s transportation system.
MDH licenses most health care facilities in the state and maintains a directory with nearly 4,500 regulated facilities. These facilities provide a wide-range of services to a large and diverse population of Minnesotans
MDH MNDOT SMTP HEALTH IMPACT ASSESSMENT
FIG. 66. TRAFFIC FATALITIES FOR MINNESOTA, 2006-2012
About 21% of all traffic fatalities between 2006 and 2012 were related to poor weather conditions.
Source: FARS, 2006-2012, courtesy of S. Saha
SMTP PROPOSED STRATEGY LANGUAGE
Work with emergency medical and trauma services to reduce response time and increase survivability. This includes minimizing obstructions to crash locations, such as blocked roadways, as well as ensuring safe and reasonable access to hospitals and other key facilities such as heliports, airports and major highways.

PAGE 87 PAGE 87
and include nursing homes, supervised living facilities, hospitals, surgical centers, clinical labs, birth centers, hospice, dialysis providers, and others. Of the total number of facilities, over 1,500 are located in areas identified as vulnerable to a severe flooding event. More than 6,100 miles of roadway providing access within a half mile of these facilities are also located within floodplain areas. Over 260 miles are part of the MnDOT trunk highway system. In some areas of the state, there are few roads that provide access to these potentially vulnerable facilities, such that if a flood event did occur, access roads may be impacted, dramatically affecting patient care (Figure 68, following page).
Roadway design elements, including elevated surfaces and culverts to divert rainwater, play a critical role in a road’s vulnerability. A 2014 MnDOT pilot study assessed the flood vulnerability of roads in a floodplain according to the road’s exposure to climate stressors, ability to cope with those stressors, and importance to the resiliency of the overall transportation system. In District 6 (southeast Minnesota), nearly half of all roads assessed were graded as highly or very highly vulnerable compared to about 20% of roads in District 1 in northeast Minnesota.92
FIG. 67. EXAMPLES OF MINNESOTA HEALTHCARE FACILITIES AND ACCESS ROADS LOCATED IN FLOODPLAINS DESIGNATED BY FEMA AS VULNERABLE TO AN EXTREME FLOOD EVENT
Work with emergency medical and trauma services to reduce response time and increase survivability. This includes minimizing obstructions to crash locations, such as blocked roadways, as well as ensuring safe and reasonable access to hospitals and other key facilities such as heliports, airports and major highways.
Source: MDH, 2016
PART II CHAPTER 4: SMTP ASSESSMENT: HEALTHY COMMUNITIES OCTOBER 2016
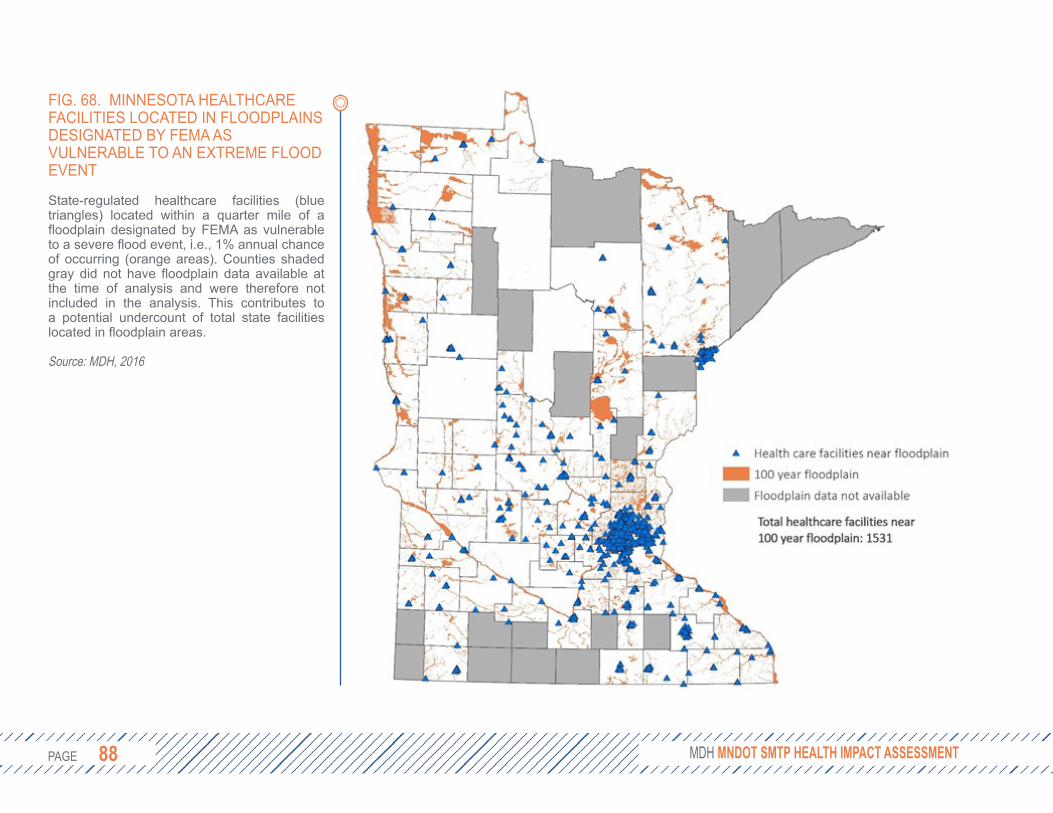
PAGE 88 PAGE 88 MDH MNDOT SMTP HEALTH IMPACT ASSESSMENT
FIG. 68. MINNESOTA HEALTHCARE FACILITIES LOCATED IN FLOODPLAINS DESIGNATED BY FEMA AS VULNERABLE TO AN EXTREME FLOOD EVENT
State-regulated healthcare facilities (bluetriangles) located within a quarter mile of a floodplain designated by FEMA as vulnerable to a severe flood event, i.e., 1% annual chance of occurring (orange areas). Counties shaded gray did not have floodplain data available at the time of analysis and were therefore not included in the analysis. This contributes to a potential undercount of total state facilities located in floodplain areas.
Source: MDH, 2016
PAGE 89 PAGE 89
4.3.3 POLLENThe life cycle of plants is strongly influenced by the environment, which controls the timing of growth and reproduction. Climate change conditions, in particular increasing temperatures and ambient levels of carbon dioxide, directly influence pollination by determining the onset of flowering, number of pollen grains produced and the amount released into the air.93
Common ragweed is the most prominent seasonal allergen in the U.S.94 Recent evidence demonstrates that the ragweed season has already lengthened across areas of the Midwest, including Minnesota, where the season has increased by more than two weeks since 1995 (Figure 69, following page).95 Other studies provide evidence that climate change conditions are increasing the allergenicity of pollen and facilitating the spread of non-native, potentially allergenic plant species into northern latitudes.96
The potential health burden on impacted communities could be substantial. Over 35 million Americans suffer from pollen allergies, and each year allergies cause 3.5 million lost workdays, 2 million lost school days, and more than $11.2 billion in treatment costs.97 High ragweed pollen levels have been linked to increases in hospital visits.98
Minneapolis/St. Paul ranked 10th among the nation’s most populous cities for ragweed sensitivity, with nearly 22% of patients tested in the metro area returning positive results.99 In addition, pollen exposure increases the risk of developing asthma and can trigger life-threatening asthma attacks.100 Half of all adults with asthma and at least two-thirds of children with asthma have allergies.94 In 2014, 1 in 12 Minnesota adults reported that they live with asthma; among black Minnesotans the rate is twice the state average.47 In 2011, seven percent of Minnesota children were reported to have asthma.101
While most people with allergies can treat their symptoms to satisfaction with over-the-counter medications, around 20% of allergy sufferers see little to no improvement with medication alone because of the severity of their condition.102 Amplifying the risks from pollen are other air pollutants associated with climate change and adverse health impacts, such as ozone and volatile organic compounds. Some authors have noted that the allergenic potential of pollen may be increased by air contamination.103
A recent review of strategies for reducing the impacts of pollen on Minnesotans by MDH’s MN Climate and Health Program identified environmental controls as an effective, evidence-based approach to reducing
PART II CHAPTER 4: SMTP ASSESSMENT: HEALTHY COMMUNITIES OCTOBER 2016

PAGE 90 PAGE 90
associated health effects. Examples of environmental controls include physical removal or use of pesticides to eliminate allergenic plants, particularly in marginalized areas or vacant lots, or informed selection of non-allergenic, native plants for new plantings. By some reports, most trees are planted in cities without awareness of their potential contributions to allergen levels and subsequent impact on residents.104
According to some experts, a lack of planning and management of green spaces has dramatically intensified the allergenic pollen burden in many cities.103
Environmental control strategies are important intervention strategies for mitigating pollen exposure and may be
a more effective “upstream” strategy for addressing pollen impacts than the current paradigm of treating symptoms after exposure and sensitization have occurred.
Pollen risk has been shown to be location-specific.105 Allergy rates tend to be higher in cities compared to rural areas,106 a trend attributed to higher carbon dioxide concentrations and temperatures (i.e., urban heat island effect) found in city settings apart from but amplified by climate change.107
Decisions regarding environmental controls of ragweed and other nuisance plants in Minnesota are mainly made at the local level. However, local jurisdictions look for planting and management guidance from
MDH MNDOT SMTP HEALTH IMPACT ASSESSMENT
FIG. 69. INCREASE IN THE DURATION OF RAGWEED POLLEN SEASON FOR AREAS IN AND AROUND MINNESOTA, 1995-2015
Ragweed season has increased by over two weeks for most of Minnesota since 1995. The lengthening pollen season is strongly related to climate change characteristics, such as lengthening of the frost-free season and later timing of first fall frost, changes that are most pronounced in northern areas of Minnesota.
Source: United States Environmental Protection Agency. May 2014. http://www3.epa.gov/climatechange/science/indicators/health-society/ragweed.html
PAGE 91 PAGE 91
state agencies like the Department of Natural Resources and MnDOT. MnDOT has the opportunity to substantially contribute to the reduction of allergenic pollen in many areas of the state by providing detailed guidance on environmental controls and plant/seed selection for local planners, as well as initiating environmental controls in affected lands owned and managed by MnDOT directly.
4.3.4 MITIGATIONTransportation accounts for 25% of all greenhouse gas (GHG) emissions in Minnesota. GHG emissions from the transportation sector have dropped 8% from 2005 - 2012, mostly due to improvements in vehicle efficiency. This is below goals set forth by the Minnesota Next Generation Energy Act of 2007 which called for reductions in GHG emissions of 15% by 2015, 30% by 2025, and 80% by 2050.87 These goals are consistent with the U.S. national goal of a 26-28% reduction over 2005 levels by 2025 as set forth in the 2015 Paris agreement.
The Minnesota Pollution Control Agency’s forecasts for emissions from the transportation sector include increases in vehicle miles traveled (VMT), continued fuel efficiencies, and adoption of electric vehicles, among other factors. While GHG
emissions from the transportation sector are projected to continue to decline between now and 2030, they will likely be 10-15% higher than the targets set by the Next Generation Energy Act. Declining emissions from light-duty vehicles will be partially offset by increases in emissions from heavy and medium-duty vehicles and air transportation. Using population projections, VMT per person is expected to increase from 9,773 in 2005 to 10,879 in 2025.4
Improvements in vehicle efficiencies alone are unlikely to achieve emissions targets. Reducing VMTs will be necessary through mode shifts and prioritizing projects where the land uses complement transportation infrastructure, such as transit-oriented development and siting schools in the communities they serve, both of which have demonstrated health benefits.108, 109 Achieving reductions through mode shift is more feasible in dense, urban areas with access to public transit and more walkable destinations. Not only must public transit, biking, and walking infrastructure expand across the state, but MnDOT can leverage public-private partnerships (such as Transportation Management Organizations) to encourage their use and develop alternatives (including vanpooling or telecommuting) for businesses where public transit is not yet available.
PART II CHAPTER 4: SMTP ASSESSMENT: HEALTHY COMMUNITIES OCTOBER 2016
PROPOSED SMTP STRATEGY LANGUAGE
Give higher priority to transportation improvements in areas with complementary existing or planned land uses. ... For example, siting schools or medical facilities on the edge of communities stresses the transportation system by requiring people to travel greater distances to access resources and often results in new infrastructure investments. ... Where appropriate, transit-oriented development is a tool that connects land use and transportation infrastructure through higher density residential and commercial development. TOD often incorporates features that better facilitate transit use, bicycling, and walking.
PAGE 92 PAGE 92
Reductions in air pollution, especially fine particles and ground-level ozone, can have significant health benefits. The recent Life and Breath study of air pollution in the Twin Cities by the Minnesota Pollution Control Agency and MDH49 found that a 10% reduction in fine particles and ground-level ozone from 2008 levels could “prevent hundreds of deaths, hospitalizations, and emergency visits due to heart and lung conditions every year that are attributed to these pollutants.”
The health impacts of a statewide 10% reduction in PM 2.5, SO2, NOX, NH3, and VOC from on-road sources of pollution can be estimated and monetized, using the Environmental Protection Agency’s Co-Benefits Risk Assessment Model (COBRA). The total associate health costs avoided in Minnesota could range from $69-156 million per year (for more on the methodology, see Appendix). Most of these benefits would occur in the Twin Cities metro area (Figure 70, opposite page). If efforts were made to reduce pollution from on-road sources of pollution by 10% in the seven-county metro area alone, the total associated health costs avoided would be $56-126 million per year, or 81% of the benefit of statewide reductions. A 10% reduction of pollution from diesel vehicles in the Twin Cities metro area would net $39-88 million per year in avoided health costs.
MDH MNDOT SMTP HEALTH IMPACT ASSESSMENT
MITIGATION: CONSIDERING TRADE-OFFSMnDOT has moved toward replacing state-owned light fixtures with high-efficiency LEDs. This initiative will likely reduce both costs and energy usage, although the American Medical Association advises against bulbs that emit a harsher blue light (4000k) that can reduce melatonin production and interfere with sleep cycles.110 Other important considerations for LED street lamps include potential glare (which can be especially problematic for the elderly), luminary design, light pollution/trespass, and adjustability in color temperature and output for use in emergency situations, crosswalk safety, place-making, or to fit the local context.

PAGE 93 PAGE 93
4.4 ACTIVE TRANSPORTATIONWhile there are many elements of the SMTP that support active transportation, a newly proposed strategy specifically prioritizes projects that increase the number of people who walk, bike, and take transit. This strategy makes several notable references to health, economic, and environmental impacts of active transportation. This section further details these benefits.
4.4.1 HEALTH BENEFITS Active transportation can be a significant source of regular physical activity when incorporated into daily routines and can contribute to meeting the national physical activity guidelines of at least 150 minutes per week.10,11 More people meeting the physical activity guidelines will result in reduced obesity and related chronic diseases, such as diabetes, heart disease and stroke, and some cancers.
The health benefits of physical activity have been well-documented by hundreds of studies. An increasing number of recent studies have confirmed that these benefits are specifically linked to walking and biking.111-113
For example, it has been reported that people who bike or walk at an amount meeting the national physical activity guidelines of 150 minutes/week, reduce their risk of death for
PART II CHAPTER 4: SMTP ASSESSMENT: HEALTHY COMMUNITIES OCTOBER 2016
FIG. 70. TOTAL MONETIZED HEALTH EFFECTS FOR A 10% STATEWIDE REDUCTION IN ON-ROAD SOURCES OF POLLUTION
Most of the health benefits would be in dense urban areas such as the Twin Cities and along transportation corridors.
Source: Co-Benefit Risk Assessment (2015). United States Environmental Protection Agency.
PROPOSED SMTP STRATEGY LANGUAGE
Identify and give priority to infrastructure improvements, services, and education that increase the number of people who bicycle, walk, and take transit. Increasing the number of people who bicycle, walk, and take transit has many benefits for Minnesota's communities. Shifting a greater share of travelers towards more active modes has the potential to improve the health of Minnesota's people and environment by encouraging physical activity and reducing vehicle emissions.

PAGE 94 PAGE 94
all causes by about 10%.111,114 For risk of heart disease, one study found that risk is reduced by 16% for people who walk three hours per week115 and another study found that risk is reduced by 11% for people who commute using active transportation modes compared to those who do not.116
Promoting transit use can be another strategy to encourage walking and biking because each trip typically starts and ends with a walk or bike ride. One study reported that transit users walk to and from the transit station for an average of 19 minutes per day, and another reported that 29% of transit users walk at least 30 minutes per day.117 Another study reported that people who use transit walk an additional 21 minutes a day in going to and from transit stops or stations.118
The health benefits of active transportation have been found to exceed the risks of injury and exposure to air pollution. Reviews of 30 health impact modeling studies that quantify health benefits from walking or biking due to increases in physical activity, as well as risks from exposure to air pollution or crashes, have consistently demonstrated that health benefits from active transportation outweigh risks.119 It should be noted that these risks can vary greatly by location based on the proximity to high-traffic roadways. In addition, biking may result in greater exposure to
air pollution when traveling along roads because air pollution concentrations are typically elevated along roads, and elevated breathing rates from the effort of biking can lead to higher intake of air pollutants.120
However, there are no studies that link exposure to air pollution from biking directly to long-term health effects.121
4.4.2 ENVIRONMENTAL BENEFITSSupporting mode shift toward active transportation reduces GHG emissions because walking and biking do not produce GHG emissions. Greater use of high-occupancy vehicles like carpools, buses, and trains reduce per person GHG emissions. Increasing the use of these modes will lead to improved air quality and potentially reduced prevalence of asthma and other respiratory conditions exacerbated by air pollution.
Vehicle emissions are greatest when in stop-and-go traffic and while warming up in the first few minutes of operation.122 A shift toward active transportation can reduce traffic congestion for all road users, often more effectively than expanding the capacity of a road.149 Using active transportation modes can eliminate the need for short trips where the vehicle operates inefficiently for a greater proportion of time.
MDH MNDOT SMTP HEALTH IMPACT ASSESSMENT

PAGE 95 PAGE 95
Features of walkable and bikeable communities often include more shade trees and other aesthetically-pleasing green space along the travel corridors. Additional environmental benefits of active transportation modes include reductions in traffic congestion leading to less maintenance costs on existing roadways.
4.4.3 ECONOMIC BENEFITSActive transportation can save people money. This is particularly beneficial to those who cannot afford or choose not to own a vehicle as well as those who are not able to drive based on age (very young and very old) or disability. People living in areas with multiple transit connections are more likely to spend less of their income on transportation costs due to reduced car use.123 Owning fewer cars, or no cars, and driving them less can mean significant savings. The average American family spends approximately 18% of household income on transportation and very low-income households can spend 55% or more, while households with access to good transit service spend only 9%.124 The personal costs of owning and operating a car include the purchase price, finance fees, gas, oil, maintenance and repairs, insurance and parking. The American Automobile Association’s annual study, “Your Driving Costs” showed in 2013 that owning and
operating a car in the U.S. continues to become more expensive each year. Based on driving 15,000 miles per year, type of vehicle, and depreciation, the cost averaged $0.61 cents per mile or $9,722 per year.125 As described in this report, safe active transportation options are critical components of a transportation network that connects people, especially those in low-income households, to jobs, education and essential services. Providing affordable transportation options can also improve health by shifting transportation cost savings to health improvement costs, such as food and health care.
4.4.4 STRATEGIES TO INCREASE MODE SHIFTThere is strong evidence to support the health, environmental, and economic benefits of active transportation. However, there is very little evidence comparing the various strategies and approaches to achieving this modal shift. Reviews of scientific literature found weaknesses in study design and evaluation that make comparisons across studies difficult.126, 127 Projects vary widely in their scope, population, implementation, and evaluation, making results difficult to generalize or compare.
PART II CHAPTER 4: SMTP ASSESSMENT: HEALTHY COMMUNITIES OCTOBER 2016
PAGE 96 PAGE 96
Still, several observations can be made:• Changing the habits of students may
lead to life-long health improvements.• Providing safe active transportation
choices to historically dis-invested and low-income communities can promote equity by serving the transportation needs of those who would benefit most.
• The total benefits to society of increased walking or biking likely outweigh the costs of effective mode shift strategies.128
The SMTP strategies name several proven approaches to creating environments and transportation systems that encourage walking, biking, and transit use. These include transit-oriented development, school siting and Safe Routes to School, and complete streets. This section briefly reviews the evidence for these programs.
Transit-Oriented DevelopmentTransit-Oriented Development (TOD) creates connected, livable, and active neighborhoods where most trips can be completed by walking, biking, or public transit. In Minnesota, the Metropolitan Council has designated several areas around light rail and high frequency bus routes as TOD zones where additional funding for development projects may be available.
A recent review of the literature found five factors to be associated with increased physical activity levels, all of which are common to TOD: diverse housing types, mixed land use, housing density, compact development patterns, and increased levels of open space.129 More specifically, those who use public transit walk to and from the transit station for a median of 19 minutes per day, with 29% of users walking at least 30 minutes per day, meeting national physical activity guidelines.117
School Siting and Safe Routes to SchoolJust as transportation projects complement the existing land use, transportation planners can help schools to identify sites that complement the existing transportation infrastructure. An HIA of the guidelines on school siting and design in Minnesota found that the guidelines were out of date and lacking key elements that promote physical activity.109 In particular, the report found that by siting schools where land was inexpensive and plentiful, schools were removing themselves from the communities they served. As a result, fewer children were able to walk or bike to school and community use of facilities (e.g., gymnasiums) was more restricted.
MDH MNDOT SMTP HEALTH IMPACT ASSESSMENT

PAGE 97 PAGE 97
School districts can also apply for Safe Routes to School (SRTS) grants that help support infrastructure improvements and programming to encourage students to safely bike and walk to school. From 2005-2015, MnDOT has awarded more than $20 million in funding for SRTS projects in over 538 schools. Still more schools are seeking funding; applications for project funding totaled nearly $120 million over that period.130
These grants have been shown to be effective. Two independent studies compared rates of walking and biking to school before and after SRTS programming in six states plus the District of Columbia. These studies found that walking and biking increased by 31%131 and 37%132 relative to baseline levels. In New York City, SRTS programs have reduced the annual rate of pedestrian injuries among school-age children by 33% and among other age groups by 14%.133
Complete StreetsComplete streets is a complementary movement to CSS that ensures the design and decision-making processes for transportation projects routinely take into account the needs and safety of all users, including drivers, freight, bicyclists, pedestrians, and transit users.134 Common strategies address traffic speed, pedestrian
crossings, accessibility, bicycle lanes and parking, and an engaging streetscape environment. In addition to the state, a number of localities have passed complete streets policies. Minnesota has made great strides in implementing complete streets, yet challenges remain. MnDOT has committed to complete streets, but cities and counties are left to themselves to decide whether or not to prioritize complete streets.
For some jurisdictions, cost can be a major barrier. In 2016 MnDOT revised its Cost Participation Policy to adjust the local share for State Trunk Highway projects that have a mutual benefit to local jurisdictions. These changes include allowances for MnDOT to pay the full price for warranted sidewalks, bikeways, and lighting, and share more of the cost of pedestrian and bicycle grade separated crossings. These improvements depend on the availability of increasingly limited funds. It is important that MnDOT continue to examine and review cost sharing agreements (including maintenance) with local jurisdictions to facilitate adoption of complete streets.
PART II CHAPTER 4: SMTP ASSESSMENT: HEALTHY COMMUNITIES OCTOBER 2016

PAGE 98 PAGE 98
Transportation Management OrganizationsIn 2007, MnDOT and the Metropolitan Council were awarded federal funds to work with regional partners to reduce congestion. The partners included the City of Minneapolis, the University of Minnesota, the Minnesota Valley Transit Authority, and Transportation Management Organizations (TMOs). The Urban Partnership Agreement focused on reducing congestion by improving transit infrastructure and flow, dynamic pricing strategies on freeways, improving technology (e.g., real-time information signs, GPS on buses, intersection control technology), and telecommuting programs. While the goal was to reduce congestion in a limited area, this partnership could be utilized to encourage active transportation.
TMOs in particular can work with local businesses to develop telecommuting programs, vanpool and ridesharing strategies, walk/bike promotions, and shuttle services to/from transit hubs. Increased collaboration with the private sector can help reduce or eliminate trips taken by private automobile, especially in areas where transit services may be limited.
4.5 CONCLUSIONThe proposed revisions to the SMTP open new opportunities for MnDOT and its partners to promote health. This objective area continues to evolve, identifying new ways to include communities in the decision-making process while looking forward to national and global trends that can affect the environment, economic vitality, and health of Minnesota’s residents.
As MnDOT considers the next iteration of Context-Sensitive Solutions, it is important to consider the relationship between transportation projects and the communities they serve. MnDOT has a responsibility to engage early, often, and in earnest with communities to not only assess the physical context of a transportation project, but to understand its potential impacts on the social determinants of health. A Community-Sensitive Framework may increase transparency, ensure projects reflect community needs, and share power with those who will be most impacted by transportation projects.
From the local to global context, climate change poses a severe threat to the health and safety of all travelers. Recognizing the important role of the transportation sector in society, both adaptation and mitigation
MDH MNDOT SMTP HEALTH IMPACT ASSESSMENT

PAGE 99 PAGE 99
strategies are critical for future planning. Increasingly frequent severe weather events can be problematic for all travelers trying to reach homes, jobs, or even health care services.
Finally, active transportation can substantially increase levels of regular physical activity. The health benefits of physical activity have been well documented and apply to walking and biking. Studies indicate that the health benefits of active transportation exceed associated risks of injury and exposure to air pollution. Developing policies and programs that increase walking and biking is challenging; individuals’ decisions to walk or bike are not only determined by their personal needs, preferences and attitudes, but also by a complex mix of physical and socioeconomic determinants. Policies that improve access to public transit can increase active transportation modes, while policies that make car use less attractive can increase the competitiveness of active transportation modes.
Although there are considerable demographic complexities related to barriers and supports for walking and biking, the evidence supports the conclusion that efforts to increase access to active transportation are warranted due to the substantial health, environmental and economic benefits to be gained.
PART II CHAPTER 4: SMTP ASSESSMENT: HEALTHY COMMUNITIES OCTOBER 2016
PAGE 100 PAGE 100
4.6 RECOMMENDATIONS
01 Work with the Minnesota Environmental Quality Board
(EQB) and the Minnesota Pollution Control Agency to identify effective strategies to reduce air pollution and greenhouse gas emissions to meet the Next Generation Energy Act goals. In addition, MnDOT should support complementary policies outside of the transportation sector that can further facilitate the reduction of GHG emissions. For example, smart-grid energy policies can make it easier for consumers to drive electric vehicles. Explicitly name climate change as a department-wide top priority.
See 2017 SMTP Proposed Performance Measures: Annual greenhouse gas emissions from the transportation sector (target: 29.5 million metric tons CO2-e by 2025).
02 Work with state and local partners to complete climate change
vulnerability assessments. These assessments should continue MnDOT’s efforts to plan for flooding, mudslides, extreme heat, pollen, and other climate-related impacts on transportation systems.
See 2017 SMTP Work Plan: Identify vulnerabilities and assess risks to the transportation system.
03 Continue to work toward shifting travelers to active transportation
modes by providing convenient, safe, and connected walking, biking and transit infrastructure. While there are many effective strategies to achieve mode shift, nearly all will require increased investment in pedestrian and bicyclist infrastructure. Strategies may include the following:
• Continue to support complete streets and Safe Routes to School initiatives throughout the state;
• Collaborate with Transportation Management Organizations that can connect employees to public transit hubs, offer incentive programs, and implement other transportation demand management programs;
• Work with the Department of Natural Resources and private foundations to convert abandoned railroad beds into paved bicycle paths; and
• Offer free transit rides during severe weather events.
See 2017 SMTP Proposed Performance Measures: Annual percent of MnDOT omnibus survey respondents perceiving safe environments for bicycling/walking.
>>
>>
>>
MDH MNDOT SMTP HEALTH IMPACT ASSESSMENT

PAGE 101 PAGE 101
04 Develop context guidance for transportation projects that
includes health determinant data and community engagement best practices. Health determinant information can include, but should not be limited to, park districts, TOD zones, school walk/bike zones, pedestrian priority areas, green streets, and areas of concentrated poverty or wealth. As part of a proposed Community-Sensitive Framework, these elements can strengthen the human component of current Context Sensitive Design approaches. MnDOT should continue to document the process and implementation of incorporating context into transportation planning and design, as well as the community engagement practices that enrich those decisions.
See 2017 SMTP Work Plan: Develop tools and resources to support transportation decisions that reflect the surrounding context.See 2017 SMTP Work Plan: Provide more continuous engagement with partners and the public.See 2017 SMTP Work Plan: Develop and update new, more inclusive public engagement resources.
05 As a work plan item, explore the potential utility of the Integrated
Transport and Health Impacts Model to assess, quantify, and message around the health benefits of transportation projects that influence mode choice.
See 2017 SMTP Work Plan: Refine the methodology used for calculating return on investment.
06 Performance measures based on traffic delays or congestion can
undercut efforts to shift Minnesotans to more active modes of transportation. As MnDOT considers new performance measures, they should focus on reliability and total number of trips generated, with the goal of reducing single-occupancy automobile trips.
See 2017 SMTP Proposed Strategy: Identify and give priority to infrastructure improvements, services and education that increase the number of people who bicycle, walk and take transit.
>>
>>
>>
>>
>>
PART II CHAPTER 4: SMTP ASSESSMENT: HEALTHY COMMUNITIES OCTOBER 2016
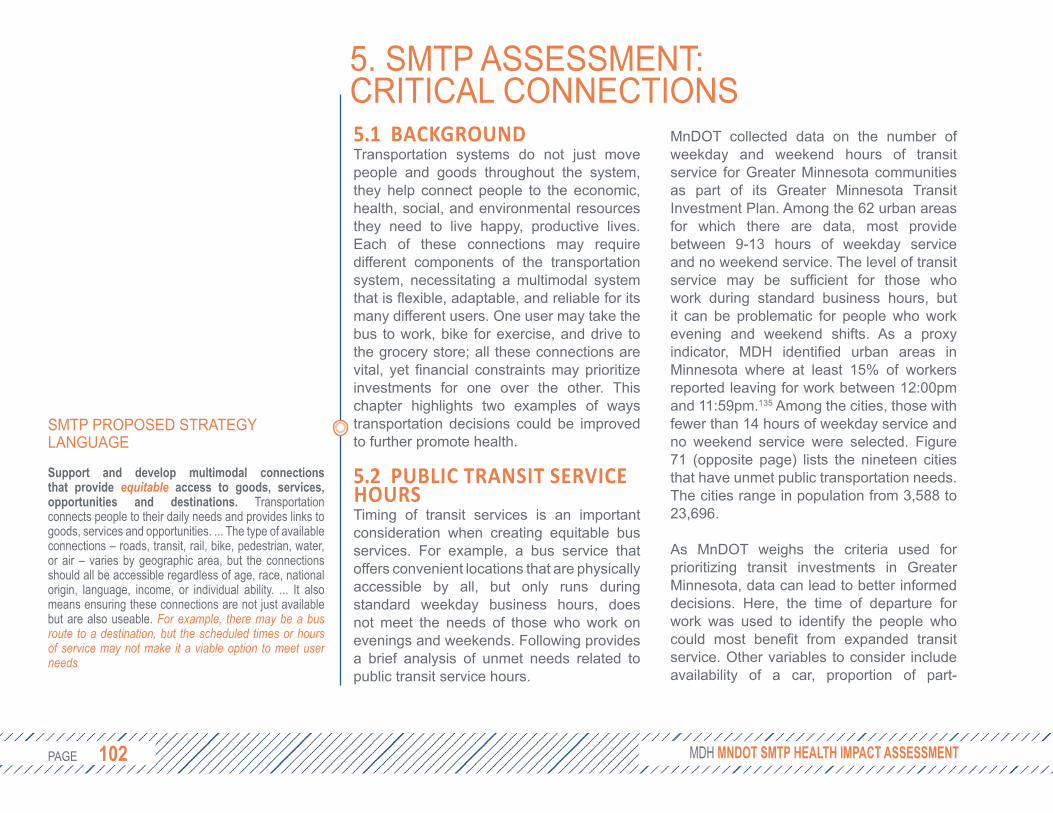
PAGE 102 PAGE 102
5. SMTP ASSESSMENT: CRITICAL CONNECTIONS5.1 BACKGROUNDTransportation systems do not just move people and goods throughout the system, they help connect people to the economic, health, social, and environmental resources they need to live happy, productive lives. Each of these connections may require different components of the transportation system, necessitating a multimodal system that is flexible, adaptable, and reliable for its many different users. One user may take the bus to work, bike for exercise, and drive to the grocery store; all these connections are vital, yet financial constraints may prioritize investments for one over the other. This chapter highlights two examples of ways transportation decisions could be improved to further promote health.
5.2 PUBLIC TRANSIT SERVICE HOURSTiming of transit services is an important consideration when creating equitable bus services. For example, a bus service that offers convenient locations that are physically accessible by all, but only runs during standard weekday business hours, does not meet the needs of those who work on evenings and weekends. Following provides a brief analysis of unmet needs related to public transit service hours.
MnDOT collected data on the number of weekday and weekend hours of transit service for Greater Minnesota communities as part of its Greater Minnesota Transit Investment Plan. Among the 62 urban areas for which there are data, most provide between 9-13 hours of weekday service and no weekend service. The level of transit service may be sufficient for those who work during standard business hours, but it can be problematic for people who work evening and weekend shifts. As a proxy indicator, MDH identified urban areas in Minnesota where at least 15% of workers reported leaving for work between 12:00pm and 11:59pm.135 Among the cities, those with fewer than 14 hours of weekday service and no weekend service were selected. Figure 71 (opposite page) lists the nineteen cities that have unmet public transportation needs. The cities range in population from 3,588 to 23,696.
As MnDOT weighs the criteria used for prioritizing transit investments in Greater Minnesota, data can lead to better informed decisions. Here, the time of departure for work was used to identify the people who could most benefit from expanded transit service. Other variables to consider include availability of a car, proportion of part-
MDH MNDOT SMTP HEALTH IMPACT ASSESSMENT
SMTP PROPOSED STRATEGY LANGUAGE
Support and develop multimodal connections that provide equitable access to goods, services, opportunities and destinations. Transportation connects people to their daily needs and provides links to goods, services and opportunities. ... The type of available connections – roads, transit, rail, bike, pedestrian, water, or air – varies by geographic area, but the connections should all be accessible regardless of age, race, national origin, language, income, or individual ability. ... It also means ensuring these connections are not just available but are also useable. For example, there may be a bus route to a destination, but the scheduled times or hours of service may not make it a viable option to meet user needs
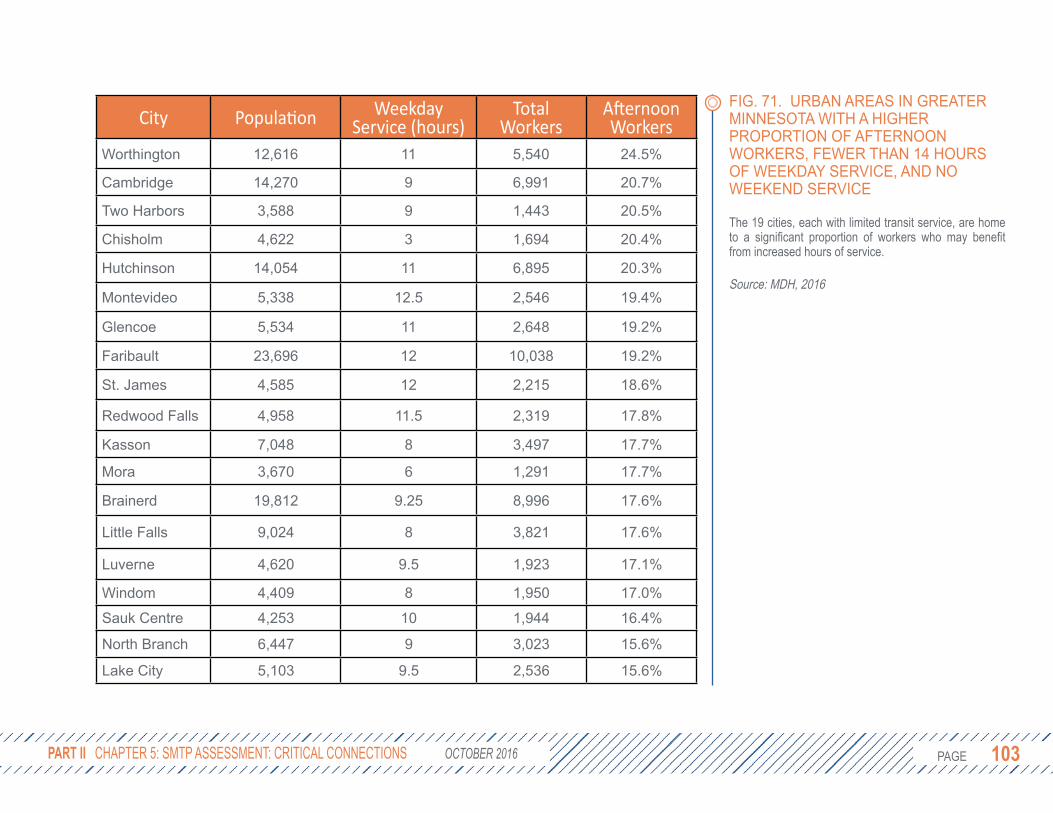
PAGE 103 PAGE 103 PART II CHAPTER 5: SMTP ASSESSMENT: CRITICAL CONNECTIONS OCTOBER 2016
FIG. 71. URBAN AREAS IN GREATER MINNESOTA WITH A HIGHER PROPORTION OF AFTERNOON WORKERS, FEWER THAN 14 HOURS OF WEEKDAY SERVICE, AND NO WEEKEND SERVICE
The 19 cities, each with limited transit service, are home to a significant proportion of workers who may benefit from increased hours of service.
Source: MDH, 2016
City Population Weekday Service (hours)
Total Workers
Afternoon Workers
Worthington 12,616 11 5,540 24.5%
Cambridge 14,270 9 6,991 20.7%
Two Harbors 3,588 9 1,443 20.5%
Chisholm 4,622 3 1,694 20.4%
Hutchinson 14,054 11 6,895 20.3%
Montevideo 5,338 12.5 2,546 19.4%
Glencoe 5,534 11 2,648 19.2%
Faribault 23,696 12 10,038 19.2%
St. James 4,585 12 2,215 18.6%
Redwood Falls 4,958 11.5 2,319 17.8%
Kasson 7,048 8 3,497 17.7%
Mora 3,670 6 1,291 17.7%
Brainerd 19,812 9.25 8,996 17.6%
Little Falls 9,024 8 3,821 17.6%
Luverne 4,620 9.5 1,923 17.1%
Windom 4,409 8 1,950 17.0%
Sauk Centre 4,253 10 1,944 16.4%
North Branch 6,447 9 3,023 15.6%
Lake City 5,103 9.5 2,536 15.6%
PAGE 104 PAGE 104
time workers, and transportation cost as a percentage of income. A variety of information can advance conversations about what it means to “right size” a transportation system and support strategies that promote equitable economic development and job opportunities in Minnesota.
5.3 IDENTIFYING COSTS AND BENEFITSTerms such as return on investment, cost efficient, and low cost/high benefit belie the underlying assumption about which costs and benefits are being considered. Transportation decisions can have strong impacts on communities’ access to jobs, healthy food, green space, recreation, art, housing, and healthcare facilities, yet these impacts are not always reflected in fiscal terms. Similarly, the costs of transportation projects are not limited to a dollar figure. When Interstate 94 was built over the Rondo neighborhood, the true cost of the project can still be felt today in the loss of community cohesion and trust in state agencies. Specifying the factors included when calculating costs and benefits could increase the transparency and equity of the decision-making process.
One model used to better estimate certain costs and benefits of transportation projects is the Integrated Transport and Health Impacts
Model (ITHIM). ITHIM was developed to model changes in disability adjusted life years (DALYs) resulting from changes in exposure to air pollution, road traffic injury risk, and physical activity.62 ITHIM uses fourteen data points on travel time, mode, and distance; physical activity levels; demographics; and health status. It then uses a comparative risk assessment methodology to estimate user-defined changes in the physical activity levels for the population.
The model has been used in Nashville, Tennessee to estimate and monetize the health benefits of increasing physical activity through active transportation. In 2013 Tennessee was ranked 49th in the nation for meeting aerobic physical activity guidelines and had the 4th highest prevalence of obesity (33.7%). In response, the Nashville Area Metropolitan Planning Organization used ITHIM to estimate the health benefits of increased physical activity in the Nashville metro area. In Nashville, 10 additional minutes of active transportation per person per week (moderate scenario, Figures 72-73, opposite) would avert an estimated 188 deaths and 5,662 disability adjusted life years. The health benefits were then monetized into avoided costs, including medical expenses and lost productivity. The project helped Nashville factor in the economic benefits of physical activity into their cost calculations.
MDH MNDOT SMTP HEALTH IMPACT ASSESSMENT
SMTP PROPOSED STRATEGY LANGUAGE
Define priority networks for all modes based on connectivity and access to destinations and integrate the networks into decision-making. ... For transit systems, the priority is to meet minimum service guidelines, which quantify the number of hours a transit agency provides service during weekdays and weekends based on the community’s size, demographics, and unique needs, especially of transit-dependent populations.
SMTP PROPOSED STRATEGY LANGUAGE
Identify and prioritize multimodal solutions that have a high return on investment. Selecting investments and operational strategies that have a high return on investment demonstrates sound management of limited resources. Calculating return on investment is not limited to only financial considerations. It also includes health, social, economic and environmental factors such as safety, noise, travel time, vehicle operating costs, surrounding land use and context, air quality, and wetland impacts.

PAGE 105 PAGE 105 PART II CHAPTER 5: SMTP ASSESSMENT: CRITICAL CONNECTIONS OCTOBER 2016
FIG. 72 & 73. A MODERATE INCREASE IN PHYSICAL ACTIVITY AMONG RESIDENTS OF NASHVILLE WOULD HAVE SIGNIFICANT OVERALL HEALTH AND ECONOMIC BENEFITS
The results of the Integrated Transport and Health Impacts Model show long-term health benefits from increased physical activity that outweigh potential increases in the number of pedestrian and bicyclist collisions.
Adapted from: Meehan, L. & Whitfield, G. (2015). Calibrating the ITHIM Tool in Nashville Tennessee (presentation).

PAGE 106 PAGE 106
5.3.1 ADVERTISING REVENUETransit agencies often rely on advertising revenue to support transit services that may otherwise be cost prohibitive to users. One of the most successful advertising opportunities is to wrap a train car or bus, creating a moving billboard that can create millions of impressions each month. The service, which costs about $20,000 and runs for at least 12 weeks,136 also creates a critical opportunity to promote healthy behaviors. Metro Transit trains have advertised health care and health insurance providers, academic institutions, and public safety campaigns. However, they have also featured advertisements for beer and wine, creating contradictory messages (Figure 74, opposite).
While Metro Transit does have a policy against advertising alcoholic beverages, it includes exemptions for beer and wine, which must include a responsible drinking message.137 An analysis of alcohol industry magazine ads found that 88% of responsibility messages served to reinforce promotion of the advertised product, failing to provide any information about what it means to drink responsibly.138 These advertisements can be particularly influential on students. In a study of the Boston’s transit system, alcohol ads reached 43% of the rider population (over 1.2 million impressions), including 54%
of public school student riders.139 In 2015, Metro Transit reported nearly 4 million rides by students in the Twin Cities, about 4.7% of all rides, demonstrating the broad reach among youth of advertisements. This does not include impressions made on non-riders who see the bus or train pass by.
Alcohol plays a substantial role in motor vehicle crashes, one of the leading causes of death among youth. The CDC estimates 38 child and adolescent (0-19 years) deaths each year in Minnesota can be attributed to alcohol use, including 14 motor vehicle fatalities. Among all age groups, alcohol is responsible for 159 motor vehicle fatalities per year in Minnesota.140 The costs to society of underage drinking extend far beyond fatalities. In 2010, underage drinking cost Minnesota approximately $391 million in health care costs, lost labor/productivity, increased crime, motor vehicle crashes, and other costs.141 A review of longitudinal studies provides strong, consistent evidence that exposure to alcohol ads impacts subsequent alcohol use by adolescents.142 In one 2006 study, researchers found that a one-third reduction in advertising would reduce alcohol-related mortality by about 4%.143
MDH MNDOT SMTP HEALTH IMPACT ASSESSMENT
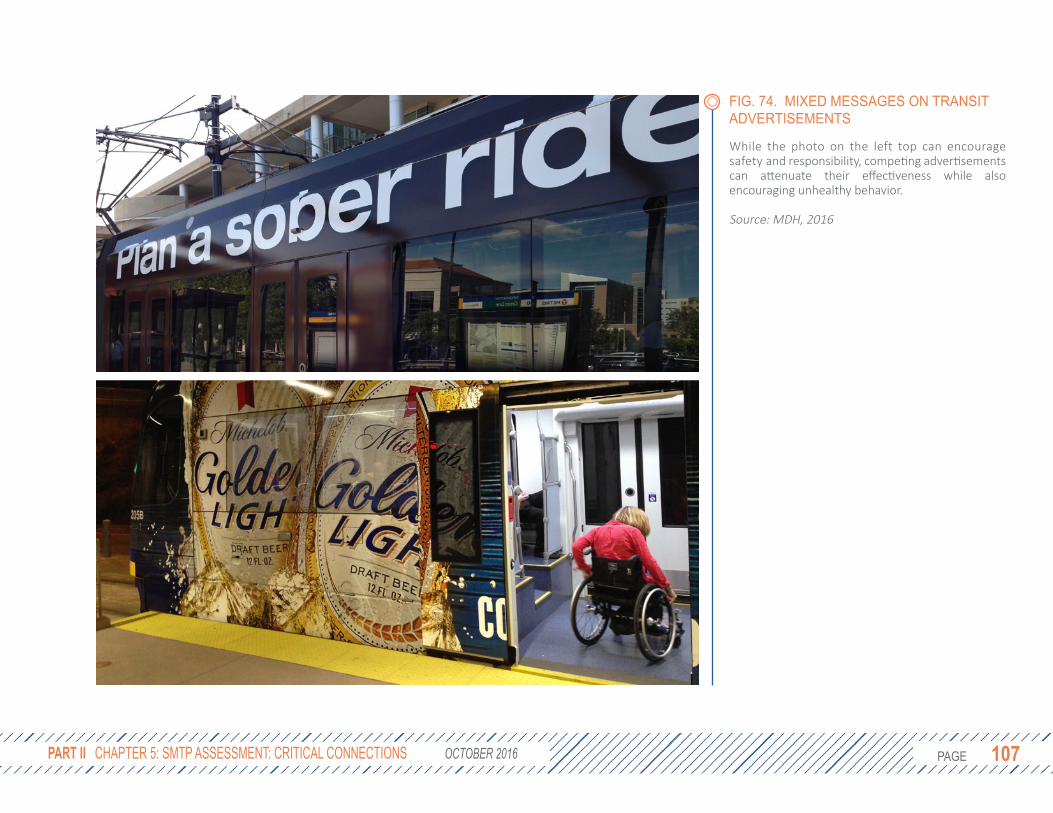
PAGE 107 PAGE 107
While the photo on the left top can encourage safety and responsibility, competing advertisements can attenuate their effectiveness while also encouraging unhealthy behavior.
Source: MDH, 2016
PART II CHAPTER 5: SMTP ASSESSMENT: CRITICAL CONNECTIONS OCTOBER 2016
FIG. 74. MIXED MESSAGES ON TRANSIT ADVERTISEMENTS
PAGE 108 PAGE 108
COMPLEMENTARY POLICY: UNIVERSAL IGNITION INTERLOCK DEVICESIgnition interlock devices require a driver to successfully pass a breathalyser test before the car may start. In Minnesota, first-time alcohol offenders with an alcohol concentration of 0.16 or greater and all second-time offenders have the option to regain driving privileges by participating in the Minnesota Ignition Interlock Device Program. This allows individuals to continue to travel for work or daily activities when sober. The CDC currently recommends universal application of these devices to all drunk-driving convictions.144 In a recent study, states with universal interlock requirements had 15% fewer alcohol-involved crash deaths compared to states with less stringent requirements.145
Requiring a proportion of revenue from alcohol advertisements to fund an expansion of the ignition interlock device program may be one way to reduce fatalities and deter transit agencies from seeking alcohol advertisements.
Other metropolitan transit agencies have restricted alcohol advertisements, to varying degrees. The Chicago Transit Authority (CTA) does not permit advertisements for alcohol on any buses, on rail stations with increased student ridership, and on no more than 15 exterior rail car pairs or 9.99% of total advertising space available. In a survey of 32 major metropolitan transit agencies, about half explicitly ban alcohol advertising, including Seattle, San Francisco, Boston, and Philadelphia.146
Even in cities where a ban is in place, it may not extend to all jurisdictions. For example, Massachusetts Bay Transit Authority currently bans alcohol advertisements, but the City of Boston does not. In some cases, bus shelters and benches may not be owned by the transit authority and subject to its policies. Among four transit agencies that allow alcohol advertisements for which financial data were available (Boston, Denver, Pittsburgh, and Portland), alcohol made up less than 10% of the agency’s ad revenue and far below 1% of its total operating revenue. While similar data were not available for Metro Transit, if a similar scenario was assumed, alcohol advertisement revenue would be approximately $3 million. This is likely an overestimation, as the Metro Transit budgeted $3.85 million in 2014 for total
MDH MNDOT SMTP HEALTH IMPACT ASSESSMENT

PAGE 109 PAGE 109
Societal costs of alcohol outweigh alcohol ad revenue.
Source: Sacks, Gonzales, Bouchery, Tomedi, & Brewer, 2015; MetCouncil
advertising revenue.136 If $3 million were to be absorbed by riders, fares would increase by less than four cents per trip.
In addition to media advertisements, promotional events have also been sponsored by alcohol companies, including free transit rides on St. Patrick’s Day and New Year’s Eve, two holidays that have seen predictable increases in the number of crashes and deaths due to alcohol-impaired driving. On these days, Metro Transit provides free transit rides sponsored by alcohol companies. According to their own analysis, ridership on St. Patrick’s Day increased by 19.5% over baseline estimates from 2012-2016. It is not clear how much of this increase is directly attributable to the price promotion, although research has shown that riders are sensitive to changes in price.90 While some users may have taken transit regardless of price, for others the promotion may have spurred them to reconsider their transportation options. It is not known whether these latter users would have otherwise driven, walked, taken a taxi, or traveled by some other mode.
If all the increased ridership occurred during the promotional period (after 6:00pm) at a value of $1.75 per ride (ignoring users with unlimited ride passes or who would not otherwise pay extra), $73,000 in free rides
were provided per year on average. While not inconsequential, this number is dwarfed by the roughly $300 million per year operating budget. For comparison, in 2014 the average economic cost to Minnesota was $62,000 per alcohol-related crash,147 meaning about one crash would need to be prevented per year to cover lost revenue (although Metro Transit would not be reimbursed directly). It is also important to note that this is a unique and valuable opportunity for a sponsor to be identified with messages of both safety and free transportation. Other potential sponsors, such as foundations, health insurance agencies, and public safety campaigns may be interested in sponsoring these promotional events in place of alcohol companies.
Despite the strong research supporting a link between alcohol advertisement and use, the substantial societal costs of underage drinking, and the relatively modest revenue generated, transit agencies may still feel compelled to use alcohol ads to close gaps in federal and local funding. This represents a market failure in which transit agencies are asked “to pay” (in reduced ad revenue) for societal benefits (reduced alcohol-related costs) that do not benefit them. In other words, transit agencies do not see the economic returns of banning alcohol ads. Increased advertising by insurance companies (that
PART II CHAPTER 5: SMTP ASSESSMENT: CRITICAL CONNECTIONS OCTOBER 2016
FIG. 75. ALCOHOL COSTS
PAGE 110 PAGE 110
benefit from reduced alcohol-related health risks) may be one approach to correcting the market failure. Additionally, there is an opportunity cost to allowing alcohol advertisements. Instead, MnDOT could help transit agencies generate ad revenue through innovative messaging that promotes health, safety, and community. Additionally, MnDOT could create model policy language on banning alcohol advertising and track adoption of policies by the 70 public transit systems in Minnesota.
5.4 CONCLUSIONIdeally, a strong, equitable transportation system provides all Minnesotans with access to jobs, education, social services, recreation, and other connections essential for a high quality of life. Minnesota is advancing toward this vision, but financial constraints increasingly exert pressure to prioritize short-term economic gains. A utilitarian prioritization of projects may serve the greatest number of people, but perhaps not those who could benefit most. By applying a long-term, health-centric approach, transportation planners can better understand the costs borne by society that are difficult yet essential to account for in order to make responsible investments.
MDH MNDOT SMTP HEALTH IMPACT ASSESSMENT

PAGE 111 PAGE 111
5.5 RECOMMENDATIONS
01 Over the next four years, MnDOT should consider exploring the
potential utility of new models and tools that capture the social and health benefits and costs of transportation projects. This may include Health Impact Assessment, the Integrated Transport and Health Impacts Model, Social Return on Investment (SROI), and multiple mini cost-benefit analyses for different stakeholder groups (e.g., government agencies, community, or environment). These models can quantify in economic terms the financial, environmental, and social impacts of transportation projects. Further analysis can attribute the costs and benefits by stakeholder group.
See 2017 SMTP Work Plan: Refine the methodology used for calculating return on investment.
02 Given limited resources, MnDOT must constantly weigh costs and
benefits in order to prioritize investments. To better inform this process and advance an equitable transportation system, MnDOT should consider demographic and health data in order to ensure systems are accessible and available to serve the range of needs of a community. This may include data on evening and weekend employment, car availability, and transportation cost-
burdened households. Engaging those most dependent on multimodal transportation systems in the planning and decision-making process can further help identify and support critical connections.
See 2017 SMTP Proposed Performance Measures: Average annual number of jobs accessible within a 30-minute transit commute during AM peak.
03 MnDOT should work with transit agencies, the Metropolitan
Council, and cities to review and revise transit agencies’ formal policies to ban alcohol advertisements on transit property by 2020. This ban should extend to contracts with advertising corporations and other contractors. Enforcement protocols should include fines and publicly-available data on alcohol advertisement revenue. MnDOT, as a government agency, shares responsibility for protecting Minnesotans from harm caused by alcohol consumption, especially in youth populations. The relatively modest gains in operating revenue are dwarfed by the potential costs to society of alcohol-related health impacts. Adoption of model policies by public transit systems should be tracked as a performance indicator. State legislators could consider further action by banning alcohol advertisements on all state-owned property.
See Also: MnDOT Greater Minnesota Transit Investment Plan
>>
>>
>>
PART II CHAPTER 5: SMTP ASSESSMENT: CRITICAL CONNECTIONS OCTOBER 2016
PAGE 112 PAGE 112
6. SMTP ASSESSMENT: EQUITYAdvancing equity is key to Minnesota reaching its full potential as a state where everyone can be happy, successful, and healthy. Throughout the revisions of the SMTP, equity was brought up numerous times by each of the work groups. In recognizing the importance of considering equity in long-term plans, MnDOT has taken a significant step toward building a transportation system that is just, fair, and equitable. This section of the HIA defines equity, identifies places in the draft SMTP that support equity, and suggests activities that promote a more equitable and healthy transportation system.
6.1 EQUITY VS EQUALITYGovernment has a responsibility to help ensure every Minnesotan has the opportunity to flourish and reach their full potential. A common approach is to treat everyone the same, distributing resources equally. For example, public school education is available to all children in a community, with established quality standards. Despite seemingly equal treatment, graduation rates vary greatly by race and ethnicity. While equality focuses on treating everyone the same, equity focuses instead on treating everyone fairly. This includes a recognition that not everyone is starting on even footing. To ensure homeless or highly mobile youth can still receive a
quality education, additional resources are afforded to meet their transportation needs and keep them in the same school if possible. An equitable system is one in which everyone has a chance to reach their full potential, regardless of race, sexual orientation, gender, religion, income, origin of birth, or any other socially constructed barrier.
In Figure 76 (opposite), there are three individuals that each receive an equal size box to stand on, yet the outcome disproportionately favors the taller person. A more equitable solution would be to provide each person with a box sized appropriately to allow all three to see over the fence.
Equity challenges the existing ethical framework used to make decisions. Many public agencies try to maximize the use of limited resources by achieving the greatest good for the greatest number of people. For example, if most people drive to work, ensuring that the roads are in good condition and not congested may benefit the most number of people; however, this utilitarian approach does not benefit everyone equally, particularly people who may not have the financial resources to own a car. An equitable approach would be to distribute resources to maximize the benefit to those most in need. This approach may allocate more funding
MDH MNDOT SMTP HEALTH IMPACT ASSESSMENT

PAGE 113 PAGE 113 PART II CHAPTER 6: SMTP ASSESSMENT: EQUITY OCTOBER 2016
FIG. 76. ILLUSTRATION OF EQUALITY VS. EQUITY
While equality focuses on treating everyone the same, equity focuses instead on treating everyone fairly. Government has a responsibility to ensure every Minnesotan has the opportunity to flourish. Inherent in this responsibility is a focus on creating a equitable systems in which everyone has a chance to reach their full potential, regardless of race, sexual orientation, gender, religion, income, origin of birth, or any other socially constructed barrier.
The top depiction shows the outcome of treating everyone the same, where resources are distributed equally. This ends up benefiting some while disadvantaging others.
The middle depiction illustrates individual equity, where resources are distributed according to need with the aim of granting equal access. This results in a more fair and just outcome, where everyone has the opportunity to flourish.
The bottom depiction show systemic equity, where all people have access to achieve the same outcome without the need for additional accommodations because the systemic barrier (cause of the inequity) was removed.
Source: MDH, 2016

PAGE 114 PAGE 114
toward transit to provide greater access to job opportunities for low-income families.
6.1.1 INCLUDING HEALTH EQUITY IN HIAIn 2014 MDH examined inequities in the health of Minnesotans, summarized in the Advancing Health Equity report to the legislature. This report specifically named structural racism as an underlying driver of health inequities in Minnesota, while recognizing that there are many other contributing factors, such as discrimination based on gender, sexual orientation, income, education, and race. In an effort to move toward a state in which all people can reach their full health potential, HIA can further describe how policies, plans, and projects contribute toward or help alleviate health inequities. Health equity is addressed throughout this HIA. Following are the sections of the HIA that specifically concern equity.
Baseline Assessment Chapter 2The baseline assessment summarizes the demographics, travel behaviors, and the health status of Minnesotans, pointing out when possible the differences in social, economic, and environmental conditions in
which people live.• All regions of Minnesota can expect to
see continued growth of both minority and elderly populations, requiring our transportation system to adapt to accommodate their distinct needs.
• People of color are less likely to make at least $15 per hour compared to whites, even when they have the same level of education. There is a pattern of concentration of low- and high-income households at both local and regional levels.
• Minnesota’s students of color graduate at lower rates compared to their white peers.
• Homelessness continues to disrupt families who often also face significant transportation challenges.
• Families of color have less access to a private vehicle compared to white families.
• Low-income and people of color rely more on transit, walking, and biking than whites, yet often feel less safe doing so.
• Women are underrepresented among commuters who bike.
• Life expectancy can vary greatly from neighborhood to neighborhood and is associated with income and race. Infant mortality and other adverse birth outcomes are much more likely for
MDH MNDOT SMTP HEALTH IMPACT ASSESSMENT
PAGE 115 PAGE 115
mothers of color.• Chronic diseases, including diabetes,
obesity, and cardiovascular disease, continue to disproportionately burden Minnesotans of color.
• Some communities in Minnesota have less access to healthy food.
Safety from Crime Section 3.3 – Transportation SafetyFear for personal safety can play a strong role in where people go and how they get there. This can vary greatly from neighborhood to neighborhood depending on many factors, including the design of the urban environment and the level of investment in safe biking and walking.
Racial Profiling Section 3.4 – Transportation SafetyOne strategy to improve safety is to enforce the rules and laws that govern transportation systems. To advance equity, transportation and law enforcement agencies must work together to ensure that no one group or community is targeted due to their race or ethnicity.
Maintenance of Pedestrian Routes Section 3.5 – Transportation SafetySevere weather, including flooding and heavy snow, can impact all modes of transportation. Route clearing should be done in ways that
do not burden other modes of transportation, such as when snow plows block curb cuts and make sidewalks impassable for people with disabilities.
Community-Sensitive Framework Section 4.2 – Healthy CommunitiesTwo aspects of the proposed Community-Sensitive Framework tie directly to equity. First, this approach emphasizes strong community engagement that is appropriate to the scale and nature of the project. Second, the framework suggest identifying areas of both concentrated poverty and wealth.
Active Transportation Section 4.4 – Healthy CommunitiesIncreasing the safety, accessibility, and availability of transit, biking, and walking routes will benefit those who have limited access to cars, including many low-income households and communities of color. These communities would also benefit the most from a health perspective as they frequently have fewer opportunities to engage in physical activity and are disproportionately burdened by chronic disease.
Public Transit Service Hours Section 5.2 – Critical ConnectionsIn Greater Minnesota, transit hours are typically less than 10 hours per week with no weekend service. This may serve those with
PART II CHAPTER 6: SMTP ASSESSMENT: EQUITY OCTOBER 2016

PAGE 116 PAGE 116
jobs during standard 9-5 business hours, but there are many low-wage workers with shifts outside of these limited hours that may benefit the most from accessible transit service.
6.1.2 EQUITY IN THE SMTPNumerous aspects of the transportation system have impacts on equity. Below is a list of specific mentions of equity in the draft 2017 SMTP, although there are many other proposed changes that could impact equity in Minnesota.
Trend Analysis Chapter 3 Some of the first steps in the SMTP revision process included looking at how Minnesota is changing. The SMTP describes changes in demographics, travel behaviors, the environment, the economy, and technology. One of the trends describes racial disparities and equity in Minnesota, noting that “Advancing equity in Minnesota is critical to the health and well-being of the state. It is critically important to make sure that all people have access to a healthy and prosperous future.”
Objectives Chapter 6 Of the five objectives of the SMTP, two were re-framed in the 2017 revision to include equity. The following changes were made to the “What this is about” section that describes the purpose and scope of that objective.
• Open Decision-Making now emphasizes the process by which decisions are made, with important considerations of “socio-economic equity and individual ability,” as well as strong engagement with affected communities allowing opportunities for the public to influence decisions.
• Health Communities focuses on the health implications of transportation decisions. It focuses on how fiscal resources are allocated to ensure projects are safer, sustainable, and tailored to the surrounding physical, economic, and human context. This objective seeks to “ensure that Minnesota is advancing equitable
MDH MNDOT SMTP HEALTH IMPACT ASSESSMENT
PAGE 117 PAGE 117
access to opportunities.”Strategies Chapter 6 The 2017 revision focuses heavily on revising the strategies for achieving each of the five objectives. While many strategies could have impacts on equity, four included equity in the title or description (abridged below in italics). Full descriptions are available in the SMTP under the objective name in parenthesis.
1. Support and develop multimodal connections that provide equitable access to goods, services, opportunities and destinations (Critical Connections).
2. Support and implement approaches that preserve Minnesota’s natural resources, avoid causing environmental harm, and improve environmental quality. ... Minimizing negative impacts from the transportation system in [communities of color and low-income households] is an important aspect of advancing equity through the transportation system (Healthy Communities).
3. Support economic vitality and create and maintain jobs through transportation infrastructure investments. ... A particular focus should be placed on ensuring that economic development activities work to advance equity for all people in
Minnesota (Healthy Communities).4. Plan, design, develop, and maintain
transportation infrastructure and facilities in a way that reflects and is informed by the surrounding context. ... The principles of context sensitive solutions should guide plans and projects to address environmental, economic and social needs while involving a broad range of stakeholders, advancing equity and creating lasting value for communities (Healthy Communities).
Work Plan Items Chapter 7 Some topics or challenges that arose during the SMTP revision require additional time and resources to fully address. These items are added to MnDOT’s four-year work plan. Below are the titles of two proposed work plan items that address equity. Additional information on each can be found in the SMTP.
1. Study how transportation affects equity and identify transportation strategies and approaches that will meaningfully reduce disparities.
2. Pilot tools and strategies to better incorporate equity into project-level decision-making.
PART II CHAPTER 6: SMTP ASSESSMENT: EQUITY OCTOBER 2016
PAGE 118 PAGE 118
6.2 RECOMMENDATIONSMnDOT has made significant strides to include equity considerations in Minnesota’s transportation system. Continuing the work in this area will strengthen communities and promote health equity. The following recommendations encourage MnDOT to advance a vision for an equitable and healthy transportation system.
01 Define what equity means in transportation, and include
transportation equity in the Minnesota GO Vision. As a first step, MnDOT should continue to detail what an equitable transportation system looks like. Ensure that MnDOT’s definition of equity includes health and is consistent with MDH’s definition of health equity: a state in which all persons have the opportunity to reach their full “health potential” and be as healthy as they can. Add equity as a guiding principle of the Minnesota GO Vision.
02 Study, document, and report on inequities in Minnesota’s
transportation system and define MnDOT’s role in reducing those inequities. Over the next four years, MnDOT should evaluate their processes, policies, and practices through an equity lens, similar to MDH’s efforts summarized
in the Advancing Health Equity report to the legislature. As part of this effort, MnDOT should engage with many stakeholders, including local and regional transportation partners, MDH, and multimodal users of the transportation system, especially resource-poor communities that rely on an affordable, flexible, and reliable transportation system.
03 Prioritize investments in communities that have
faced historical disinvestment. This recommendation includes understanding past divisions caused by transportation projects, and actively working to heal those divisions. For example, the Rondo neighborhood was largely displaced with the construction of I-94 between Minneapolis and St. Paul. Repairing the damaged relationships with this community does not require dismantling the highway, but rather investing the human and financial resources to help meet their transportation needs.
The Minnesota legislature can support MnDOT’s efforts by creating dedicated funding for projects that could increase equity. Projects may include those that improve door-through-door mobility for people with disabilities, improve transit access for communities with low car ownership rates, and reduce transportation cost burdens for low-income families.
MDH MNDOT SMTP HEALTH IMPACT ASSESSMENT

PAGE 119 PAGE 119
This page intentionally left blank.
PART II CHAPTER 6: SMTP ASSESSMENT: EQUITY OCTOBER 2016

PAGE 120 PAGE 120
1. Rudolph L, Caplan J, Ben-Moshe K, Dillon L. Health in All Policies: A guide for state and local governments: American Public Health Association; 2013.
2. Minnesota Department of Health. Advancing Health Equity in Minnesota: Report to the Legislature. In; 2014.
3. Hennepin County Human Services and Public Health Department. SHAPE 2006: Adult Data Book, Survey of the Health of All the Population and the Environment. In. Minneapolis, Minnesota; 2008.
4. Minnesota State Demographic Center. Minnesota's total population, age and sex projections from 2015-2070. In; 2014.
5. Minnesota Department of Health. Poverty & Income: Facts & Figures. In; 2011.6. Gerrard M, Owen G. 2015 Minnesota Homeless Study Fact Sheet: Wilder Research;
2016.7. Sivak M. Has motorization in the US peaked? Part 2: Use of light-duty vehicles. 2013.8. Hoehner CM, Barlow CE, Allen P, Schootman M. Commuting distance, cardiorespiratory
fitness, and metabolic risk. Am J Prev Med 2012;42(6):571-8.9. PolicyLink/PERE. National Equity Atlas. In; 2014.10. Buehler R, Pucher J, Merom D, Bauman A. Active travel in Germany and the U.S.
Contributions of daily walking and cycling to physical activity. Am J Prev Med 2011;41(3):241-50.
11. Lachapelle U, Frank, L., Saelens, B.E., Sallis, J.F., and Conway, T.L. Commuting by Public Transit and Physical Activity: Where You Live, Where You Work, and How You Get There. Journal of Physical Activity and Health 2011;8(Suppl 1):S72-S82.
12. Santos A, McGuckin N, Nakamoto HY, Gray D, Liss S. Summary of travel trends: 2009 national household travel survey; 2011.
13. Levinson D, Lindsey G, Fan Y, Cao J, Iacono M, Brosnan M, et al. Travel Behavior Over Time. 2015.
14. U.S. Census Bureau. American Community Survey 2014 1-Year Estimates, Table S0804. In; 2014.
15. Goodard T, Kahn, K.B., Adkins, A. Racial Bias in Driver Yielding Behavior at Crosswalks. In: National Institute for Transportation and Communities; 2014.
16. Schroeder P and Wilbur M. 2012 National Survey of Bicyclist and Pedestrian Attitudes and Behaviors, Volume 2: Findings Report. In. Washington, DC: National Highway Traffic Safety Administration; 2013.
REFERENCES
MDH MNDOT SMTP HEALTH IMPACT ASSESSMENT
PAGE 121 PAGE 121
17. Alliance for Biking & Walking. Bicycling and Walking in the United States 2016 Benchmarking Report. Washington, DC; 2016.
18. Loukaitou-Sideris A and Eck J. Crime Prevention and Active Living. American Journal of Health Promotion 2007;21(4 Supplement):380-389.
19. Federal Highway Administration. Summary of Travel Trends: 2009 National Household Travel Survey. In: U.S. Department of Transportation, editor. Washington, DC; 2011.
20. U.S. Census Bureau. American Community Survey 2014 1-Year Estimates, Table B08006. In; 2014.
21. Frank LD, Pivo G. Impacts of mixed use and density on utilization of three modes of travel: single-occupant vehicle, transit, and walking. 1994.
22. Chen C, Gong H, Paaswell R. Role of the built environment on mode choice decisions: additional evidence on the impact of density. Transportation 2007;35(3):285-299.
23. Ewing R, Cervero R. Travel and the Built Environment. Journal of the American Planning Association 2010;76(3):265-294.
24. Litman T. Evaluating Active Transport Benefits and Costs. Victoria Transport Policy Institute. Victoria, BC: Victoria Transport Policy Institute. Retrieved from http://www. vtpi. org/nmt-tdm. pdf 2013.
25. National Highway Traffic Safety Administration. Alcohol-impaired driving. Traffic Safety Facts: 2012 Data 2013.
26. Jacobsen PL, Racioppi F, Rutter H. Who owns the roads? How motorised traffic discourages walking and bicycling. Inj Prev 2009;15(6):369-73.
27. Naumann RB, Dellinger AM, Zaloshnja E, Lawrence BA, Miller TR. Incidence and total lifetime costs of motor vehicle-related fatal and nonfatal injury by road user type, United States, 2005. Traffic Inj Prev 2010;11(4):353-60.
28. Lewis K, Burd-Sharps S. The Measure of America 2013-2014: Measure of America; 2014.29. Chetty R, Stepner M, Abraham S, Lin S, Scuderi B, Turner N, et al. The Association Between
Income and Life Expectancy in the United States, 2001-2014. Jama 2016.30. Wilder Research. The Unequal Distribution of Health in the Twin Cities. St. Paul, MN; 2010.31. Minnesota Department of Transportation. Minnesota Motor Vehicle Crash Facts. In.
Accessed 5/3/16 from https://dps.mn.gov/divisions/ots/reports-statistics/pages/crash-facts.aspx; 2014.
32. Centers for Disease Control and Prevention. Web-based Injury Statistics Query and Reporting System (WISQARS). In.
REFERENCES OCTOBER 2016

PAGE 122 PAGE 122
33. Maybury RS, Bolorunduro OB, Villegas C, Haut ER, Stevens K, Cornwell EE, et al. Pedestrians struck by motor vehicles further worsen race-and insurance-based disparities in trauma outcomes: the case for inner-city pedestrian injury prevention programs. Surgery 2010;148(2):202-208.
34. Lu MC, Halfon N. Racial and ethnic disparities in birth outcomes: a life-course perspective. Maternal and child health journal 2003;7(1):13-30.
35. Colen CG, Geronimus AT, Bound J, James SA. Maternal upward socioeconomic mobility and black-white disparities in infant birthweight. Am J Public Health 2006;96(11):2032-9.
36. Lu MC, Kotelchuck M, Hogan V, Jones L, Wright K, Halfon N. Closing the Black-White Gap in Birth Outcomes: A Life-course Approach. Ethnicity & disease 2010;20(1 0 2):S2-62-76.
37. Minnesota Department of Health. Chronic Conditions in Minnesota: New Estimates of Prevalence, Cost, and Geographic Variation for Insured Minnesotans, 2012. In: Program HE, editor. Saint Paul, MN; 2016.
38. Centers for Disease Control and Prevention. Vital signs: avoidable deaths from heart disease, stroke, and hypertensive disease-United States, 2001-2010. MMWR. Morbidity and mortality weekly report 2013;62(35):721.
39. Geiss LS, Wang J, Cheng YJ, Thompson TJ, Barker L, Li Y, et al. Prevalence and incidence trends for diagnosed diabetes among adults aged 20 to 79 years, United States, 1980-2012. JAMA 2014;312(12):1218-26.
40. Centers for Disease Control and Prevention. National diabetes statistics report: estimates of diabetes and its burden in the United States, 2014. Atlanta, GA: US Department of Health and Human Services 2014.
41. Minnesota Department of Health. Health Disparities by Racial/Ethnic Populations in Minnesota. In: Statistics CfH, editor.; 2009.
42. Minnesota Department of Health. Income, Employment, and Diabetes. In: Diabetes Program, editor.; 2016.
43. Masters RK, Reither EN, Powers DA, Yang YC, Burger AE, Link BG. The Impact of Obesity on US Mortality Levels: The Importance of Age and Cohort Factors in Population Estimates. American Journal of Public Health 2013;103(10):1895-1901.
44. Trogdon JG, Finkelstein EA, Feagan CW, Cohen JW. State‐and payer‐specific estimates of annual medical expenditures attributable to obesity. Obesity 2012;20(1):214-220.
MDH MNDOT SMTP HEALTH IMPACT ASSESSMENT

PAGE 123 PAGE 123
45. Kaiser Commission on Medicaid and the Uninsured. Overweight and Obesity Rates for Adults by Race/Ethnicity. In. Kaiser Family Foundation; 2014.
46. Danaei G, Ding EL, Mozaffarian D, Taylor B, Rehm J, Murray CJ, et al. The preventable causes of death in the United States: comparative risk assessment of dietary, lifestyle, and metabolic risk factors. PLoS Med 2009;6(4):e1000058.
47. Centers for Disease Control and Prevention. BRFSS Prevalence & Trend Data [online]. In. National Center for Chronic Disease Prevention and Health Promotion, Division of Population Health.; 2015.
48. Minnesota Department of Education. Minnesota Student Survey. In; 2013.49. Bael D, Sample J. Life and Breath: How air pollution affects public health in the Twin Cities.
In: Minnesota Pollution Control Agency, Minnesota Department of Health, editors.; 2015.50. O’Neill MS, Ebi KL. Temperature extremes and health: impacts of climate variability
and change in the United States. Journal of Occupational and Environmental Medicine 2009;51(1):13-25.
51. Meehl GA, Tebaldi C. More intense, more frequent, and longer lasting heat waves in the 21st century. Science 2004;305(5686):994-997.
52. Minnesota Department of Health. Minnesota Climate & Health Profile Report. St Paul, MN; 2015 February 2015.
53. National Highway Traffic Safety Administration. Overview: 2014 data. (Traffic Safety Facts. Report No. DOT HS 812 263). In. Washington, DC; 2016.
54. Jacobsen PL. Safety in numbers: more walkers and bicyclists, safer walking and bicycling. Injury prevention 2003;9(3):205-209.
55. Elvik R. The non-linearity of risk and the promotion of environmentally sustainable transport. Accident Analysis & Prevention 2009;41(4):849-855.
56. Whitfield G, Meehan L. Calibrating the ITHIM Tool in Nashville Tennessee. In; 2015.57. Winters M, Babul S, Becker H, Brubacher JR, Chipman M, Cripton P, et al. Safe cycling:
how do risk perceptions compare with observed risk? Canadian journal of public health 2012;103(Supplement 3):S42-S47.
58. Cho G, Rodriguez DA, Khattak AJ. The role of the built environment in explaining relationships between perceived and actual pedestrian and bicyclist safety. Accid Anal Prev 2009;41(4):692-702.
59. Krizek KJ, Forsyth, A., and Baum, L. Walking and Cycling International Literature Review Final Report. Melbourne, Victoria, Australia; 2009.
REFERENCES OCTOBER 2016
PAGE 124 PAGE 124
60. Napier MA, Brown BB, Werner CM, Gallimore J. Walking to school: Community design and child and parent barriers. Journal of Environmental Psychology 2011;31(1):45-51.
61. Weir LA, Etelson D, Brand DA. Parents' perceptions of neighborhood safety and children's physical activity. Prev Med 2006;43(3):212-7.
62. Woodcock J, Givoni M, Morgan AS. Health impact modelling of active travel visions for England and Wales using an Integrated Transport and Health Impact Modelling Tool (ITHIM). PLoS One 2013;8(1):e51462.
63. Ferrell CE, Mathur S, Meek J, Piven M. Neighborhood Crime and Travel Behavior: An Investigation of the Influence of Neighborhood Crime Rates on Mode Choice-Phase II. 2012.
64. Ferrell CE, Mathur S, Appleyard BS. Neighborhood Crime and Transit Station Access Mode choice-Phase III of Neighborhood Crime and Travel Behavio. 2015.
65. McDonald NC. The effect of objectively measured crime on walking in minority adults. American Journal of Health Promotion 2008;22(6):433-436.
66. Seefeldt V, Malina RM, Clark MA. Factors affecting levels of physical activity in adults. Sports medicine 2002;32(3):143-168.
67. Yavuz N, Welch EW. Addressing fear of crime in public space: gender differences in reaction to safety measures in train transit. Urban studies 2010.
68. Kim S, Ulfarsson GF, Hennessy JT. Analysis of light rail rider travel behavior: impacts of individual, built environment, and crime characteristics on transit access. Transportation Research Part A: Policy and Practice 2007;41(6):511-522.
69. Wolff N, Shi J, Schumann BE. Reentry Preparedness among Soon-to-be-Released Inmates and the Role of Time Served. J Crim Justice 2012;40(5):379-385.
70. Bohmert MN. The Role of Transportation Disadvantage for Women on Community Supervision. Criminal Justice and Behavior 2016:0093854816654267.
71. Clark VA. Making the most of second chances: an evaluation of Minnesota's high-risk revocation reduction reentry program. Journal of Experimental Criminology 2014;11(2):193-215.
72. Retting RA, Van Houten R. Safety benefits of advance stop lines at signalized intersections: results of a field evaluation. Institute of Transportation Engineers. ITE Journal 2000;70(9):47.
73. Dill J, Monsere CM, McNeil N. Evaluation of bike boxes at signalized intersections. Accident Analysis & Prevention 2012;44(1):126-134.
MDH MNDOT SMTP HEALTH IMPACT ASSESSMENT

PAGE 125 PAGE 125
74. Johns Hopkins Center for Injury Research and Policy. Active Design Supplement: Promoting Safety. New York City; 2013. Report No.: Version 2.
75. Rosén E, Sander U. Pedestrian fatality risk as a function of car impact speed. Accident Analysis & Prevention 2009;41(3):536-542.
76. Rosen E, Stigson H, Sander U. Literature review of pedestrian fatality risk as a function of car impact speed. Accident Analysis & Prevention 2011;43(1):25-33.
77. Rosén E, Källhammer J-E, Eriksson D, Nentwich M, Fredriksson R, Smith K. Pedestrian injury mitigation by autonomous braking. Accident Analysis & Prevention 2010;42(6):1949-1957.
78. Vlasic B. Automakers Will Make Automatic Braking Systems Standard in New Cars. The New York Times 2015 September 12, 2015.
79. National Highway Traffic Safety Administration. The Safety Impact of Right Turn on Red: Report to Congress. In: Transportation USDo, editor. Washington, DC; 1995.
80. Daniello A, Gabler H. Effect of barrier type on injury severity in motorcycle-to-barrier collisions in North Carolina, Texas, and New Jersey. Transportation Research Record: Journal of the Transportation Research Board 2011(2262):144-151.
81. Associated Press. Castile stopped 52 times by police: Was it racial profiling? Minnesota Public Radio 2016 July 9.
82. Institute on Race and Poverty, Council on Crime and Justice. Minnesota Statewide Racial Profiling Report: All Participating Jurisdictions. 2003.
83. Knab A, O'Donnell E. Sidewalks and Shared-Use Paths: Safety, Security, and Maintenance. 2007.
84. Federal Highway Administration. Pedestrian Safety Guide and Countermeasure Selection System. In. Accessed May 6, 2016 at www.pedbikesafe.org; 2013.
85. Fan Y, Guthrie AE, Levinson DM. Impact of light rail implementation on labor market accessibility: A transportation equity perspective. Journal of Transport and Land Use 2012;5(3).
86. Active Transportation Alliance. Complete Streets Complete Network: A Manual for the Design of Active Transportation, Chapter 2. Retrievied from http://activetransportationpolicy.org/node/204; 2012.
87. Minnesota Department of Commerce, Minnesota Pollution Control Agency. Greenhouse Gas Emissions Reductions. In; 2015.
88. U.S. Department of Transportation. Climate Adaptation Plan. In; 2014.
REFERENCES OCTOBER 2016
PAGE 126 PAGE 126
89. Saha S. FARS analysis of weather-related motor vehicle crashes. In: Hoppe B, editor.; 2016.
90. Schimek P. Dynamic Estimates of Fare Elasticity for U.S. Public Transit. Transportation Research Record: Journal of the Transportation Research Board 2015;2538:96-101.
91. Kunkel K, Stevens L, Stevens S, Sun L, Janssen E, Wuebbles D, et al. Regional climate trends and scenarios for the US national climate assessment. Part 3. Climate of the Midwest. NOAA technical report NESDIS 2013;142(3):82.
92. Minnesota Department of Transportation. MnDOT Flash Flood Vulnerability and Adaptataion Assessment Pilot Project. St Paul, MN. Available at http://www.dot.state.mn.us/climate/pilotproject.html.; 2014.
93. Gálan C, Domingues V. Effect of climate change on plant distribution and phenology in the Iberian Peninsula. Alergologia Immunologia 2012;9(2-3):101-103.
94. El-Qutob D, Mencia G, Fernandez-Caldas E. Recent advances in immunotherapy for allergic diseases. Recent patents on inflammation & allergy drug discovery 2014;8(1):24-35.
95. Ziska L, Knowlton K, Rogers C, Dalan D, Tierney N, Elder MA, et al. Recent warming by latitude associated with increased length of ragweed pollen season in central North America. Proceedings of the National Academy of Sciences 2011;108(10):4248-4251.
96. Ziska LH, Beggs PJ. Anthropogenic climate change and allergen exposure: the role of plant biology. Journal of Allergy and Clinical Immunology 2012;129(1):27-32.
97. Nathan RA. The burden of allergic rhinitis. In: Allergy and Asthma Proceedings; 2007: OceanSide Publications, Inc; 2007. p. 3-9.
98. Breton M-C, Garneau M, Fortier I, Guay F, Louis J. Relationship between climate, pollen concentrations of Ambrosia and medical consultations for allergic rhinitis in Montreal, 1994–2002. Science of the Total Environment 2006;370(1):39-50.
99. Quest Diagnostics. Allergies Across America - the largest study of allergy testing in the United States; 2011.
100. Huynh BT, Tual S, Turbelin C, Pelat C, Cecchi L, D'Amato G, et al. Short-term effects of airborne pollens on asthma attacks as seen by general practitioners in the Greater Paris area, 2003-2007. Prim Care Respir J 2010;19(3):254-259.
101. Minnesota Department of Health. Asthma in Minnesota: 2012 Epidemiology Report. St. Paul, MN; 2012.
MDH MNDOT SMTP HEALTH IMPACT ASSESSMENT

PAGE 127 PAGE 127
102. Calderon M, Penagos M, Sheikh A, Canonica G, Durham S. Sublingual immunotherapy for allergic conjunctivitis: Cochrane systematic review and meta‐analysis. Clinical & Experimental Allergy 2011;41(9):1263-1272.
103. Cariñanos P, Casares-Porcel M. Urban green zones and related pollen allergy: A review. Some guidelines for designing spaces with low allergy impact. Landscape and Urban Planning 2011;101(3):205-214.
104. Bergmann K, Zuberbier T, Augustin J, Mücke H, Straff W. Climate change and pollen allergy: cities and municipalities should take people suffering from pollen allergy into account when planting in public spaces. Allergo J 2012;21(2):103-7.
105. Katz DS, Carey TS. Heterogeneity in ragweed pollen exposure is determined by plant composition at small spatial scales. Science of the Total Environment 2014;485:435-440.
106. Eggleston PA. The environment and asthma in US inner cities. Chest 2007;132(5 Suppl):782s-788s.
107. Ziska LH, Gebhard DE, Frenz DA, Faulkner S, Singer BD, Straka JG. Cities as harbingers of climate change: common ragweed, urbanization, and public health. Journal of Allergy and Clinical Immunology 2003;111(2):290-295.
108. Ito K, Sportiche N, Keppard B, James P. Transit-Oriented Development and Health: A Health Impact Assessment to Inform the Healthy Neighborhood Equity Fund. Boston, MA: Metropolitan Area Planning Council; 2013.
109. Weisman S, Ferris M, Kelly S, Flynn E. Building Healthy Schools: Health Impact Assessment on Planning School Construction Projects in Minnesota. St Paul, MN: Public Health Law Center; 2015.
110. Domonoske C. Bright, Bluish-White LED Streetlamps Disrupt Sleep Cycles, AMA Says. National Public Radio 2016 June 21.
111. Kelly P, Kahlmeier, S., Gotschi, T., Orsini, N., Richards, J., Roberts, N., Scarborough, P., and Foster, C. Systematic review and meta-analysis of reduction in all-cause mortality from walking and cycling and shape of dose response relationship. International Journal of Behavioral Nutrition and Physical Activity 2014;11(132):1-15.
112. Oja P, Titze S, Bauman A, de Geus B, Krenn P, Reger-Nash B, et al. Health benefits of cycling: a systematic review. Scand J Med Sci Sports 2011;21(4):496-509.
113. Saunders LE, Green JM, Petticrew MP, Steinbach R, Roberts H. What are the health benefits of active travel? A systematic review of trials and cohort studies. PLoS One 2013;8(8):e69912.
REFERENCES OCTOBER 2016

PAGE 128 PAGE 128
114. Woodcock J, Franco OH, Orsini N, Roberts I. Non-vigorous physical activity and all-cause mortality: systematic review and meta-analysis of cohort studies. Int J Epidemiol 2011;40(1):121-38.
115. Hamer M, Chida Y. Walking and primary prevention: a meta-analysis of prospective cohort studies. Br J Sports Med 2008;42(4):238-43.
116. Hamer M, Chida Y. Active commuting and cardiovascular risk: a meta-analytic review. Prev Med 2008;46(1):9-13.
117. Besser LM, Dannenberg AL. Walking to public transit: steps to help meet physical activity recommendations. Am J Prev Med 2005;29(4):273-80.
118. Freeland AL, Banerjee SN, Dannenberg AL, Wendel AM. Walking associated with public transit: moving toward increased physical activity in the United States. Am J Public Health 2013;103(3):536-42.
119. Mueller N, Rojas-Rueda D, Cole-Hunter T, de Nazelle A, Dons E, Gerike R, et al. Health impact assessment of active transportation: A systematic review. Prev Med 2015;76:103-14.
120. Bigazzi AY, Figliozzi MA. Review of Urban Bicyclists' Intake and Uptake of Traffic-Related Air Pollution. Transport Reviews 2014;34(2):221-245.
121. Götschi T, Garrard J, Giles-Corti B. Cycling as a Part of Daily Life: A Review of Health Perspectives. Transport Reviews 2015;36(1):45-71.
122. Stein WR, Walker D. Link-Based Calculation of Motor Vehicle Air Toxin Emissions using Mobile. In: Conference on the Application of Transportation Planning Methods; 2003: Citeseer; 2003. p. 64.
123. Center for Neighborhood Technology. Penny Wise, Pound Fuelish: New Measures of Housing + Transportation Affordability. Chicago, IL; 2010 March 2010.
124. Center for Transit-Oriented Development. Mixed-income housing near transit: Increasing affordability with location efficiency. Washington, DC: Federal Transit Administration; 2009.
125. American Automobile Association. Your Driving Costs. Heathrow, FL; 2013.126. Chillón P, Evenson KR, Vaughn A, Ward DS. A systematic review of interventions for
promoting active transportation to school. International Journal of Behavioral Nutrition and Physical Activity 2011;8(1):1-17.
127. Scheepers CE, Wendel-Vos GCW, den Broeder JM, van Kempen EEMM, van Wesemael PJV, Schuit AJ. Shifting from car to active transport: A systematic review of the effectiveness of interventions. Transportation Research Part A: Policy and Practice 2014;70:264-280.
MDH MNDOT SMTP HEALTH IMPACT ASSESSMENT

PAGE 129 PAGE 129
128. Litman T. Transportation cost and benefit analysis. Victoria Transport Policy Institute 2009;31.
129. Durand CP, Andalib M, Dunton GF, Wolch J, Pentz MA. A systematic review of built environment factors related to physical activity and obesity risk: implications for smart growth urban planning. Obes Rev 2011;12(5):e173-82.
130. Minnesota Department of Transportation. 2014-2015 Legislative Report on Safe Routes to School. In; 2015.
131. McDonald NC, Steiner RL, Lee C, Rhoulac Smith T, Zhu X, Yang Y. Impact of the Safe Routes to School Program on Walking and Bicycling. Journal of the American Planning Association 2014;80(2):153-167.
132. Stewart O, Moudon AV, Claybrooke C. Multistate evaluation of safe routes to school programs. Am J Health Promot 2014;28(3 Suppl):S89-96.
133. Dimaggio C, Li G. Effectiveness of a safe routes to school program in preventing school-aged pedestrian injury. Pediatrics 2013;131(2):290-6.
134. McCann B. Complete streets: We can get there from here. Institute of Transportation Engineers. ITE Journal 2008;78(5):24.
135. U.S. Census Bureau. American Community Survey 2014 1-Year Estimates, Table B08132. In; 2014.
136. Renault M. Buses and trains wrapped in ads pay off big for Metro Transit. MPR News 2014.137. Metro Transit. Policies and Standards for Advertising on Metro Transit Facilities. In.
http://www.minneapolismn.gov/www/groups/public/@clerk/documents/webcontent/wcms1p-120355.pdf; 2007.
138. Smith KC, Cukier S, Jernigan DH. Defining strategies for promoting product through 'drink responsibly' messages in magazine ads for beer, spirits and alcopops. Drug Alcohol Depend 2014;142:168-73.
139. Nyborn JA, Wukitsch K, Nhean S, Siegel M. Alcohol Advertising on Boston's Massachusetts Bay Transportation Authority Transit System: An Assessment of Youths' and Adults' Exposure. American Journal of Public Health 2009;99(Suppl 3):S644-S648.
140. Centers for Disease Control and Prevention. Alcohol Related Disease Impact (ARDI) application. Available at www.cdc.gov/ARDI. In; 2013.
141. Sacks JJ, Gonzales KR, Bouchery EE, Tomedi LE, Brewer RD. 2010 National and State Costs of Excessive Alcohol Consumption. Am J Prev Med 2015;49(5):e73-9.
REFERENCES OCTOBER 2016
PAGE 130 PAGE 130
142. Anderson P, de Bruijn A, Angus K, Gordon R, Hastings G. Impact of alcohol advertising and media exposure on adolescent alcohol use: a systematic review of longitudinal studies. Alcohol Alcohol 2009;44(3):229-43.
143. Hollingworth W, Ebel BE, McCarty CA, Garrison MM, Christakis DA, Rivara FP. Prevention of deaths from harmful drinking in the United States: the potential effects of tax increases and advertising bans on young drinkers. Journal of studies on alcohol 2006;67(2):300-308.
144. Centers for Disease Control and Prevention. CDC Grand Rounds: Evidence-based injury prevention. MMWR. Morbidity and mortality weekly report 2014;62(51-52):1048.
145. Kaufman EJ, Wiebe DJ. Impact of State Ignition Interlock Laws on Alcohol-Involved Crash Deaths in the United States. Am J Public Health 2016;106(5):865-71.
146. Mart S, Blakemore J. Alcohol Ads on Public Transit: Policies From Major Metropolitan Areas in the United States. World Medical & Health Policy 2014;6(3):280-291.
147. Minnesota Department of Public Safety. Minnesota Motor Vehicle Crash Facts. In. https://dps.mn.gov/divisions/ots/reports-statistics/Pages/crash-facts.aspx; 2014.
148. MPR News Staff. (2016, March 7). Minnesota's graduation gap: By the numbers. Minnesota Public Radio. Retrieved from: http://www.mprnews.org/story/2016/03/07/graduation-gap-by-the-numbers.
149. Cervero, R. (2002). Induced travel demand: Research design, empirical evidence, and normative policies. Journal of Planning Literature, 17(1), 3-20.
MDH MNDOT SMTP HEALTH IMPACT ASSESSMENT

PAGE 131 PAGE 131
This page intentionally left blank.
REFERENCES OCTOBER 2016

PAGE 132 PAGE 132
PH
OTO
CR
ED
IT: M
inne
sota
Dep
artm
ent o
f Tra
nspo
rtatio
n
APPENDIX
PH
OTO
CR
ED
IT: M
inne
sota
Dep
artm
ent o
f Tra
nspo
rtatio
n
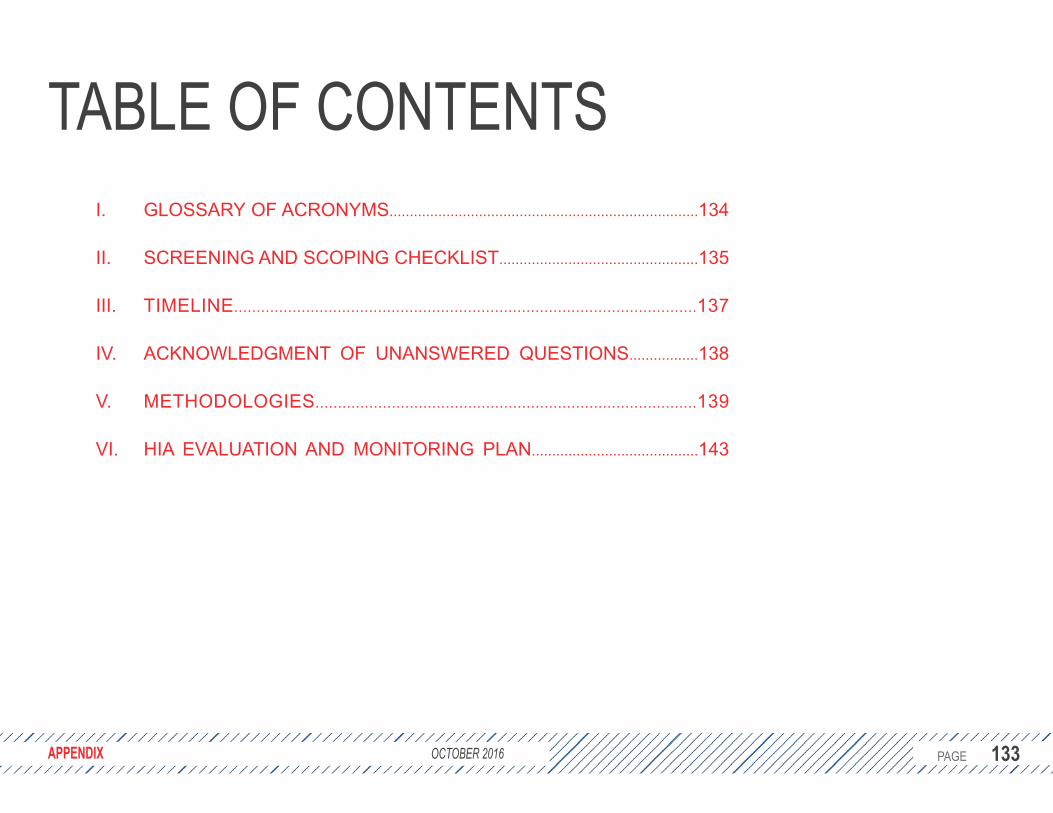
PAGE 133 PAGE 133 APPENDIX OCTOBER 2016
TABLE OF CONTENTSI. GLOSSARY OF ACRONYMS............................................................................134
II. SCREENING AND SCOPING CHECKLIST.................................................135
III. TIMELINE.......................................................................................................137
IV. ACKNOWLEDGMENT OF UNANSWERED QUESTIONS.................138
V. METHODOLOGIES.....................................................................................139
VI. HIA EVALUATION AND MONITORING PLAN.........................................143

PAGE 134 PAGE 134
HIA – Health Impact AssessmentHiAP – Health in All PoliciesMDH – Minnesota Department of HealthMnDOT – Minnesota Department of TransportationSMTP – Statewide Multimodal Transportation PlanITHIM – Integrated Transport and Health Impacts ModelPPP – Public Participation PlanVMT – Vehicle Miles TraveledCDC – Centers for Disease Control and Prevention
I. GLOSSARY OF ACRONYMS
MDH MNDOT SMTP HEALTH IMPACT ASSESSMENT

PAGE 135 PAGE 135
This section summarizes the screening and scoping steps of the HIA. The goal of screening is to ensure the HIA is feasible and adds value to the decision-making process, and scoping identifies the priority health determinants, research questions, and roles for the HIA. The following checklists were developed based on the Minimum Elements and Practice Standards for HIA2 in order to demonstrate fidelity with established best practices.
2 Bhatia, R., Farhang, L., Heller, J., Lee, M., Orenstein, M., Richardson, M., & Wernham, A. (2014). Minimum Elements and Practice Standards for Health Impact Assessment, Version 3. Retrieved from hiasociety.org
II. SCREENING AND SCOPING CHECKLIST
APPENDIX OCTOBER 2016
SCREENING CRITERIA ADDRESSED NOTESDecision event identified? YES Adoption of strategies, work plan in
SMTP update.
HIA adds value? YES
Substantial long-term impacts, including on equity. Health not currently holistically/systematically considered.
HIA feasible? YES
Resources, data available. Integration into SMTP process creates clear and appropriate timeline.
Notification of decision? YES MnDOT active partner, work groups informed.

PAGE 136 PAGE 136 MDH MNDOT SMTP HEALTH IMPACT ASSESSMENT
SCOPING CRITERIA ADDRESSED NOTESRoles identified? YES MDH and MnDOT staff to meet every
three weeks to coordinate next steps.
Goals established? YES See Chapter 1 of the HIA.
Assessment plan established? YES
Project required an iterative process to identify questions raised in work group meetings, determine if feasible and valuable to assess for health impacts, and establish appropriate methodology. Due to broad nature of SMTP, characterization of health impacts was not always possible.
Stakeholder engagement plan established? YES Integrated with SMTP Public Participation
Plan (see Chapter 1).
Health issues prioritized? YES
Initial scoping meeting with stakeholders held in early stages of project to help inform direction of assessment and specific topics of interest, but potential changes to strategies were not yet identified at that point. Instead, scoping meeting identified three objectives (work groups) to prioritize for assessment stage.
Plan to evaluate inequities? YES
Equity was considered through the HIA, although the nature of this plan precluded evaluation of direct impacts and especially disparate impacts. Existing disparities by race, income, geography, age, and other factors were included in baseline assessment and in assessment findings where data were available. Data gaps were noted.

PAGE 137 PAGE 137 APPENDIX OCTOBER 2016
The HIA was screened and initiated in August 2015 and concluded approximately one year later. Initial meetings between MDH and MnDOT project staff outlined the process for both the SMTP revision as well as the HIA, although many adjustments to that process were made throughout the project. The HIA’s timeline was largely dictated by the series of five work group meetings for each objective area of the SMTP, summarized below.
III. TIMELINE
TIME SMTP WORK GROUP MEETING HIA TASKS
Summer 2015 1. Review 2012 SMTP • Screen HIA• Review 2012 SMTP• Stakeholder input on process
Fall 2015 2. Review trend analysis papers.
• Establish assessment plan• Baseline assessment• Stakeholder input on process
Winter 2016 3. Begin revisions/additions to objectives and strategies.4. Finish draft changes to objectives and strategies.
• Assessment of proposed changes to strategies, objectives, performance measures, and work plan items.
Spring 2016 5. Review performance measures and work plan items.
• Present HIA findings and recommendations

PAGE 138 PAGE 138
IV. ACKNOWLEDGMENT OF UNANSWERED QUESTIONSHIAs are frequently unable to answer all the questions that arise throughout the project. This is often due to a lack of time, lack of information or data, or because the question is beyond the scope of the current HIA. Below are some of these unanswered questions of interest.
1. How will the projected rise in autonomous vehicles (AVs) affect physical activity, access to goods and services, air quality, safety, and economic opportunities, especially for low-income communities and those with disabilities?
b. AVs may increase the ease of door-to-door services, increasing the mobility for some while reducing the incentive for physical activity for others.
c. AVs promise to be safer and more energy efficient, but there could be increased environmental impacts from battery manufacturing and electricity production.
d. AVs may threaten to replace transit and mobility services, displacing some workers (e.g. taxi drivers) while creating new economic opportunities for others.
2. With commutes that are less stressful and more productive, AVs may incentivize urban sprawl.
3. How do transportation systems (including their accessibility, travel time, reliability, and sense of personal security) impact the stress and mental health of its users?
4. How could air quality guidelines in the SMTP affect land use decisions along transportation corridors, including alignment of bike paths along roads, residential zoning, and use of environmental buffers?
MDH MNDOT SMTP HEALTH IMPACT ASSESSMENT
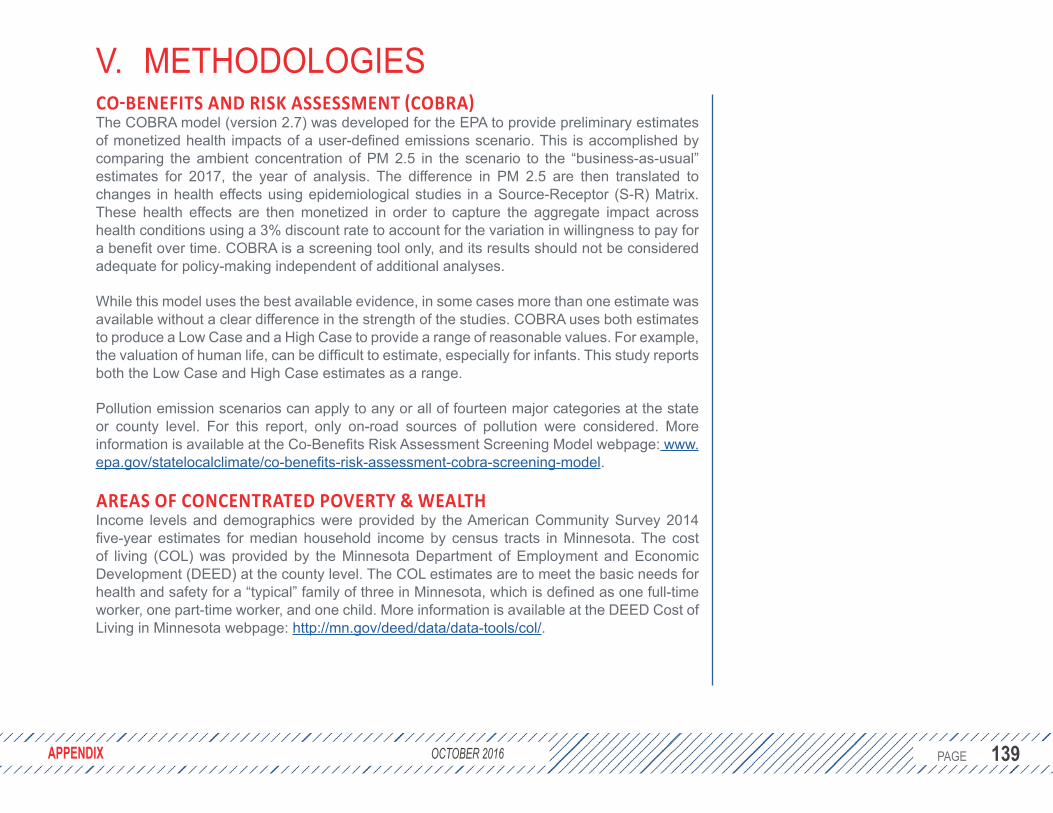
PAGE 139 PAGE 139
CO-BENEFITS AND RISK ASSESSMENT (COBRA)The COBRA model (version 2.7) was developed for the EPA to provide preliminary estimates of monetized health impacts of a user-defined emissions scenario. This is accomplished by comparing the ambient concentration of PM 2.5 in the scenario to the “business-as-usual” estimates for 2017, the year of analysis. The difference in PM 2.5 are then translated to changes in health effects using epidemiological studies in a Source-Receptor (S-R) Matrix. These health effects are then monetized in order to capture the aggregate impact across health conditions using a 3% discount rate to account for the variation in willingness to pay for a benefit over time. COBRA is a screening tool only, and its results should not be considered adequate for policy-making independent of additional analyses.
While this model uses the best available evidence, in some cases more than one estimate was available without a clear difference in the strength of the studies. COBRA uses both estimates to produce a Low Case and a High Case to provide a range of reasonable values. For example, the valuation of human life, can be difficult to estimate, especially for infants. This study reports both the Low Case and High Case estimates as a range.
Pollution emission scenarios can apply to any or all of fourteen major categories at the state or county level. For this report, only on-road sources of pollution were considered. More information is available at the Co-Benefits Risk Assessment Screening Model webpage: www.epa.gov/statelocalclimate/co-benefits-risk-assessment-cobra-screening-model.
AREAS OF CONCENTRATED POVERTY & WEALTHIncome levels and demographics were provided by the American Community Survey 2014 five-year estimates for median household income by census tracts in Minnesota. The cost of living (COL) was provided by the Minnesota Department of Employment and Economic Development (DEED) at the county level. The COL estimates are to meet the basic needs for health and safety for a “typical” family of three in Minnesota, which is defined as one full-time worker, one part-time worker, and one child. More information is available at the DEED Cost of Living in Minnesota webpage: http://mn.gov/deed/data/data-tools/col/.
V. METHODOLOGIES
APPENDIX OCTOBER 2016

PAGE 140 PAGE 140 MDH MNDOT SMTP HEALTH IMPACT ASSESSMENT
There are several limitations to these data worth noting. First, as is the case with all survey data, household income was self-reported and may be subject to bias. Second, the COL estimates for a “typical” family of three may not represent the costs for other family compositions, such as a single parent with two children. About 65% of households are family households, 79% of which have two parents, and the average number of hours worked is 33.7 per week. COL estimates are available for a user-specified family composition, so areas of concentrated wealth and poverty were also identified using the COL estimates for a single parent with two children (not shown). Compared to the original analysis, the second analysis found fewer areas of concentrated wealth (16 vs 72) and more areas of concentrated poverty (138 vs 123), but the overall patterns for the state and Twin Cities metro area were highly consistent. Finally, the COL estimates are for the county. In this analysis, MDH assigned the county-level COL estimates to the census tracts comprising the county. There may be discrepancies between the COL for urban versus rural census tracts within a single county.
HOSPITAL RESILIENCY TO FLOODINGData on healthcare facilities regulated by the Minnesota Department of Health (MDH) (e.g. nursing homes, supervised living facilities, hospitals, surgical centers, clinical labs, birth centers, hospice, dialysis providers, and others) were obtained at the MDH Health Regulation - Facilities and Professions website: www.health.state.mn.us/divs/fpc/directory/providerselect.cfm. These facilities were geocoded and those located within a quarter mile of an area designated as a Special Flood Hazard Area (SFHA), i.e., areas defined by the Federal Emergency Management Agency (FEMA) as the area that will be inundated by a flood event having a 1-percent change of being equaled or exceeded in any given year, were retained. A half-mile buffer was applied to each healthcare facility to capture proximal access roads.
Locations and designations of FEMA-SFHA areas were obtained directly from the Minnesota Department of Natural Resources. For seventeen counties, no floodplain data were currently available (i.e., Carlton, Clearwater, Cook, Cottonwood, Crow Wing, Dodge, Faribault, Hubbard, Jackson, Kanabec, Koochiching, Lake, Martin, Pipestone, Rock, Waseca, Watonwan). Therefore, any facilities, as well as their access roads, located in these counties were not included in the mapping and estimation of total roads and Minnesota Department of Transportation (MnDOT) highways potentially impacted by extreme flood events.

PAGE 141 PAGE 141 APPENDIX OCTOBER 2016
Spatial data on Minnesota’s roads were obtained from the Minnesota Geospatial Commons Roads webpage: https://gisdata.mn.gov/dataset/trans-roads-mndot-tis. This dataset represents centerlines for all public roads within Minnesota, broken from intersection to intersection, as reported to the MnDOT at the end of 2012. All roads within a quarter mile of a designated SFHA area were selected. A half-mile buffer was applied to each healthcare facility to capture proximal access roads. Roads were clipped to this buffered (and dissolved) layer and flood vulnerable access roads were selected that crossed the outline of a FEMA-SFHA area. This same approach was applied to data on highways MnDOT owns and maintains as part of the MnDOT trunk highway system, which was obtained from the MnDOT GIS Data Products webpage: www.dot.state.mn.us/maps/gdma/gis-data.html.
GREATER MINNESOTA TRANSIT SERVICE PRIORITY AREASData on the span of public transit service for 62 towns and cities in Greater Minnesota was provided by MnDOT Transit Operations. The data were originally gathered as part of the Greater Minnesota Transit Investment Plan. These data were matched to census data on means of transportation to work by time leaving home (B08132) for urban areas in Minnesota (ACS 2014 five-year estimates) and represented graphically using GIS (ArcMap 10.2).
Using census data, MDH computed the total percent of workers who left for work between 12pm and 11:59pm, which ranged from 8.2% to 26.4%, with a mean of 17.8% and a standard deviation of 3.9%. To select priority areas, MDH selected urban areas that met the following conditions:
• At least 15% of workers left for work between 12pm and 11:59pm. • Weekday service hours were less than 14.• No Saturday or Sunday service was offered.
Limitations of these data include the completeness of the span of service data, which were only available for 62 of the 111 urban areas in Minnesota, including the Twin Cities metro area. These data only access the time availability of transit service and not the geographic access. The percent of workers leaving for work in the afternoon was chosen as an approximate indicator of the potential demand for expanded service hours beyond the standard 6am-6pm timeframe. However, this may exclude other potential riders such as the unemployed who may rely on transit for seeking job opportunities.
PAGE 142 PAGE 142
MOTOR VEHICLE CRASHES ATTRIBUTABLE TO WEATHER CONDITIONSData from the National Highway Traffic Safety Administration’s Fatality Analysis Reporting System from 2006-2012 were provided by Shubhayu Saha, PhD, from the Centers for Disease Control and Prevention. Crashes related to weather were identified if the police crash report included at least one of the following: bad weather, rain, snow, fog, bad road, wet road, or icy road.
MDH MNDOT SMTP HEALTH IMPACT ASSESSMENT

PAGE 143 PAGE 143 APPENDIX OCTOBER 2016
This section describes the evaluation of the HIA along with the HIA monitoring plan. The HIA evaluation reflects on the goals of the HIA by assessing its process and impact. The HIA monitoring plan is used to track the effects of the proposed policy, project or program on health outcomes and/or determinants of concern.
The overall goal of HIA was to inform the revision of the SMTP from a health perspective. It was applied to three SMTP objectives of Transportation Safety, Critical Connections, and Healthy Communities as well as an additional brief on equity (see Part II). Specifically, the five stated goals were:
1. Participate in the SMTP work groups.2. Assess selected objectives and strategies for connections to health.3. Provide recommendations to maximize health benefits and minimize health risks.4. Demonstrate the value and feasibility of a Health in All Policies (HiAP) approach.5. Build capacity among MnDOT staff to conduct or use HIA findings.
The HIA Process Evaluation will address the first three goals. The HIA Impact Evaluation will address progress toward goals four and five. The HIA Monitoring Plan will describe plans to track the effects of the HIA.
HIA PROCESS EVALUATIONAs detailed in Part II of this report, HIA staff participated in three of the six SMTP work groups. Within those three work groups, the HIA assessed selected strategies, performance measures, and work plan items and offered a total of 22 recommendations to MnDOT on opportunities to maximize positive impacts on health while minimizing potential risks. Beyond this fulfillment of the first three goals, it is important to note several strengths and limitations to how the HIA was designed and undertaken.
STRENGTHSThis HIA makes several contributions to the field. First, it demonstrates how HIAs can efficiently integrate into existing processes. This HIA took advantage of both the extensive community and stakeholder engagement efforts of the SMTP and the initial trend analysis which helped inform the baseline assessment of the HIA. Because HIAs can be time and resource-intensive, finding efficiencies such as these can increase feasibility.
VI. HIA EVALUATION AND MONITORING PLAN
PAGE 144 PAGE 144
Second, this HIA benefitted from a close partnership with MnDOT staff who were coordinating the SMTP revision and drafting the 2017 SMTP. Working directly with these staff allowed the HIA to be more responsive to new changes or questions that arose throughout the project. The fact that both MnDOT and MDH are state agencies also contributed to an efficient process due to the mutual understanding of state government processes.
Finally, coordination among staff of the two agencies was facilitated by a strong communications plan. Periodic in-person meetings allowed for in-depth discussions and planning, while instant messaging and email were used for quick questions, clarifications, and sharing documents. Like all HIAs, the timing of the release of the report is critical. Unlike many HIAs, however, the release was able to be coordinated with the release of the SMTP with consistent and complementary messaging strategies.
LIMITATIONSWhile HIA is a flexible tool, adapting it to the unique needs of a project can pose new challenges. Documenting these challenges can help other HIA practitioners and advance the field. This HIA has three notable limitations.
First, as is detailed in Part I, MnDOT engaged in extensive community and stakeholder engagement to inform the SMTP. However, these efforts were not specific to the HIA, and the direction and decisions made in the HIA were not made by those potentially impacted by the decision. This is partly due to the difficulty in defining who would be impacted by such a broad and long-term policy. In many ways, this HIA was about informing the way decisions are made and recommends stronger community engagement to be incorporated into those processes. Still, this presents an interesting challenge for the HIA field when incorporating HIA into other decision-making processes.
Second, HIA framework acknowledges that there are many social and environmental determinants of our health, yet there are limits to how many of pathways can be explored within a single HIA. Typically an HIA will select three to five health determinants that are prioritized by the community and stakeholders and examine the potential effects on those health determinants by the proposed policy, plan, or project.
MDH MNDOT SMTP HEALTH IMPACT ASSESSMENT

PAGE 145 PAGE 145
An initial meeting with stakeholders to help guide the HIA identified several areas that were of particular importance, including accessibility, land use, communications, climate change, decision-making processes, and equity. Many of these topics were addressed at least in part through the HIA. Accessibility was already being closely examined by MnDOT, and land use decisions were identified as an issue in the SMTP, but one that requires additional collaboration beyond the scope of the SMTP. Remaining and unanswered questions are included in section IV of the Appendix. Rather than adhering closely to specific health determinants, the HIA team of MDH and MnDOT staff decided to retain flexibility to assess any proposed strategy that would benefit from a health perspective.
Finally, an HIA distinguishes itself from other types of assessments or reports by predicting potential changes to the health status of a community due to a proposed policy, plan, or project. While the decision of how to revise the SMTP carries important implications for health, the SMTP rarely speaks at a level of granularity that makes it possible to predict potential impacts. In addition to its broad language, the wide geographic and long-term scale of the SMTP makes it difficult to identify a specific population on which to base potential impacts. While some models (such as for flooding or changes in air quality) were available, other impacts were based on best practices in public health and community engagement to inform the implementation of various strategies and initiatives identified in the SMTP.
In retrospect, this HIA would have benefited from two changes. First would be to expand the number of individuals on the HIA team participating in the work groups. Due to limited resources, usually only one or two staff members from MDH were able to attend and were well-informed enough to assess proposed strategies. Including more people from varied disciplines would help identify, detail, and assess key questions arising in the work groups. Second, this HIA could have integrated more closely with the Public Participation Plan to capture stakeholder feedback that was more specific to health.
APPENDIX OCTOBER 2016

PAGE 146 PAGE 146
HIA IMPACT EVALUATIONThe impact evaluation attempts to judge to what degree the recommendations were adopted and implemented and how the HIA influenced the decision-making process. The impacts on goals four and five are described as follows.
1. Demonstrate value of HiAP approachWhile many have advocated for advancing Health in All Policies (HiAP), few have detailed how to operationalize this framework. This project demonstrates the value of HIA as one tool to bring a health perspective to other sectors in a mutually-beneficial way. A post-process survey of work group members can capture the perceived value of this approach, as well as monitoring public discourse through social media and formal comments on the SMTP relating to health.
2. Build capacity among MnDOT staff to conduct or use HIA findingsMnDOT staff were involved in each step of the HIA, from initial screening of the HIA through reporting and dissemination. Capacity among MnDOT staff may best be assessed by monitoring actions taken by MnDOT to conduct, include, or reference HIAs over the next four years.
An HIA often leads to impacts beyond informing the decision at hand. This HIA’s impacts include strengthened partnerships and identification of common barriers and opportunities.
3. Strengthened partnershipsWhile MnDOT and MDH have shared a collaborative partnership for years, this project strengthened the partnership even further. Additional understanding of the transportation system was gained by the MDH Climate & Health Program staff conducting the HIA and additional understanding of health impacts was gained by the MnDOT Policy Planning Unit staff leading the SMTP revision process. In addition, a number of MnDOT staff from across the agency who served on the three SMTP objective work groups expressed support for the HIA opportunity and appreciation for having health at the table in the SMTP decision-making process. While achieving a vision of Health in All Policies will require strong agency leadership, relationships between programmatic units and across agency staff are also essential.
MDH MNDOT SMTP HEALTH IMPACT ASSESSMENT

PAGE 147 PAGE 147
4. Identification of common barriers and opportunitiesAnother impact of the HIA is a deeper understanding of how the levels and sources of transportation funding have important implications for public health goals. For example, pedestrian and bicyclist projects are often limited not by a lack of perceived value, but by limited dedicated funding. Other sources of transportation funding are for specific initiatives which may not be aligned with public health goals. For example, this report has detailed the trade-off between increasing walking and biking and the expected rise in the total number of crashes, even if the rate of crashes declines. If a funding source is provided to reduce the number of crashes, it may limit considerations of all associated health benefits or risks. While complicated, public health professionals would be wise to understand and support dedicated funding for transportation projects that benefit health.
HIA MONITORING PLANThe purpose of the HIA Monitoring Plan is to track the effects of the SMTP on health outcomes and/or determinants of concern. The plan describes the short-term and long-term monitoring that is proposed within currently available resources and the mechanisms for reporting outcomes to decision makers.
SHORT-TERM MONITORINGOnce the SMTP is finalized and accepted in early 2017, MDH staff will review if any changes have been made related to recommendations set forth in this HIA. Because the HIA was integrated into the revision process, it is likely that changes were made to the SMTP at least in part as a result of MDH staff participation in work group meetings. Changes resulting from participation are harder to capture or document but may have contributed the most to including health in the SMTP. For example, MDH staff shared details about MDH’s own examination of health equity, culminating in the 2014 Advancing Health Equity report to the legislature. The current draft of the SMTP includes a work plan item to undergo a similar effort to define transportation equity, specifically referencing the MDH report.
APPENDIX OCTOBER 2016

PAGE 148 PAGE 148
LONG-TERM MONITORINGIf sufficient support is available, project staff from MDH and MnDOT should review HIA recommendations as part of the next SMTP revision in four to five years. This review can focus on progress toward work plan items, new challenges resulting from changes to the SMTP, and renewing the MDH/MnDOT memorandum of understanding (MOU) set to expire that year. One of MnDOT’s proposed work plan items is to maintain the trend analysis library which can help monitor changes in the demographics, travel behaviors, and health of Minnesotans.
MECHANISMS FOR REPORTING OUTCOMES TO DECISION MAKERSHealth equity and Health in All Policies (HiAP) are priorities of the current MDH leadership, particularly the MDH Commissioner. Whenever the SMTP or related work plans are implemented that address the HIA recommendations, health equity and HiAP, MDH Climate & Health Program staff will inform the MDH Commissioner of these updates. An anticipated example is the SMTP work plan item to create a Transportation Equity report modeled after the 2014 MDH Health Equity report.
MDH MNDOT SMTP HEALTH IMPACT ASSESSMENT

PAGE 149 PAGE 149
This page intentionally left blank.
APPENDIX OCTOBER 2016

FOR MORE INFORMATION OR TO OBTAIN COPIES OF THIS REPORT:ONLINE: www.health.mn.gov/mnhiaE-MAIL: [email protected]: 651-201-4899
MINNESOTA CLIMATE AND HEALTH PROGRAMENVIRONMENTAL IMPACTS ANALYSIS UNIT


