Connecting Xcelsius Dashboards to External Data Sources using Excel 2003bobj.sdn-sap.com
16
Page 1 of 1 Connecting Xcelsius Dashboards to External Data Sources using: XML Maps in Excel 2003 A step-by-step guide to connecting Xcelsius Enterprise XE dashboards to company databases using XML Maps in Excel 2003 for enterprise-wide reporting. Chris Bryant Technical Consultant Infommersion, Inc. January 2005 Tech Tips
Transcript
Page 1 of 1
Connecting Xcelsius Dashboards to External Data Sources using:
XML Maps in Excel 2003 A step-by-step guide to connecting Xcelsius Enterprise XE dashboards to company databases using XML Maps in Excel 2003 for enterprise-wide reporting. Chris Bryant Technical Consultant Infommersion, Inc. January 2005
Tech Tips
Page 2 of 2
Table of Contents Page
Prerequisites for getting the most from this Guide 3
Introduction 3
Integrating Xcelsius|Enterprise XE with your data source 4
How Xcelsius works 4
Basic architecture 4
XML integration dynamic refresh 6
XML maps in Excel 2003 6
Defining XML mappings in Excel 6
Configuring Xcelsius|Enterprise XE to use XML maps 9
Refreshing on an interval 12
Refreshing using a refresh button 13
Benefits 14
XML “gotchas” 14
Page 3 of 3
Prerequisites for getting the most from this Tech Tips Guide This Tech Tips Guide is technically oriented, and as such the reader should have a solid understanding of the following technologies and terms: Excel: A basic understanding of Excel – how to navigate and create formulas – is required. It is beneficial, but not required, to have an understanding of Excel 2003 XML Maps. Flash: No knowledge of Flash programming is necessary Xcelsius: Experience creating data presentations with Xcelsius is required, including an understanding of the work area components and how they work. XML: A basic familiarity with XML – how it is structured and how it can be used for communicating between applications – is required. Additionally, included in some guides is an example of an ASPX script. Therefore, knowledge of ASP .NET and how to connect to a database through OLEDB would be helpful for understanding this example. A few Xcelsius-specific terms used throughout the guide:
• Xcelsius Work Area – The Xcelsius authoring environment – which includes menus, toolbars, components, the object browser, and the canvas – used to design and create dashboards and data presentations.
• Xcelsius File - The XLF file created during the development of Xcelsius data
presentations. It is the working (and saved) development file used in the work area (authoring environment).
• Xcelsius Data Presentation – The output of the work area (authoring environment) for
deployment to presentation/dashboard viewers. An Xcelsius data presentation is a Flash file, also known as a SWF file for its file extension (.swf). It can be exported to, and is fully operational in, PowerPoint, Outlook and the Web.
Introduction A corporate dashboard is critical for monitoring the daily health of an organization. It gives decision-makers concise, visual access to key performance indicators that drive the business. With Xcelsius|Enterprise XE, the award-winning software from Infommersion, users create and deploy corporate dashboards that make it easier than ever to identify critical data relationships, probe elaborate “what-if” scenarios, and peer into their company’s financial future. By combining critical business data with the features of Macromedia Flash™, Xcelsius gives users the power to convert data from ordinary Excel spreadsheets and XML-compliant company databases into dynamic dashboards and data presentations for Portals, PowerPoint and the Web. This guide provides a step-by-step guide to connecting Xcelsius|Enterprise XE data presentations to company databases using XML Maps in Excel 2003 for enterprise-wide reporting.
Page 4 of 4
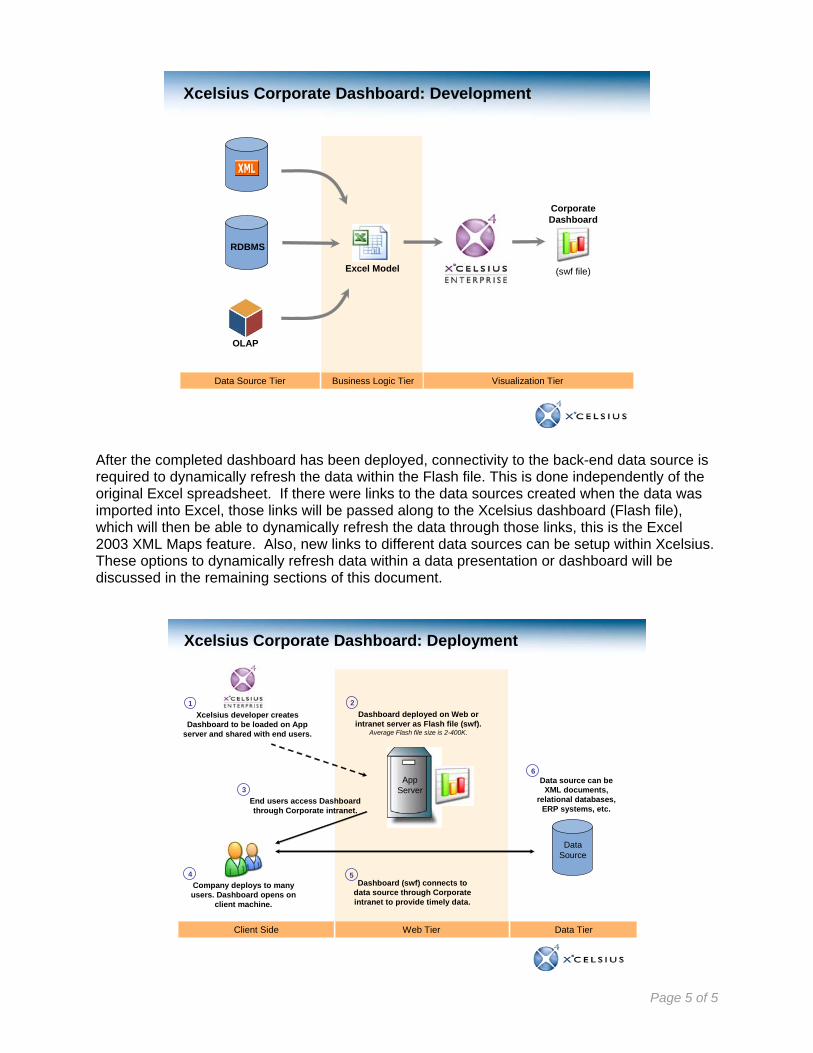
Connecting Xcelsius|Enterprise XE Dashboards to External Data Sources Now that you’ve discovered the power and possibilities of building highly sophisticated and interactive data presentations with Xcelsius, let’s take a closer look at how to connect a dashboard that was created with Xcelsius|Enterprise XE to external data sources – such as corporate databases – via XML. How Xcelsius Works Before looking at the various options for connecting an Xcelsius dashboard to an external data source, it is important to understand how Xcelsius|Enterprise XE works with Excel and why connecting to an external data source can be beneficial. The first step to creating an Xcelsius data presentation or dashboard is to import a previously created Excel spreadsheet into the Xcelsius authoring environment (work area). This import brings in all data, formulas, formatting, mapping, and other features contained in the Excel spreadsheet, and loads it into Xcelsius’ own embedded Excel spreadsheet. All the information is still contained in Excel, but now it is in an Excel spreadsheet embedded in the Xcelsius work area (XLF file). You will see this when you select a data range for use with a component. The Excel spreadsheet which was imported is opened in a temporary Excel file. Therefore, after the initial import, there is no need for the original Excel spreadsheet. After you have created your data presentation in the Xcelsius work area, Xcelsius converts it into a Flash (swf) file. The finished presentation (Flash file) does not contain the full Excel spreadsheet as the Xcelsius work area does. It only contains the range of cells, and their dependencies, that you selected for each component. When a viewer opens the presentation (Flash file), all the necessary data is either contained within the presentation itself, or dynamically retrieved via connectivity to an external data source. By connecting your data presentation (such as a dashboard) to an external data source, you can cause the data within the presentation to dynamically refresh – thus enabling the dashboard to be continuously connected to the latest data available. Basic Architecture Let’s take a look at the typical architecture of how and where Xcelsius|Enterprise XE fits into a dashboard reporting environment. Following are two diagrams: design architecture and deployment architecture. The first diagram illustrates the process and technologies used to build the Xcelsius data presentation and generate a Flash file. The second diagram illustrates where the Flash file resides within the dashboard application when it’s deployed. During the design phase, the data can be brought into Excel by many methods: relational pull, manual entry, importing XML, etc. Once the data is in Excel and subsequently imported into Xcelsius, there is no need for the database anymore during the design phase. All data is now self-contained within the data presentation, and the resulting Flash file can be used in static data situations.
Page 5 of 5
Data Source Tier
Xcelsius Corporate Dashboard: Development
Visualization TierBusiness Logic Tier
RDBMS
OLAP
CorporateDashboard
(swf file)Excel Model
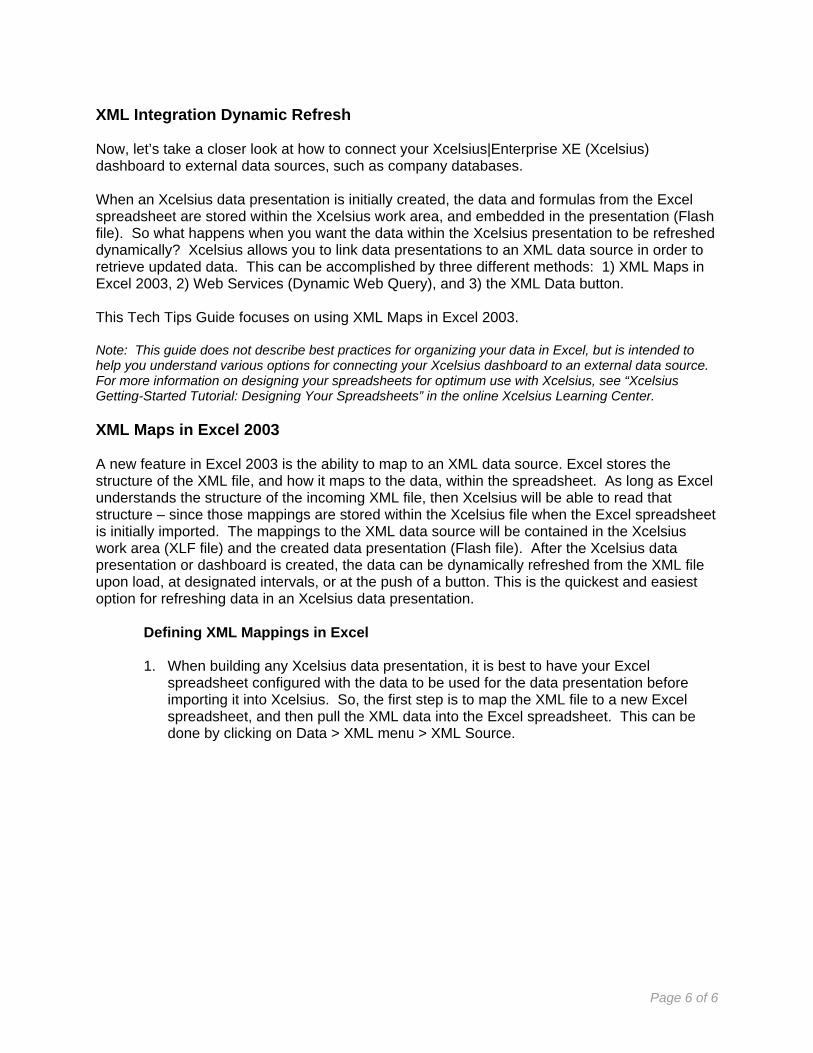
After the completed dashboard has been deployed, connectivity to the back-end data source is required to dynamically refresh the data within the Flash file. This is done independently of the original Excel spreadsheet. If there were links to the data sources created when the data was imported into Excel, those links will be passed along to the Xcelsius dashboard (Flash file), which will then be able to dynamically refresh the data through those links, this is the Excel 2003 XML Maps feature. Also, new links to different data sources can be setup within Xcelsius. These options to dynamically refresh data within a data presentation or dashboard will be discussed in the remaining sections of this document.
Client Side
Xcelsius developer creates Dashboard to be loaded on App
server and shared with end users.
Xcelsius Corporate Dashboard: Deployment
Data Tier
Dashboard (swf) connects to data source through Corporate intranet to provide timely data.
Data source can be XML documents,
relational databases, ERP systems, etc.
Data Source
Company deploys to many users. Dashboard opens on
client machine.
End users access Dashboard through Corporate intranet.
Dashboard deployed on Web or intranet server as Flash file (swf).
Average Flash file size is 2-400K.
App Server
Web Tier
1
6
3
4 5
2
Page 6 of 6
XML Integration Dynamic Refresh Now, let’s take a closer look at how to connect your Xcelsius|Enterprise XE (Xcelsius) dashboard to external data sources, such as company databases. When an Xcelsius data presentation is initially created, the data and formulas from the Excel spreadsheet are stored within the Xcelsius work area, and embedded in the presentation (Flash file). So what happens when you want the data within the Xcelsius presentation to be refreshed dynamically? Xcelsius allows you to link data presentations to an XML data source in order to retrieve updated data. This can be accomplished by three different methods: 1) XML Maps in Excel 2003, 2) Web Services (Dynamic Web Query), and 3) the XML Data button. This Tech Tips Guide focuses on using XML Maps in Excel 2003. Note: This guide does not describe best practices for organizing your data in Excel, but is intended to help you understand various options for connecting your Xcelsius dashboard to an external data source. For more information on designing your spreadsheets for optimum use with Xcelsius, see “Xcelsius Getting-Started Tutorial: Designing Your Spreadsheets” in the online Xcelsius Learning Center. XML Maps in Excel 2003 A new feature in Excel 2003 is the ability to map to an XML data source. Excel stores the structure of the XML file, and how it maps to the data, within the spreadsheet. As long as Excel understands the structure of the incoming XML file, then Xcelsius will be able to read that structure – since those mappings are stored within the Xcelsius file when the Excel spreadsheet is initially imported. The mappings to the XML data source will be contained in the Xcelsius work area (XLF file) and the created data presentation (Flash file). After the Xcelsius data presentation or dashboard is created, the data can be dynamically refreshed from the XML file upon load, at designated intervals, or at the push of a button. This is the quickest and easiest option for refreshing data in an Xcelsius data presentation. Defining XML Mappings in Excel
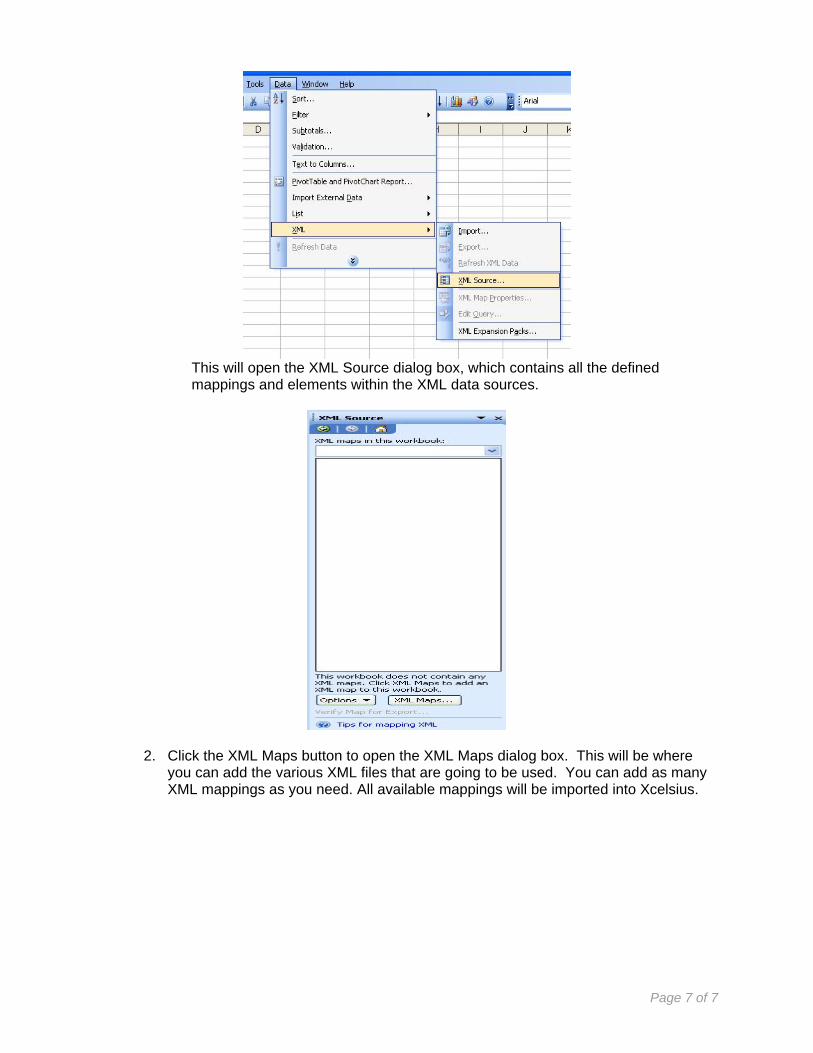
1. When building any Xcelsius data presentation, it is best to have your Excel
spreadsheet configured with the data to be used for the data presentation before importing it into Xcelsius. So, the first step is to map the XML file to a new Excel spreadsheet, and then pull the XML data into the Excel spreadsheet. This can be done by clicking on Data > XML menu > XML Source.
Page 7 of 7
This will open the XML Source dialog box, which contains all the defined mappings and elements within the XML data sources.
2. Click the XML Maps button to open the XML Maps dialog box. This will be where you can add the various XML files that are going to be used. You can add as many XML mappings as you need. All available mappings will be imported into Xcelsius.
Page 8 of 8
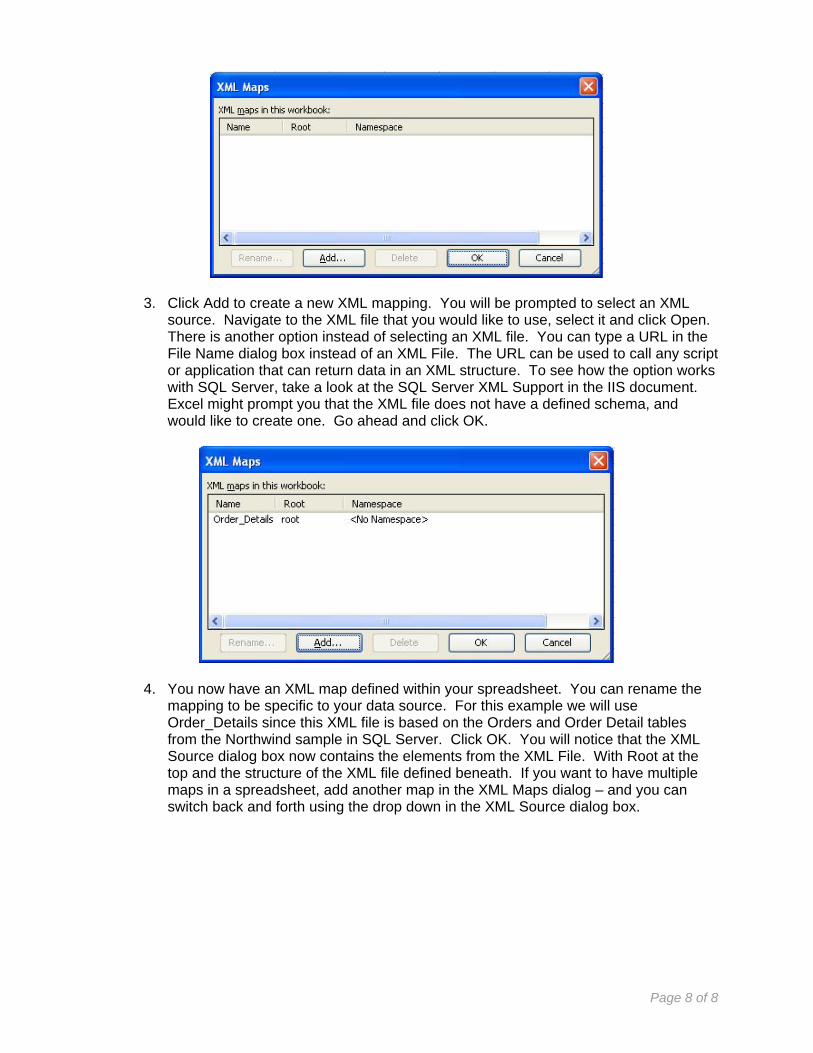
3. Click Add to create a new XML mapping. You will be prompted to select an XML source. Navigate to the XML file that you would like to use, select it and click Open. There is another option instead of selecting an XML file. You can type a URL in the File Name dialog box instead of an XML File. The URL can be used to call any script or application that can return data in an XML structure. To see how the option works with SQL Server, take a look at the SQL Server XML Support in the IIS document. Excel might prompt you that the XML file does not have a defined schema, and would like to create one. Go ahead and click OK.
4. You now have an XML map defined within your spreadsheet. You can rename the mapping to be specific to your data source. For this example we will use Order_Details since this XML file is based on the Orders and Order Detail tables from the Northwind sample in SQL Server. Click OK. You will notice that the XML Source dialog box now contains the elements from the XML File. With Root at the top and the structure of the XML file defined beneath. If you want to have multiple maps in a spreadsheet, add another map in the XML Maps dialog – and you can switch back and forth using the drop down in the XML Source dialog box.
Page 9 of 9
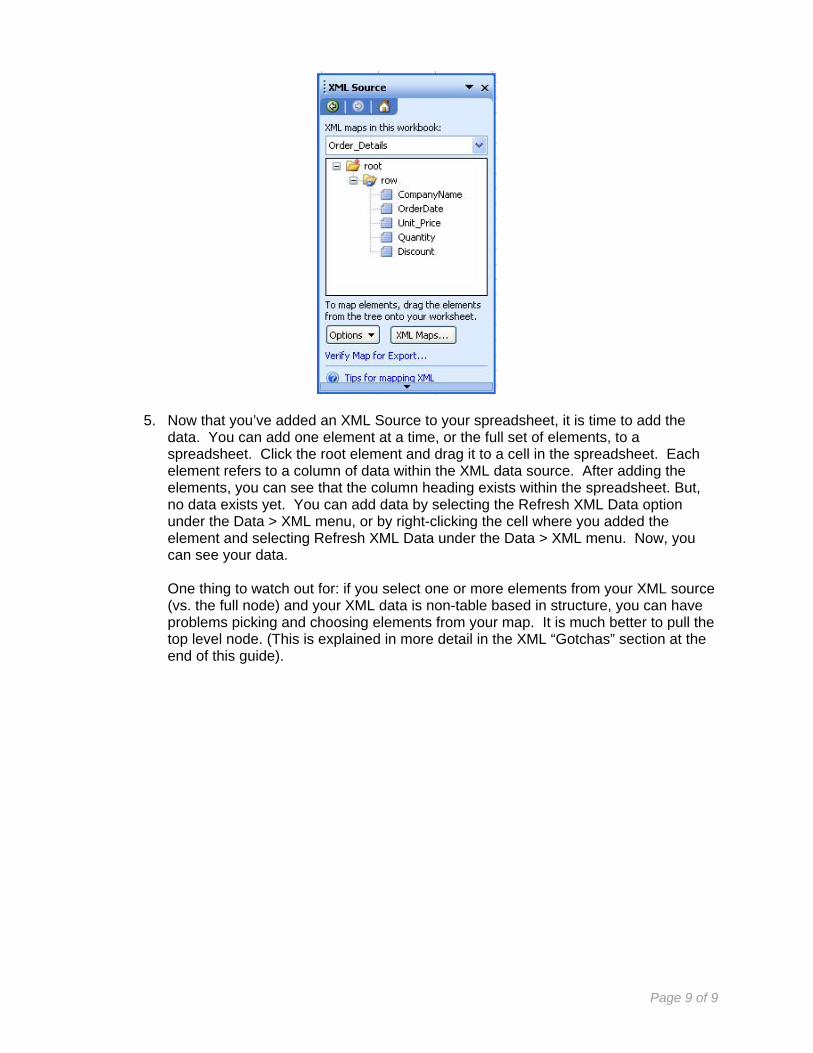
5. Now that you’ve added an XML Source to your spreadsheet, it is time to add the data. You can add one element at a time, or the full set of elements, to a spreadsheet. Click the root element and drag it to a cell in the spreadsheet. Each element refers to a column of data within the XML data source. After adding the elements, you can see that the column heading exists within the spreadsheet. But, no data exists yet. You can add data by selecting the Refresh XML Data option under the Data > XML menu, or by right-clicking the cell where you added the element and selecting Refresh XML Data under the Data > XML menu. Now, you can see your data.
One thing to watch out for: if you select one or more elements from your XML source (vs. the full node) and your XML data is non-table based in structure, you can have problems picking and choosing elements from your map. It is much better to pull the top level node. (This is explained in more detail in the XML “Gotchas” section at the end of this guide).
Page 10 of 10
For our purposes here, that is all we need to do in Excel. We have defined the data we will use to build an Xcelsius data presentation. So now, save your Excel spreadsheet and we will move on to configuring Xcelsius to use the XML maps.
Configuring Xcelsius to use XML Maps
1. Now that you have data to work with, it’s time to learn how to configure Xcelsius to
pull data from the XML file. Open Xcelsius, and import your Excel spreadsheet into
the work area by clicking on the Excel icon on the toolbar to bring up the Import Model dialog box. Click the button with three dots to browse to the Excel file you just created and click OK. You now have an Excel spreadsheet with XML mappings to associate with your data presentation (dashboard).
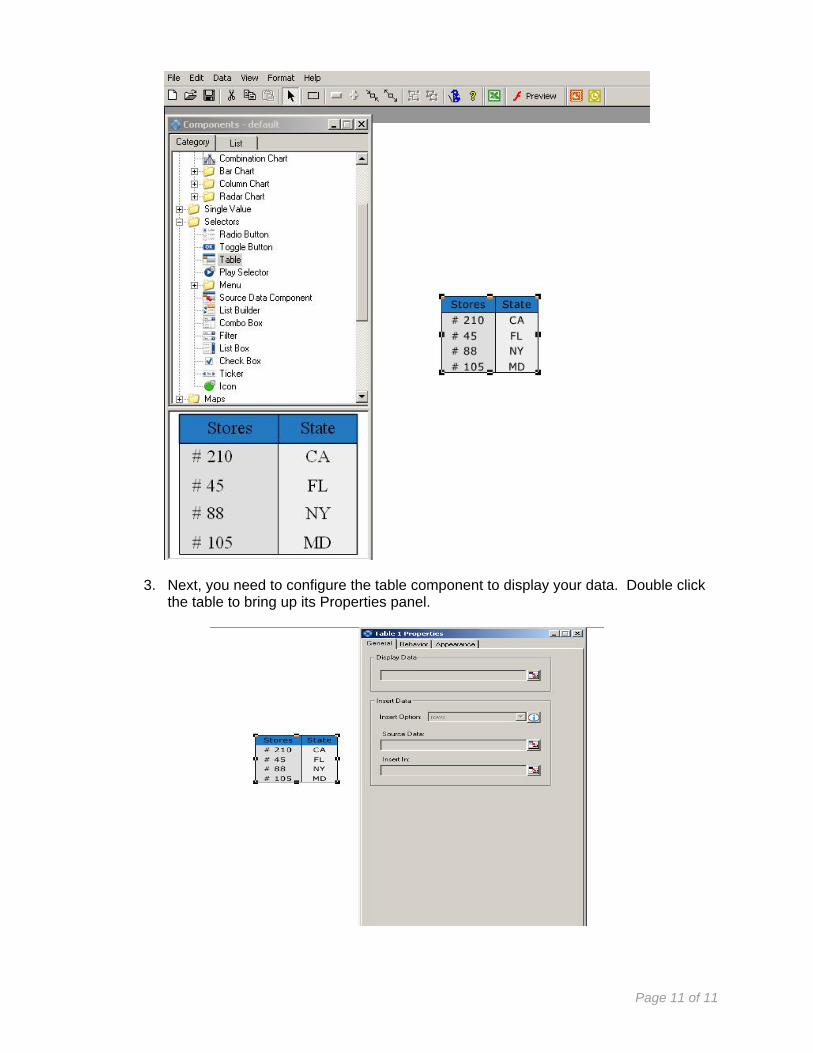
2. The Next step is to create your dashboard in the Xcelsius work area. Begin by adding a few components, so you have some data to display and can see how the dynamic refresh works. In the Components panel, click the Table component and drag it onto the blank slide (canvas) to add a table to your presentation.
Page 11 of 11
3. Next, you need to configure the table component to display your data. Double click the table to bring up its Properties panel.
Page 12 of 12
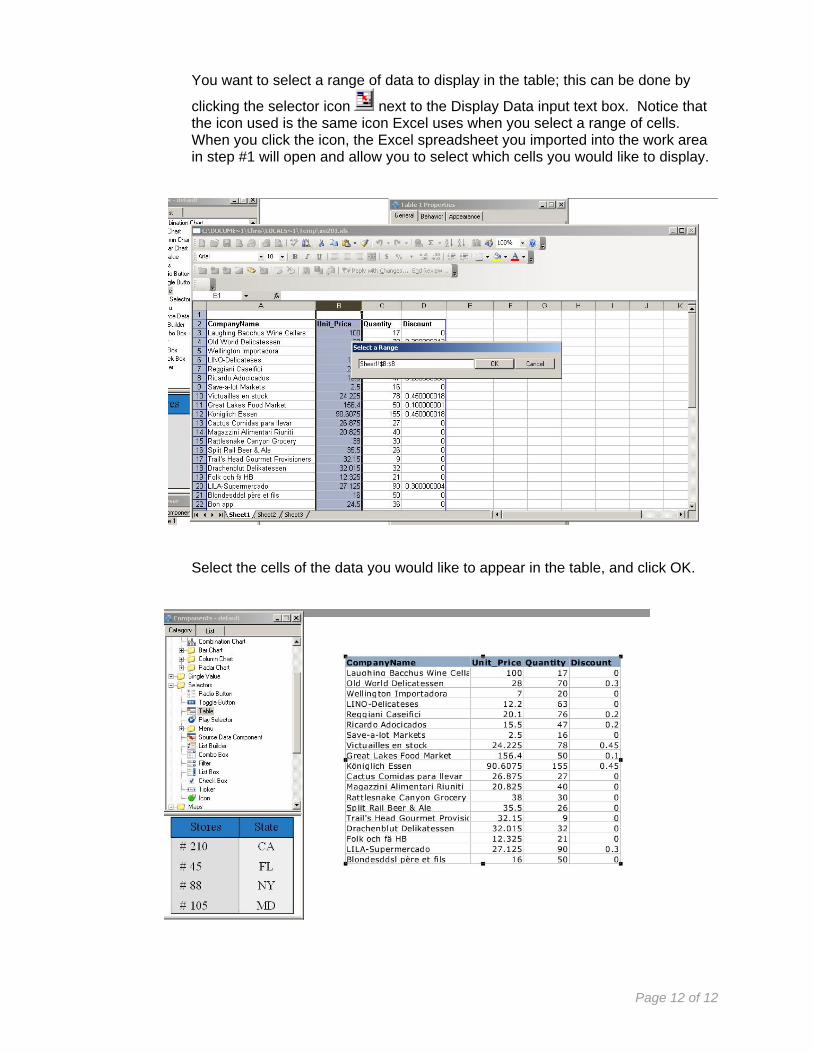
You want to select a range of data to display in the table; this can be done by
clicking the selector icon next to the Display Data input text box. Notice that the icon used is the same icon Excel uses when you select a range of cells. When you click the icon, the Excel spreadsheet you imported into the work area in step #1 will open and allow you to select which cells you would like to display.
Select the cells of the data you would like to appear in the table, and click OK.
Page 13 of 13
4. Notice the table has been updated to display the data you selected. There are three
(3) options for how the data can be refreshed. The first option (default) is created automatically when you import an Excel spreadsheet with XML Maps into Xcelsius. This option tells the data presentation (Flash file) to dynamically refresh the data every time the presentation is loaded. The other two options are: refreshing on an interval, and using a refresh button. We show how to setup both options below.
Refreshing on an Interval
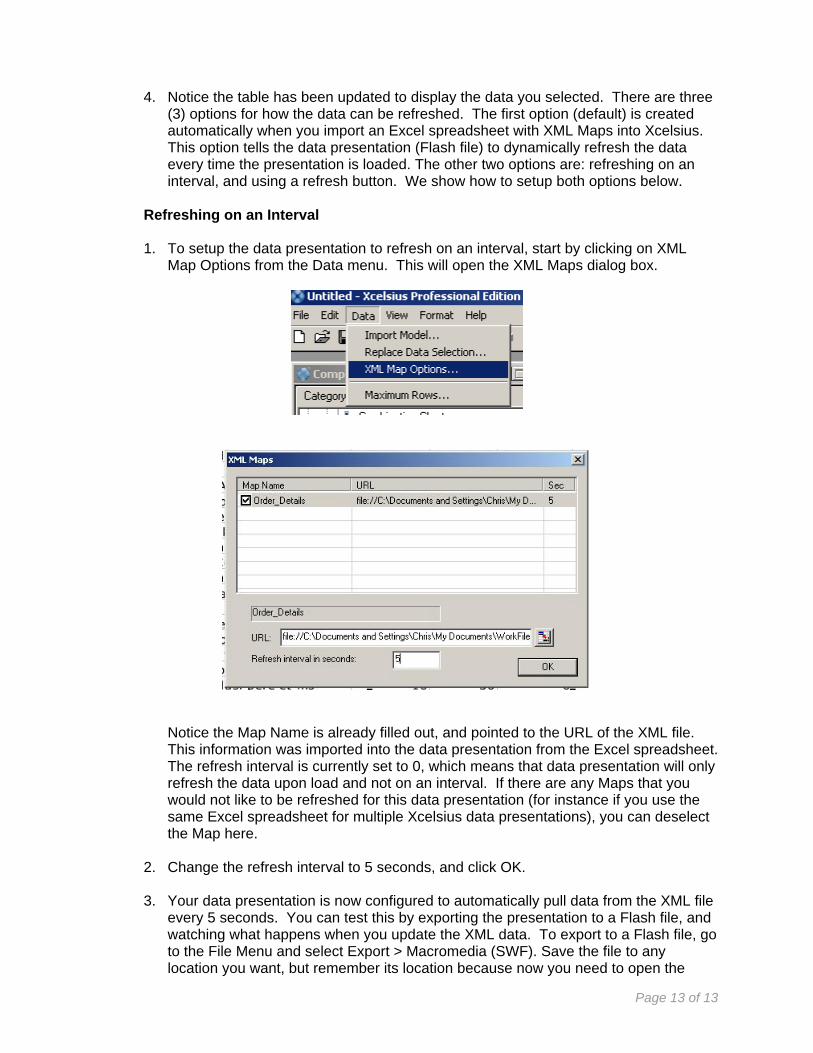
1. To setup the data presentation to refresh on an interval, start by clicking on XML
Map Options from the Data menu. This will open the XML Maps dialog box.
Notice the Map Name is already filled out, and pointed to the URL of the XML file. This information was imported into the data presentation from the Excel spreadsheet. The refresh interval is currently set to 0, which means that data presentation will only refresh the data upon load and not on an interval. If there are any Maps that you would not like to be refreshed for this data presentation (for instance if you use the same Excel spreadsheet for multiple Xcelsius data presentations), you can deselect the Map here.
2. Change the refresh interval to 5 seconds, and click OK. 3. Your data presentation is now configured to automatically pull data from the XML file
every 5 seconds. You can test this by exporting the presentation to a Flash file, and watching what happens when you update the XML data. To export to a Flash file, go to the File Menu and select Export > Macromedia (SWF). Save the file to any location you want, but remember its location because now you need to open the
Page 14 of 14
presentation (Flash file) in Internet Explorer (IE). Navigate to the Flash file and double click to open it in IE. (If you haven’t previously done so, you will need to “associate” Flash files with Internet Explorer in order to open Flash files in IE. See Windows Help for instructions.) You will see the table that was created with all of your data. With the data presentation (Flash file) open, go to the XML file and make a change that will be visible in the table. Save your XML and then watch the presentation change as it pulls the updated data from the XML file.
Refreshing Using a Refresh Button
1. The second option for updating the data is to add a refresh button to the data
presentation, so that the presentation viewer can click the button anytime to check for new data. First, go to the Xcelsius work area and open the XML Maps dialog box from Data > XML Map Options and change the refresh interval back to 0, if you set it to 5 during the last steps.
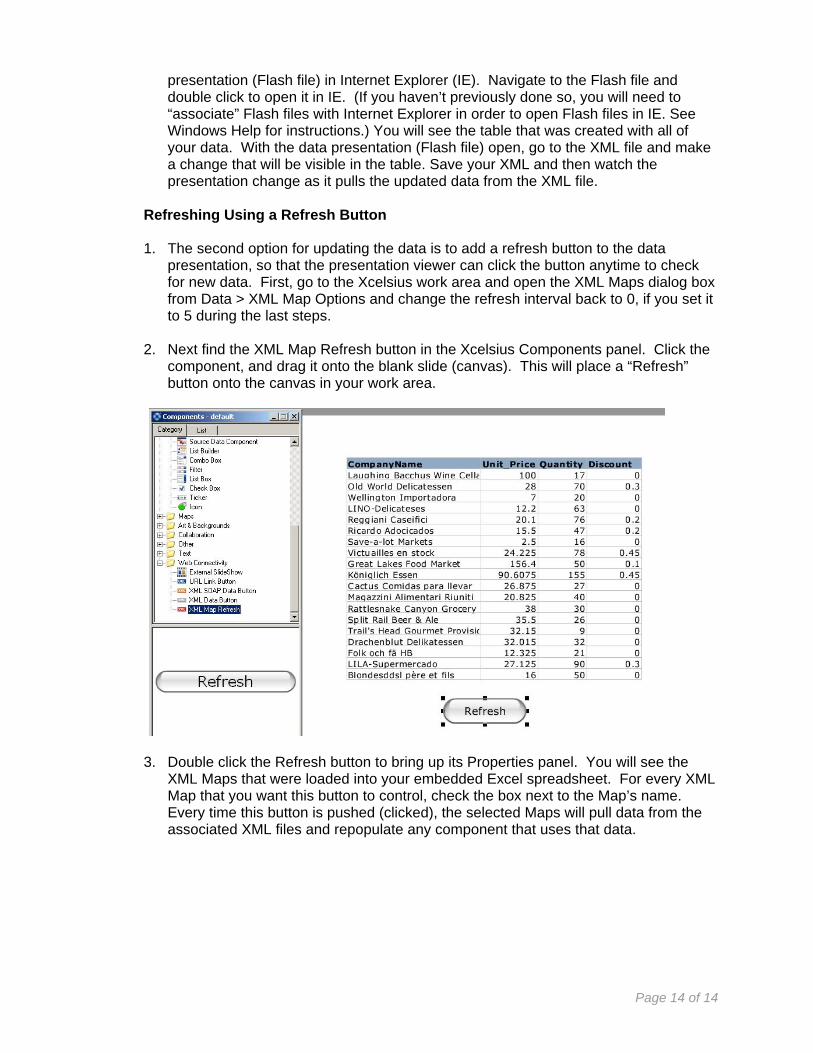
2. Next find the XML Map Refresh button in the Xcelsius Components panel. Click the
component, and drag it onto the blank slide (canvas). This will place a “Refresh” button onto the canvas in your work area.
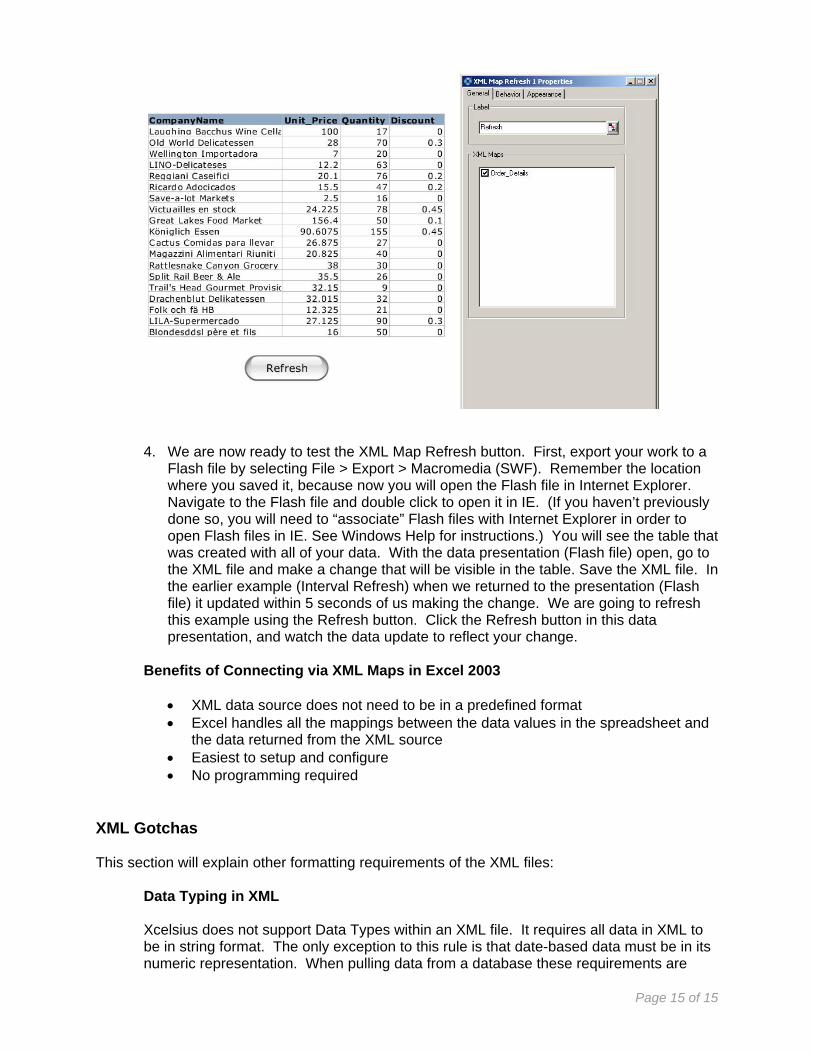
3. Double click the Refresh button to bring up its Properties panel. You will see the XML Maps that were loaded into your embedded Excel spreadsheet. For every XML Map that you want this button to control, check the box next to the Map’s name. Every time this button is pushed (clicked), the selected Maps will pull data from the associated XML files and repopulate any component that uses that data.
Page 15 of 15
4. We are now ready to test the XML Map Refresh button. First, export your work to a Flash file by selecting File > Export > Macromedia (SWF). Remember the location where you saved it, because now you will open the Flash file in Internet Explorer. Navigate to the Flash file and double click to open it in IE. (If you haven’t previously done so, you will need to “associate” Flash files with Internet Explorer in order to open Flash files in IE. See Windows Help for instructions.) You will see the table that was created with all of your data. With the data presentation (Flash file) open, go to the XML file and make a change that will be visible in the table. Save the XML file. In the earlier example (Interval Refresh) when we returned to the presentation (Flash file) it updated within 5 seconds of us making the change. We are going to refresh this example using the Refresh button. Click the Refresh button in this data presentation, and watch the data update to reflect your change.
Benefits of Connecting via XML Maps in Excel 2003
• XML data source does not need to be in a predefined format • Excel handles all the mappings between the data values in the spreadsheet and
the data returned from the XML source • Easiest to setup and configure • No programming required
XML Gotchas This section will explain other formatting requirements of the XML files:
Data Typing in XML
Xcelsius does not support Data Types within an XML file. It requires all data in XML to be in string format. The only exception to this rule is that date-based data must be in its numeric representation. When pulling data from a database these requirements are
Page 16 of 16
usually not an issue, but if another application creates the XML or a user is converting text- based data to a XML, these rules need to be taken into account. Note: this applies to using the Web Services and the XML Data button connectivity options described in other Tech Tip Guides, it does not apply to the Excel 2003 Map option.
Non-Table-Based XML in Excel 2003 Maps
If the data being pulled into Excel Maps is in a non-table-based format, the entire root level of the XML file should be pulled into the spreadsheet instead of picking individual elements. A non-table-based format would be an XML file that lists each customer followed by the Orders/Invoices that belong to the customer. By pulling in the full root level, we allow Excel to keep the data in the structure of the XML file. By pulling elements individually Excel might make some changes so it can display the data the best way it sees fit.
Multiple Range selections in a single XML
For both the Web Services and the XML Data Button connectivity options, it is possible to define multiple ranges of data to be replaced from the same XML file. In this case the structure will be exactly the same, but just repeated within the XML file. Inside the data element there will be two blocks of data each with their own variable names which match the names of the ranges defined in Xcelsius. If there are more ranges than blocks in the XML file, the whole file will not work properly. But, it is possible to have more data in the XML than is needed for the ranges.