2.2.4 Limitations of the Diary Survey................................................................... 20
2.3 Supplementary Diary Survey of People with Diabetes/Impaired Glucose Tolerance............................................................................................................. 21
4.1 Exposure to Intense Sweeteners ......................................................................... 58
4.1.1 Proportion of Survey Respondents Exposed to Each Intense Sweetener .... 58
4.1.2 Mean Daily Exposures (mg/day) ................................................................. 60
4.1.3 Daily Exposures by Body Weight (mg/kg bw/day) ..................................... 66
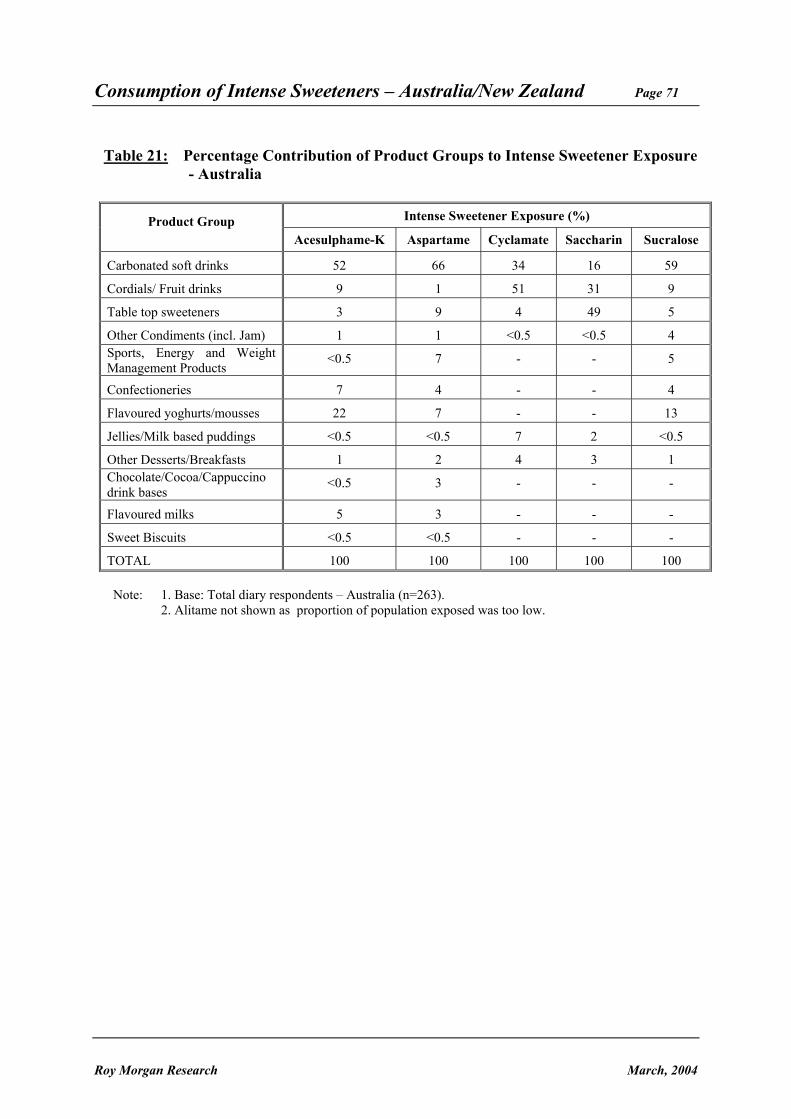
4.2 Contribution of Each Food Group to Intense Sweetener Exposures .................. 70
4.3 Comparison of Intense Sweetener Exposure with Acceptable Daily Intake ...... 73
4.4 Summary of Diary Survey Findings ................................................................... 79
5. KEY FINDINGS - DIARY SURVEY OF PEOPLE WITH DIABETES OR IMPAIRED GLUCOSE TOLERANCE ................................................................ 80
5.1 Exposure to Intense Sweeteners ......................................................................... 80
5.1.1 Proportion of Respondents Exposed to Intense Sweeteners ........................ 80
5.1.2 Mean Daily Exposures (mg/day) ................................................................. 82
5.1.3 Daily Exposures by Body Weight (mg/kg bw/day) ..................................... 86
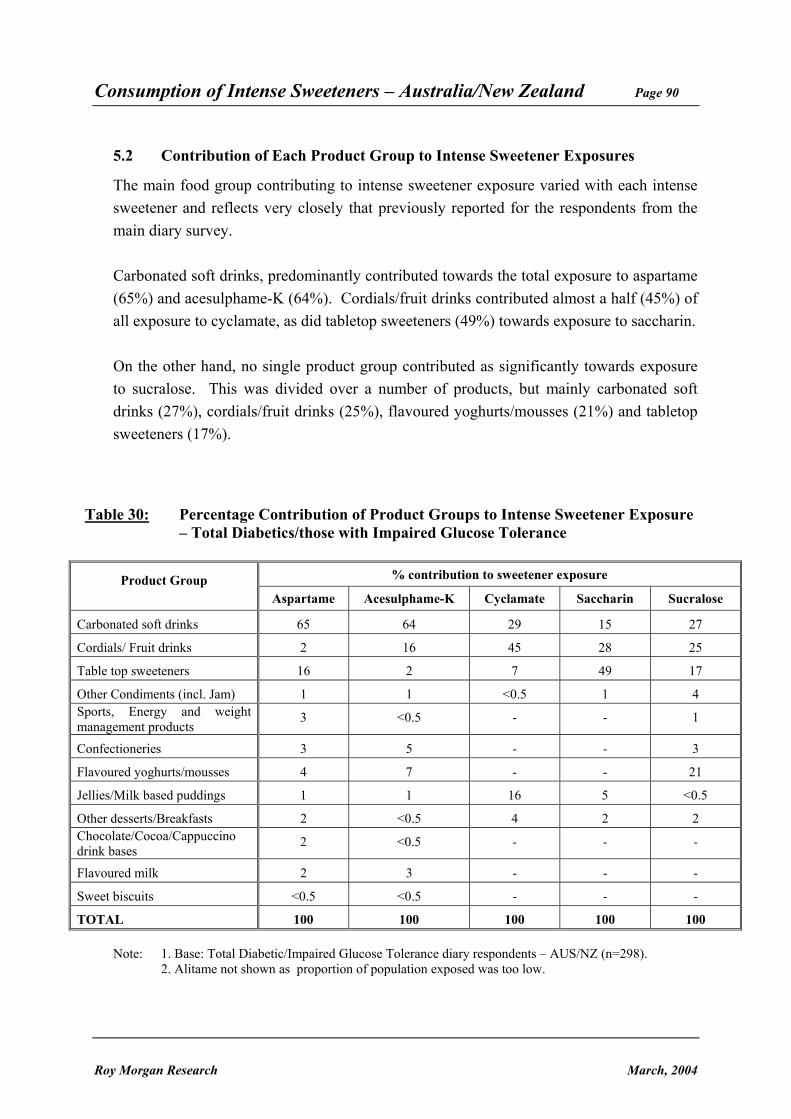
5.2 Contribution of Each Product Group to Intense Sweetener Exposures .............. 90
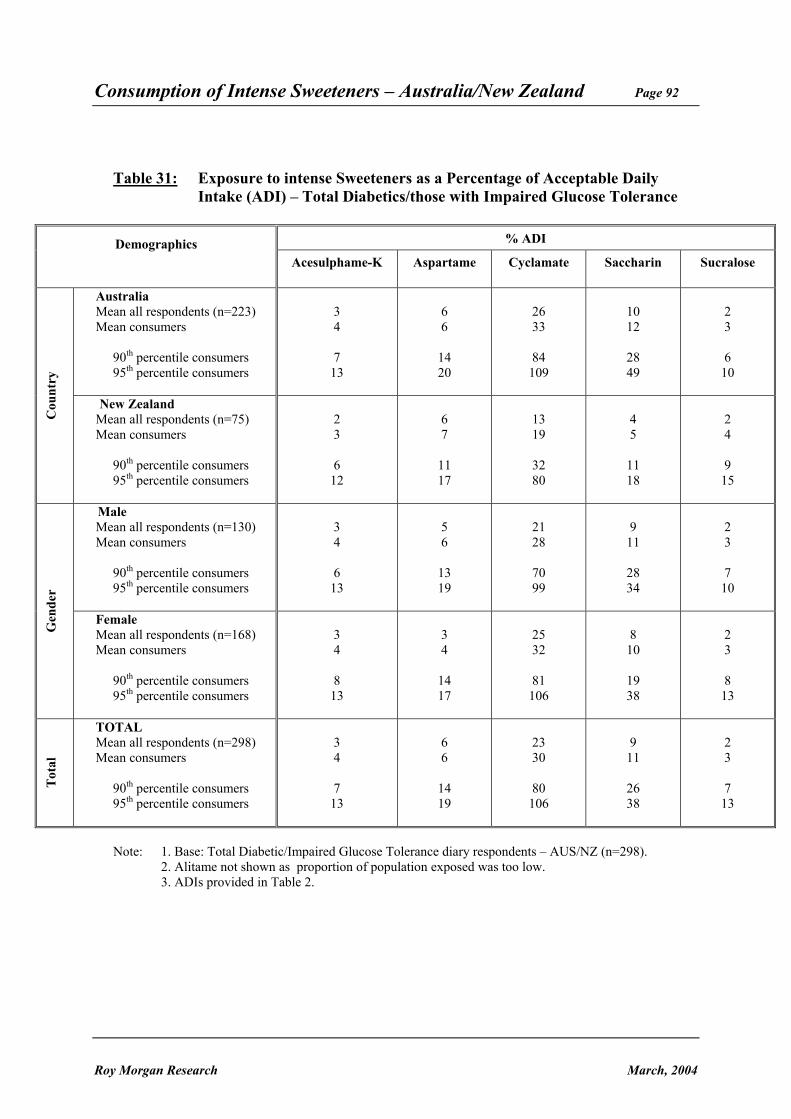
5.3 Comparison of Intense Sweetener Exposure with Acceptable Daily Intake ...... 91
5.4 Summary of Diary Findings – People with Diabetes/Impaired Glucose Tolerance............................................................................................................. 93
Consumption of Intense Sweeteners – Australia/New Zealand
Roy Morgan Research March, 2004
INDEX OF TABLES
Table 1: Classification of Intense Sweeteners under the Australia New Zealand Food Standards Code 2002 ............................................................................................ 2
Table 2: Intense Sweeteners Approved for Use in Australia and New Zealand................. 3
Table 3: Demographic Summary Profile of Screener Sample versus Population Profile 12
Table 10: Screener Survey - Percentage of People Consuming From Product Groups at Least Once in the Last 7 Days ............................................................................ 29
Table 11: Screener Survey - Percentage of People Consuming From Product Groups at Least Once in the Last 7 Days - 1994 versus 2002-03 (Australians aged 12-39)30
Table 12: Daily Consumption of Product Groups from the Screener Survey – Australia.. 31
Table 13: Daily Consumption of Product Groups from the Screener Survey – New Zealand ....................................................................................................... 32
Table 14: Daily Consumption of Product Groups from the Screener Survey - 1994 versus 2002-03 (Australians aged 12-39 years)......................................... 34
Table 15: Daily Consumption of Product Groups from the Screener Survey - 1994 versus 2002-03 (Australian Males aged 12-39 years)................................ 35
Table 16: Daily Consumption of Product Groups from the Screener Survey - 1994 versus 2002-03 (Australian Females aged 12-39 years) ............................ 36
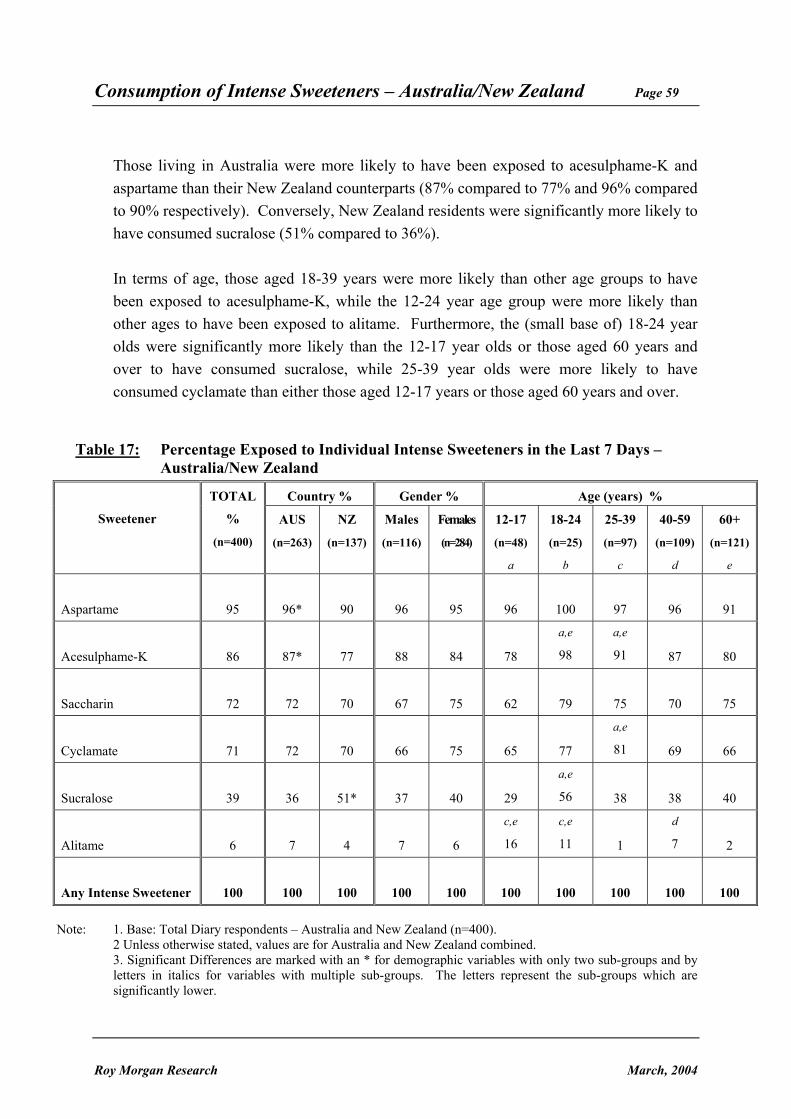
Table 17: Percentage Exposed to Individual Intense Sweeteners in the Last 7 Days – Australia/New Zealand ....................................................................................... 59
Table 21: Percentage Contribution of Product Groups to Intense Sweetener Exposure - Australia .............................................................................................................. 71
Table 22: Percentage Contribution of Product Groups to Intense Sweetener Exposure – New Zealand ....................................................................................................... 72
Table 23: Exposure to Sweeteners as a Percentage of Acceptable Daily Intake – Australia/New Zealand ....................................................................................... 75
Table 24: Exposure to Intense Sweeteners as a Percentage of Acceptable Daily Intake –Australia .............................................................................................................. 76
Table 25: Exposure to Intense Sweeteners as a Percentage of Acceptable Daily Intake 1994 versus 2002-03 (Australians aged 12-39 years)......................................... 77
Table 26: Exposure to Intense Sweeteners as a Percentage of Acceptable Daily Intake – New Zealand ....................................................................................................... 78
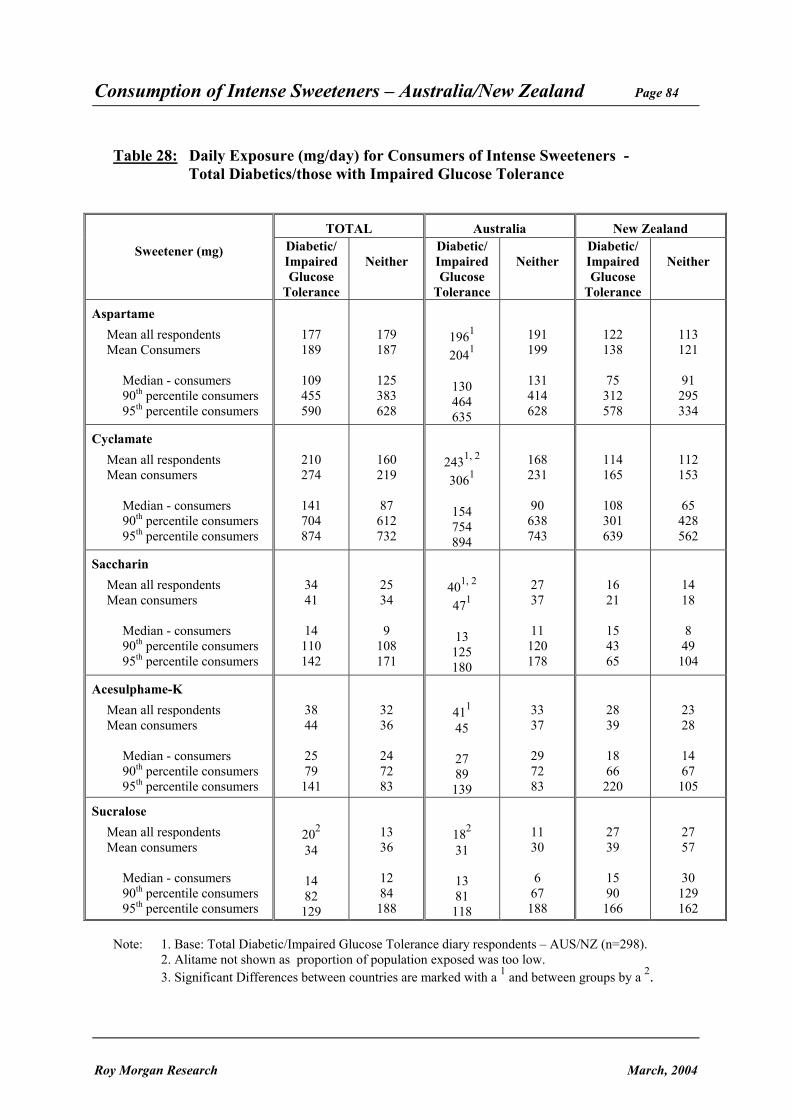
Table 27: Consumption of Intense Sweeteners in the Last 7 Days – Total Diabetics/those with Impaired Glucose Tolerance.................................... 81
Table 28: Daily Exposure (mg/day) for Consumers of Intense Sweeteners - Total Diabetics/those with Impaired Glucose Tolerance.................................... 84
Table 29: Exposure (mg/kg bw) for Consumers of Intense Sweeteners - Total Diabetics/those with Impaired Glucose Tolerance.................................... 87
Table 30: Percentage Contribution of Product Groups to Intense Sweetener Exposure – Total Diabetics/those with Impaired Glucose Tolerance.................................... 90
Table 31: Exposure to intense Sweeteners as a Percentage of Acceptable Daily Intake (ADI) – Total Diabetics/those with Impaired Glucose Tolerance ...................... 92
Consumption of Intense Sweeteners – Australia/New Zealand
Appendix 2: Diary Measurements by Product Groups ................................................... 118
Appendix 3: Letter Sent to Diary Acceptors................................................................... 120
Appendix 4: Number of Respondents by Key Demographics (Unweighted)................. 121
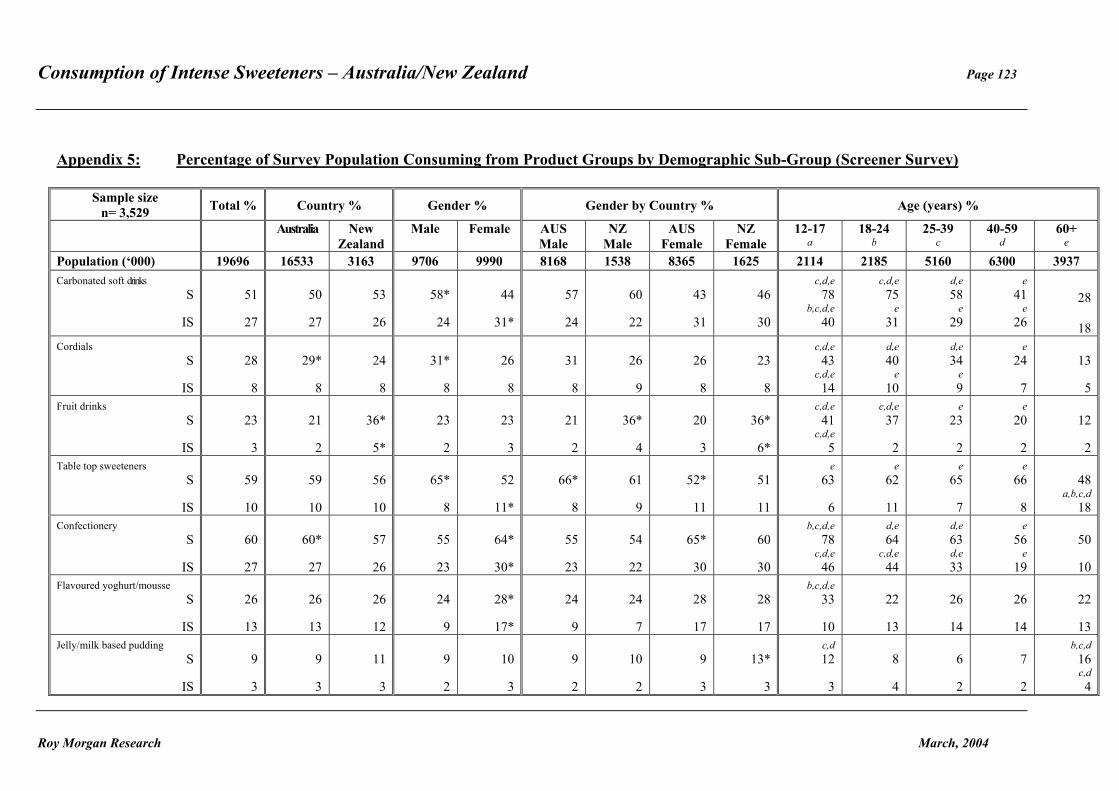
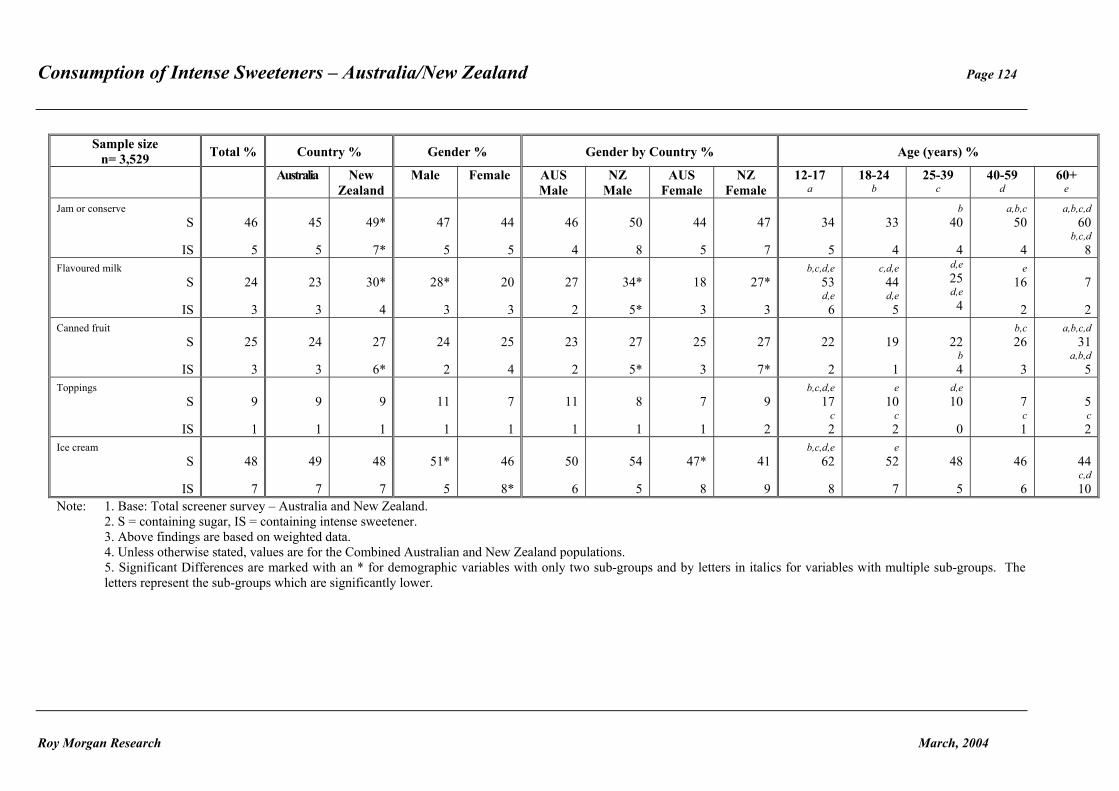
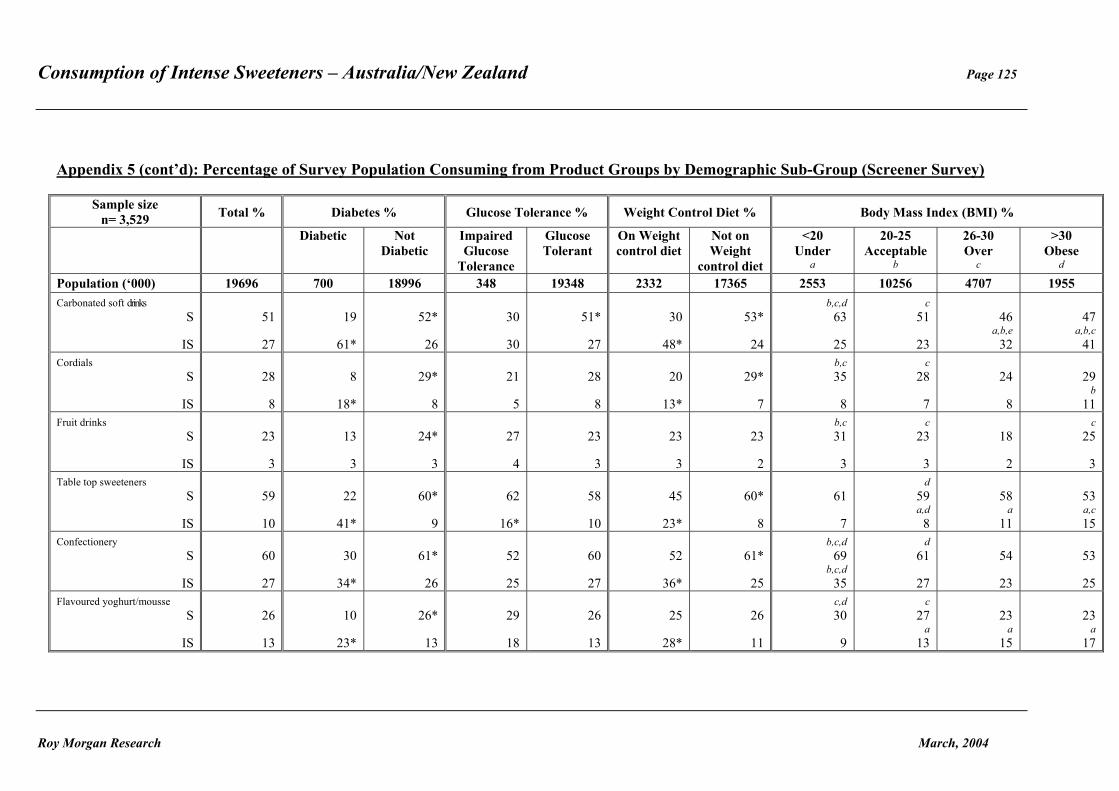
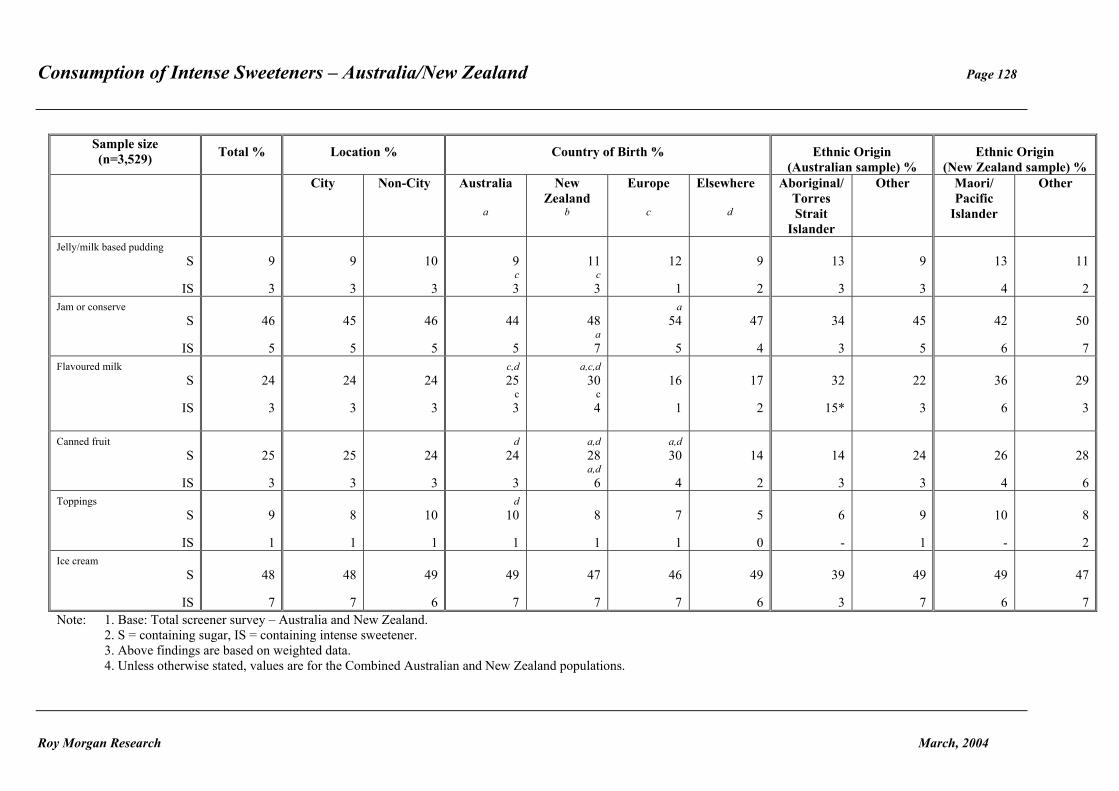
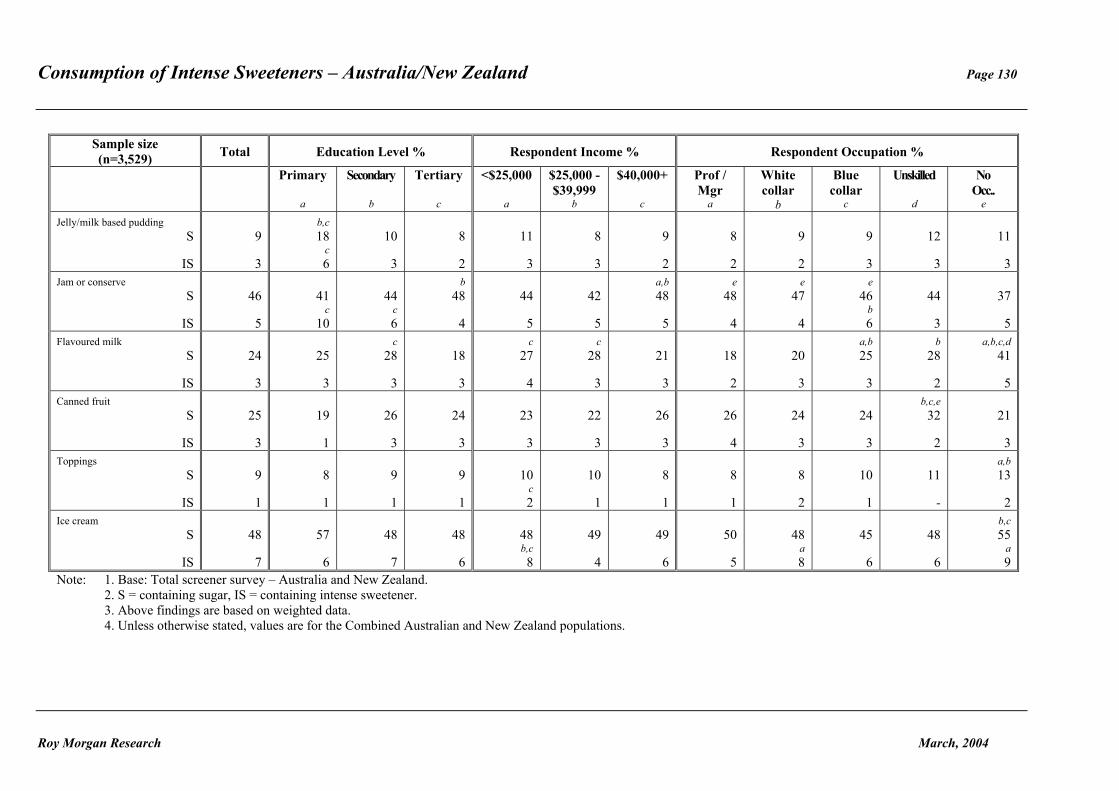
Appendix 5: Percentage of Survey Population Consuming from Product Groups by Demographic Sub-Group (Screener Survey) ............................................. 123
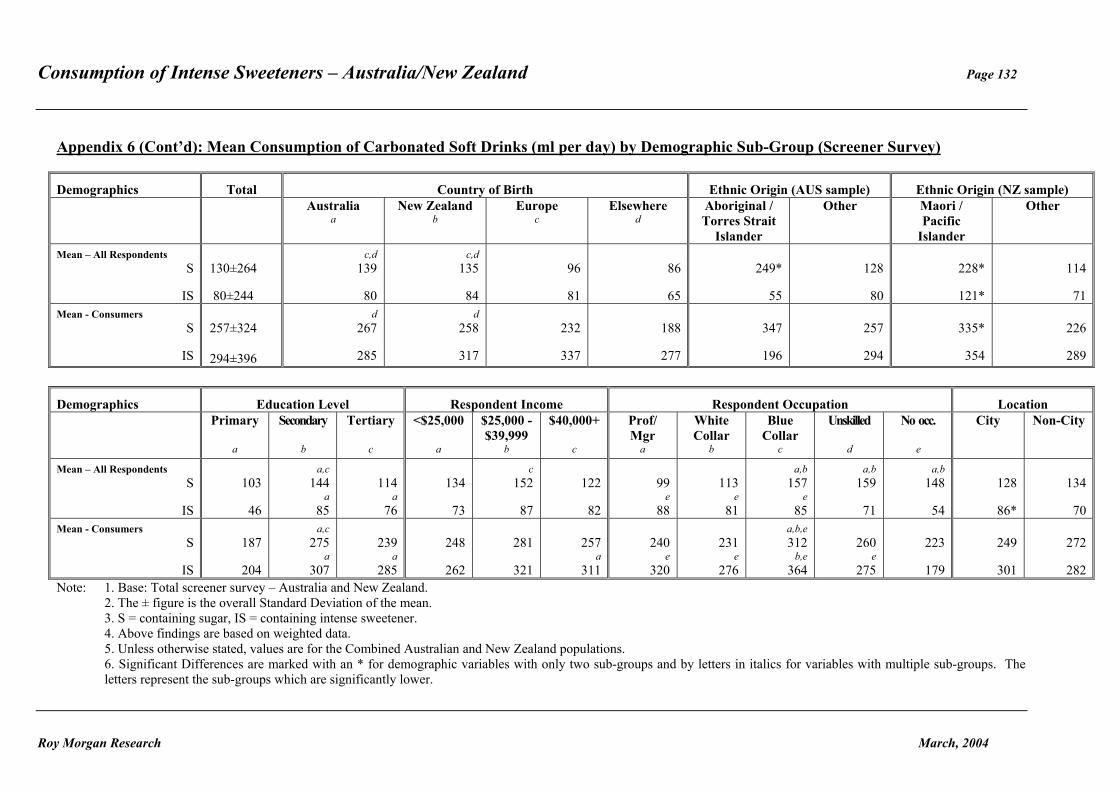
Appendix 6: Mean Consumption of Carbonated Soft Drinks (ml per day) by Demographic Sub-Group (Screener Survey) ............................................. 131
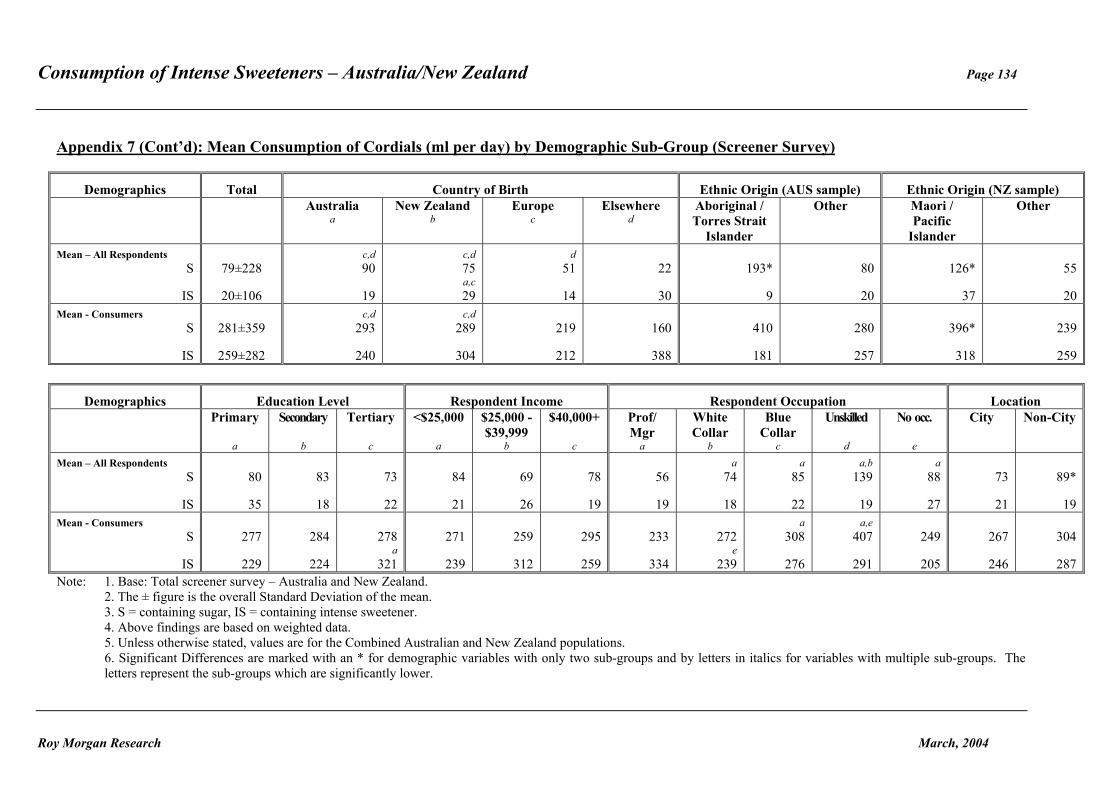
Appendix 7: Mean Consumption of Cordials (ml per day) by Demographic Sub-Group (Screener Survey)....................................................................................... 133
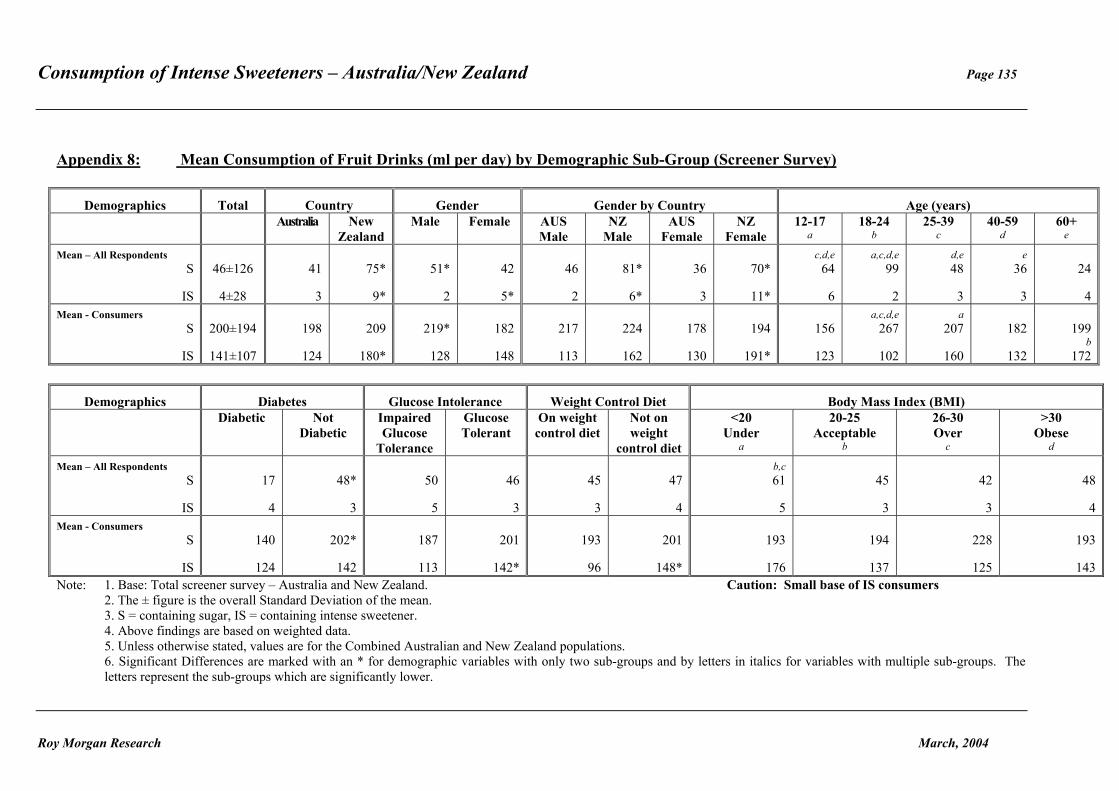
Appendix 8: Mean Consumption of Fruit Drinks (ml per day) by Demographic Sub-Group (Screener Survey).................................................................... 135
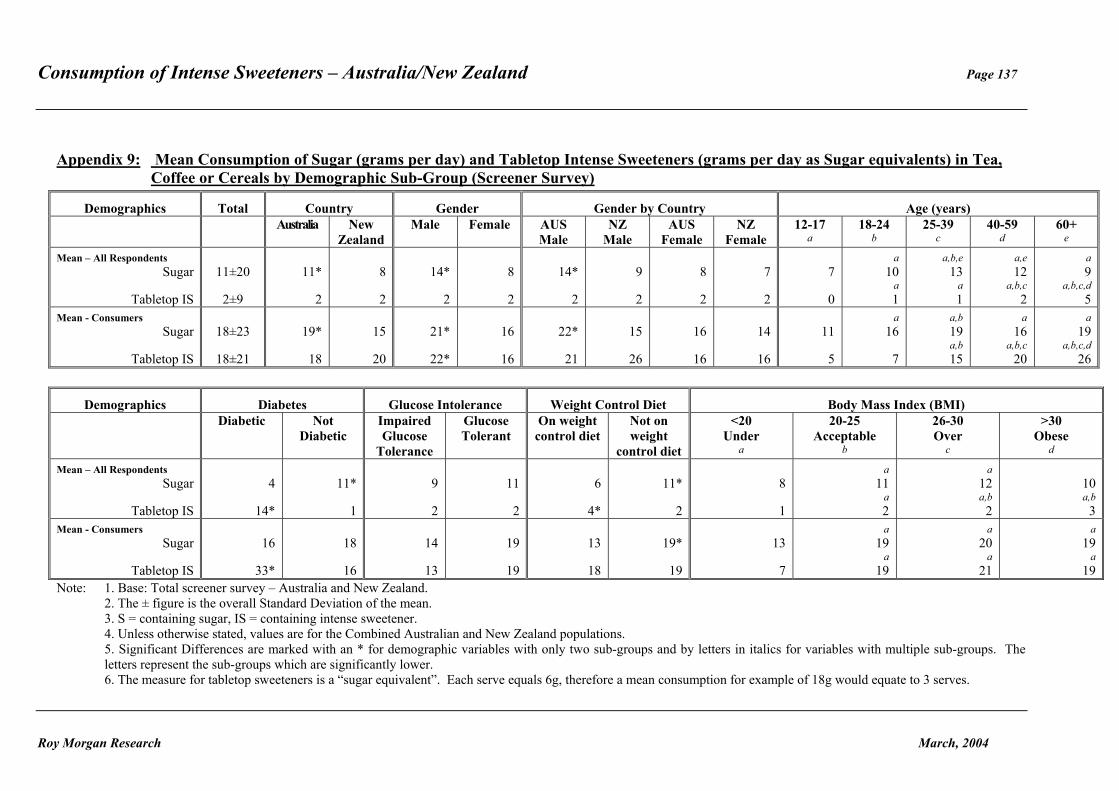
Appendix 9: Mean Consumption of Sugar (grams per day) and Tabletop Intense Sweeteners (grams per day as Sugar equivalents) in Tea, Coffee or Cereals by Demographic Sub-Group (Screener Survey) ........................................ 137
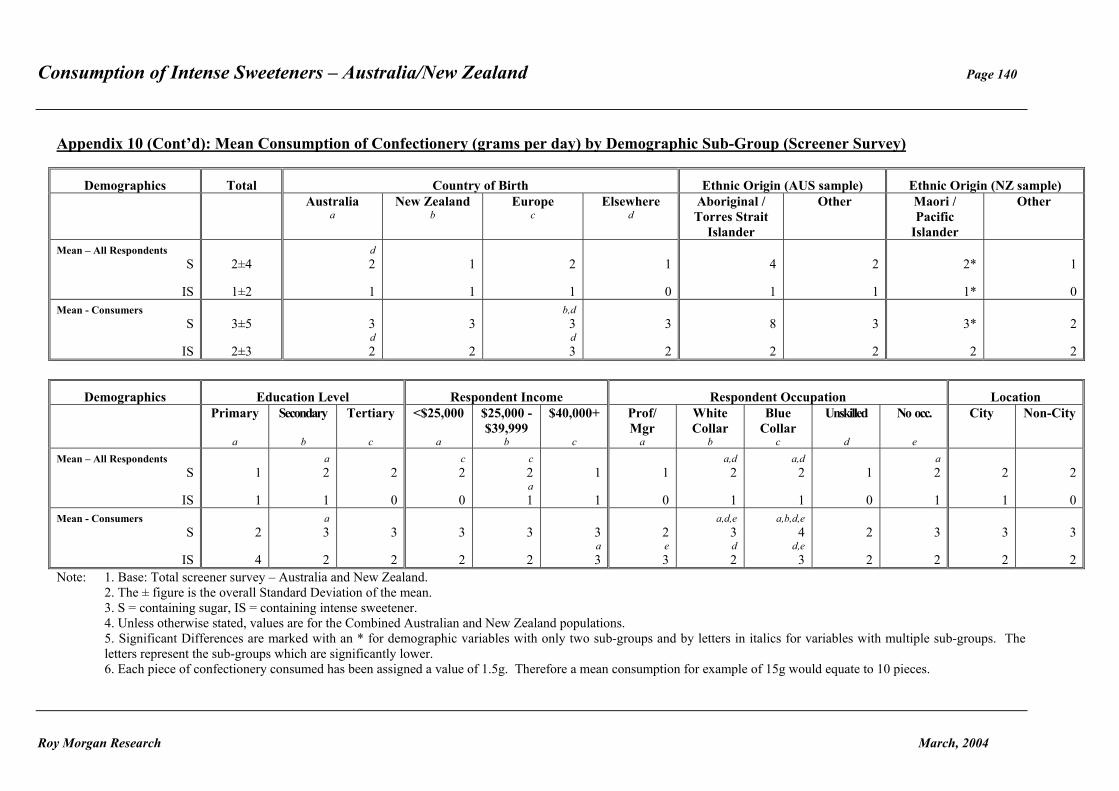
Appendix 10: Mean Consumption of Confectionery (grams per day) by Demographic Sub-Group (Screener Survey).................................................................... 139
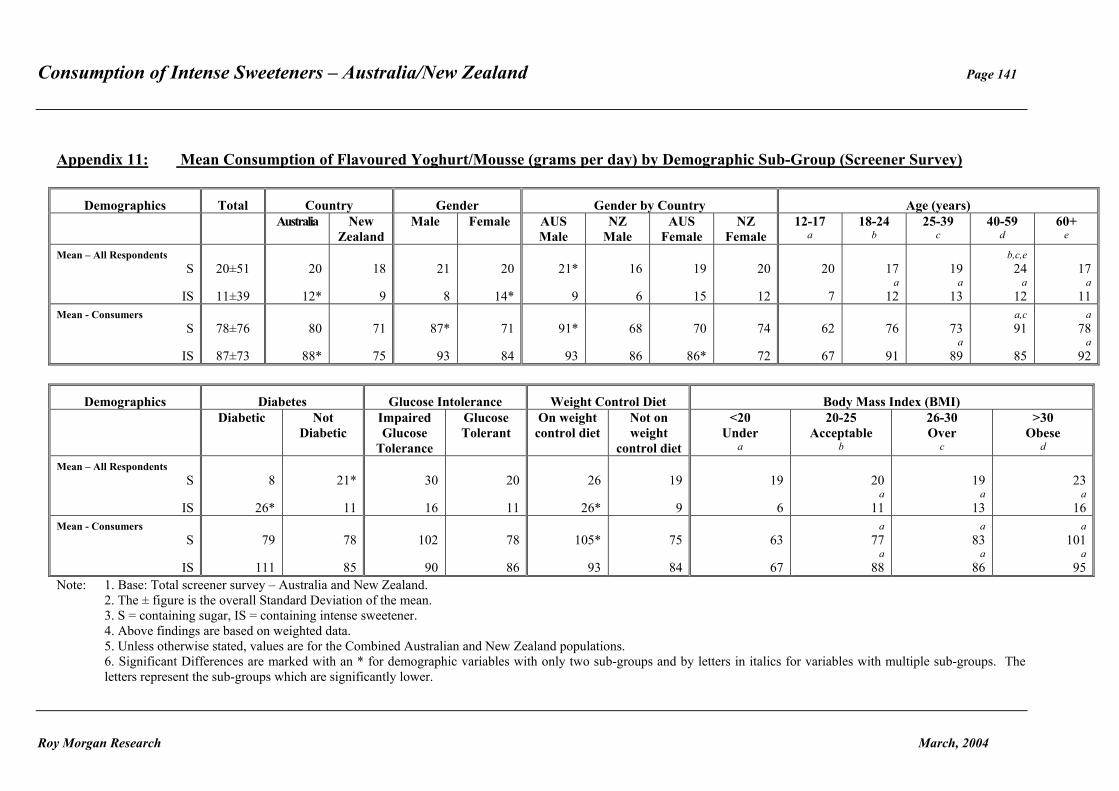
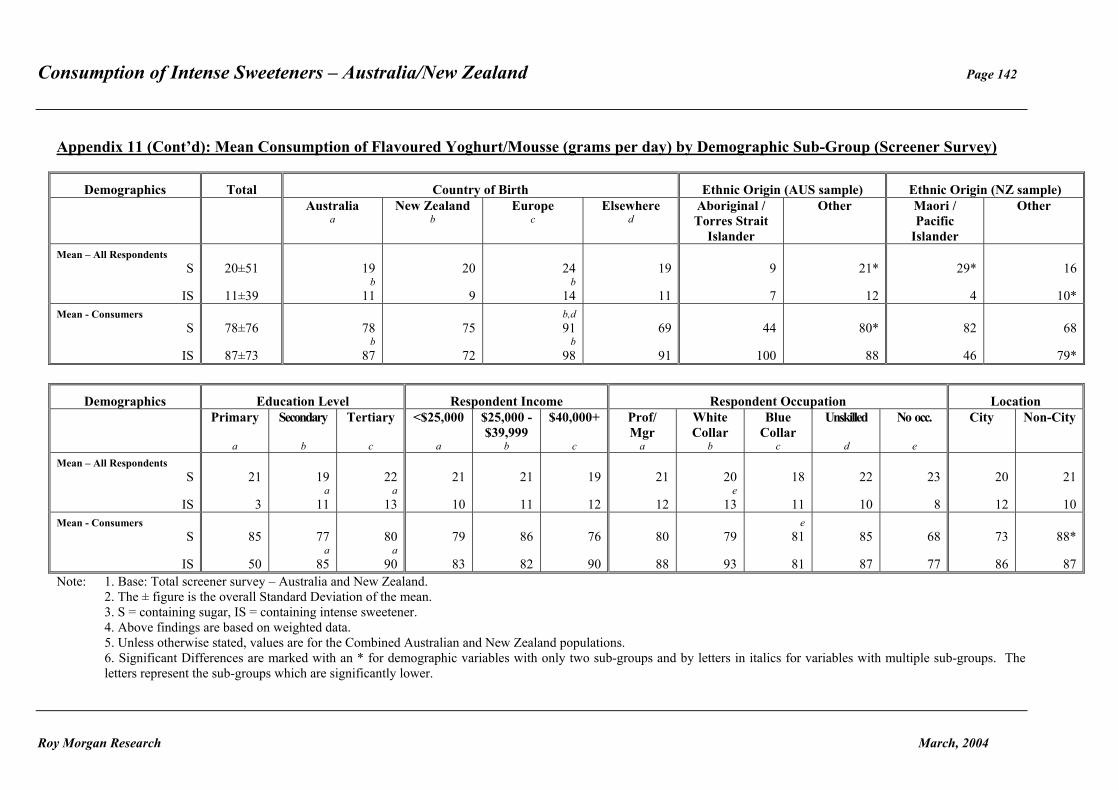
Appendix 11: Mean Consumption of Flavoured Yoghurt/Mousse (grams per day) by Demographic Sub-Group (Screener Survey) ............................................. 141
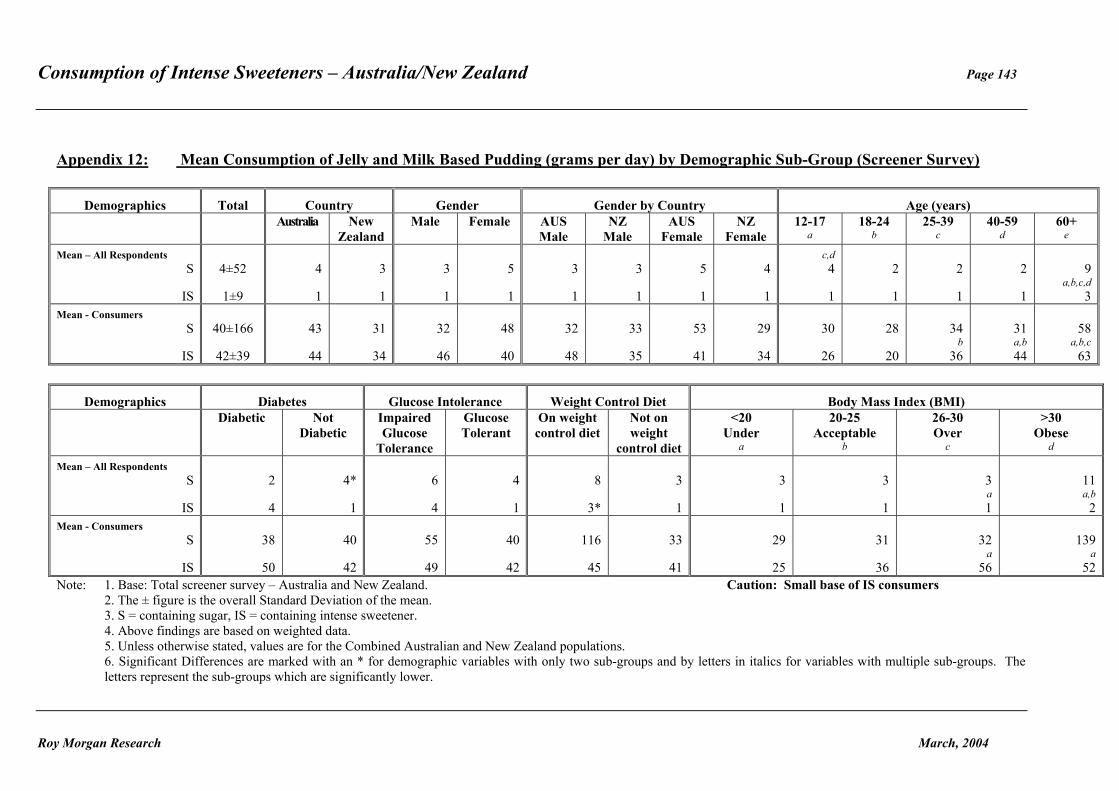
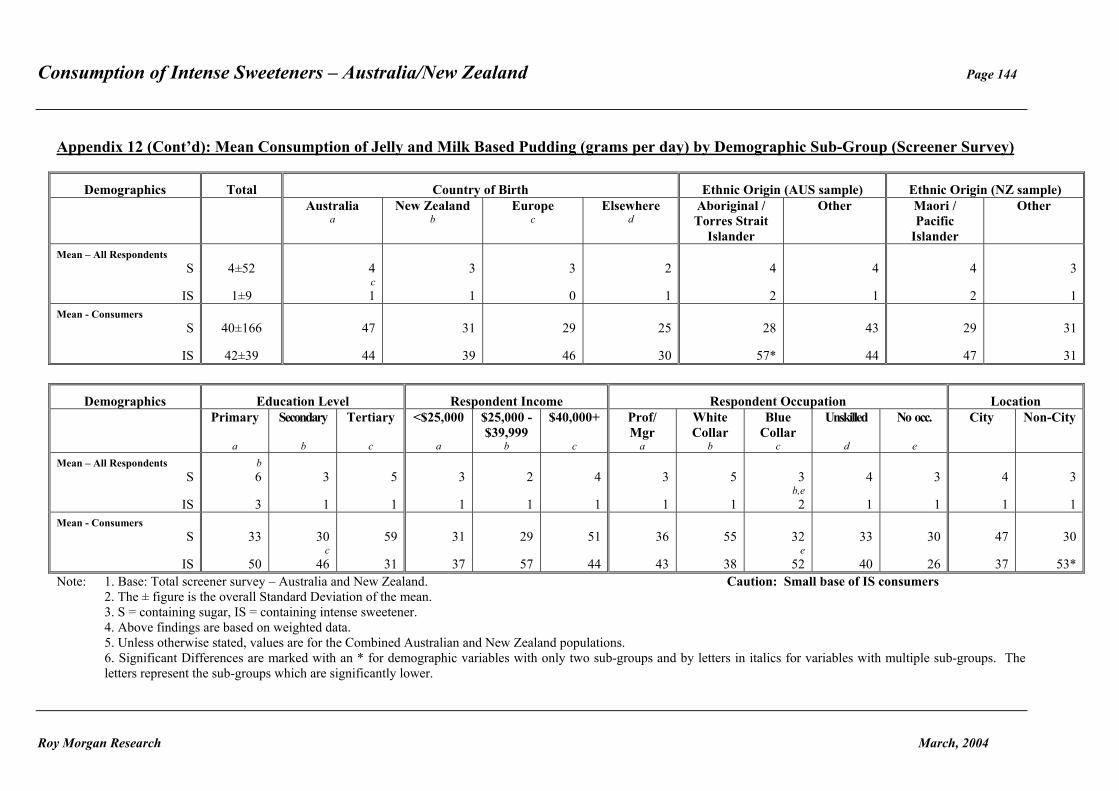
Appendix 12: Mean Consumption of Jelly and Milk Based Pudding (grams per day) by Demographic Sub-Group (Screener Survey) ............................................. 143
Appendix 13: Mean Consumption of Jam or Conserve (grams per day) by Demographic Sub-Group (Screener Survey).................................................................... 145
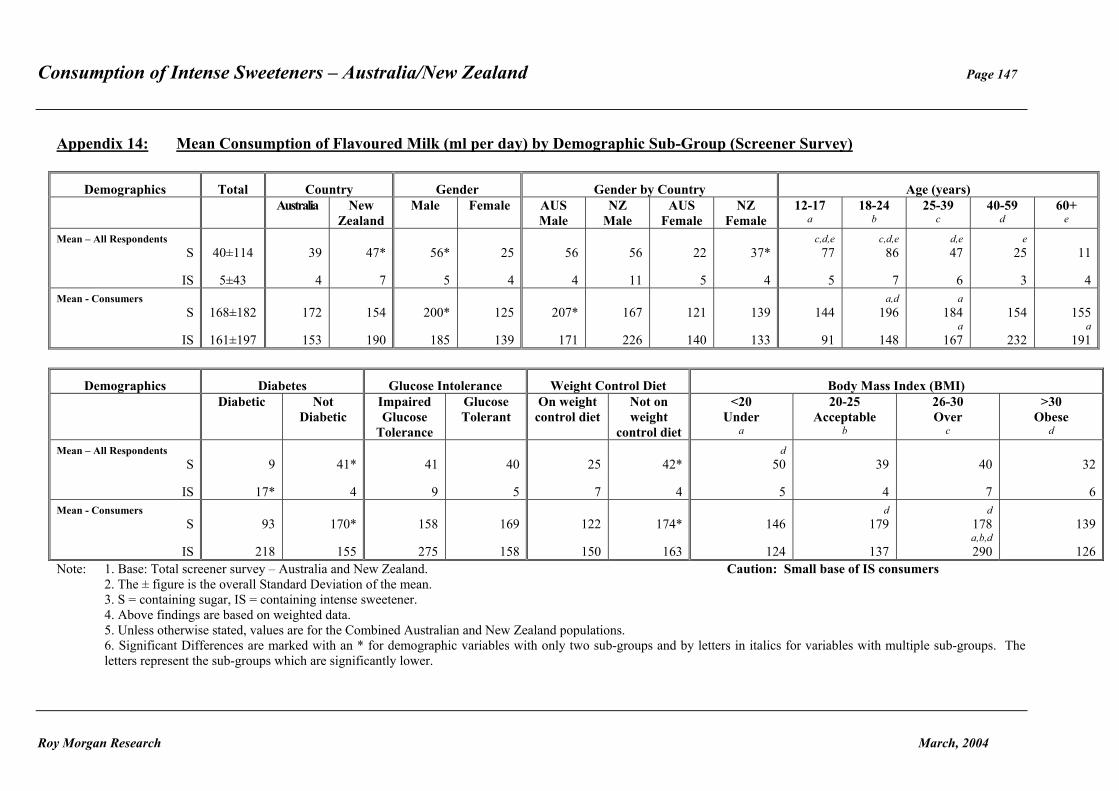
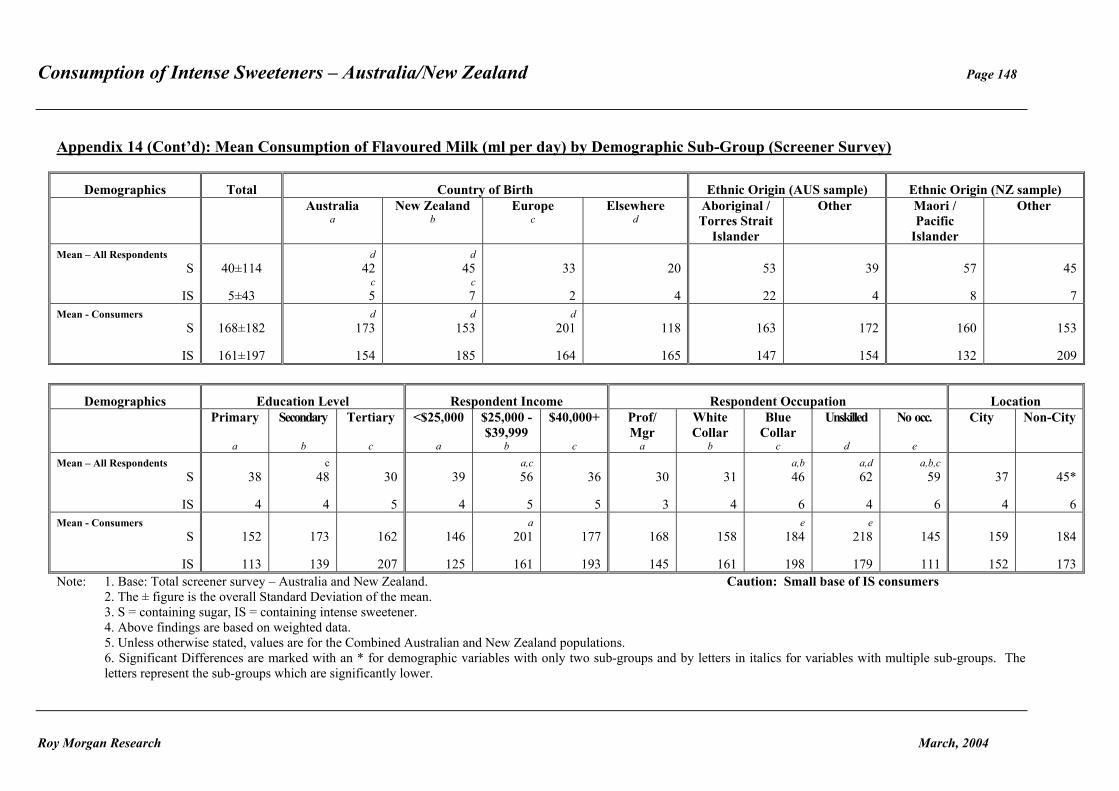
Appendix 14: Mean Consumption of Flavoured Milk (ml per day) by Demographic Sub-Group (Screener Survey).................................................................... 147
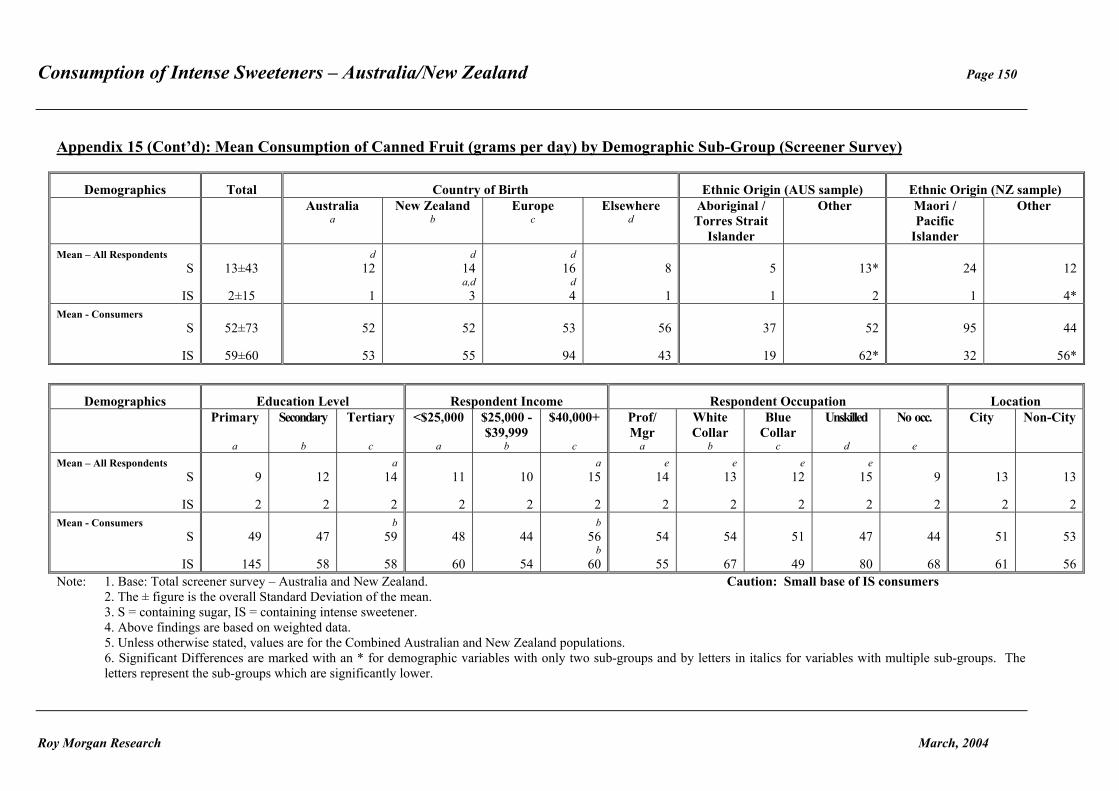
Appendix 15: Mean Consumption of Canned Fruit (grams per day) by Demographic Sub-Group (Screener Survey).................................................................... 149
Appendix 16: Mean Consumption of Toppings (grams per day) by Demographic Sub-Group (Screener Survey).................................................................... 151
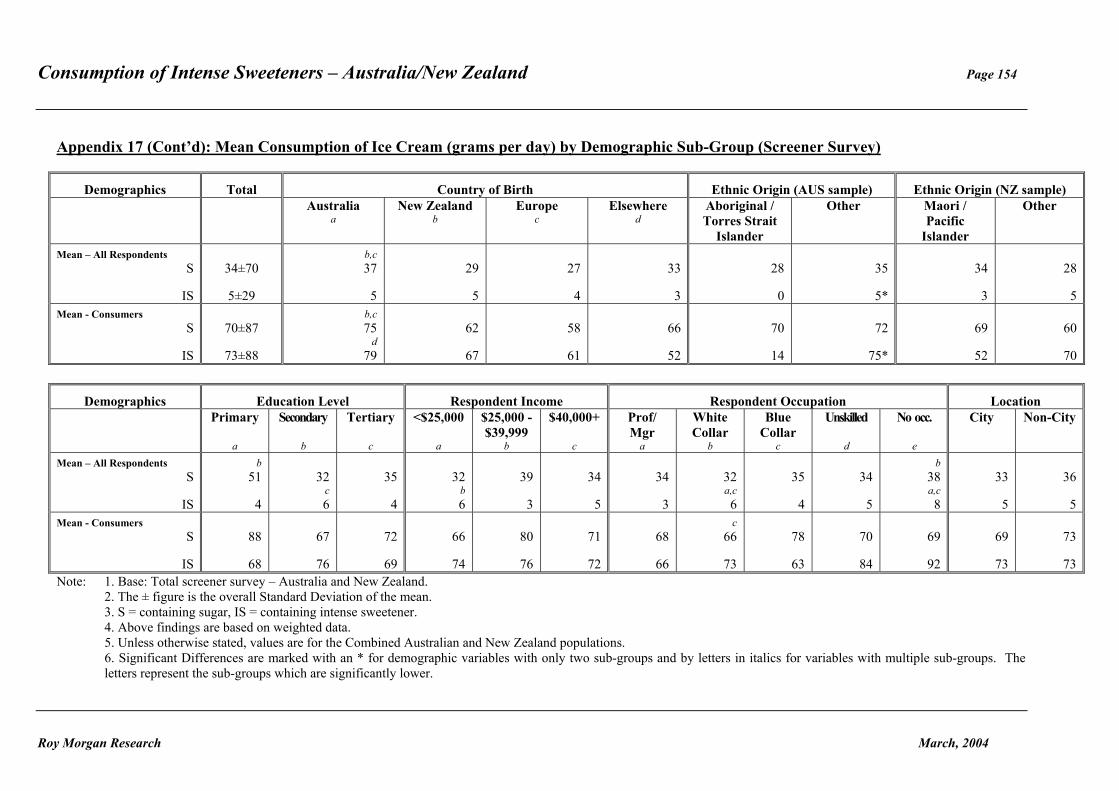
Appendix 17: Mean Consumption of Ice Cream (grams per day) by Demographic Sub-Group (Screener Survey).................................................................... 153
Consumption of Intense Sweeteners – Australia/New Zealand
Roy Morgan Research March, 2004
Appendix 18: Mean Consumption by Body Weight of Carbonated Soft Drinks (ml per kilogram of body weight per day) by Demographic Sub-Group (Screener Survey)....................................................................................................... 155
Appendix 19: Mean Consumption by Body Weight of Cordial (ml per kilogram of body weight per day) by Demographic Sub-Group (Screener Survey).............. 157
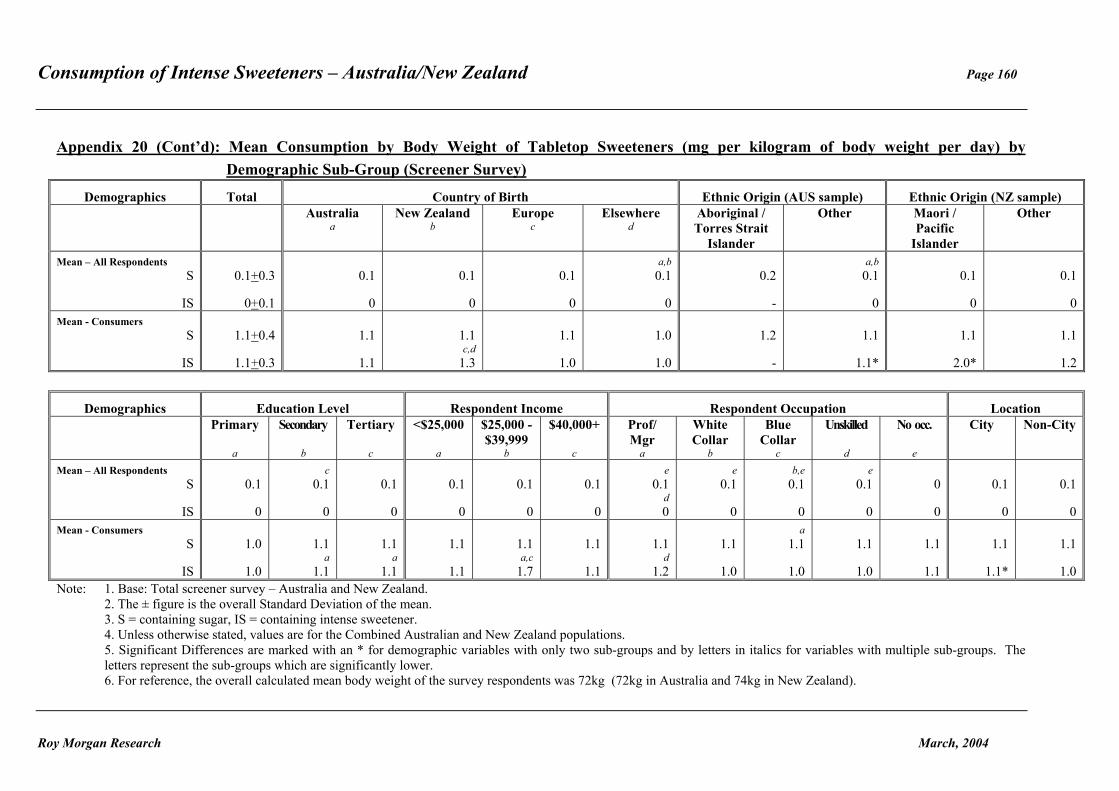
Appendix 20: Mean Consumption by Body Weight of Tabletop Sweeteners (mg per kilogram of body weight per day) by Demographic Sub-Group (Screener Survey)....................................................................................................... 159
Appendix 21: Eligibility Criteria for Main Diary Survey (Non-Diabetics/Non-Impaired Glucose Tolerance) .................................................................................... 161
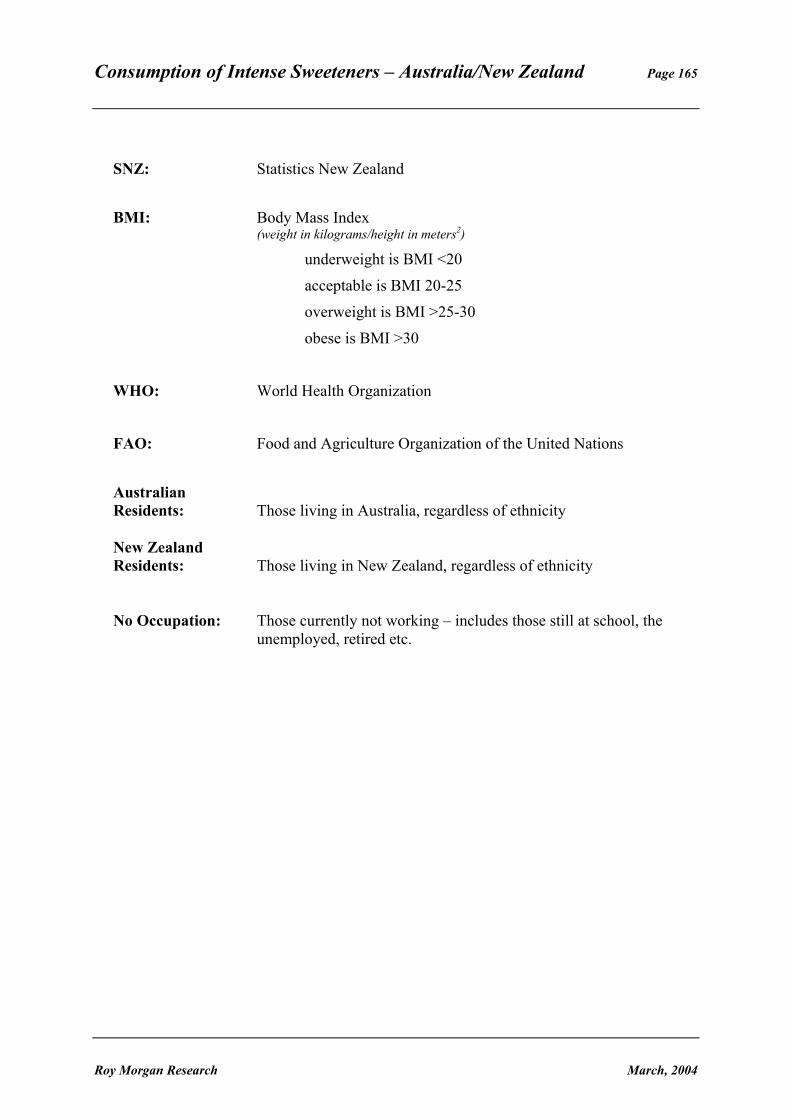
Appendix 22: Glossary of Terms ...................................................................................... 163
Consumption of Intense Sweeteners – Australia/New Zealand Page i
Roy Morgan Research March, 2004
EXECUTIVE SUMMARY Background Food additives permitted for use in the Australian and New Zealand food supply are identified in the joint Australia New Zealand Food Standards Code (‘the Code’). In December 2000 the Code was adopted to replace both the Australian Food Standards Code and relevant New Zealand Food Regulations, although the standard covering food additives (Standard 1.3.1) was in place before December 2000. There was a two-year transition period before the new Code became fully implementable from 20 December 2002. Standard 1.3.1 of the Code permits eight intense sweeteners to be used - cyclamate, saccharin, aspartame, acesulphame-K, sucralose, alitame, neotame and thaumatin. In 1994, the then National Food Authority commissioned Roy Morgan Research to undertake preliminary research into intense sweetener consumption patterns in Australia. The aims of that research were to provide baseline data for 12 to 39 year old Australians on exposure to the intense sweeteners cyclamate, saccharin, aspartame and acesulphame-K and to identify sub-groups of the population who may have been at risk of exceeding the Acceptable Daily Intake (ADI)1 for individual intense sweeteners. Dietary exposure was estimated by combining survey data on individual respondents’ weekly consumption of different foods with data on the level of intense sweetener in each food. Neither alitame nor sucralose exposure were included in that survey as there were few products containing these two intense sweeteners available in the market at that time. In the 1994 study, high consumers of saccharin and cyclamate had exposures to these sweeteners that approached or exceeded their respective ADIs. The present research forms part of Food Standards Australia New Zealand’s (FSANZ) Evaluation Strategy 2001-2003, designed to assess the impact of implementing the Code (FSANZ 2001). This study uses the 1994 research as baseline data on Australians’ dietary exposure to intense sweeteners. The parameters of the latest research, however, were extended to include investigation of the consumption patterns and exposure to intense sweeteners of Australians aged 40 years and over, as well as of the New Zealand population. In addition, there was a supplementary diary survey of people with diabetes or impaired glucose tolerance.
1 ADI or Acceptable Daily Intake is the amount of a food additive that can be ingested daily over an entire lifetime without any appreciable risk to health. It is expressed in units of milligrams per kilogram of bodyweight per day (mg/kg bw/day). Food regulators aim to set food standards to ensure a population’s exposure to food additives does not exceed the ADI. However occasional exposure above the ADI does not necessarily indicate a health risk as ADIs incorporate substantial safety margins.
Consumption of Intense Sweeteners – Australia/New Zealand Page ii
Roy Morgan Research March, 2004
Methodology The present research comprised the following three survey groups in both Australia and New Zealand:
• a national telephone (screener) survey of all respondents aged 12 years and over, to determine patterns of consumption of twelve key food groups containing intense sweeteners and to screen respondents in order to select apparent high consumers of these products;
• a diary survey of potential high consumers of products containing intense
sweeteners, selected from the screener survey, to estimate their exposure to individual intense sweeteners; and
• a supplementary diary survey of people with diabetes or impaired glucose
tolerance to estimate their exposure to individual intense sweeteners. In total, 3,529 people were interviewed as part of the screener survey; 2,514 in Australia and 1,015 in New Zealand. The screener survey sample was weighted to represent the overall population distribution in each country. All interviews were administered by computer assisted telephone interviewing (CATI). The fieldwork was conducted over two phases from 30 August – 16 September 2002, and 17 January – 7 February 2003. This phased approach to the screener survey provided more seasonally representative data and also allowed greater control over the sampling methodology, so that any under-representations in the sampling for the initial phase could be remedied in the second phase. Exactly 400 respondents to the screener survey (263 in Australia and 137 in New Zealand), who were identified as potential high consumers of the products containing intense sweeteners, accepted and completed a 7-day diary. Consumption patterns recorded for these consumers may therefore be different to those of the population as a whole. These high consuming respondents included 111 respondents with diabetes or impaired glucose tolerance. A further 187 diabetics or those with impaired glucose tolerance were recruited from other sources to participate in a supplementary 7-day diary survey. Therefore, in total 298 people (223 in Australia and 75 in New Zealand) with either medical condition completed a diary.
Consumption of Intense Sweeteners – Australia/New Zealand Page iii
Roy Morgan Research March, 2004
Summary of Findings – Screener Survey From the screener survey it was clear that there were several population groups who were more likely than others to have consumed products containing intense sweeteners. These sub-groups included females, people with diabetes and those on a weight control diet. In terms of age, the younger age groups were significantly more likely to be consumers of cordials, fruit drinks, flavoured milks and confectioneries containing intense sweeteners. At the other end of the age spectrum, those aged 60 years and over were significantly more likely to have consumed jams and canned fruits containing intense sweeteners, as well as tabletop intense sweeteners. Very few differences were evident between Australia and New Zealand in the proportions of the populations consuming products containing intense sweeteners. New Zealand respondents, however, were more likely than their Australian counterparts to have consumed fruit drinks, canned fruits and jams containing intense sweeteners. Likewise, the mean daily consumption amongst actual consumers of the various products containing intense sweeteners differed very little between Australia and New Zealand (consumers are those respondents who actually consumed from a particular product group – see Appendix 22 for a glossary of terms used in this report). However, the mean daily amount of fruit drinks consumed containing intense sweeteners was higher in New Zealand, while the mean daily consumption of flavoured yoghurts containing intense sweetener was higher in Australia. Overall, the mean daily consumption of products containing intense sweeteners was significantly higher for people with diabetes and those on a weight control diet. A similar finding was evident in the 1994 survey. On the other hand, the sugar sweetened versions of the products tended to be consumed in larger amounts by those without diabetes or not on such diets. In comparison with the 1994 survey, which focused solely on 12-39 year old Australians, there has been a significant increase in the average daily amount of carbonated soft drinks containing intense sweeteners consumed amongst Australian consumers aged 12-39 years. Significant increases were also evident for cordials, flavoured yoghurts/mousses (both particularly amongst Australian male consumers) and flavoured milks (amongst Australian female consumers) containing intense sweeteners. More Australians now consume intense sweetened cordials than in 1994 but fewer consume sugar sweetened cordials and sugar sweetened carbonated soft drinks. Overall, more Australians now consume foods containing intense sweetener (66%) than in 1994 (51%).
Consumption of Intense Sweeteners – Australia/New Zealand Page iv
Roy Morgan Research March, 2004
Summary of Findings – Diary Surveys It is evident from the diary surveys that the mean consumer exposures to all sweeteners measured were well below the ADI for each sweetener. This applied in both Australia and New Zealand, both among those respondents selected from the screener survey as potential high consumers of products containing intense sweeteners, and among those with either diabetes or impaired glucose tolerance who were recruited independently. The estimated mean daily exposure to acesulphame-K amongst 12-39 year old Australian consumers (ie those who were exposed to the sweetener during the 7-day diary period) has increased significantly since 1994. The mean daily exposure to intense sweeteners amongst respondents with diabetes and those with impaired glucose tolerance living in Australia was significantly higher, though, than for their counterparts living in New Zealand. This was particularly the case for aspartame, cyclamate and saccharin. However, it is interesting to note that, the estimated mean daily consumer exposure amongst those with diabetes or impaired glucose tolerance (in both Australia and New Zealand), did not differ significantly from the main diary consumers who did not have either of these medical conditions. As a percentage of the respective ADI, cyclamate exposure was the highest of all the intense sweeteners measured. This was particularly the case amongst the small number of 12-17 year olds recruited from the screener survey who completed a diary. Furthermore, there were some consumers who exceeded the ADI for cyclamate at the 95th percentile exposure level. The products which contributed most to cyclamate exposure were cordials, fruit drinks, carbonated soft drinks (and tabletop sweeteners in New Zealand). Tabletop sweeteners containing cyclamate were permitted in New Zealand, but not Australia, until the Code became enforceable in both countries from 20 December 2002. Under stock-in-trade provisions, these tabletop sweeteners could still be available for sale during 2003. Therefore at the time of the survey, such cyclamate-containing products could still have been available but will not be available for sale in the near future. Similarly, at the time of the survey, it was still possible to buy cordials and soft drinks containing higher levels of saccharin and cyclamate than are now permitted under the Code for products manufactured after 20 December 2002.
Consumption of Intense Sweeteners – Australia/New Zealand Page v
Roy Morgan Research March, 2004
Key Findings:
Mean exposure to all intense sweeteners surveyed was below their ADI;
Acesulphame K exposure (mg/day) has increased in Australia since 1994;
Exposure in relation to each ADI was highest for cyclamate with some consumers exceeding the cyclamate ADI;
Cordials, fruit drinks and carbonated soft drinks were the major contributors to cyclamate exposure;
Consumption amounts of carbonated soft drinks and yoghurts/mousses containing intense sweeteners has increased in Australia since 1994;
Women, diabetics and those on weight control diets were more likely to use foods containing intense sweeteners;
Diabetics and those with impaired glucose tolerance who consume foods containing intense sweeteners were not exposed to higher amounts of intense sweeteners than consumers who have neither of these medical conditions.
Consumption of Intense Sweeteners – Australia/New Zealand Page 1
Roy Morgan Research March, 2004
1. INTRODUCTION
1.1 Background
The use of food additives in the food supply is set out in the Australia New Zealand Food Standards Code (‘the Code’). In December 2000 the Code was adopted and replaced the joint Australian Food Standards Code (‘the Old Code’) and the relevant New Zealand Food Regulations (NZFR). After a two-year transition period, the Code became fully implementable from 20 December 2002. This research forms part of the Food Standards Australia New Zealand’s (FSANZ) Evaluation Strategy 2001-2003 (FSANZ 2001), designed to assess the impact of implementing the Code. Standard 1.3.1 Food Additives of the Code specifies requirements for the use of intense sweeteners and other additives. This standard was adopted in Australia and New Zealand in July 1999, earlier than the adoption of the remainder of the Code (FSANZ 2002).
1.2 Key Features of the Code in Relation to Intense Sweeteners
Prior to the development of the Code, in both Australia and New Zealand, food additive permissions were set out in the individual food commodity standards. The new food additives standard brings the food additives that may be used in all foods together into one generic standard that covers all foods. Some maximum limits for intense sweeteners included under the old Code are retained but some additional restrictions were introduced for cyclamates and saccharin. As previously, a food additive must not be added to a food unless expressly permitted by the Code. Under the old Code and the NZFR, seven intense sweeteners (previously known as artificial sweeteners) were approved for use. In 2001, an eighth intense sweetener, neotame, was approved for use. The approval for use of individual intense sweeteners under the new Code depends on whether the sweetener is listed in Schedule 1 or Schedule 2 of Standard 1.3.1 (see Table 1). Generally, Schedule 1 additives have restricted permissions in specific food groups, whilst Schedule 2 additives are permitted at good manufacturing practice levels (GMP) in the majority of processed foods and beverages, although some sweeteners are listed in both schedules. For sweeteners, there are extra requirements stated in Clause 4 of Standard 1.3.1, which states that where GMP permissions are given, intense sweeteners may only be added to food in an amount
Consumption of Intense Sweeteners – Australia/New Zealand Page 2
Roy Morgan Research March, 2004
necessary to replace the sweetness normally provided by sugars, or as a flavour enhancer. Some sweeteners (aspartame, sucralose and thaumatin) are listed in both schedules as they have GMP permissions in the majority of processed foods and beverages, subject to the aforementioned restriction, but additional permissions in specific food categories.
Table 1: Classification of Intense Sweeteners under the Australia New Zealand Food Standards Code 2002
Schedule 1
Additives with Restricted Permissions
Schedule 2
Additives Permitted at GMP levels
950 acesulphame potassium 951 aspartame
951 aspartame (confectionery, table top sweetener, electrolyte drinks and electrolyte drink bases, brewed soft drinks)
955 sucralose
952 cyclamates 957 thaumatin
954 saccharin 961 neotame
955 sucralose (confectionery, table top sweetener, brewed soft drinks)
956 alitame
957 thaumatin (brewed soft drinks)
Another change over this period has been the use of the term ‘low joule’. In the old Code, the number of food categories that could have low joule versions was restricted. This term is now generic and can be applied to any food category providing conditions of maximum energy content are met. As a result, intense sweeteners can now be used across a wider range of food categories than previously assessed in 1994. In the previous study conducted by Roy Morgan Research, eight specific categories of food were surveyed (carbonated soft drinks, cordials, table top sweeteners, flavoured milk, flavoured yoghurts, jellies and other desserts, jams and chewing gum).
Consumption of Intense Sweeteners – Australia/New Zealand Page 3
Roy Morgan Research March, 2004
Table 2 shows for each sweetener permitted for use in New Zealand and Australia the ADI and relative sweetness compared to sucrose. As noted earlier, the ADI represents the amount of a food additive that can be ingested daily over an entire lifetime without any appreciable risk to health.
Table 2: Intense Sweeteners Approved for Use in Australia and New Zealand
Intense sweetener ADI (mg/kg body weight)*
Approx. sweetness (relative to sucrose = 1)
Saccharin 0-5 300
Cyclamate 0-11 30
Aspartame 0-40 180
Acesulphame-K 0-15 200
Thaumatin Not specified# 2000-3000
Sucralose 0-15 600
Alitame 0-1 2000
Neotame 0-2 7000-13000
Note: *determined by the WHO/FAO Joint Expert Committee on Food Additives. # establishment of an ADI is not deemed necessary because of a good safety profile.
Consumption of Intense Sweeteners – Australia/New Zealand Page 4
Roy Morgan Research March, 2004
1.3 Research Objectives
The objectives of the present research were to: • provide information on current consumption patterns of foods containing intense
sweeteners for the Australian and New Zealand populations and specified sub-populations as follows:
• country (Australia versus New Zealand); • gender; • country by gender; • age; • location (city/non-city); • country of birth; • ethnic origin; • education level; • respondent income; • respondent occupation; • diabetes (yes/no); • impaired glucose tolerance (yes/no); • weight control diet (yes/no); and • body mass index (underweight, acceptable, overweight, obese).
• assess the current dietary exposure to the eight intense sweeteners permitted for use
under Standard 1.3.1 of the Code against their respective reference health standards (ADIs) for both the Australian and New Zealand populations and specified sub-populations;
• identify if there are any particular sub-groups within the population whose members
appear to be at risk of exceeding ADIs; • compare information on dietary exposure to intense sweeteners estimated in 1994 to
that estimated in 2002/03 for the Australian population aged 12-39 years; and • provide information for the purposes of assessment of current safety provisions and
future decision making in relation to the food additive standard. Approval for conducting the survey was obtained from the Commonwealth Department of Health & Ageing Ethics Committee in 2002. The summarised findings of the research are presented in this report.
Consumption of Intense Sweeteners – Australia/New Zealand Page 5
Roy Morgan Research March, 2004
2. METHODOLOGY In 1994, the then National Food Authority commissioned Roy Morgan Research to undertake preliminary research into intense sweetener consumption patterns in Australia. The aims of that research were to provide baseline data for 12-39 year old Australians on exposure to the intense sweeteners cyclamate, saccharin, aspartame, and acesulphame-K and to identify sub-groups of the population who may have been at risk of exceeding the ADI for individual intense sweeteners. Dietary exposure was estimated by combining survey data on individual respondents’ weekly consumption of different foods with data on the level of intense sweetener in each food. Neither alitame nor sucralose exposure were included in that survey as there were no products consumed in the survey that contained either of these two intense sweeteners. The research in 1994 used face-to-face screener interviews to assess the weekly consumption of sugar sweetened foods and foods containing intense sweeteners. This helped identify respondents with a high level of consumption of products containing intense sweeteners. These respondents were then invited to participate in a one-week (7-day) diary survey. The present research used the 1994 survey as baseline data on Australians’ dietary exposure to intense sweeteners (NFA 1995). The latest research, however, used a telephone screener survey and the parameters were extended to include investigation of the consumption patterns of Australians aged 40 years and over so as to cover a broader section of the population as well as of the New Zealand population. Children under 12 years of age were not included in this survey as it was considered that the survey methodology was not appropriate for this age group. Alternative survey techniques would be required to adequately estimate consumption of products containing intense sweeteners by children. In addition to the diary survey of apparent high consumers of intense sweetened foods, there was also a supplementary diary survey of people with diabetes or impaired glucose tolerance.
Consumption of Intense Sweeteners – Australia/New Zealand Page 6
Roy Morgan Research March, 2004
The research involved three survey groups in both Australia and New Zealand:
• a national (screener) survey of all respondents aged 12 years or over, to determine patterns of consumption of twelve key food product groups containing intense sweeteners and to screen respondents in order to select apparent high consumers of key products;
• a diary survey of apparent high consumers of products containing intense
sweeteners, selected from the screener survey, to estimate their exposure to individual intense sweeteners; and
• a supplementary diary survey of people with diabetes or those with
impaired glucose tolerance to estimate their exposure to individual intense sweeteners.
The following were identified as the main food product groups containing intense sweeteners:
• carbonated soft drinks*; • cordials*; • fruit drinks; • tabletop sweeteners*; • confectioneries^; • flavoured yoghurts and mousses*; • jellies and milk based puddings*; • jams or conserves*; • flavoured milks*; • canned fruits; • toppings; and • ice creams.
* Represents foods also surveyed in 1994
^ Only chewing gum consumption was surveyed in 1994
Roy Morgan Research developed the questionnaire and diaries in conjunction with FSANZ staff and were guided by a project team that included representatives from FSANZ external stakeholders.
Consumption of Intense Sweeteners – Australia/New Zealand Page 7
Roy Morgan Research March, 2004
The following diagram (Figure 1) gives an overview of the research methodology. The circles represent the research respondents. The larger circle represents all the screener survey respondents. The shaded circles specifically indicate the diary respondents. The section of the “Diabetics” circle lying outside the “Screener survey” circle represents those with diabetes who were recruited from other sources for the supplementary diary survey. The area where the two shaded circles intersect represents those with diabetes or impaired glucose tolerance who were interviewed as part of the screener sample, and therefore eligible to take part in the main diary survey. In Section 5 of this report, diary respondents who suffer from diabetes or impaired glucose tolerance are compared with those diary respondents who had neither of the two medical conditions. Therefore, in this context, those respondents represented by the intersection of the two shaded circles are not double-counted. In Section 4, however, all those recruited from the screener survey who completed the diary are used for analysis purposes. This group is representative of the population of all those eligible to take part in the diary survey and naturally includes a high proportion who have either diabetes or impaired glucose tolerance.
Consumption of Intense Sweeteners – Australia/New Zealand Page 8
Part 2 Part 3 Main Diary survey Supplementary Diary survey (n=400 respondents) (n=298 respondents i.e. 187 recruited from
other sources in addition to the 111 diabetics/those with impaired glucose tolerance yielded from the main diary survey)
Random sample of Australians and New Zealanders
aged 12 years and over
Diabetics
High consumptionof foods
containing intense sweeteners
Sample sourced from:
• Diabetes Australia/NZ
• Tertiary institution websites/ noticeboards
• Indigenous/Asian health services
• (main diary survey)
Consumption of Intense Sweeteners – Australia/New Zealand Page 9
Roy Morgan Research March, 2004
2.1 Screener Survey
The screener survey (Part 1 of the research) comprised a computer assisted telephone interview (CATI) survey with respondents from Australia and New Zealand.
2.1.1 Objectives
The screener survey had two functions:
• to collect data on the patterns of consumption of food and drinks containing intense sweeteners, and their sugar sweetened counterparts, for the twelve food product groups from a nationally representative sample of the general population; and
• to select a sub-sample of respondents who were apparent high consumers of intense
sweeteners, for participation in the diary survey.
2.1.2 Methodology
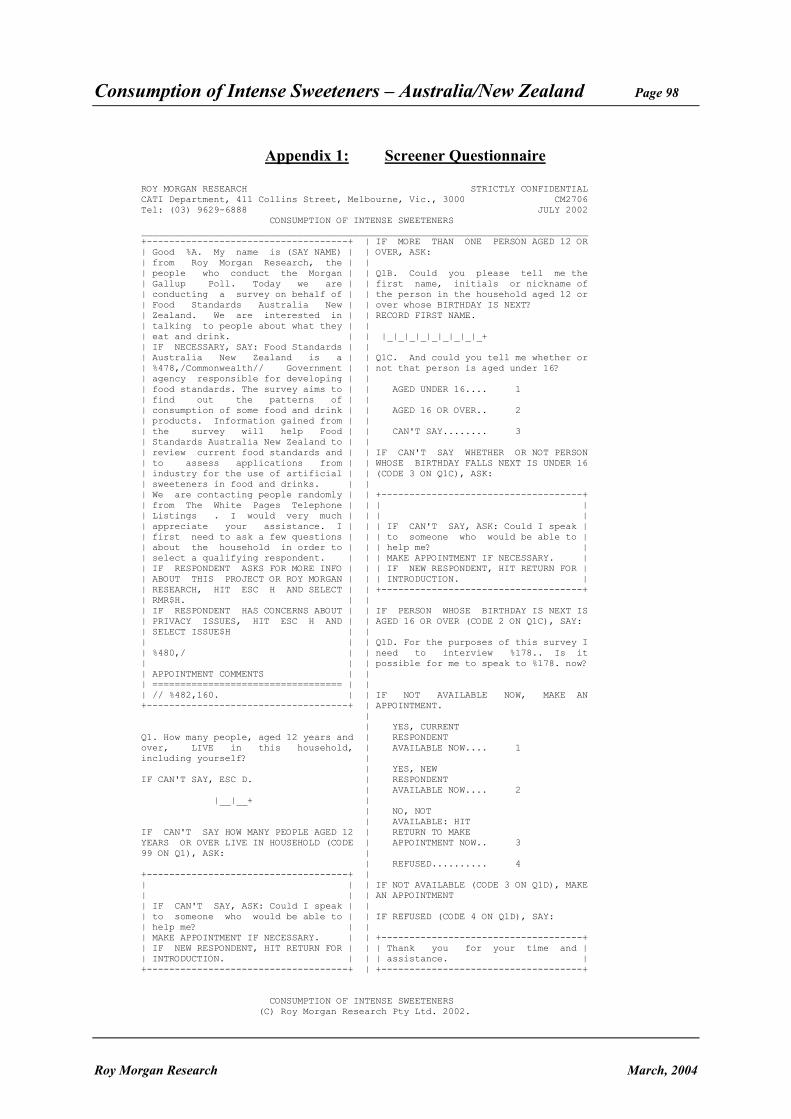
The screener questionnaire was pre-tested in July 2002 and then piloted in August 2002. A separate report on the outcomes of the pre-test and pilot was provided to FSANZ in September 2002. The final screener questionnaire is attached to this report as Appendix 1. The same questionnaire was used in both Australia and New Zealand. Essentially, the questionnaire comprised a 7-day recall of consumption of the 12 selected food groups, recording both those containing sugar and those containing intense sweeteners. Reported units of consumption of each product type were converted to metric measures (see Appendix 2). Self reported height and weight was recorded for each respondent in the screener survey. Each respondent also self-reported whether they had diabetes, followed a diet for impaired glucose tolerance, or were on a diet to lose or control weight. The final questionnaire was administered (by telephone) using Roy Morgan Research’s CATI facilities. In total, 3,529 people were interviewed as part of the screener survey; 2,514 in Australia and 1,015 in New Zealand. The fieldwork was conducted over two phases; 30 August – 16 September 2002 and 17 January – 7 February 2003. The screener fieldwork was conducted over two phases for two main reasons. Firstly, for seasonal reasons - by conducting some of the research during the summer months, consumption of products such as carbonated soft drinks and ice cream was captured at a
Consumption of Intense Sweeteners – Australia/New Zealand Page 10
Roy Morgan Research March, 2004
time when they are likely to be highest. If the research was conducted only in non-summer months it could be argued that consumption would be understated and less reflective of the year as a whole. Secondly, conducting the research over two phases allowed more control over the sample. It was possible to review after the first phase whether any age or geographic groups were being under-represented, which could be then remedied by boosting the relevant sample numbers in the second phase. During the second phase of the screener fieldwork, the 12-39 year age group was boosted as they were under-represented in the initial phase. The other age groups, while also interviewed, were therefore under-represented in this phase. This boosting attempted to yield a more robust sample of these younger respondents for analysis purposes. Weighting was applied to the data to ensure it was representative of the population and to correct for the boosting which took place. Households were randomly selected from the electronic White Pages (EWP) telephone directories. The entire EWP is randomly sorted using a program that utilises a random number generator. Sample is then drawn from this randomly sorted file, top down, according to geographic stratification criteria. As the file is randomly sorted to start with, drawing sample from the top down results in a random selection of records (households). Only one respondent was interviewed per household and that respondent was selected based on the next birthday2 technique. In addition, quotas were set to age, gender and area in both Australia and New Zealand in proportion to Australian Bureau of Statistics (2003, 2001) and Statistics New Zealand (2003) data, as applicable. If a respondent was aged 12-15 years, permission to interview that person was sought from a responsible adult, within that particular household. Permission had to be received before the 12-15 year olds could be interviewed. Also, Roy Morgan Research had facilities available for translation for non-English speakers including Maori. Advice on surveying Maori people in New Zealand was sought from Kahui Kounga Kai , FSANZ’s Maori Reference Group.
2 The next birthday technique is a method of randomly choosing a person to interview within a selected household. The person chosen (within that household) to take part in the survey is the person who has the next birthday. If that person is not available at the time of the call, the interviewer makes an appointment to call back at another time when that person is available. No other household member can take part. This technique avoids just interviewing people who are easier to contact ie those who are always at home, who may be quite different (demographically or otherwise) to those people who are not at home as often.
Consumption of Intense Sweeteners – Australia/New Zealand Page 11
Roy Morgan Research March, 2004
Furthermore, during the CATI screener survey, if there was a build up of five or more interviews in a language other than English, then Roy Morgan Research arranged to have these interviews completed with bi-lingual Roy Morgan Research interviewers. Demographic information on the unweighted Screener survey sample is provided as Appendix 3.
2.1.3 Weighting
Statistical weighting was applied to the survey data collected to ensure it was representative of the respective Australian and New Zealand population in terms of age, gender and area of residence. In Australia an 88 cell weighting matrix was employed (2 gender groups x 4 age groups x 11 geographic regions), while in New Zealand a 40 cell weighting matrix was employed (2 gender groups x 4 age groups x 5 geographic regions). The overall population of the two countries was a combination of both. The age groups used for weighting purposes in both countries were as follows:
• 12-24 years
• 25-39 years
• 40-59 years
• 60+ years
Moreover, the geographic regions used in the weighting for each country were as follows:
Australia
• Sydney
• Other NSW/ACT
• Melbourne
• Other VIC
• Brisbane
• Other QLD
• Adelaide
• Other SA/NT
• Tasmania
• Perth
• Other WA
New Zealand
• Auckland
• Wellington
• Christchurch
• Other North Island
• Other South Island
Consumption of Intense Sweeteners – Australia/New Zealand Page 12
Roy Morgan Research March, 2004
The following table (Table 3) shows an unweighted demographic summary profile of the screener sample compared to the population profile, which it was subsequently weighted to. This is shown for Australia and New Zealand combined, as well as for each country separately.
Table 3: Demographic Summary Profile of Screener Sample versus Population Profile
TOTAL (%) Australia (%) New Zealand (%)
Demographics
Screener Sample
(Unweighted)
Population
Screener Sample
(Unweighted)
Population1
Screener Sample
(Unweighted)
Population2
Gender
Male Female
39 61
49 51
40 60
49 51
36 64
49 51
Age (years)
18-24 25-39 40-59 60+
18 27 31 24
22 26 32 20
18 27 32 24
22 26 32 20
17 27 30 27
24 26 32 19
Geographical location
City Non –City
61 39
62 38
61 39
63 37
62 38
60 40
Note: 1Australian Bureau of Statistics (ABS). 2003.
Australian Bureau of Statistics (ABS). 2001. 2Statistics New Zealand (SNZ). 2003.
Consumption of Intense Sweeteners – Australia/New Zealand Page 13
Roy Morgan Research March, 2004
2.2 Diary Survey The main diary survey, which formed Part 2 of the research, comprised a 7-consecutive day, recall diary survey of respondents identified as potential high intense sweetener consumers from the screener survey. This included those from the screener survey who claimed to have diabetes or impaired glucose tolerance.
2.2.1 Objectives
The diary survey had two aims:
• to estimate exposure to intense sweeteners for a sub-group of the population who appeared to be high consumers of key products containing intense sweeteners; and
• to assess estimated exposure to intense sweeteners with respect to their individual
ADI.
2.2.2 Methodology
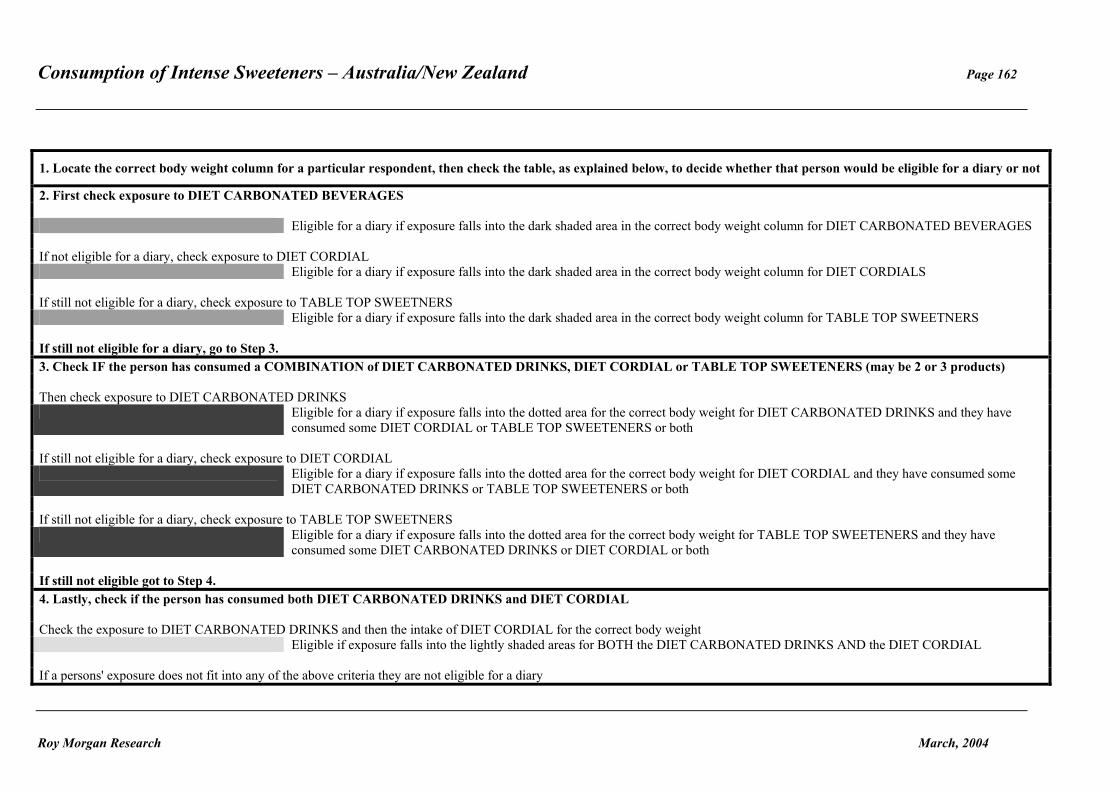
Respondents to the screener survey (see Section 2.1) who were identified, through their self-reported behaviour, to be high consumers of certain products containing intense sweeteners were invited to participate in the diary survey. Selection was based on the reported amounts of key foods or beverages (carbonated soft drinks, cordials and tabletop sweeteners) consumed in relation to body weight. The criteria were set such that screener survey respondents consuming more than the equivalent amount of intense sweetener contained in half a can of carbonated soft drink per day, at a body weight of 70 kg, were selected (see appendix 18 for more details). These criteria were the same as those used in the 1994 survey. These respondents were invited to complete a 7-day diary record of consumption of the listed key product groups, including details such as brand (identified during a market survey in 2001-02), flavour and the quantity consumed. (This diary was pre-tested and then piloted in July/August 2002). The diary was mailed out to those eligible who agreed to accept a diary, along with a reply-paid envelope for them to return the diary when completed. A financial incentive of $25 and entry into a draw for a prize of $4,000 was offered to those eligible for the diary survey to encourage their participation in the diary phase. (The
Consumption of Intense Sweeteners – Australia/New Zealand Page 14
Roy Morgan Research March, 2004
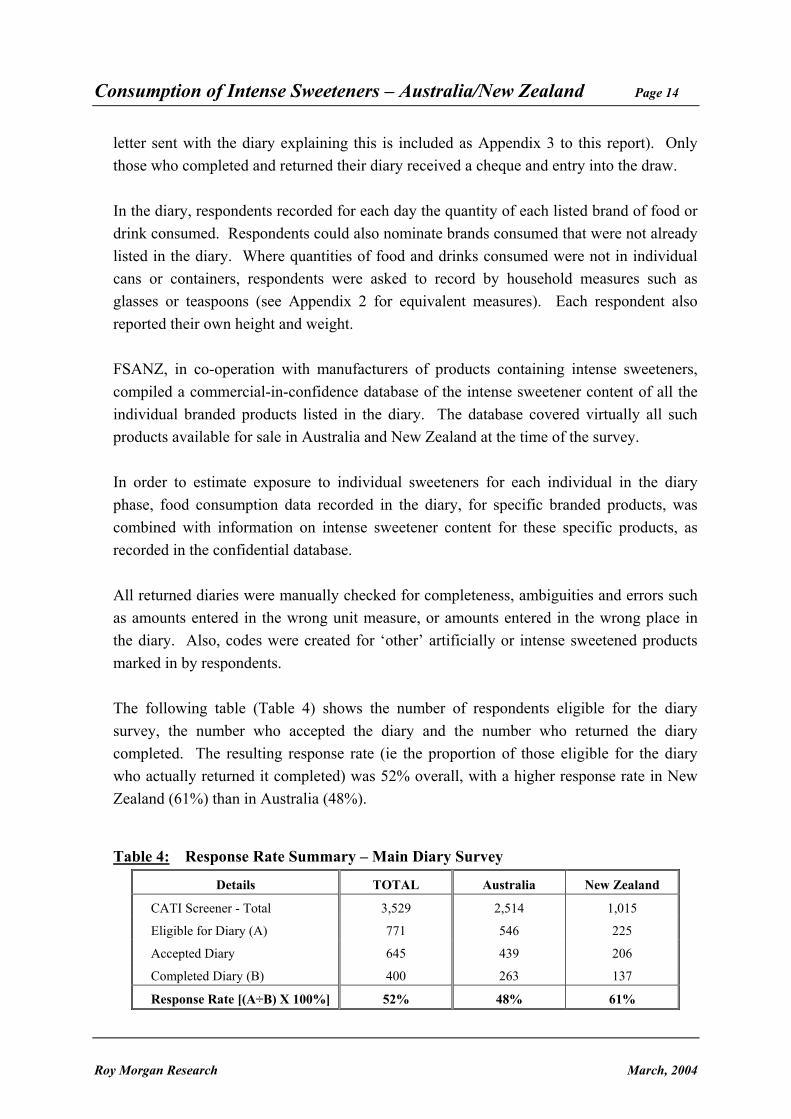
letter sent with the diary explaining this is included as Appendix 3 to this report). Only those who completed and returned their diary received a cheque and entry into the draw. In the diary, respondents recorded for each day the quantity of each listed brand of food or drink consumed. Respondents could also nominate brands consumed that were not already listed in the diary. Where quantities of food and drinks consumed were not in individual cans or containers, respondents were asked to record by household measures such as glasses or teaspoons (see Appendix 2 for equivalent measures). Each respondent also reported their own height and weight. FSANZ, in co-operation with manufacturers of products containing intense sweeteners, compiled a commercial-in-confidence database of the intense sweetener content of all the individual branded products listed in the diary. The database covered virtually all such products available for sale in Australia and New Zealand at the time of the survey. In order to estimate exposure to individual sweeteners for each individual in the diary phase, food consumption data recorded in the diary, for specific branded products, was combined with information on intense sweetener content for these specific products, as recorded in the confidential database. All returned diaries were manually checked for completeness, ambiguities and errors such as amounts entered in the wrong unit measure, or amounts entered in the wrong place in the diary. Also, codes were created for ‘other’ artificially or intense sweetened products marked in by respondents. The following table (Table 4) shows the number of respondents eligible for the diary survey, the number who accepted the diary and the number who returned the diary completed. The resulting response rate (ie the proportion of those eligible for the diary who actually returned it completed) was 52% overall, with a higher response rate in New Zealand (61%) than in Australia (48%).
Table 4: Response Rate Summary – Main Diary Survey
Details TOTAL Australia New Zealand
CATI Screener - Total 3,529 2,514 1,015
Eligible for Diary (A) 771 546 225
Accepted Diary 645 439 206
Completed Diary (B) 400 263 137
Response Rate [(A÷B) X 100%] 52% 48% 61%
Consumption of Intense Sweeteners – Australia/New Zealand Page 15
Roy Morgan Research March, 2004
2.2.3 Weighting
As already reported in Section 2.1.3, the overall screener sample was weighted to ensure it was representative of the Australian and New Zealand populations aged 12 years and over. From within this the representative demographic profile of those eligible to receive a diary was identified. As shown in Table 4, not everyone who was eligible for a diary accepted one, nor did everyone who accepted a diary return it completed, despite follow-up reminder calls to do so. To correct for such non-response, the data from the diaries that were completed correctly were weighted to the known profile of those who were eligible for the diary, as ascertained from the screener survey. The diary data collected was weighted to ensure it was representative in terms of age, gender and area of residence of those identified as high consumers of products with intense sweeteners. A less comprehensive weighting matrix was applied to the diary data compared to that applied to the screener data, to accommodate the smaller sample size involved in that phase. The age groups used for weighting the main diary data, in both countries, were as follows:
• 12-24 years
• 25-39 years
• 40-59 years
• 60+ years
The sample size was too small to weight to the 11 regions in Australia and to the 5 regions in New Zealand as used for weighting the screener survey data. Consequently, for the diary weighting purposes, Australia was divided into city and non-city areas, while New Zealand was not broken down by area type. Therefore, in Australia a 16 cell weighting matrix was employed (2 gender groups x the 4 age groups x the 2 area types), while in New Zealand an 8 cell weighting matrix was employed (2 gender groups x the 4 age groups). The overall weighted diary population of the two countries was a combination of both.
Consumption of Intense Sweeteners – Australia/New Zealand Page 16
Roy Morgan Research March, 2004
The following tables compares the profile of the survey respondents. Table 5 shows the unweighted demographic profile of the screener sample versus those who completed the diary. Table 6 then shows the weighted profile of those eligible for the diary versus the overall weighted population profile. From this it is possible to see how those who are high consumers of products containing intense sweeteners differ demographically from the overall population. It is interesting to note from Table 6 that, in Australia, females were particularly more likely to have been eligible for the diary survey, as were non-city residents in New Zealand. Table 7 shows the unweighted profile of those who completed a diary compared to the weighted representative profile of those eligible for a diary (to which the diary respondents were ultimately weighted). Finally, it should be remembered that the consumption patterns of those who completed the diary survey do not represent those of the whole population, as diary participants were selected primarily on the basis of their high consumption of foods containing intense sweeteners. Therefore, estimated exposure to intense sweeteners among the diary group is expected to be higher than for the population as a whole.
Consumption of Intense Sweeteners – Australia/New Zealand Page 17
Roy Morgan Research March, 2004
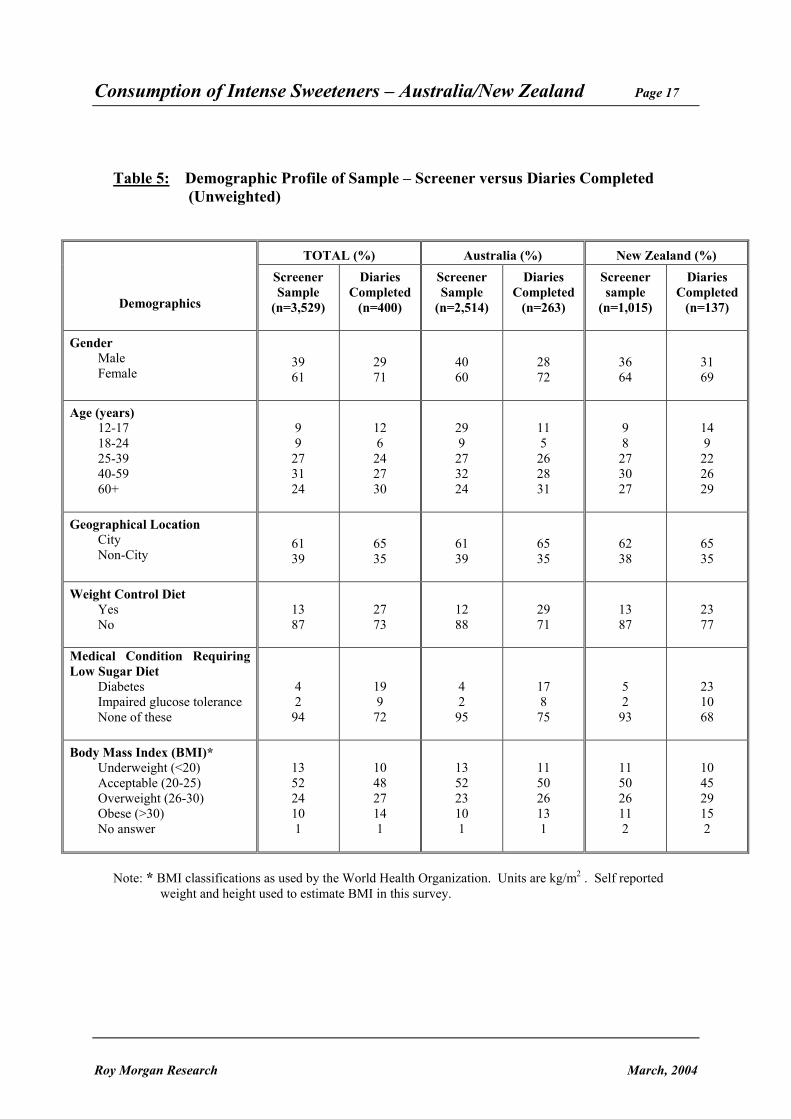
Table 5: Demographic Profile of Sample – Screener versus Diaries Completed (Unweighted)
TOTAL (%) Australia (%) New Zealand (%)
Demographics
Screener Sample
(n=3,529)
Diaries Completed
(n=400)
Screener Sample
(n=2,514)
Diaries Completed
(n=263)
Screener sample
(n=1,015)
Diaries Completed
(n=137)
Gender Male Female
39 61
29 71
40 60
28 72
36 64
31 69
Age (years)
12-17 18-24 25-39 40-59 60+
9 9
27 31 24
12 6
24 27 30
29 9
27 32 24
11 5
26 28 31
9 8
27 30 27
14 9
22 26 29
Geographical Location
City Non-City
61 39
65 35
61 39
65 35
62 38
65 35
Weight Control Diet
Yes No
13 87
27 73
12 88
29 71
13 87
23 77
Medical Condition Requiring Low Sugar Diet
Diabetes Impaired glucose tolerance None of these
4 2
94
19 9
72
4 2
95
17 8
75
5 2
93
23 10 68
Body Mass Index (BMI)*
Underweight (<20) Acceptable (20-25) Overweight (26-30) Obese (>30) No answer
13 52 24 10 1
10 48 27 14 1
13 52 23 10 1
11 50 26 13 1
11 50 26 11 2
10 45 29 15 2
Note: * BMI classifications as used by the World Health Organization. Units are kg/m2 . Self reported
weight and height used to estimate BMI in this survey.
Consumption of Intense Sweeteners – Australia/New Zealand Page 18
Roy Morgan Research March, 2004
Table 5 (Cont’d) : Demographic Profile of Sample – Screener versus Diaries Completed (Unweighted)
TOTAL (%) Australia (%) New Zealand (%)
Demographics
Screener Sample
(n=3,529)
Diaries Completed
(n=400)
Screener Sample
(n=2,514)
Diaries Completed
(n=263)
Screener sample
(n=1,015)
Diaries Completed
(n=137)
Country of birth Australia New Zealand Europe Other
57 25 12 7
53 31 11 6
80 2
12 7
80 2
12 6
2
81 11 6
-
85 10 5
Ethnicity Aboriginal/ Torres Strait
Islander Other Australian Residents NZ Maori/ Pacific Islander Other New Zealand Residents
1 70 4
25
1 65 5
29
1 99 - -
2 98 - -
- -
14 86
- -
15 85
Education
Some primary Some secondary Some tertiary No answer/None
4
55 40 1
5
58 37 1
5
58 37 1
2
57 41 -
6
55 38 1
10 58 29 2
Respondent Income (AUD/NZD) Under $25,000 $25,000-$39,999 $40,000+
36 13 51
42 10 48
38 13 50
44 10 46
32 14 53
39 10 50
Respondent Occupation
Professional/managerial White collar Blue collar Unskilled None
19 35 30 5
11
18 34 31 5
13
18 39 27 5
11
18 37 29 5
13
21 27 38 5
10
18 30 35 5
12
Note: - denotes not applicable
Consumption of Intense Sweeteners – Australia/New Zealand Page 19
Roy Morgan Research March, 2004
Table 6: Demographic Profile of Diary Eligibility versus Overall Population Profile
TOTAL (%) Australia (%) New Zealand (%)
Demographics Eligible for
Diary (Weighted)
Population
Eligible for Diary
(Weighted)
Population1
Eligible for Diary
(Weighted)
Population2
Gender Male Female
41 59
49 51
40 60
49 51
47 53
49 51
Age (years)
12-17 18-24 25-39 40-59 60+
16 7
24 29 24
11 11 26 32 20
16 7
25 29 24
11 11 26 32 20
19 10 20 28 24
12 12 26 32 19
Geographical Location
City Non-City
65 35
62 38
64 36
63 37
68 32
60 40
Note: 1Australian Bureau of Statistics (ABS). 2003.
Australian Bureau of Statistics (ABS). 2001. 2Statistics New Zealand. 2003.
Table 7: Demographic Profile of Diary Eligibility versus Diaries Completed
TOTAL (%) Australia (%) New Zealand (%)
Demographics Eligible for
Diary^ (Weighted)
Diaries Completed (Unweighted)
Eligible for Diary^
(Weighted)
Diaries Completed (Unweighted)
Eligible for Diary^
(Weighted)
Diaries Completed (Unweighted)
Gender Male Female
41 59
29 71
40 60
28 72
47 53
31 69
Age (years)
12-17 18-24 25-39 40-59 60+
16 7
24 29 24
12 6
24 27 30
16 7
25 29 24
11 5
26 28 31
19 10 20 28 24
14 9
22 26 29
Geographical Location
City Non-City
65 35
65 35
64 36
65 35
68 32
65 35
Note: ^ Also represents weighted profile of Diaries Completed.
Consumption of Intense Sweeteners – Australia/New Zealand Page 20
Roy Morgan Research March, 2004
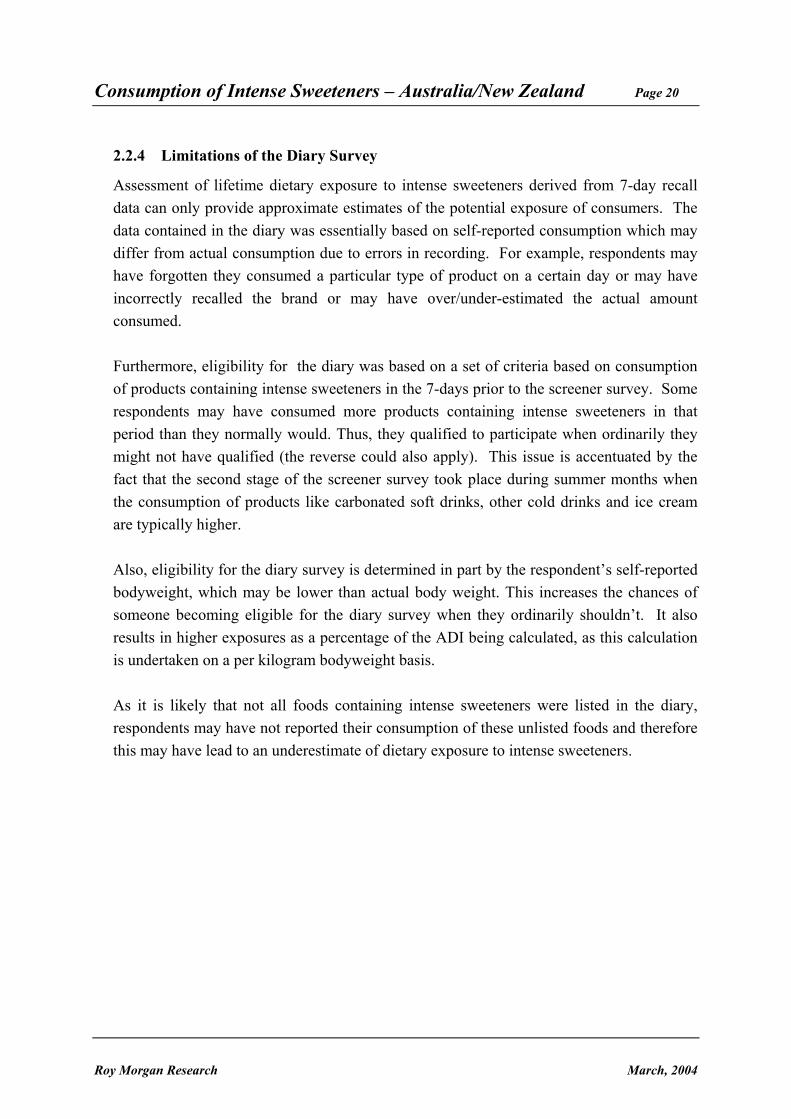
2.2.4 Limitations of the Diary Survey
Assessment of lifetime dietary exposure to intense sweeteners derived from 7-day recall data can only provide approximate estimates of the potential exposure of consumers. The data contained in the diary was essentially based on self-reported consumption which may differ from actual consumption due to errors in recording. For example, respondents may have forgotten they consumed a particular type of product on a certain day or may have incorrectly recalled the brand or may have over/under-estimated the actual amount consumed. Furthermore, eligibility for the diary was based on a set of criteria based on consumption of products containing intense sweeteners in the 7-days prior to the screener survey. Some respondents may have consumed more products containing intense sweeteners in that period than they normally would. Thus, they qualified to participate when ordinarily they might not have qualified (the reverse could also apply). This issue is accentuated by the fact that the second stage of the screener survey took place during summer months when the consumption of products like carbonated soft drinks, other cold drinks and ice cream are typically higher. Also, eligibility for the diary survey is determined in part by the respondent’s self-reported bodyweight, which may be lower than actual body weight. This increases the chances of someone becoming eligible for the diary survey when they ordinarily shouldn’t. It also results in higher exposures as a percentage of the ADI being calculated, as this calculation is undertaken on a per kilogram bodyweight basis. As it is likely that not all foods containing intense sweeteners were listed in the diary, respondents may have not reported their consumption of these unlisted foods and therefore this may have lead to an underestimate of dietary exposure to intense sweeteners.
Consumption of Intense Sweeteners – Australia/New Zealand Page 21
Roy Morgan Research March, 2004
2.3 Supplementary Diary Survey of People with Diabetes/Impaired Glucose Tolerance
People with diabetes or with impaired glucose tolerance were also studied as a separate group in this research, as it was assumed that this group of respondents may consume greater amounts of foods containing intense sweeteners than the rest of the population. Approximately two percent of the general population in Australia and four percent of the general population in New Zealand have been diagnosed with diabetes at some time in their lives (ABS 1995; Statistics NZ 1997). Almost one in four Australians aged 25 years or older has either diabetes or a condition of impaired glucose metabolism (Zimmet 2002). Furthermore, some population groups with high prevalence of diabetes are less likely to be contacted by means of random surveying techniques. As diabetics were, therefore, not likely to be recruited in large numbers (from the screener survey of the general population) for the diary survey, a supplementary survey of diabetics was undertaken using convenience sampling techniques.
2.3.1 Objectives
The supplementary diary survey had two basic aims:
• to estimate exposure to intense sweeteners for a more robust sample size of diabetics and those with impaired glucose tolerance; and
• to assess this group’s estimated exposure to intense sweeteners with respect to
acceptable daily intakes (ADIs).
2.3.2 Methodology
The diary survey, in this context, comprised a pragmatic or purposive sample of diabetics and those with impaired glucose tolerance. The sample was not intended to be representative of the overall diabetic/impaired glucose tolerance population, but aimed to provide greater understanding of consumption patterns in this group. A range of different approaches were used in an attempt to recruit enough Asian, Aboriginal and Torres Strait Islander peoples, New Zealand Maori people and young people with diabetes to enable an appropriate sample, as follows:
Consumption of Intense Sweeteners – Australia/New Zealand Page 22
Roy Morgan Research March, 2004
• A number of people with diabetes were identified via diabetes support groups. For example, Diabetes Australia (and some of its State/Territory branches) and Diabetes New Zealand both agreed to include an invitation to take part in the research in their regular newsletters to members.
• An invitation to participate in the diary survey was also placed on the multilingual
Internet resource of Diabetes Australia and on the website of Diabetes New Zealand.
• Young people with diabetes were invited to take part in the diary survey through a
notice on the Reality Check website. This is a Melbourne-based website for young people with diabetes and it includes a well-frequented online discussion forum. Advertisements were also placed in university notice boards and e-notices.
• There is a high prevalence of diabetes amongst Aboriginal or Torres Strait Islander
peoples3, Maori/Pacific Islanders or people of Asian origin. These people are likely to be under-represented using the other methods outlined above (AIHW 2001; Simmons et al 1999). A sample of health services catering specifically for indigenous and Asian groups in Australia, and Maori/Pacific Islanders in New Zealand were approached to distribute the diary to people with diabetes from these backgrounds.
Respondents with diabetes or impaired glucose tolerance who were interviewed as part of the screener survey were combined with the diabetics recruited from all these other sources above to form an overall diabetics/impaired glucose tolerance group for the purposes of the analysis in Section 5 of this report. In total, 298 people with diabetes or impaired glucose tolerance completed a diary, including 187 recruited from sources other than the CATI screener survey. The sample sizes for the successfully recruited diabetics (along with diabetics/those with impaired glucose tolerance yielded from the screener survey) are outlined in Table 8.
3 In 1995, self-reported diabetes was 7 to 8 times higher among Indigenous Australians than for other Australians aged 25-55 years
Consumption of Intense Sweeteners – Australia/New Zealand Page 23
Roy Morgan Research March, 2004
Table 8: Sample Sizes for those with Diabetes/Impaired Glucose Tolerance
Sample - Recruitment TOTAL Australia New Zealand
Screener Survey (Main Diary)
Diabetic
Impaired Glucose Tolerance
(Total)
76
35
(111)
45
22
(67)
31
13
(44)
Other Sources 187 156 31
TOTAL 298 223 75
Table 8 shows that 111 respondents with either diabetes (76) or impaired glucose tolerance (35) recruited from the screener survey took part in the main diary survey. This group represents (as shown earlier in Table 5) 28% of those who completed a main diary, and represents a similar proportion of those eligible for the main diary survey. This underlines the fact that those with diabetes/impaired glucose tolerance are over-represented in the population of high consumers of products containing intense sweeteners. Table 9 provides a demographic profile of the overall purposive sample of those with diabetes/impaired glucose tolerance. Only basic demographics (age, gender and country) were available for those recruited from sources other than the CATI screener.
Table 9: Demographic Profile of Diabetic/Impaired Glucose Tolerance Sample
Demographics TOTAL (n=298)
% Gender
Male Female
44 56
Age (years)
12-17 18-24 25-39 40-59 60+
13 1
12 29 44
Country
Australia New Zealand
75 25
Consumption of Intense Sweeteners – Australia/New Zealand Page 24
Roy Morgan Research March, 2004
2.3.3 Limitations of Supplementary Diary Survey
All the limitations relating to self reported consumption behaviour, as mentioned in Section 2.2.4 for the main diary survey, also apply to the supplementary diary survey. Furthermore, the sample for this supplementary survey of people with diabetes or impaired glucose tolerance is not representative of this group nor is it weighted to any particular profile. It is intended as a purposive sample of those with either of the two medical conditions. Due to the manner in which the extra diabetics were recruited, this sample is likely to comprise more educated people who access the Internet, read newsletters, are members of support groups and who can read English.
Consumption of Intense Sweeteners – Australia/New Zealand Page 25
Roy Morgan Research March, 2004
3. KEY FINDINGS – SCREENER SURVEY The screener survey data was analysed to determine the consumption of the twelve selected food groups containing sugar or intense sweetener. The analysis specifically examined the mean daily consumption based on all respondents to the screener survey and the mean, median, 90th and 95th percentile daily consumption for the subset of respondents that actually consumed each of the particular food types (referred to as consumers in this report). The analysis also examined the percentage that products containing intense sweeteners represented out of the total consumption of each of the selected food groups. The data was analysed according to the following demographic information:
• country (Australia versus New Zealand); • gender; • gender by country; • age; • location (city/non-city); • country of birth; • ethnic origin; • education level; • respondent income; • respondent occupation; • diabetes (yes/no); • impaired glucose tolerance (yes/no); • weight control diet (yes/no); and • body mass index (underweight, acceptable, overweight, obese).
Patterns of consumption according to the different demographic sub-groups are reported in the text and in Appendix 5. Consumption for the total Australian and New Zealand population is outlined in this section, along with comparisons where possible with the 1994 survey for Australians aged 12-39 years. The mean daily consumption according to the above demographic groups is shown in Appendices 6 to 20. Demographic differences have been mentioned in the text where they were determined to be statistically significant at the 95% confidence level, using a one-tailed Z-score test.
Consumption of Intense Sweeteners – Australia/New Zealand Page 26
Roy Morgan Research March, 2004
3.1 Patterns of Consumption
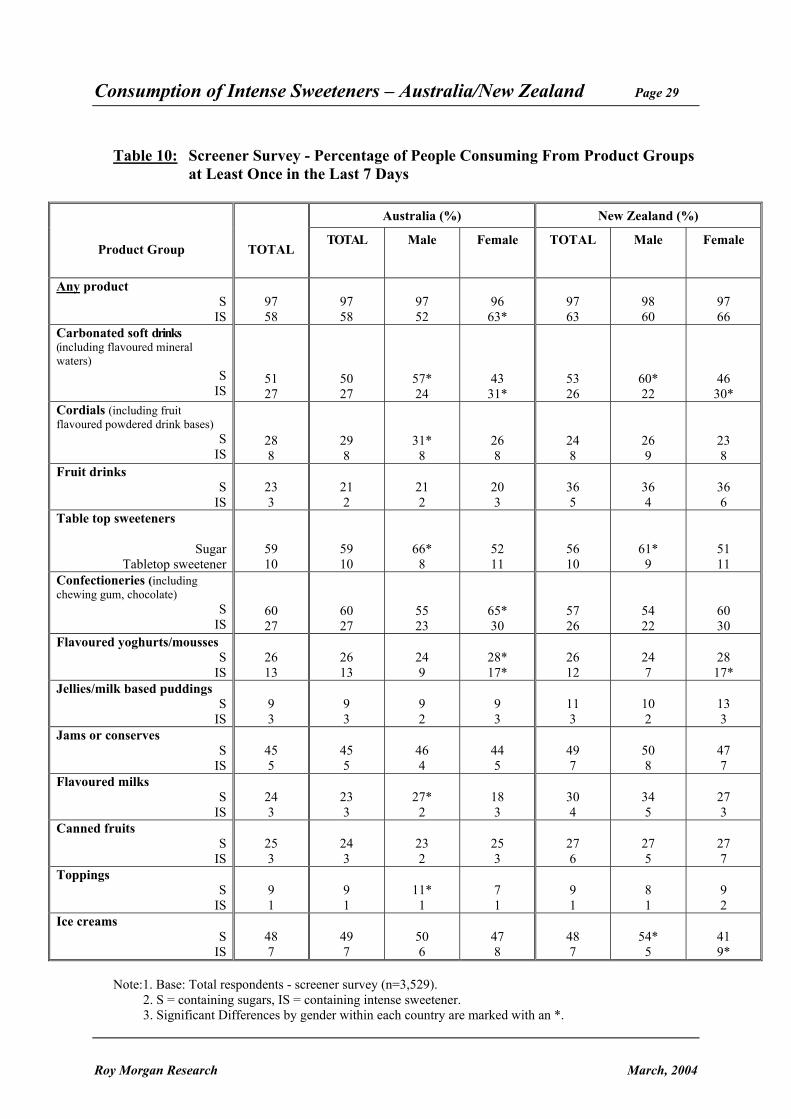
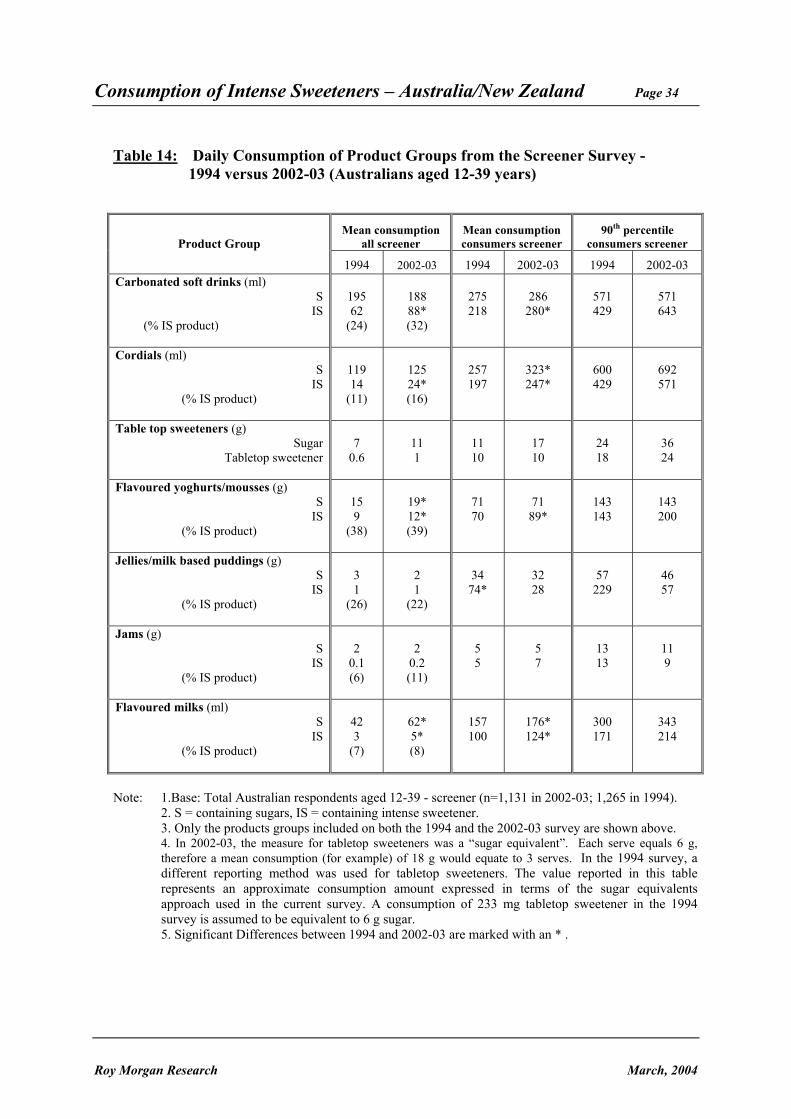
The following section outlines the pattern of consumption for each of the twelve food product groups measured in the screener survey. Table 10 contains information on the percent of the population consuming each of those 12 key food groups over the previous seven days. Tables 12 and 13 provide information on the consumption amounts in each of the food product groups in Australia and New Zealand respectively. The findings are compared to the 1994 survey wherever possible, and show that there has been a significant increase in the proportion of 12-39 year old Australians consuming products containing intense sweeteners (66% in 2002-03 compared with 51% in 1994). However, this is likely to be due to a greater number of product groups containing intense sweeteners in 2002-03 compared to 19944, rather than an increase in the percentage of this age group consuming the products that were previously measured in 1994 (see Table 11).
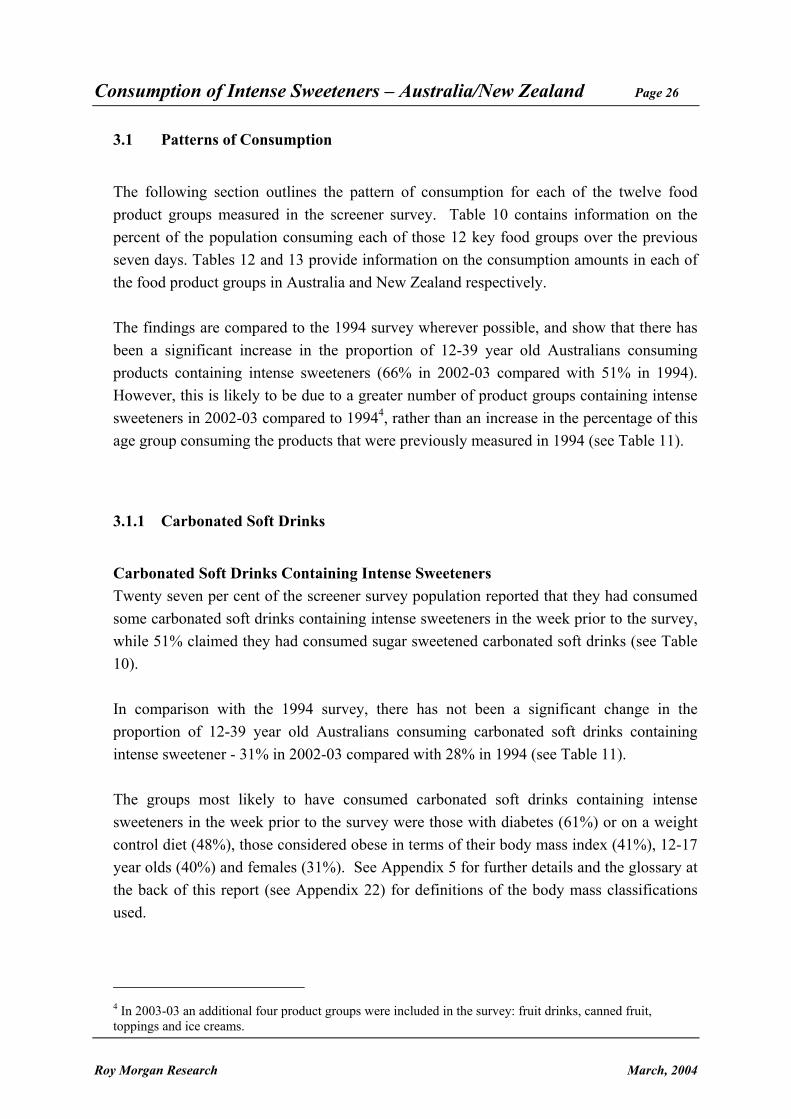
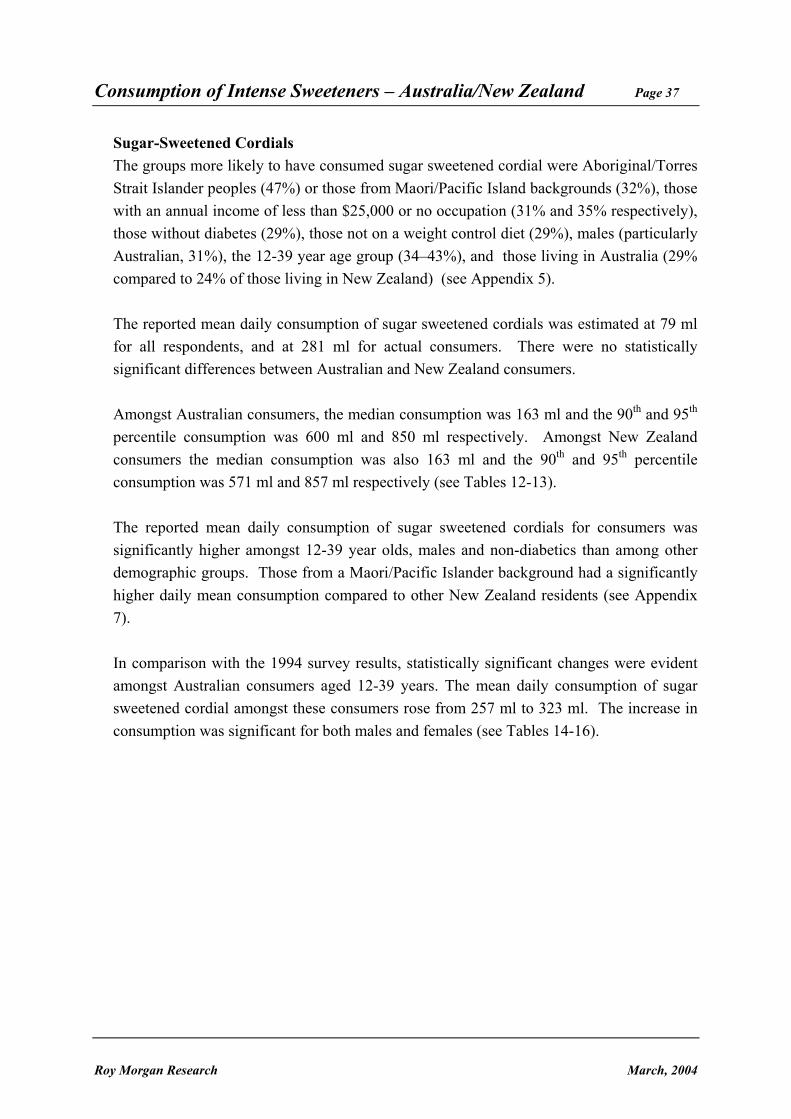
3.1.1 Carbonated Soft Drinks
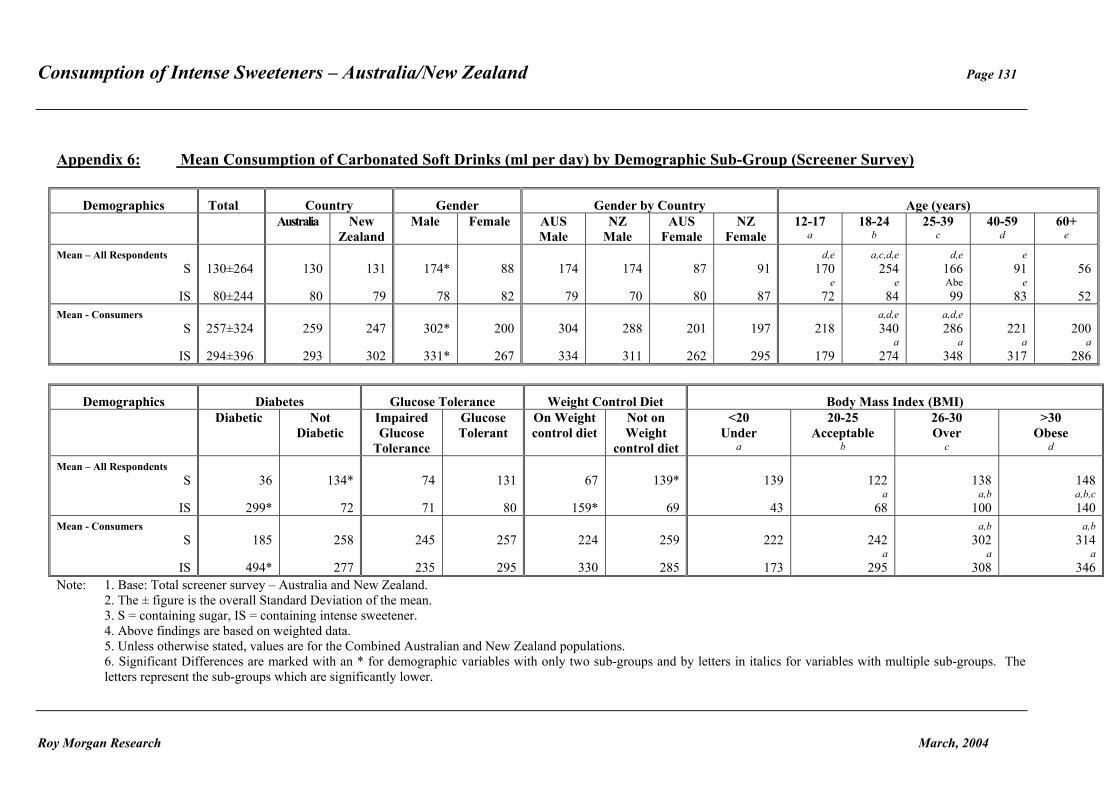
Carbonated Soft Drinks Containing Intense Sweeteners Twenty seven per cent of the screener survey population reported that they had consumed some carbonated soft drinks containing intense sweeteners in the week prior to the survey, while 51% claimed they had consumed sugar sweetened carbonated soft drinks (see Table 10). In comparison with the 1994 survey, there has not been a significant change in the proportion of 12-39 year old Australians consuming carbonated soft drinks containing intense sweetener - 31% in 2002-03 compared with 28% in 1994 (see Table 11). The groups most likely to have consumed carbonated soft drinks containing intense sweeteners in the week prior to the survey were those with diabetes (61%) or on a weight control diet (48%), those considered obese in terms of their body mass index (41%), 12-17 year olds (40%) and females (31%). See Appendix 5 for further details and the glossary at the back of this report (see Appendix 22) for definitions of the body mass classifications used.
4 In 2003-03 an additional four product groups were included in the survey: fruit drinks, canned fruit, toppings and ice creams.
Consumption of Intense Sweeteners – Australia/New Zealand Page 27
Roy Morgan Research March, 2004
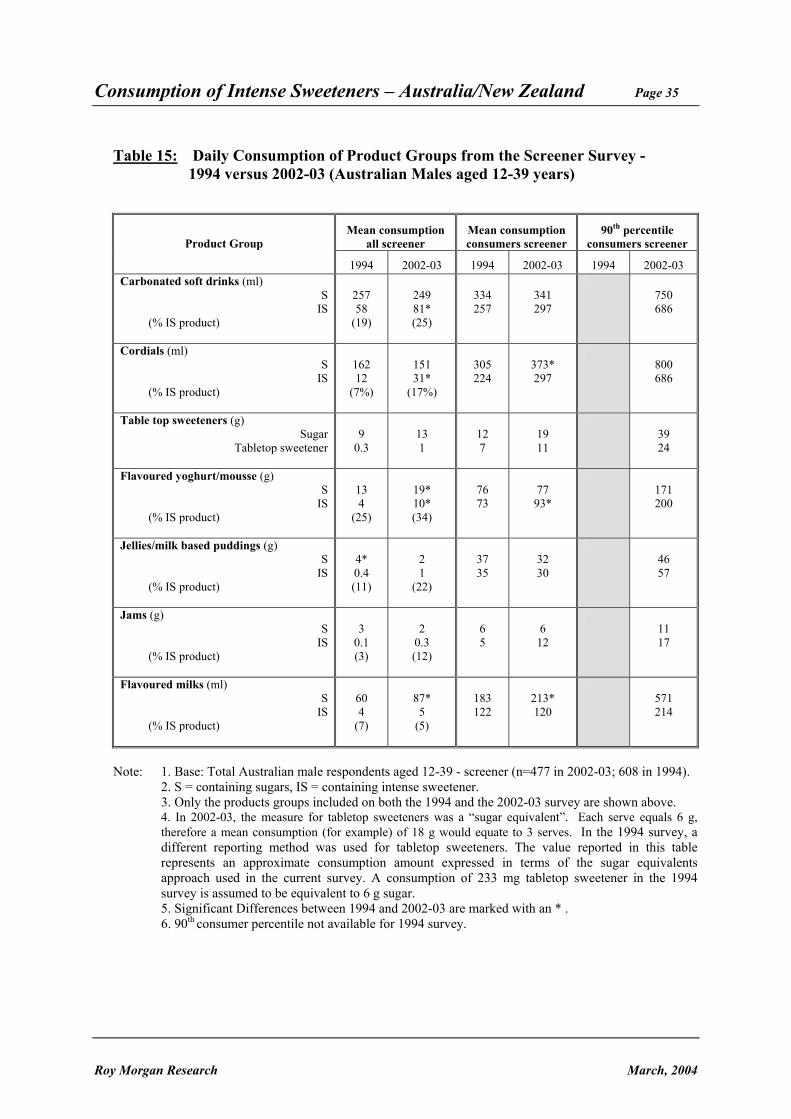
The reported mean daily consumption of carbonated soft drinks containing intense sweetener amongst all respondents across both Australia and New Zealand was 80 ml, while the consumer average was 294 ml. There was no significant difference between Australia or New Zealand (see Appendix 6). In Australia the median consumer consumption of carbonated soft drinks containing intense sweetener was 171 ml and the 90th and 95th percentile consumer consumption was 643 ml and 1,000 ml respectively. In New Zealand the median consumer consumption was 179 ml and the 90th and 95th percentile was 686 ml and 857 ml respectively (see Tables 12-13). The mean daily consumption has increased significantly for Australians aged 12-39 (both male and female) since 1994. The mean for Australian male respondents aged 12-39 years has risen from 58 ml to 81 ml (see Table 15), and from 65 ml to 95 ml for female respondents aged 12-39 years (see Table 16). The consumer mean has also increased significantly for Australian females, up from 192 ml to 268 ml in the current survey (see Tables 14-16). In both Australia and New Zealand, 38% of the total consumption of carbonated soft drinks consumed contained intense sweetener. This proportion of total consumption was significantly higher amongst females than males (48% compared to 31%). Sugar-Sweetened Carbonated Soft Drinks The groups most likely to have consumed sugar sweetened carbonated soft drinks included the younger age groups i.e. 12-17 year olds (78%) and the 18-24 years old (75%). These groups were significantly more likely to be consumers of these type of drinks than their older counterparts (see Appendix 5). Underlining this younger age profile, those with an annual income of less than $40,000, those with secondary level education or less and those with either no occupation or an unskilled occupation were more likely to have consumed sugar sweetened carbonated soft drinks. (These latter groups would include younger people still at school/college who have no income or occupation). Males were, also, more likely to be consumers than females (58% compared to 44%). Furthermore, consumption of sugar sweetened soft drinks was more evident amongst those without diabetes (52% compared to 19% of diabetics), those who are glucose tolerant (51% compared to 30% of those with impaired glucose tolerance) and those not on a weight control diet (53% compared to 30% compared to those not on such a diet).
Consumption of Intense Sweeteners – Australia/New Zealand Page 28
Roy Morgan Research March, 2004
Interestingly, those who are underweight were more likely to have consumed sugar sweetened soft drinks (63%) than those with a higher body mass index (46–51%). The reported mean daily consumption of sugar sweetened carbonated soft drinks for all ages was estimated at 130 ml, and at 257 ml for consumers. There was no statistically significant difference between Australia and New Zealand. Amongst Australian consumers, the median consumption was 161 ml and the 90th and 95th percentile consumption was 571 ml and 857 ml respectively. Amongst New Zealand consumers the median consumption was 171 ml and the 90th and 95th percentile consumption was 571 ml and 750 ml respectively (see Tables 12-13). The reported mean daily consumption of sugar sweetened carbonated soft drinks amongst consumers was significantly higher amongst 18-24 year olds, 25-39 year olds, males, those considered to be over-weight or obese, those with secondary education, blue collar workers and Maori/Pacific Islanders (compared with other New Zealand residents) (see Appendix 6). In comparison with the 1994 survey results, no statistically significant change in the mean daily consumption of sugar sweetened carbonated soft drinks was evident amongst Australian consumers aged 12-39 years, either male or female (see Tables 14-16).
Consumption of Intense Sweeteners – Australia/New Zealand Page 29
Roy Morgan Research March, 2004
Table 10: Screener Survey - Percentage of People Consuming From Product Groups at Least Once in the Last 7 Days
Australia (%) New Zealand (%)
Product Group TOTAL TOTAL
Male
Female
TOTAL
Male
Female
Any product S
IS
97 58
97 58
97 52
96 63*
97 63
98 60
97 66
Carbonated soft drinks (including flavoured mineral waters)
S IS
51 27
50 27
57* 24
43 31*
53 26
60* 22
46 30*
Cordials (including fruit flavoured powdered drink bases)
Note:1. Base: Total respondents - screener survey (n=3,529). 2. S = containing sugars, IS = containing intense sweetener. 3. Significant Differences by gender within each country are marked with an *.
Consumption of Intense Sweeteners – Australia/New Zealand Page 30
Roy Morgan Research March, 2004
Table 11: Screener Survey - Percentage of People Consuming From Product Groups at Least Once in the Last 7 Days - 1994 versus 2002-03 (Australians aged 12-39)
Product Group 1994
%
2002-03
%
Any product IS
51
66*
Carbonated soft drinks (including flavoured mineral waters)
S IS
71* 28
66 31
Cordials (including fruit flavoured powdered drink bases)
S IS
46* 7
39 10*
Table top sweeteners
Sugar Tabletop sweetener
62 6
64 7
Flavoured yoghurts/mousses S
IS
22 12
26* 13
Jellies/milk based puddings S
IS
9 1
7 2
Jams or conserves S
IS
44* 4
36 4
Flavoured milks S
IS
27 3
35* 4
Note: 1.Base: Total Australian respondents aged 12-39 - screener (n=1,131 in 2002-03; 1,265 in 1994).
2. S = containing sugars, IS = containing intense sweetener. 3. Only the products groups included on both the 1994 and the 2002-03 survey are shown above. 4. Significant Differences between 1994 and 2002-03 are marked with an *.
Consumption of Intense Sweeteners – Australia/New Zealand Page 31
Roy Morgan Research March, 2004
Table 12: Daily Consumption of Product Groups from the Screener Survey – Australia
Product Group Mean
consumption all screener
Mean consumption (median consumption)
consumers screener
90th percentile consumers screener
95th percentile consumers screener
Carbonated soft drinks (ml) S
IS (% IS product)
130 80
(38)
259 (161) 293 (171)
571 643
857 1000
Cordials (ml)
S IS
(% IS product)
81 20
(20)
283 (163) 256 (163)
600 600
850 814
Fruit drinks (ml)
S IS
(% IS product)
41 3
(6)
198 (143) 124 (81)
393 214
550 244
Table top sweeteners (g)
Sugar Tabletop sweetener (sugar equivalents)
11 2
19 (12) 18 (12)
36 36
60 60
Confectioneries (g) S
IS (% IS product)
2 1
(25)
3 (2) 2 (1)
6 4
10 7
Flavoured yoghurts/mousses (g)
S IS
(% IS product)
20 12
(37)
80 (57) 88 (57)
171 200
200 200
Jellies/milk based puddings (g)
S IS
(% IS product)
4 1
(24)
43 (23) 44 (29)
55
114
69
143
Jams (g) S
IS (% IS product)
3
0.4 (11)
6 (5) 8 (5)
16 11
16 16
Flavoured milks (ml)
S IS
(% IS product)
39 4
(10)
172 (86) 153 (86)
343 285
600 407
Canned fruit (g)
S IS
(% IS product)
12 2
(11)
52 (39) 61 (39)
96
135
135 135
Toppings (g)
S IS
(% IS product)
1 0
(11)
9 (5) 8 (8)
15 13
21 18
Ice creams (g)
S IS
(% IS product)
35 5
(12)
72 (43) 74 (57)
143 171
200 286
Note: 1. Base: Total Australian respondents - screener survey (n=2,514).
2. S = containing sugars, IS = containing intense sweetener. 3. The measure for tabletop sweeteners is a “sugar equivalent”. Each serve whether in the form of a sachet, drop or tablet is considered to equal 6 g, therefore a mean consumption (for example) of 18 g would equate to 3 serves. 4. Each piece of confectionery consumed has been assigned a value of 1.5 g, therefore a mean consumption (for example) of 15 g equates to 10 pieces.
Consumption of Intense Sweeteners – Australia/New Zealand Page 32
Roy Morgan Research March, 2004
Table 13: Daily Consumption of Product Groups from the Screener Survey – New Zealand
Product Group Mean consumption all screener
Mean consumption (median consumption)
consumers screener
90th percentile consumers screener
95th percentile consumers screener
Carbonated soft drinks (ml) S
IS (% IS product)
131 79
(38)
247 (171) 302 (179)
571 686
750 857
Cordials (ml)
S IS
(% IS product)
66 22
(25)
270 (163) 272 (163)
571 600
857 800
Fruit drinks (ml)
S IS
(% IS product)
75 9
(10)
209 (118) 180 (163)
457 400
686 429
Table top sweeteners (g)
Sugar Tabletop sweetener (sugar equivalents)
8 2
15 (10) 20 (12)
36 51
48 60
Confectioneries (g) S
IS (% IS product)
1
0.4 (26)
3 (2) 2 (1)
4 4
7 6
Flavoured yoghurts/mousses (g) S
IS (% IS product)
18 9
(33)
71 (57) 75 (57)
171 200
200 200
Jellies/milk based puddings (g)
S IS
(% IS product)
3 1
(20)
31 (23) 34 (29)
55 80
69 86
Jams (g) S
IS (% IS product)
4
0.4 (11)
7 (6) 6 (5)
16 11
23 16
Flavoured milks (ml) S
IS (% IS product)
47 7
(13)
154 (114) 190 (163)
321 343
400 407
Canned fruit (g)
S IS
(% IS product)
14 3
(18)
51 (39) 54 (39)
77 116
116 116
Toppings (g)
S IS
(% IS product)
1 0
(10)
9 (8) 7 (5)
18 10
26 10
Ice creams (g) S
IS (% IS product)
29 5
(14)
61 (43) 67 (29)
114 100
171 200
Note: 1. Base: Total New Zealand respondents - screener survey (n=1,015).
2. S = containing sugars, IS = containing intense sweetener. 3. The measure for tabletop sweeteners is a “sugar equivalent”. Each serve whether in the form of a sachet, drop or tablet is considered to equal 6 g, therefore a mean consumption (for example) of 18 g would equate to 3 serves. 4. Each piece of confectionery consumed has been assigned a value of 1.5 g, therefore a mean consumption (for example) of 15 g equates to 10 pieces.
Consumption of Intense Sweeteners – Australia/New Zealand Page 33
Roy Morgan Research March, 2004
3.1.2 Cordials
Cordials Containing Intense Sweeteners Eight per cent of the survey population reported that they had consumed some cordial containing intense sweeteners in the week prior to the survey. This compares to 28% who reported to have consumed sugar sweetened cordial in the same period (see Table 10). In comparison with the 1994 survey, there has been an increase in the proportion of 12-39 year old Australians consuming cordials containing intense sweetener; 10% in 2002-03 compared with 7% in 1994 (see Table 11). The groups more likely to have consumed cordial containing intense sweeteners were those with diabetes (18%), those with primary education only (15%), 12-17 year olds (14%), those on a weight control diet (13%) and those living in city areas (9%) (see Appendix 5). The reported mean daily consumption of made-up cordial containing intense sweetener for all respondents was estimated to be 20 ml. Amongst consumers the mean amount was 259 ml. There was no significant difference between Australia and New Zealand in the mean daily consumption of cordial containing intense sweeteners. In Australia the median consumption of cordial containing intense sweetener amongst actual consumers was 163 ml and the 90th and 95th percentile was 600 ml and 814 ml respectively. In New Zealand the median consumption amongst consumers was also 163 ml and the 90th and 95th percentile was 600 ml and 800 ml respectively (see Tables 12-13). Amongst consumers across Australia and New Zealand, the reported mean daily consumption of cordial containing intense sweeteners was significantly higher for males than females (311 ml compared with 209 ml), for those without impaired glucose tolerance and for those with tertiary education (see Appendix 7). The mean daily consumption of cordial containing intense sweeteners has increased significantly for Australian male respondents aged 12-39 since the 1994 survey. The mean has risen from 12 ml to 31 ml (see Table 15). In Australia, 20% of the total cordial consumed contained intense sweeteners. The proportion in New Zealand was slightly higher at 25%.
Consumption of Intense Sweeteners – Australia/New Zealand Page 34
Roy Morgan Research March, 2004
Table 14: Daily Consumption of Product Groups from the Screener Survey - 1994 versus 2002-03 (Australians aged 12-39 years)
Note: 1.Base: Total Australian respondents aged 12-39 - screener (n=1,131 in 2002-03; 1,265 in 1994).
2. S = containing sugars, IS = containing intense sweetener. 3. Only the products groups included on both the 1994 and the 2002-03 survey are shown above. 4. In 2002-03, the measure for tabletop sweeteners was a “sugar equivalent”. Each serve equals 6 g, therefore a mean consumption (for example) of 18 g would equate to 3 serves. In the 1994 survey, a different reporting method was used for tabletop sweeteners. The value reported in this table represents an approximate consumption amount expressed in terms of the sugar equivalents approach used in the current survey. A consumption of 233 mg tabletop sweetener in the 1994 survey is assumed to be equivalent to 6 g sugar. 5. Significant Differences between 1994 and 2002-03 are marked with an * .
Consumption of Intense Sweeteners – Australia/New Zealand Page 35
Roy Morgan Research March, 2004
Table 15: Daily Consumption of Product Groups from the Screener Survey - 1994 versus 2002-03 (Australian Males aged 12-39 years)
Note: 1. Base: Total Australian male respondents aged 12-39 - screener (n=477 in 2002-03; 608 in 1994).
2. S = containing sugars, IS = containing intense sweetener. 3. Only the products groups included on both the 1994 and the 2002-03 survey are shown above. 4. In 2002-03, the measure for tabletop sweeteners was a “sugar equivalent”. Each serve equals 6 g, therefore a mean consumption (for example) of 18 g would equate to 3 serves. In the 1994 survey, a different reporting method was used for tabletop sweeteners. The value reported in this table represents an approximate consumption amount expressed in terms of the sugar equivalents approach used in the current survey. A consumption of 233 mg tabletop sweetener in the 1994 survey is assumed to be equivalent to 6 g sugar. 5. Significant Differences between 1994 and 2002-03 are marked with an * . 6. 90th consumer percentile not available for 1994 survey.
Consumption of Intense Sweeteners – Australia/New Zealand Page 36
Roy Morgan Research March, 2004
Table 16: Daily Consumption of Product Groups from the Screener Survey - 1994 versus 2002-03 (Australian Females aged 12-39 years)
Note: 1. Base: Total Australian female respondents aged 12-39 -screener (n=654 in 2002-03; 657 in 1994).
2. S = containing sugars, IS = containing intense sweetener. 3. Only the products groups included on both the 1994 and the 2002-03 survey are shown above. 4. In 2002-03, the measure for tabletop sweeteners was a “sugar equivalent”. Each serve equals 6 g, therefore a mean consumption (for example) of 18 g would equate to 3 serves. In the 1994 survey, a different reporting method was used for tabletop sweeteners. The value reported in this table represents an approximate consumption amount expressed in terms of the sugar equivalents approach used in the current survey. A consumption of 233 mg tabletop sweetener in the 1994 survey is assumed to be equivalent to 6 g sugar. 5. Significant Differences between 1994 and 2002-03 are marked with an * . 6. 90th consumer percentile not available for 1994 survey.
Consumption of Intense Sweeteners – Australia/New Zealand Page 37
Roy Morgan Research March, 2004
Sugar-Sweetened Cordials The groups more likely to have consumed sugar sweetened cordial were Aboriginal/Torres Strait Islander peoples (47%) or those from Maori/Pacific Island backgrounds (32%), those with an annual income of less than $25,000 or no occupation (31% and 35% respectively), those without diabetes (29%), those not on a weight control diet (29%), males (particularly Australian, 31%), the 12-39 year age group (34–43%), and those living in Australia (29% compared to 24% of those living in New Zealand) (see Appendix 5). The reported mean daily consumption of sugar sweetened cordials was estimated at 79 ml for all respondents, and at 281 ml for actual consumers. There were no statistically significant differences between Australian and New Zealand consumers. Amongst Australian consumers, the median consumption was 163 ml and the 90th and 95th percentile consumption was 600 ml and 850 ml respectively. Amongst New Zealand consumers the median consumption was also 163 ml and the 90th and 95th percentile consumption was 571 ml and 857 ml respectively (see Tables 12-13). The reported mean daily consumption of sugar sweetened cordials for consumers was significantly higher amongst 12-39 year olds, males and non-diabetics than among other demographic groups. Those from a Maori/Pacific Islander background had a significantly higher daily mean consumption compared to other New Zealand residents (see Appendix 7). In comparison with the 1994 survey results, statistically significant changes were evident amongst Australian consumers aged 12-39 years. The mean daily consumption of sugar sweetened cordial amongst these consumers rose from 257 ml to 323 ml. The increase in consumption was significant for both males and females (see Tables 14-16).
Consumption of Intense Sweeteners – Australia/New Zealand Page 38
Roy Morgan Research March, 2004
3.1.3 Fruit Drinks
Fruit Drinks Containing Intense Sweeteners Three per cent of the survey population reported that they had consumed fruit drinks containing intense sweetener in the week prior to the survey. This compares to 23% who claimed to have consumed sugar sweetened fruit drinks in the same period (see Table 10). Fruit drinks were not included in the 1994 survey, therefore comparisons with the present study were not possible. Those living in New Zealand were more likely to have consumed fruit drinks containing intense sweetener than their Australian counterparts (5% compared to 2%). Across both countries, 12-17 year olds (5%) were more likely to have consumed this type of drink in the week prior to the survey than any other age group (see Appendix 5). The reported mean daily consumption of fruit drinks containing intense sweetener for all respondents was estimated to be 4 ml. Amongst the small base of actual consumers (n=107) the mean amount was 141 ml. The mean daily amount consumed was significantly higher in New Zealand than in Australia - 180 ml compared to 124 ml (see Appendix 8). In Australia the median daily consumer consumption was 81 ml and the 90th and 95th percentile was 214 ml and 244 ml respectively. In New Zealand the median consumer consumption was 163 ml and the 90th and 95th percentile was 400 ml and 429 ml respectively (see Tables 12-13). As the base size of consumers of fruit drinks containing intense sweeteners was relatively small, it was not practical to analyse the consumers’ mean daily consumption by demographics. Therefore, the consumers’ means for fruit drinks containing intense sweeteners by demographics as shown in Appendix 8 must be interpreted with caution. In Australia just 6% of the total fruit drinks consumed contained intense sweetener. The proportion in New Zealand was slightly higher at 10%.
Consumption of Intense Sweeteners – Australia/New Zealand Page 39
Roy Morgan Research March, 2004
Sugar Sweetened Fruit Drinks The groups more likely to have consumed sugar sweetened fruit drinks were those without an occupation (35%), those living in New Zealand, (36% compared to 21% of Australians), those considered underweight (31%), the 12-24 age group and non-diabetics (24%) (see Appendix 5). The mean daily consumption of sugar sweetened fruit drinks was estimated at 46 ml for all respondents, and at 200 ml for consumers. There were no statistically significant differences between Australian and New Zealand consumers (see Appendix 8). Amongst Australian consumers, the median daily consumption of sugar sweetened fruit drinks was 143 ml and the 90th and 95th percentile consumption was 393 ml and 550 ml respectively. Amongst New Zealand consumers the median daily consumption was 118 ml and the 90th and 95th percentile consumption was 457 ml and 686 ml respectively (see Tables 12-13). The reported mean consumer consumption of sugar sweetened fruit drinks was significantly higher amongst 18-24 year olds, males, non-diabetics and those in unskilled occupations (see Appendix 8 for detailed comparisons).
3.1.4 Tabletop Sweeteners in Hot Drinks or on Cereals
Intense Sweeteners in Hot Drinks or on Cereals Ten per cent of the survey population reported that they had consumed some tabletop intense sweetener that they had added to hot drinks or to cereal in the week prior to the survey. This compares to 59% who claimed they had consumed added sugar in hot drinks or on cereal in the same period (see Table 10). In comparison with the 1994 survey, there has not been a significant increase in the proportion of 12-39 year old Australians using tabletop intense sweeteners in hot drinks or on cereals - 7% in 2002-03 compared with 6% in 1994 (see Table 11). There was no significant difference between Australia and New Zealand in the proportion consuming tabletop intense sweeteners in 2002-03 (see Appendix 5 for further details). The groups most likely to have consumed tabletop intense sweeteners in the week prior to the survey were diabetics (41%), those on a weight controlled diet (23%), those aged over 60 (18%), those with impaired glucose tolerance (16%) and those considered obese (15%).
Consumption of Intense Sweeteners – Australia/New Zealand Page 40
Roy Morgan Research March, 2004
Females were, also, slightly more likely than males to have consumed tabletop intense sweeteners (11% compared to 8%) in this period (see Appendix 5). The reported mean daily consumption of tabletop intense sweetener for all respondents was 2 g, while the consumer mean was 18 g. This is based on a “sugar equivalent” measure, whereby a serve of intense sweetener equates to a teaspoon of sugar i.e. 6 g. Therefore, the consumer mean consumption of 18 g is essentially 3 serves, whether in the form of a powder, a sachet, a tablet or drops. There was no significant difference between Australia or New Zealand in terms of the mean daily consumption amount for consumers. In Australia the median daily consumption of tabletop intense sweeteners for consumers was 12 g (2 serves) and the 90th and 95th percentile consumption for consumers was 30 g (5 serves) and 60 g (10 serves) respectively. In New Zealand the median consumption amounts for consumers was also 12 g (2 serves/day) and the 90th and 95th percentile was 51 g (8.5 serves) and 60 g (10 serves) respectively (see Tables 12-13). In the 1994 survey, a different reporting method was used for tabletop sweeteners. The values for 1994 reported in Tables 14-16 represents an approximate consumption amount expressed in terms of the sugar equivalents approach used in the current survey. A consumption of 233 mg of tabletop sweetener in the 1994 survey is assumed to be equivalent to 6 g of sugar. However, it must be noted that this is not an exact comparison and therefore it is not possible to indicate whether there has been a change in the mean daily amount consumed. Sugar in Hot Drinks or on Cereals The groups most likely to have added sugar to their hot drinks or to their cereal were Maori/Pacific Islanders (67% compared to 54% of all other New Zealand residents), those in blue collar or unskilled occupations (65% and 67% respectively), males (65% compared to 52% of females), those living in non-city areas (61%), non-diabetics (60%) and those not on a weight control diet (60%) (see Appendix 5). The reported mean daily consumption of added sugar in hot drinks and on cereal for both Australia and New Zealand was estimated at 11 g (approximately 2 teaspoons) for all respondents, and at 18 g (approximately 3 teaspoons) for consumers. The mean daily consumption was statistically higher in Australia than New Zealand, both for all respondents and for consumers. The consumer mean daily consumption in Australia was 19 g, compared with 15 g in New Zealand (see Appendix 9).
Consumption of Intense Sweeteners – Australia/New Zealand Page 41
Roy Morgan Research March, 2004
Furthermore, amongst Australian consumers, the median daily sugar consumption was 12 g and the 90th and 95th percentile consumption was 36 g and 60 g respectively. Amongst New Zealand consumers the median consumption was 10 g and the 90th and 95th percentile consumption was 36 g and 48 g respectively (see Tables 12-13). The reported mean daily consumption of added sugar amongst consumers (across both Australia and New Zealand) was significantly higher for males (21 g compared to 16 g of females), for those not on a weight control diet (19 g compared to 13 g of those on such a diet), for blue collar workers (22 g) and the non-city residents (21 g compared to 17 g of those living in cities) (see Appendix 9). In comparison with the 1994 survey results, no statistically significant changes in the addition of sugar to hot drinks and cereals were evident amongst Australian consumers aged 12-39 years either male or female (see Tables 14-16).
3.1.5 Confectioneries
Confectioneries Containing Intense Sweeteners Twenty seven per cent of the survey population reported that they had consumed confectionery (i.e. chewing gum, lollies, chocolate etc) containing intense sweetener in the week prior to the survey. This compares to 60% who claimed to have consumed sugar sweetened confectionery in the same period (see Table 10). Australian and New Zealand residents were just as likely to have consumed confectioneries containing intense sweeteners in the week prior to the screener survey. However, across both countries, the groups more likely to have consumed this type of product were those on a weight control diet (36% compared to 25% of those not on such a diet), or those considered underweight (35% compared to 23–27% of those with a body mass index above 20), diabetics (34% compared to 26% of non-diabetics), females (30% compared to 23% of males), those living in cities (29% compared to 23% of non-city dwellers) and the 12-24 years age group (44–46% compared to 10–33% of those aged 25 years and above) (see Appendix 5). The reported mean daily consumption of confectioneries containing intense sweeteners was estimated to be 1 g for all respondents. Amongst consumers the mean daily amount was 2 g (see Appendix 10). This measurement is based on each piece of confectionery consumed being assigned a value of 1.5 g, which represents the mean mass of one piece of chewing gum. Therefore a mean consumption, for example, of 15 g would equate to 10
Consumption of Intense Sweeteners – Australia/New Zealand Page 42
Roy Morgan Research March, 2004
pieces of confectionery. There was no significant difference between Australia and New Zealand in terms of the mean consumer intake. The reported consumption amounts are likely to be underestimates of the actual consumption amounts as the term ‘confectionery’ includes foods other than chewing gum (e.g. chocolate) that have a larger mass per piece than chewing gum itself. In Australia the median daily consumption of confectioneries containing intense sweeteners amongst consumers was 1 g and the 90th and 95th percentile was 4 g and 7 g respectively. In New Zealand the median consumption amongst consumers was also 1 g and the 90th and 95th percentile were 4 g and 6 g respectively (see Tables 12-13). Amongst consumers, the reported consumption of confectioneries containing intense sweeteners was significantly higher for those on a weight control diet – 3 g compared to 2 g for those not on such a diet (see Appendix 10). In Australia, 25% of the total confectioneries consumed contained intense sweetener. The proportion in New Zealand was similar at 26%. The 1994 survey only recorded consumption of chewing gum rather than of all types of intense sweetened confectionery and therefore it is not possible to compare the results of the two studies for this food group. Sugar Sweetened Confectioneries The groups more likely to have consumed sugar sweetened confectioneries were the 12-17 year age group (78%), those without an occupation (71% - this includes 12-17 year olds who are still at school/college), those considered underweight (69%), females (64% compared to 52% of males), non-diabetics (61% compared to 30% of diabetics) and those not on a weight control diet (61% compared to 52%) (see Appendix 5). The reported mean daily consumption of sugar sweetened confectioneries across both Australia and New Zealand was estimated at 2 g for all respondents, and at 3 g for consumers. There was no statistically significant difference between Australia and New Zealand consumers (see Appendix 10). Amongst Australian consumers, the median consumption of sugar sweetened confectioneries was 2 g and the 90th and 95th percentile consumption was 6 g and 10 g respectively. Amongst New Zealand consumers the median consumption was also 2 g and the 90th and 95th percentile consumption was 4 g and 7 g respectively (see Tables 12-13).
Consumption of Intense Sweeteners – Australia/New Zealand Page 43
Roy Morgan Research March, 2004
The reported mean daily consumption of sugar sweetened confectionery amongst consumers was significantly higher amongst males, non-diabetics, those not on a weight control diet, those considered underweight in terms of their BMI, and blue collar workers (see Appendix 10).
3.1.6 Flavoured Yoghurts and Mousses
Flavoured Yoghurts and Mousses Containing Intense Sweeteners Thirteen per cent of the survey population reported that they had consumed flavoured yoghurt or mousse containing intense sweetener in the week prior to the survey. This compares to 26% who claimed to have consumed sugar sweetened flavoured yoghurt or mousse in the same period (see Table 10). In comparison with the 1994 survey, there has not been an increase in the proportion of 12-39 year old Australians consuming flavoured yoghurts or mousses containing intense sweetener - 13% in 2002-03 compared with 12% in 1994 (see Table 11). Those living in Australia and New Zealand were just as likely to have consumed the intense sweetened option in the previous 7 days. However, across both countries, the groups more likely to have consumed flavoured yoghurt or mousse containing intense sweeteners were those on a weight control diet (28% compared to 11% of those not on such a diet), diabetics (23% compared to 13% of non-diabetics), females (17% compared to 9% of males) and those who have attained secondary or tertiary level education (13% and 14% respectively compared to 6% of those with only primary education) (see Appendix 5). The reported mean daily consumption of flavoured yoghurt or mousse containing intense sweetener was estimated to be 11 g for all respondents. Amongst consumers the mean amount was 87 g. Australian consumers had a significantly higher mean daily consumption of yoghurt and mousse containing intense sweetener than their New Zealand counterparts – 88 g compared to 75 g (see Appendix 11). However, in both Australia and New Zealand the median daily consumption of yoghurt and mousse containing intense sweetener amongst actual consumers was 57 g and the 90th and 95th percentile were both 200 g (see tables 12-13). Furthermore, the mean daily consumption amongst consumers has increased significantly since 1994 for Australians aged 12-39 years. The mean consumption has risen from 70 g
Consumption of Intense Sweeteners – Australia/New Zealand Page 44
Roy Morgan Research March, 2004
to 89 g, mainly due to an increase in consumption amongst male Australian consumers - up from 73g to 93g (see Table 15). As the base size of consumers of flavoured yoghurt or mousse containing intense sweetener was relatively small, it was not practical to analyse the consumers’ mean daily consumption by detailed demographics. Therefore the consumers’ means for flavoured yoghurt or mousse containing intense sweetener, as shown in Appendix 11, must be interpreted with caution. In Australia, 37% of the total flavoured yoghurt and mousse consumed contained intense sweetener. The proportion in New Zealand was slightly lower at 33%. Sugar Sweetened Flavoured Yoghurts or Mousses The groups more likely to have consumed sugar sweetened flavoured yoghurt or mousse were Maori/Pacific Islanders (35% compared to 24% of all other New Zealand residents), those with no occupation (34%), the 12-17 age group (33%), those considered underweight (30%), females (28% compared to 24% for males) and non-diabetics (26% compared to 10% of diabetics) (see Appendix 5). The reported mean daily consumption of sugar sweetened flavoured yoghurt or mousse across both Australia and New Zealand was estimated at 20 g for all respondents, and at 78 g for actual consumers. There was no statistically significant difference between Australia and New Zealand consumers (see Appendix 11). Amongst both Australian and New Zealand consumers, the median daily consumption of sugar sweetened flavoured yoghurt or mousse was 57 g and the 90th and 95th percentile consumption was 171 g and 200 g respectively (see Tables 12-13). The reported mean daily consumption of sugar sweetened yoghurts and mousses amongst consumers was significantly higher amongst males (particularly Australian males), the 40-59 year age group, those on a weight control diet, all those not considered underweight, Australians or New Zealanders born in Europe, non-indigenous Australians and non-city residents (see Appendix 8 for detailed comparisons). In comparison with the 1994 survey results, there were no statistically significant changes evident in the mean amount of sugar sweetened flavoured yoghurt consumed amongst Australian consumers aged 12-39 years (see Tables 14-16).
Consumption of Intense Sweeteners – Australia/New Zealand Page 45
Roy Morgan Research March, 2004
3.1.7 Jellies and Milk Based Puddings
Jellies and Milk Based Puddings Containing Intense Sweeteners Three per cent of the survey population reported that they had consumed jelly or milk based pudding containing intense sweetener in the week prior to the survey. This compares to nine percent who reported consuming sugar sweetened jelly or milk based pudding in the same period (see Table 10). In comparison with the 1994 survey, there has not been an increase in the proportion of 12-39 year old Australians consuming jelly or milk based pudding containing intense sweetener - 2% in 2002-03 compared with 1% in 1994 (see Table 11). Those living in Australia and New Zealand were just as likely as each other to have consumed the intense sweetened option in the previous 7 days. However, across both countries, the groups more likely to have consumed jelly or milk based pudding containing intense sweeteners were those with diabetes or impaired glucose tolerance (8% compared to 3% of those without impaired tolerance), those on a weight control diet (7% compared to 2% of those not on such a diet) and those who attained only primary level education (6% compared to 3% and 2% of those with secondary or tertiary education respectively) (see Appendix 5). The reported mean daily consumption of jelly or milk based pudding containing intense sweetener was estimated to be 1 g for all respondents. Amongst the small base of actual consumers (n=102) the mean daily consumption of jelly containing intense sweetener was 42 g. There was no statistically significant difference in the mean daily consumption between Australian and New Zealand consumers – 44 g compared to 34 g (see Appendix 12). In Australia the median daily consumption of jelly or milk based pudding containing intense sweetener amongst consumers was 29 g and the 90th and 95th percentile were 114 g and 143 g respectively. In New Zealand the median daily consumption of jelly or milk based pudding containing intense sweetener amongst consumers was also 29 g and the 90th and 95th percentile was 80 g and 86 g respectively (see Tables 12-13). Furthermore, the mean daily consumption of jelly or milk based pudding containing intense sweetener amongst consumers has decreased significantly for Australians aged 12-39 years since 1994; from 74 g down to 28 g. This decrease in average consumption was notable for females, where consumption decreased from 102 g in 1994 to 25 g in 2002-03 (see Tables 14-16).
Consumption of Intense Sweeteners – Australia/New Zealand Page 46
Roy Morgan Research March, 2004
As the base size of consumers of jelly or milk based pudding containing intense sweeteners was relatively small, it was not practical to analyse the consumers’ mean daily consumption by detailed demographics. Therefore, the consumers’ means for jelly or milk based pudding containing intense sweeteners, as shown in Appendix 12, must be interpreted with caution. In Australia, 24% of the total jelly or milk based pudding consumed contained intense sweetener. The proportion in New Zealand was slightly lower at 20%. Sugar Sweetened Jellies and Milk Based Puddings The groups more likely to have consumed sugar sweetened jelly or milk based pudding were those who had only attained primary level education (18%), those aged 60 years and over (16%) and the 12-17 year old age group (12%). New Zealand females were more likely than Australian females to have consumed sugar sweetened jelly and milk based pudding in the previous seven days (13% compared to 9%) (see Appendix 5). Across Australia and New Zealand, the reported mean daily consumption of sugar sweetened jelly or milk based pudding was estimated at 4 g for all respondents, and at 40 g for actual consumers. There was no statistically significant difference between Australian and New Zealand consumers (see Appendix 12). Amongst both Australian and New Zealand consumers, the median daily consumption of sugar sweetened jelly or milk based pudding was 23 g and the 90th and 95th percentile consumption was 55 g and 69 g respectively (see Tables 12-13). The reported mean daily consumption of sugar sweetened jelly or milk based pudding amongst consumers did not differ significantly across any of the demographic sub-groups. In comparison with the 1994 survey results, there was no statistically significant change evident in the mean daily amount of sugar sweetened jelly or milk based pudding consumed amongst Australian consumers aged 12-39 years (see Tables 14-16).
Consumption of Intense Sweeteners – Australia/New Zealand Page 47
Roy Morgan Research March, 2004
3.1.8 Jams or Conserves
Jams or Conserves Containing Intense Sweeteners Five per cent of the survey population reported that they had consumed jam or conserve containing intense sweetener in the week prior to the survey. This compares to 46% who claimed to have consumed sugar sweetened jam or conserve in the same period (see Table 10). In comparison with the 1994 survey, there has not been an increase in the proportion of 12-39 year old Australians consuming jam or conserve containing intense sweetener; 4% in both 2002-03 and in 1994 (see Table 11). New Zealanders, particularly males, were more likely than Australians to have consumed jam or conserve containing intense sweeteners in the previous 7 days (7% compared to 5% respectively). However, across both countries, the groups more likely to have consumed jams or conserves containing intense sweetener were those with diabetes (26% compared to 4% of non-diabetics), those on a weight control diet (11% compared to 4% of those not on such a diet), those who had only attained primary level education (10%), the 60 years and over age group (8%) and those considered to be obese according to their body mass index (8%) (see Appendix 5). The reported mean daily consumption of jam or conserve containing intense sweetener was estimated to be less than 0.5 g for all respondents. Amongst the small base of actual consumers (n=188) the mean daily amount was 8 g (equivalent to approximately 1.5 teaspoons of jam). There was no statistically significant difference in the mean consumption between Australian and New Zealand consumers (8 g compared to 6 g). In both Australia and New Zealand the median daily consumption of jam or conserve containing intense sweetener amongst consumers was 5 g and the 90th and 95th percentile was 11 g and 16 g respectively (see Tables 12-13). Furthermore, the mean consumption amongst Australian consumers aged 12-39 years has not changed significantly since 1994 (see Tables 14-16). Amongst consumers, the reported consumption of jams or conserves containing intense sweetener, across both countries, was significantly higher for males (10 g compared to 6 g for females), particularly Australian males (11 g compared to 7 g for Australian females) (see Appendix 13).
Consumption of Intense Sweeteners – Australia/New Zealand Page 48
Roy Morgan Research March, 2004
In both Australia and New Zealand, 11% of the total jams or conserves consumed contained intense sweetener. Sugar Sweetened Jams or Conserves Those living in New Zealand were more likely to have consumed sugar sweetened jam or conserve in the 7 days prior to the survey than their Australian counterparts (49% compared to 45%). Across both countries, the groups more likely to have consumed sugar sweetened jam or conserve were those aged 60 years and over (60%) or 40-59 years (50%), those not on a weight control diet (47% compared to 35% on such a diet), non-diabetics (46% compared to 33% of diabetics) and those with higher annual incomes ($40,000 and over in the local currency) (see Appendix 5 for detailed comparisons). The estimated mean daily consumption of sugar sweetened jam or conserve across both Australia and New Zealand was estimated at 3 g, and at 7 g for actual consumers. New Zealand consumers had a slightly, but statistically significant, higher mean than their Australian counterparts – 7 g compared to 6 g (see Appendix 13). Amongst Australian consumers, the median daily consumption of sugar sweetened jam or conserve was 5 g and the 90th and 95th percentile consumption were both 16 g respectively. Amongst New Zealand consumers the median daily consumption was also 6 g and the 90th and 95th percentile consumption was 16 g and 23 g respectively (see Tables 12-13). The reported mean daily consumption of sugar sweetened jam or conserve, amongst consumers, differed across some of the demographic sub-groups. The mean daily consumption was significantly higher amongst Maori/Pacific Islanders compared to all other New Zealand residents (11 g compared to 7 g), males (particularly New Zealand males – 9 g compared to 6 g for New Zealand females), those aged 60 years and over (8 g compared to 6–7 g for younger groups) and those living in non-city areas (7 g compared to 6 g for city dwellers) (see Appendix 13). In comparison with the 1994 survey results, there was no statistically significant change evident in the mean daily amount of sugar sweetened jam or conserve consumed amongst Australian consumers aged 12-39 years (see Tables 14-16).
Consumption of Intense Sweeteners – Australia/New Zealand Page 49
Roy Morgan Research March, 2004
3.1.9 Flavoured Milks
Flavoured Milk Containing Intense Sweeteners Three per cent of the survey population reported that they had consumed flavoured milk containing intense sweetener in the week prior to the survey. This compares to 24% who claimed to have consumed sugar sweetened flavoured milk in the same period (see Table 10). In comparison with the 1994 survey, there has not been an increase in the proportion of 12-39 year old Australians consuming flavoured milks containing intense sweetener - 4% in 2002-03 compared with 3% in 1994 (see Table 11). Australian and New Zealand residents were just as likely to have consumed flavoured milk containing intense sweeteners in the previous seven days (3% and 4% respectively). However, across both countries, the groups more likely to have consumed flavoured milk containing intense sweeteners were those aged 12-39 years (4–6% compared to 2% of those aged 40 years and above), Aboriginal or Torres Strait Islander peoples compared to all other Australians (15% compared to 3%), diabetics (8% compared to 3% of non-diabetics) and those on a weight control diet (5% compared to 3% of those not on such a diet) (see Appendix 5). The reported mean daily consumption of flavoured milk containing intense sweetener was estimated to be 5 ml for all respondents. Amongst the small base of actual consumers (n=110) the mean amount was 161 ml. There was no statistically significant difference in the mean daily consumption between Australian and New Zealand consumers – 153 ml compared to 190 ml (see Appendix 14). In Australia the median daily consumption of flavoured milk containing intense sweetener amongst consumers was 86 ml and the 90th and 95th percentile was 285 ml and 407 ml respectively. In New Zealand the median consumption amongst consumers was 163 ml and the 90th and 95th percentile was 343 ml and 407 ml respectively (see Tables 12-13). Furthermore, the mean daily consumption of flavoured milk containing intense sweetener amongst consumers has increased significantly since 1994 for Australians aged 12-39 years, rising from a mean of 100 ml to 124 ml. The increase in consumption was significant for Australian female consumers aged 12-39 years, increasing from a mean daily consumption of 70 ml in 1994 to 129 ml in 2003 (see Tables 14-16).
Consumption of Intense Sweeteners – Australia/New Zealand Page 50
Roy Morgan Research March, 2004
As the base size of consumers of flavoured milk containing intense sweeteners was relatively small, it was not practical to analyse the consumers’ mean daily consumption by detailed demographics. Therefore, the consumers’ means for flavoured milk containing intense sweeteners, as shown in Appendix 14, must be interpreted with caution. In Australia 10% of the total flavoured milk consumed contained intense sweeteners. The proportion in New Zealand was slightly higher at 13%. Sugar Sweetened Flavoured Milk New Zealand residents were more likely to have consumed sugar sweetened flavoured milk in the 7 days prior to the survey than their Australian counterparts (30% compared to 23%). New Zealand males were significantly more likely than Australian males to have consumed sugar sweetened flavoured milk (34% compared to 27%) (see Appendix 5 for a detailed comparison). Across both countries, the groups more likely to have consumed sugar sweetened flavoured milk were those aged 12-17 and 18-24 years (53% and 44% respectively), those with no occupation (41% - this includes the younger age groups still at school and the unemployed), those considered underweight in terms of their BMI (34%), those respondents born in New Zealand as opposed to elsewhere (30%) and non-diabetics (24% compared to 10% of diabetics) (see Appendix 5). The reported mean daily consumption of sugar sweetened flavoured milk for both Australia and New Zealand was estimated at 40 ml for all respondents, and at 168 ml for actual consumers. There was no statistically significant difference between Australia and New Zealand consumers (see Appendix 14). Amongst Australian consumers, the median daily consumption of sugar sweetened flavoured milks was 86 ml and the 90th and 95th percentile consumption was 343 ml and 600 ml respectively. Amongst New Zealand consumers the median daily consumption was 114 ml and the 90th and 95th percentile consumption was 321 ml and 400 ml respectively (see Tables 12-13). The estimated mean daily consumption of sugar sweetened flavoured milks amongst consumers differed across some of the demographic sub-groups. The mean daily consumption was greatest amongst males (particularly Australian males – 207 ml), those aged 18-24 years (196 ml) and those not on a weight control diet (174 ml compared to 122 ml for those on a diet) (see Appendix 14).
Consumption of Intense Sweeteners – Australia/New Zealand Page 51
Roy Morgan Research March, 2004
There has been a significant increase in the mean daily amount of sugar sweetened flavoured milk consumed amongst Australian consumers aged 12-39 years, since the 1994 survey. The mean amount rose from 157 ml in 1994 to 176 ml in 2003. The increase was particularly significant amongst the male consumers in this age group, whose mean consumption increased from 183 ml up to 213 ml (see Tables 14-16).
3.1.10 Canned Fruits
Canned Fruit Containing Intense Sweeteners Three per cent of the survey population reported that they had consumed canned fruit containing intense sweeteners in the week prior to the survey. This compares to 25% who claimed to have consumed sugar sweetened canned fruit in the same period (see Table 10). Canned fruit was not included in the 1994 survey, therefore comparisons with the present study were not possible. New Zealand residents were significantly more likely than their Australian counterparts to have consumed canned fruit containing intense sweeteners in the previous 7 days (6% and 3% respectively). However, across both countries, the groups more likely to have consumed canned fruits containing intense sweeteners were those with diabetes (11% compared to 3% of non-diabetics), those with impaired glucose tolerance (10% compared to 3%), those on a weight control diet (7% compared to 3% of those not on such a diet) and those aged 60 years and over (5% compared to 1–4% of younger groups) (see Appendix 5). The reported mean daily consumption of canned fruit containing intense sweetener was estimated to be 2 g for all respondents. Amongst the small base of actual consumers (n=139) the mean daily amount was 59 g. There was no statistically significant difference in the mean consumption of canned fruit containing intense sweetener between Australian and New Zealand consumers – 61 g compared to 54 g (see Appendix 15). In Australia the median daily consumption of canned fruit containing intense sweetener amongst consumers was 39 g and the 90th and 95th percentile were both 135 g. In New Zealand the median daily consumption amongst consumers was also 39 g and the 90th and 95th percentile were both 116 g respectively (see Tables 12-13). As the base size of consumers of canned fruit containing intense sweetener was relatively small, it was not practical to analyse the consumers’ mean daily consumption by detailed
Consumption of Intense Sweeteners – Australia/New Zealand Page 52
Roy Morgan Research March, 2004
demographics. Therefore, the consumers’ means for canned fruit containing intense sweetener, as shown in Appendix 15, must be interpreted with caution. In Australia 11% of the total consumption of canned fruit contained intense sweetener. The proportion in New Zealand was higher at 18%. Sugar Sweetened Canned Fruit There was no statistically significant difference between Australia and New Zealand in the proportion who consumed sugar sweetened canned fruit (including fruit canned in natural juice) in the 7 days prior to the screener survey (24% compared to 27%). Across both countries, the groups more likely to have consumed sugar sweetened canned fruit in that period were those in an unskilled occupation (32%), those aged 60 years and over (31%), those with a BMI in the range 20-30 (26-27%) and non-diabetics (25% compared to 16% of those with diabetes) (see Appendix 5 for a detailed comparison). The reported mean daily consumption of sugar sweetened canned fruit across both Australia and New Zealand was estimated at 13 g for all respondents, and at 52 g amongst actual consumers. There was no statistically significant difference between Australian and New Zealand consumers (see Appendix 15). Amongst Australian consumers, the median daily consumption of sugar sweetened canned fruit was 39 g and the 90th and 95th percentile consumption was 96 g and 135 g respectively. Amongst New Zealand consumers the median daily consumption was also 39 g and the 90th and 95th percentile consumption was 77 g and 116 g respectively (see Tables 12-13). Across both countries, the older age consumer group, i.e. those aged 60 years and over had a higher mean daily consumption of sugar sweetened canned fruit than the younger groups. This trend was, also, observed among consumers with high income (56 g) or tertiary level education (59 g) compared with those with who attained primary and/or secondary education (49 g and 47 g respectively) (see Appendix 15).
Consumption of Intense Sweeteners – Australia/New Zealand Page 53
Roy Morgan Research March, 2004
3.1.11 Toppings
Toppings Containing Intense Sweeteners One per cent of the survey population reported that they had consumed toppings containing intense sweetener in the week prior to the survey. This compares to nine percent who reported to have consumed sugar sweetened toppings in the same period (see Table 10). Toppings were not included in the 1994 survey, therefore comparisons with the present study were not possible. There was no statistically significant difference between Australia and New Zealand in the proportion who consumed toppings containing intense sweeteners in the period leading up to the screener survey (1% in both countries) However, across both countries, those with diabetes were more likely than non-diabetics to have been consumers of the product in the 7 days prior to the survey (3% compared to 1% respectively). No other significant differences were evident (see Appendix 5). The reported mean daily consumption of toppings containing intense sweeteners was estimated to be less than 0.5 g for all respondents. Amongst the very small base of actual consumers (n=42) the mean daily amount was 8 g. There was no statistically significant difference in the mean consumption between Australian and New Zealand consumers - 8 g compared to 7 g (see Appendix 16). In Australia the median daily consumption of toppings containing intense sweeteners amongst consumers was 8 g and the 90th and 95th percentile was 13 g and 18 g respectively. In New Zealand the median daily consumption amongst consumers was 5 g and the 90th and 95th percentile were both 10 g respectively (see Tables 12-13). As the base size of consumers of toppings containing intense sweeteners was very small, it was not practical to analyse the consumers’ mean daily consumption by detailed demographics. Therefore all consumers’ means for toppings containing intense sweeteners, as shown in Appendix 16 and Tables 12-13, must be interpreted with caution. In Australia 11% of the total toppings consumed contained intense sweetener. The proportion in New Zealand was 10%.
Consumption of Intense Sweeteners – Australia/New Zealand Page 54
Roy Morgan Research March, 2004
Sugar Sweetened Toppings There was no statistically significant difference between Australia and New Zealand in the proportion who consumed sugar sweetened toppings during the 7 days prior to the survey (9% in both countries). The groups more likely to have consumed sugar sweetened toppings in that period were the 12-17 year age group (17%), those not on a weight control diet (10% compared to 4% of those not on such a diet) and non-diabetics (9% compared to 1% of non-diabetics) (see Appendix 5 for a detailed comparison). The reported mean daily consumption of sugar sweetened toppings across both Australia and New Zealand was estimated at 1 g for all respondents, and at 9 g for actual consumers. There was no statistically significant difference between Australia and New Zealand consumers (see appendix 16). Amongst Australian consumers of sugar sweetened toppings, the median daily consumption was 5 g and the 90th and 95th percentile consumption was 15 g and 21 g respectively. Amongst New Zealand consumers the median daily consumption was 8 g and the 90th and 95th percentile consumption was 18 g and 26 g respectively (see Tables 12-13). Mean daily consumption of sugar sweetened toppings did not differ greatly across the various consumer demographic sub-groups (see Appendix 16).
3.1.12 Ice Creams
Ice Cream Containing Intense Sweeteners Seven per cent of the survey population reported that they had consumed ice cream containing intense sweeteners in the week prior to the survey. This compares to 48% who claimed to have consumed sugar sweetened ice cream in the same period (see Table 10). Ice cream was not included in the 1994 survey, therefore comparisons with the present study were not possible. There was no statistically significant difference between Australia and New Zealand in the proportion who consumed ice cream containing intense sweeteners in the week leading up to the survey (7% in both countries). Those with diabetes were more likely to have been consumers of the product in the 7 days prior to the survey (22% compared to 6% of non-diabetics), as were those on a weight control diet (14% compared to 6% of those not on
Consumption of Intense Sweeteners – Australia/New Zealand Page 55
Roy Morgan Research March, 2004
such a diet) and those with a lower annual income - $25,000 or less (8% compared to 4-6% of those with incomes above this) (see Appendix 5). The reported mean daily consumption of ice cream containing intense sweetener was estimated at 5 g for all respondents. Amongst actual consumers the mean amount was 73 g. There was no statistically significant difference between Australian and New Zealand consumers in the mean daily consumption of ice cream containing intense sweetener – 74 g compared to 67 g (see Appendix 14). In Australia the median daily consumption of ice cream containing intense sweetener amongst consumers was 57 g and the 90th and 95th percentile was 171 g and 286 g respectively. In New Zealand the median daily consumption amongst consumers was 29 g and the 90th and 95th percentile was 100 g and 200 g respectively (see Tables 12-13). The reported mean daily consumption of ice cream containing intense sweetener did not differ greatly across the demographic sub-groups of consumers (see Appendix 17). In Australia 12% of the total ice cream consumed contained intense sweetener. The proportion in New Zealand was slightly higher at 14%. Sugar Sweetened Ice Cream There was no statistically significant difference between Australia and New Zealand in the proportion who consumed sugar sweetened ice cream in the 7 days prior to the survey (49% compared to 48%). Across both countries, the groups more likely to have consumed sugar sweetened ice cream were the 12-17 year age group (62%), those considered underweight according to their BMI (55%), those not on a weight control diet (50% compared to 35%), males (51% compared to 46% of females) and non-diabetics (49% compared to 26%) (see Appendix 5). The mean daily consumption of sugar sweetened ice cream across both Australia and New Zealand was estimated at 34 g for all respondents, and at 70 g for actual consumers. Australian consumers ate a significantly higher mean daily amount than their New Zealand counterparts – 72 g compared to 61 g (see Appendix 17). Amongst Australian consumers, the median daily consumption of sugar sweetened ice cream was 43 g and the 90th and 95th percentile consumption was 143 g and 200 g respectively. Amongst New Zealand consumers the median daily consumption was also 43 g and the 90th and 95th percentile consumption was 114 g and 171 g respectively (see Tables 12-13).
Consumption of Intense Sweeteners – Australia/New Zealand Page 56
Roy Morgan Research March, 2004
The mean daily consumption of sugar sweetened ice cream did not differ greatly across the various consumer demographic sub-groups. However, males had a significantly higher mean than females (83 g compared to 57 g). Also, those without impaired glucose tolerance had a significantly greater mean daily consumption amount than those with impaired tolerance (71 g compared to 40 g) (see Appendix 17).
3.2 Summary of Screener Survey Findings
In the week prior to the survey, 27% of the combined populations of Australia and New Zealand aged 12 years and over had consumed carbonated soft drinks containing intense sweeteners. The same proportion consumed confectioneries containing intense sweeteners (27%), while 13% consumed flavoured yoghurt/mousse containing intense sweetener. On the other hand, ten percent or less consumed from each of the other key food product groups containing intense sweeteners. The proportions who consumed from each of the product groups containing intense sweeteners were as follows:
• carbonated soft drinks (27%); • confectioneries (27%); • flavoured yoghurt/mousse (13%) • tabletop sweeteners (10%); • cordials (8%); • ice cream (7%); • jam or conserve (5%); • flavoured milk (3%); • fruit drinks (3%); • jelly or milk based puddings (3%); • canned fruit (3%); and • toppings (1%).
There were several groups who were more likely to have consumed products containing intense sweeteners than others. These included females, those with diabetes or impaired glucose tolerance (despite the small base size) and those on a weight control diet. In terms of age, the younger age groups were significantly more likely to be consumers of cordials, fruit drinks, flavoured milk and confectionery containing intense sweeteners than
Consumption of Intense Sweeteners – Australia/New Zealand Page 57
Roy Morgan Research March, 2004
the older age groups. At the other end of the age spectrum, those aged 60 years and over were significantly more likely to have consumed jam and canned fruit and tabletop sweeteners containing intense sweeteners. Very few differences were evident between Australia and New Zealand in the consumption of food products containing intense sweeteners. New Zealand respondents, however, were more likely than their Australian counterparts to have consumed fruit drinks, canned fruit and jams/conserves containing intense sweeteners. The reported mean daily consumption for all products had a large standard deviation. This was also evident in the 1994 survey and suggests that these products are not consumed on a regular basis. Similar to the findings reported in the 1994 survey, the mean daily respondent consumption of products containing intense sweeteners continues to be significantly higher for those who are diabetic or are on a weight control diet. On the other hand, the consumption of the sugar sweetened versions of the products tend to be higher for those without diabetes or not on such diets. In comparison with the 1994 Australian survey of 12-39 year olds, there has been a significant increase in the average daily consumption of carbonated soft drinks containing intense sweeteners amongst respondents and consumers in this age group. Significant increases, amongst Australian respondents aged 12-39 years, were also evident for cordial, flavoured yoghurt/mousse (both particularly amongst male consumers) and flavoured milk (amongst female consumers) containing intense sweeteners. Jellies and milk based puddings with intense sweetener showed a significant decrease in consumption while consumption of intense sweetened jam and table top sweeteners remained unchanged. Mean daily consumption of the various products containing intense sweeteners differed very little between Australia and New Zealand. However, the mean daily consumption amount of fruit drinks containing intense sweetener was higher in New Zealand, while the mean daily consumption amount of flavoured yoghurt/mousse containing intense sweetener was higher in Australia.
Consumption of Intense Sweeteners – Australia/New Zealand Page 58
Roy Morgan Research March, 2004
4. KEY FINDINGS - DIARY SURVEY The diary survey was used to estimate exposure to intense sweeteners for the sub-group of the population who were identified in the screener survey as potential high consumers of products containing intense sweeteners. Estimated exposures were compared to acceptable daily intakes (ADIs) for each of the following intense sweeteners:
Demographic differences in mean daily exposures have been mentioned in the text where they were determined to be statistically significant at the 95% confidence level, using a one-tailed Z-score test. Although respondents were selected from the screener survey as having had, in the previous 7-day period, a high consumption of certain products containing intense sweeteners per kilogram of body weight, they did not necessarily consume these products in the 7-day period measured in the diary.
4.1 Exposure to Intense Sweeteners
4.1.1 Proportion of Survey Respondents Exposed to Each Intense Sweetener
In order to estimate exposure to individual intense sweeteners, the reported consumption data from the diary was combined with information from a database on the intense sweetener contents of the products listed in the diary. Results are reported for acesulphame-K, aspartame, cyclamate, saccharin and sucralose. Due to limited product availability or absence in the marketplace, very few diary respondents were exposed to alitame, therefore reporting on this particular intense sweetener is more limited. No products were identified as containing either neotame or thaumatin, therefore no results are reported for these sweeteners. While all respondents to the diary were exposed to an intense sweetener over the 7-day diary period, the proportion of respondents exposed to particular intense sweeteners varied by country and age of respondent but not by gender. Aspartame was consumed by the highest proportion of diary respondents - with 95% of all diary respondents having been exposed to it in the 7-day period, while alitame was the least commonly consumed (6%) (see Table 17).
Consumption of Intense Sweeteners – Australia/New Zealand Page 59
Roy Morgan Research March, 2004
Those living in Australia were more likely to have been exposed to acesulphame-K and aspartame than their New Zealand counterparts (87% compared to 77% and 96% compared to 90% respectively). Conversely, New Zealand residents were significantly more likely to have consumed sucralose (51% compared to 36%). In terms of age, those aged 18-39 years were more likely than other age groups to have been exposed to acesulphame-K, while the 12-24 year age group were more likely than other ages to have been exposed to alitame. Furthermore, the (small base of) 18-24 year olds were significantly more likely than the 12-17 year olds or those aged 60 years and over to have consumed sucralose, while 25-39 year olds were more likely to have consumed cyclamate than either those aged 12-17 years or those aged 60 years and over.
Table 17: Percentage Exposed to Individual Intense Sweeteners in the Last 7 Days – Australia/New Zealand
Country % Gender % Age (years) %
Sweetener
TOTAL
%
(n=400)
AUS
(n=263)
NZ
(n=137)
Males
(n=116)
Females
(n=284)
12-17
(n=48)
a
18-24
(n=25)
b
25-39
(n=97)
c
40-59
(n=109)
d
60+
(n=121)
e
Aspartame
95
96*
90
96
95
96
100
97
96
91
Acesulphame-K
86
87*
77
88
84
78
a,e
98
a,e
91
87
80
Saccharin
72
72
70
67
75
62
79
75
70
75
Cyclamate
71
72
70
66
75
65
77
a,e
81
69
66
Sucralose
39
36
51*
37
40
29
a,e
56
38
38
40
Alitame
6
7
4
7
6
c,e
16
c,e
11
1
d
7
2
Any Intense Sweetener
100
100
100
100
100
100
100
100
100
100 Note: 1. Base: Total Diary respondents – Australia and New Zealand (n=400).
2 Unless otherwise stated, values are for Australia and New Zealand combined. 3. Significant Differences are marked with an * for demographic variables with only two sub-groups and by letters in italics for variables with multiple sub-groups. The letters represent the sub-groups which are significantly lower.
Consumption of Intense Sweeteners – Australia/New Zealand Page 60
Roy Morgan Research March, 2004
4.1.2 Mean Daily Exposures (mg/day)
As the proportion of diary respondents who consumed each individual sweetener during the survey period varied so, too, did the mean daily exposure. However, the amounts of any one intense sweetener consumed cannot be strictly compared to other intense sweeteners, as they are different chemical compounds. Different amounts of intense sweeteners are used to achieve the same level of sweetness and each sweetener has a separate ADI. Aspartame The calculated mean daily exposure to aspartame across both Australia and New Zealand was estimated at 169 mg/day for all respondents, and at 177 mg/day for actual consumers. Australian consumers had a significantly higher mean daily exposure to aspartame than their New Zealand counterparts (187 mg compared to 124 mg). Amongst Australian consumers the median daily exposure was 124 mg and the 90th and 95th percentile exposure was 408 mg and 628 mg respectively. Amongst New Zealand consumers the median daily exposure was 83 mg and the 90th and 95th percentile exposure was 296 mg and 334 mg respectively (see Table 18). The mean daily exposure to aspartame differed significantly by gender and age. Across both Australia and New Zealand, male consumers had a significantly higher mean daily exposure than females (210 mg compared to 152 mg). In terms of age, the 25-39 year age group had a significantly higher exposure than other ages (253 mg/day). Furthermore, the mean exposure amongst Australian consumers aged 12-39 years has not changed significantly since 1994 (182 mg in 1994 compared to 199 mg in 2002-03) (see Table 19).
Consumption of Intense Sweeteners – Australia/New Zealand Page 61
Roy Morgan Research March, 2004
Cyclamate Seventy one percent of diary respondents were exposed to cyclamate over the 7 day diary period. The calculated mean daily exposure to cyclamate across both Australia and New Zealand was estimated at 146 mg/day for all respondents. However, amongst actual consumers the mean daily exposure was 204 mg. Australian and New Zealand consumers did not differ significantly in their daily exposure (212 mg compared to 163 mg). Amongst Australian consumers the median daily exposure to cyclamate was 83 mg and the 90th and 95th percentile exposure was 595 mg and 732 mg respectively. Amongst New Zealand consumers the median daily exposure was 67 mg and the 90th and 95th percentile exposure was 428 mg and 639 mg respectively (see Table 18). Mean daily exposure to cyclamate did not differ significantly by gender nor by age. Furthermore, the mean exposure amongst Australian consumers aged 12-39 years has not changed significantly since 1994 (178 mg in 1994 compared to 231 mg in 2002-03) (see Table 19). Saccharin Seventy two percent of the diary respondents were exposed to saccharin over the 7-day diary period. The calculated mean daily exposure to saccharin across both Australia and New Zealand was estimated at 23 mg/day for all respondents, and at 31 mg/day for consumers. Australian consumers had a significantly higher mean daily exposure than their New Zealand counterparts (33 mg compared to 20 mg). Amongst Australian consumers the median daily exposure was 9 mg and the 90th and 95th percentile exposure was 105 mg and 168 mg respectively. Amongst New Zealand consumers the median daily exposure was 8 mg and the 90th and 95th percentile exposure was 49 mg and 107 mg respectively (see Table 18). The mean daily exposure to saccharin differed significantly by age but not by gender. Across both Australia and New Zealand, those aged 60 years and over had a significantly higher mean daily exposure than other age groups (46 mg for consumers). The mean exposure amongst Australian consumers aged 12-39 years has not changed significantly since 1994 (31 mg in 1994 compared to 25 mg in 2002-03) (see Table 19).
Consumption of Intense Sweeteners – Australia/New Zealand Page 62
2. Unless otherwise stated, values are for Australia and New Zealand combined. 3. Alitame not shown as proportion of population exposed was too low. 4. Base Sizes of diary respondents/consumers aged 12-17 years and 18-24 years are small. Refer to Table 17. 5. Significant Differences are marked with an * for demographic variables with only two sub-groups and by letters in italics for variables with multiple sub-groups. The letters represent the sub-groups which are significantly lower.
Consumption of Intense Sweeteners – Australia/New Zealand Page 63
Roy Morgan Research March, 2004
Table 19: Daily Exposure (mg/day) to Individual Intense Sweeteners - 1994 versus 2002-03 (Australians aged 12-39 years)
Total Aged 12-39 years
Sweetener 1994 2002-03
Aspartame Mean all respondents Mean consumers 90th percentile consumers
n/a 182 n/a
196 199 449
Cyclamate Mean all respondents Mean consumers 90th percentile consumers
n/a 178 n/a
171 231 653
Saccharin Mean all respondents Mean consumers 90th percentile consumers
n/a 31 n/a
17 25 60
Acesulphame-K Mean all respondents Mean consumers 90th percentile consumers
n/a 9
n/a
41
45* 78
Sucralose Mean all respondents Mean consumers 90th percentile consumers
14 41 72
Note: 1. Base: Diary respondents – Australia (n=263 in 2002-03; 128 in 1994).
2. Alitame not shown as proportion of population exposed was too low. 3. Significant Differences between 1994 and 2002-03 are marked with an * . 4. n/a = information not available from the 1994 survey. 5. Sucralose not included in the 1994 survey.
Consumption of Intense Sweeteners – Australia/New Zealand Page 64
Roy Morgan Research March, 2004
Acesulphame-K Eighty six per cent of the diary respondents were exposed to acesulphame-K during the diary period. The calculated mean daily exposure to this sweetener across both Australia and New Zealand was estimated at 31 mg for all respondents and at 35 mg amongst consumers. Australia and New Zealand consumers did not differ significantly in their daily exposure (36 mg compared to 28 mg). Amongst Australian consumers the median daily exposure was 25 mg and the 90th and 95th percentile consumption was 72 mg and 88 mg respectively. Amongst New Zealand consumers the median daily exposure was 14 mg and the 90th and 95th percentile exposure was 66 mg and 91 mg respectively (see Table 18). The mean daily exposure to acesulphame-K did not differ significantly by gender but did so by age. Across both Australia and New Zealand those aged 25-39 years had a significantly higher mean daily exposure (55 mg) than other age groups. Furthermore, the mean daily exposure to acesulphame-K amongst Australian consumers aged 12-39 years has increased significantly since 1994 (see Table 19). This is most likely a result of a substantial increase in the number of food products using acesulphame-K in 2002-03 compared to 1994, generally in combination with aspartame. Sucralose Thirty nine per cent of the diary respondents were exposed to sucralose during the diary period. The calculated mean daily exposure to sucralose across both Australia and New Zealand was estimated at 14 mg/day, and at 34 mg/day for consumers. New Zealand consumers had a significantly higher mean daily exposure than their Australian counterparts - 51 mg compared to 29 mg (see Table 18). Amongst Australian consumers the median daily exposure to sucralose was 7 mg and the 90th and 95th percentile exposure was 66 mg and 188 mg respectively. Amongst New Zealand consumers the median daily exposure was 30 mg and the 90th and 95th percentile exposure was 129 mg and 162 mg respectively (see Table 18). The mean daily exposure to sucralose differed significantly by age but not by gender. Across both Australia and New Zealand, consumers aged 18-39 years had a significantly higher mean daily exposure to sucralose (53 mg), as they also did to acesulphame-K, than other age groups.
Consumption of Intense Sweeteners – Australia/New Zealand Page 65
Roy Morgan Research March, 2004
Although it was approved for use, sucralose exposure was not assessed in the 1994 survey. At that time no products containing sucralose were consumed by the respondents and there was only a limited number of products available. Therefore, no comparisons with the present study were possible. Alitame Just six percent of the diary respondents were exposed to alitame during the diary period, in part due to the small number of products available containing alitame (some chewing gums only). The calculated mean daily exposure across both Australia and New Zealand was estimated at 0.1 mg/day for all respondents, and at 1.2 mg/day for consumers. However, this consumer mean should be interpreted with caution as it is based on a very small base size of consumers (n=36). Further demographic analysis of exposure to alitame was, therefore, not practical.
Consumption of Intense Sweeteners – Australia/New Zealand Page 66
Roy Morgan Research March, 2004
4.1.3 Daily Exposures by Body Weight (mg/kg bw/day)
The daily exposure to each of the intense sweeteners was also calculated per kilogram (kg) of body weight of the respondents, using individual self-reported body weights. It is reported in milligrams (mg) per kg of the respondent’s body weight (mg/kg bw). All the intense sweeteners measured are reported on in this context, but the reporting on alitame is limited since it was consumed by a very low proportion of respondents as previously mentioned. Once more, it should be noted that the amounts of each intense sweetener consumed per kg of bodyweight cannot be strictly compared, as they are different additives comprising different compounds. Aspartame The calculated mean daily exposure to aspartame across both Australia and New Zealand was estimated at 2.31 mg/kg bw for all respondents, and at 2.42 mg/kg bw for actual consumers. Australian consumers had a significantly higher mean daily exposure relative to bodyweight than their New Zealand counterparts (2.56 mg/kg bw compared to 1.69 mg/kg bw). Amongst Australian consumers, the median exposure per kg of bodyweight was 1.84 mg and the 90th and 95th percentile exposure was 5.30 and 7.46 mg/kg bw respectively. Amongst New Zealand consumers the median exposure per kg of bodyweight was 1.27 mg and the 90th and 95th percentile exposure was 3.93 and 5.38 mg/kg bw respectively. Mean daily exposure to aspartame per kg of bodyweight did not differ significantly by gender but did by age. Across both Australia and New Zealand, those aged 18-59 years (particularly the 25-39 year age group) had significantly higher mean daily exposures per kg than those aged 12-17 years or 60 years and over (see Table 20).
Consumption of Intense Sweeteners – Australia/New Zealand Page 67
Median - consumers 90th percentile consumers 95th percentile consumers
2.31 2.42
1.71 5.02 6.98
2.47* 2.56*
1.84 5.30 7.46
1.53 1.69
1.27 3.93 5.38
2.51 2.61
1.89 5.48 8.13
2.17 2.29
1.55 4.63 6.42
1.67 1.75
1.42 4.08 4.86
2.43a,e 2.43a,e
2.23 3.86 4.08
3.32a-e 3.40a,b,e
2.81 8.13 9.89
2.44a,e 2.55a,e
1.57 5.48 7.86
1.53 1.69
1.42 3.72 4.55
Cyclamate Mean all respondents Mean consumers
Median - consumers 90th percentile consumers 95th percentile consumers
2.09 2.93
1.23 7.80 9.32
2.21* 3.08*
1.26 8.23 9.89
1.53 2.20
1.12 7.47 8.75
2.04 3.09
1.34 8.50 9.32
2.13 2.83
1.14 7.26
10.18
2.68 4.10
2.44 8.23
10.18
1.71 2.23
1.25 4.90
10.30
2.63 3.24
1.14 9.32
11.44
1.56 2.25
1.09 5.76 8.25
1.92 2.89
1.43 7.46
11.05
Saccharin Mean all respondents Mean consumers
Median - consumers 90th percentile consumers 95th percentile consumers
0.33 0.46
0.14 1.28 2.35
0.36* 0.50*
0.14 1.53 2.54
0.19 0.27
0.14 0.77 1.18
0.30 0.44
0.16 1.28 1.66
0.35 0.47
0.12 1.18 2.51
0.23 0.37
0.13 0.87 0.87
0.19 0.24
0.11 0.88 1.01
0.29 0.39
0.12 1.18 2.27
0.31 0.44b
0.15 1.08 1.90
0.50a-c 0.67c,b
0.27 1.73 2.76
Acesulphame-K Mean all respondents Mean consumers
Median - consumers 90th percentile consumers 95th percentile consumers
0.44 0.51
0.36 0.92 1.39
0.46* 0.53
0.37 0.92 1.39
0.30 0.39
0.21 0.96 1.59
0.38 0.44
0.36 0.82 1.04
0.47 0.56
0.36 1.01 1.41
0.35 0.44
0.31 0.82 1.64
0.50d,e 0.50e
0.45 0.79 1.14
0.73d,e 0.79
0.46 1.19 1.94
0.34 0.39
0.27 0.86 1.07
0.30 0.38
0.27 0.75 1.01
Sucralose Mean all respondents Mean consumers
Median - consumers 90th percentile consumers 95th percentile consumers
0.20 0.52
0.18 1.32 2.31
0.16 0.45
0.12 0.95 2.44
0.39* 0.76*
0.40 1.68 2.31
0.18 0.47
0.18 1.04 1.71
0.22 0.55
0.18 1.42 2.44
0.13 0.43
0.28 0.92 1.68
0.54 0.96
0.22 3.87 3.87
0.28 0.73d
0.21 2.44 3.57
0.13 0.34
0.12 1.04 1.52
0.16 0.38
0.15 0.82 1.41
Note: 1. Base: Diary respondents Australia/New Zealand (n=400). 2. Unless otherwise stated, values are for Australia and New Zealand combined. 3. Alitame not shown as proportion of population exposed was too low (mean exposure: 0.016 mg/kg bw consumers). 4. Base sizes of diary respondents/consumers aged 12-17 years and 18-24 years are small. Refer to Table 17. 5. Significant Differences are marked with an * for demographic variables with only two sub-groups and by letters in italics for variables with multiple sub-groups. The letters represent the sub-groups which are significantly lower.
Consumption of Intense Sweeteners – Australia/New Zealand Page 68
Roy Morgan Research March, 2004
Cyclamate The calculated mean daily exposure to cyclamate across both Australia and New Zealand was estimated at 2.09 mg/kg bw, and at 2.93 mg/kg bw for consumers. Australian consumers had a significantly higher mean daily exposure relative to bodyweight than their New Zealand counterparts (3.08 mg/kg bw compared to 2.20 mg/kg bw). Amongst Australian consumers, the median daily exposure to cyclamate per kg of bodyweight was 1.26 mg and the 90th and 95th percentile exposure was 8.23 and 9.89 mg/kg bw respectively. Amongst New Zealand consumers the median exposure per kg of bodyweight was 1.12 mg and the 90th and 95th percentile exposure was 7.47 and 8.75 mg/kg bw respectively. Mean daily exposure to cyclamate per kg of bodyweight did not differ significantly by gender nor by age (see Table 20). Saccharin The calculated mean daily exposure to saccharin across both Australia and New Zealand was estimated at 0.33 mg/kg bw for all respondents, and at 0.46 mg/kg bw for consumers. Australian consumers had a significantly higher mean daily exposure relative to bodyweight than their New Zealand counterparts (0.50 mg/kg bw compared to 0.27 mg/kg bw). Amongst Australian consumers, the median daily exposure to saccharin per kg of bodyweight was 0.14 mg and the 90th and 95th percentile exposure was 1.53 and 2.54 mg/kg bw respectively. Amongst New Zealand consumers, the median daily exposure per kg of bodyweight was 0.14 mg and the 90th and 95th percentile exposure was 0.77 and 1.18 mg/kg bw respectively. Mean daily exposure to saccharin per kg of bodyweight did not differ significantly by gender but did slightly by age. Across both Australia and New Zealand, those aged 60 years and over had significantly higher mean daily exposures per kg, particularly compared to those aged 18-39 years (see Table 20).
Consumption of Intense Sweeteners – Australia/New Zealand Page 69
Roy Morgan Research March, 2004
Acesulphame-K The calculated mean daily exposure to acesulphame-K across both Australia and New Zealand was estimated at 0.44 mg/kg bw for all respondents, and at 0.51 mg/kg bw for consumers. Australian and New Zealand consumers did not differ statistically significantly in this regard (0.53 mg/kg bw compared to 0.39 mg/kg bw). Amongst Australian consumers, the median daily exposure to acesulphame-K per kg of bodyweight was 0.37 mg and the 90th and 95th percentile exposure was 0.92 and 1.39 mg/kg bw respectively. Amongst New Zealand consumers the median daily exposure per kg of bodyweight was 0.21 mg and the 90th and 95th percentile exposure was 0.96 and 1.59 mg/kg bw respectively. Mean daily exposure per kg of bodyweight to acesulphame-K did not differ significantly amongst consumers by gender nor by age. However, amongst all respondents the mean daily exposure per kg of bodyweight was significantly higher for the 18-39 year olds compared to those aged 40 years and over (see Table 20). Sucralose The calculated mean daily exposure to sucralose across both Australia and New Zealand was estimated at 0.20 mg/kg bw for all respondents, and at 0.52 mg/kg bw for consumers. New Zealand consumers had a significantly higher mean daily exposure relative to bodyweight than their Australian counterparts (0.76 mg/kg bw compared to 0.45 mg/kg bw). Amongst Australian consumers, the median daily exposure per kg of bodyweight was 0.12 mg and the 90th and 95th percentile exposure was 0.95 and 2.44 mg/kg bw respectively. Amongst New Zealand consumers the median daily exposure per kg of bodyweight was 0.40 mg and the 90th and 95th percentile exposure was 1.68 and 2.31 mg/kg bw respectively. Mean daily exposure per kg of bodyweight to sucralose did not differ significantly by gender nor by age (see Table 20).
Alitame The calculated mean daily exposure to alitame across both Australia and New Zealand was estimated at 0.0015 mg/kg bw for all respondents, and at 0.016 mg/kg bw for the small base of consumers. This consumer mean for alitame should, once again, be interpreted with caution due to the small base size of its consumers.
Consumption of Intense Sweeteners – Australia/New Zealand Page 70
Roy Morgan Research March, 2004
4.2 Contribution of Each Food Group to Intense Sweetener Exposures
The main food group contributing to the intense sweetener exposure varied with each sweetener type. This applied in both Australia and New Zealand (see Tables 21-22). Carbonated soft drinks contributed 66% and 70% towards the total aspartame exposure in Australia and New Zealand respectively. Likewise, these types of drinks contributed 52% and 71% towards acesulphame-K exposure in Australia and New Zealand respectively. These two intense sweeteners are commonly used in combination in foods to achieve the desired flavour profile. On the other hand, cordials/fruit drinks contributed the most towards exposure to cyclamate (51% in Australia and 34% in New Zealand), and tabletop sweeteners the most towards exposure to saccharin (49% in Australia and 36% in New Zealand). As acesulphame-K is more commonly used in yoghurts in Australia than in New Zealand, it is not surprising, therefore, that this particular product group contributed towards 22% of acesulphame-K exposure in Australia, compared to only one per cent of exposure in New Zealand. Furthermore, in Australia carbonated soft drinks contributed towards the majority of exposure to sucralose (59% compared to only 27% in New Zealand), whereas in New Zealand flavoured yoghurt/mousse contributed to 49% of all exposure to sucralose, but only 13% in Australia. In New Zealand tabletop sweeteners were a significant source of cyclamate exposure in this study, however this will change due to removal of permission to use cyclamate in these products from 20 December 2002. Chewing gums were the only source of exposure to alitame in this survey.
Consumption of Intense Sweeteners – Australia/New Zealand Page 71
Roy Morgan Research March, 2004
Table 21: Percentage Contribution of Product Groups to Intense Sweetener Exposure - Australia
Other Condiments (incl. Jam) <0.5 <0.5 <0.5 1 2 Sports, Energy and Weight Management Products
5 1 - - 2
Confectioneries 10 7 - - 4
Flavoured yoghurts/mousses 1 1 - - 49
Jellies/Milk based puddings 1 1 11 8 <0.5
Other Desserts/Breakfasts <0.5 <0.5 6 5 1 Chocolate/Cocoa/Cappuccino drink bases
- 6 - - -
Flavoured milks 2 1 - - -
Sweet Biscuits 1 1 - - -
TOTAL 100 100 100 100 100 Note: 1. Base: Total diary respondents – New Zealand (n=137).
2. Alitame not shown as proportion of population exposed was too low.
Consumption of Intense Sweeteners – Australia/New Zealand Page 73
Roy Morgan Research March, 2004
4.3 Comparison of Intense Sweetener Exposure with Acceptable Daily Intake
As shown previously, estimated exposures to individual intense sweeteners were expressed as exposures per kg of bodyweight. Exposures were then compared to the Acceptable Daily Intake (ADI) for each sweetener. These were calculated on an individual person basis, from which means and other statistics were derived. Mean Daily Exposures - All Diary Respondents Overall, the mean daily exposure to individual intense sweeteners for all diary respondents were well below the ADI for each sweetener (cyclamate, 19% ADI; saccharin, 7% ADI; aspartame, 6% of ADI; acesulphame-K, 3% ADI; sucralose, 1% ADI; and alitame, 0.1% ADI). A similar finding was evident in both Australia and New Zealand, with the percentages being only slightly higher in Australia, with the exception of sucralose (see Tables 23 –25). The exposure as percentage of the ADI was notably higher for cyclamate (in both countries) than for any of the other intense sweeteners, and the mean daily exposure as a percentage of the ADI was highest for the small base of those aged 12-17 years (25% across both countries; 26% in Australia and 18% in New Zealand). Mean Daily Exposures - Consumers For consumers of each intense sweetener in the diary survey, exposure remained low compared to the ADIs (cyclamate, 27% ADI; saccharin, 9% ADI; aspartame 6% ADI; acesulphame-K, 3% ADI; sucralose, 3% ADI). Again a similar finding was evident in both Australia and New Zealand, with the percentages being slightly higher in Australia, with the exception of sucralose (see Tables 23-26). The exposure to alitame relative to its ADI amongst its small base of consumers was just 2%, across both countries. This finding, however, should be interpreted with caution due to the small base of consumers.
Consumption of Intense Sweeteners – Australia/New Zealand Page 74
Roy Morgan Research March, 2004
The daily exposure to cyclamate (in both countries) as a percentage of ADI was again notably higher than for any of the other sweeteners. The daily exposure to cyclamate as a percentage of the ADI was highest for the small base of consumers aged 12-17 years (37% across both countries; 42% in Australia). The 90th and 95th percentile exposure gives an indication of the upper end of the ranges of exposures for consumers. Reported consumer exposures at the 95th percentile in the diary survey, across both countries, for those consumers aged 25-39 years were in excess of the ADI for cyclamate (104%). In Australia, the 25-39 year olds and the small base of 12-17 year old consumers exceeded the cyclamate ADI at the 95th percentile (151% and 245% respectively), while in New Zealand the small base of 25-39 year olds and those aged 60 years and over also exceeded the cyclamate ADI - 104% and 112% respectively (see Tables 23-26). The percentage of the ADI for Australians consumers aged 12-39 years has increased slightly (but not significantly) for cyclamate and acesulphame-K since the 1994 survey. However, the upper ranges of exposures for consumers (at the 90th percentile level) has decreased for aspartame, saccharin and cyclamate (see Table 25).
Consumption of Intense Sweeteners – Australia/New Zealand Page 75
Roy Morgan Research March, 2004
Table 23: Exposure to Sweeteners as a Percentage of Acceptable Daily Intake – Australia/New Zealand
% ADI Demographics
Acesulphame-K Aspartame Cyclamate Saccharin Sucralose Male Mean all respondents (n=116) Mean consumers
16 Note: 1.Base: Total diary respondents – Australia (n=263).
2. Alitame not shown as proportion of population exposed was too low. 3. ADIs provided in Table 2.
Consumption of Intense Sweeteners – Australia/New Zealand Page 77
Roy Morgan Research March, 2004
Table 25: Exposure to Intense Sweeteners as a Percentage of Acceptable Daily Intake 1994 versus 2002-03 (Australians aged 12-39 years)
Total Aged 12-39 years
Sweetener 1994
% ADI
2002-03
% ADI
Aspartame Mean all respondents Mean consumers 90th percentile consumers
6 7
23
7 7
15
Cyclamate Mean all respondents Mean consumers 90th percentile consumers
8
23 107
24 33 84
Saccharin Mean all respondents Mean consumers 90th percentile consumers
3 9
56
6 8
18
Acesulphame-K Mean all respondents Mean consumers 90th percentile consumers
<0.5
1 3
4 5 7
Sucralose Mean all respondents Mean consumers 90th percentile consumers
1 4
16
Note: 1. Diary respondents aged 12-39 - Australia (n=109 in 2002-03; 128 in 1994).
2. ADIs provided in Table 2. 3. Alitame not shown as proportion of population exposed was too low. 4. Sucralose not included in the 1994 survey. 5. 95th percentile exposure was not estimated in the 1994 survey.
Consumption of Intense Sweeteners – Australia/New Zealand Page 78
Roy Morgan Research March, 2004
Table 26: Exposure to Intense Sweeteners as a Percentage of Acceptable Daily Intake – New Zealand
% ADI Demographics
Acesulphame-K Aspartame Cyclamate Saccharin Sucralose Male Mean all respondents (n=42) Mean consumers
Note: 1. Base: Total diary respondents – New Zealand (n=137).
2. Alitame not shown as proportion of population exposed was too low. 3. ADIs provided in Table 2.
Consumption of Intense Sweeteners – Australia/New Zealand Page 79
Roy Morgan Research March, 2004
4.4 Summary of Diary Survey Findings
It was evident from the diary survey that estimated mean exposure levels to all sweeteners (amongst those respondents identified from the screener survey as apparent high consumers of products containing intense sweeteners) were well below the ADI for each sweetener. This was evident in both Australia and New Zealand. The mean daily exposure to acesulphame-K amongst Australian consumers aged 12-39 years, however, has increased significantly since 1994. This is likely to be a result of more widespread use of acesulphame-K in food products. Despite aspartame being the most widely consumed intense sweetener, it was cyclamate that had the highest percentage of the ADI of all the intense sweeteners measured. Further to this, there were some consumers in the diary survey who appeared to be exceeding the ADI for cyclamate at the 95th percentile exposure level. The products which contributed most to cyclamate exposure were cordials/fruit drinks, carbonated soft drinks (plus tabletop sweeteners in New Zealand). It is worth noting that tabletop sweeteners containing cyclamate were permitted in New Zealand, but not Australia, until the Code became enforceable in both countries on 20 December 2002. Under stock-in-trade provisions these products could still be available for sale during 2003. Therefore, at the time of the survey, such cyclamate-containing products could still have been available to survey respondents. These products will not be available for sale in the near future. Similarly, at the time of the survey, consumers were still able to purchase cordials and soft drinks containing higher levels of saccharin and cyclamate than are now permitted under the joint Code for products manufactured after 20 December 2002.
Consumption of Intense Sweeteners – Australia/New Zealand Page 80
Roy Morgan Research March, 2004
5. KEY FINDINGS - DIARY SURVEY OF PEOPLE WITH DIABETES OR IMPAIRED GLUCOSE TOLERANCE
For the analysis in this section of the report, the diary data from the respondents with diabetes or impaired glucose tolerance who were recruited from the screener survey of the general population was combined with diary data from the separate sample of diabetics recruited from various other sources. This merging of data helped form an overall diabetics/impaired glucose tolerance group. It should be noted however, as previously mentioned in the methodology section of this report, that this overall combined sample of people with diabetes/impaired glucose tolerance was only a purposive sample and therefore not representative in nature. In this section of the report, these diabetic/impaired glucose tolerance diary respondents are analysed by country (Australia and New Zealand). However, in parts, this group is also compared with those respondents from the main diary survey who had neither of these two medical conditions. Differences between the above groups in their mean daily exposures have been mentioned in the text where they were determined to be statistically significant at the 95% confidence level, using a one-tailed Z-score test.
5.1 Exposure to Intense Sweeteners
5.1.1 Proportion of Respondents Exposed to Intense Sweeteners
While all respondents to the diary, in this context, were exposed to an intense sweetener over the 7 day-period of the diary, the exposure to each of the intense sweeteners reflects closely that already reported for the main diary survey. However, the proportion of respondents exposed to sucralose, saccharin and cyclamate was slightly higher among those with diabetes or impaired glucose tolerance. Aspartame was again the most widely consumed intense sweetener with 94% of all diabetic/impaired glucose tolerance diary respondents having been exposed to it during the 7-day diary period. Alitame, once again, had the least proportion of consumers (3%) due to the small number of products on the market containing it (see Table 27). Likewise, neotame and thaumatin were not identified in many products on the market, therefore, no exposure was recorded for these sweeteners.
Consumption of Intense Sweeteners – Australia/New Zealand Page 81
Roy Morgan Research March, 2004
Diabetics or those with impaired glucose tolerance living in Australia were significantly more likely to have been exposed to acesulphame-K and aspartame than their New Zealand counterparts (90% compared to 69% and 96% compared to 88% respectively). Conversely, the New Zealanders were slightly more likely to have consumed sucralose but the difference was not significant - 65% compared to 56% (see Table 27). The exposure to intense sweeteners did not differ significantly by gender.
Table 27: Consumption of Intense Sweeteners in the Last 7 Days – Total Diabetics/those with Impaired Glucose Tolerance
Consumption of Intense Sweeteners – Australia/New Zealand Page 82
Roy Morgan Research March, 2004
5.1.2 Mean Daily Exposures (mg/day)
While the proportion of the survey respondents exposed to individual intense sweeteners varied so, too, did the mean daily exposure to each sweetener. However, once again, the amounts of intense sweetener consumed cannot be directly compared as different amounts of intense sweeteners are used to achieve the same level of sweetness. Aspartame Ninety four percent of diabetic/impaired glucose tolerance diary respondents consumed foods containing aspartame. The calculated mean daily exposure to aspartame across both Australia and New Zealand, amongst this sample, was estimated at 177 mg/day for all respondents, and at 189 mg/day for consumers. These Australian consumers had a significantly higher mean daily exposure than their New Zealand counterparts - 204 mg compared to 138 mg (see Table 28). In both countries, these estimated consumer means did not differ significantly from those evident amongst the consumers from the main diary survey who had neither of the two medical conditions (see Table 28). Amongst Australian consumers, with either medical condition, the median daily exposure was 130 mg and the 90th and 95th percentile exposure was 464 mg and 635 mg respectively. Amongst New Zealand consumers, with either medical condition, the median daily exposure was 75 mg and the 90th and 95th percentile exposure was 312 mg and 578 mg respectively. Cyclamate Seventy seven percent of diabetic/impaired glucose tolerant diary respondents consumed foods containing cyclamate. The calculated mean daily exposure to cyclamate across both Australia and New Zealand, amongst this sample, was estimated at 210 mg/day for all respondents and at 274 mg/day for consumers. Australian consumers had a significantly higher mean daily exposure than their New Zealand counterparts - 306 mg compared to 165 mg (see Table 28). In both countries, these estimated consumer mean exposures did not differ significantly from those evident amongst consumers from the main diary survey who had neither of the two medical conditions (see Table 28).
Consumption of Intense Sweeteners – Australia/New Zealand Page 83
Roy Morgan Research March, 2004
Amongst Australian consumers with either medical condition, the median daily exposure was 154 mg and the 90th and 95th percentile exposure was 754 mg and 894 mg respectively. Amongst New Zealand consumers the median daily exposure was 108 mg and the 90th and 95th percentile exposure was 301 mg and 639 mg respectively. Saccharin Seventy per cent of this sample of diary respondents were exposed to saccharin during the diary period. The calculated mean daily exposure to saccharin across both Australia and New Zealand was estimated at 34 mg/day for all respondents and at 41 mg/day for consumers. Australian consumers had a significantly higher mean daily exposure than their New Zealand counterparts - 47 mg compared to 21 mg (see Table 28). In both countries, these estimated consumer mean exposures did not differ significantly from those evident amongst the main diary consumers who had neither of the two medical conditions (see Table 28). Amongst Australian consumers, with either medical condition, the median daily exposure was 13 mg and the 90th and 95th percentile exposure was 125 mg and 180 mg respectively. Amongst New Zealand consumers, with either medical condition, the median daily exposure was 15 mg and the 90th and 95th percentile exposure was 43 mg and 65 mg respectively (see Table 28). Acesulphame-K Eighty five per cent of this sample of diary respondents were exposed to acesulphame-K during the diary period. The calculated mean daily exposure to acesulphame-K across both Australia and New Zealand was estimated at 38 mg/day for all respondents and at 44 mg/day for consumers. These Australian and New Zealand consumers did not differ significantly in their mean daily exposure (45 mg compared to 39 mg respectively, see Table 28). Again in both countries, these estimated consumer mean exposures did not differ significantly from those evident amongst the main diary consumers who had neither of the two medical conditions (see Table 28). Amongst Australian consumers, with either medical condition, the median daily exposure was 27 mg and the 90th and 95th percentile exposure was 89 mg and 139 mg respectively. Amongst New Zealand consumers, with either medical condition, the median daily consumption was 18 mg and the 90th and 95th percentile consumption was 66 mg and 220 mg respectively.
Consumption of Intense Sweeteners – Australia/New Zealand Page 84
Roy Morgan Research March, 2004
Table 28: Daily Exposure (mg/day) for Consumers of Intense Sweeteners - Total Diabetics/those with Impaired Glucose Tolerance
TOTAL Australia New Zealand
Sweetener (mg) Diabetic/ Impaired Glucose
Tolerance
Neither
Diabetic/ Impaired Glucose
Tolerance
Neither
Diabetic/ Impaired Glucose
Tolerance
Neither
Aspartame Mean all respondents Mean Consumers
Median - consumers 90th percentile consumers 95th percentile consumers
177 189
109 455 590
179 187
125 383 628
1961 2041
130 464 635
191 199
131 414 628
122 138
75 312 578
113 121
91 295 334
Cyclamate Mean all respondents Mean consumers
Median - consumers 90th percentile consumers 95th percentile consumers
210 274
141 704 874
160 219
87 612 732
2431, 2 3061
154 754 894
168 231
90 638 743
114 165
108 301 639
112 153
65 428 562
Saccharin Mean all respondents Mean consumers
Median - consumers 90th percentile consumers 95th percentile consumers
34 41
14 110 142
25 34
9
108 171
401, 2 471
13 125 180
27 37
11 120 178
16 21
15 43 65
14 18
8
49 104
Acesulphame-K Mean all respondents Mean consumers
Median - consumers 90th percentile consumers 95th percentile consumers
38 44
25 79 141
32 36
24 72 83
411 45
27 89 139
33 37
29 72 83
28 39
18 66 220
23 28
14 67 105
Sucralose Mean all respondents Mean consumers
Median - consumers 90th percentile consumers 95th percentile consumers
2. Alitame not shown as proportion of population exposed was too low. 3. Significant Differences between countries are marked with a 1 and between groups by a 2.
Consumption of Intense Sweeteners – Australia/New Zealand Page 85
Roy Morgan Research March, 2004
Sucralose Fifty eight per cent of this sample of diary respondents were exposed to sucralose during the diary period. The calculated mean daily exposure to sucralose across both Australia and New Zealand was estimated at 20 mg/day for all respondents and at 34 mg/day for consumers. These Australian and New Zealand consumers did not differ significantly in their mean daily exposure - 31 mg compared to 39 mg respectively (see Table 28). In both countries, these estimated consumer mean exposures did not differ significantly from those evident amongst the main diary consumers who had neither of the two medical conditions. Amongst Australian consumers, with either medical condition, the median daily exposure was 13 mg and the 90th and 95th percentile exposure was 81 mg and 118 mg respectively. Amongst New Zealand consumers, with either medical condition, the median daily exposure was 15 mg and the 90th and 95th percentile exposure was 90 mg and 166 mg respectively (see Table 28). Alitame Just three percent of this sample of diary respondents were exposed to alitame during the diary period. The actual amounts consumed were extremely small due to the small number of products available containing alitame. The calculated mean daily exposure to alitame across both Australia and New Zealand was estimated at 0.1 mg/day for all respondents and at 2 mg/day for the small base of actual consumers (n=12). However, this consumer mean should be interpreted with caution as it is calculated on such a small base size of consumers. Further demographic analysis of exposure to alitame was, therefore, not practical.
Consumption of Intense Sweeteners – Australia/New Zealand Page 86
Roy Morgan Research March, 2004
5.1.3 Daily Exposures by Body Weight (mg/kg bw/day)
The mean daily exposure to each of the intense sweeteners amongst this sample of diabetics/those with impaired glucose tolerance was also calculated per kg of body weight of these respondents, using individual self-reported bodyweight as done in the previous section for the main diary respondents. Once again, it is reported in milligrams (mg) per kilogram of the respondent’s body weight (mg/kg bw). All the intense sweeteners measured are reported on in this context, but the reporting on alitame is once again limited since it was consumed by a very low proportion of respondents. Once more, it should be noted that the amounts of each intense sweetener consumed per kg of bodyweight cannot be strictly compared, as they are different compounds. Therefore, different amounts of intense sweeteners are used to achieve the same level of sweetness. Aspartame The calculated mean daily exposure to aspartame across both Australia and New Zealand was estimated at 2.17 mg/kg bw for all respondents, and at 2.31 mg/kg bw for consumers. These Australian consumers had a significantly higher mean daily exposure relative to bodyweight than their New Zealand counterparts - 2.52 mg/kg bw compared to 1.66 mg/kg bw (see Table 29). This follows a similar pattern to that reported for the main diary respondents. In either country, the estimated consumer mean exposures did not differ significantly from those evident amongst consumers from the main diary who had neither of the two medical conditions (see Table 29). Amongst Australian consumers, with either medical condition, the median daily exposure per kg of bodyweight was 1.75 mg and the 90th and 95th percentile exposure was 5.48 mg and 7.86 mg respectively. Amongst New Zealand consumers, with either medical condition, the median daily exposure per kg of bodyweight was 0.93 mg and the 90th and 95th percentile exposure was 4.51 mg and 6.68 mg respectively.
Consumption of Intense Sweeteners – Australia/New Zealand Page 87
Roy Morgan Research March, 2004
Table 29: Exposure (mg/kg bw) for Consumers of Intense Sweeteners - Total Diabetics/those with Impaired Glucose Tolerance
TOTAL Australia New Zealand
Sweetener (mg/kg bw) Diabetic/ Impaired Glucose
Tolerance
Neither
Diabetic/ Impaired Glucose
Tolerance
Neither
Diabetic/ Impaired Glucose
Tolerance
Neither
Aspartame Mean all respondents Mean consumers
Median - consumers 90th percentile consumers 95th percentile consumers
2.17 2.31
1.49 5.32 7.47
2.48 2.60
1.86 5.02 6.72
2.411 2.521
1.75 5.48 7.86
2.64 2.76
2.01 5.15 9.24
1.46 1.66
0.93 4.51 6.68
1.57 1.68
1.28 3.64 4.03
Cyclamate Mean all respondents Mean consumers
Median - consumers 90th percentile consumers 95th percentile consumers
2.51 3.26
1.77 8.76
11.62
2.35 3.23
1.26 8.25
10.30
2.871 3.621
1.86 9.22
11.94
2.49 3.42
1.32 8.50
10.30
1.42 2.05
1.31 3.48 8.75
1.62 2.22
1.10 7.47 8.55
Saccharin Mean all respondents Mean consumers
Median - consumers 90th percentile consumers 95th percentile consumers
0.43 0.53
0.17 1.29 1.89
0.37 0.51
0.16 1.59 2.54
0.501 0.611
0.17 1.41 2.47
0.40 0.55
0.17 1.63 2.54
0.20 0.27
0.16 0.52 0.90
0.20 0.26
0.12 0.77 1.18
Acesulphame-K Mean all respondents Mean consumers
Median - consumers 90th percentile consumers 95th percentile consumers
0.46 0.55
0.33 1.03 1.95
0.46 0.52
0.84 0.88 1.39
0.511 0.56
0.34 1.06 1.95
0.48 0.54
0.39 0.88 1.19
0.33 0.47
0.23 0.86 1.82
0.33 0.40
0.22 1.03 1.62
Sucralose Mean all respondents Mean consumers
Median - consumers 90th percentile consumers 95th percentile consumers
2. Alitame not shown as proportion of population exposed was too low. 3. Significant Differences between countries are marked with a 1.
Consumption of Intense Sweeteners – Australia/New Zealand Page 88
Roy Morgan Research March, 2004
Cyclamate The calculated mean daily exposure to cyclamate across both Australia and New Zealand was estimated at 2.51 mg/kg bw for all respondents, and at 3.26 mg/kg bw for consumers. Australian consumers had a significantly higher mean daily exposure relative to bodyweight than their New Zealand counterparts - 3.62 mg/kg bw compared to 2.05 mg/kg bw (see Table 29). In both countries, the estimated consumer mean exposures did not differ significantly from those evident amongst consumers from the main diary survey who had neither of the two medical conditions (see Table 29). Amongst Australian consumers, with either medical condition, the median daily exposure per kg of bodyweight was 1.86 mg and the 90th and 95th percentile exposure was 9.22 mg and 11.94 mg respectively. Amongst New Zealand consumers, with either medical condition, the median daily exposure per kg of bodyweight was 1.31 mg and the 90th and 95th percentile exposure was 3.48 mg and 8.75 mg respectively. Saccharin The calculated mean daily exposure to saccharin across both Australia and New Zealand was estimated at 0.43 mg/kg bw for all respondents, and at 0.53 mg/kg bw for consumers. Australian consumers had a significantly higher mean daily exposure relative to bodyweight than their New Zealand counterparts - 0.61 mg/kg bw compared to 0.27 mg/kg bw (see Table 29). In both countries, these estimated consumer mean exposures did not differ significantly from those evident amongst consumers from the main diary survey who had neither of the two medical conditions (see Table 29). Amongst Australian consumers, with either medical condition, the median daily exposure per kg of bodyweight was 0.17 mg and the 90th and 95th percentile exposure was 1.41 mg and 2.47 mg respectively. Amongst New Zealand consumers, with either medical condition, the median daily exposure per kg of bodyweight was 0.16 mg and the 90th and 95th percentile exposure was 0.52 mg and 0.90 mg respectively.
Consumption of Intense Sweeteners – Australia/New Zealand Page 89
Roy Morgan Research March, 2004
Acesulphame-K The calculated mean daily exposure to acesulphame-K across both Australia and New Zealand was quite similar to saccharin and was estimated at 0.46 mg/kg bw for all respondents, and at 0.55 mg/kg bw for consumers. These Australian and New Zealand consumers did not differ significantly in this regard - 0.56 mg/kg bw compared to 0.47 mg/kg bw respectively (see Table 29). Furthermore, in both countries, the estimated consumer mean exposures again did not differ significantly from those evident amongst the consumers from the main diary survey who had neither of the two medical conditions (see Table 29). Amongst Australian consumers, with either medical condition, the median daily exposure per kg of bodyweight was 0.34 mg and the 90th and 95th percentile exposure was 1.06 mg and 1.95 mg respectively. Amongst New Zealand consumers, with either medical condition, the median daily exposure per kg of bodyweight was 0.23 mg and the 90th and 95th percentile exposure was 0.86 mg and 1.82 mg respectively. Sucralose The calculated mean daily exposure to sucralose across both Australia and New Zealand was estimated at 0.26 mg/kg bw for all respondents, and at 0.46 mg/kg bw for consumers. Australian and New Zealand consumers did not differ significantly in this regard - 0.42 mg/kg bw compared to 0.54 mg/kg bw respectively (see Table 29). In both countries, the estimated consumer mean exposures did not differ significantly from those evident amongst consumers from the main diary survey who had neither of the two medical conditions (see Table 29). Amongst Australian consumers, with either medical condition, the median daily exposure per kg of bodyweight was 0.17 mg and the 90th and 95th percentile exposure was 0.86 mg and 1.50 mg respectively. Amongst New Zealand consumers, with either medical condition, the median daily exposure per kg of bodyweight was 0.21 mg and the 90th and 95th percentile exposure was 1.41 mg and 2.31 mg respectively. Alitame The calculated mean daily exposure to alitame across both Australia and New Zealand was estimated at 0.0012 mg/kg bw for all respondents, and at 0.023 mg/kg bw for consumers. This consumer mean for alitame should once again be interpreted with caution due to the small base size of its consumers.
Consumption of Intense Sweeteners – Australia/New Zealand Page 90
Roy Morgan Research March, 2004
5.2 Contribution of Each Product Group to Intense Sweetener Exposures
The main food group contributing to intense sweetener exposure varied with each intense sweetener and reflects very closely that previously reported for the respondents from the main diary survey. Carbonated soft drinks, predominantly contributed towards the total exposure to aspartame (65%) and acesulphame-K (64%). Cordials/fruit drinks contributed almost a half (45%) of all exposure to cyclamate, as did tabletop sweeteners (49%) towards exposure to saccharin. On the other hand, no single product group contributed as significantly towards exposure to sucralose. This was divided over a number of products, but mainly carbonated soft drinks (27%), cordials/fruit drinks (25%), flavoured yoghurts/mousses (21%) and tabletop sweeteners (17%).
Table 30: Percentage Contribution of Product Groups to Intense Sweetener Exposure – Total Diabetics/those with Impaired Glucose Tolerance
% contribution to sweetener exposure Product Group
Other Condiments (incl. Jam) 1 1 <0.5 1 4 Sports, Energy and weight management products
3 <0.5 - - 1
Confectioneries 3 5 - - 3
Flavoured yoghurts/mousses 4 7 - - 21
Jellies/Milk based puddings 1 1 16 5 <0.5
Other desserts/Breakfasts 2 <0.5 4 2 2 Chocolate/Cocoa/Cappuccino drink bases
2 <0.5 - - -
Flavoured milk 2 3 - - -
Sweet biscuits <0.5 <0.5 - - -
TOTAL 100 100 100 100 100 Note: 1. Base: Total Diabetic/Impaired Glucose Tolerance diary respondents – AUS/NZ (n=298).
2. Alitame not shown as proportion of population exposed was too low.
Consumption of Intense Sweeteners – Australia/New Zealand Page 91
Roy Morgan Research March, 2004
5.3 Comparison of Intense Sweetener Exposure with Acceptable Daily Intake
As reported earlier, estimated exposures to individual intense sweeteners were expressed as exposures per kg of bodyweight. Exposures were then compared to the ADI for each sweetener. The percentage of ADI measure is the only means of directly comparing exposure between sweeteners. Daily Exposures - All Diary Respondents Overall, the mean daily exposure to each individual sweetener for all diary respondents with either diabetes or impaired glucose tolerance was well below the ADI for each sweetener (cyclamate 23% ADI; saccharin 9% ADI; aspartame 6% ADI; acesulphame-K, 3% ADI; sucralose 2%; and alitame 0.1% ADI). The proportions of ADIs for each sweetener are almost identical to those reported for the main diary survey respondents. The proportion of the ADI was notably higher, again, for cyclamate than for any of the other sweeteners. Daily Exposures - Consumers Amongst consumers, with either medical condition, the exposure to intense sweetener remained low compared to the ADIs (cyclamate 30% ADI; saccharin 11% ADI; aspartame 6% ADI; acesulphame-K, 4% ADI; and sucralose 3%). The exposure to alitame compared to its ADI amongst its small number of consumers across both countries was just 2%. This finding, however, should be interpreted with caution because of the small base of its consumers. Again, all these findings are very similar to those from the main diary survey and the exposure as a per cent of ADI remains notably higher for cyclamate. The 90th and 95th percentile exposure gives an indication of the upper end of the ranges of exposures for consumers. Reported consumer exposures at the 95th percentile were in excess of the ADI for cyclamate (106%), particularly for those in Australia (109%) and for females across both countries (106%) (see Table 31).
Consumption of Intense Sweeteners – Australia/New Zealand Page 92
Roy Morgan Research March, 2004
Table 31: Exposure to intense Sweeteners as a Percentage of Acceptable Daily Intake (ADI) – Total Diabetics/those with Impaired Glucose Tolerance
2. Alitame not shown as proportion of population exposed was too low. 3. ADIs provided in Table 2.
Consumption of Intense Sweeteners – Australia/New Zealand Page 93
Roy Morgan Research March, 2004
5.4 Summary of Diary Findings – People with Diabetes/Impaired Glucose Tolerance
It was evident, from the diary survey amongst those with diabetes or impaired glucose tolerance, that the mean exposure levels to all intense sweeteners were well below the ADI for each sweetener. Cyclamate had the highest percentage of the ADI of all the intense sweeteners measured amongst this sample of diabetics/those with impaired glucose tolerance. Further to this, there were some consumers who exceeded the ADI for cyclamate at the 95th percentile exposure level. The products which contributed most to cyclamate exposure were cordials/fruit drinks and carbonated soft drinks. The mean daily exposures for the diabetics and those with impaired glucose tolerance living in Australia was significantly higher than for their counterparts living in New Zealand, particularly for aspartame, cyclamate and saccharin. Estimated mean exposures of those consumers of intense sweeteners with diabetes/impaired glucose tolerance, whether measured per day or by body weight per day, did not differ significantly from those evident amongst consumers from the main diary survey who suffered neither of these conditions. This finding also applied when Australians and New Zealanders were considered separately.
Consumption of Intense Sweeteners – Australia/New Zealand Page 94
Roy Morgan Research March, 2004
6. CONCLUSIONS AND RECOMMENDATIONS Despite the increased consumption of foods containing intense sweeteners since an earlier survey in Australia in 1994, the majority of Australians and New Zealanders consume these foods in amounts that present no appreciable safety risk. However, there was a small proportion of the population in both countries whose exposure to the sweetener cyclamate was above desirable levels. This study has demonstrated the merits of ongoing monitoring of the consumption of food additives that have been identified elsewhere as a potential public health and safety concern and has provided an important evidence base against which FSANZ can consider any necessary further action. In light of the high exposures to cyclamate found in this study, it is recommended that the survey be repeated in the future so that the effectiveness of the Food Standards Code in moderating cyclamate exposure can be evaluated.
Consumption of Intense Sweeteners – Australia/New Zealand Page 95
Roy Morgan Research March, 2004
LIST OF REFERENCES Australian Bureau of Statistics (ABS). 2003. Labour Force Survey, 6291.0.40.001,
February 2003, Canberra, Australian Bureau of Statistics (ABS). 2001. Population by Age and Sex, 3235.0.55.001,
2001, Canberra
Australian Institute of Health and Welfare(AIHW). 2001, National Diabetes Register Statistical Profile 2000, AIHW, Canberra.
Food Standards Australia New Zealand (FSANZ). 2002, The Australia New Zealand Food Standards Code, Anstat, Melbourne.
Food Standards Australia New Zealand (FSANZ). 2001, The ANZFA Evaluation Strategy 2001 –2003, FSANZ, Canberra.
Food Standards Australia New Zealand (FSANZ). 2002. Food Standards Code Volume 2. Amendment 62. Canberra: Commonwealth of Australia.
McLennan W, Podger A. 1999. National Nutrition Survey. Foods Eaten Australia 1995.
Canberra: Australian Bureau of Statistics.
National Food Authority (NFA).1995, Survey of Intense Sweetener Consumption in Australia- Final Report prepared in cooperation with Roy Morgan Research Centre, FSANZ, Canberra
Simmons D, Harry T, Gatland B. 1999. Prevalence of known diabetes in different ethnic groups in inner urban South Auckland. NZ Med J, vol. 112, pp 316-319
Statistics New Zealand. 2003. NZ Household Labour Force Survey, February 2003.
Zimmet P. 2002. Diabetes Mellitus – one of Australia’s top six health priorities. [Online] 2002. Available from:http://www.healthinsite.gov.au. Accessed May 14, 2003.
Consumption of Intense Sweeteners – Australia/New Zealand Page 96
Roy Morgan Research March, 2004
APPENDICES
Consumption of Intense Sweeteners – Australia/New Zealand Page 97
Roy Morgan Research March, 2004
Consumption of Intense Sweeteners – Australia/New Zealand Page 98
Roy Morgan Research March, 2004
Appendix 1: Screener Questionnaire ROY MORGAN RESEARCH STRICTLY CONFIDENTIAL CATI Department, 411 Collins Street, Melbourne, Vic., 3000 CM2706 Tel: (03) 9629-6888 JULY 2002 CONSUMPTION OF INTENSE SWEETENERS ________________________________________________________________________________ +------------------------------------+ | IF MORE THAN ONE PERSON AGED 12 OR | Good %A. My name is (SAY NAME) | | OVER, ASK: | from Roy Morgan Research, the | | | people who conduct the Morgan | | Q1B. Could you please tell me the | Gallup Poll. Today we are | | first name, initials or nickname of | conducting a survey on behalf of | | the person in the household aged 12 or | Food Standards Australia New | | over whose BIRTHDAY IS NEXT? | Zealand. We are interested in | | RECORD FIRST NAME. | talking to people about what they | | | eat and drink. | | |_|_|_|_|_|_|_|_|_+ | IF NECESSARY, SAY: Food Standards | | | Australia New Zealand is a | | Q1C. And could you tell me whether or | %478,/Commonwealth// Government | | not that person is aged under 16? | agency responsible for developing | | | food standards. The survey aims to | | AGED UNDER 16.... 1 | find out the patterns of | | | consumption of some food and drink | | AGED 16 OR OVER.. 2 | products. Information gained from | | | the survey will help Food | | CAN'T SAY........ 3 | Standards Australia New Zealand to | | | review current food standards and | | IF CAN'T SAY WHETHER OR NOT PERSON | to assess applications from | | WHOSE BIRTHDAY FALLS NEXT IS UNDER 16 | industry for the use of artificial | | (CODE 3 ON Q1C), ASK: | sweeteners in food and drinks. | | | We are contacting people randomly | | +------------------------------------+ | from The White Pages Telephone | | | | | Listings . I would very much | | | | | appreciate your assistance. I | | | IF CAN'T SAY, ASK: Could I speak | | first need to ask a few questions | | | to someone who would be able to | | about the household in order to | | | help me? | | select a qualifying respondent. | | | MAKE APPOINTMENT IF NECESSARY. | | IF RESPONDENT ASKS FOR MORE INFO | | | IF NEW RESPONDENT, HIT RETURN FOR | | ABOUT THIS PROJECT OR ROY MORGAN | | | INTRODUCTION. | | RESEARCH, HIT ESC H AND SELECT | | +------------------------------------+ | RMR$H. | | | IF RESPONDENT HAS CONCERNS ABOUT | | IF PERSON WHOSE BIRTHDAY IS NEXT IS | PRIVACY ISSUES, HIT ESC H AND | | AGED 16 OR OVER (CODE 2 ON Q1C), SAY: | SELECT ISSUE$H | | | | | Q1D. For the purposes of this survey I | %480,/ | | need to interview %178.. Is it | | | possible for me to speak to %178. now? | APPOINTMENT COMMENTS | | | ================================== | | | // %482,160. | | IF NOT AVAILABLE NOW, MAKE AN +------------------------------------+ | APPOINTMENT. | | YES, CURRENT Q1. How many people, aged 12 years and | RESPONDENT over, LIVE in this household, | AVAILABLE NOW.... 1 including yourself? | | YES, NEW IF CAN'T SAY, ESC D. | RESPONDENT | AVAILABLE NOW.... 2 |__|__+ | | NO, NOT | AVAILABLE: HIT IF CAN'T SAY HOW MANY PEOPLE AGED 12 | RETURN TO MAKE YEARS OR OVER LIVE IN HOUSEHOLD (CODE | APPOINTMENT NOW.. 3 99 ON Q1), ASK: | | REFUSED.......... 4 +------------------------------------+ | | | | IF NOT AVAILABLE (CODE 3 ON Q1D), MAKE | | | AN APPOINTMENT | IF CAN'T SAY, ASK: Could I speak | | | to someone who would be able to | | IF REFUSED (CODE 4 ON Q1D), SAY: | help me? | | | MAKE APPOINTMENT IF NECESSARY. | | +------------------------------------+ | IF NEW RESPONDENT, HIT RETURN FOR | | | Thank you for your time and | | INTRODUCTION. | | | assistance. | +------------------------------------+ | +------------------------------------+ CONSUMPTION OF INTENSE SWEETENERS (C) Roy Morgan Research Pty Ltd. 2002.
Consumption of Intense Sweeteners – Australia/New Zealand Page 99
Roy Morgan Research March, 2004
DATE 2-JUN-03 CONSUMPTION OF INTENSE SWEETENERS PAGE 2 ________________________________________________________________________________ IF SELECTED RESPONDENT IS AGED 12 TO | IF PERMISSION IS NOT ABLE TO BE GIVEN 15, SAY: | YET (CODE 3 ON Q1E), MAKE AN | APPOINTMENT | Before I interview %178. I need the | IF PERMISSION HAS BEEN OBTAINED, SAY: permission of an adult. Could I speak | to an adult responsible for the | Q1F. Thank you. Can you tell me your household now, that is, someone 18 or | relationship to %178.? over who is at home at the moment? | READ OUT. IF NONE AVAILABLE, HIGHLIGHT CODE 3 TO | MAKE APPOINTMENT. | IF OTHER, HIGHLIGHT OTHER AND TYPE IN IF SAME RESPONDENT, ASK: May I have | RESPONSE your permission to interview %178.? | | Parent of %178... 1 IF RESPONSIBLE ADULT IS A NEW | RESPONDENT, SAY: Good %A. My name is | Older (SAY NAME) from Roy Morgan Research, | Brother/Sister of the people who conduct the Morgan | %178............. 2 Gallup Poll. Today we are conducting a | survey on behalf of Food Standards | Other relative of Australia New Zealand. We are | %178............. 3 interested in talking to people about | what they eat and drink. | (DO NOT READ) IF NECESSARY, SAY: Food Standards | OTHER (SPECIFY).. 4 Australia New Zealand is a | %504,/Commonwealth// Government agency | IF SELECTED RESPONDENT NOW ON PHONE, responsible for developing food | AND PERMISSION RECEIVED IF TALKING TO standards. The survey aims to find out | A 12 TO 15 YEAR OLD (CODE 2 ON Q1D OR the patterns of consumption of some | CODE 1 ON Q1E), SAY: food and drink products. Information | gained from the survey will help Food | +------------------------------------+ Standards Australia New Zealand to | | TO NEW RESPONDENT: Good %A. My | review current food standards and to | | name is (SAY NAME) from Roy Morgan | assess applications from industry for | | Research, the people who conduct | the use of artificial sweeteners in | | the Morgan Gallup Poll. Today we | food and drinks. | | are conducting a survey on behalf | We are contacting people randomly from | | of Food Standards Australia New | The White Pages Telephone Listings . | | Zealand. We are interested in | The randomly selected respondent for | | talking to people about what they | this household is %178., but as he/she | | eat and drink. | is under 16, I need to obtain | | IF NECESSARY, SAY: Food Standards | permission of an adult before I can | | Australia New Zealand is a | interview %178.. I would very much | | %515,/Commonwealth// Government | appreciate your permission. | | agency responsible for developing | IF PERMISSION NOT ABLE TO BE GIVEN | | food standards. The survey aims to | YET, ESC H TO PROVIDE MORE | | find out the patterns of | INFORMATION, OR HIGHLIGHT CODE 3 AND | | consumption of some food and drink | HIT RETURN TO MAKE AN APPOINTMENT. | | products. Information gained from | | | the survey will help Food | PERMISSION | | Standards Australia New Zealand to | OBTAINED......... 1 | | review current food standards and | | | to assess applications from | | | industry for the use of artificial | PERMISSION | | sweeteners in food and drinks. | REFUSED.......... 2 | | We are contacting people randomly | | | from The White Pages Telephone | PERMISSION NOT | | Listings . I would very much | ABLE TO BE GIVEN | | appreciate your assistance to | YET.............. 3 | | complete the survey. The survey | | | will take approximately 15 minutes | IF PERMISSION REFUSED (CODE 2 ON Q1E), | | and will be used for Research | SAY: | | purposes only. Is now a good time | | | or would it be more convenient if | +------------------------------------+ | | I made an appointment to speak to | | Thank you for your time, however | | | you at another time? | | we need permission to interview | | | | | individuals under 16. | | | IF NECESSARY, MAKE AN APPOINTMENT. | +------------------------------------+ | +------------------------------------+ CONSUMPTION OF INTENSE SWEETENERS (C) Roy Morgan Research Pty Ltd. 2002.
Consumption of Intense Sweeteners – Australia/New Zealand Page 100
Roy Morgan Research March, 2004
DATE 2-JUN-03 CONSUMPTION OF INTENSE SWEETENERS PAGE 3 ________________________________________________________________________________ IF ONLY ONE PERSON IN HOUSEHOLD OR IS | Female 12-17..... 6 CURRENT RESPONDENT AVAILABLE NOW (CODE | 1 ON Q1 OR Q1D), SAY: | Female 18-24..... 7 | +------------------------------------+ | Female 25-34..... 8 | I would very much appreciate your | | | assistance to complete the survey. | | Female 35-49..... 9 | The survey will take approximately | | | 15 minutes and will be used for | | Female 50+....... 10 | Research purposes only. Is now a | | | good time or would it be more | | SEX BY AGE2 | convenient if I made an | | | appointment to speak to you at | | Male 12-17....... 1 | another time? | | | | | Male 18-24....... 2 | IF NECESSARY, MAKE AN APPOINTMENT. | | +------------------------------------+ | Male 25-44....... 3 | QSEX. RECORD SEX OF RESPONDENT | Male 45-64....... 4 | MALE............. 1 | Male 65+......... 5 | FEMALE........... 2 | Female 12-17..... 6 | Q1A. Would you mind telling me your | Female 18-24..... 7 approximate age please? | | Female 25-44..... 8 IF REFUSES, READ OUT. IF STILL REFUSES | TERMINATE. | Female 45-64..... 9 | 12-13............ 1 | Female 65+....... 10 | 14-15............ 2 | IF QUOTA FULL, SAY: | 16-17............ 3 | +------------------------------------+ | | Thank you for your time and | 18-20............ 4 | | assistance, but we have already | | | spoken to enough people in your | 21-24............ 5 | | age group. | | +------------------------------------+ 25-29............ 6 | | +------------------------------------+ 30-34............ 7 | | I would like to ask you some | | | questions about how often you eat | 35-39............ 8 | | or drink certain things. When we | | | refer to "diet" or "lite" | 40-44............ 9 | | products, this includes any low | | | calorie or low joule products, | 45-49............ 10 | | even if you are not actually on a | | | diet. | 50-54............ 11 | +------------------------------------+ | 55-59............ 12 | +------------------------------------+ | | ASK EVERYONE. | 60-64............ 13 | +------------------------------------+ | 65+.............. 14 | Q2. Have you drunk any diet, lite, low | calorie or low joule carbonated soft SEX BY AGE | drink or diet flavoured mineral water, | including any Reef, in the last 7 Male 12-17....... 1 | days? ("Diet" includes any low calorie | or low joule drinks, even if you are Male 18-24....... 2 | not actually on a diet.) | Male 25-34....... 3 | YES.............. 1 | Male 35-49....... 4 | NO............... 2 | Male 50+......... 5 | CAN'T SAY........ 3 CONSUMPTION OF INTENSE SWEETENERS (C) Roy Morgan Research Pty Ltd. 2002.
Consumption of Intense Sweeteners – Australia/New Zealand Page 101
Roy Morgan Research March, 2004
DATE 2-JUN-03 CONSUMPTION OF INTENSE SWEETENERS PAGE 4 ________________________________________________________________________________ IF HAVE DRUNK ANY DIET CARBONATED SOFT | IF GAVE AMOUNT OF DIET CARBONATED SOFT DRINK OR DIET FLAVOURED MINERAL WATER | DRINK OR DIET FLAVOURED MINERAL WATER IN THE LAST 7 DAYS (CODE 1 ON Q2), | IN SMALL GLASSES (CODE 3 ON Q2A), ASK: | ENTER NUMBER OF SMALL GLASSES | Q2A. How much diet, lite, low calorie | or low joule carbonated soft drink or | Q2D. ENTER NUMBER OF SMALL GLASSES OF diet flavoured mineral water, | DIET CARBONATED SOFT DRINK OR DIET including any Reef, have you drunk in | FLAVOURED MINERAL WATER DRUNK IN THE the last 7 days? You can give your | LAST 7 DAYS answer in terms of number of cans, | number of small, medium or large | |__|__+ glasses, number of bottles or number | of millilitres, whichever you find | easiest. | IF GAVE AMOUNT OF DIET CARBONATED SOFT | DRINK OR DIET FLAVOURED MINERAL WATER INTERVIEWER NOTE: HIGHLIGHT THOSE | IN MEDIUM GLASSES OR 300ML CANS (CODE MENTIONED, AND HIT RETURN TO ENTER THE | 4 ON Q2A), ENTER NUMBER OF MEDIUM NUMBER DRUNK AT NEXT SCREEN. | GLASSES OR 300ML CANS PLEASE PROMPT FOR SIZE OF CAN, GLASS | OR BOTTLE. | SMALL CANS ON AEROPLANES ARE 300 MLS. | Q2E. ENTER NUMBER OF MEDIUM GLASSES OR | 300 ML CANS OF DIET CARBONATED SOFT SMALL CAN (LESS | DRINK OR DIET FLAVOURED MINERAL WATER THAN 200 ML EG. | DRUNK IN THE LAST 7 DAYS V)............... 1, | | |__|__+ REGULAR CAN (375 | ML).............. 2, | | IF GAVE AMOUNT OF DIET CARBONATED SOFT SMALL GLASS (EG | DRINK OR DIET FLAVOURED MINERAL WATER 200 ML).......... 3, | IN LARGE GLASSES (CODE 5 ON Q2A), | ENTER NUMBER OF LARGE GLASSES MEDIUM GLASS | (MIDDY/ POT SIZE) 4, | Q2F. ENTER NUMBER OF LARGE GLASSES OF | DIET CARBONATED SOFT DRINK OR DIET LARGE GLASS (EG | FLAVOURED MINERAL WATER DRUNK IN THE 400 ML).......... 5, | LAST 7 DAYS | SMALL BOTTLE (EG | |__|__+ 350 ML).......... 6, | | IF GAVE AMOUNT OF DIET CARBONATED SOFT MEDIUM BOTTLE (EG | DRINK OR DIET FLAVOURED MINERAL WATER 600ML)........... 7, | IN SMALL BOTTLES (CODE 6 ON Q2A), | ENTER NUMBER OF SMALL BOTTLES 1.25L BOTTLE..... 8, | | Q2G. ENTER NUMBER OF SMALL BOTTLES OF 2L BOTTLE........ 9, | DIET CARBONATED SOFT DRINK OR DIET | FLAVOURED MINERAL WATER DRUNK IN THE MILLILITRES...... 10, | LAST 7 DAYS | CAN'T SAY........ 11, | |__|__+ | IF GAVE AMOUNT OF DIET CARBONATED SOFT | IF GAVE AMOUNT OF DIET CARBONATED SOFT DRINK OR DIET FLAVOURED MINERAL WATER | DRINK OR DIET FLAVOURED MINERAL WATER IN SMALL CANS (CODE 1 ON Q2A), ENTER | IN MEDIUM BOTTLES (CODE 7 ON Q2A), NUMBER OF SMALL CANS | ENTER NUMBER OF MEDIUM BOTTLES | Q2B. ENTER NUMBER OF SMALL CANS OF | Q2H. ENTER NUMBER OF MEDIUM BOTTLES OF DIET CARBONATED SOFT DRINK OR DIET | DIET CARBONATED SOFT DRINK OR DIET FLAVOURED MINERAL WATER DRUNK IN THE | FLAVOURED MINERAL WATER DRUNK IN THE LAST 7 DAYS | LAST 7 DAYS | |__|__+ | |__|__+ | IF GAVE AMOUNT OF DIET CARBONATED SOFT | IF GAVE AMOUNT OF DIET CARBONATED SOFT DRINK OR DIET FLAVOURED MINERAL WATER | DRINK OR DIET FLAVOURED MINERAL WATER IN REGULAR CANS (CODE 2 ON Q2A), ENTER | IN 1.25L BOTTLES (CODE 8 ON Q2A), NUMBER OF REGULAR CANS | ENTER NUMBER OF 1.25L BOTTLES | Q2C. ENTER NUMBER OF REGULAR CANS OF | Q2I. ENTER NUMBER OF 1.25 LITRE DIET CARBONATED SOFT DRINK OR DIET | BOTTLES OF DIET CARBONATED SOFT DRINK FLAVOURED MINERAL WATER DRUNK IN THE | OR DIET FLAVOURED MINERAL WATER DRUNK LAST 7 DAYS | IN THE LAST 7 DAYS | |__|__+ | |__|__+ CONSUMPTION OF INTENSE SWEETENERS (C) Roy Morgan Research Pty Ltd. 2002.
Consumption of Intense Sweeteners – Australia/New Zealand Page 102
Roy Morgan Research March, 2004
DATE 2-JUN-03 CONSUMPTION OF INTENSE SWEETENERS PAGE 5 ________________________________________________________________________________ IF GAVE AMOUNT OF DIET CARBONATED SOFT | SMALL GLASS (EG DRINK OR DIET FLAVOURED MINERAL WATER | 200 ML).......... 3, IN 2 LITRE BOTTLES (CODE 9 ON Q2A), | ENTER NUMBER OF 2 LITRE BOTTLES | MEDIUM GLASS | (MIDDY/ POT SIZE) 4, | Q2J. ENTER NUMBER OF 2 LITRE BOTTLES | LARGE GLASS (EG OF DIET CARBONATED SOFT DRINK OR DIET | 400 ML).......... 5, FLAVOURED MINERAL WATER DRUNK IN THE | LAST 7 DAYS | SMALL BOTTLE (EG | 350 ML).......... 6, |__|__+ | | MEDIUM BOTTLE (EG IF GAVE AMOUNT OF DIET CARBONATED SOFT | 600ML)........... 7, DRINK OR DIET FLAVOURED MINERAL WATER | IN MILLILITRES (CODE 10 ON Q2A) ENTER | 1.25L BOTTLE..... 8, NUMBER OF MILLILITRES | | 2L BOTTLE........ 9, Q2K. ENTER AMOUNT IN MILLILITRES OF | DIET CARBONATED SOFT DRINK OR DIET | MILLILITRES...... 10, FLAVOURED MINERAL WATER DRUNK IN THE | LAST 7 DAYS | CAN'T SAY........ 11, | |__|__|__|__|__+ | IF GAVE AMOUNT OF CARBONATED SOFT | DRINK OR FLAVOURED MINERAL WATER (NOT +------------------------------------+ | DIET) IN SMALL CANS (CODE 1 ON Q3A), | ASK EVERYONE. | | ENTER NUMBER OF SMALL CANS +------------------------------------+ | | Q3B. ENTER NUMBER OF SMALL CANS OF Q3. Have you drunk any carbonated soft | CARBONATED SOFT DRINK OR FLAVOURED drink or flavoured mineral water that | MINERAL WATER, NOT DIET, DRUNK IN THE is NOT diet, nor lite, nor low joule, | LAST 7 DAYS nor low calorie, in the last 7 days? | | |__|__+ IF NECESSARY SAY: For example, Coke, | Pepsi, Fanta, Solo etc? | IF GAVE AMOUNT OF CARBONATED SOFT | DRINK OR FLAVOURED MINERAL WATER (NOT YES.............. 1 | DIET) IN REGULAR CANS (CODE 2 ON Q3A), | ENTER NUMBER OF REGULAR CANS NO............... 2 | | Q3C. ENTER NUMBER OF REGULAR CANS OF CAN'T SAY........ 3 | CARBONATED SOFT DRINK OR FLAVOURED | MINERAL WATER, NOT DIET, DRUNK IN THE IF HAVE DRUNK ANY CARBONATED SOFT | LAST 7 DAYS DRINK OR FLAVOURED MINERAL WATER (NOT | DIET) IN THE LAST 7 DAYS (CODE 1 ON | |__|__+ Q3), ASK: | | IF GAVE AMOUNT OF CARBONATED SOFT Q3A. How much carbonated soft drink or | DRINK OR FLAVOURED MINERAL WATER (NOT flavoured mineral water that is NOT | DIET) IN SMALL GLASSES (CODE 3 ON diet, nor lite, nor low joule, nor low | Q3A), ENTER NUMBER OF SMALL GLASSES calorie, have you drunk in the last 7 | days? You can give your answer in | Q3D. ENTER NUMBER OF SMALL GLASSES OF terms of number of cans, number of | CARBONATED SOFT DRINK OR FLAVOURED small, medium or large glasses, number | MINERAL WATER, NOT DIET, DRUNK IN THE of bottles or number of millilitres, | LAST 7 DAYS whichever you find easiest. | | |__|__+ INTERVIEWER NOTE: HIGHLIGHT THOSE | MENTIONED, AND HIT RETURN TO ENTER THE | IF GAVE AMOUNT OF CARBONATED SOFT NUMBER DRUNK AT NEXT SCREEN. | DRINK OR FLAVOURED MINERAL WATER (NOT PLEASE PROMPT FOR SIZE OF CAN, GLASS | DIET) IN MEDIUM GLASSES OR 300 ML CANS OR BOTTLE. | (CODE 4 ON Q3A), ENTER NUMBER OF SMALL CANS ON AEROPLANES ARE 300 MLS. | MEDIUM GLASSES OR 300ML CANS | SMALL CAN (EG | Q3E. ENTER NUMBER OF MEDIUM GLASSES OR LESS THAN 200 ML | 300 ML CANS OF CARBONATED SOFT DRINK EG V)............ 1, | OR FLAVOURED MINERAL WATER, NOT DIET, | DRUNK IN THE LAST 7 DAYS REGULAR CAN (375 | ML).............. 2, | |__|__+ CONSUMPTION OF INTENSE SWEETENERS (C) Roy Morgan Research Pty Ltd. 2002.
Consumption of Intense Sweeteners – Australia/New Zealand Page 103
Roy Morgan Research March, 2004
DATE 2-JUN-03 CONSUMPTION OF INTENSE SWEETENERS PAGE 6 ________________________________________________________________________________ IF GAVE AMOUNT OF CARBONATED SOFT | +------------------------------------+ DRINK OR FLAVOURED MINERAL WATER (NOT | | ASK EVERYONE | DIET) IN LARGE GLASSES (CODE 5 ON | +------------------------------------+ Q3A), ENTER NUMBER OF LARGE GLASSES | | Q4. Have you drunk any diet, lite, low | joule or sugar free cordial drinks, Q3F. ENTER NUMBER OF LARGE GLASSES OF | including fruit flavoured powdered CARBONATED SOFT DRINK OR FLAVOURED | drink mixes, in the last 7 days? MINERAL WATER, NOT DIET, DRUNK IN THE | ("Diet" includes any low calorie or LAST 7 DAYS | low joule drinks, even if you are not | actually on a diet.) |__|__+ | IF NECESSARY, SAY: An example of a | diet fruit flavoured powdered drink | mix is Diet Refresh. IF GAVE AMOUNT OF CARBONATED SOFT | DRINK OR FLAVOURED MINERAL WATER (NOT | YES.............. 1 DIET) IN SMALL BOTTLES (CODE 6 ON | Q3A), ENTER NUMBER OF SMALL BOTTLES | NO............... 2 | Q3G. ENTER NUMBER OF SMALL BOTTLES OF | CAN'T SAY........ 3 CARBONATED SOFT DRINK OR FLAVOURED | MINERAL WATER, NOT DIET, DRUNK IN THE | IF HAVE DRUNK ANY DIET CORDIAL DRINKS LAST 7 DAYS | IN THE LAST 7 DAYS (CODE 1 ON Q4), | ASK: |__|__+ | | Q4A. How much diet, lite, low joule or IF GAVE AMOUNT OF CARBONATED SOFT | sugar free cordial, including fruit DRINK OR FLAVOURED MINERAL WATER (NOT | flavoured powdered drink mixes, have DIET) IN MEDIUM BOTTLES (CODE 7 ON | you drunk in the last 7 days? Q3A), ENTER NUMBER OF MEDIUM BOTTLES | You can give your answer in terms of | number of small, medium or large Q3H. ENTER NUMBER OF MEDIUM BOTTLES OF | glasses or number of millilitres, CARBONATED SOFT DRINK OR FLAVOURED | whichever you find easiest. MINERAL WATER, NOT DIET, DRUNK IN THE | LAST 7 DAYS | INTERVIEWER NOTE: HIGHLIGHT THOSE | MENTIONED, AND HIT RETURN TO ENTER THE |__|__+ | NUMBER DRUNK. | IF GAVE AMOUNT OF CARBONATED SOFT | IT IS THE MADE UP AMOUNT WE WANT, NOT DRINK OR FLAVOURED MINERAL WATER (NOT | THE AMOUNT OF CORDIAL SYRUP ITSELF. DIET) IN 1.25 LITRE BOTTLES (CODE 8 ON | Q3A), ENTER NUMBER OF 1.25 LITRE | IF THE RESPONDENT ONLY KNOWS HOW MUCH BOTTLES | ACTUAL SYRUP THEY HAVE HAD, HIGHLIGHT | CODE 5 - MILLILITRES (NOT MADE UP/ Q3I. ENTER NUMBER OF 1.25 LITRE | CONCENTRATE AMOUNT). BOTTLES OF CARBONATED SOFT DRINK OR | FLAVOURED MINERAL WATER, NOT DIET, | SMALL GLASS (EG DRUNK IN THE LAST 7 DAYS | 200 ML).......... 1, | |__|__+ | MEDIUM GLASS (EG | 285 ML, MIDDY/ IF GAVE AMOUNT OF CARBONATED SOFT | POT SIZE)........ 2, DRINK OR FLAVOURED MINERAL WATER (NOT | DIET) IN 2 LITRE BOTTLES (CODE 9 ON | LARGE GLASS (EG Q3A), ENTER NUMBER OF 2 LITRE BOTTLES | 400 ML).......... 3, | Q3J. ENTER NUMBER OF 2 LITRE BOTTLES | MILLILITRES (MADE OF CARBONATED SOFT DRINK OR FLAVOURED | UP AMOUNT)....... 4, MINERAL WATER, NOT DIET, DRUNK IN THE | LAST 7 DAYS | MILLILITRES (NOT | MADE UP/ |__|__+ | CONCENTRATE | AMOUNT).......... 5, IF GAVE AMOUNT OF CARBONATED SOFT | DRINK OR FLAVOURED MINERAL WATER (NOT | CAN'T SAY........ 6, DIET) IN MILLILITRES (CODE 10 ON Q3A) | ENTER NUMBER OF MILLILITRES | IF GAVE AMOUNT OF DIET CORDIAL IN | SMALL GLASSES (CODE 1 ON Q4A), ENTER Q3K. ENTER AMOUNT IN MILLILITRES OF | NUMBER OF SMALL GLASSES CARBONATED SOFT DRINK OR FLAVOURED | MINERAL WATER, NOT DIET, DRUNK IN THE | Q4B. ENTER NUMBER OF SMALL GLASSES OF LAST 7 DAYS | DIET CORDIAL DRUNK IN THE LAST 7 DAYS | |__|__|__|__|__+ | |__|__+ CONSUMPTION OF INTENSE SWEETENERS (C) Roy Morgan Research Pty Ltd. 2002.
Consumption of Intense Sweeteners – Australia/New Zealand Page 104
Roy Morgan Research March, 2004
DATE 2-JUN-03 CONSUMPTION OF INTENSE SWEETENERS PAGE 7 ________________________________________________________________________________ IF GAVE AMOUNT OF DIET CORDIAL IN | Q5A. How much cordial, including fruit MEDIUM GLASSES (CODE 2 ON Q4A), ENTER | flavoured powdered drink mixes, that NUMBER OF MEDIUM GLASSES | are NOT diet, nor lite, nor low joule, | nor low calorie have you drunk in the | last 7 days? You can give your answer Q4C. ENTER NUMBER OF MEDIUM GLASSES OF | in terms of number of small, medium or DIET CORDIAL DRUNK IN THE LAST 7 DAYS | large glasses, or number of | millilitres, whichever you find |__|__+ | easiest. | | INTERVIEWER NOTE: HIGHLIGHT THOSE IF GAVE AMOUNT OF DIET CORDIAL IN | MENTIONED, AND HIT RETURN TO ENTER THE LARGE GLASSES (CODE 3 ON Q4A), ENTER | NUMBER DRUNK. NUMBER OF LARGE GLASSES | | IT IS THE MADE UP AMOUNT WE WANT, NOT | THE AMOUNT OF CORDIAL SYRUP ITSELF. Q4D. ENTER NUMBER OF LARGE GLASSES OF | DIET CORDIAL DRUNK IN THE LAST 7 DAYS | IF THE RESPONDENT ONLY KNOWS HOW MUCH | ACTUAL SYRUP THEY HAVE HAD, HIGHLIGHT |__|__+ | CODE 5 - MILLILITRES (NOT MADE UP/ | CONCENTRATE AMOUNT). | IF GAVE AMOUNT OF DIET CORDIAL IN MADE | SMALL GLASS (EG UP MILLILITRES (CODE 4 ON Q4A) ENTER | 200 ML).......... 1, NUMBER OF MILLILITRES | | MEDIUM GLASS (EG | 285 ML, MIDDY/ Q4E. ENTER AMOUNT IN MILLILITRES OF | POT SIZE)........ 2, MADE UP DIET CORDIAL DRUNK IN THE LAST | 7 DAYS | LARGE GLASS (EG | 400 ML).......... 3, |__|__|__|__|__+ | | MILLILITRES (MADE | UP AMOUNT)....... 4, IF GAVE AMOUNT OF DIET CORDIAL | CONCENTRATE IN MILLILITRES (CODE 5 ON | MILLILITRES (NOT Q4A) ENTER NUMBER OF MILLILITRES | MADE UP/ | CONCENTRATE | AMOUNT).......... 5, Q4F. ENTER AMOUNT IN MILLILITRES OF | DIET CORDIAL CONCENTRATE DRUNK IN THE | CAN'T SAY........ 6, LAST 7 DAYS | | IF GAVE AMOUNT OF CORDIAL (NOT DIET) |__|__|__|__+ | IN SMALL GLASSES (CODE 1 ON Q5A), | ENTER NUMBER OF SMALL GLASSES | +------------------------------------+ | Q5B. ENTER NUMBER OF SMALL GLASSES OF | ASK EVERYONE | | CORDIAL, THAT IS NOT DIET, DRUNK IN +------------------------------------+ | THE LAST 7 DAYS | | |__|__+ Q5. Have you drunk any cordial drinks, | including fruit flavoured powdered | IF GAVE AMOUNT OF CORDIAL (NOT DIET) drink mixes, that are NOT diet, nor | IN MEDIUM GLASSES (CODE 2 ON Q5A), lite, nor low joule nor low calorie in | ENTER NUMBER OF MEDIUM GLASSES the last 7 days? | IF NECESSARY, SAY: An example of a | Q5C. ENTER NUMBER OF MEDIUM GLASSES OF fruit flavoured powdered drink mix is | CORDIAL, THAT IS NOT DIET, DRUNK IN Tang or Vitafresh. | THE LAST 7 DAYS | YES.............. 1 | |__|__+ | | IF GAVE AMOUNT OF CORDIAL (NOT DIET) NO............... 2 | IN LARGE GLASSES (CODE 3 ON Q5A), | ENTER NUMBER OF LARGE GLASSES | CAN'T SAY........ 3 | Q5D. ENTER NUMBER OF LARGE GLASSES OF | CORDIAL, THAT IS NOT DIET, DRUNK IN IF HAVE DRUNK ANY CORDIAL DRINKS (NOT | THE LAST 7 DAYS DIET) IN THE LAST 7 DAYS (CODE 1 ON | Q5), ASK: | |__|__+ CONSUMPTION OF INTENSE SWEETENERS (C) Roy Morgan Research Pty Ltd. 2002.
Consumption of Intense Sweeteners – Australia/New Zealand Page 105
Roy Morgan Research March, 2004
DATE 2-JUN-03 CONSUMPTION OF INTENSE SWEETENERS PAGE 8 ________________________________________________________________________________ IF GAVE AMOUNT OF MADE UP CORDIAL (NOT | IF GAVE AMOUNT OF OCEAN SPRAY DIET) IN MILLILITRES (CODE 4 ON Q5A) | LITESTYLE CRANBERRY CLASSIC OR ENTER NUMBER OF MILLILITRES | SUNRAYSIA DIET LEMON SQUASH IN SMALL | GLASSES (CODE 1 ON Q18A), ENTER NUMBER Q5E. ENTER AMOUNT IN MILLILITRES OF | OF SMALL GLASSES MADE UP CORDIAL, THAT IS NOT DIET, | DRUNK IN THE LAST 7 DAYS | Q18B. ENTER NUMBER OF SMALL GLASSES OF | OCEAN SPRAY LITESTYLE CRANBERRY |__|__|__|__|__+ | CLASSIC OR SUNRAYSIA DIET LEMON SQUASH | DRUNK IN THE LAST 7 DAYS IF GAVE AMOUNT OF CORDIAL CONCENTRATE | (NOT DIET) IN MILLILITRES (CODE 5 ON | |__|__+ Q5A) ENTER NUMBER OF MILLILITRES | | IF GAVE AMOUNT OF OCEAN SPRAY Q5F. ENTER AMOUNT IN MILLILITRES OF | LITESTYLE CRANBERRY CLASSIC OR CORDIAL CONCENTRATE, THAT IS NOT DIET, | SUNRAYSIA DIET LEMON SQUASH IN MEDIUM DRUNK IN THE LAST 7 DAYS | GLASSES (CODE 2 ON Q18A), ENTER NUMBER | OF MEDIUM GLASSES |__|__|__|__+ | | Q18C. ENTER NUMBER OF MEDIUM GLASSES +------------------------------------+ | OF OCEAN SPRAY LITESTYLE CRANBERRY | ASK EVERYONE | | CLASSIC OR SUNRAYSIA DIET LEMON SQUASH +------------------------------------+ | DRUNK IN THE LAST 7 DAYS | Q18. Thinking about fruit drinks. Have | |__|__+ you drunk any OCEAN SPRAY LITESTYLE | CRANBERRY CLASSIC or SUNRAYSIA DIET | IF GAVE AMOUNT OF OCEAN SPRAY LEMON SQUASH in the last 7 days? | LITESTYLE CRANBERRY CLASSIC OR | SUNRAYSIA DIET LEMON SQUASH IN LARGE YES.............. 1 | GLASSES (CODE 3 ON Q18A), ENTER NUMBER | OF LARGE GLASSES NO............... 2 | | Q18D. ENTER NUMBER OF LARGE GLASSES OF CAN'T SAY........ 3 | OCEAN SPRAY LITESTYLE CRANBERRY | CLASSIC OR SUNRAYSIA DIET LEMON SQUASH IF HAVE DRUNK ANY OCEAN SPRAY | DRUNK IN THE LAST 7 DAYS LITESTYLE CRANBERRY CLASSIC OR | SUNRAYSIA DIET LEMON SQUASH IN THE | |__|__+ LAST 7 DAYS (CODE 1 ON Q18), ASK: | | IF GAVE AMOUNT OF OCEAN SPRAY Q18A. How much OCEAN SPRAY LITESTYLE | LITESTYLE CRANBERRY CLASSIC OR CRANBERRY CLASSIC or SUNRAYSIA DIET | SUNRAYSIA DIET LEMON SQUASH IN LEMON SQUASH have you drunk in the | MILLILITRES (CODE 4 ON Q18A) ENTER last 7 days? | NUMBER OF MILLILITRES You can give your answer in terms of | number of small, medium or large | Q18E. ENTER AMOUNT IN MILLILITRES OF glasses, or number of millilitres, | OCEAN SPRAY LITESTYLE CRANBERRY whichever you find easiest. | CLASSIC OR SUNRAYSIA DIET LEMON SQUASH | DRUNK IN THE LAST 7 DAYS INTERVIEWER NOTE: HIGHLIGHT THOSE | MENTIONED, AND HIT RETURN TO ENTER THE | |__|__|__|__|__+ NUMBER DRUNK. | | +------------------------------------+ SMALL GLASS (EG | | ASK EVERYONE | 200 ML).......... 1, | +------------------------------------+ | MEDIUM GLASS (EG | Q18F. Not including those two, have 285 ML, MIDDY/ | you drunk any fruit drink in the last POT SIZE)........ 2, | 7 days? This does not include 100% | fruit juice. LARGE GLASS (EG | 400 ML).......... 3, | YES.............. 1 | MILLILITRES...... 4, | NO............... 2 | CAN'T SAY........ 5, | CAN'T SAY........ 3 CONSUMPTION OF INTENSE SWEETENERS (C) Roy Morgan Research Pty Ltd. 2002.
Consumption of Intense Sweeteners – Australia/New Zealand Page 106
Roy Morgan Research March, 2004
DATE 2-JUN-03 CONSUMPTION OF INTENSE SWEETENERS PAGE 9 ________________________________________________________________________________ IF HAVE DRUNK ANY FRUIT DRINK (NOT | Q6. Have you added any ARTIFICIAL INCLUDING OCEAN SPRAY LITESTYLE | SWEETENERS to your tea, coffee, or CRANBERRY CLASSIC OR SUNRAYSIA DIET | cereal in the last 7 days? LEMON SQUASH) IN THE LAST 7 DAYS (CODE | IF NECESSARY, SAY: For example, an 1 ON Q18F), ASK: | artificial sweetener such as Equal or | Nutrisweet. Q18G. How much of this fruit drink | have you drunk in the last 7 days? | YES.............. 1 You can give your answer in terms of | number of small, medium or large | glasses, or number of millilitres, | NO............... 2 whichever you find easiest. | | INTERVIEWER NOTE: HIGHLIGHT THOSE | CAN'T SAY........ 3 MENTIONED, AND HIT RETURN TO ENTER THE | NUMBER DRUNK. | NOTE: THIS DOES NOT INCLUDE 100% FRUIT | IF HAVE ADDED ANY ARTIFICIAL JUICE. | SWEETENERS TO TEA, COFFEE, OR CEREAL | IN THE LAST 7 DAYS (CODE 1 ON Q6.), SMALL GLASS (EG | ASK: 200 ML).......... 1, | | Q6A. How many TABLETS, TEASPOONS, MEDIUM GLASS (EG | DROPS OR SACHETS of artificial 285 ML, MIDDY/ | sweetener did you use in tea, coffee POT SIZE)........ 2, | or on cereal in the last 7 days? | INTERVIEWER NOTE: FOR EXAMPLE, AN LARGE GLASS (EG | ARTIFICIAL SWEETENER SUCH AS EQUAL OR 400 ML).......... 3, | NUTRISWEET. | MILLILITRES...... 4, | IF CAN'T SAY, ESC D. | CAN'T SAY........ 5, | |__|__|__+ | IF GAVE AMOUNT OF FRUIT DRINK (NOT | +------------------------------------+ DIET) IN SMALL GLASSES (CODE 1 ON | | ASK EVERYONE. | Q18G), ENTER NUMBER OF SMALL GLASSES | +------------------------------------+ | Q18H. ENTER NUMBER OF SMALL GLASSES | Q6B. Have you used any ARTIFICIAL NONDIET FRUIT DRINK DRUNK IN THE LAST | SWEETENERS in cooking, even if you 7 DAYS | didn't eat it, in the last 7 days? | IF NECESSARY, SAY: For example, an |__|__+ | artificial sweetener such as Equal or | Nutrisweet. IF GAVE AMOUNT OF FRUIT DRINK (NOT | This includes things that other people DIET) IN MEDIUM GLASSES (CODE 2 ON | may have cooked for you. Q18G), ENTER NUMBER OF MEDIUM GLASSES | | YES.............. 1 Q18I. ENTER NUMBER OF MEDIUM GLASSES | OF NONDIET FRUIT DRINK DRUNK IN THE | NO............... 2 LAST 7 DAYS | | CAN'T SAY........ 3 |__|__+ | | IF HAVE USED ANY ARTIFICIAL SWEETENERS IF GAVE AMOUNT OF FRUIT DRINK (NOT | IN COOKING IN THE LAST 7 DAYS (CODE 1 DIET) IN LARGE GLASSES (CODE 3 ON | ON Q6B.), ASK: Q18G), ENTER NUMBER OF LARGE GLASSES | | Q6C. How many TEASPOONS OR SACHETS of Q18J. ENTER NUMBER OF LARGE GLASSES OF | artificial sweetener did you use in NONDIET FRUIT DRINK DRUNK IN THE LAST | cooking in the last 7 days? 7 DAYS | INTERVIEWER NOTE: FOR EXAMPLE, AN | ARTIFICIAL SWEETENER SUCH AS EQUAL OR |__|__+ | NUTRISWEET. | IF GAVE AMOUNT OF FRUIT DRINK (NOT | IF CAN'T SAY, ESC D. DIET) IN MILLILITRES (CODE 4 ON Q18G) | ENTER NUMBER OF MILLILITRES | |__|__|__+ | Q18K. ENTER AMOUNT IN MILLILITRES OF | +------------------------------------+ NONDIET FRUIT DRINK DRUNK IN THE LAST | | ASK EVERYONE. | 7 DAYS | +------------------------------------+ | |__|__|__|__|__+ | Q7. Have you added any SUGAR TO TEA, | COFFEE OR ON CEREAL in the last 7 +------------------------------------+ | days? | ASK EVERYONE. | | +------------------------------------+ | YES.............. 1 CONSUMPTION OF INTENSE SWEETENERS (C) Roy Morgan Research Pty Ltd. 2002.
Consumption of Intense Sweeteners – Australia/New Zealand Page 107
Roy Morgan Research March, 2004
DATE 2-JUN-03 CONSUMPTION OF INTENSE SWEETENERS PAGE 10 ________________________________________________________________________________ NO............... 2 | Q9A. How many pieces of chewing gum, | lollies, chocolate or other | confectionery, not including sugar CAN'T SAY........ 3 | free, did you consume in the last 7 | days? IF HAVE ADDED ANY SUGAR TO TEA, COFFEE | INTERVIEWER NOTE: 1 SMALL CHOCOLATE OR ON CEREAL IN THE LAST 7 DAYS (CODE | BAR = 5 PIECES 1 ON Q7.), ASK: | 1 SMALL PACKET LOLLIES = 5 PIECES | 1 LARGE PACKET LOLLIES = 10 PIECES Q7A. How many teaspoons of sugar did | you use in tea, coffee or on cereal in | IF CAN'T SAY, ESC D. the last 7 days? | INTERVIEWER NOTE: TOTAL FOR THE LAST | |__|__|__|__+ SEVEN DAYS | | +------------------------------------+ IF CAN'T SAY, ESC D. | | ASK EVERYONE. | | +------------------------------------+ |__|__|__+ | | Q10. Have you had any DIET, LOW +------------------------------------+ | CALORIE OR LOW JOULE FLAVOURED YOGHURT | ASK EVERYONE. | | OR MOUSSE, WHICH IS ARTIFICIALLY +------------------------------------+ | SWEETENED, in the last 7 days? | IF NECESSARY SAY: Examples of Q8. Have you had any SUGAR FREE | artificially sweetened yoghurts are CHEWING GUM or other SUGAR FREE | Yoplait No Fat Yoghurt, Nestle Diet No LOLLIES, CHOCOLATE OR CONFECTIONERY in | Fat Yoghurt or Vaalia No Fat Yoghurt. the last 7 days? | | YES.............. 1 YES.............. 1 | | NO............... 2 NO............... 2 | | CAN'T SAY........ 3 CAN'T SAY........ 3 | | IF HAVE HAD ANY DIET, LOW CALORIE OR IF HAVE HAD ANY SUGAR FREE CHEWING GUM | LOW JOULE FLAVOURED YOGHURT OR MOUSSE OR OTHER SUGAR FREE LOLLIES, CHOCOLATE | WHICH IS ARTIFICIALLY SWEETENED IN THE OR CONFECTIONERY IN THE LAST 7 DAYS | LAST 7 DAYS (CODE 1 ON Q10.), ASK: (CODE 1 ON Q8.), ASK: | | Q10A. How much artificially sweetened Q8A. How many pieces of sugar free | flavoured yoghurt or mousse, did you chewing gum or other sugar free | consume in the last 7 days? You can lollies, chocolate or confectionery | give your answer in terms of did you consume in the last 7 days? | teaspoons, dessertspoons or small 200 INTERVIEWER NOTE: 1 SMALL CHOCOLATE | gram cartons, whichever you find BAR = 5 PIECES | easiest. 1 SMALL PACKET LOLLIES = 5 PIECES | 1 LARGE PACKET LOLLIES = 10 PIECES | INTERVIEWER NOTE: HIGHLIGHT TYPES | MENTIONED, AND HIT RETURN TO ENTER THE IF CAN'T SAY, ESC D. | NUMBER EATEN AT NEXT SCREEN. | |__|__|__|__+ | TEASPOONS........ 1, | +------------------------------------+ | DESSERTSPOONS.... 2, | ASK EVERYONE. | | +------------------------------------+ | CARTONS (200 GM). 3, | Q9. Have you had any CHEWING GUM, | CAN'T SAY........ 4, LOLLIES, CHOCOLATE OR OTHER | CONFECTIONERY, NOT INCLUDING SUGAR | IF GAVE AMOUNT OF ARTIFICIALLY FREE in the last 7 days? | SWEETENED YOGHURT OR MOUSSE IN | TEASPOONS (CODE 1 ON Q10A.), ENTER YES.............. 1 | NUMBER OF TEASPOONS | NO............... 2 | Q10B. ENTER NUMBER OF TEASPOONS OF | ARTIFICIALLY SWEETENED YOGHURT OR CAN'T SAY........ 3 | MOUSSE EATEN IN THE LAST 7 DAYS. | IF HAVE HAD ANY CHEWING GUM, LOLLIES, | INTERVIEWER NOTE: 1 HEAPED TEASPOON IS CHOCOLATE, OR OTHER CONFECTIONERY, NOT | EQUIVALENT TO 2 TEASPOONS. INCLUDING SUGAR FREE IN THE LAST 7 | DAYS (CODE 1 ON Q9.), ASK: | |__|__|__+ CONSUMPTION OF INTENSE SWEETENERS (C) Roy Morgan Research Pty Ltd. 2002.
Consumption of Intense Sweeteners – Australia/New Zealand Page 108
Roy Morgan Research March, 2004
DATE 2-JUN-03 CONSUMPTION OF INTENSE SWEETENERS PAGE 11 ________________________________________________________________________________ IF GAVE AMOUNT OF ARTIFICIALLY | IF GAVE AMOUNT OF YOGHURT, OR MOUSSE SWEETENED YOGHURT OR MOUSSE IN | (NOT ARTIFICIALLY SWEETENED) IN DESSERTSPOONS (CODE 2 ON Q10A.), ENTER | TEASPOONS (CODE 1 ON Q11A.), ENTER NUMBER OF DESSERTSPOONS | NUMBER OF TEASPOONS | | Q11B. ENTER NUMBER OF TEASPOONS OF Q10C. ENTER NUMBER OF DESSERTSPOONS OF | YOGHURT, OR MOUSSE (NOT ARTIFICIALLY ARTIFICIALLY SWEETENED YOGHURT OR | SWEETENED) EATEN IN THE LAST 7 DAYS. MOUSSE EATEN IN THE LAST 7 DAYS. | | INTERVIEWER NOTE: 1 HEAPED TEASPOON IS INTERVIEWER NOTE: 1 HEAPED | EQUIVALENT TO 2 TEASPOONS. DESSERTSPOON IS EQUIVALENT TO 2 | DESSERTSPOONS. | |__|__|__+ | |__|__|__+ | IF GAVE AMOUNT OF YOGHURT, OR MOUSSE | (NOT ARTIFICIALLY SWEETENED) IN | DESSERTSPOONS (CODE 2 ON Q11A.), ENTER IF GAVE AMOUNT OF ARTIFICIALLY | NUMBER OF DESSERTSPOONS SWEETENED YOGHURT OR MOUSSE IN 200 | GRAM CARTONS (CODE 3 ON Q10A.), ENTER | Q11C. ENTER NUMBER OF DESSERTSPOONS OF NUMBER OF CARTONS | YOGHURT, OR MOUSSE (NOT ARTIFICIALLY | SWEETENED) EATEN IN THE LAST 7 DAYS. Q10D. ENTER NUMBER OF 200 GRAM CARTONS | OF ARTIFICIALLY SWEETENED YOGHURT OR | INTERVIEWER NOTE: 1 HEAPED MOUSSE EATEN IN THE LAST 7 DAYS | DESSERTSPOON IS EQUIVALENT TO 2 | DESSERTSPOONS. |__|__+ | | |__|__|__+ +------------------------------------+ | | ASK EVERYONE. | | IF GAVE AMOUNT OF YOGHURT, OR MOUSSE +------------------------------------+ | (NOT ARTIFICIALLY SWEETENED) IN 200 | GRAM CARTONS (CODE 3 ON Q11A.), ENTER Q11. Have you had any FLAVOURED | NUMBER OF CARTONS YOGHURT OR MOUSSE, WHICH IS NOT | ARTIFICIALLY SWEETENED in the last 7 | Q11D. ENTER NUMBER OF 200 GRAM CARTONS days? | OF YOGHURT, OR MOUSSE (NOT IF NECESSARY SAY: Examples of | ARTIFICIALLY SWEETENED) EATEN IN THE flavoured yoghurts that are not | LAST 7 DAYS artificially sweetened include Yoplait | Lite Yoghurt, Nestle Light Yoghurt, | |__|__+ D'Lite Yoghurt or Vaalia Low Fat | Yoghurt, all non diet yoghurts and | +------------------------------------+ frozen yoghurt. | | ASK EVERYONE. | | +------------------------------------+ YES.............. 1 | | Q12. Have you had any DIET, LITE, LOW NO............... 2 | CALORIE OR LOW JOULE JELLY OR | MILK-BASED PUDDING in the last 7 days? CAN'T SAY........ 3 | | YES.............. 1 IF HAVE HAD ANY FLAVOURED YOGHURT OR | MOUSSE, WHICH IS NOT ARTIFICIALLY | NO............... 2 SWEETENED IN THE LAST 7 DAYS (CODE 1 | ON Q11.), ASK: | CAN'T SAY........ 3 | Q11A. How much flavoured yoghurt or | IF HAVE HAD ANY DIET, LITE, LOW mousse which is NOT ARTIFICIALLY | CALORIE OR LOW JOULE JELLY OR SWEETENED, did you consume in the last | MILK-BASED PUDDING IN THE LAST 7 DAYS 7 days? You can give your answer in | (CODE 1 ON Q12.), ASK: terms of teaspoons, dessertspoons or | small 200 gram cartons, whichever you | Q12A. How many dessertspoons of diet find easiest. | jelly or milk-based pudding did you | consume in the last 7 days? INTERVIEWER NOTE: HIGHLIGHT TYPES | INTERVIEWER NOTE: A TYPICAL DESSERT MENTIONED, AND HIT RETURN TO ENTER THE | BOWL CONTAINS APPROXIMATELY 5 HEAPED NUMBER EATEN AT NEXT SCREEN. | DESSERTSPOONS | TEASPOONS........ 1, | IF CAN'T SAY, ESC D. | DESSERTSPOONS.... 2, | |__|__|__+ | CARTONS (200 GM). 3, | +------------------------------------+ | | ASK EVERYONE. | CAN'T SAY........ 4, | +------------------------------------+ CONSUMPTION OF INTENSE SWEETENERS (C) Roy Morgan Research Pty Ltd. 2002.
Consumption of Intense Sweeteners – Australia/New Zealand Page 109
Roy Morgan Research March, 2004
DATE 2-JUN-03 CONSUMPTION OF INTENSE SWEETENERS PAGE 12 ________________________________________________________________________________ Q13. Have you had any ORDINARY JELLY | NO............... 2 OR MILK-BASED PUDDING in the last 7 | days? | CAN'T SAY........ 3 IF NECESSARY, SAY: That is, not diet, | lite, low calorie nor low joule. Do | IF HAVE HAD ANY JAMS OR CONSERVES, not include custards. | WHICH ARE NOT DIET, NOR LITE, NOR LOW | JOULE NOR LOW CALORIE IN THE LAST 7 YES.............. 1 | DAYS (CODE 1 ON Q15.), ASK: | NO............... 2 | Q15A. How many teaspoons of ordinary | jam or conserve did you consume in the CAN'T SAY........ 3 | last 7 days? | IF HAVE HAD ANY ORDINARY JELLY OR | MILK-BASED PUDDING IN THE LAST 7 DAYS | IF CAN'T SAY, ESC D. (CODE 1 ON Q13.), ASK: | | |__|__|__+ Q13A. How many dessertspoons of | ordinary jelly or milk-based pudding | +------------------------------------+ did you consume in the last 7 days? | | ASK EVERYONE. | INTERVIEWER NOTE: A TYPICAL DESSERT | +------------------------------------+ BOWL CONTAINS APPROXIMATELY 5 HEAPED | DESSERTSPOONS | Q16. Thinking of artificially | sweetened flavoured milk. Have you IF CAN'T SAY, ESC D. | drunk any TAKE CARE, FEEL GOOD OR OAK | LITE OR OTHER ARTIFICIALLY SWEETENED |__|__|__+ | FLAVOURED MILK in the last 7 days? | +------------------------------------+ | YES.............. 1 | ASK EVERYONE. | | +------------------------------------+ | NO............... 2 | Q14. Have you had any JAMS OR | CAN'T SAY........ 3 CONSERVES that contain artificial | sweeteners instead of sugar in the | IF HAVE DRUNK ANY TAKE CARE, FEEL GOOD last 7 days? | OR OAK LITE FLAVOURED MILK IN THE LAST | 7 DAYS (CODE 1 ON Q16), ASK: YES.............. 1 | | Q16A. How much Take Care, Feel Good or NO............... 2 | Oak Lite flavoured milk have you drunk | in the last 7 days? CAN'T SAY........ 3 | You can give your answer in terms of | number of small, medium or large IF HAVE HAD ANY JAMS OR CONSERVES THAT | glasses, number of 375ml or 600ml CONTAIN ARTIFICIAL SWEETENERS INSTEAD | cartons or number of millilitres, OF SUGAR IN THE LAST 7 DAYS (CODE 1 ON | whichever you find easiest. Q14.), ASK: | | INTERVIEWER NOTE: HIGHLIGHT THOSE Q14A. How many teaspoons of jam or | MENTIONED, AND HIT RETURN TO ENTER THE conserve that contain artificial | NUMBER DRUNK. sweeteners instead of sugar, did you | consume in the last 7 days? | SMALL GLASS (EG | 200 ML).......... 1, | IF CAN'T SAY, ESC D. | MEDIUM GLASS (EG | 285 ML, MIDDY/ |__|__|__+ | POT SIZE)........ 2, | +------------------------------------+ | LARGE GLASS (EG | ASK EVERYONE. | | 400 ML).......... 3, +------------------------------------+ | | 375ML CARTON..... 4, Q15. Have you had any ORDINARY JAMS OR | CONSERVES in the last 7 days? | 600ML CARTON/ IF NECESSARY, SAY: That is, jams or | BOTTLE........... 5, conserves that are not artificially | sweetened | MILLILITRES...... 6, | YES.............. 1 | CAN'T SAY........ 7, CONSUMPTION OF INTENSE SWEETENERS (C) Roy Morgan Research Pty Ltd. 2002.
Consumption of Intense Sweeteners – Australia/New Zealand Page 110
Roy Morgan Research March, 2004
DATE 2-JUN-03 CONSUMPTION OF INTENSE SWEETENERS PAGE 13 ________________________________________________________________________________ IF GAVE AMOUNT OF TAKE CARE, FEEL GOOD | +------------------------------------+ OR OAK LITE FLAVOURED MILK IN SMALL | | ASK EVERYONE. | GLASSES (CODE 1 ON Q16A), ENTER NUMBER | +------------------------------------+ OF SMALL GLASSES | | Q16B. ENTER NUMBER OF SMALL GLASSES OF | Q17. Have you had any ordinary TAKE CARE, FEEL GOOD OR OAK LITE | flavoured milk in the last 7 days? FLAVOURED MILK DRUNK IN THE LAST 7 | DAYS. | YES.............. 1 | |__|__+ | NO............... 2 | IF GAVE AMOUNT OF TAKE CARE, FEEL GOOD | CAN'T SAY........ 3 OR OAK LITE FLAVOURED MILK IN MEDIUM | GLASSES (CODE 2 ON Q16A), ENTER NUMBER | IF HAVE DRUNK ANY PACKAGED FLAVOURED OF MEDIUM GLASSES | MILK, NOT INCLUDING TAKE CARE, FEEL | GOOD OR OAK LITE FLAVOURED MILK IN THE Q16C. ENTER NUMBER OF MEDIUM GLASSES | LAST 7 DAYS (CODE 1 ON Q17), ASK: OF TAKE CARE, FEEL GOOD OR OAK LITE | FLAVOURED MILK DRUNK IN THE LAST 7 | Q17A. How much of this flavoured milk DAYS. | have you drunk in the last 7 days? | You can give your answer in terms of |__|__+ | number of small, medium or large | glasses, number of 375ml or 600ml IF GAVE AMOUNT OF TAKE CARE, FEEL GOOD | cartons, or number of millilitres, OR OAK LITE FLAVOURED MILK IN LARGE | whichever you find easiest. GLASSES (CODE 3 ON Q16A), ENTER NUMBER | INTERVIEWER NOTE: DO NOT INCLUDE PLAIN OF LARGE GLASSES | MILK OR FLAVOURED SOY MILK. | Q16D. ENTER NUMBER OF LARGE GLASSES OF | NOTE: HIGHLIGHT THOSE MENTIONED, AND TAKE CARE, FEEL GOOD OR OAK LITE | HIT RETURN TO ENTER THE NUMBER DRUNK. FLAVOURED MILK DRUNK IN THE LAST 7 | DAYS. | SMALL GLASS (EG | 200 ML).......... 1, |__|__+ | | MEDIUM GLASS (EG IF GAVE AMOUNT OF TAKE CARE, FEEL GOOD | 285 ML, MIDDY/ OR OAK LITE FLAVOURED MILK IN 375ML | POT SIZE)........ 2, CARTONS (CODE 4 ON Q16A), ENTER NUMBER | OF 375ML CARTONS | LARGE GLASS (EG | 400 ML).......... 3, Q16E. ENTER NUMBER OF 375ML CARTONS OF | TAKE CARE, FEEL GOOD OR OAK LITE | 375ML CARTON..... 4, FLAVOURED MILK DRUNK IN THE LAST 7 | DAYS. | 600ML CARTON/ | BOTTLE........... 5, |__|__+ | | MILLILITRES...... 6, IF GAVE AMOUNT OF TAKE CARE, FEEL GOOD | OR OAK LITE FLAVOURED MILK IN 600ML | CAN'T SAY........ 7, CARTONS OR BOTTLES (CODE 5 ON Q16A), | ENTER NUMBER OF 600ML CARTONS OR | IF GAVE AMOUNT OF FLAVOURED MILK IN BOTTLES | SMALL GLASSES (CODE 1 ON Q17A), ENTER | NUMBER OF SMALL GLASSES Q16F. ENTER NUMBER OF 600ML CARTONS OR | BOTTLES OF TAKE CARE, FEEL GOOD OR OAK | Q17B. ENTER NUMBER OF SMALL GLASSES OF LITE FLAVOURED MILK DRUNK IN THE LAST | FLAVOURED MILK NOT INCLUDING TAKE 7 DAYS. | CARE, FEEL GOOD OR OAK LITE, DRUNK IN | THE LAST 7 DAYS. |__|__+ | | |__|__+ IF GAVE AMOUNT OF TAKE CARE, FEEL GOOD | OR OAK LITE FLAVOURED MILK IN | IF GAVE AMOUNT OF FLAVOURED MILK IN MILLILITRES (CODE 6 ON Q16A), ENTER | MEDIUM GLASSES (CODE 2 ON Q17A), ENTER NUMBER OF MILLILITRES | NUMBER OF MEDIUM GLASSES | Q16G. ENTER NUMBER OF MILLILITRES OF | Q17C. ENTER NUMBER OF MEDIUM GLASSES TAKE CARE, FEEL GOOD OR OAK LITE | OF FLAVOURED MILK NOT INCLUDING TAKE FLAVOURED MILK DRUNK IN THE LAST 7 | CARE, FEEL GOOD OR OAK LITE, DRUNK IN DAYS. | THE LAST 7 DAYS. | |__|__|__|__|__+ | |__|__+ CONSUMPTION OF INTENSE SWEETENERS (C) Roy Morgan Research Pty Ltd. 2002.
Consumption of Intense Sweeteners – Australia/New Zealand Page 111
Roy Morgan Research March, 2004
DATE 2-JUN-03 CONSUMPTION OF INTENSE SWEETENERS PAGE 14 ________________________________________________________________________________ IF GAVE AMOUNT OF FLAVOURED MILK IN | +------------------------------------+ LARGE GLASSES (CODE 3 ON Q17A), ENTER | | ASK EVERYONE. | NUMBER OF LARGE GLASSES | +------------------------------------+ | Q17D. ENTER NUMBER OF LARGE GLASSES OF | FLAVOURED MILK NOT INCLUDING TAKE | Q19B. Have you had any CANNED FRUIT CARE, FEEL GOOD OR OAK LITE, DRUNK IN | WHICH IS NOT ARTIFICIALLY SWEETENED in THE LAST 7 DAYS. | the last 7 days? | IF NECESSARY, SAY: Not including |__|__+ | Weight Watchers nor Watties Lite, | Diet, Low Joule or Low Calorie canned IF GAVE AMOUNT OF FLAVOURED MILK IN | fruit 375ML CARTONS (CODE 4 ON Q17A), ENTER | NUMBER OF 375ML CARTONS | YES.............. 1 | Q17E. ENTER NUMBER OF 375ML CARTONS OF | FLAVOURED MILK NOT INCLUDING TAKE | NO............... 2 CARE, FEEL GOOD OR OAK LITE, DRUNK IN | THE LAST 7 DAYS. | CAN'T SAY........ 3 | |__|__+ | IF HAVE HAD ANY CANNED FRUIT WHICH IS | NOT ARTIFICIALLY SWEETENED IN THE LAST IF GAVE AMOUNT OF FLAVOURED MILK IN | 7 DAYS (CODE 1 ON Q19B.), ASK: 600ML CARTONS OR BOTTLES (CODE 5 ON | Q17A), ENTER NUMBER OF 600ML CARTONS | Q19C. How many serves of canned fruit OR BOTTLES | which is NOT ARTIFICIALLY SWEETENED | did you consume in the last 7 days? Q17F. ENTER NUMBER OF 600ML CARTONS OR | INTERVIEWER NOTE: AN AVERAGE SERVE OR BOTTLES OF FLAVOURED MILK NOT | SMALL TUB = 135 GM INCLUDING TAKE CARE, FEEL GOOD OR OAK | LITE, DRUNK IN THE LAST 7 DAYS. | IF CAN'T SAY, ESC D. | |__|__+ | |__|__|__+ | IF GAVE AMOUNT OF FLAVOURED MILK IN | +------------------------------------+ MILLILITRES (CODE 6 ON Q17A), ENTER | | ASK EVERYONE. | NUMBER OF MILLILITRES | +------------------------------------+ | Q17G. ENTER NUMBER OF MILLILITRES OF | Q20. Have you had any DIET, LITE, LOW FLAVOURED MILK NOT INCLUDING TAKE | CALORIE OR LOW JOULE TOPPINGS in the CARE, FEEL GOOD OR OAK LITE, DRUNK IN | last 7 days? THE LAST 7 DAYS. | | YES.............. 1 |__|__|__|__|__+ | | NO............... 2 +------------------------------------+ | | ASK EVERYONE. | | CAN'T SAY........ 3 +------------------------------------+ | | IF HAVE HAD ANY DIET, LITE, LOW Q19. Have you had any WEIGHT WATCHERS | CALORIE OR LOW JOULE TOPPINGS IN THE OR WATTIES LITE, DIET, LOW JOULE OR | LAST 7 DAYS (CODE 1 ON Q20.), ASK: LOW CALORIE CANNED FRUIT in the last 7 | days? | Q20A. How many dessertspoons of diet, | lite, low calorie or low joule YES.............. 1 | toppings did you consume in the last 7 | days? NO............... 2 | | CAN'T SAY........ 3 | IF CAN'T SAY, ESC D. | IF HAVE HAD ANY WEIGHT WATCHERS OR | |__|__|__+ WATTIES LITE, DIET, LOW JOULE OR LOW | CALORIE FRUIT IN THE LAST 7 DAYS (CODE | +------------------------------------+ 1 ON Q19.), ASK: | | ASK EVERYONE. | | +------------------------------------+ Q19A. How many serves of Weight | Watchers or Watties Lite, Diet, Low | Q20B. Have you had any TOPPINGS WHICH Joule or Low Calorie canned fruit did | ARE NOT DIET NOR LITE NOR LOW CALORIE you consume in the last 7 days? | NOR LOW JOULE in the last 7 days? INTERVIEWER NOTE: AN AVERAGE SERVE OR | SMALL TUB = 135 GM | YES.............. 1 | IF CAN'T SAY, ESC D. | NO............... 2 | |__|__|__+ | CAN'T SAY........ 3 CONSUMPTION OF INTENSE SWEETENERS (C) Roy Morgan Research Pty Ltd. 2002.
Consumption of Intense Sweeteners – Australia/New Zealand Page 112
Roy Morgan Research March, 2004
DATE 2-JUN-03 CONSUMPTION OF INTENSE SWEETENERS PAGE 15 ________________________________________________________________________________ IF HAVE HAD ANY TOPPINGS WHICH ARE NOT | IF HAVE HAD ANY ICE CREAM WHICH IS NOT DIET NOR LITE NOR LOW CALORIE NOR LOW | ARTIFICIALLY SWEETENED IN THE LAST 7 JOULE IN THE LAST 7 DAYS (CODE 1 ON | DAYS (CODE 1 ON Q21B.), ASK: Q20B.), ASK: | | Q21C. How many scoops of ice cream | which is NOT ARTIFICIALLY SWEETENED Q20C. How many dessertspoons of | did you consume in the last 7 days? topping which is NOT diet nor lite nor | INTERVIEWER NOTE: 1 ICYPOLE/ICECREAM = low calorie nor low joule did you | 1 SCOOP consume in the last 7 days? | | IF CAN'T SAY, ESC D. | IF CAN'T SAY, ESC D. | |__|__|__+ | |__|__|__+ | +------------------------------------+ | | ASK EVERYONE | | +------------------------------------+ +------------------------------------+ | | ASK EVERYONE. | | Q22. Apart from all the things we have +------------------------------------+ | been talking about so far, have you | had any other artificially sweetened | products to eat or drink in the last 7 Q21. Have you had any DIET, LITE, LOW | days? For example, diet or lite CALORIE OR LOW JOULE ICE CREAM WHICH | biscuits, sauces, sports bars, cocoa IS ARTIFICIALLY SWEETENED in the last | based drinks or other diet foods? 7 days? | | IF OTHER, HIGHLIGHT OTHER AND TYPE IN IF NECESSARY SAY: Examples of | RESPONSE artificially sweetened ice creams are | Dairy Bell Lite Polyunsaturated No | BISCUITS......... 1, Added Sugar Ice Cream and Peters | Carbohydrate Modified Ice Cream | SAUCES........... 2, | YES.............. 1 | SPORTS BARS...... 3, | NO............... 2 | COCOA BASED | DRINKS........... 4, CAN'T SAY........ 3 | | OTHER (SPECIFY).. 97, IF HAVE HAD ANY DIET, LITE, LOW | CALORIE OR LOW JOULE ICE CREAM WHICH | CAN'T SAY........ 98, IS ARTIFICIALLY SWEETENED IN THE LAST | 7 DAYS (CODE 1 ON Q21.), ASK: | NONE............. 99, | Q21A. How many scoops of artificially | +------------------------------------+ sweetened ice cream did you consume in | | Now I need to ask you some | the last 7 days? | | questions about your general | | | health. | | +------------------------------------+ IF CAN'T SAY, ESC D. | | Q22A. Are you currently on a diet to |__|__|__+ | lose or control weight? | +------------------------------------+ | YES.............. 1 | ASK EVERYONE. | | +------------------------------------+ | NO............... 2 | Q21B. Have you had any ICE CREAM WHICH | CAN'T SAY........ 3 IS NOT ARTIFICIALLY SWEETENED in the | last 7 days? | Q22B. Are you diabetic? | IF NECESSARY SAY: Examples of non | YES.............. 1 artificially sweetened ice creams are | Dairy Bell Reduced Fat Ice Cream, | NO............... 2 Peters Light and Creamy 97% Fat Free | Ice Cream, Norce Light Prestige Rich | CAN'T SAY........ 3 and Creamy Ice Cream, Streets Blue | Ribbon Light Ice Cream, and all non | IF DIABETIC (CODE 1 ON Q22B), ASK: diet ice creams. Icypoles/ icecreams | are included. | Q22C. Are you on a diet for diabetes? | YES.............. 1 | YES.............. 1 | NO............... 2 | NO............... 2 | CAN'T SAY........ 3 | CAN'T SAY........ 3 CONSUMPTION OF INTENSE SWEETENERS (C) Roy Morgan Research Pty Ltd. 2002.
Consumption of Intense Sweeteners – Australia/New Zealand Page 113
Roy Morgan Research March, 2004
DATE 2-JUN-03 CONSUMPTION OF INTENSE SWEETENERS PAGE 16 ________________________________________________________________________________ IF NOT DIABETIC (CODE 2 OR 3 ON Q22B), | 80-89 Kg (12 ASK: | 1/2-14 1/2 STONES | OR 176-203 Q22D. Are you glucose intolerant? | POUNDS).......... 6 | YES.............. 1 | | 90-99 Kg (14 NO............... 2 | 1/2-16 STONES OR | 204-224 POUNDS).. 7 CAN'T SAY........ 3 | | IF GLUCOSE INTOLERANT (CODE 1 ON | 100-109 Kg (16 Q22D), ASK: | -17 1/2 STONES OR | 225-245 POUNDS).. 8 Q22E. Are you on a diet for impaired | glucose tolerance? | 110-119 Kg (17 | 1/2-19 STONES OR YES.............. 1 | 246-266 POUNDS).. 9 | NO............... 2 | 120 Kg Or More | (19 STONES OR 266 CAN'T SAY........ 3 | POUNDS OR MORE).. 10 | Q23. Could you tell me your current | (DO NOT READ) weight in KILOGRAMS please? | CAN'T SAY........ 11 IF NECESSARY SAY: All of the | information you provide is | SIZE confidential and will be used for | research purposes only. Your weight is | 39 KG OR LESS.... 1 needed to calculate a Body Mass Index | for you. | 40-49 KG......... 2 IF RESPONDENT DOES NOT KNOW WEIGHT, | SAY: Are you able to go and weigh | 50-59 KG......... 3 yourself now please? | | 60-69 KG......... 4 INTERVIEWER NOTE: IF RESPONDENT CAN | ONLY GIVE WEIGHT IN STONES AND POUNDS, | 70-79 KG......... 5 ESC H FOR WEIGHT1 (4 TO 22 STONES) OR | WEIGHT2 (23 STONES OR MORE), AND ENTER | 80-89 KG......... 6 WEIGHT IN KILOGRAMS. | | 90-99 KG......... 7 IF CAN'T SAY, ESC D. | IF REFUSED, ESC D. | 100-109 KG....... 8 | |__|__|__+ | 110-119 KG....... 9 | IF CAN'T SAY WEIGHT IN KILOGRAMS (CODE | 120 KG OR MORE... 10 300 ON Q23), ASK: | | +------------------------------------+ Q23B. Would you say your weight is | | ASK EVERYONE | approximately... | +------------------------------------+ READ OUT. | | Q24. Could you tell me your height in 39 Kg Or Less (6 | CENTIMETRES please? IF NECESSARY, SAY: STONES OR LESS OR | You may give your height in feet and 84 POUNDS OR | inches, we can convert it. LESS)............ 1 | INTERVIEWER NOTE: IF RESPONDENT CAN | ONLY GIVE HEIGHT IN FEET AND INCHES, 40-49 Kg (6 1/2-7 | ESC H FOR HEIGHT, AND ENTER HEIGHT IN 1/2 STONES OR | CENTIMETRES. 85-111 POUNDS)... 2 | | IF CAN'T SAY, ESC D. 50-59 Kg (8-9 1/2 | STONES OR 112-126 | |__|__|__+ POUNDS).......... 3 | | +------------------------------------+ 60-69 Kg (9 | | BMI IS CALCULATED USING WEIGHT IN | 1/2-11 STONES OR | | KILOGRAMS GIVEN ON Q23, OTHERWISE | 127-154 POUNDS).. 4 | | THE MIDPOINT IS TAKEN FROM THE | | | RANGE GIVEN ON Q23B. BMI IS NOT | 70-79 Kg (11 -12 | | CALCULATED IF EITHER HEIGHT OR | 1/2 STONES OR | | WEIGHT IS UNKNOWN. | 155-175 POUNDS).. 5 | +------------------------------------+ CONSUMPTION OF INTENSE SWEETENERS (C) Roy Morgan Research Pty Ltd. 2002.
Consumption of Intense Sweeteners – Australia/New Zealand Page 114
Roy Morgan Research March, 2004
DATE 2-JUN-03 CONSUMPTION OF INTENSE SWEETENERS PAGE 17 ________________________________________________________________________________ IF BMI DOES NOT FALL INTO REALISTIC | RETIRED.......... 3 RANGE, SAY: | | +------------------------------------+ | STUDENT.......... 4 | Can I just check those details | | | please? | | | | | NON-WORKER....... 5 | PLEASE GO BACK AND CHECK PERSON'S | | | HEIGHT AND WEIGHT. | | HOME DUTIES...... 6 | PLEASE ENSURE THAT WEIGHT IS | | | ENTERED IN KILOGRAMS AND HEIGHT IS | | +------------------------------------+ | ENTERED IN CENTIMETRES. | | | ASK EVERYONE | +------------------------------------+ | +------------------------------------+ | DIARY ELIGIBILITY | QOCC. What is your (was your last) | occupation - the position and ELIGIBLE FOR | industry? DIARY............ 1 | | 1: Professional INELIGIBLE FOR | 2: Owner or Executive DIARY............ 2 | 3: Owner of Small Businesses | 11: Sales +------------------------------------+ | 12: Semi-Professional | DIARY ELIGIBILITY IS DETERMINED BY | | 4: Other White Collar | THE AMOUNT OF DIET SOFT DRINK, | | 5: Skilled | DIET CORDIAL AND ARTIFICIAL | | 6: Semi-Skilled | SWEETENERS CONSUMED BY THE | | 7: Unskilled | RESPONDENT, COMPARED TO THEIR BODY | | 8: Farm Owner | WEIGHT. ALL RESPONDENTS WHO ARE | | 9: Farm Worker | DIABETIC OR GLUCOSE INTOLERANT | | 10: No Occupation | (CODE 1 ON Q22B OR CODE 1 ON Q22D) | | | ARE AUTOMATICALLY ELIGIBLE FOR THE | | |__|__+ | DIARY. | | +------------------------------------+ | QINC. Would you mind telling me your | approximate personal annual income +------------------------------------+ | from all sources before tax? | Lastly, to make sure we have | | IF CANT SAY:Well what's your best | interviewed a true cross-section | | guess? | of people, I'd like to ask you a | | | few more questions about yourself. | | LESS THAN $5,999. 1 +------------------------------------+ | | $6,000-$9,999.... 2 VQ18. Are you now in paid employment? | | $10,000-$14,999.. 3 IF YES, ASK: Is that FULL-time for 35 | hours or more a week, PART-time, or | $15,000-$19,999.. 4 CASUAL? | | $20,000-$24,999.. 5 YES, FULL-TIME... 1 | | $25,000-$29,999.. 6 YES, PART-TIME... 2 | | $30,000-$34,999.. 7 YES, CASUAL...... 3 | | $35,000-$39,999.. 8 NO............... 4 | | $40,000-$44,999.. 9 IF NOT EMPLOYED (CODE 4 ON VQ18) ASK: | | $45,000-$49,999.. 10 VQ18A. Are you now looking for a paid | job? | $50,000-$59,999.. 11 | IF LOOKING, ASK: A full-time job for | $60,000-$69,999.. 12 35 hours or more a week, or a | part-time job? | $70,000-$79,999.. 13 | IF NOT LOOKING, ASK: Are you retired, | $80,000-$89,999.. 14 a student, a non-worker or home | duties? | $90,000-$99,999.. 15 | LOOKING FOR | $100,000 OR MORE. 16 FULL-TIME........ 1 | | CAN'T SAY........ 17 LOOKING FOR | PART-TIME........ 2 | REFUSED.......... 18 CONSUMPTION OF INTENSE SWEETENERS (C) Roy Morgan Research Pty Ltd. 2002.
Consumption of Intense Sweeteners – Australia/New Zealand Page 115
Roy Morgan Research March, 2004
DATE 2-JUN-03 CONSUMPTION OF INTENSE SWEETENERS PAGE 18 ________________________________________________________________________________ ***> IF CAN'T SAY OR REFUSED ANNUAL | GREECE........... 4 INCOME (CODES 17 OR 18 IN QINC), ASK: | | ITALY............ 5 QINC2. Well could you tell me whether | your income before tax would be over | OTHER EUROPE..... 6 $50,000 or under $50,000 per annum? | | NEW ZEALAND...... 7 UNDER $50,000.... 1 | | ENGLAND/ $50,000 OR MORE.. 2 | SCOTLAND/ U.K.... 8 | CAN'T SAY........ 3 | U.S.A............ 9 | REFUSED.......... 4 | AFRICA........... 10 | +------------------------------------+ | MIDDLE EAST...... 11 | ASK EVERYONE. | | +------------------------------------+ | PACIFIC ISLANDS.. 12 | VQ15. What is the highest level of | SOUTH AMERICA.... 13 education you have completed? | | OTHER (SPECIFY).. 14 READ OUT. | | IF BORN IN AUSTRALIA (CODE 1 ON Q25), No Formal | ASK: Schooling........ 1 | | Q26. Are you of Aboriginal or Torres Primary School... 2 | Strait Islander origin? | Some Secondary | NO............... 1 School (School | Certificate, | YES, ABORIGINAL.. 2 Leaving | Certificate)..... 3 | YES, TORRES | STRAIT ISLANDER.. 3 Completed | Secondary School | YES, BOTH (H.S.C./ V.C.E./ | ABORIGINAL AND Matric Etc)...... 4 | TORRES STRAIT | ISLANDER......... 4 Trade Or | Technical | CAN'T SAY........ 5 Qualification (eg | TAFE)............ 5 | IF BORN IN NZ (CODE 7 ON Q25), ASK: | University/ | Q26A. Are you descended from a NZ C.A.E. Diploma, | Maori, (that is, did you have a NZ Degree Or Higher | Maori birth parent, grand parent or Degree........... 6 | great grand parent etc)? | (DO NOT READ) | YES.............. 1 REFUSED.......... 7 | | NO............... 2 Q25. Would you mind telling me in | which country were you born? | CAN'T SAY........ 3 | IF OTHER, HIGHLIGHT OTHER AND TYPE IN | Q26B. Do you belong to a Pacific RESPONSE | Islander ethnic group? | AUSTRALIA........ 1 | YES.............. 1 | ASIA............. 2 | NO............... 2 | CANADA........... 3 | CAN'T SAY........ 3 CONSUMPTION OF INTENSE SWEETENERS (C) Roy Morgan Research Pty Ltd. 2002.
Consumption of Intense Sweeteners – Australia/New Zealand Page 116
Roy Morgan Research March, 2004
DATE 2-JUN-03 CONSUMPTION OF INTENSE SWEETENERS PAGE 19 ________________________________________________________________________________ IF ELIGIBLE FOR DIARY, ASK: | May I have your suburb? | Q44. As part of this important study, | |_|_|_|_|_|_|_|_|_+ Food Standards Australia New Zealand | would like to know a little more | information about the food and drink | +------------------------------------+ consumption of people like yourself. | | TOWN AND POSTAL AREA WILL NOT BE | We would appreciate it very much if | | ASKED IN AUSTRALIA | you could complete a diary over 7 days | +------------------------------------+ about the food and beverages that you | consume in that period. We will send | you this diary. | What is the name of your town or city? After 7 days please return the diary | in the reply paid envelope. | |_|_|_|_|_|_|_|_|_+ To thank you for your time and effort | we will send you $25 once we receive | your completed diary. | What is the name of your postal area IF REFUSES, OR WANTS MORE INFORMATION | (if any)? SAY: Food Standards Australia New | Zealand is a %1056,/Commonwealth// | |_|_|_|_|_|_|_|_|_+ Government agency responsible for | developing food standards. The survey | will measure how much people are | And your postcode? eating of different food and drink | products. This information will help | Food Standards Australia New Zealand | IF DON'T KNOW THEN "ESCAPE D" to review current food standards and | to ensure that the health of consumers | |__|__|__|__+ is being safeguarded. The information | you provide is very important and will | Can I confirm your name, address and be used for research purposes only. | telephone details are correct? IF STILL REFUSES, CODE AS REFUSED. | READ OUT DETAILS | ACCEPTED DIARY... 1 | TITLE:...................%381. | FIRST NAME:..............%382. REFUSED DIARY.... 2 | LAST NAME:...............%383. | STREET NUMBER & NAME:....%384. IF ACCEPTED DIARY (CODE 1 ON Q44), | SUBURB:..................%385. ASK: | POSTCODE:................%388. | +------------------------------------+ | CHANGE TITLE..... 1, | May I have your name and your full | | | postal address so we can send the | | CHANGE FIRST NAME 2, | diary out to you? | | | | | CHANGE LAST NAME. 3, | I remind you that this information | | | will only be used for research | | CHANGE STREET.... 4, | purposes. | | | | | CHANGE SUBURB.... 5, | HIT RETURN TO RECORD NAME AND | | | ADDRESS | | CHANGE POSTCODE.. 6, +------------------------------------+ | | ALL DETAILS May I have your title please? (MR, | CORRECT.......... 10, MRS, MS, DR, etc) | | +------------------------------------+ |__|__|__|__|__|__+ | | Is the number I called the best | | | number to reach you after hours? | May I have your first name or initial? | | IF NO, ASK: What number would be | | | best to reach you after hours? | |_|_|_|_|_|_|_|_|_+ | | ESC T TO ENTER NEW NUMBER | | +------------------------------------+ May I have your last name? | | +------------------------------------+ |_|_|_|_|_|_|_|_|_+ | | We will send you the diary in the | | | next few days. In the meantime, if | May I have your street number and name | | you have any questions, please | please? | | call Amy Helme of Roy Morgan | | | Research on 1800 700 086. | |_|_|_|_|_|_|_|_|_+ | +------------------------------------+ CONSUMPTION OF INTENSE SWEETENERS (C) Roy Morgan Research Pty Ltd. 2002.
Consumption of Intense Sweeteners – Australia/New Zealand Page 117
Roy Morgan Research March, 2004
DATE 2-JUN-03 CONSUMPTION OF INTENSE SWEETENERS PAGE 20 ________________________________________________________________________________ +------------------------------------+ | +------------------------------------+ | Thank you for your time and | | | END-OF-QUESTIONNAIRE | | assistance. This market research | | +------------------------------------+ | is carried out in compliance with | | | the Privacy Act, and the | | | information you provided will be | | | used only for research purposes. | | | | | | (We are conducting this research | | | on behalf of FOOD STANDARDS | | | AUSTRALIA NEW ZEALAND.) | | | | | | If you would like any more | | | information about this project or | | | Roy Morgan Research, you can phone | | | us on 1800 700 086. | | +------------------------------------+ | CONSUMPTION OF INTENSE SWEETENERS (C) Roy Morgan Research Pty Ltd. 2002.
Consumption of Intense Sweeteners – Australia/New Zealand Page 118
Roy Morgan Research March, 2004
Appendix 2: Diary Measurements by Product Groups SOFT DRINKS
Large Glass: 400ml
Medium Glass: 300ml
Small Glass: 200ml
Standard Can: 375ml
CORDIALS, FRUIT FLAVOURED POWDERS AND SYRUPS (made-up amount)
Large Glass: 400ml
Medium Glass: 300ml
Small Glass: 200ml
SPORTS, ENERGY AND WEIGHT MANAGEMENT PRODUCTS (made-up amount)
Large Glass: 400ml
Medium Glass: 300ml
Small Glass: 200ml
FLAVOURED MILK
Large Glass: 400ml
Medium Glass: 300ml
Small Glass: 200ml
1 small carton: 375ml
1 large carton: 600ml
Consumption of Intense Sweeteners – Australia/New Zealand Page 119
Roy Morgan Research March, 2004
CHOCOLATE, COCOA, CAPPUCINO DRINK BASES
1 sachet: 2 heaped teaspoons
CHEWING GUM
1 pellet/tab: 1 piece
CHOCOLATE BASED CONFECTIONERY
1 bar: 5 piece
1 small block: 7 pieces
CANNED FRUIT, INCLUDING FRUIT IN TUBS
135g tub: 1 serve
400g can: 3 serves
FLAVOURED YOGHURT/MOUSSES
200g tub: 5 heaped dessert spoons
40g: 1 heaped dessert spoon
TABLETOP AND SPOON FOR SPOON INTENSE SWEETENERS
1 teaspoon: 1 sachet/tablet/drop
Consumption of Intense Sweeteners – Australia/New Zealand Page 120
Roy Morgan Research March, 2004
Appendix 3: Letter Sent to Diary Acceptors February 2003
Dear survey respondent
Recently you agreed to participate in a survey of the foods and drinks you consume. Roy Morgan Research, on behalf of Food Standards Australia New Zealand (FSANZ), is conducting this survey in New Zealand and in all States and Territories of Australia.
FSANZ is a binational, statutory body which helps protect the health and safety of people in Australia and New Zealand through the maintenance of a safe food supply. The information gained from this survey will help FSANZ to review the effectiveness of food standards in Australia and New Zealand.
This survey collects information on the amount and types of intense sweeteners that are consumed by Australians and New Zealanders, aged 12 years and above. Intense sweeteners – also known as artificial sweeteners - include saccharin, cyclamate, aspartame, sucralose, acesulphame potassium, alitame, neotame and thaumatin.
The information you provide will be treated in strict confidence, and there is no way you will be identified from your individual responses. If you are interested, you will be able to read a report from the study published on FSANZ’s website (www.foodstandards.gov.au) in 2003.
You should have received in this package a seven day consumption diary and a reply paid envelope. Be sure to complete the diary carefully as it is essential you return an accurate record of what you have eaten and drunk from the categories listed. All those who return a completed diary will receive a cheque for $25 and will enter a draw to win a prize with a value of $4,000.
Should you require further information on the survey, please contact, Dr Judy Cunningham at FSANZ’s Canberra office (02 6271 2213) or Roy Morgan Research toll free on 1800 700 086. You will also find information about the survey on FSANZ’s website. Thank you for your cooperation in this important survey.
Yours sincerely,
Gary C. Morgan EXECUTIVE CHAIRMAN
Consumption of Intense Sweeteners – Australia/New Zealand Page 121
Roy Morgan Research March, 2004
Appendix 4: Number of Respondents by Key Demographics (Unweighted)
TOTAL Australia New Zealand
Demographics
Screener sample
(n=3,529)
Diary sample (n=400)
Screener sample
(n=2,514)
Diary sample (n=263)
Screener sample
(n=1,015)
Diary sample (n=137)
Gender
Male Female
1,362 2,167
116 284
996
1518
74 189
366 649
42 95
Age (years)
12-17 18-24 25-39 40-59 60+
308 308 959
1,092 862
48 25 97 109 121
220 229 682 791 592
29 13 67 73 81
88 79 277 301 270
19 12 30 36 40
Weight control diet
Yes No
443
3,086
107 293
307
2,207
75 188
136 879
32 105
Medical condition requiring low sugar diet
Diabetes Impaired glucose tolerance None
146 61
3,322
76 35 289
92 41
2,381
45 22 196
54 20 941
31 13 93
Body Mass Index (BMI)*
Underweight (<20) Acceptable (20-25) Overweight (26-30) Obese (>30) No answer
446
1,822 846 366 49
41 193 107 54 5
338
1,136 584 250 26
28 131 67 34 3
108 506 262 116 23
13 62 40 20 2
Note: * BMI classifications as used by the World Health Organization.
Consumption of Intense Sweeteners – Australia/New Zealand Page 122
Roy Morgan Research March, 2004
Appendix 4 (Cont’d.): Number of Respondents by Key Demographics (Unweighted)
TOTAL Australia New Zealand
Demographics
Screener sample
(n=3,529)
Diary sample (n=400)
Screener Sample
(n=2,514)
Diary sample (n=263)
Screener sample
(n=1,015)
Diary sample (n=137)
Country of birth
Australia New Zealand Europe Other
2,017 868 409 235
210 123 45 22
1,999
48 293 174
210 6
32 15
18 820 116 61
-
117 13 7
Ethnicity Aboriginal/
Torres Strait Islanders Other Australian Residents Maori/ Pacific Islander Other New Zealand Residents
37 2,477 142 873
5 258 21 116
37 2,477
- -
5 258
- -
- -
142 873
- -
21 116
Education
Some primary Some secondary Some tertiary No answer/None
135
1,935 1,429
30
20 230 147 3
75
1,379 1,047
13
6
150 107
-
60 556 382 17
14 80 40 3
Respondent income (AUD/NZD) Under $25,000 $25,000-$39,999 $40,000+
1,274 462
1,793
169 41 190
945 318
1,251
115 27 121
329 144 542
54 14 69
Respondent occupation
Professional/managerial White collar Blue collar Unskilled None
658
1,237 1,073 176 385
70 137 123 20 50
449 967 688 128 282
46 96 75 13 33
209 270 385 48 103
24 41 48 7
17
Geographical location City Non -City
2,169 1,360
261 139
1,544 970
172 91
625 390
89 48
Consumption of Intense Sweeteners – Australia/New Zealand Page 123
Roy Morgan Research March, 2004
Appendix 5: Percentage of Survey Population Consuming from Product Groups by Demographic Sub-Group (Screener Survey)
Sample size n= 3,529 Total % Country % Gender % Gender by Country % Age (years) %
Consumption of Intense Sweeteners – Australia/New Zealand Page 124
Roy Morgan Research March, 2004
Sample size n= 3,529 Total % Country % Gender % Gender by Country % Age (years) %
Australia New Zealand
Male Female AUS Male
NZ Male
AUS Female
NZ Female
12-17 a
18-24 b
25-39 c
40-59 d
60+ e
Jam or conserve S
IS
46
5
45
5
49*
7*
47
5
44
5
46
4
50
8
44
5
47
7
34
5
33
4
b 40
4
a,b,c 50
4
a,b,c,d 60
b,c,d 8
Flavoured milk S
IS
24
3
23
3
30*
4
28*
3
20
3
27
2
34*
5*
18
3
27*
3
b,c,d,e 53 d,e 6
c,d,e 44 d,e 5
d,e 25 d,e 4
e 16
2
7
2
Canned fruit S
IS
25
3
24
3
27
6*
24
2
25
4
23
2
27
5*
25
3
27
7*
22
2
19
1
22
b 4
b,c 26
3
a,b,c,d 31
a,b,d 5
Toppings S
IS
9
1
9
1
9
1
11
1
7
1
11
1
8
1
7
1
9
2
b,c,d,e 17
c 2
e 10
c 2
d,e 10
0
7 c 1
5 c 2
Ice cream S
IS
48
7
49
7
48
7
51*
5
46
8*
50
6
54
5
47*
8
41
9
b,c,d,e 62
8
e 52
7
48
5
46
6
44 c,d 10
Note: 1. Base: Total screener survey – Australia and New Zealand. 2. S = containing sugar, IS = containing intense sweetener. 3. Above findings are based on weighted data. 4. Unless otherwise stated, values are for the Combined Australian and New Zealand populations. 5. Significant Differences are marked with an * for demographic variables with only two sub-groups and by letters in italics for variables with multiple sub-groups. The letters represent the sub-groups which are significantly lower.
Consumption of Intense Sweeteners – Australia/New Zealand Page 125
Roy Morgan Research March, 2004
Appendix 5 (cont’d): Percentage of Survey Population Consuming from Product Groups by Demographic Sub-Group (Screener Survey)
Sample size n= 3,529 Total % Diabetes % Glucose Tolerance % Weight Control Diet % Body Mass Index (BMI) %
Consumption of Intense Sweeteners – Australia/New Zealand Page 126
Roy Morgan Research March, 2004
Sample size n= 3,529 Total % Diabetes % Glucose Tolerance % Weight Control Diet % Body Mass Index (BMI) %
Diabetic Not Diabetic
Impaired Glucose
Tolerance
Glucose Tolerant
On Weight control diet
Not on Weight
control diet
<20 Under
a
20-25 Acceptable
b
26-30 Over
c
>30 Obese
d
Jelly/milk based pudding S
IS
9
3
6
8*
9
3
11
8*
9
3
7
7*
10
2
11
2
9
2
11
3
8 b 4
Jam or conserve S
IS
46
5
33
26*
46*
4
45
-
46
5
35
11*
47*
4
39
5
a,d 48
5
a 47
4
41 b,c 8
Flavoured milk S
IS
24
3
10
8*
24*
3
26
3
24
3
20
5*
24
3
b,c,d 34
c 4
22
3
22
2
23
c 5
Canned fruit S
IS
25
3
16
11*
25*
3
23
10*
25
3
23
7*
25
3
19
2
a 26
2
a,d 27
b 4
21 abb
5 Toppings
S
IS
9
1
1
3*
9*
1
4
-
9
1
4
2
10*
1
10
1
c 10
1
7
1
8
1
Ice cream S
IS
48
7
26
22*
49*
6
49
10
48
7
35
14*
50*
6
b,c,d 55
7
47
6
47
7
47
b 9
Note: 1. Base: Total screener survey – Australia and New Zealand. 2. S = containing sugar, IS = containing intense sweetener. 3. Above findings are based on weighted data. 4. Unless otherwise stated, values are for the Combined Australian and New Zealand populations. 5. Significant Differences are marked with an * for demographic variables with only two sub-groups and by letters in italics for variables with multiple sub-groups. The letters represent the sub-groups which are significantly lower.
Consumption of Intense Sweeteners – Australia/New Zealand Page 127
Roy Morgan Research March, 2004
Appendix 5 (cont’d): Percentage of Survey Population Consuming from Product Groups by Demographic Sub-Group (Screener Sample)
Sample size (n=3,529) Total % Location % Country of Birth % Ethnic Origin
Consumption of Intense Sweeteners – Australia/New Zealand Page 128
Roy Morgan Research March, 2004
Sample size (n=3,529) Total % Location % Country of Birth % Ethnic Origin
(Australian sample) % Ethnic Origin
(New Zealand sample) %
City Non-City Australia
a
New Zealand
b
Europe c
Elsewhere
d
Aboriginal/ Torres Strait
Islander
Other Maori/ Pacific
Islander
Other
Jelly/milk based pudding S
IS
9
3
9
3
10
3
9 c 3
11
c 3
12
1
9
2
13
3
9
3
13
4
11
2
Jam or conserve S
IS
46
5
45
5
46
5
44
5
48
a 7
a 54
5
47
4
34
3
45
5
42
6
50
7
Flavoured milk S
IS
24
3
24
3
24
3
c,d 25
c 3
a,c,d 30
c 4
16
1
17
2
32
15*
22
3
36
6
29
3
Canned fruit S
IS
25
3
25
3
24
3
d 24
3
a,d 28 a,d 6
a,d 30
4
14
2
14
3
24
3
26
4
28
6
Toppings S
IS
9
1
8
1
10
1
d 10
1
8
1
7
1
5
0
6
-
9
1
10
-
8
2
Ice cream S
IS
48
7
48
7
49
6
49
7
47
7
46
7
49
6
39
3
49
7
49
6
47
7
Note: 1. Base: Total screener survey – Australia and New Zealand. 2. S = containing sugar, IS = containing intense sweetener. 3. Above findings are based on weighted data. 4. Unless otherwise stated, values are for the Combined Australian and New Zealand populations.
Consumption of Intense Sweeteners – Australia/New Zealand Page 129
Roy Morgan Research March, 2004
Appendix 5 (cont’d): Percentage of Survey Population Consuming from Product Groups by Demographic Sub-Group (Screener Survey)
Sample size (n=3,529) Total Education Level % Respondent Income % Respondent Occupation %
Consumption of Intense Sweeteners – Australia/New Zealand Page 130
Roy Morgan Research March, 2004
Sample size (n=3,529) Total Education Level % Respondent Income % Respondent Occupation %
Primary a
Secondary b
Tertiary c
<$25,000 a
$25,000 - $39,999
b
$40,000+ c
Prof / Mgr
a
White collar
b
Blue collar
c
Unskilled d
No Occ..
e
Jelly/milk based pudding S
IS
9
3
b,c 18
c 6
10
3
8
2
11
3
8
3
9
2
8
2
9
2
9
3
12
3
11
3
Jam or conserve S
IS
46
5
41
c 10
44
c 6
b 48
4
44
5
42
5
a,b 48
5
e 48
4
e 47
4
e 46
b 6
44
3
37
5
Flavoured milk S
IS
24
3
25
3
c 28
3
18
3
c 27
4
c 28
3
21
3
18
2
20
3
a,b 25
3
b 28
2
a,b,c,d 41
5
Canned fruit S
IS
25
3
19
1
26
3
24
3
23
3
22
3
26
3
26
4
24
3
24
3
b,c,e 32
2
21
3
Toppings S
IS
9
1
8
1
9
1
9
1
10
c 2
10
1
8
1
8
1
8
2
10
1
11
-
a,b 13
2
Ice cream S
IS
48
7
57
6
48
7
48
6
48 b,c 8
49
4
49
6
50
5
48
a 8
45
6
48
6
b,c 55
a 9
Note: 1. Base: Total screener survey – Australia and New Zealand. 2. S = containing sugar, IS = containing intense sweetener. 3. Above findings are based on weighted data. 4. Unless otherwise stated, values are for the Combined Australian and New Zealand populations.
Consumption of Intense Sweeteners – Australia/New Zealand Page 131
Roy Morgan Research March, 2004
Appendix 6: Mean Consumption of Carbonated Soft Drinks (ml per day) by Demographic Sub-Group (Screener Survey)
Demographics Total Country Gender Gender by Country Age (years)
Australia New Zealand
Male Female AUS Male
NZ Male
AUS Female
NZ Female
12-17 a
18-24 b
25-39 c
40-59 d
60+ e
Mean – All Respondents S
IS
130±264
80±244
130
80
131
79
174*
78
88
82
174
79
174
70
87
80
91
87
d,e 170
e 72
a,c,d,e 254
e 84
d,e 166 Abe 99
e 91
e 83
56
52
Mean - Consumers S
IS
257±324
294±396
259
293
247
302
302*
331*
200
267
304
334
288
311
201
262
197
295
218
179
a,d,e 340
a 274
a,d,e 286
a 348
221
a 317
200
a 286
Demographics Diabetes Glucose Tolerance Weight Control Diet Body Mass Index (BMI)
Diabetic Not Diabetic
Impaired Glucose
Tolerance
Glucose Tolerant
On Weight control diet
Not on Weight
control diet
<20 Under
a
20-25 Acceptable
b
26-30 Over
c
>30 Obese
d
Mean – All Respondents S
IS
36
299*
134*
72
74
71
131
80
67
159*
139*
69
139
43
122
a 68
138
a,b 100
148 a,b,c 140
Mean - Consumers S
IS
185
494*
258
277
245
235
257
295
224
330
259
285
222
173
242
a 295
a,b 302
a 308
a,b 314
a 346
Note: 1. Base: Total screener survey – Australia and New Zealand. 2. The ± figure is the overall Standard Deviation of the mean. 3. S = containing sugar, IS = containing intense sweetener. 4. Above findings are based on weighted data. 5. Unless otherwise stated, values are for the Combined Australian and New Zealand populations. 6. Significant Differences are marked with an * for demographic variables with only two sub-groups and by letters in italics for variables with multiple sub-groups. The letters represent the sub-groups which are significantly lower.
Consumption of Intense Sweeteners – Australia/New Zealand Page 132
Roy Morgan Research March, 2004
Appendix 6 (Cont’d): Mean Consumption of Carbonated Soft Drinks (ml per day) by Demographic Sub-Group (Screener Survey)
Demographics Total Country of Birth Ethnic Origin (AUS sample) Ethnic Origin (NZ sample)
Australia a
New Zealand b
Europe c
Elsewhere d
Aboriginal / Torres Strait
Islander
Other Maori / Pacific
Islander
Other
Mean – All Respondents S
IS
130±264
80±244
c,d 139
80
c,d 135
84
96
81
86
65
249*
55
128
80
228*
121*
114
71
Mean - Consumers S
IS
257±324
294±396
d 267
285
d 258
317
232
337
188
277
347
196
257
294
335*
354
226
289
Demographics Education Level Respondent Income Respondent Occupation Location
Primary a
Secondary b
Tertiary c
<$25,000 a
$25,000 - $39,999
b
$40,000+ c
Prof/ Mgr
a
White Collar
b
Blue Collar
c
Unskilled d
No occ. e
City
Non-City
Mean – All Respondents S
IS
103
46
a,c 144
a 85
114
a 76
134
73
c 152
87
122
82
99
e 88
113
e 81
a,b 157
e 85
a,b 159
71
a,b 148
54
128
86*
134
70
Mean - Consumers S
IS
187
204
a,c 275
a 307
239
a 285
248
262
281
321
257
a 311
240
e 320
231
e 276
a,b,e 312
b,e 364
260
e 275
223
179
249
301
272
282
Note: 1. Base: Total screener survey – Australia and New Zealand. 2. The ± figure is the overall Standard Deviation of the mean. 3. S = containing sugar, IS = containing intense sweetener. 4. Above findings are based on weighted data. 5. Unless otherwise stated, values are for the Combined Australian and New Zealand populations. 6. Significant Differences are marked with an * for demographic variables with only two sub-groups and by letters in italics for variables with multiple sub-groups. The letters represent the sub-groups which are significantly lower.
Consumption of Intense Sweeteners – Australia/New Zealand Page 133
Roy Morgan Research March, 2004
Appendix 7: Mean Consumption of Cordials (ml per day) by Demographic Sub-Group (Screener Survey)
Demographics Total Country Gender Gender by Country Age (years)
Australia New Zealand
Male Female AUS Male
NZ Male
AUS Female
NZ Female
12-17 a
18-24 b
25-39 c
40-59 d
60+ e
Mean – All Respondents S
IS
79±228
20±106
81*
20
66
22
94*
24*
64
17
98*
24
71
27
65
17
61
18
d,e 128
e 29
d,e 111
21
d,e 115
e 26
e 54
18
27
12
Mean - Consumers S
IS
281±359
259±282
283
256
270
272
308*
311*
251
209
313
312
275
309
248
205
264
231
d,e 299
210
d,e 280
217
b,d,e 344
288
225
275
203
272
Demographics Diabetes Glucose Tolerance Weight Control Diet Body Mass Index (BMI)
Diabetic Not Diabetic
Impaired Glucose
Tolerance
Glucose Tolerant
On Weight control diet
Not on Weight
control diet
<20 Under
a
20-25 Acceptable
b
26-30 Over
c
>30 Obese
d
Mean – All Respondents S
IS
10
50*
81*
19
69
7
79
21*
50
30*
83*
19
c 91
21
c 86
18
60
22
71
27
Mean - Consumers S
IS
120
275
283*
257
337
139
280
260*
251
223
284
268
258
257
c,d 307
261
251
260
247
248
Note: 1. Base: Total screener survey – Australia and New Zealand. 2. The ± figure is the overall Standard Deviation of the mean. 3. S = containing sugar, IS = containing intense sweetener. 4. Above findings are based on weighted data. 5. Unless otherwise stated, values are for the Combined Australian and New Zealand populations. 6. Significant Differences are marked with an * for demographic variables with only two sub-groups and by letters in italics for variables with multiple sub-groups. The letters represent the sub-groups which are significantly lower.
Consumption of Intense Sweeteners – Australia/New Zealand Page 134
Roy Morgan Research March, 2004
Appendix 7 (Cont’d): Mean Consumption of Cordials (ml per day) by Demographic Sub-Group (Screener Survey)
Demographics Total Country of Birth Ethnic Origin (AUS sample) Ethnic Origin (NZ sample)
Australia a
New Zealand b
Europe c
Elsewhere d
Aboriginal / Torres Strait
Islander
Other Maori / Pacific
Islander
Other
Mean – All Respondents S
IS
79±228
20±106
c,d 90
19
c,d 75 a,c 29
d 51
14
22
30
193*
9
80
20
126*
37
55
20
Mean - Consumers S
IS
281±359
259±282
c,d 293
240
c,d 289
304
219
212
160
388
410
181
280
257
396*
318
239
259
Demographics Education Level Respondent Income Respondent Occupation Location
Primary a
Secondary b
Tertiary c
<$25,000 a
$25,000 - $39,999
b
$40,000+ c
Prof/ Mgr
a
White Collar
b
Blue Collar
c
Unskilled d
No occ. e
City Non-City
Mean – All Respondents S
IS
80
35
83
18
73
22
84
21
69
26
78
19
56
19
a 74
18
a 85
22
a,b 139
19
a 88
27
73
21
89*
19
Mean - Consumers S
IS
277
229
284
224
278
a 321
271
239
259
312
295
259
233
334
272
e 239
a 308
276
a,e 407
291
249
205
267
246
304
287
Note: 1. Base: Total screener survey – Australia and New Zealand. 2. The ± figure is the overall Standard Deviation of the mean. 3. S = containing sugar, IS = containing intense sweetener. 4. Above findings are based on weighted data. 5. Unless otherwise stated, values are for the Combined Australian and New Zealand populations. 6. Significant Differences are marked with an * for demographic variables with only two sub-groups and by letters in italics for variables with multiple sub-groups. The letters represent the sub-groups which are significantly lower.
Consumption of Intense Sweeteners – Australia/New Zealand Page 135
Roy Morgan Research March, 2004
Appendix 8: Mean Consumption of Fruit Drinks (ml per day) by Demographic Sub-Group (Screener Survey)
Demographics Total Country Gender Gender by Country Age (years)
Australia New Zealand
Male Female AUS Male
NZ Male
AUS Female
NZ Female
12-17 a
18-24 b
25-39 c
40-59 d
60+ e
Mean – All Respondents S
IS
46±126
4±28
41
3
75*
9*
51*
2
42
5*
46
2
81*
6*
36
3
70*
11*
c,d,e 64
6
a,c,d,e 99
2
d,e 48
3
e 36
3
24
4
Mean - Consumers S
IS
200±194
141±107
198
124
209
180*
219*
128
182
148
217
113
224
162
178
130
194
191*
156
123
a,c,d,e 267
102
a 207
160
182
132
199
b 172
Demographics Diabetes Glucose Intolerance Weight Control Diet Body Mass Index (BMI)
Diabetic Not Diabetic
Impaired Glucose
Tolerance
Glucose Tolerant
On weight control diet
Not on weight
control diet
<20 Under
a
20-25 Acceptable
b
26-30 Over
c
>30 Obese
d
Mean – All Respondents S
IS
17
4
48*
3
50
5
46
3
45
3
47
4
b,c 61
5
45
3
42
3
48
4
Mean - Consumers S
IS
140
124
202*
142
187
113
201
142*
193
96
201
148*
193
176
194
137
228
125
193
143
Note: 1. Base: Total screener survey – Australia and New Zealand. Caution: Small base of IS consumers 2. The ± figure is the overall Standard Deviation of the mean. 3. S = containing sugar, IS = containing intense sweetener. 4. Above findings are based on weighted data. 5. Unless otherwise stated, values are for the Combined Australian and New Zealand populations. 6. Significant Differences are marked with an * for demographic variables with only two sub-groups and by letters in italics for variables with multiple sub-groups. The letters represent the sub-groups which are significantly lower.
Consumption of Intense Sweeteners – Australia/New Zealand Page 136
Roy Morgan Research March, 2004
Appendix 8 (Cont’d): Mean Consumption of Fruit Drinks (ml per day) by Demographic Sub-Group (Screener Survey)
Demographics Total Country of Birth Ethnic Origin (AUS sample) Ethnic Origin (NZ sample)
Australia a
New Zealand b
Europe c
Elsewhere d
Aboriginal / Torres Strait
Islander
Other Maori / Pacific
Islander
Other
Mean – All Respondents S
IS
46±126
4±28
42
2
a,c,d 72
a 8
43
4
39
a 7
29
-
41
3*
76
5
75
9
Mean - Consumers S
IS
200±194
141±107
193
124
d 215
a,d 180
d 241
158
169
115
162
-
198
124*
183
135
214
187*
Demographics Education Level Respondent Income Respondent Occupation Location
Primary a
Secondary b
Tertiary c
<$25,000 a
$25,000 - $39,999
b
$40,000+ c
Prof/ Mgr
a
White Collar
b
Blue Collar
c
Unskilled d
No occ. e
City Non-City
Mean – All Respondents S
IS
40
5
48
4
45
3
50
3
44
2
45
4
39
4
39
3
b 48
4
a,b,c 85
2
a,b 59
5
48
4
44
3
Mean - Consumers S
IS
168
158
197
138
207
145
191
113
198
133
209
a 166
194
149
191
117
e 215
b 175
a,b,c,e 311
130
164
122
198
144
205
133
Note: 1. Base: Total screener survey – Australia and New Zealand. Caution: Small base of IS consumers 2. The ± figure is the overall Standard Deviation of the mean. 3. S = containing sugar, IS = containing intense sweetener. 4. Above findings are based on weighted data. 5. Unless otherwise stated, values are for the Combined Australian and New Zealand populations. 6. Significant Differences are marked with an * for demographic variables with only two sub-groups and by letters in italics for variables with multiple sub-groups. The letters represent the sub-groups which are significantly lower.
Consumption of Intense Sweeteners – Australia/New Zealand Page 137
Roy Morgan Research March, 2004
Appendix 9: Mean Consumption of Sugar (grams per day) and Tabletop Intense Sweeteners (grams per day as Sugar equivalents) in Tea, Coffee or Cereals by Demographic Sub-Group (Screener Survey)
Demographics Total Country Gender Gender by Country Age (years)
Australia New Zealand
Male Female AUS Male
NZ Male
AUS Female
NZ Female
12-17 a
18-24 b
25-39 c
40-59 d
60+ e
Mean – All Respondents Sugar
Tabletop IS
11±20
2±9
11*
2
8
2
14*
2
8
2
14*
2
9
2
8
2
7
2
7
0
a 10
a 1
a,b,e 13
a 1
a,e 12
a,b,c 2
a 9
a,b,c,d 5
Mean - Consumers Sugar
Tabletop IS
18±23
18±21
19*
18
15
20
21*
22*
16
16
22*
21
15
26
16
16
14
16
11
5
a 16
7
a,b 19 a,b 15
a 16
a,b,c 20
a 19
a,b,c,d 26
Demographics Diabetes Glucose Intolerance Weight Control Diet Body Mass Index (BMI)
Diabetic Not Diabetic
Impaired Glucose
Tolerance
Glucose Tolerant
On weight control diet
Not on weight
control diet
<20 Under
a
20-25 Acceptable
b
26-30 Over
c
>30 Obese
d
Mean – All Respondents Sugar
Tabletop IS
4
14*
11*
1
9
2
11
2
6
4*
11*
2
8
1
a 11
a 2
a 12 a,b 2
10 a,b 3
Mean - Consumers Sugar
Tabletop IS
16
33*
18
16
14
13
19
19
13
18
19*
19
13
7
a 19
a 19
a 20
a 21
a 19
a 19
Note: 1. Base: Total screener survey – Australia and New Zealand. 2. The ± figure is the overall Standard Deviation of the mean. 3. S = containing sugar, IS = containing intense sweetener. 4. Unless otherwise stated, values are for the Combined Australian and New Zealand populations. 5. Significant Differences are marked with an * for demographic variables with only two sub-groups and by letters in italics for variables with multiple sub-groups. The letters represent the sub-groups which are significantly lower. 6. The measure for tabletop sweeteners is a “sugar equivalent”. Each serve equals 6g, therefore a mean consumption for example of 18g would equate to 3 serves.
Consumption of Intense Sweeteners – Australia/New Zealand Page 138
Roy Morgan Research March, 2004
Appendix 9 (Cont’d): Mean Consumption of Sugar (grams per day) and Tabletop Intense Sweeteners (grams per day as Sugar equivalents) in Tea, Coffee or Cereals by Demographic Sub-Group (Screener Survey)
Demographics Total Country of Birth Ethnic Origin (AUS sample) Ethnic Origin (NZ sample)
Australia a
New Zealand b
Europe c
Elsewhere d
Aboriginal Torres Strait
Islander
Other Maori Pacific
Islander
Other
Mean – All Respondents Sugar
Tabletop IS
11±20
2±9
b 11
2
9
2
b 12
2
11
2
18
2
11
2
10
1
8
2
Mean - Consumers Sugar
Tabletop IS
18±23
18±21
b 19
17
16
21
b 22
22
18
20
25
25
19
18
15
13
15
22
Demographics Education Level Respondent Income Respondent Occupation Location
Primary a
Secondary b
Tertiary c
<$25,000 a
$25,000 - $39,999
b
$40,000+ c
Prof/ Mgr
a
White Collar
b
Blue Collar
c
Unskilled d
No occ. e
Capital cities
Country
Mean – All Respondents Sugar
Tabletop IS
10
2
11
2
10
2
10
2
a 13
2
11
2
e 10
b,d,e 3
e 10
2
a,b,e 14 d,e 2
e 12
1
6
1
10
2*
13*
2
Mean - Consumers Sugar
Tabletop IS
15
16
a 19
19
18
19
17
18
20
15
a 19
19
e 18 b,e 24
e 18
16
a,b,e 22
e 20
e 18
15
10
12
17
19
21*
17
Note: 1. Base: Total screener survey – Australia and New Zealand. 2. The ± figure is the overall Standard Deviation of the mean. 3. S = containing sugar, IS = containing intense sweetener. 4. Unless otherwise stated, values are for the Combined Australian and New Zealand populations. 5. Significant Differences are marked with an * for demographic variables with only two sub-groups and by letters in italics for variables with multiple sub-groups. The letters represent the sub-groups which are significantly lower. 6. The measure for tabletop sweeteners is a “sugar equivalent”. Each serve equals 6g, therefore a mean consumption for example of 18g would equate to 3 serves.
Consumption of Intense Sweeteners – Australia/New Zealand Page 139
Roy Morgan Research March, 2004
Appendix 10: Mean Consumption of Confectionery (grams per day) by Demographic Sub-Group (Screener Survey)
Demographics Total Country Gender Gender by Country Age (years)
Australia New Zealand
Male Female AUS Male
NZ Male
AUS Female
NZ Female
12-17 a
18-24 b
25-39 c
40-59 d
60+ e
Mean – All Respondents S
IS
2±4
1±2
2
1
1
0
2
1
2
1
2*
1
1
0
2*
1
1
0
2
d,e 1
e 2
a,d,e 1
d,e 2
de 1
e 2 e 0
1
0
Mean - Consumers S
IS
3±5
2±3
3
2
3
2
3*
2
3
2
3*
3
3
2
3*
2
2
2
3
2
3 a 2
e 3 a 2
3 a 2
3
3
Demographics Diabetes Glucose Intolerance Weight Control Diet Body Mass Index (BMI)
Diabetic Not Diabetic
Impaired Glucose
Tolerance
Glucose Tolerant
On weight control diet
Not on weight
control diet
<20 Under
a
20-25 Acceptable
b
26-30 Over
c
>30 Obese
d
Mean – All Respondents S
IS
0
0.7*
2*
0.5
1
1
2
1
1
1*
2*
0
b,c,d 2
1
c,d 2
1
1
1
1
1
Mean - Consumers S
IS
2
2
3*
2
2
4
3
2
2
3*
3*
2
c,d 4
2
c 3 a 2
3 a 3
3 a 2
Note: 1. Base: Total screener survey – Australia and New Zealand. 2. The ± figure is the overall Standard Deviation of the mean. 3. S = containing sugar, IS = containing intense sweetener. 4. Unless otherwise stated, values are for the Combined Australian and New Zealand populations. 5. Significant Differences are marked with an * for demographic variables with only two sub-groups and by letters in italics for variables with multiple sub-groups. The letters represent the sub-groups which are significantly lower. 6. Each piece of confectionery consumed has been assigned a value of 1.5g. Therefore a mean consumption for example of 15g would equate to 10 pieces.
Consumption of Intense Sweeteners – Australia/New Zealand Page 140
Roy Morgan Research March, 2004
Appendix 10 (Cont’d): Mean Consumption of Confectionery (grams per day) by Demographic Sub-Group (Screener Survey)
Demographics Total Country of Birth Ethnic Origin (AUS sample) Ethnic Origin (NZ sample)
Australia a
New Zealand b
Europe c
Elsewhere d
Aboriginal / Torres Strait
Islander
Other Maori / Pacific
Islander
Other
Mean – All Respondents S
IS
2±4
1±2
d 2
1
1
1
2
1
1
0
4
1
2
1
2*
1*
1
0
Mean - Consumers S
IS
3±5
2±3
3 d 2
3
2
b,d 3 d 3
3
2
8
2
3
2
3*
2
2
2
Demographics Education Level Respondent Income Respondent Occupation Location
Primary a
Secondary b
Tertiary c
<$25,000 a
$25,000 - $39,999
b
$40,000+ c
Prof/ Mgr
a
White Collar
b
Blue Collar
c
Unskilled d
No occ. e
City Non-City
Mean – All Respondents S
IS
1
1
a 2
1
2
0
c 2
0
c 2 a 1
1
1
1
0
a,d 2
1
a,d 2
1
1
0
a 2
1
2
1
2
0
Mean - Consumers S
IS
2
4
a 3
2
3
2
3
2
3
2
3 a 3
2 e 3
a,d,e 3 d 2
a,b,d,e 4
d,e 3
2
2
3
2
3
2
3
2
Note: 1. Base: Total screener survey – Australia and New Zealand. 2. The ± figure is the overall Standard Deviation of the mean. 3. S = containing sugar, IS = containing intense sweetener. 4. Unless otherwise stated, values are for the Combined Australian and New Zealand populations. 5. Significant Differences are marked with an * for demographic variables with only two sub-groups and by letters in italics for variables with multiple sub-groups. The letters represent the sub-groups which are significantly lower. 6. Each piece of confectionery consumed has been assigned a value of 1.5g. Therefore a mean consumption for example of 15g would equate to 10 pieces.
Consumption of Intense Sweeteners – Australia/New Zealand Page 141
Roy Morgan Research March, 2004
Appendix 11: Mean Consumption of Flavoured Yoghurt/Mousse (grams per day) by Demographic Sub-Group (Screener Survey)
Demographics Total Country Gender Gender by Country Age (years)
Australia New Zealand
Male Female AUS Male
NZ Male
AUS Female
NZ Female
12-17 a
18-24 b
25-39 c
40-59 d
60+ e
Mean – All Respondents S
IS
20±51
11±39
20
12*
18
9
21
8
20
14*
21*
9
16
6
19
15
20
12
20
7
17
a 12
19
a 13
b,c,e 24
a 12
17
a 11
Mean - Consumers S
IS
78±76
87±73
80
88*
71
75
87*
93
71
84
91*
93
68
86
70
86*
74
72
62
67
76
91
73
a 89
a,c 91
85
a 78
a 92
Demographics Diabetes Glucose Intolerance Weight Control Diet Body Mass Index (BMI)
Diabetic Not Diabetic
Impaired Glucose
Tolerance
Glucose Tolerant
On weight control diet
Not on weight
control diet
<20 Under
a
20-25 Acceptable
b
26-30 Over
c
>30 Obese
d
Mean – All Respondents S
IS
8
26*
21*
11
30
16
20
11
26
26*
19
9
19
6
20
a 11
19
a 13
23
a 16
Mean - Consumers S
IS
79
111
78
85
102
90
78
86
105*
93
75
84
63
67
a 77
a 88
a 83
a 86
a 101
a 95
Note: 1. Base: Total screener survey – Australia and New Zealand. 2. The ± figure is the overall Standard Deviation of the mean. 3. S = containing sugar, IS = containing intense sweetener. 4. Above findings are based on weighted data. 5. Unless otherwise stated, values are for the Combined Australian and New Zealand populations. 6. Significant Differences are marked with an * for demographic variables with only two sub-groups and by letters in italics for variables with multiple sub-groups. The letters represent the sub-groups which are significantly lower.
Consumption of Intense Sweeteners – Australia/New Zealand Page 142
Roy Morgan Research March, 2004
Appendix 11 (Cont’d): Mean Consumption of Flavoured Yoghurt/Mousse (grams per day) by Demographic Sub-Group (Screener Survey)
Demographics Total Country of Birth Ethnic Origin (AUS sample) Ethnic Origin (NZ sample)
Australia a
New Zealand b
Europe c
Elsewhere d
Aboriginal / Torres Strait
Islander
Other Maori / Pacific
Islander
Other
Mean – All Respondents S
IS
20±51
11±39
19
b 11
20
9
24
b 14
19
11
9
7
21*
12
29*
4
16
10*
Mean - Consumers S
IS
78±76
87±73
78
b 87
75
72
b,d 91
b 98
69
91
44
100
80*
88
82
46
68
79*
Demographics Education Level Respondent Income Respondent Occupation Location
Primary a
Secondary b
Tertiary c
<$25,000 a
$25,000 - $39,999
b
$40,000+ c
Prof/ Mgr
a
White Collar
b
Blue Collar
c
Unskilled d
No occ. e
City Non-City
Mean – All Respondents S
IS
21
3
19
a 11
22
a 13
21
10
21
11
19
12
21
12
20
e 13
18
11
22
10
23
8
20
12
21
10
Mean - Consumers S
IS
85
50
77
a 85
80
a 90
79
83
86
82
76
90
80
88
79
93
e 81
81
85
87
68
77
73
86
88*
87
Note: 1. Base: Total screener survey – Australia and New Zealand. 2. The ± figure is the overall Standard Deviation of the mean. 3. S = containing sugar, IS = containing intense sweetener. 4. Above findings are based on weighted data. 5. Unless otherwise stated, values are for the Combined Australian and New Zealand populations. 6. Significant Differences are marked with an * for demographic variables with only two sub-groups and by letters in italics for variables with multiple sub-groups. The letters represent the sub-groups which are significantly lower.
Consumption of Intense Sweeteners – Australia/New Zealand Page 143
Roy Morgan Research March, 2004
Appendix 12: Mean Consumption of Jelly and Milk Based Pudding (grams per day) by Demographic Sub-Group (Screener Survey)
Demographics Total Country Gender Gender by Country Age (years)
Australia New Zealand
Male Female AUS Male
NZ Male
AUS Female
NZ Female
12-17 a
18-24 b
25-39 c
40-59 d
60+ e
Mean – All Respondents S
IS
4±52
1±9
4
1
3
1
3
1
5
1
3
1
3
1
5
1
4
1
c,d 4
1
2
1
2
1
2
1
9
a,b,c,d 3
Mean - Consumers S
IS
40±166
42±39
43
44
31
34
32
46
48
40
32
48
33
35
53
41
29
34
30
26
28
20
34
b 36
31 a,b 44
58
a,b,c 63
Demographics Diabetes Glucose Intolerance Weight Control Diet Body Mass Index (BMI)
Diabetic Not Diabetic
Impaired Glucose
Tolerance
Glucose Tolerant
On weight control diet
Not on weight
control diet
<20 Under
a
20-25 Acceptable
b
26-30 Over
c
>30 Obese
d
Mean – All Respondents S
IS
2
4
4*
1
6
4
4
1
8
3*
3
1
3
1
3
1
3 a 1
11 a,b 2
Mean - Consumers S
IS
38
50
40
42
55
49
40
42
116
45
33
41
29
25
31
36
32
a 56
139
a 52
Note: 1. Base: Total screener survey – Australia and New Zealand. Caution: Small base of IS consumers 2. The ± figure is the overall Standard Deviation of the mean. 3. S = containing sugar, IS = containing intense sweetener. 4. Above findings are based on weighted data. 5. Unless otherwise stated, values are for the Combined Australian and New Zealand populations. 6. Significant Differences are marked with an * for demographic variables with only two sub-groups and by letters in italics for variables with multiple sub-groups. The letters represent the sub-groups which are significantly lower.
Consumption of Intense Sweeteners – Australia/New Zealand Page 144
Roy Morgan Research March, 2004
Appendix 12 (Cont’d): Mean Consumption of Jelly and Milk Based Pudding (grams per day) by Demographic Sub-Group (Screener Survey)
Demographics Total Country of Birth Ethnic Origin (AUS sample) Ethnic Origin (NZ sample)
Australia a
New Zealand b
Europe c
Elsewhere d
Aboriginal / Torres Strait
Islander
Other Maori / Pacific
Islander
Other
Mean – All Respondents S
IS
4±52
1±9
4 c 1
3
1
3
0
2
1
4
2
4
1
4
2
3
1
Mean - Consumers S
IS
40±166
42±39
47
44
31
39
29
46
25
30
28
57*
43
44
29
47
31
31
Demographics Education Level Respondent Income Respondent Occupation Location
Primary a
Secondary b
Tertiary c
<$25,000 a
$25,000 - $39,999
b
$40,000+ c
Prof/ Mgr
a
White Collar
b
Blue Collar
c
Unskilled d
No occ. e
City Non-City
Mean – All Respondents S
IS
b 6
3
3
1
5
1
3
1
2
1
4
1
3
1
5
1
3
b,e 2
4
1
3
1
4
1
3
1
Mean - Consumers S
IS
33
50
30
c 46
59
31
31
37
29
57
51
44
36
43
55
38
32
e 52
33
40
30
26
47
37
30
53*
Note: 1. Base: Total screener survey – Australia and New Zealand. Caution: Small base of IS consumers 2. The ± figure is the overall Standard Deviation of the mean. 3. S = containing sugar, IS = containing intense sweetener. 4. Above findings are based on weighted data. 5. Unless otherwise stated, values are for the Combined Australian and New Zealand populations. 6. Significant Differences are marked with an * for demographic variables with only two sub-groups and by letters in italics for variables with multiple sub-groups. The letters represent the sub-groups which are significantly lower.
Consumption of Intense Sweeteners – Australia/New Zealand Page 145
Roy Morgan Research March, 2004
Appendix 13: Mean Consumption of Jam or Conserve (grams per day) by Demographic Sub-Group (Screener Survey)
Demographics Total Country Gender Gender by Country Age (years)
Australia New Zealand
Male Female AUS Male
NZ Male
AUS Female
NZ Female
12-17 a
18-24 b
25-39 c
40-59 d
60+ e
Mean – All Respondents S
IS
3±6
0.4±3
3
0
4*
0
4*
0
3
0
3
0
4*
1
3
0
3
0
2 c 1
2
0
2
0
a,b,c 3 c 0
a,b,c,d 5
b,c 1
Mean - Consumers S
IS
7±7
8±9
6
8
7*
6
7*
10*
6
6
7
11*
9*
7
6
6
6
6
6
11
6
5
6
4
c 7 c 8
a,b,c,d 8
b,c 9
Demographics Diabetes Glucose Intolerance Weight Control Diet Body Mass Index (BMI)
Diabetic Not Diabetic
Impaired Glucose
Tolerance
Glucose Tolerant
On weight control diet
Not on weight
control diet
<20 Under
a
20-25 Acceptable
b
26-30 Over
c
>30 Obese
d
Mean – All Respondents S
IS
2
2*
3*
0
3
-
3
0*
2
1*
3*
0
2
0
a 3
0
a 3
0
a 3
a,c 1
Mean - Consumers S
IS
6
9
7
7
7
-
7
8*
6
7
7
8
6
5
7 a 9
7
7
7
7
Note: 1. Base: Total screener survey – Australia and New Zealand. 2. The ± figure is the overall Standard Deviation of the mean. 3. S = containing sugar, IS = containing intense sweetener. 4. Above findings are based on weighted data. 5. Unless otherwise stated, values are for the Combined Australian and New Zealand populations. 6. Significant Differences are marked with an * for demographic variables with only two sub-groups and by letters in italics for variables with multiple sub-groups. The letters represent the sub-groups which are significantly lower.
Consumption of Intense Sweeteners – Australia/New Zealand Page 146
Roy Morgan Research March, 2004
Appendix 13 (Cont’d): Mean Consumption of Jam or Conserve (grams per day) by Demographic Sub-Group (Screener Survey)
Demographics Total Country of Birth Ethnic Origin (AUS sample) Ethnic Origin (NZ sample)
Australia a
New Zealand b
Europe c
Elsewhere d
Aboriginal / Torres Strait
Islander
Other Maori / Pacific
Islander
Other
Mean – All Respondents S
IS
3±6
0.4±3
3
0
a,d 4
0
a,d 4
1
3
0
1
0
3*
0*
4
0
3
0
Mean - Consumers S
IS
7±7
8±9
6
8
a,d 7
6
7
b,d 11
6
5
4
3
6*
8*
11*
6
7
6
Demographics Education Level Respondent Income Respondent Occupation Location
Primary a
Secondary b
Tertiary c
<$25,000 a
$25,000 - $39,999
b
$40,000+ c
Prof/ Mgr
a
White Collar
b
Blue Collar
c
Unskilled d
No occ. e
City Non-City
Mean – All Respondents S
IS
3
1
3
0
3
0
3
0
3
0
b 3
0
e 3 b 1
e 3
0
e 3
b,e 0
4
1
2
0
3
0
3*
0
Mean - Consumers S
IS
7
6
7
8
6
7
7
8
6
8
7
8
e 7
b,c,e 12
6
6
7
6
8
28
6
6
6
7
7*
8
Note: 1. Base: Total screener survey – Australia and New Zealand. 2. The ± figure is the overall Standard Deviation of the mean. 3. S = containing sugar, IS = containing intense sweetener. 4. Above findings are based on weighted data. 5. Unless otherwise stated, values are for the Combined Australian and New Zealand populations. 6. Significant Differences are marked with an * for demographic variables with only two sub-groups and by letters in italics for variables with multiple sub-groups. The letters represent the sub-groups which are significantly lower.
Consumption of Intense Sweeteners – Australia/New Zealand Page 147
Roy Morgan Research March, 2004
Appendix 14: Mean Consumption of Flavoured Milk (ml per day) by Demographic Sub-Group (Screener Survey)
Demographics Total Country Gender Gender by Country Age (years)
Australia New Zealand
Male Female AUS Male
NZ Male
AUS Female
NZ Female
12-17 a
18-24 b
25-39 c
40-59 d
60+ e
Mean – All Respondents S
IS
40±114
5±43
39
4
47*
7
56*
5
25
4
56
4
56
11
22
5
37*
4
c,d,e 77
5
c,d,e 86
7
d,e 47
6
e 25
3
11
4
Mean - Consumers S
IS
168±182
161±197
172
153
154
190
200*
185
125
139
207*
171
167
226
121
140
139
133
144
91
a,d 196
148
a 184
a 167
154
232
155
a 191
Demographics Diabetes Glucose Intolerance Weight Control Diet Body Mass Index (BMI)
Diabetic Not Diabetic
Impaired Glucose
Tolerance
Glucose Tolerant
On weight control diet
Not on weight
control diet
<20 Under
a
20-25 Acceptable
b
26-30 Over
c
>30 Obese
d
Mean – All Respondents S
IS
9
17*
41*
4
41
9
40
5
25
7
42*
4
d 50
5
39
4
40
7
32
6
Mean - Consumers S
IS
93
218
170*
155
158
275
169
158
122
150
174*
163
146
124
d 179
137
d 178 a,b,d 290
139
126
Note: 1. Base: Total screener survey – Australia and New Zealand. Caution: Small base of IS consumers 2. The ± figure is the overall Standard Deviation of the mean. 3. S = containing sugar, IS = containing intense sweetener. 4. Above findings are based on weighted data. 5. Unless otherwise stated, values are for the Combined Australian and New Zealand populations. 6. Significant Differences are marked with an * for demographic variables with only two sub-groups and by letters in italics for variables with multiple sub-groups. The letters represent the sub-groups which are significantly lower.
Consumption of Intense Sweeteners – Australia/New Zealand Page 148
Roy Morgan Research March, 2004
Appendix 14 (Cont’d): Mean Consumption of Flavoured Milk (ml per day) by Demographic Sub-Group (Screener Survey)
Demographics Total Country of Birth Ethnic Origin (AUS sample) Ethnic Origin (NZ sample)
Australia a
New Zealand b
Europe c
Elsewhere d
Aboriginal / Torres Strait
Islander
Other Maori / Pacific
Islander
Other
Mean – All Respondents S
IS
40±114
5±43
d 42
c 5
d 45
c 7
33
2
20
4
53
22
39
4
57
8
45
7
Mean - Consumers S
IS
168±182
161±197
d 173
154
d 153
185
d 201
164
118
165
163
147
172
154
160
132
153
209
Demographics Education Level Respondent Income Respondent Occupation Location
Primary a
Secondary b
Tertiary c
<$25,000 a
$25,000 - $39,999
b
$40,000+ c
Prof/ Mgr
a
White Collar
b
Blue Collar
c
Unskilled d
No occ. e
City Non-City
Mean – All Respondents S
IS
38
4
c 48
4
30
5
39
4
a,c 56
5
36
5
30
3
31
4
a,b 46
6
a,d 62
4
a,b,c 59
6
37
4
45*
6
Mean - Consumers S
IS
152
113
173
139
162
207
146
125
a 201
161
177
193
168
145
158
161
e 184
198
e 218
179
145
111
159
152
184
173
Note: 1. Base: Total screener survey – Australia and New Zealand. Caution: Small base of IS consumers 2. The ± figure is the overall Standard Deviation of the mean. 3. S = containing sugar, IS = containing intense sweetener. 4. Above findings are based on weighted data. 5. Unless otherwise stated, values are for the Combined Australian and New Zealand populations. 6. Significant Differences are marked with an * for demographic variables with only two sub-groups and by letters in italics for variables with multiple sub-groups. The letters represent the sub-groups which are significantly lower.
Consumption of Intense Sweeteners – Australia/New Zealand Page 149
Roy Morgan Research March, 2004
Appendix 15: Mean Consumption of Canned Fruit (grams per day) by Demographic Sub-Group (Screener Survey)
Demographics Total Country Gender Gender by Country Age (years)
Australia New Zealand
Male Female AUS Male
NZ Male
AUS Female
NZ Female
12-17 a
18-24 b
25-39 c
40-59 d
60+ e
Mean – All Respondents S
IS
13±43
2±15
12
2
14
3*
13
1
12
2*
13
1
14
3*
12
2
13
4
9
1
8
0
a,b 13 a,b 2
a,b 13
b 1
a,b,c,d 17
a,b,d 4
Mean - Consumers S
IS
52±73
59±60
52
61
51
54
56
56
48
61
57
56
53
54
48
64
49
53
39
44
42
46
a,b 58
54
a 51
54
a,b 55
a 73
Demographics Diabetes Glucose Intolerance Weight Control Diet Body Mass Index (BMI)
Diabetic Not Diabetic
Impaired Glucose
Tolerance
Glucose Tolerant
On weight control diet
Not on weight
control diet
<20 Under
a
20-25 Acceptable
b
26-30 Over
c
>30 Obese
d
Mean – All Respondents S
IS
7
6*
13*
2
12
3
13
2
11
4*
13
2
8
1
a 13
1
a 15
a 3
12 a,b 3
Mean - Consumers S
IS
44
54
52
60
51
30
52
61*
48
52
52
62
44
46
50
59
a 58
61
55
62
Note: 1. Base: Total screener survey – Australia and New Zealand. Caution: Small base of IS consumers 2. The ± figure is the overall Standard Deviation of the mean. 3. S = containing sugar, IS = containing intense sweetener. 4. Above findings are based on weighted data. 5. Unless otherwise stated, values are for the Combined Australian and New Zealand populations. 6. Significant Differences are marked with an * for demographic variables with only two sub-groups and by letters in italics for variables with multiple sub-groups. The letters represent the sub-groups which are significantly lower.
Consumption of Intense Sweeteners – Australia/New Zealand Page 150
Roy Morgan Research March, 2004
Appendix 15 (Cont’d): Mean Consumption of Canned Fruit (grams per day) by Demographic Sub-Group (Screener Survey)
Demographics Total Country of Birth Ethnic Origin (AUS sample) Ethnic Origin (NZ sample)
Australia a
New Zealand b
Europe c
Elsewhere d
Aboriginal / Torres Strait
Islander
Other Maori / Pacific
Islander
Other
Mean – All Respondents S
IS
13±43
2±15
d 12
1
d 14 a,d 3
d 16
d 4
8
1
5
1
13*
2
24
1
12
4*
Mean - Consumers S
IS
52±73
59±60
52
53
52
55
53
94
56
43
37
19
52
62*
95
32
44
56*
Demographics Education Level Respondent Income Respondent Occupation Location
Primary a
Secondary b
Tertiary c
<$25,000 a
$25,000 - $39,999
b
$40,000+ c
Prof/ Mgr
a
White Collar
b
Blue Collar
c
Unskilled d
No occ. e
City Non-City
Mean – All Respondents S
IS
9
2
12
2
a 14
2
11
2
10
2
a 15
2
e 14
2
e 13
2
e 12
2
e 15
2
9
2
13
2
13
2
Mean - Consumers S
IS
49
145
47
58
b 59
58
48
60
44
54
b 56
b 60
54
55
54
67
51
49
47
80
44
68
51
61
53
56
Note: 1. Base: Total screener survey – Australia and New Zealand. Caution: Small base of IS consumers 2. The ± figure is the overall Standard Deviation of the mean. 3. S = containing sugar, IS = containing intense sweetener. 4. Above findings are based on weighted data. 5. Unless otherwise stated, values are for the Combined Australian and New Zealand populations. 6. Significant Differences are marked with an * for demographic variables with only two sub-groups and by letters in italics for variables with multiple sub-groups. The letters represent the sub-groups which are significantly lower.
Consumption of Intense Sweeteners – Australia/New Zealand Page 151
Roy Morgan Research March, 2004
Appendix 16: Mean Consumption of Toppings (grams per day) by Demographic Sub-Group (Screener Survey)
Demographics Total Country Gender Gender by Country Age (years)
Australia New Zealand
Male Female AUS Male
NZ Male
AUS Female
NZ Female
12-17 a
18-24 b
25-39 c
40-59 d
60+ e
Mean – All Respondents S
IS
1±4
0.1±1
1
0
1
0
1*
0
1
0
1
0
1
0
0
0
1*
0
d,e 1
0
1 c 0
d 1
0
1
0
1
0
Mean - Consumers S
IS
9±11
8±4
9
8
9
7
10
8
7
8
10
8
10
7
7
8
9
6
7
7
11
8
9
7
7
7
a,d 11
8
Demographics Diabetes Glucose Intolerance Weight Control Diet Body Mass Index (BMI)
Diabetic Not Diabetic
Impaired Glucose
Tolerance
Glucose Tolerant
On weight control diet
Not on weight
control diet
<20 Under
a
20-25 Acceptable
b
26-30 Over
c
>30 Obese
d
Mean – All Respondents S
IS
0
0
1*
0
0
-
1
0*
0
0
1*
0
1
0
1
0
1
0
1
0
Mean - Consumers S
IS
9
7
9
8
4
-
9
8*
10
6
9
8*
6
9
a 8
8
a 12
6
a 11
9
Note: 1. Base: Total screener survey – Australia and New Zealand. Caution: Small base of IS consumers 2. The ± figure is the overall Standard Deviation of the mean. 3. S = containing sugar, IS = containing intense sweetener. 4. Above findings are based on weighted data. 5. Unless otherwise stated, values are for the Combined Australian and New Zealand populations. 6. Significant Differences are marked with an * for demographic variables with only two sub-groups and by letters in italics for variables with multiple sub-groups. The letters represent the sub-groups which are significantly lower.
Consumption of Intense Sweeteners – Australia/New Zealand Page 152
Roy Morgan Research March, 2004
Appendix 16 (Cont’d): Mean Consumption of Toppings (grams per day) by Demographic Sub-Group (Screener Survey)
Demographics Total Country of Birth Ethnic Origin (AUS sample) Ethnic Origin (NZ sample)
Australia a
New Zealand b
Europe c
Elsewhere d
Aboriginal / Torres Strait
Islander
Other Maori / Pacific
Islander
Other
Mean – All Respondents S
IS
1±4
0.1±1
d 1
0
d 1
0
1
0
0
0
1
-
1
0*
1
-
1
0*
Mean - Consumers S
IS
9±11
8±4
d 9 d 8
d 9 d 7
9 d 6
6
3
7
-
9
8*
11
-
9
7*
Demographics Education Level Respondent Income Respondent Occupation Location
Primary a
Secondary b
Tertiary c
<$25,000 a
$25,000 - $39,999
b
$40,000+ c
Prof/ Mgr
a
White Collar
b
Blue Collar
c
Unskilled d
No occ. e
City Non-City
Mean – All Respondents S
IS
0
0
a 1
0
a 1
0
1
0
1
0
1
0
1
0
1
0
a 1
0
1
-
a 1
a,d 0
1
0
1
0
Mean - Consumers S
IS
5
5
a 8 a 8
a 10
a 7
8
7
13
10
8
7
7 d 8
9 d 7
a,e 10
d 8
9
-
7 d 9
8
8
10
7
Note: 1. Base: Total screener survey – Australia and New Zealand. Caution: Small base of IS consumers 2. The ± figure is the overall Standard Deviation of the mean. 3. S = containing sugar, IS = containing intense sweetener. 4. Above findings are based on weighted data. 5. Unless otherwise stated, values are for the Combined Australian and New Zealand populations. 6. Significant Differences are marked with an * for demographic variables with only two sub-groups and by letters in italics for variables with multiple sub-groups. The letters represent the sub-groups which are significantly lower.
Consumption of Intense Sweeteners – Australia/New Zealand Page 153
Roy Morgan Research March, 2004
Appendix 17: Mean Consumption of Ice Cream (grams per day) by Demographic Sub-Group (Screener Survey)
Demographics Total Country Gender Gender by Country Age (years)
Australia New Zealand
Male Female AUS Male
NZ Male
AUS Female
NZ Female
12-17 a
18-24 b
25-39 c
40-59 d
60+ e
Mean – All Respondents S
IS
34±70
5±29
35*
5
29
5
42*
4
26
5
43
4
36
3
27*
5
22
6
d,e 43 c,d 8
d 38
4
d 37
3
30
4
31 c,d 7
Mean - Consumers S
IS
70±87
73±88
72*
74
61
67
83*
78
57
69
86*
79
67
73
58
71
53
65
69
94
72
65
d 76
61
65
73
71
74
Demographics Diabetes Glucose Intolerance Weight Control Diet Body Mass Index (BMI)
Diabetic Not Diabetic
Impaired Glucose
Tolerance
Glucose Tolerant
On weight control diet
Not on weight
control diet
<20 Under
a
20-25 Acceptable
b
26-30 Over
c
>30 Obese
d
Mean – All Respondents S
IS
20
13*
35*
5
19
7
34*
5
22
12*
36*
4
b 39
6
32
4
37
6
33
6
Mean - Consumers S
IS
75
60
70
75
40
66
71*
73
62
81
71
70
70
86
67
66
78
87
70
65
Note: 1. Base: Total screener survey – Australia and New Zealand. 2. The ± figure is the overall Standard Deviation of the mean. 3. S = containing sugar, IS = containing intense sweetener. 4. Above findings are based on weighted data. 5. Unless otherwise stated, values are for the Combined Australian and New Zealand populations. 6. Significant Differences are marked with an * for demographic variables with only two sub-groups and by letters in italics for variables with multiple sub-groups. The letters represent the sub-groups which are significantly lower.
Consumption of Intense Sweeteners – Australia/New Zealand Page 154
Roy Morgan Research March, 2004
Appendix 17 (Cont’d): Mean Consumption of Ice Cream (grams per day) by Demographic Sub-Group (Screener Survey)
Demographics Total Country of Birth Ethnic Origin (AUS sample) Ethnic Origin (NZ sample)
Australia a
New Zealand b
Europe c
Elsewhere d
Aboriginal / Torres Strait
Islander
Other Maori / Pacific
Islander
Other
Mean – All Respondents S
IS
34±70
5±29
b,c 37
5
29
5
27
4
33
3
28
0
35
5*
34
3
28
5
Mean - Consumers S
IS
70±87
73±88
b,c 75
d 79
62
67
58
61
66
52
70
14
72
75*
69
52
60
70
Demographics Education Level Respondent Income Respondent Occupation Location
Primary a
Secondary b
Tertiary c
<$25,000 a
$25,000 - $39,999
b
$40,000+ c
Prof/ Mgr
a
White Collar
b
Blue Collar
c
Unskilled d
No occ. e
City Non-City
Mean – All Respondents S
IS
b 51
4
32
c 6
35
4
32
b 6
39
3
34
5
34
3
32 a,c 6
35
4
34
5
b 38 a,c 8
33
5
36
5
Mean - Consumers S
IS
88
68
67
76
72
69
66
74
80
76
71
72
68
66
c 66
73
78
63
70
84
69
92
69
73
73
73
Note: 1. Base: Total screener survey – Australia and New Zealand. 2. The ± figure is the overall Standard Deviation of the mean. 3. S = containing sugar, IS = containing intense sweetener. 4. Above findings are based on weighted data. 5. Unless otherwise stated, values are for the Combined Australian and New Zealand populations. 6. Significant Differences are marked with an * for demographic variables with only two sub-groups and by letters in italics for variables with multiple sub-groups. The letters represent the sub-groups which are significantly lower.
Consumption of Intense Sweeteners – Australia/New Zealand Page 155
Roy Morgan Research March, 2004
Appendix 18: Mean Consumption by Body Weight of Carbonated Soft Drinks (ml per kilogram of body weight per day) by Demographic Sub-Group (Screener Survey)
Demographics Total Country Gender Gender by Country Age (years)
Australia New Zealand
Male Female AUS Male
NZ Male
AUS Female
NZ Female
12-17 a
18-24 b
25-39 c
40-59 d
60+ e
Mean – All Respondents S
IS
1.9±3.7
1.1±3.3
1.8
1.1
1.9
1.1
2.3*
1.0
1.5
1.2*
2.3
1.0
2.3
0.8
1.5
1.2
1.5
1.3
c,d,e 3.1
e 1.2
c,d,e 3.6
e 1.2
d,e 2.2
e 1.4
e 1.2
e 1.1
0.8
0.7
Mean - Consumers S
IS
3.8±4.5
4.2±5.4
3.8
4.2
3.7
4.2
4.1*
4.3
3.5
4.1
4.1
4.3
4.0
3.9
3.5
4.0
3.4
4.4
d,e 4.1
3.1
c,d,e 4.9
3.9
d,e 3.9
a 4.8
3.2
a 4.3
3.0
a 4.0
Demographics Diabetes Glucose Intolerance Weight Control Diet Body Mass Index (BMI)
Diabetic Not Diabetic
Impaired Glucose
Tolerance
Glucose Tolerant
On weight control diet
Not on weight
control diet
<20 Under
a
20-25 Acceptable
b
26-30 Over
c
>30 Obese
d
Mean – All Respondents S
IS
0.4
3.5*
1.9*
1.0
0.9
1.1
1.9*
1.1
0.9
2.0*
2.0*
1.0
b,c,d 2.7
0.9
1.8
1.0
1.6
a 1.2
1.5 a,b
1.4 Mean - Consumers
S
IS
2.9
6.0*
3.8
4.0
3.7
3.7
3.8
4.2
3.1
4.3
3.9*
4.1
b,c,d 4.4
3.5
3.7 a,d
4.6
3.7
3.9
3.5
3.7
Note: 1. Base: Total screener survey – Australia and New Zealand. 2. The ± figure is the overall Standard Deviation of the mean. 3. S = containing sugar, IS = containing intense sweetener. 4. Unless otherwise stated, values are for the Combined Australian and New Zealand populations. 5. Significant Differences are marked with an * for demographic variables with only two sub-groups and by letters in italics for variables with multiple sub-groups. The letters represent the sub-groups which are significantly lower. 6. For reference, the overall calculated mean body weight of the survey respondents was 72kg (72kg in Australia and 74kg in New Zealand).
Consumption of Intense Sweeteners – Australia/New Zealand Page 156
Roy Morgan Research March, 2004
Appendix 18 (Cont’d): Mean Consumption by Body Weight of Carbonated Soft Drinks (ml per kilogram of body weight per day) by Demographic Sub-Group (Screener Survey)
Demographics Total Country of Birth Ethnic Origin (AUS sample) Ethnic Origin (NZ sample)
Australia a
New Zealand b
Europe c
Elsewhere d
Aboriginal / Torres Strait
Islander
Other Maori / Pacific
Islander
Other
Mean – All Respondents S
IS
1.9±3.7
1.1±3.3
c,d 2.0
1.1
c,d 1.9
1.1
1.3
1.1
1.4
1.0
3.6*
0.8
1.8
1.1
3.1*
1.5
1.6
1.0
Mean - Consumers S
IS
3.8±4.5
4.2±5.4
d 3.9
4.0
3.8
4.3
3.5
4.7
3.2
4.4
5.1
2.9
3.8
4.2
4.6*
4.4
3.5
4.1
Demographics Education Level Respondent Income Respondent Occupation Location
Primary a
Secondary b
Tertiary c
<$25,000 a
$25,000 - $39,999
b
$40,000+ c
Prof/ Mgr
a
White Collar
b
Blue Collar
c
Unskilled d
No occ. e
City Non-City
Mean – All Respondents S
IS
1.8
0.7
c 2.1
a 1.2
1.5
1.0
c 2.1
1.1
c 2.1
1.1
1.6
1.1
1.3
1.1
a 1.6
1.1
a,b 2.1
1.1
a,b 2.2
1.0
a,b,c 2.6
0.9
1.8
1.2*
1.9
1.0
Mean - Consumers S
IS
3.4
3.1
c 4.2
a 4.4
3.3
3.9
4.0
4.1
4.0
4.3
3.6
4.2
3.3
e 4.2
3.5
e 4.0
a,b 4.3 b,e
5.0
3.8
4.1
4.0
3.1
3.7
4.2
4.0
4.0
Note: 1. Base: Total screener survey – Australia and New Zealand. 2. The ± figure is the overall Standard Deviation of the mean. 3. S = containing sugar, IS = containing intense sweetener. 4. Unless otherwise stated, values are for the Combined Australian and New Zealand populations. 5. Significant Differences are marked with an * for demographic variables with only two sub-groups and by letters in italics for variables with multiple sub-groups. The letters represent the sub-groups which are significantly lower. 6. For reference, the overall calculated mean body weight of the survey respondents was 72kg (72kg in Australia and 74kg in New Zealand).
Consumption of Intense Sweeteners – Australia/New Zealand Page 157
Roy Morgan Research March, 2004
Appendix 19: Mean Consumption by Body Weight of Cordial (ml per kilogram of body weight per day) by Demographic Sub-Group (Screener Survey)
Demographics Total Country Gender Gender by Country Age (years)
Australia New Zealand
Male Female AUS Male
NZ Male
AUS Female
NZ Female
12-17 a
18-24 b
25-39 c
40-59 d
60+ e
Mean – All Respondents S
IS
1.2±3.4
0.3±1.5
1.2*
0.3
0.9
0.3
1.2
0.3
1.1
0.3
1.3*
0.3
0.9
0.4
1.1
0.3
1.0
0.3
b,c,d,e 2.3 d,e
0.5
d,e 1.6
0.3
d,e 1.6
0.3
e 0.7
0.2
0.4
0.2
Mean - Consumers S
IS
4.3±5.5
3.9±4.2
4.3
3.8
4.3
4.1
4.3
4.2
4.4
3.6
4.3
4.2
4.0
4.1
4.3
3.5
4.5
4.2
d,e 5.4
4.0
d,e 4.3
3.5
d,e 4.9
3.8
3.3
3.9
3.4
4.3
Demographics Diabetes Glucose Intolerance Weight Control Diet Body Mass Index (BMI)
Diabetic Not Diabetic
Impaired Glucose
Tolerance
Glucose Tolerant
On weight control diet
Not on weight
control diet
<20 Under
a
20-25 Acceptable
b
26-30 Over
c
>30 Obese
d
Mean – All Respondents S
IS
0.1
0.6*
1.2*
0.3
1.0
0.1
1.2
0.3*
0.7
0.4
1.2*
0.3
b,c,d 1.7
0.4
c,d 1.3
0.3
0.7
0.3
0.7
0.3
Mean - Consumers S
IS
1.5
3.7
4.4*
3.9
5.1
2.3
4.3
3.9*
3.6
3.1
4.4
4.1*
5.1 c,d
5.1
c,d 4.7
d 4.0
3.2
3.2
2.8
3.1
Note: 1. Base: Total screener survey – Australia and New Zealand. 2. The ± figure is the overall Standard Deviation of the mean. 3. S = containing sugar, IS = containing intense sweetener. 4. Unless otherwise stated, values are for the Combined Australian and New Zealand populations. 5. Significant Differences are marked with an * for demographic variables with only two sub-groups and by letters in italics for variables with multiple sub-groups. The letters represent the sub-groups which are significantly lower. 6. For reference, the overall calculated mean body weight of the survey respondents was 72kg (72kg in Australia and 74kg in New Zealand).
Consumption of Intense Sweeteners – Australia/New Zealand Page 158
Roy Morgan Research March, 2004
Appendix 19 (Cont’d): Mean Consumption by Body Weight of Cordial (ml per kilogram of body weight per day) by Demographic Sub-Group (Screener Survey)
Demographics Total Country of Birth Ethnic Origin (AUS sample) Ethnic Origin (NZ sample)
Australia a
New Zealand b
Europe c
Elsewhere d
Aboriginal / Torres Strait
Islander
Other Maori / Pacific
Islander
Other
Mean – All Respondents S
IS
1.2±3.4
0.3±1.5
b,c,d 1.3
0.3
c,d 1.1
c 0.4
d 0.7
0.2
0.3
0.4
2.6*
0.2
1.2
0.3
1.7*
0.6
0.8
0.3
Mean - Consumers S
IS
4.3±5.5
3.9±4.2
c,d 4.5
3.7
c,d 4.5
4.8
3.4
3.1
2.7
4.9
5.8
3.1
4.3
3.9
5.5
5.7
4.0
3.7
Demographics Education Level Respondent Income Respondent Occupation Location
Primary a
Secondary b
Tertiary c
<$25,000 a
$25,000 - $39,999
b
$40,000+ c
Prof/ Mgr
a
White Collar
b
Blue Collar
c
Unskilled d
No occ. e
City Non-City
Mean – All Respondents S
IS
1.7
0.6
c 1.2
0.3
1.0
0.3
b,c 1.3
0.3
1.0
0.3
1.1
0.3
0.8
0.3
a 1.1
0.3
a 1.2
0.3
a,b,c 2.0
0.2
a,b,c 1.6
a,b,d 0.5
1.4
1.1
1.6
1.3*
Mean - Consumers S
IS
6.3
4.1
4.5
3.4
3.9
b 4.5
4.6
3.7
3.8
4.3
4.3
3.9
3.4
4.5
a 4.3
3.7
a 4.4
3.9
a 6.0
3.5
a 4.7
3.8
4.2
4.1
4.8
4.6
Note: 1. Base: Total screener survey – Australia and New Zealand. 2. The ± figure is the overall Standard Deviation of the mean. 3. S = containing sugar, IS = containing intense sweetener. 4. Unless otherwise stated, values are for the Combined Australian and New Zealand populations. 5. Significant Differences are marked with an * for demographic variables with only two sub-groups and by letters in italics for variables with multiple sub-groups. The letters represent the sub-groups which are significantly lower. 6. For reference, the overall calculated mean body weight of the survey respondents was 72kg (72kg in Australia and 74kg in New Zealand).
Consumption of Intense Sweeteners – Australia/New Zealand Page 159
Roy Morgan Research March, 2004
Appendix 20: Mean Consumption by Body Weight of Tabletop Sweeteners (mg per kilogram of body weight per day) by Demographic Sub-Group (Screener Survey)
Demographics Total Country Gender Gender by Country Age (years)
Australia New Zealand
Male Female AUS Male
NZ Male
AUS Female
NZ Female
12-17 a
18-24 b
25-39 c
40-59 d
60+ e
Mean – All Respondents S
IS
0.1±0.3
0±0.1
0.1*
0
0.1
0
0.1
0
0.1
0
0.1*
0
0.1
0
0.1
0
0.1
0
0.1
-
0.1
-
a,e 0.1
0
a,e 0.1
0
0.1
a,b,c,d 0
Mean - Consumers S
IS
1.1±0.4
1.1±0.3
1.1
1.1
1.1
1.2
1.1
1.1
1.1
1.1
1.1*
1.1
1.0
1.2
1.1
1.1
1.2
1.2
1.0
-
1.1
-
a 1.1 a,b
1.1
a 1.1
b 1.1
1.1 a,b
1.1
Demographics Diabetes Glucose Intolerance Weight Control Diet Body Mass Index (BMI)
Diabetic Not Diabetic
Impaired Glucose
Tolerance
Glucose Tolerant
On weight control diet
Not on weight
control diet
<20 Under
a
20-25 Acceptable
b
26-30 Over
c
>30 Obese
d
Mean – All Respondents S
IS
0
0.1*
0.1*
0
0
-
0.1
0*
0
0*
0.1*
0
d 0.1
0
c,d 0.1
0
d 0.1
0
0 a 0
Mean - Consumers S
IS
1.0
1.2
1.1*
1.1
1.0
-
1.1*
1.1*
1.0
1.0
1.1*
1.1
1.0
1.4
1.1
c,d,e 1.2
1.2
1.0
1.1
1.0
Note: 1. Base: Total screener survey – Australia and New Zealand. 2. The ± figure is the overall Standard Deviation of the mean. 3. S = containing sugar, IS = containing intense sweetener. 4. Unless otherwise stated, values are for the Combined Australian and New Zealand populations. 5. Significant Differences are marked with an * for demographic variables with only two sub-groups and by letters in italics for variables with multiple sub-groups. The letters represent the sub-groups which are significantly lower. 6. For reference, the overall calculated mean body weight of the survey respondents was 72kg (72kg in Australia and 74kg in New Zealand).
Consumption of Intense Sweeteners – Australia/New Zealand Page 160
Roy Morgan Research March, 2004
Appendix 20 (Cont’d): Mean Consumption by Body Weight of Tabletop Sweeteners (mg per kilogram of body weight per day) by Demographic Sub-Group (Screener Survey)
Demographics Total Country of Birth Ethnic Origin (AUS sample) Ethnic Origin (NZ sample)
Australia a
New Zealand b
Europe c
Elsewhere d
Aboriginal / Torres Strait
Islander
Other Maori / Pacific
Islander
Other
Mean – All Respondents S
IS
0.1+0.3
0+0.1
0.1
0
0.1
0
0.1
0
a,b 0.1
0
0.2
-
a,b 0.1
0
0.1
0
0.1
0
Mean - Consumers S
IS
1.1+0.4
1.1+0.3
1.1
1.1
1.1 c,d
1.3
1.1
1.0
1.0
1.0
1.2
-
1.1
1.1*
1.1
2.0*
1.1
1.2
Demographics Education Level Respondent Income Respondent Occupation Location
Primary a
Secondary b
Tertiary c
<$25,000 a
$25,000 - $39,999
b
$40,000+ c
Prof/ Mgr
a
White Collar
b
Blue Collar
c
Unskilled d
No occ. e
City Non-City
Mean – All Respondents S
IS
0.1
0
c 0.1
0
0.1
0
0.1
0
0.1
0
0.1
0
e 0.1
d 0
e 0.1
0
b,e 0.1
0
e 0.1
0
0
0
0.1
0
0.1
0
Mean - Consumers S
IS
1.0
1.0
1.1
a 1.1
1.1
a 1.1
1.1
1.1
1.1 a,c
1.7
1.1
1.1
1.1
d 1.2
1.1
1.0
a 1.1
1.0
1.1
1.0
1.1
1.1
1.1
1.1*
1.1
1.0
Note: 1. Base: Total screener survey – Australia and New Zealand. 2. The ± figure is the overall Standard Deviation of the mean. 3. S = containing sugar, IS = containing intense sweetener. 4. Unless otherwise stated, values are for the Combined Australian and New Zealand populations. 5. Significant Differences are marked with an * for demographic variables with only two sub-groups and by letters in italics for variables with multiple sub-groups. The letters represent the sub-groups which are significantly lower. 6. For reference, the overall calculated mean body weight of the survey respondents was 72kg (72kg in Australia and 74kg in New Zealand).
Consumption of Intense Sweeteners – Australia/New Zealand Page 161
Roy Morgan Research March, 2004
Appendix 21: Eligibility Criteria for Main Diary Survey (Non-Diabetics/Non-Impaired Glucose Tolerance) Amount Body Weight of Respondent (kgs/st lbs)
Consumption of Intense Sweeteners – Australia/New Zealand Page 162
Roy Morgan Research March, 2004
1. Locate the correct body weight column for a particular respondent, then check the table, as explained below, to decide whether that person would be eligible for a diary or not
2. First check exposure to DIET CARBONATED BEVERAGES Eligible for a diary if exposure falls into the dark shaded area in the correct body weight column for DIET CARBONATED BEVERAGES If not eligible for a diary, check exposure to DIET CORDIAL Eligible for a diary if exposure falls into the dark shaded area in the correct body weight column for DIET CORDIALS If still not eligible for a diary, check exposure to TABLE TOP SWEETNERS Eligible for a diary if exposure falls into the dark shaded area in the correct body weight column for TABLE TOP SWEETNERS If still not eligible for a diary, go to Step 3. 3. Check IF the person has consumed a COMBINATION of DIET CARBONATED DRINKS, DIET CORDIAL or TABLE TOP SWEETENERS (may be 2 or 3 products) Then check exposure to DIET CARBONATED DRINKS Eligible for a diary if exposure falls into the dotted area for the correct body weight for DIET CARBONATED DRINKS and they have
consumed some DIET CORDIAL or TABLE TOP SWEETENERS or both If still not eligible for a diary, check exposure to DIET CORDIAL Eligible for a diary if exposure falls into the dotted area for the correct body weight for DIET CORDIAL and they have consumed some
DIET CARBONATED DRINKS or TABLE TOP SWEETENERS or both If still not eligible for a diary, check exposure to TABLE TOP SWEETNERS Eligible for a diary if exposure falls into the dotted area for the correct body weight for TABLE TOP SWEETENERS and they have
consumed some DIET CARBONATED DRINKS or DIET CORDIAL or both If still not eligible got to Step 4. 4. Lastly, check if the person has consumed both DIET CARBONATED DRINKS and DIET CORDIAL Check the exposure to DIET CARBONATED DRINKS and then the intake of DIET CORDIAL for the correct body weight Eligible if exposure falls into the lightly shaded areas for BOTH the DIET CARBONATED DRINKS AND the DIET CORDIAL If a persons' exposure does not fit into any of the above criteria they are not eligible for a diary
Consumption of Intense Sweeteners – Australia/New Zealand Page 163
Roy Morgan Research March, 2004
Appendix 22: Glossary of Terms
Screener Survey: Random telephone survey of the population to identify those who were apparent high consumers of intense sweeteners, for participation in the diary survey.
CATI: Computer Assisted Telephone Interviewing (the methodology used
for the screener survey).
Respondents (Screener Survey): Everyone who participated in the screener survey regardless of
whether they consumed a particular type of food product or not.
Consumers (Screener Survey): Those who participated in the screener survey who actually
consumed, in the 7-days prior to the survey, food or drinks from the 12 product groups measured e.g consumers of confectionery, consumers of soft-drinks etc.
Intense Sweetener: Artificial or non-nutritive sweetener
GMP: Good Manufacturing Practice levels
Eligible for Diary Survey: Those who participated in the screener survey who i) were identified
as apparent high consumers of intense sweeteners or ii) claimed to have diabetes or impaired glucose tolerance
Main Diary Survey: Ongoing daily record of the amount of food consumed over a 7-day
period by product group type (particular brands by weight/volume) amongst those deemed eligible to participate from the screener survey.
Consumption of Intense Sweeteners – Australia/New Zealand Page 164
Roy Morgan Research March, 2004
Supplementary Diary Survey: Ongoing daily record of the amount of food consumed over a 7-day
period by product group type (particular brands by weight/volume) amongst diabetics recruited independently of the screener survey.
Respondents (Diary Survey): Everyone who participated in the diary survey regardless of whether
they consumed a particular type of food product or not during the 7-day period measured by the diary.
Consumers (Diary Survey): Those who participated in the diary survey who were actually
exposed to a particular intense sweetener during the 7-day period measured by the diary eg consumers of aspartame, consumers of sucralose etc
Mean: The sum of individual values divided by the total number of individuals surveyed.
Median: The middle point in a distribution of values.
90th/95th percentile: Positions within a distribution of values where either 90% or 95% of individual values are below this point; only 10% or 5% of values respectively are higher than this value.
Total Diabetics/ Impaired Glucose Tolerance: All those with diabetes or impaired glucose tolerance who
completed a 7-day diary (regardless of whether they were recruited via the screener survey of the population or from sources independent of this).
S: Containing sugar ie sugar sweetened
IS: Containing intense sweeteners
ADI: Acceptable Daily Intake
FSANZ: Food Standards Australia New Zealand
ABS: Australian Bureau of Statistics
Consumption of Intense Sweeteners – Australia/New Zealand Page 165
Roy Morgan Research March, 2004
SNZ: Statistics New Zealand
BMI: Body Mass Index (weight in kilograms/height in meters2)
underweight is BMI <20
acceptable is BMI 20-25
overweight is BMI >25-30
obese is BMI >30
WHO: World Health Organization
FAO: Food and Agriculture Organization of the United Nations
Australian Residents: Those living in Australia, regardless of ethnicity New Zealand Residents: Those living in New Zealand, regardless of ethnicity No Occupation: Those currently not working – includes those still at school, the