Page 1
Contribution to the mechanical characterization of unbound
sub-base and base road pavement layers containing reclaimed
asphalt pavements
José Antonio Filipe dos Reis
Thesis to obtain the Master of Science Degree in
Civil Engineering
Supervisors: Professor Doctor José Manuel Coelho das Neves
Doctor Ana Cristina Ferreira de Oliveira Rosado Freire
Examination Committee
Chairperson: Professor Doctor João Torres de Quinhones Levy
Supervisor: Doctor Ana Cristina Ferreira de Oliveira Rosado Freire
Members of the Comitee: Professor Doctor Luís Guilherme de Picado Santos
October 2016
Page 3
iii
Acknowledgement
Firstly, I would like to express my sincere gratitude to my advisor Doctor José Manuel Coelho das Neves,
assistant teacher of the Civil Engineering and Architecture of Instituto Superior Técnico, and to Doctor
Ana Cristina Ferreira de Oliveira Rosado Freire, LNEC researcher.
This dissertation was done with the cooperation of Laboratório Nacional de Engenharia Civil. I would
like to thank to the Transport Infrastructure Research Group (NIT) of LNEC and to its coordinator
Eduardo Fortunato.
I would also like to thank the team that helped to perform the experimental tests, Doctor André Paixão
and Rui Coelho.
I express my gratitude to Instituto Superior Técnico for the institutional support.
I am very thankful to the support, effort and understanding of my family that allways believed in the best
of me.
At last I would like to thank to Filipa Caleiro, my bride, for giving me the strength to overtake countless
barriers thought this journey and for being the most amazing person that I could ever count on.
Page 4
iv
Resumo
As estradas são uma das mais importantes mais valias de qualquer país. Tem-se vindo a sentir um
crescimento no incentivo ao uso de materiais alternativos na construção em geral bem como no que
diz respeito às vias de comunicação.
Do ponto de vista de desempenho mecânico, os materiais alternativos representam um desafio,
principalmente no que diz respeito ao desempenho a longo prazo. A natureza e a composição de
materiais alternativos é usualmente significativamente diferente dos agregados naturais, não sendo
apropriado recorrer a certo tipo de ensaios.
O principal objetivo desta dissertação é aprofundar o estudo quanto ao uso de materiais reciclados
provenientes de construção e demolição na construção e reabilitação de estradas. O estudo foi
direcionado para a avaliação do comportamento físico e mecânico, de uma mistura composta por 30%
agregados reciclados provenientes de fresagem de pavimentos (BET-F(T)) e 70% de agregado natural
britado de granulometria extensa (ABGE(T)), quando sujeito a às condições das camadas de base e
sub base dos pavimentos. Este estudo foi realizado com base no ensaio triaxial cíclico. Foram
estudadas as deformações permanentes e o comportamento resiliente para temperaturas de 20, 30 e
40ºC e graus de compactação de 95 e 100%. Os resultados revelam que as deformações permanentes
obtidas são comparáveis com materiais naturais e o comportamento resiliente é comparável com
agregados testados por outros autores. Conclui-se que o material é potencialmente utilizável para
camadas estruturais de estradas.
Palavras Chave: Comportamento Mecânico, ensaios traxiais ciclicos, materiais reciclados
provenientes da construção e demolição, dimensionamento de estradas.
Page 5
v
Abstract
Roads are one of the biggest assets in any country. Throughout Europe there is pressure to increase
the use of alternative materials in road construction.
From the point of view of mechanical performance, uncertainties about alternative materials remain,
especially with respect to the long-term performance. The nature and composition of alternative
materials is often significantly different from that of natural aggregates, and existing tests for natural
aggregates may not be appropriate
The main objective of this work is to contribute to the study of the use of construction and demolition
recycled materials at pavement construction and rehabilitation. The study focused on evaluating the
physical and mechanic behaviour of a mixture composed by 30% recycled aggregates from reclaimed
asphalt pavement (BET-F(T)) and 70% natural grinded aggregate mixture with extensive grain size
(ABGE(T)) when submitted to state conditions of base and sub base pavement layers. This analysis
was performed based on a repeated load triaxial test. Permanent deformations and resilient behaviour
was studied for temperatures of 20, 30 and 40oC and compaction degrees of 95 and 100%. The results
shows that the axial permanent deformation obtained is comparable with results found on natural
aggregates and the resilient behaviour is comparable to results obtained, from other authors. It is
concluded that this material is a potential candidate for use on structural pavement layers.
Keywords: Mechanical behaviour, repeated triaxial load test, construction and demolition recycled
materials, road construction.
Page 6
vi
Table of contents
Acknowledgement ................................................................................................................................... iii
Resumo ................................................................................................................................................... iv
Abstract.....................................................................................................................................................v
Table of contents ..................................................................................................................................... vi
List of Figures ........................................................................................................................................ viii
List of Tables ............................................................................................................................................x
Acronyms ................................................................................................................................................. xi
1. Introduction ....................................................................................................................................... 1
1.1. Framework and motivation ...................................................................................................... 1
1.2. Objectives and Methodology ................................................................................................... 2
1.3. Structure .................................................................................................................................. 2
2. Mechanical behaviour of aggregate mixtures with C&DRM in unbound pavement layers. ............. 3
2.1. Introduction .............................................................................................................................. 3
2.2. C&DRM concept ...................................................................................................................... 3
2.3. Legislation applicable to C&DRM ............................................................................................ 5
2.4. Use of C&DRM in unbound granular layers ............................................................................ 7
2.5. Characteristics of unbound base and subbase layers .......................................................... 10
2.6. Structural behaviour of unbound granular layers .................................................................. 12
2.7. Repeated Load Triaxial Test ................................................................................................. 13
2.8. Studies with repeated triaxial test on C&DRM ...................................................................... 16
2.9. Materials behaviour modelling ............................................................................................... 21
2.10. Final Remarks........................................................................................................................ 25
3. Experimental Study ........................................................................................................................ 27
3.1. Methods ................................................................................................................................. 27
3.2. Materials ................................................................................................................................ 29
3.3. Equipment description ........................................................................................................... 30
3.4. Specimen preparation ........................................................................................................... 40
4. Results and discussion................................................................................................................... 45
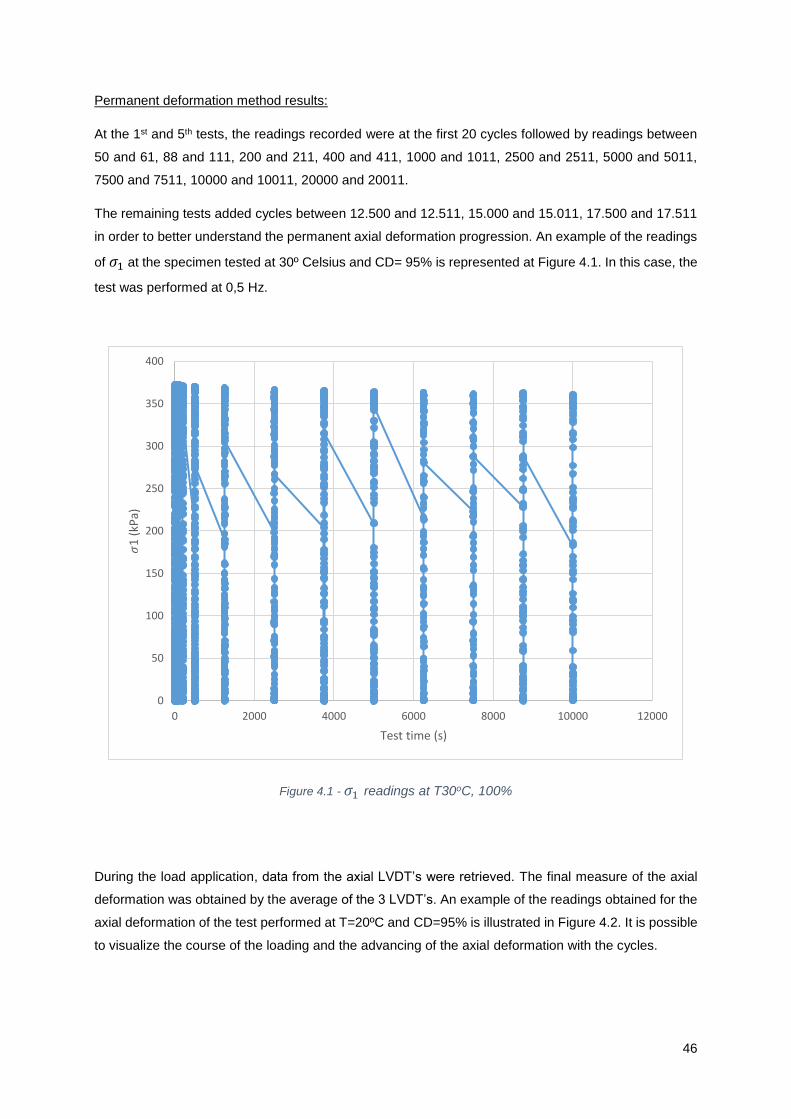
4.1. Considerations ....................................................................................................................... 45
4.2. Study of permanent deformations ......................................................................................... 45
Page 7
vii
4.3. Study of Resilient behaviour .................................................................................................. 49
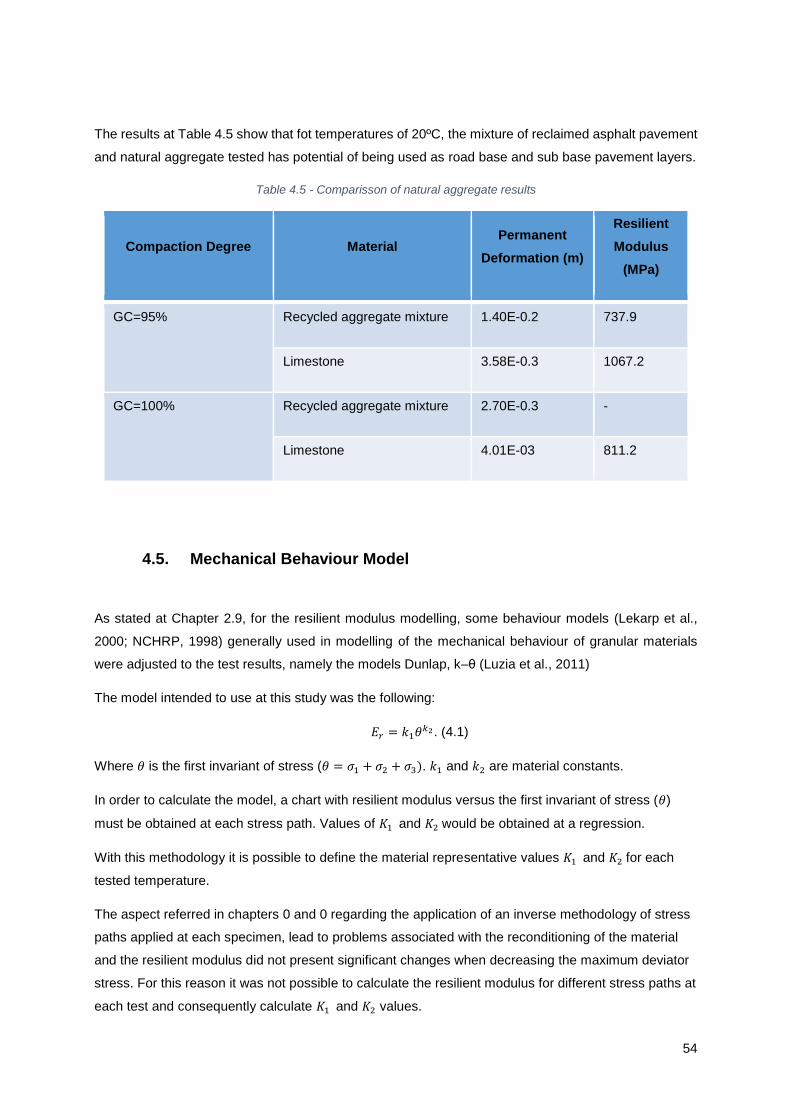
4.4. Study of Natural Aggregate ................................................................................................... 53
4.5. Mechanical Behaviour Model ................................................................................................ 54
5. Conclusions .................................................................................................................................... 55
5.1. General conclusions .............................................................................................................. 55
5.2. Future works .......................................................................................................................... 56
Bibliographic references ........................................................................................................................ 57
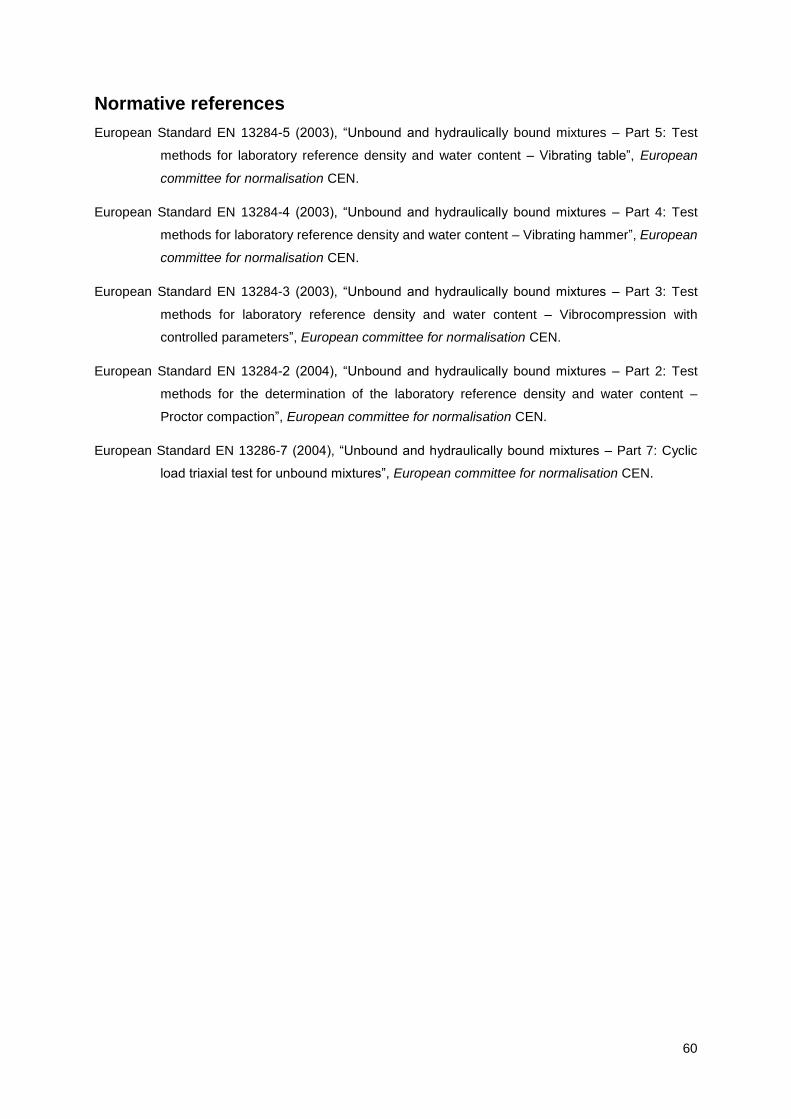
Normative references ............................................................................................................................ 60
Appendice .............................................................................................................................................. 61
Page 8
viii
List of Figures
Figure 2.1 - Concrete from demolition works .......................................................................................... 7
Figure 2.2 - Recycled concrete aggregate .............................................................................................. 7
Figure 2.3 - Reclaimed Asphalt Pavement (morerap.us 2015) ............................................................... 8
Figure 2.4 - Crushed concrete aggregate sample example RCA (SUPREMA, 2008) .......................... 10
Figure 2.5 - Crushed bituminous sample example RAP (SUPREMA, 2008) ........................................ 10
Figure 2.6 - Flexible pavement structure (José Neves 2001) ............................................................... 11
Figure 2.7 - Stress axial symmetry of Triaxial Test ............................................................................... 13
Figure 2.8 - Vibrating hammer ............................................................................................................... 14
Figure 2.9 - Comparison of Performance Using the Two-Parameter Model ......................................... 17
Figure 2.10 - Comparison of stiffness. Crushed concrete and crushed rock with different origin. ........ 18
Figure 2.11 - Resilient modulus variation with the confining strain for granular materiais .................... 19
Figure 2.12 - Resilient modulus versus vertical stress for limestone, crushed concrete ...................... 19
Figure 2.13 - Principle of the strains in the specimen of triaxial testing ................................................ 21
Figure 2.14 - Permanent deformation, comparison between model and empirical test ........................ 22
Figure 2.15 - Permanet deformation results for the C&D RM aggregate ............................................. 23
Figure 2.16 - Modelisation results for Pombal limestone and granite resilient modulus ....................... 24
Figure 2.17 - Calculated values plotted against experimental values of resilient modulus ................... 25
Figure 3.1 - Composition the recycled aggregates from reclaimed asphalt pavement mixture ............ 29
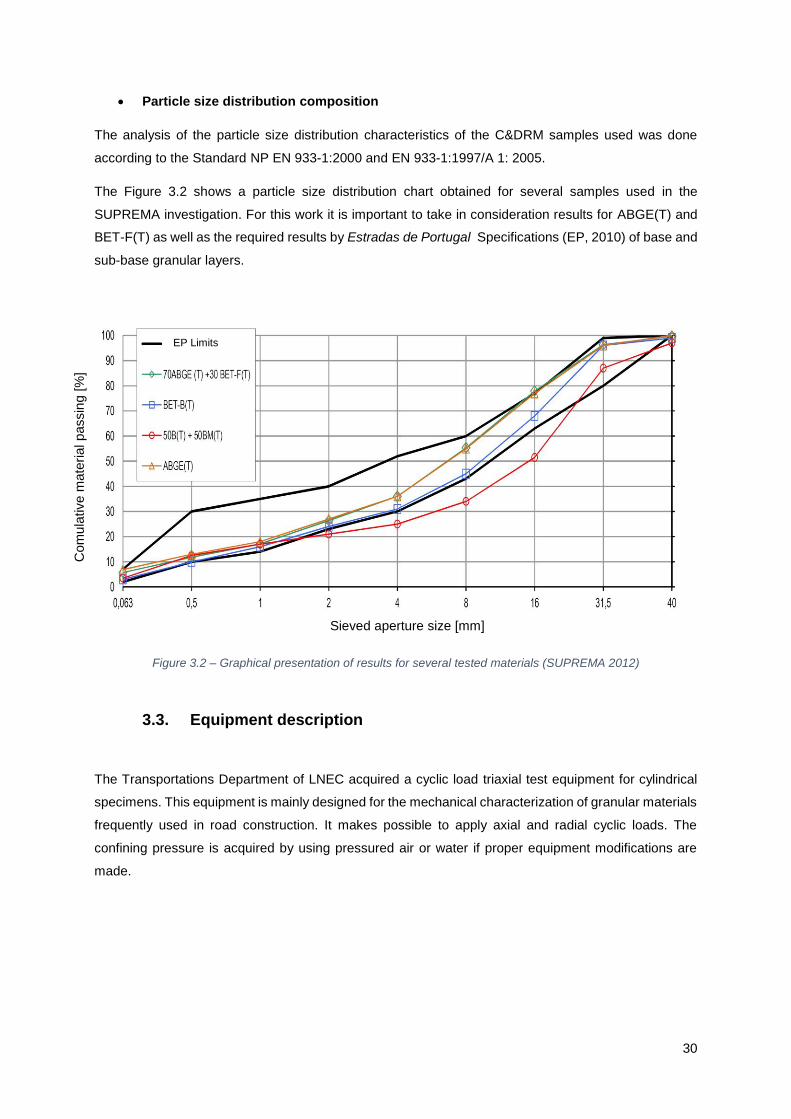
Figure 3.2 – Graphical presentation of results for several tested materials (SUPREMA 2012) ........... 30
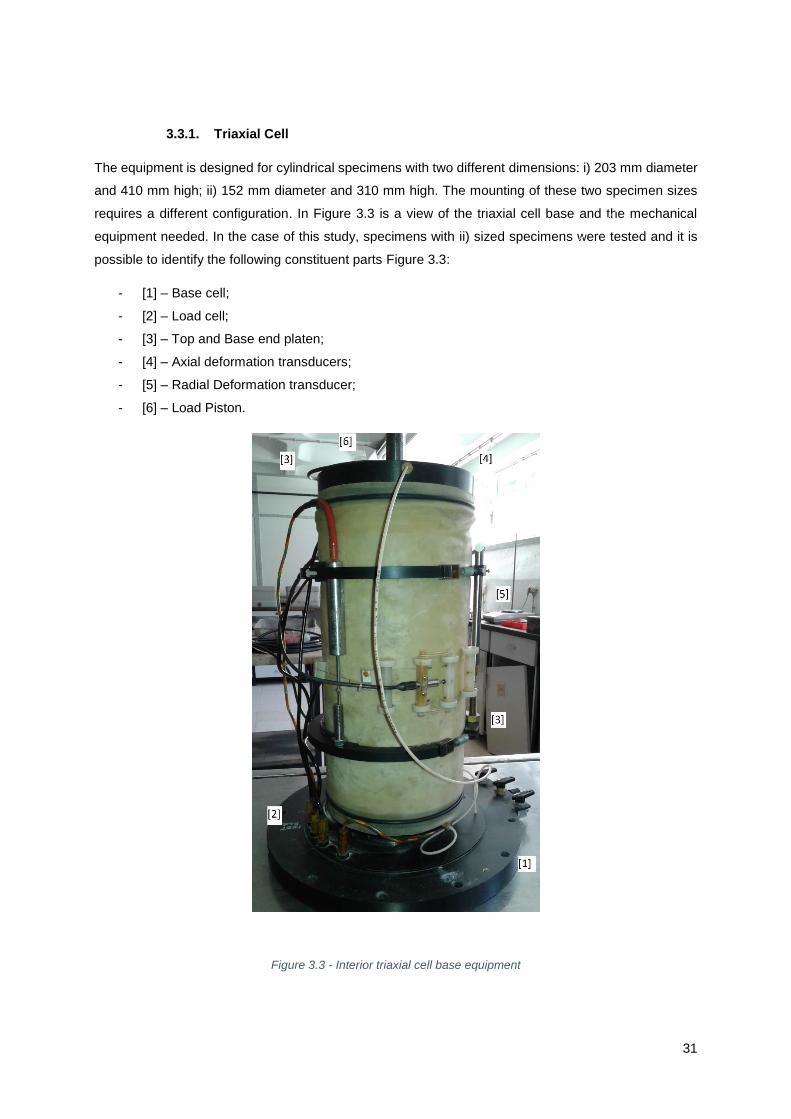
Figure 3.3 - Interior triaxial cell base equipment ................................................................................... 31
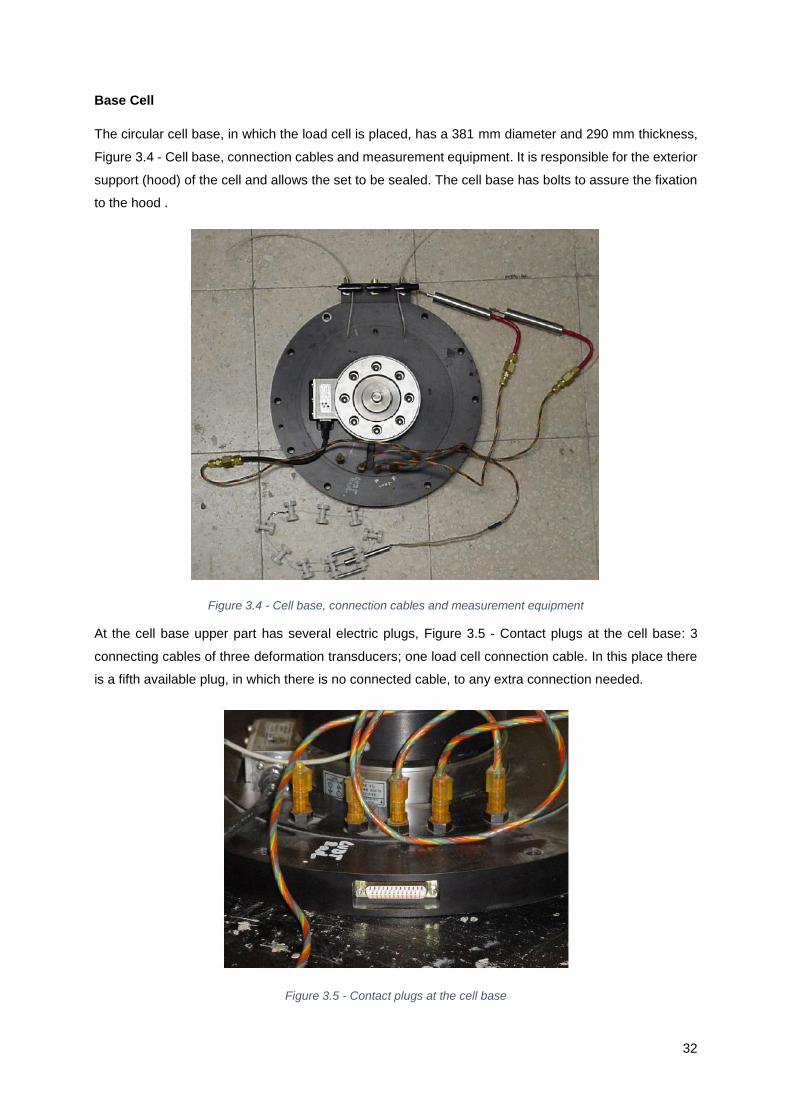
Figure 3.4 - Cell base, connection cables and measurement equipment ............................................. 32
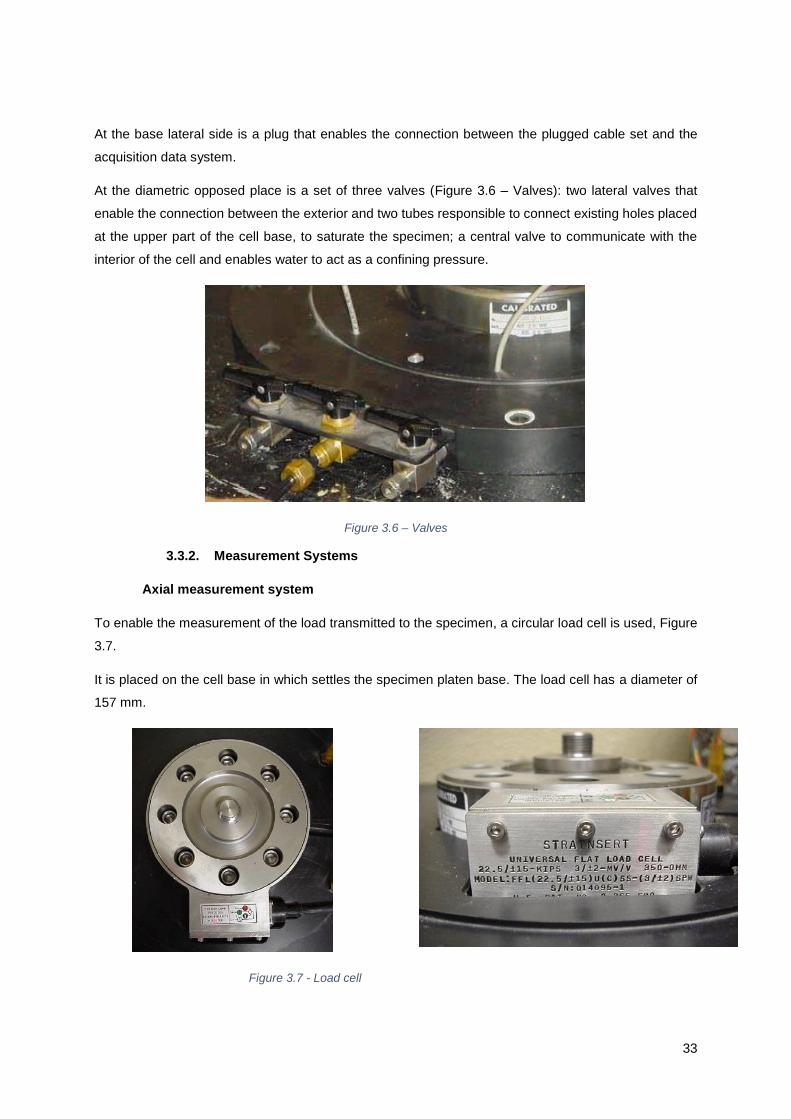
Figure 3.5 - Contact plugs at the cell base ............................................................................................ 32
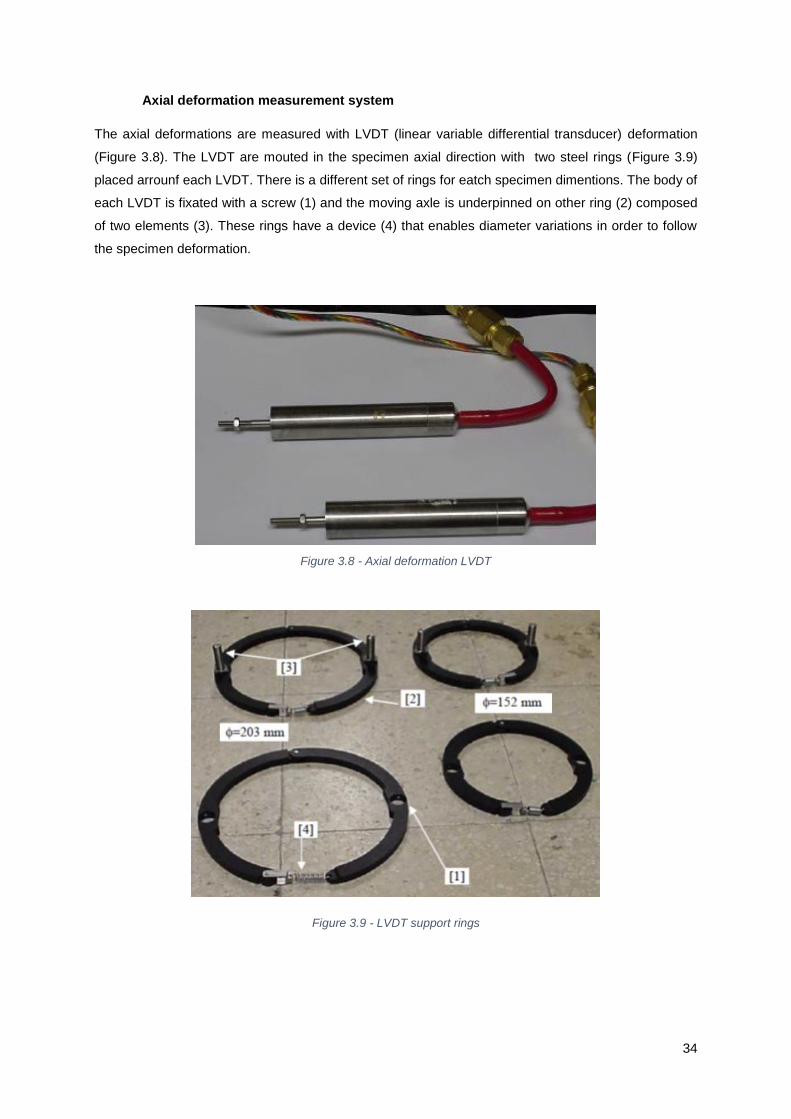
Figure 3.6 – Valves ................................................................................................................................ 33
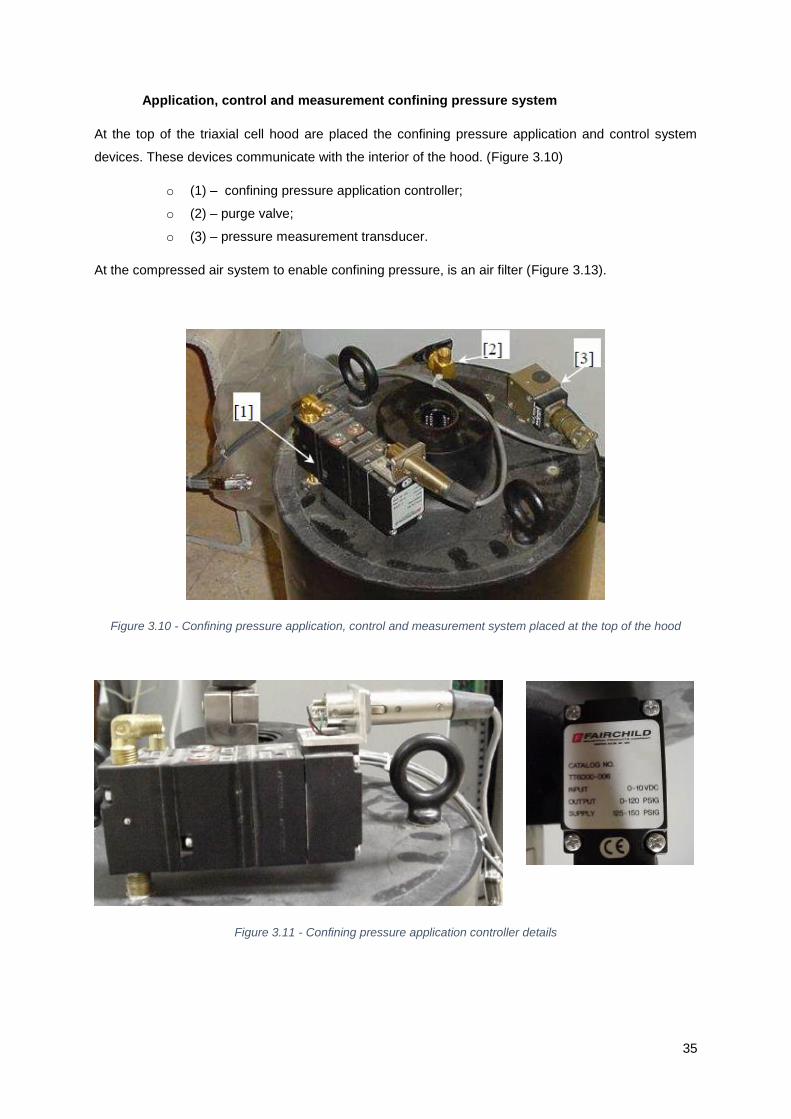
Figure 3.7 - Load cell ............................................................................................................................. 33
Figure 3.8 - Axial deformation LVDT ..................................................................................................... 34
Figure 3.9 - LVDT support rings ............................................................................................................ 34
Figure 3.10 - Confining pressure application, control and measurement system ................................. 35
Figure 3.11 - Confining pressure application controller details ............................................................. 35
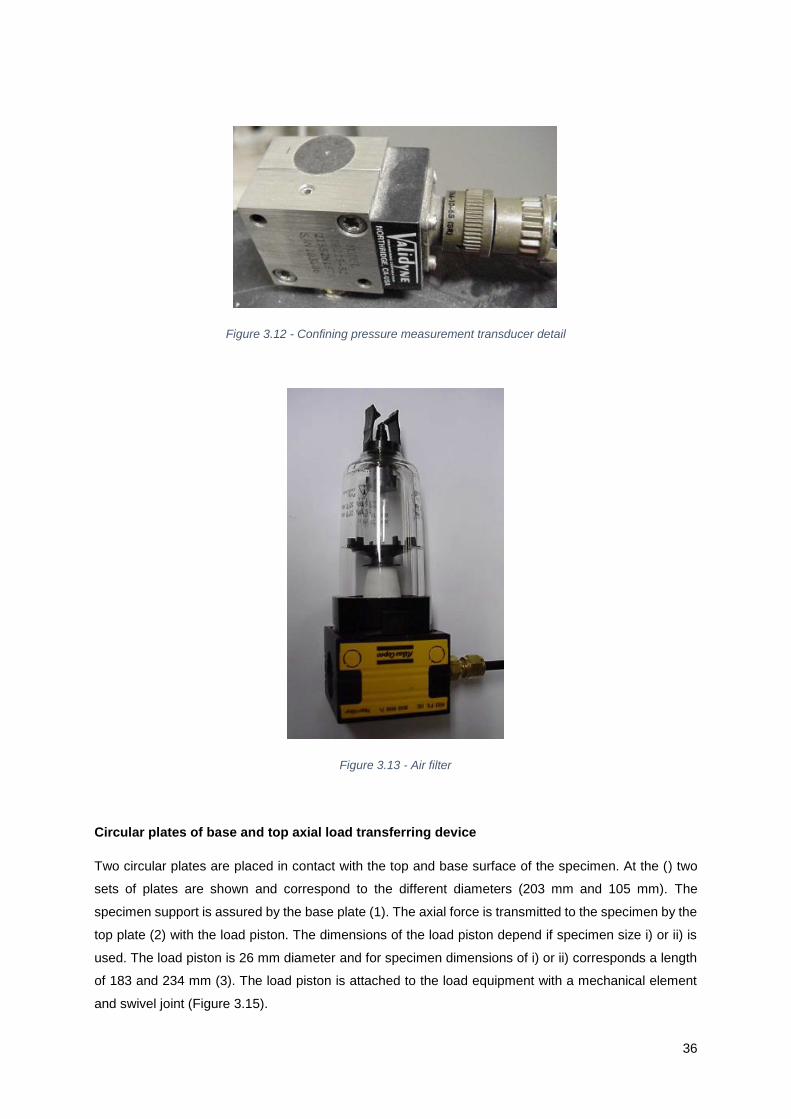
Figure 3.12 - Confining pressure measurement transducer detail ........................................................ 36
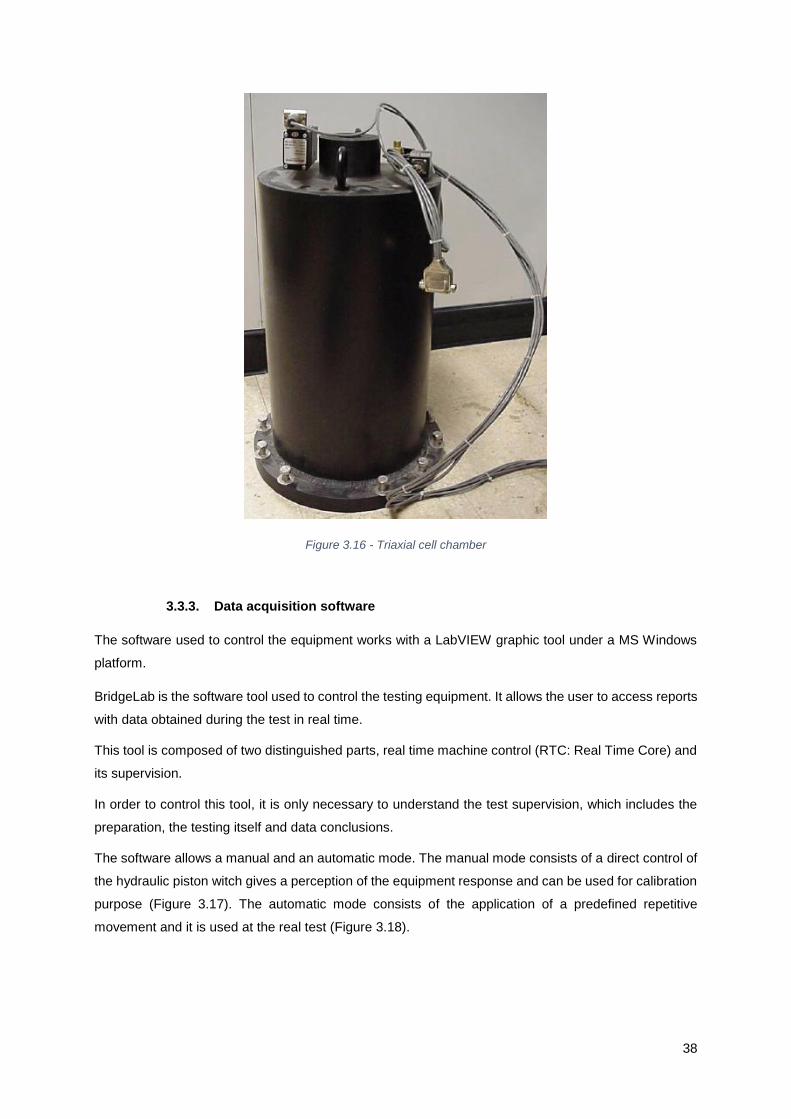
Figure 3.13 - Air filter ............................................................................................................................. 36
Figure 3.14 - Two cell base sets (1) and top (2).................................................................................... 37
Figure 3.15 - Mechanical connecting device of the load ....................................................................... 37
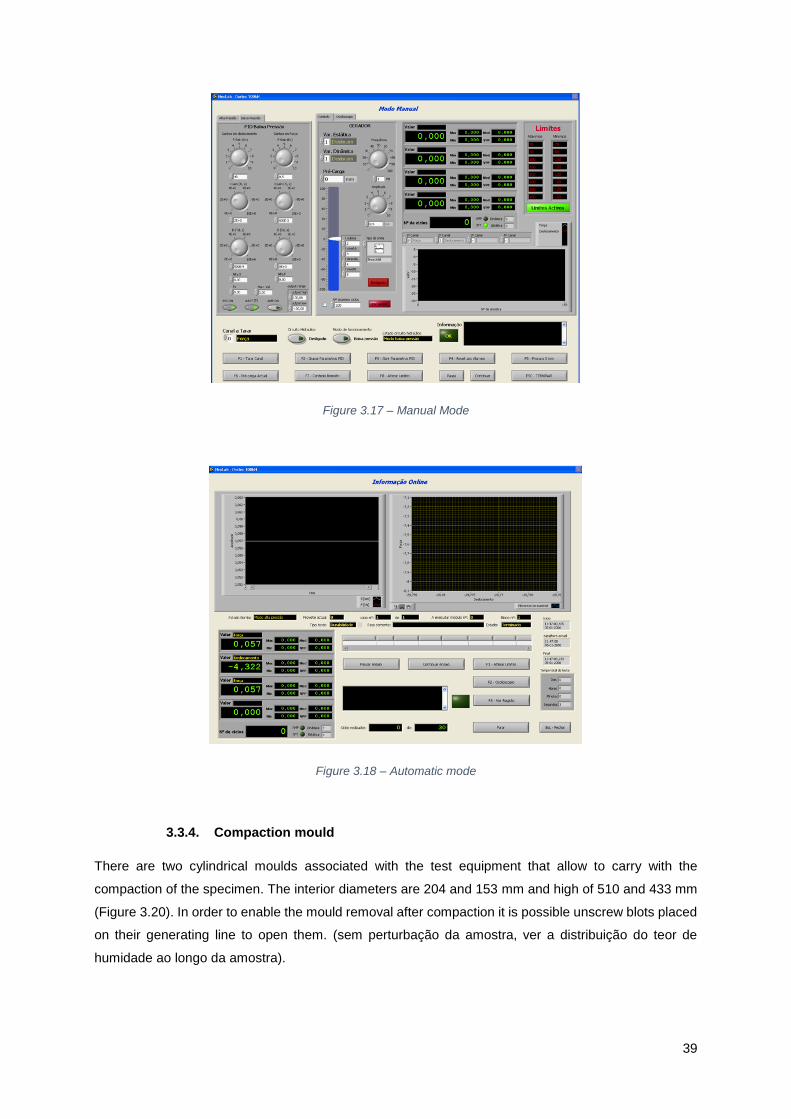
Figure 3.16 - Triaxial cell chamber ........................................................................................................ 38
Figure 3.17 – Manual Mode................................................................................................................... 39
Figure 3.18 – Automatic mode .............................................................................................................. 39
Figure 3.19 - Open mould...................................................................................................................... 40
Figure 3.20 - Compaction mould ........................................................................................................... 40
Figure 3.21 – Material moistening ......................................................................................................... 41
Figure 3.22 - Compaction mould with membrane ................................................................................. 41
Page 9
ix
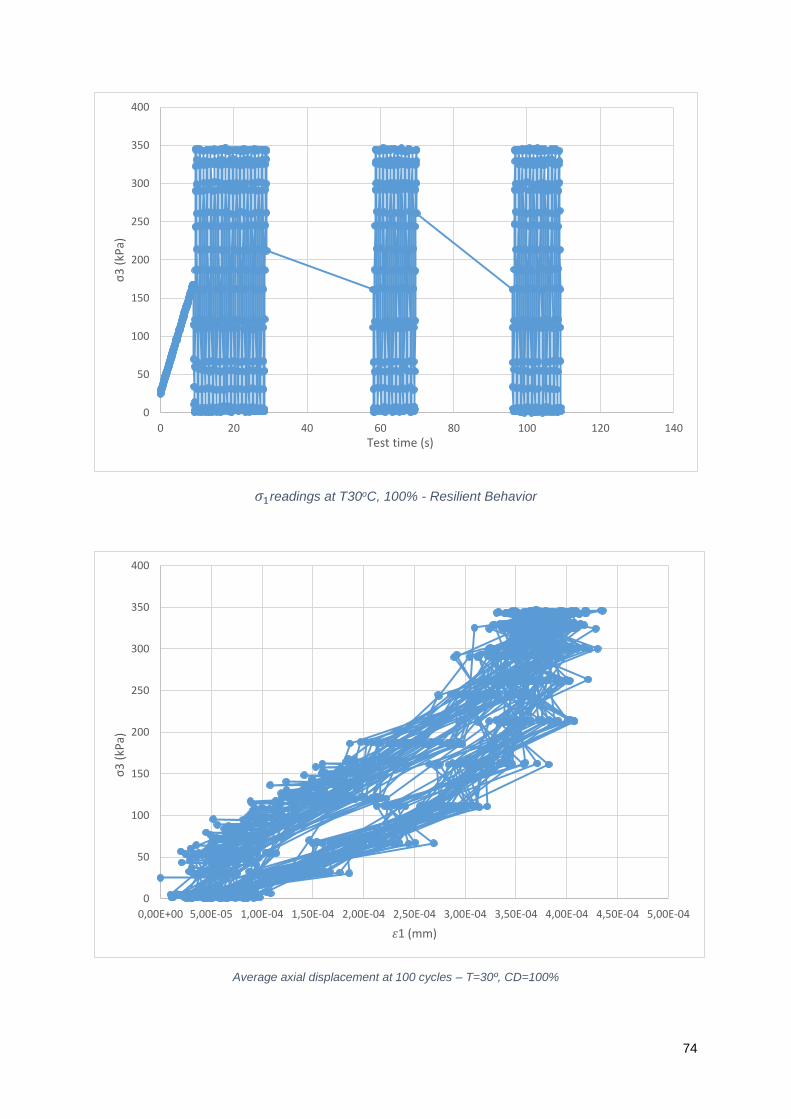
Figure 4.1 - 𝜎1 readings at T30oC, 100% ............................................................................................. 46
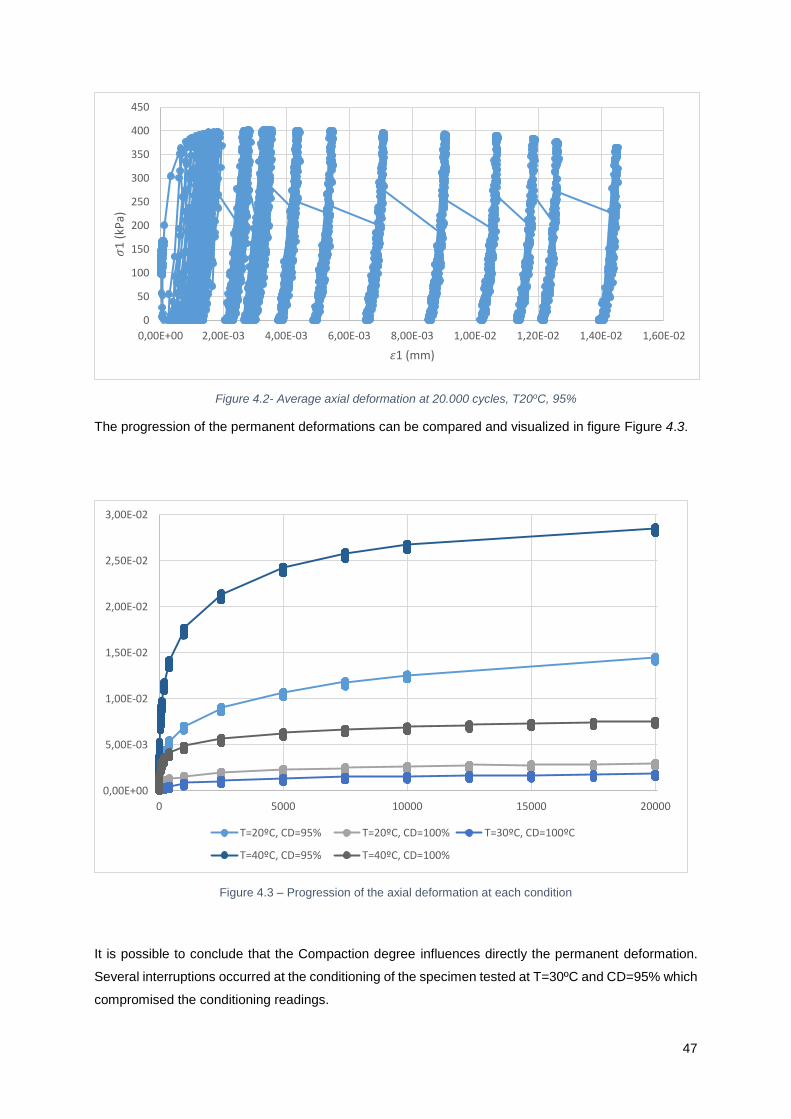
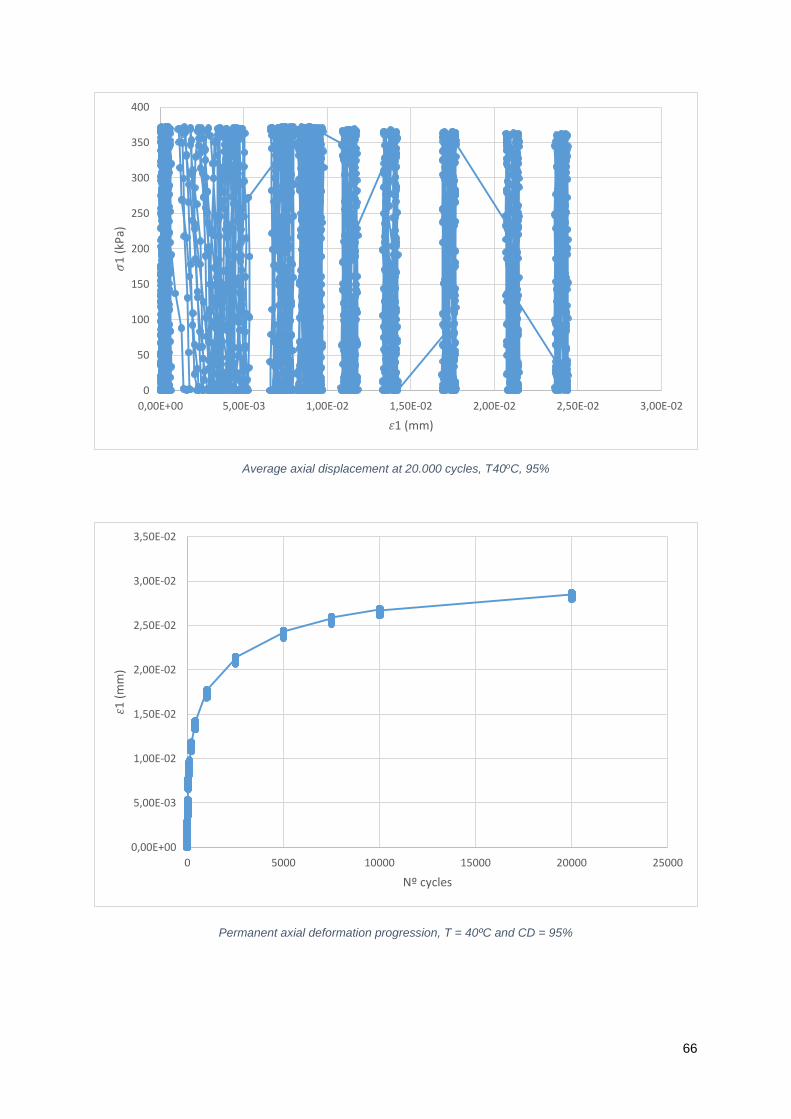
Figure 4.2- Average axial deformation at 20.000 cycles, T20oC, 95% .................................................. 47
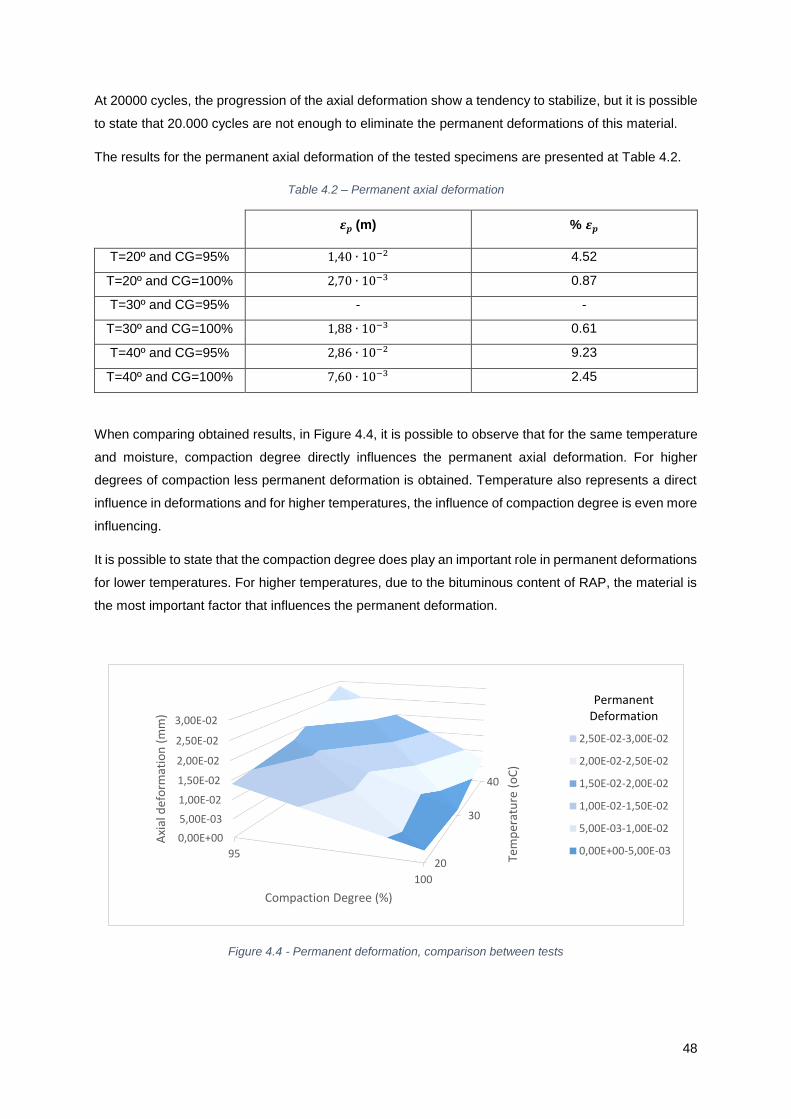
Figure 4.3 – Progression of the axial deformation at each condition .................................................... 47
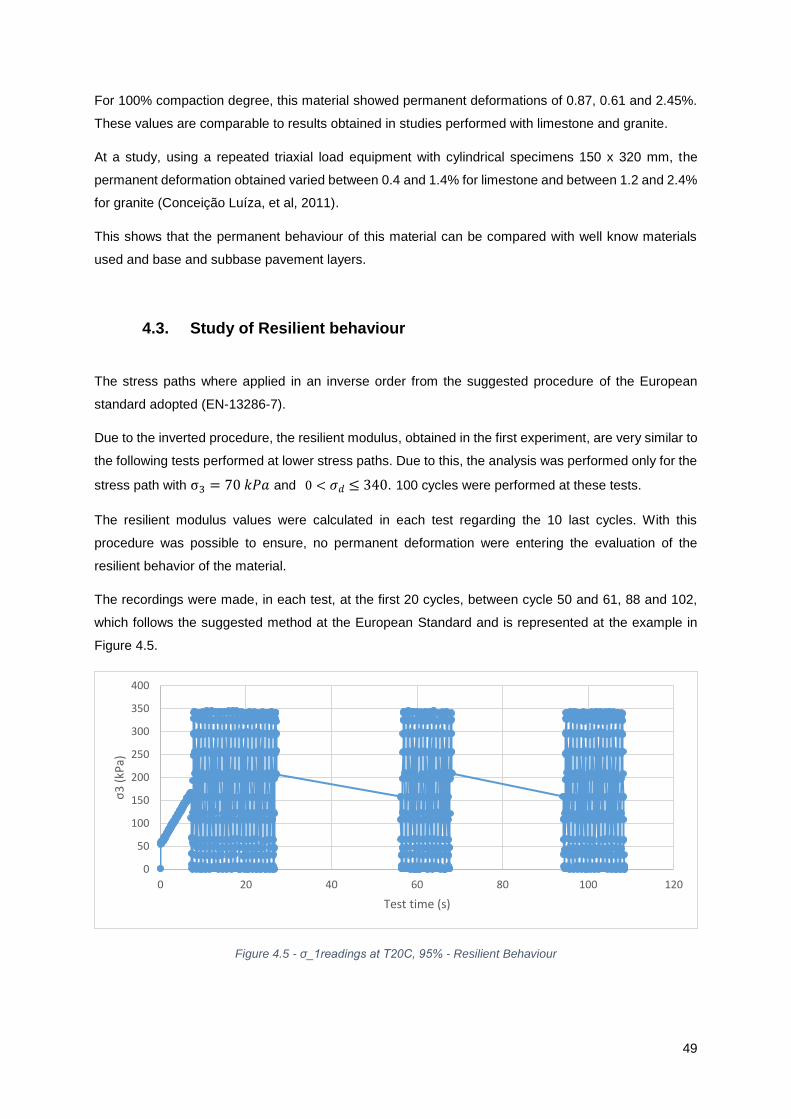
Figure 4.4 - Permanent deformation, comparison between tests ......................................................... 48
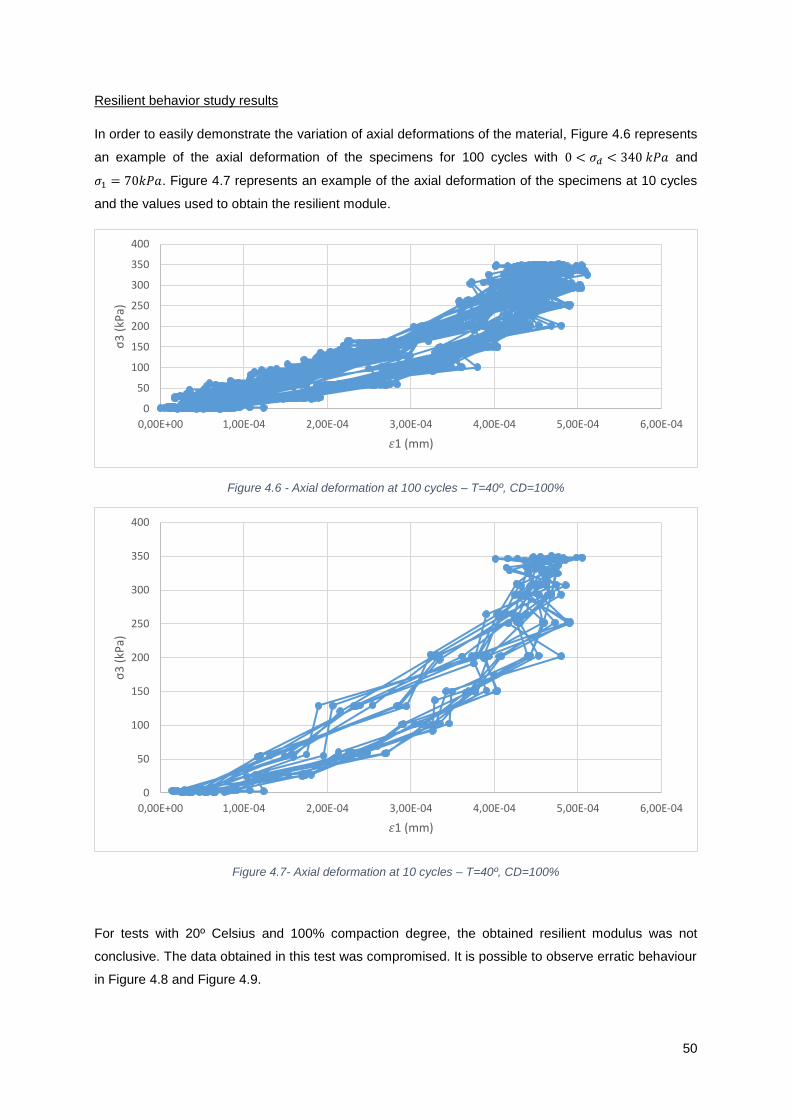
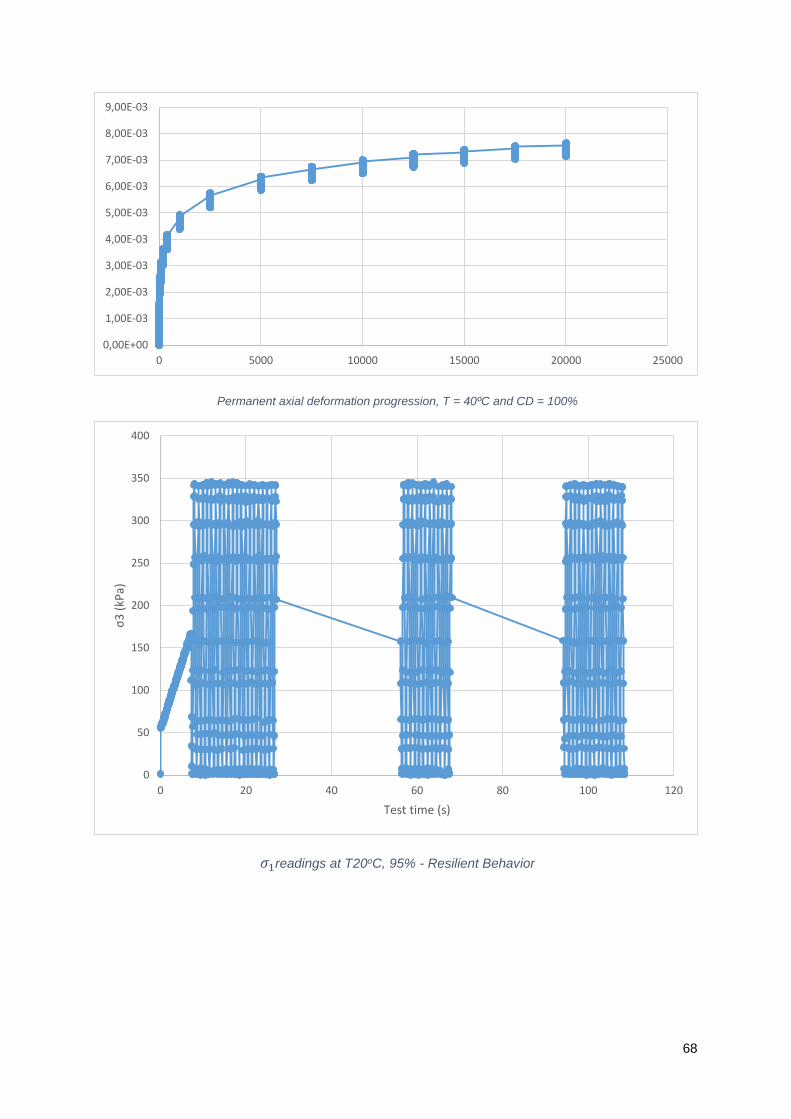
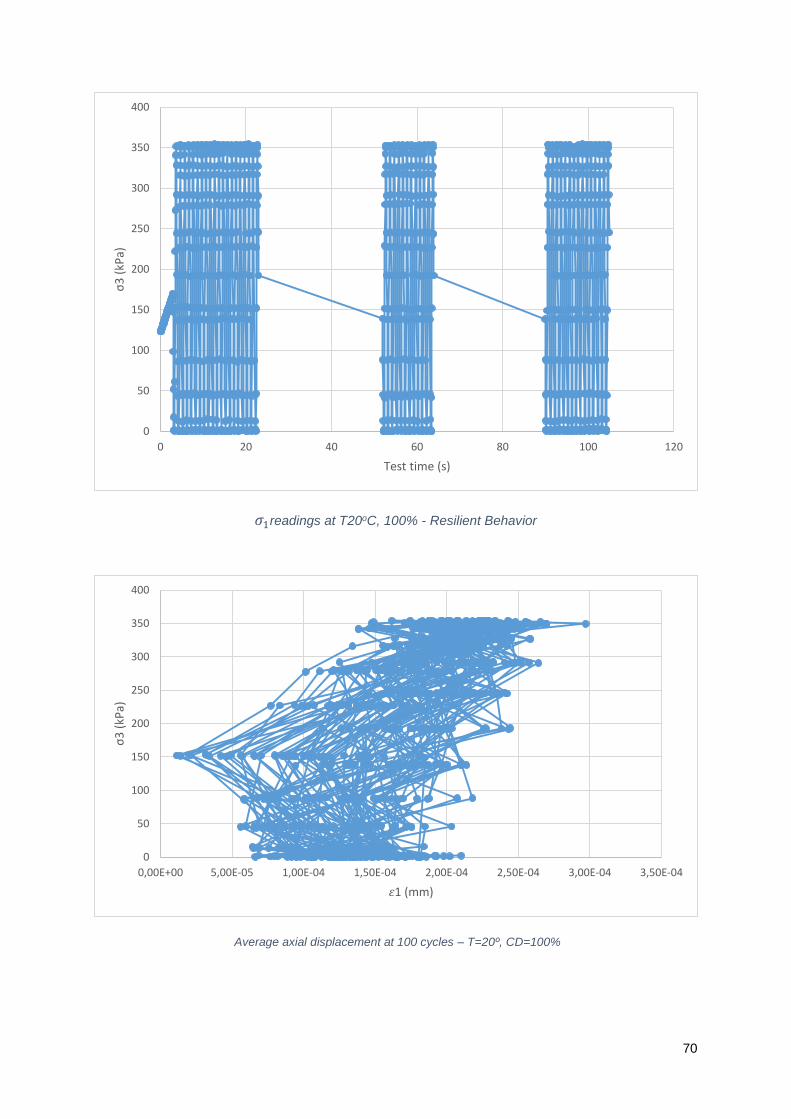
Figure 4.5 - σ_1readings at T20C, 95% - Resilient Behaviour.............................................................. 49
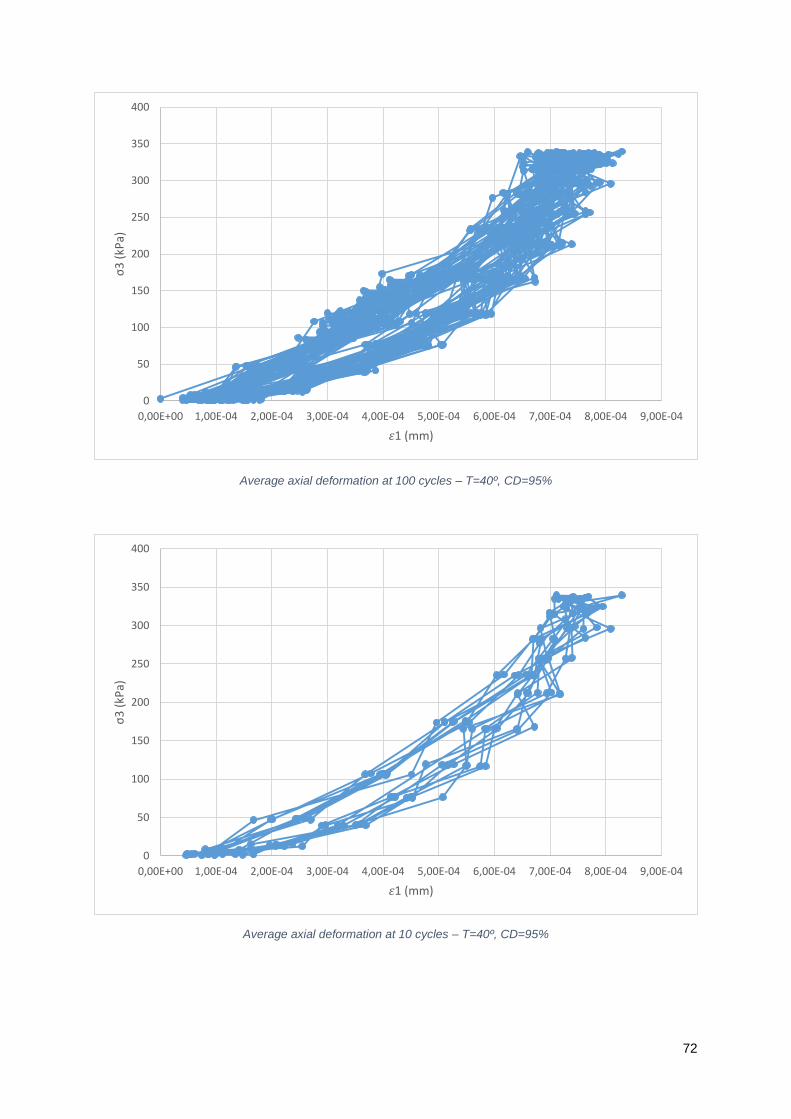
Figure 4.6 - Axial deformation at 100 cycles – T=40º, CD=100% ......................................................... 50
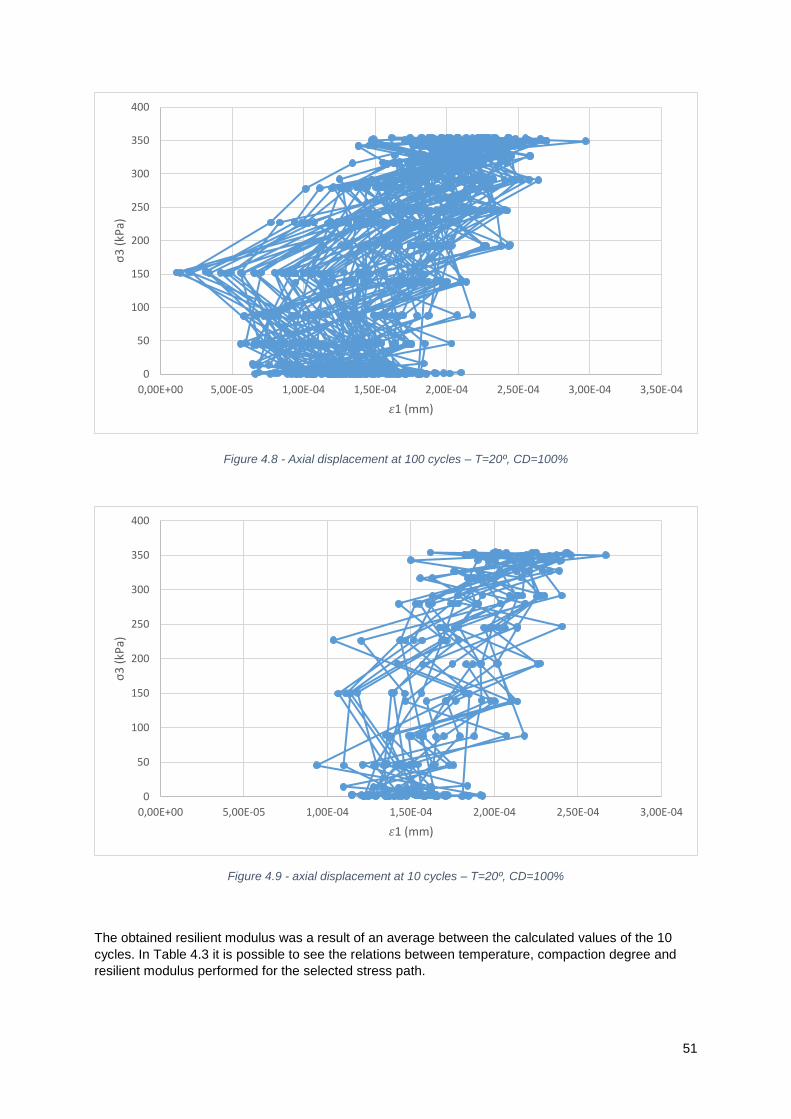
Figure 4.7- Axial deformation at 10 cycles – T=40º, CD=100% ............................................................ 50
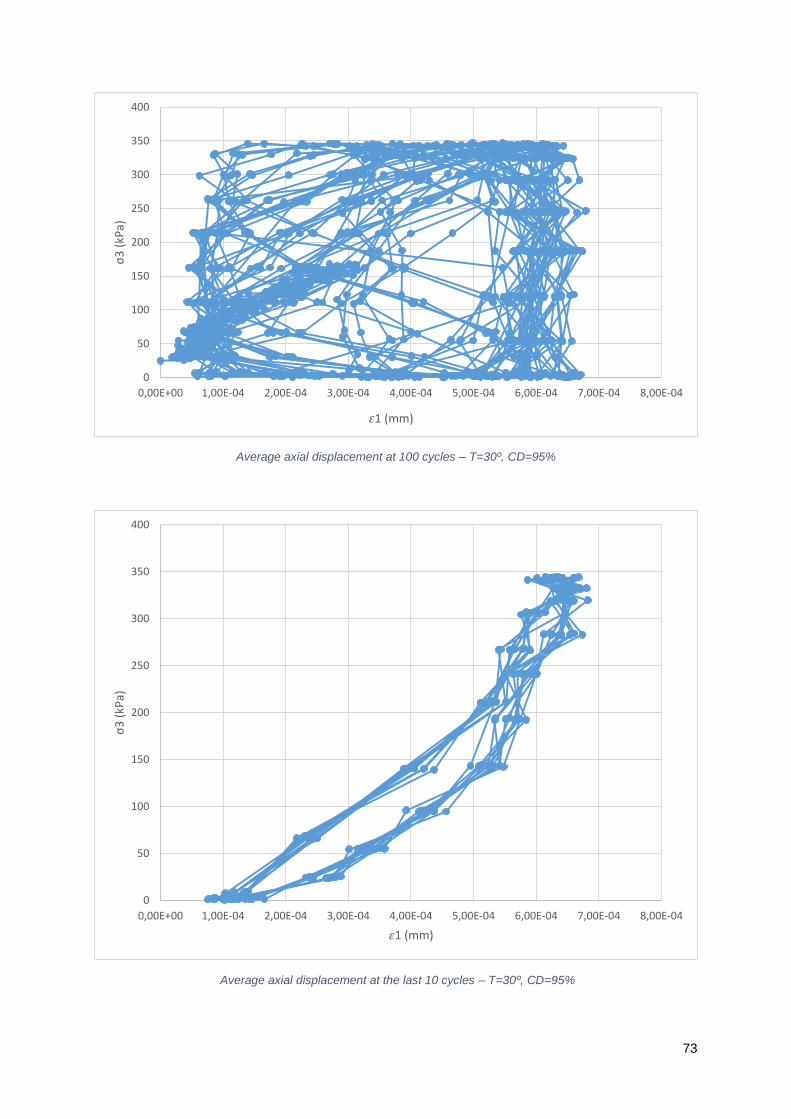
Figure 4.8 - Axial displacement at 100 cycles – T=20º, CD=100% ....................................................... 51
Figure 4.9 - axial displacement at 10 cycles – T=20º, CD=100% ......................................................... 51
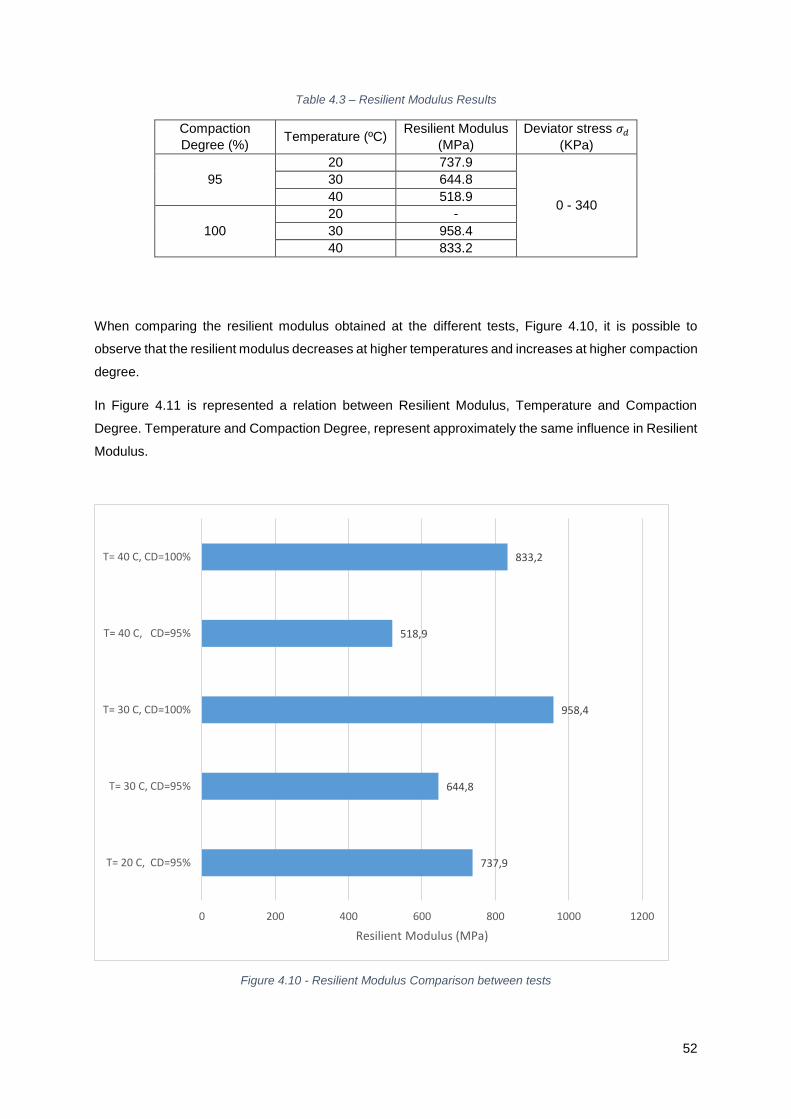
Figure 4.10 - Resilient Modulus Comparison between tests ................................................................. 52
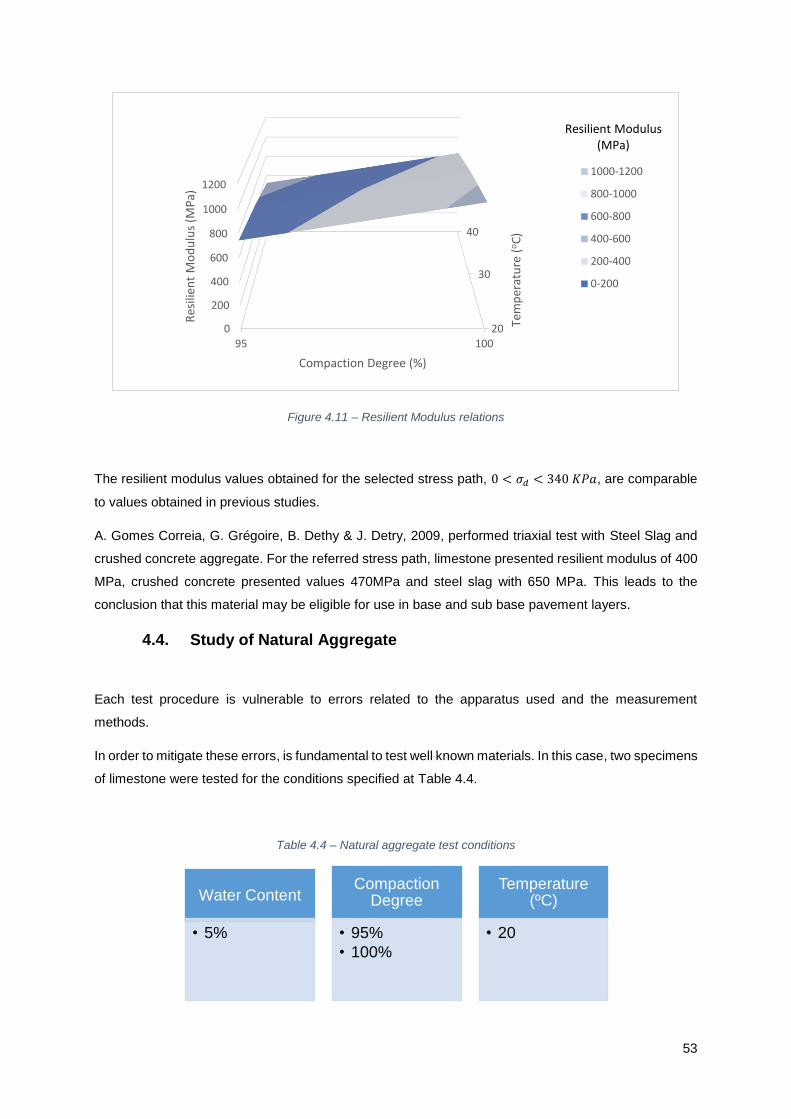
Figure 4.11 – Resilient Modulus relations ............................................................................................. 53
Page 10
x
List of Tables
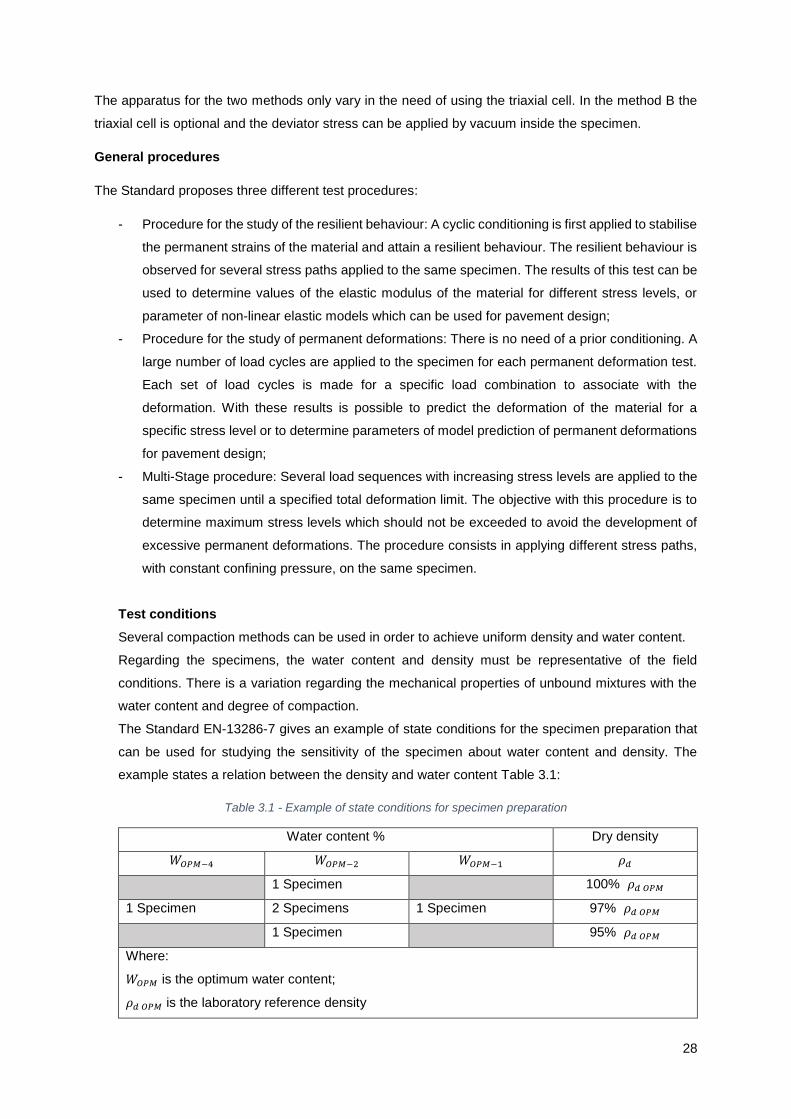
Table 3.1 - Example of state conditions for specimen preparation ....................................................... 28
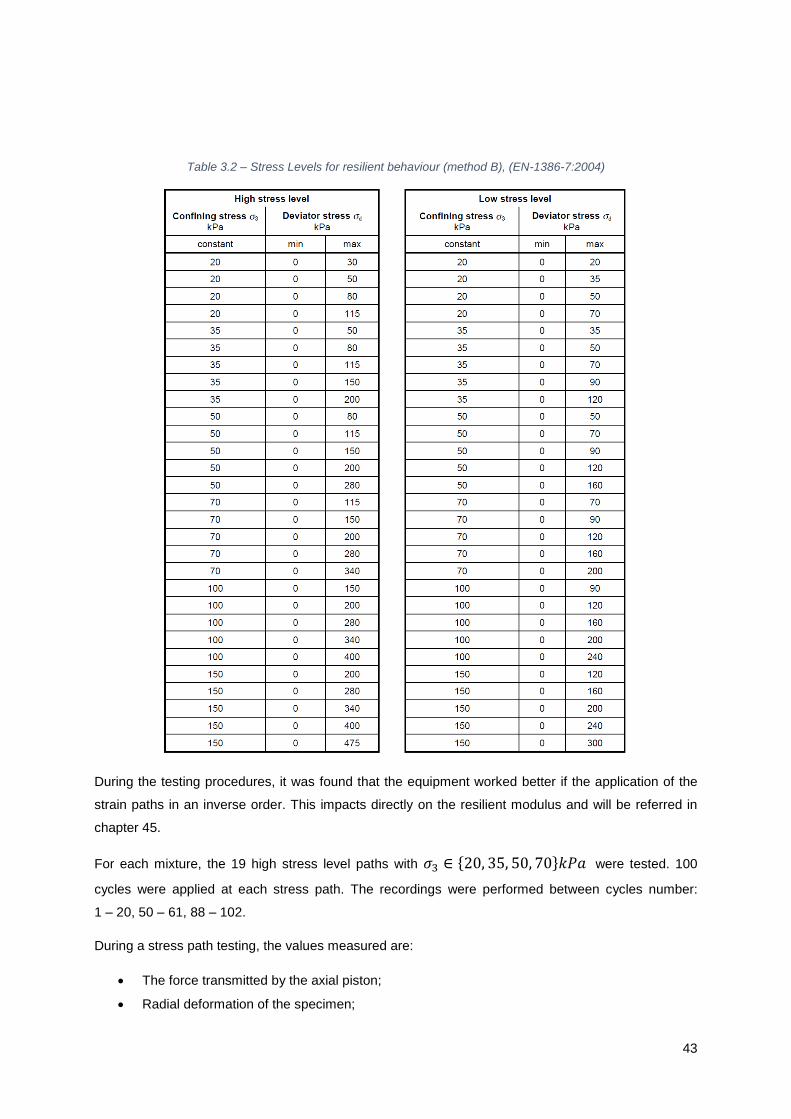
Table 3.2 – Stress Levels for resilient behaviour (method B), (EN-1386-7:2004) ................................ 43
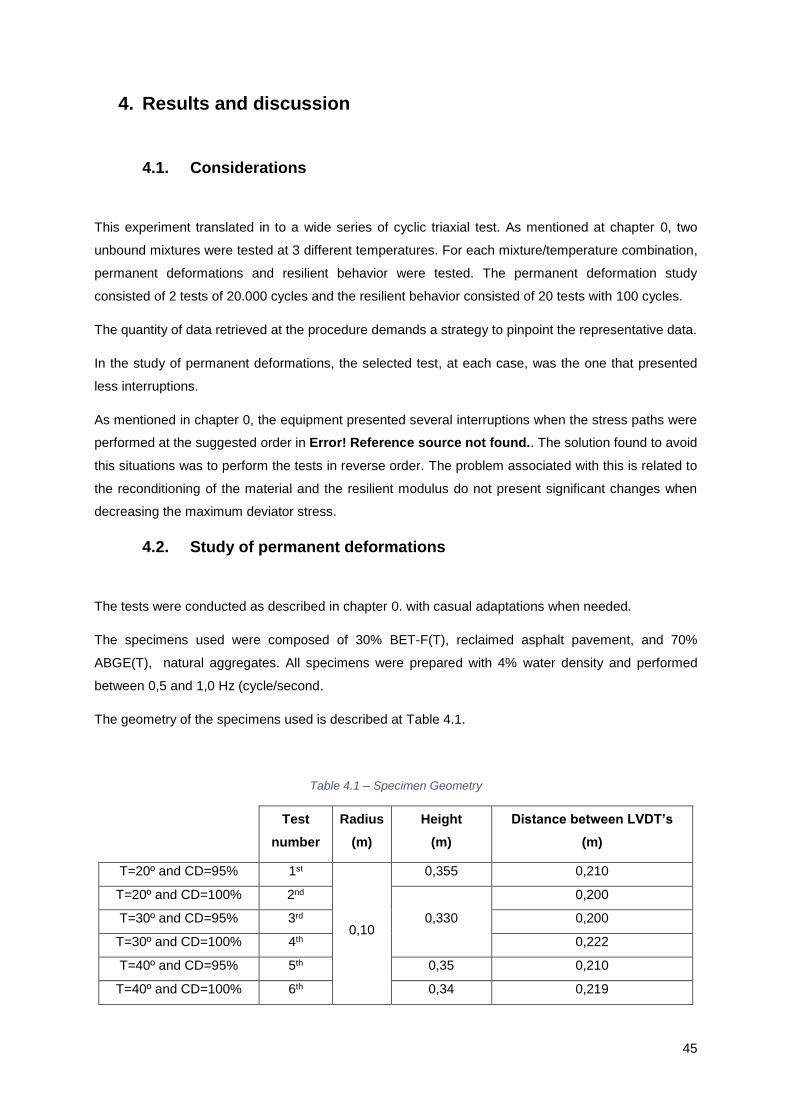
Table 4.1 – Specimen Geometry ........................................................................................................... 45
Table 4.2 – Permanent axial deformation ............................................................................................. 48
Table 4.3 – Resilient Modulus Results .................................................................................................. 52
Table 4.4 – Natural aggregate test conditions....................................................................................... 53
Table 4.5 - Comparisson of natural aggregate results .......................................................................... 54
Page 11
xi
Acronyms
C&DRM - Construction and demolition recycled materials;
C&DW - Construction and demolition waste;
APA - Associação Portuguesa do Ambiente;
LER - Lista Europeia de Resíduos;
EC - European Commission;
CSSA - Crop Science Society of America;
CETRA - International conference on road and rail infrastructure;
RAP - Reclaimed asphalt pavement;
RCA - Recycled concrete aggregates
AASHTO - American Association of State Highway and Transportation Officials
Page 12
1
1. Introduction
1.1. Framework and motivation
Recycling is the best way to manage construction and demolition waste. The negative environmental,
social, and economic impacts on waste disposal to landfills, increasing waste generation with the
population increase, community demand to recycle more, and national waste policies and legislations
on recycling waste, have demanded the need for recycling.
Roads are one of the biggest assets in any country. Construction and rehabilitation of roads demand a
large volume of crushed rock as granular layers, stabilized granular layers, and aggregates for asphalt
production.
Throughout Europe there is pressure to increase the use of alternative materials in construction
applications such as roads. This is reflected in the hierarchy of waste disposal options set out by the
European Commission in the Community Strategy for Waste Management:
1. Prevention: minimise waste production and the use of natural materials
2. Recovery: recycling of materials at the highest possible technical level
3. Incineration to recover energy and minimise volumes that have to be deposited
4. Disposal in landfills
The use of alternative materials in road construction contributes directly to options 1 and 2, by reducing
the amount of natural aggregate consumed and recycling materials that would otherwise be disposed
of as waste. It reduces reliance on option 4, and enables the products of option 3 to be recycled in
construction instead of being landfilled. (Commission of the European Communities, 1996)
From the point of view of mechanical performance, uncertainties about alternative materials remain,
especially with respect to the long-term performance. The nature and composition of alternative
materials is often significantly different from that of natural aggregates, and existing tests for natural
aggregates may not be appropriate.
Existing asphalt pavement materials are commonly removed during resurfacing, rehabilitation, or
reconstruction operations. Once removed and processed, the pavement material becomes Reclaimed
Asphalt Pavement (RAP), which contains valuable asphat binder and aggregate. RAP is most commonly
used as an aggregate and virgin asphalt binder substitute in recycled asphalt paving, but it is also used
as an unbounded granular base or subbase, stabilized base aggregate, and embankment or fill material.
It can also be used in other construction applications. RAP is a valuable, high-quality material that can
replace more expensive virgin aggregates and binders. (Stephanos, Pagán-Ortiz, 2011)
The use of Construction and demolition recycled materials (C&DRM) at unbound pavement layers
namely base and sub base road pavement layers is a matter of interest. In order to access if a certain
Page 13
2
material can replace well known natural aggregates it is important to study mechanic and physical
characteristics when submitted to the conditions verified in situ.
1.2. Objectives and Methodology
The main objective of this work is to add a positive input regarding the study of construction and
demolition recycled materials, more specifically its use for road construction purposes. It is intended to
simulate the long term behaviour of the material when subjected to similar to real conditions.
To achieve the purposed objectives, a cyclic triaxial load was performed to a mix of natural aggregate
and reclaimed asphalt pavement, accordingly to the European Standard. A study of permanent
deformations and resilient behaviour is conducted to describe as accurately as possible the mechanical
and physical potential of the material.
1.3. Structure
The present dissertation is divided into five chapters. The first chapter corresponds to the introduction,
where a scope to address the subject is made and the main objectives are presented. In chapter 2 an
overview of the of construction and demolition recycled materials is made to what concerns its definition,
the legislation applicable to it, the behaviour demands and specifications to be eligible to be applied in
roads as unbounded base and sub base pavement layers. Chapter 2 also approaches some
specifications related to the European Standard used at cyclic triaxial testing and material behaviour
modulation. Chapter 3 explains every aspect of the experimental study. It approaches the methods
used, the materials tested (mixture of 70% natural aggregate and 30% of reclaimed asphalt pavement)
as well as equipment specifications and all procedures regarding tests. Chapter 4 presents the results
obtained at the experimental study and compares them with results from another authors. Chapter 5
presents the general conclusions of this thesis and some recommendations for future works.
Page 14
3
2. Mechanical behaviour of aggregate mixtures with C&DRM in
unbound pavement layers.
2.1. Introduction
The constant use of natural resources presents evident negative environmental impacts at several
levels. For instance, there is a conversion of land use from undeveloped or agricultural land, to a hole
on the ground empowering geological problems and a bigger degradation of land value. There is a
growing concern for environmental impacts that pressures political power to create laws and associated
taxes for use and waste of natural resources. The use of recycled construction and demolition waste is
a way of reducing waste materials and to avoid the payment of taxes associated with these procedures.
To use recycled materials is necessary to understand its behaviour when submitted to final conditions
and the existing legislation applied.
This second chapter consists of an approaching to the problematic evolving the use of recycled materials
from construction and demolition works. It includes references to the existing legislations applied in order
to understand how the activities involving C&DRM are regulated; an introduction to the behaviour
requirements for its use in unbound pavements; a reference to repeated load triaxial test, its advantages,
down sides and specimen compaction methods.
2.2. C&DRM concept
According to the Portuguese decree-law nº 73/2011 of July 17th, the sources of C&DW are construction
activities, reconstruction, modifications, conservation, demolitions and building downfall. These residues
can result from buildings, roads and other structures. In order to retrieve the maximum quantity of a
demolition activity a selective procedure is needed.
Construction and Demolition Waste is one of the heaviest and most voluminous waste streams
generated in the EU. It accounts for approximately 25% - 30% of all waste generated in the EU. and
consists of numerous materials, including concrete, bricks, gypsum, wood, glass, metals, plastic,
solvents, asbestos and excavated soil, many of which can be recycled (EC, 2015).
The global production at European Union is estimated in 100 million tons. Despite significant quantities
associated, these residues present another challenge to its management namely their heterogeneous
constitution, various sizes and different levels of danger. The civil construction activity presents various
specifications, as the geographical disperse and temporary character of work sites that difficult the
environmental performance control and inspection of the sector corporations. The difficult
Page 15
4
quantifications, uncontrolled landfill and the use of special systems of treatment of non-usable materials,
constitute the restrains parallel to this sector. These situations can lead to undesirable environmental
situations that represent the opposite of the national and European goals for this matter. Such reality
motivates a bigger concern at the field of legislation. (APA 2015)
The composition of C&DRM is directly connected to the characteristics of its generator source and the
moment of collection. There are several aspects that play an important part on the quantity, composition
and characteristics of C&DW namely:
- Regarding the level of development of local construction industry:
o Quality and experience of available labour.
o Construction and demolition used techniques.
o Implementation of quality and loss reduction programs.
o Implementation of recycling process and construction site reuse
- Types of materials available in the construction region.
- Special works development in the region (Subway, sanitation, historical centre recovery,
between others.
- Region’s economic development.
- Demand for new Constructions. (Gonçalves, Martins, 2010)
C&DW has been identified as a priority waste stream by the European Union. There is a high potential
for recycling and re-use of C&DW, since some of its components have a high resource value. In
particular, there is a re-use market for aggregates derived from C&DW waste in roads, drainage and
other construction projects. Technology for the separation and recovery of construction and demolition
waste is well established, readily accessible and in general inexpensive. [EC 2015]
According to the European list of residues (LER, 2004), transported to the Portuguese legislation
nº209/2004 of March 3rd of 2004, the C&DW are composed by:
- Concrete, bricks, tiles and ceramic materials;
- Wood, glass and plastic;
- Bituminous mixtures, asphalt;
- Metals including alloys;
- Soils (including contaminated excavated soils), rocks and draining muds;
- Insolation Materials and construction materials with asbestos;
- Other construction and demolition residues.
It is estimated that in Europe the C&DW comes between 10% and 20% from construction waste, 30%
to 40% from renovation, rehabilitation and remodelling and 40% to 50% from demolition works. [José
Ferreira 2009]
Page 16
5
2.3. Legislation applicable to C&DRM
The valorisation of the waste from operations of construction and demolition (C&DRM) became an
important subject due to environmental issues, strict policies regarding the treatment, storage and
managing of C&DRM have been implemented and higher fines have been applied to incorrect
procedures. Reusing this materials in the same construction site where they are produced leads to
significant savings in money and time [Tuncer B. Edil 2011].
There is a growth of decree-laws and policies to legislate the procedures evolving C&DRM. The first
policy to be implemented in Europe was the 75/442CEE of July 15th of 1975. At that time it made a clear
approximation of the different existing legislations regarding this subject with the goal to protect Man,
the environment and encourage the use of recycled materials and residue recovery. It also set the
principle that the entities that contribute to contamination, must be held responsible.
In Portugal, the first regulation to face the problem of waste management was in 1985 with the decree-
law nº488/85. This document embraced a less residue production through the development of recycling
technologies. It addressed the elimination of non-recyclable materials, quantification and
characterisation of produced residues and the identification of their producers and its final destiny. At
this stage was created, in Portugal, a system of mandatory registration for residues and defined
management skills and responsibility. Later on, the creation of European policies led to the repeal of
this document. (R. Simões 2013)
The resolutions of the Council at May 7th of 1990 about policy in the matter of residues (90/C122/02)
refers that the production of waste must be limited at the source and the ones impossible to reuse must
be eliminated in a safe way, each country must set the goal to self-sufficiency. The categorization of the
residues and its elimination and valorisation operations as well as the operations needed regarding the
management where regulated and defined in the European Council’s Directive of March 18th of 1991
(91/156/CEE).
At the Council’s resolution 97/C.76/01 of February 24th of 1997 the accountability referring to prevention,
valorisation and elimination of residues is considered to be held by manufacturers, importers, distributors
and consumers.
In January 16th of 2001, the European Commission published the LER, following the nº209/2004 of
March 3rd. The different types of residues listed are defined by a code of six digits referring to the specific
residues, two digits referring to the chapter and four to sub-chapter.
In Portugal, the decree-law nº178/2006 of September 5th was referred to residue management
operations including all operations of collection, transport, storage, screening, treatment, valorisation
and elimination. This decree was in force until 2011 and also referred operations of decontaminations
of soils, monitoring the deposition sites before inactivation.
Page 17
6
The Portuguese decree-law nº 4 6/2008 of March 12nd sets specific rules on this subject, collection
operations, transport, triage and identification of offenses in the procedures and the correspondent fines
applied. The Portuguese Law Decree nº73/2011, of June 17th transposes the European Policy nr
2008/98CE that in between other aspects, refers to a promotion of the full use of an organised C&DRM
market in order to add value to waste with benefits for the economic agents. Sets goals for the
valorisation of C&DRM and its use in public works and proposes a criteria in order to change the status
of waste to a sub product.
One of the objectives of the Waste Framework Directive (2008/98/EC) is to provide a framework for
moving towards a European recycling society with a high level of resource efficiency. In particular, Article
11.2 stipulates that "Member States shall take the necessary measures designed to achieve that by
2020 a minimum of 70% (by weight) of non-hazardous construction and demolition waste excluding
naturally occurring material defined in category 17 05 04 in the List of Wastes shall be prepared for re-
use, recycled or undergo other material recovery" (including backfilling operations using waste to
substitute other materials).
In Portugal the LNEC specifications provide recommendations and state minimum requirements in the
usage of recycled construction and demolition waste in pavement layers. The LNEC E 471 is regarding
the use of coarse recycled aggregates in bituminous hydraulic binders. The LNEC E 472 states
specifications for the recycling of hot bituminous mixtures in Plant. The LNEC E 473 comes in the context
of the use of recycles aggregates in unbound pavement layers. The LNEC E 474 is referred to recycles
materials in landfills and subgrade pavement layers of transport infrastructures.
The Portuguese law 46/2008 stated that the usage of C&DRM in civil works follows the LNEC
specifications when no other technical Standards are eligible.
The Portuguese law 73/2011 brought the concept of subproduct and the end of residue status. The term
subproduct came in the article nr. 44-A and is defined by any substances ore objects that result from a
production operation of another product. The end of residue status was referred on the article nr. 44-B
and is applied to determined residues that have suffered a valorisation operation including recycling.
Page 18
7
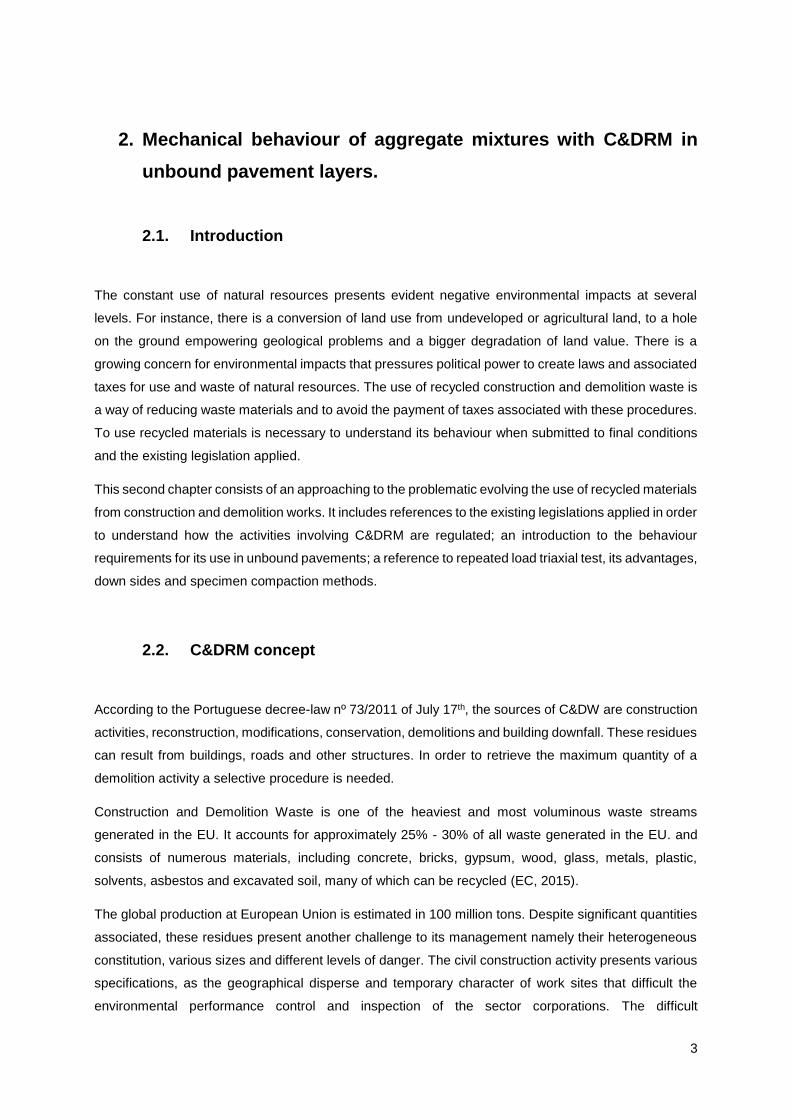
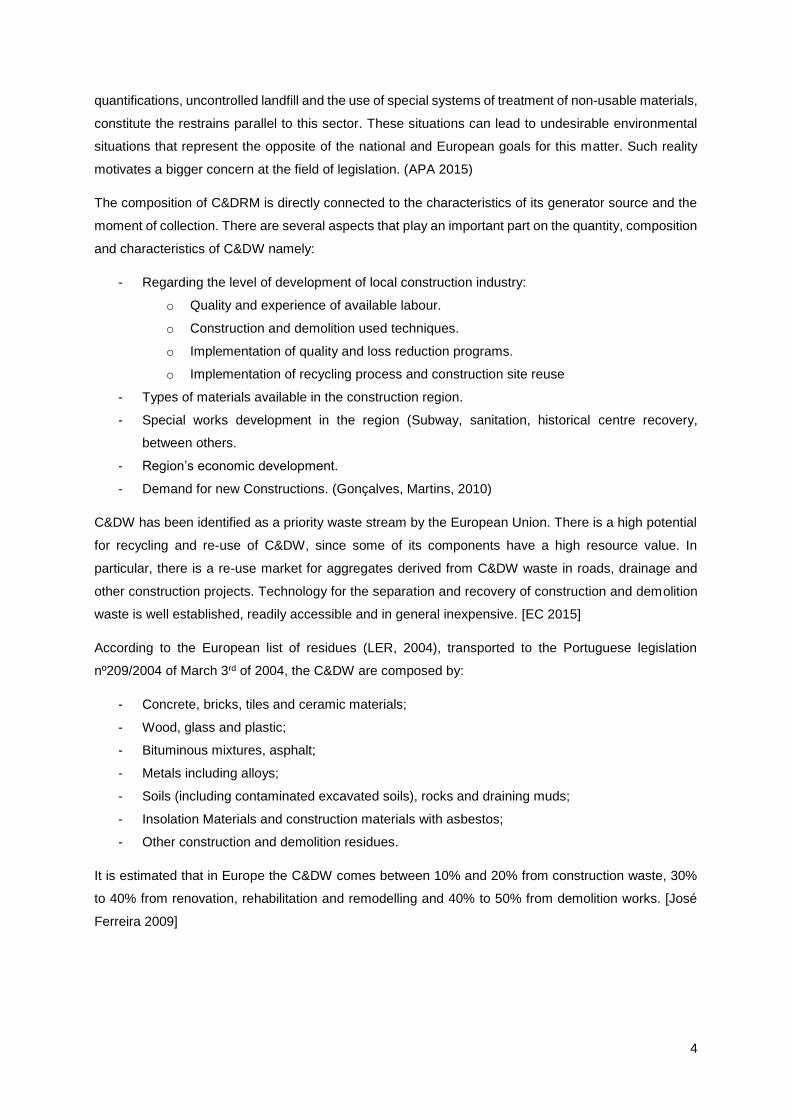
2.4. Use of C&DRM in unbound granular layers
The use of C&DRM as unbound granular materials in base and sub base pavement layers represents
a technically viable solution with economic and environmental benefits, once it allows the use of large
quantities.
The most widely used recycled materials are recycled asphalt pavement (RAP) and recycled concrete
aggregate (RCA). RAP is produced by removing and reprocessing existing asphalt pavement and RCA
(Figure 2.2) is the product of the demolition of concrete structures such as buildings, roads and runways.
The production of RAP and RCA results in an aggregate that can be well graded and of high quality.
The aggregates in RAP are coated with asphalt cement that reduces the water absorption qualities of
the material. In contrast, the aggregates in RCA are coated with a cementitious paste that increases the
water absorption qualities of the material.
Figure 2.1 - Concrete from demolition works
Figure 2.2 - Recycled concrete aggregate
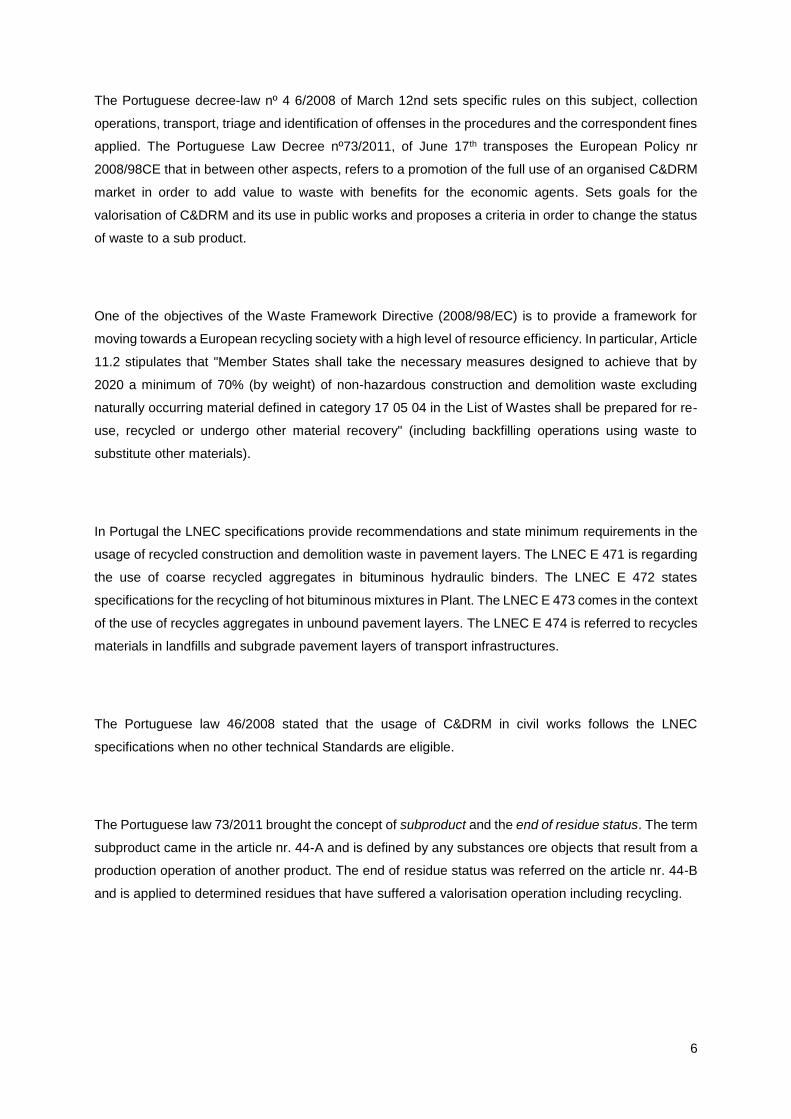
Reclaimed asphalt pavement (RAP) is bituminous concrete materials removed from pavement
undergoing reconstruction or resurfacing (Figure 2.3). Reclaiming the asphaltic concrete may
involve either cold milling a portion of the existing bituminous concrete pavement, or its full depth
removal or crushing. One of the applications for the RAP and RCM is in Portland cement concrete
production as a replacement of virgin aggregates. In UK, 10% of the total consumed aggregate is
produced from recycled concrete (Collins, 1994). However, the replacement ratio of recycled
aggregates in concrete is limited to a certain value (Agrela et al., 2012). (Huang et al. ,2006),
investigated the effects of using RAP in cement concrete by replacing the coarse and fraction of
aggregate with the reclaimed asphalt, and found that the mixtures containing recycled aggregate
have a lower tensile and compressive strength than the mixture containing virgin aggregates.
However, the mixtures containing recycled asphalt concrete showed to have a higher toughness.
Page 19
8
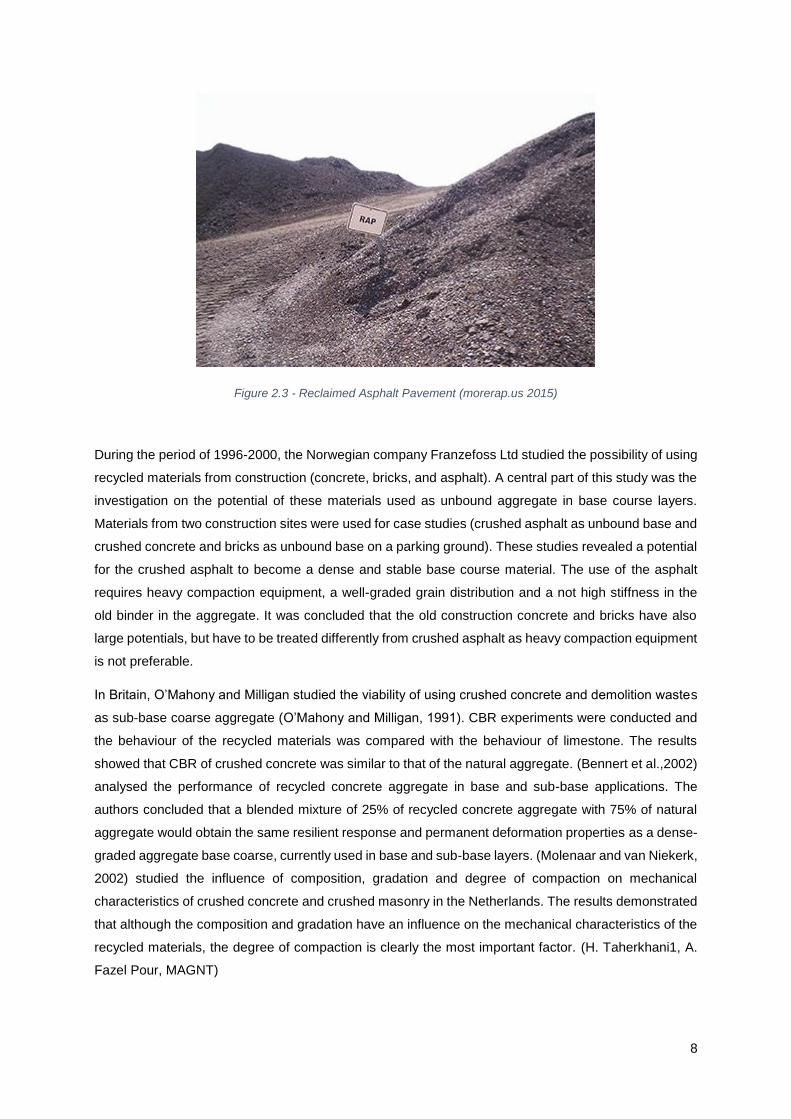
Figure 2.3 - Reclaimed Asphalt Pavement (morerap.us 2015)
During the period of 1996-2000, the Norwegian company Franzefoss Ltd studied the possibility of using
recycled materials from construction (concrete, bricks, and asphalt). A central part of this study was the
investigation on the potential of these materials used as unbound aggregate in base course layers.
Materials from two construction sites were used for case studies (crushed asphalt as unbound base and
crushed concrete and bricks as unbound base on a parking ground). These studies revealed a potential
for the crushed asphalt to become a dense and stable base course material. The use of the asphalt
requires heavy compaction equipment, a well-graded grain distribution and a not high stiffness in the
old binder in the aggregate. It was concluded that the old construction concrete and bricks have also
large potentials, but have to be treated differently from crushed asphalt as heavy compaction equipment
is not preferable.
In Britain, O’Mahony and Milligan studied the viability of using crushed concrete and demolition wastes
as sub-base coarse aggregate (O’Mahony and Milligan, 1991). CBR experiments were conducted and
the behaviour of the recycled materials was compared with the behaviour of limestone. The results
showed that CBR of crushed concrete was similar to that of the natural aggregate. (Bennert et al.,2002)
analysed the performance of recycled concrete aggregate in base and sub-base applications. The
authors concluded that a blended mixture of 25% of recycled concrete aggregate with 75% of natural
aggregate would obtain the same resilient response and permanent deformation properties as a dense-
graded aggregate base coarse, currently used in base and sub-base layers. (Molenaar and van Niekerk,
2002) studied the influence of composition, gradation and degree of compaction on mechanical
characteristics of crushed concrete and crushed masonry in the Netherlands. The results demonstrated
that although the composition and gradation have an influence on the mechanical characteristics of the
recycled materials, the degree of compaction is clearly the most important factor. (H. Taherkhani1, A.
Fazel Pour, MAGNT)
Page 20
9
In Portugal, A. Freire, J. Neves and R. Pestana 2010 performed several test on material from laboratory
crushing of cubic concrete specimens, used previously in compression strength test and material from
in situ crushing of C&DW, obtained from a concrete building demolition near Lisbon (ISAP 2010). Was
concluded that the two recycled materials are adequate for application in unbound granular base and
sub-base layers even though the obtained values for mechanical properties regarding fragmentation
and wear resistance. In effect, micro-Deval and Los Angeles values are higher than the maximum values
required in Portuguese standards references.
The ALT-MAT was a multinational project regarding the use of alternative materials in road construction.
It referred mainly about test methods rather than material suitability, but the project included an
assessment of the materials used in the study. The materials were chosen in each country on the basis
of their availability, past use and potential for use in road construction. Natural materials commonly used
in road construction, such as limestone, were tested as a control. Regarding the use of C&DRM in
unbound pavement layers it is possible to retain the following (ALT-MAT 2001):
- In Denmark, Crushed concrete was suitable for unbound road base. MSWI bottom ash was
suitable as unbound sub-base. Under forthcoming environmental legislation, the MSWI would
be suitable below the road pavement but not under the shoulders of the road;
- In United Kingdom, Steel slag from EAF plant and demolition rubble, consisting of a mixture of
brick and concrete, were investigated. The steel slag is acceptable as an unbound sub-base
material provided it has been aged. The demolition rubble was satisfactory in most respects for
unbound sub-base, however it failed to meet the criteria for frost resistance. This test may be
too severe for many parts of the United Kingdom, where temperatures are rarely below zero for
any length of time. In-situ tests on a site where the demolition rubble was used as a combined
sub-base and capping layer indicated that it was performing satisfactorily. No leaching problems
were encountered for the demolition rubble, but leaching tests on the steel slag had high
concentrations of molybdenum.
The production of RCA and RAP/RPM involves the removal and reprocessing of existing asphalt
pavement from roadway structures. During the removable process of asphalt pavement, some additional
materials mix into the recycled materials, such as wood chips or pavement markings. Even though the
majority of the recycled materials is recycled and used in the same year, some of them were stockpiled
in order to use later. The stockpiling conditions of the recycled materials also could create additional
impurities. It seems the crushing and processing of RCA and RAP has improved in recent years limiting
the impurities to very small percentages to be of concern. Building derived concrete aggregate can
contain stone, brick, asphalt pieces, porcelain and decorative concrete. It may also have a higher soil
fraction. (Tuncer B. Edil, 2011)
Page 21
10
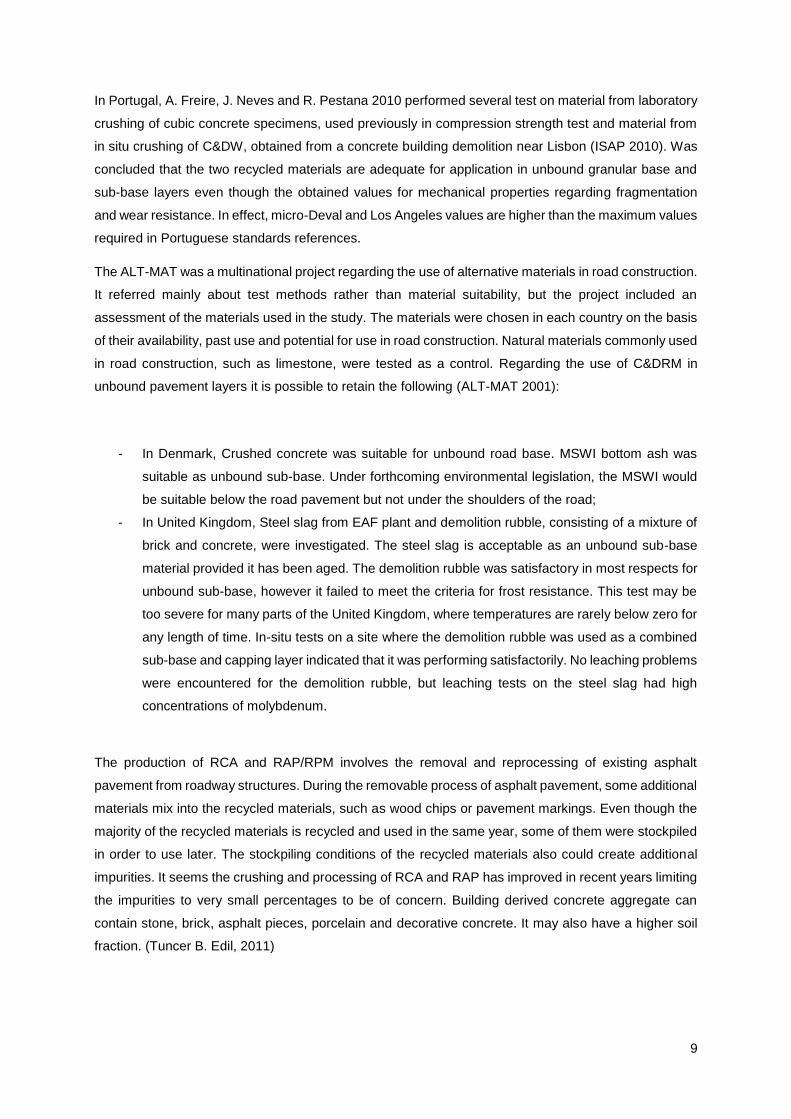
Figure 2.4 - Crushed concrete aggregate sample example RCA (SUPREMA, 2008)
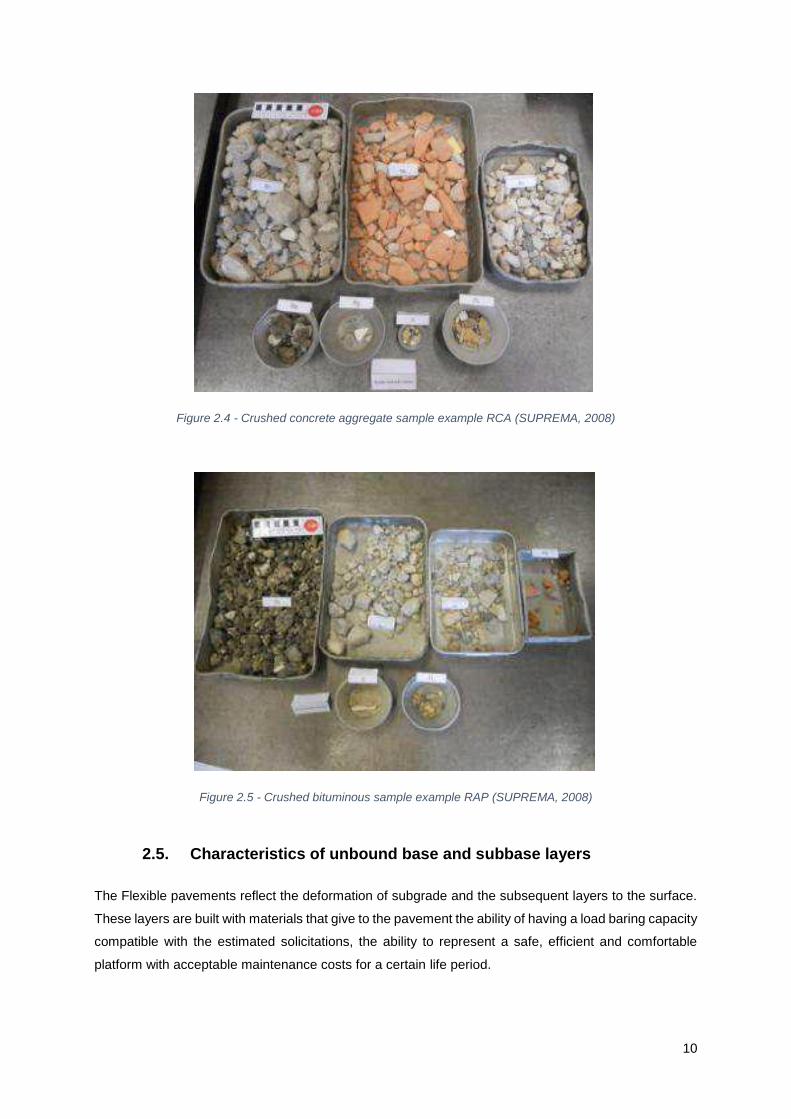
Figure 2.5 - Crushed bituminous sample example RAP (SUPREMA, 2008)
2.5. Characteristics of unbound base and subbase layers
The Flexible pavements reflect the deformation of subgrade and the subsequent layers to the surface.
These layers are built with materials that give to the pavement the ability of having a load baring capacity
compatible with the estimated solicitations, the ability to represent a safe, efficient and comfortable
platform with acceptable maintenance costs for a certain life period.
Page 22
11
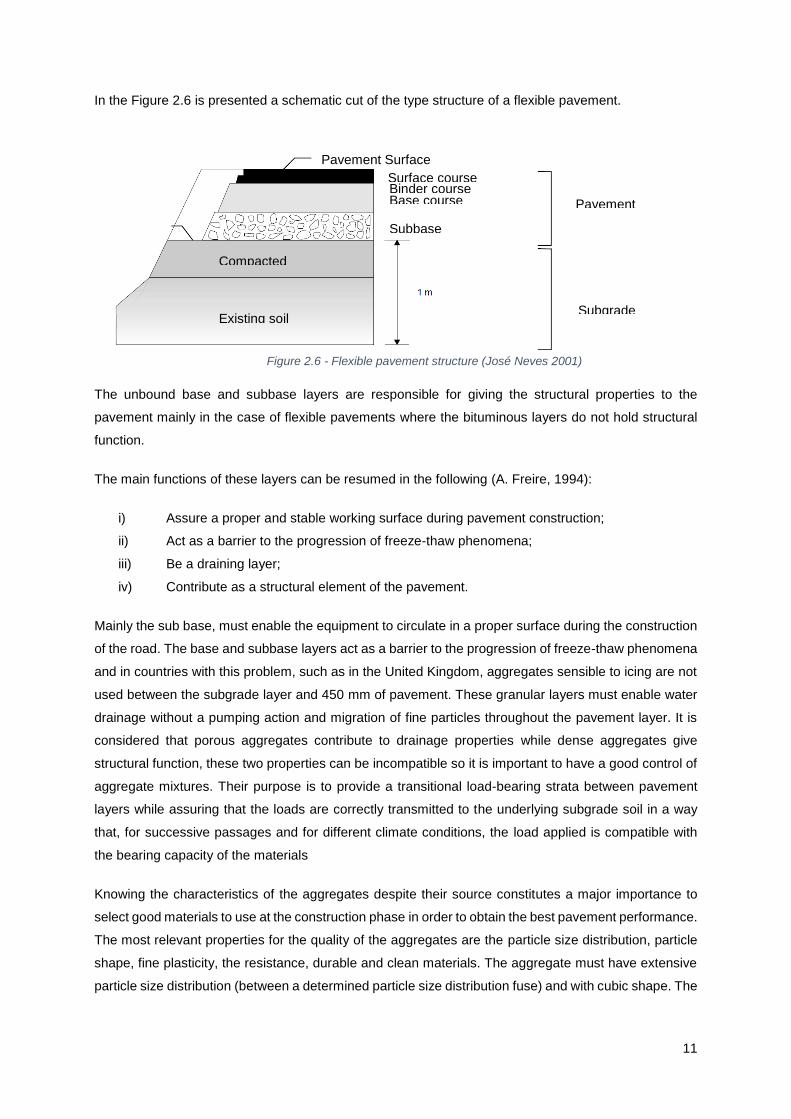
In the Figure 2.6 is presented a schematic cut of the type structure of a flexible pavement.
The unbound base and subbase layers are responsible for giving the structural properties to the
pavement mainly in the case of flexible pavements where the bituminous layers do not hold structural
function.
The main functions of these layers can be resumed in the following (A. Freire, 1994):
i) Assure a proper and stable working surface during pavement construction;
ii) Act as a barrier to the progression of freeze-thaw phenomena;
iii) Be a draining layer;
iv) Contribute as a structural element of the pavement.
Mainly the sub base, must enable the equipment to circulate in a proper surface during the construction
of the road. The base and subbase layers act as a barrier to the progression of freeze-thaw phenomena
and in countries with this problem, such as in the United Kingdom, aggregates sensible to icing are not
used between the subgrade layer and 450 mm of pavement. These granular layers must enable water
drainage without a pumping action and migration of fine particles throughout the pavement layer. It is
considered that porous aggregates contribute to drainage properties while dense aggregates give
structural function, these two properties can be incompatible so it is important to have a good control of
aggregate mixtures. Their purpose is to provide a transitional load-bearing strata between pavement
layers while assuring that the loads are correctly transmitted to the underlying subgrade soil in a way
that, for successive passages and for different climate conditions, the load applied is compatible with
the bearing capacity of the materials
Knowing the characteristics of the aggregates despite their source constitutes a major importance to
select good materials to use at the construction phase in order to obtain the best pavement performance.
The most relevant properties for the quality of the aggregates are the particle size distribution, particle
shape, fine plasticity, the resistance, durable and clean materials. The aggregate must have extensive
particle size distribution (between a determined particle size distribution fuse) and with cubic shape. The
Pavement Surface
Surface course
Base course
Subbase
Compacted
Existing soil
Pavement
Subgrade
Binder course
Figure 2.6 - Flexible pavement structure (José Neves 2001)
Page 23
12
aggregate must be from hard materials and resistant to shock, friction and wear. The materials must be
stable, clean, and free of clayey minerals and organic matter.
In addition of being composed of aggregates, in order to be stable, these unbound granular layers have
cementitious binder blended with sufficient amounts of water that results in a mixture having a moist,
non-plastic consistency that can be compacted to form a dense mass and gain strength. These base
ore sub base materials are not meant to include the stabilization of soils or aggregates using asphalt
cement or emulsified asphalt. The purpose of a stabilized base or sub base layer is to provide a
transitional load-bearing strata between pavement layers which directly receives the wheel loading of
vehicular traffic, while reducing loading on the underlying subgrade soil. (Griffin soil, CSSA, 2010)
One of the advantages of the use of granular materials is the possibility of a mechanization of the
constructive methods allowing a high compactness with the increase of contact points between particles
and the increase of the friction angle. For the construction of these layers the method used in only the
spreading, irrigation and compaction of the aggregates. For the construction of new pavements prepared
for heavy traffic pavements, crushed materials are needed for sub base layers. The use of non-crushed
natural aggregates from river is limited for light and medium traffic.
2.6. Structural behaviour of unbound granular layers
The understanding of pavement structure behaviour under cyclic loading is necessary in order to assure
its serviceability during a predicted structure life. Unbound granular material layers in pavement structure
represent a base for upper construction and their compaction and deformational behaviour under cyclic
loading have significant impact on the bearing capacity of upper layers and overall pavement
construction. Unbound granular materials show complex behaviour under cyclic loads with gradual
accumulation of permanent deformation. Accumulation of a large number of small permanent
deformation in unbound granular material usually cause the failure of the sub-base layer and larger
irreversible deformations in the upper layers of the pavement structure. (CETRA, 2014)
The amount by which an unbound aggregate material is deformed when loaded depends on its stiffness
and stability. Stiffness, or the ability to spread the load, is a measure of the resistance to resilient
deformation. It is expressed in terms of a modulus of elasticity or resilience that is used in designing the
pavement. Stability is a measure of the ability to resist permanent deformation. Another term is load-
bearing capacity, which could be defined as the load a layer of material can carry without being deformed
more than the permissible amount. Determination of the bearing capacity thus requires a limiting
deformation value.
After a great number of load cycles, the granular materials show a decrease in permanent deformation
and begin to show elastic behaviour when a certain permanent deformation is reached. With cyclic
triaxial load tests is possible to simulate the behaviour of the granular material under consecutive load
Page 24
13
cycles. It has a great importance to evaluate the material deformability after the stabilization of
deformations.
The mechanical behaviour of granular materials under a loading action depends on several factors.
Regarding state parameters we can consider: Strain state, compactness and degree of saturation.
Parameters related to the material nature: particle size distribution, particle resistance, lithology and the
alteration state of the material; roughness, shape, dimension, cleaning and material hardness.
Regarding the service conditions, the number of load cycles, strain history and the change of main
strains. The construction methods and the state of the material when used, may as well, influence the
final mechanic behaviour of the materials. (Pestana, 2008)
Proper characterization of the mechanical response of unbound aggregate materials is a crucial factor
in the design and rehabilitation of pavement structures. Among the many parameters that exists for
characterization, the resilient modulus appears to be the most suitable candidate. This is due to the
ability of this parameter to closely simulate the material in situ conditions under traffic loading (Brown,
1977). The resilient modulus, Mr, is a mechanical property of the material that describes its stress –
strain relationship under dynamic loading and specified physical conditions. In repeated triaxial load
tests, Mr is defined as the ratio of the peak cyclic deviator stress to the recoverable measured axial
strain as given in equation 1 below. Due to the non-linear behaviour of granular materials, their resilient
moduli appear to be influenced by several factors (Khogali & Zeghal, 2000).
2.7. Repeated Load Triaxial Test
It is important to determine the mechanical behavior of granular materials, used in base and subbase
road layers, for use in analytical design methods. The laboratory equipment must simulate the
environmental and loading condition to which the material is to be subjected both during and after
construction. From a mechanistic point of view it is necessary to apply a well-defined stress state and
measure the deformations accurately. (Correia, Gillett 1996).
The repeated load triaxial is one of the most widely used geotechnical
laboratory tests and is suitable for all types of soils. It is one of the most versatile
and widely performed tests, allowing the shear strength and stiffness of soil and
rock to be determined for use in geotechnical or road design. Advantages over
simpler procedures, such as the direct shear test, include the ability to control
specimen drainage and take measurements of pore water pressures.
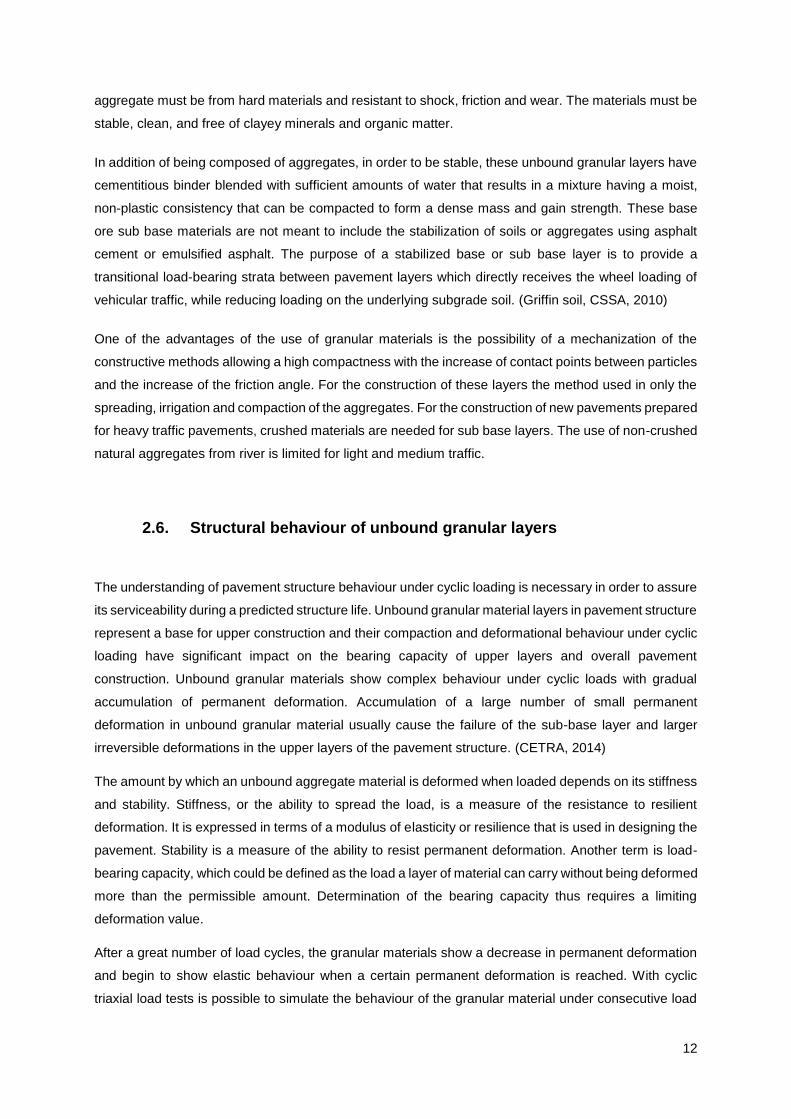
A cylindrical specimen is used in the test and is stressed under conditions of
axial symmetry in the manner shown in Figure 2.7. The specimen is subjected
to an all-round fluid pressure in the cell, consolidation is allowed to take place if
appropriate, and then the axial stress is gradually increased by the application
of compressive load through the ram until failure of the specimen takes place.
Figure 2.7 - Stress axial symmetry of Triaxial Test
Page 25
14
Specimen compaction methodologies
The specimen preparation requires a pre characterization of grading in order to make the sample
adjustments if needed and a compaction test to achieve the optimum water content that represents a
reference to the specimen preparation. The preparation consists in several steps: material preparation,
mixing and moistening, compaction and test specimen wrapping.
Compaction tests
Compaction by vibrating hammer
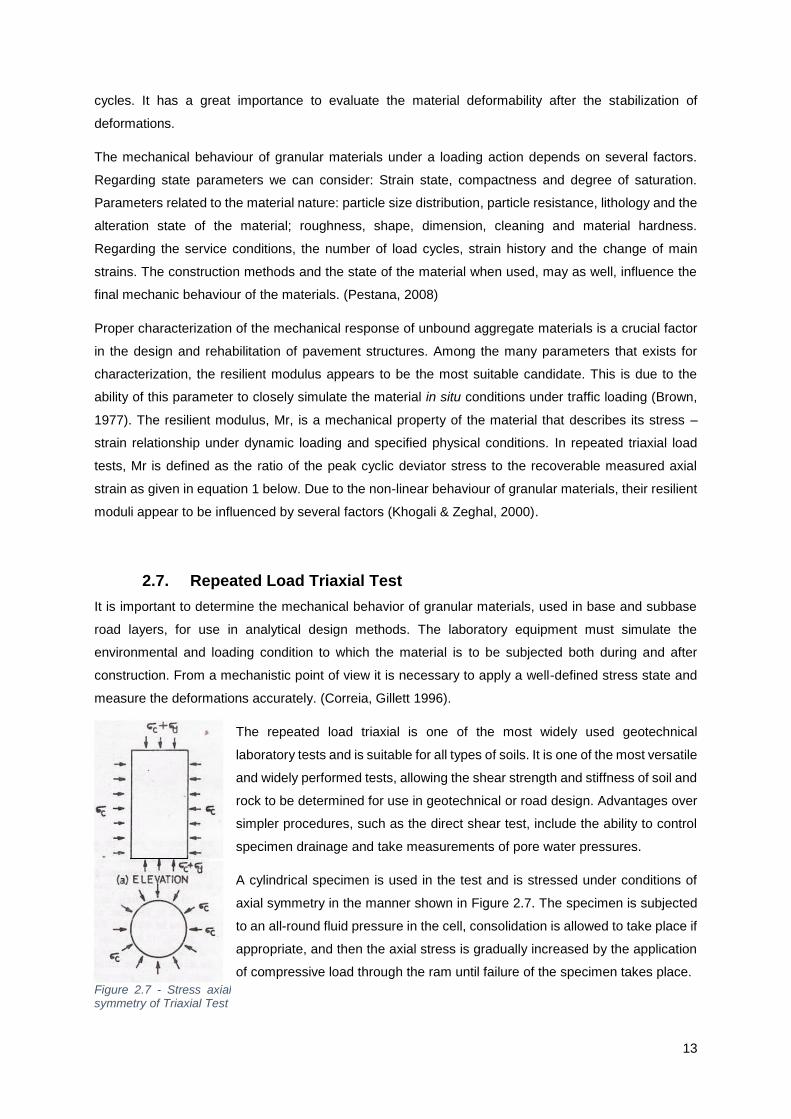
The EN 13286-4 specifies vibrating hammer test methods of mixtures used in road construction which
contain no more than 30% by mass retained on the 20 mm test sieve. It is not applicable to mixtures
with more than 10% by mass of the mixture retained on the 40 mm test sieve.
This method consists of compacting the specimen in several layers, using a vibration process. The
apparatus includes a Cylindrical, corrosion resistant, metal mould, a detachable baseplate and
removable extension piece. A vibrating hammer clamped to a sliding frame that is guided by two vertical
rods a tamper foot. The equipment is relatively inexpensive, portable and compaction results are not
influenced by the rigid foundation, making this test method well suited for fieldwork. The test is easier
and quicker to perform than the other methods mentioned above and provides reproducible and
consistent results. The maximum dry unit weight obtained is comparable to that from other current
methods such as the Vibrating Table test And the Modified Proctor test.
Figure 2.8 - Vibrating hammer
Page 26
15
Compaction by vibrocompression
The equipment used enables the specimen to be simultaneously pressed with the aid of vibration. The
pressing efficiency is measured by the ability to eliminate the voids of the mixture, which sets in a
straightforward manner the cohesion in the fresh and hardened properties of the component. The
reduction of the porosity of the unit is associated with an increase in mechanical strength and decreased
of permeability of the final product.
The European standard EN 13286-3 refers that this test applies to mixtures with a maximum particle
size less than 31.5 mm. The specimen must be compacted in a cylindrical plastic mould covered by
caps which are sealed after the compaction in order to avoid loss of moisture during storage. The
compaction time should not exceed 90s. The material is compacted into a mould by means of circular
horizontal vibration and an increasing vertical axial pressure. The dry density at frequencies of 50 Hz
and 100 Hz and the dry density are measured.
The apparatus consist of cylindrical steel mould, vibrators and a piston. The cylindrical steel mould must
have a minimum thickness wall of 10 mm, internal diameter of 152.0 mm, be of sufficient height so that
the mould can contain enough mixture which after compaction at 100 Hz has height in the mould of
152.0 mm and have a removable base plate fitted with a watertight seal. The vibrators, which apply to
the mould a horizontal circular vibration of amplitude (0.80 ± 0.08) mm at frequencies of (50 ± 3) Hz and
(100 ± 3) Hz. The Piston must have a diameter of (151.0 o 0.2) mm allowing a variable pressure.
Proctor compaction
The EN 13286-2 specifies the Proctor test method suitable for unbound and hydraulically bond mixtures.
These mixtures must be from upper sieve (D) size up to 63 mm and oversize up to 25% by mass.
The procedure consists of dropping a hammer with a specific mass from a certain height with a
compactive force. At the Proctor test a 2.5 kg rammer is used, and at the modified Proctor test a much
greater degree of compaction is added by using different rammers (4.5kg or 15 kg) and/or greater drops
on thinner layer of material as in the Proctor test. The size of the compaction mould as a direct relation
with the value of D. If more than 25% of material is retained on a 63 mm test sieve, the test method is
not suitable
It has been used for compacting specimens before repeated load triaxial testing at a study conducted
by Magnusdottir, B. & Erlingsson, S. One of the goals was to evaluate the stiffness characteristics and
the ability to withstand the accumulation of permanent deformation during pulsating loading of unbound
granular base course materials. The specimens used were 150 mm diameter and 300 mm height and
with particle size distributions up to 30 mm. The material was compacted according to the Proctor
compaction method, in a split cylinder lined with a rubber membrane, usually up to a level corresponding
to standard or modified compaction energy.
Page 27
16
Vibrating table
The EN 13286-5:2003(E) specifies the vibrating table test method. The method utilizes vibratory
compaction to obtain maximum density under saturated conditions. Materials for which this method is
applicable may contain up to 12 % by mass fines (< 0,063 mm). The maximum particle size of the
materials to be tested is 80 mm. The mixture is compacted in a mould by means of a load on the top of
the mixture and a vibrating table. The laboratory dry density and the corresponding water content are
determined.
2.8. Studies with repeated triaxial test on C&DRM
When characterizing the behaviour of a material for a specific function, the tests performed must
replicate as accurately as possible the conditions experienced in that function. The conditions of strain
state induced by traffic and the repetitive character of loads are the most difficult to accomplish with an
experimental test.
The repeated triaxial test is considered by many researchers as the best equipment to determine the
mechanical properties of soils and granular materials. Several institutions have adopted this test to
characterise the reversible modulus of soils and granular materials, for example, the AASHTO though
the Standard AASHTO T 294 (1992). (Neves, 2001)
To simulate the stress conditions of the ones experienced on base and sub base layers, is necessary
to cycle both the confining pressure in phase with the deviatoric load, and to be able to reverse the
principle stress directions to simulate the rotation of principle stresses that can be measures when a
pavement is loaded by a moving wheel. Some of the main advantages of cyclic triaxial load tests are
(Hoff, 2004) :
- Flexible load application (Amplitude, frequency, number of pulses);
- Controlled confining pressure (cyclic or constant);
- Accurate axial and radial strain measurements (permanent and resilient).
This testing also has some drawbacks. Some of the most important are:
- Unable to test undisturbed samples from field;
- Real size aggregates often require unpractical large samples;
- Unable to simulate continuous rotation of principle stress directions;
- Expensive (much work required per sample).
The results from a cyclic triaxial test can be used directly in advanced material models to predict
performance of unbound granular materials in a pavement stricture.
Some of the studies performed to C&DRM with repeated triaxial load test are briefly described below.
Page 28
17
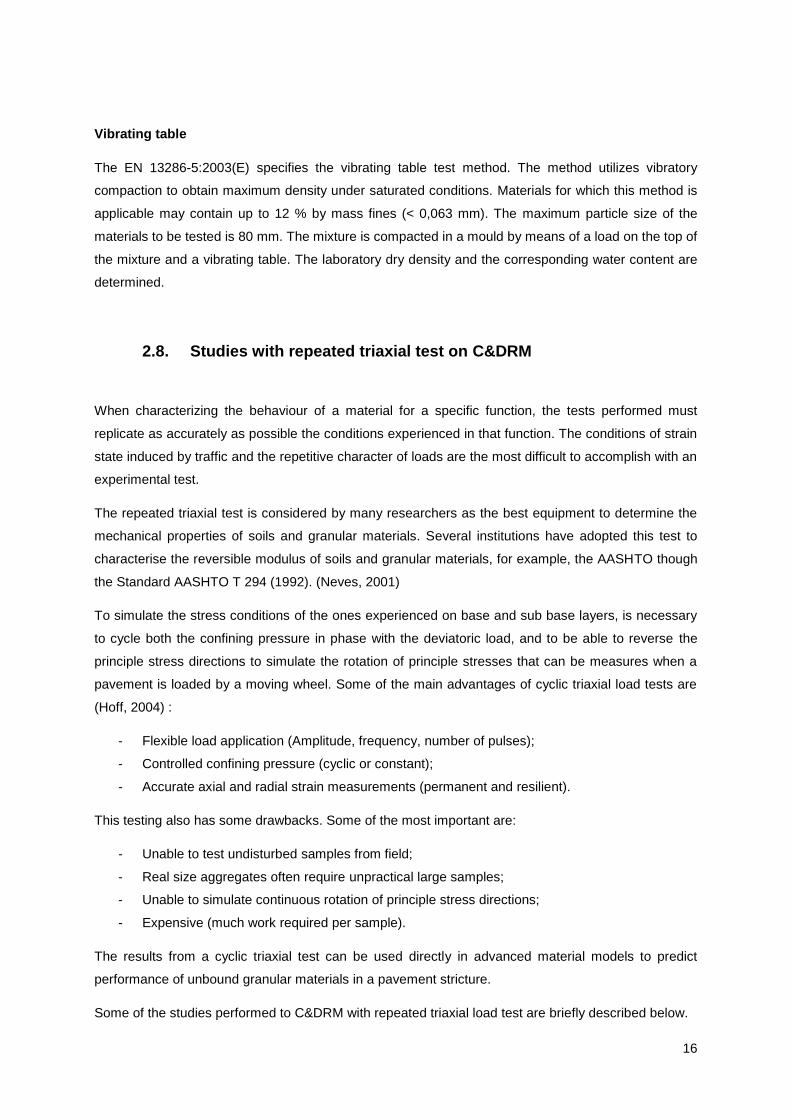
Andreas Nataatmadja & Ya Ling Tan, [Griffith University, Australia], The performance of Recycled
Crushed Concrete Aggregate.
This paper presents the results of an investigation on the performance of four Recycled Crushed
Concrete (RCC) aggregates in sub-base pavement layer. Triaxial specimens were tested under
repeated loading one day after compaction.
The RCC materials consist of one commercial aggregate with 15 MPa of compressive strength and
three other aggregates with corresponding compressive strength of 18.5, 49 and 75 MPa produced in-
house by crushing concrete beams.
The repeated load triaxial test (RLTT) was performed after Compaction test and a day of cure. On the
following day the test was performed using a servo-controlled pneumatic equipment that can
accommodate 100 mm diameter specimens. The design of the equipment was based on the Nottingham
Asphalt Tester (NAT). The confining pressure was assured with pressured air and the values varied
between 50 and 170 kPa. The repeated deviator stress was kept well bellow the maximum stress
associated with the static shear envelope to avoid a premature failure.
Comparisons between the performance of RCCs and typical aggregates where made regarding the
resilient modulus variations. In Figure 2.9 the A and B variables represent experimental coefficients and
the r2 represents the coefficient of determination. Base on the test results it was concluded that the
performance of the RCC may be comparable to fresh base-course aggregates. The well-graded RCC
may even produce a higher resilient modulus under low deviator stresses as compared with other
materials.
Figure 2.9 - Comparison of Performance Using the Two-Parameter Model [Nataatmadja & Ling Tan, 2000]
Maria Arm 2001, [Swedish National Road and Transport Research Institute, Linkoping, Sweden], Self-
cementing properties of crushed demolished concrete in unbound layers: results from triaxial tests and
field tests.
Page 29
18
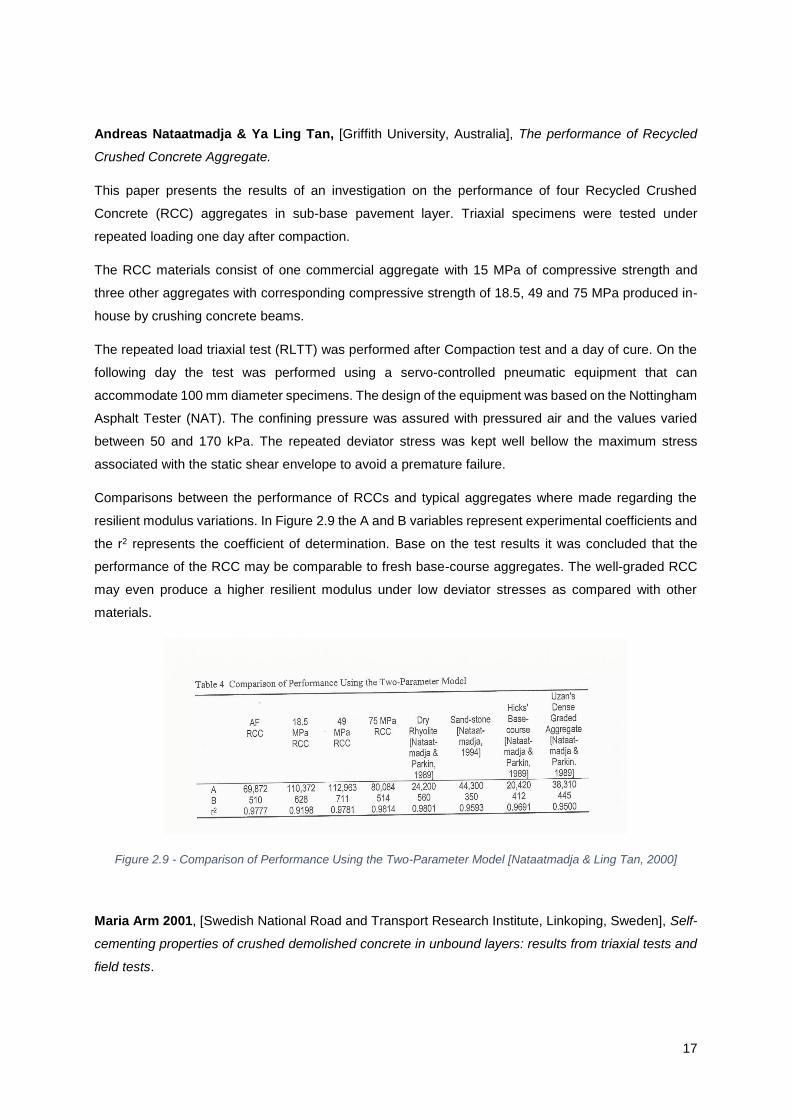
In this study, repeated load triaxial tests where preformed on manufactured specimens after different
storing times. The materials tested where crushed concrete originated from demolished buildings, a
demolished concrete road and railway sleepers. The optimum water content chosen for specimens was
60% optimum. The tests were performed on Specimens of 300 m high and 150 mm diameter. The
specimens were compacted, in one layer by simultaneous vibration and compression in a
vibrocompressor, to a 97% degree of compaction. Finally, the specimens were wrapped in plastic foil
and stored indoors. After a certain storing time (1, 7, 15, 28, 60, 180, 365 or 730 days) the specimens
were exposed to repeated load in triaxial tests and the resilient moduli for different stress conditions
were calculated. Comparisons between the material tested and natural aggregates were made in the
field of stiffness variation with time. Was possible to state conclusions regarding the resilient modulus
used in pavement design. When crushed concrete with very little impurities is used as a Swedish sub
base material, at least the same design modulus can be used as for natural aggregates. In Figure 2.10
is a comparison of stiffness between crushed concrete and crushed rock.
Figure 2.10 - Comparison of stiffness. Crushed concrete and crushed rock with different origin. [Maria Arm 2001]
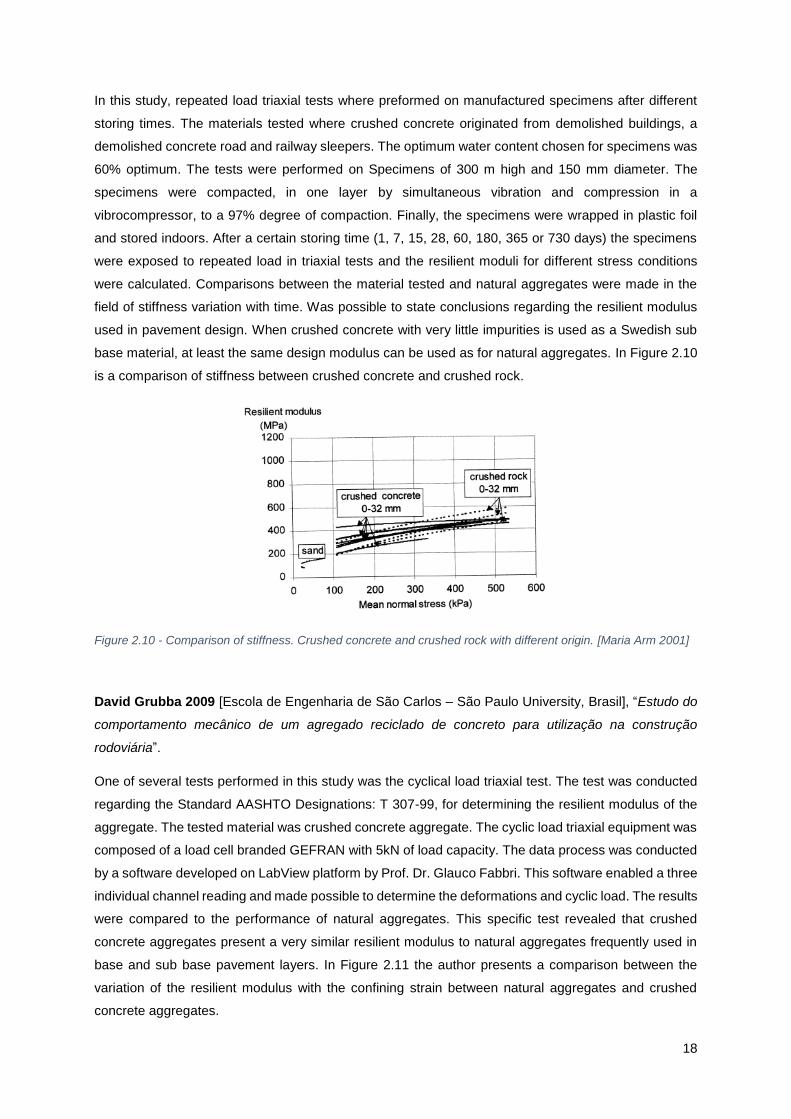
David Grubba 2009 [Escola de Engenharia de São Carlos – São Paulo University, Brasil], “Estudo do
comportamento mecânico de um agregado reciclado de concreto para utilização na construção
rodoviária”.
One of several tests performed in this study was the cyclical load triaxial test. The test was conducted
regarding the Standard AASHTO Designations: T 307-99, for determining the resilient modulus of the
aggregate. The tested material was crushed concrete aggregate. The cyclic load triaxial equipment was
composed of a load cell branded GEFRAN with 5kN of load capacity. The data process was conducted
by a software developed on LabView platform by Prof. Dr. Glauco Fabbri. This software enabled a three
individual channel reading and made possible to determine the deformations and cyclic load. The results
were compared to the performance of natural aggregates. This specific test revealed that crushed
concrete aggregates present a very similar resilient modulus to natural aggregates frequently used in
base and sub base pavement layers. In Figure 2.11 the author presents a comparison between the
variation of the resilient modulus with the confining strain between natural aggregates and crushed
concrete aggregates.
Page 30
19
Figure 2.11 - Resilient modulus variation with the confining strain for granular materiais [Grubba, 2009]
C. Grégoire, B. Dethy & J. Detry [Belgian Road Research Centre, Belgium], A. Gomes Correia
[University of Minho, Guimarães, Portugal], 2009 “Characterizing natural and recycled granular
materials for (sub)base layers of roads by cyclic triaxial testing.
Cyclic load triaxial test was performed with a reference material used in sub base layers of Belgian roads
and two recycled materials. The recycled materials used were Steel Slag and crushed concrete
aggregate. The tests were made under constant confining pressure, using method B of European
standard EN 13286-7. The specimens tested were 160 mm high and 320 mm diameter. The specimen
compacting method was the vibration hammer (EN 13286-51), in six layers. The optimum density and
water content were determined by modified Proctor testing. Actuators of 50 kN were used in the pressure
system. Studies for the reversible deformations and resilient modulus were made at the reference
material and the recycled materials. In Figure 2.12 is possible to see the comparison between limestone
and crushed concrete aggregate regarding the resilient modulus for different levels of vertical stress.
Figure 2.12 - Resilient modulus versus vertical stress for limestone, crushed concrete and steel slag (Correia et al., 2009)
Page 31
20
Fabiana Leite, Rosângela Motta, Kamilla Vasconcelos, Liedi Bernucci, [Department of
Transportation Engineering, Polytechnic School, University of São Paulo, Brazil, 2010], “Laboratory
evaluation of recycled construction and demolitions waste for pavements”.
The materials tested were cementitious materials (concrete and mortar), highly porous ceramic
materials (bricks anda roof tiles), less porous ceramic materials (ceramic tiles) and crushed rocks. The
grain shape was according to de Brazilian Standard NBR 6954 in order to determine the percentage of
cubic, flat or elongated particles. The specimen compaction was the Proctor based on the American
Standard procedure (ASTM D1557). The used specimen were 300 mm high and 150 mm diameter. The
resilient behaviour was determined based on the AASHTO TP46 specification for soils and aggregate
materials.
Comparing the resilient modulus results obtained for the RCDW aggregate with a standard well-graded
crushed stone, the authors observed that both materials present similar behavior. The use of higher
compactive effort reduced the resilient deformation of the RCDW aggregate in only 10–20%.
Livia Fujii, 2012 [Departamento of Civil Engeniering, Faculdade de Tecnologia, University of Brasília,
Brazil], “Estudo de misturas de solo, RCD e cal virgem e Hidratada para uso em obras rodoviárias”.
Several tests were performed with two different mixtures. The cyclical triaxial test only involved one. The
materials tested were a mixture of 2/3 of clayey soil with 23% of natural humidity and 1/3 of crushed
concrete. The soil was prepared following the Standard DNER-ME 041/94 for characterization tests.
The RCD was submitted to separation with #4 sieve. The equipment used was Cyclycal triaxial ELE/IPC
Global in the Road Engineering lab (LER). The tests were based on AASHTO T 307/99 specifications
and resilient behaviours were determined.
Shiran Jayakody 2014, [Science and Engineering Faculty Queensland University Of Technology],
“Investigation on characteristics and performance of recycled concrete aggregates as granular materials
for unbound pavements”.
Cyclical load triaxial tests were performed on recycled concrete aggregates. Following the principles of
test method “Q137-Permanent deformation and resilient modulus of granular materials” of DTMR,
Queensland (MariRoads 2013a). Various specimens where tested with different percentages of RAP
mixed with RCA. The maximum percentage of RAP used was 20%. The sample dimensions were 100
mm diameter and 200 mm height. The software used was the UTM_41 v2.04. The resilient modulus and
permanent deformation characteristics with various pressure and load conditions were determined.
Page 32
21
2.9. Materials behaviour modelling
In order to characterize the mechanical behaviour of a specific material there are several known and
used models that allow future users to calculate the resilient modulus, knowing for instance a vertical
stress or the deviatoric stress.
Before collecting data for the modelling of the resilient modulus is necessary to eliminate the permanent
deformations in the specimen by applying a high number of cycles for different strain paths. The
conditioning of the specimen and its strain paths as well as the number of cycles associated are stated
in the standard used.
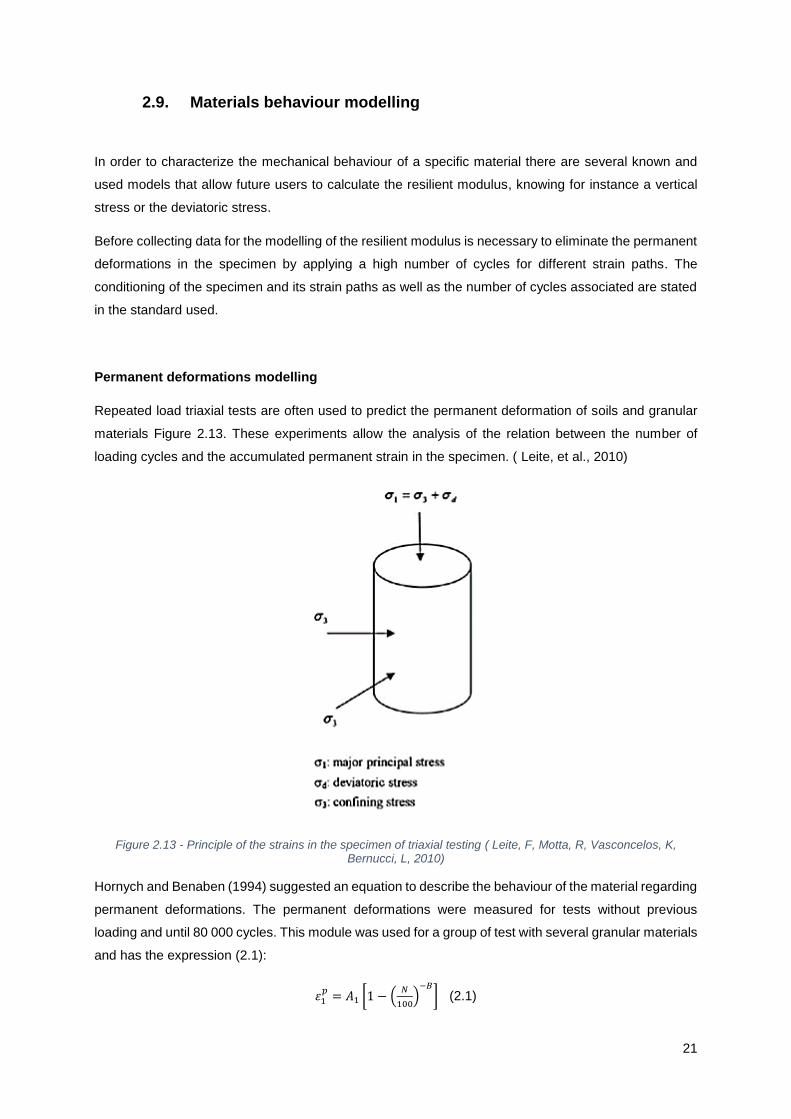
Permanent deformations modelling
Repeated load triaxial tests are often used to predict the permanent deformation of soils and granular
materials Figure 2.13. These experiments allow the analysis of the relation between the number of
loading cycles and the accumulated permanent strain in the specimen. ( Leite, et al., 2010)
Figure 2.13 - Principle of the strains in the specimen of triaxial testing ( Leite, F, Motta, R, Vasconcelos, K, Bernucci, L, 2010)
Hornych and Benaben (1994) suggested an equation to describe the behaviour of the material regarding
permanent deformations. The permanent deformations were measured for tests without previous
loading and until 80 000 cycles. This module was used for a group of test with several granular materials
and has the expression (2.1):
𝜀1𝑝
= 𝐴1 [1 − (𝑁
100)
−𝐵
] (2.1)
Page 33
22
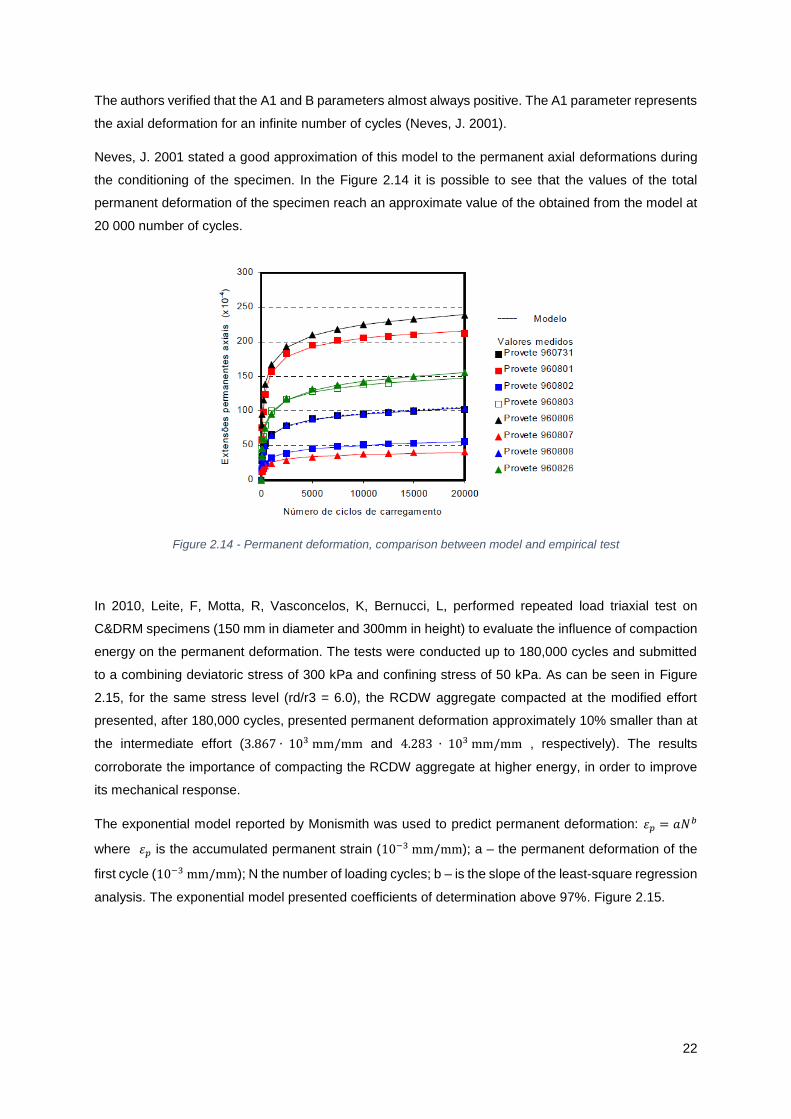
The authors verified that the A1 and B parameters almost always positive. The A1 parameter represents
the axial deformation for an infinite number of cycles (Neves, J. 2001).
Neves, J. 2001 stated a good approximation of this model to the permanent axial deformations during
the conditioning of the specimen. In the Figure 2.14 it is possible to see that the values of the total
permanent deformation of the specimen reach an approximate value of the obtained from the model at
20 000 number of cycles.
Figure 2.14 - Permanent deformation, comparison between model and empirical test
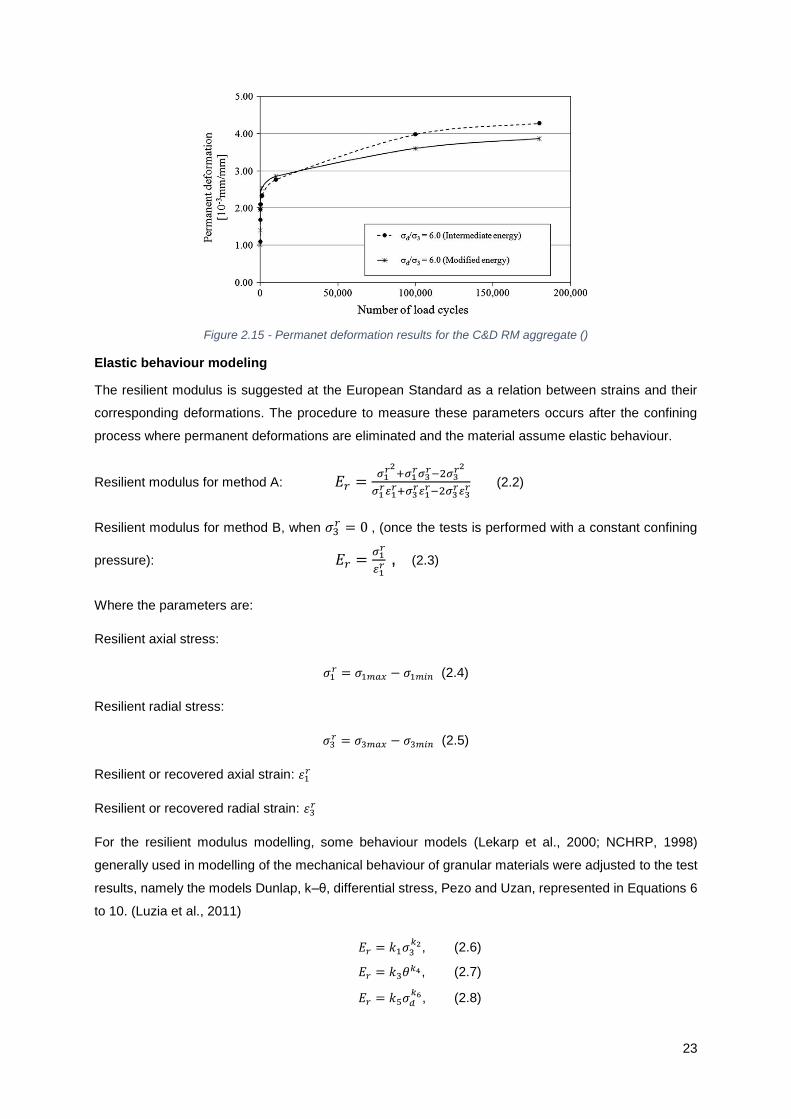
In 2010, Leite, F, Motta, R, Vasconcelos, K, Bernucci, L, performed repeated load triaxial test on
C&DRM specimens (150 mm in diameter and 300mm in height) to evaluate the influence of compaction
energy on the permanent deformation. The tests were conducted up to 180,000 cycles and submitted
to a combining deviatoric stress of 300 kPa and confining stress of 50 kPa. As can be seen in Figure
2.15, for the same stress level (rd/r3 = 6.0), the RCDW aggregate compacted at the modified effort
presented, after 180,000 cycles, presented permanent deformation approximately 10% smaller than at
the intermediate effort (3.867 ∙ 103 mm/mm and 4.283 ∙ 103 mm/mm , respectively). The results
corroborate the importance of compacting the RCDW aggregate at higher energy, in order to improve
its mechanical response.
The exponential model reported by Monismith was used to predict permanent deformation: 𝜀𝑝 = 𝑎𝑁𝑏
where 𝜀𝑝 is the accumulated permanent strain (10−3 mm/mm); a – the permanent deformation of the
first cycle (10−3 mm/mm); N the number of loading cycles; b – is the slope of the least-square regression
analysis. The exponential model presented coefficients of determination above 97%. Figure 2.15.
Page 34
23
Figure 2.15 - Permanet deformation results for the C&D RM aggregate ()
Elastic behaviour modeling
The resilient modulus is suggested at the European Standard as a relation between strains and their
corresponding deformations. The procedure to measure these parameters occurs after the confining
process where permanent deformations are eliminated and the material assume elastic behaviour.
Resilient modulus for method A: 𝐸𝑟 =𝜎1
𝑟2+𝜎1
𝑟𝜎3𝑟−2𝜎3
𝑟2
𝜎1𝑟𝜀1
𝑟+𝜎3𝑟𝜀1
𝑟−2𝜎3𝑟𝜀3
𝑟 (2.2)
Resilient modulus for method B, when 𝜎3𝑟 = 0 , (once the tests is performed with a constant confining
pressure): 𝐸𝑟 =𝜎1
𝑟
𝜀1𝑟 , (2.3)
Where the parameters are:
Resilient axial stress:
𝜎1𝑟 = 𝜎1𝑚𝑎𝑥 − 𝜎1𝑚𝑖𝑛 (2.4)
Resilient radial stress:
𝜎3𝑟 = 𝜎3𝑚𝑎𝑥 − 𝜎3𝑚𝑖𝑛 (2.5)
Resilient or recovered axial strain: 𝜀1𝑟
Resilient or recovered radial strain: 𝜀3𝑟
For the resilient modulus modelling, some behaviour models (Lekarp et al., 2000; NCHRP, 1998)
generally used in modelling of the mechanical behaviour of granular materials were adjusted to the test
results, namely the models Dunlap, k–θ, differential stress, Pezo and Uzan, represented in Equations 6
to 10. (Luzia et al., 2011)
𝐸𝑟 = 𝑘1𝜎3𝑘2, (2.6)
𝐸𝑟 = 𝑘3𝜃𝑘4, (2.7)
𝐸𝑟 = 𝑘5𝜎𝑑𝑘6, (2.8)
Page 35
24
𝐸𝑟 = 𝑘7𝑞𝑘8𝜎3𝑘9, (2.9)
𝐸𝑟 = 𝑘10𝜃𝑘11𝑞𝑘12 (2.10)
Where 𝜃 is the first invariant of stress (𝜃 = 𝜎1 + 𝜎2 + 𝜎3) and 𝑘1 to 𝑘12 are material constants.
In 2011, Luzia, R., Santos, L., Neves, J., Gardete, D., used the cyclical triaxial testing – method A (to
evaluate the behaviour of limestone and granite. In the analysis of the results, for all models the
correlations obtained were considered to be from reasonable to very good quality, with the determination
of coefficients varying between 0.7691 and 0.9990. Has can be seen in Figure 2.16, the best generic
equations are 9 and 10 for both materials.
Figure 2.16 - Model results for Pombal limestone and granite resilient modulus (ICE 2001)
In order to establish the best and more conservative model for each material, two important aspects
were taken in to consideration; namely a determination coefficient close to 1 and low resultant resilient
modulus.
The models obtained are presented in the Equations 2.11 and 2.12 for the limestone and the granite,
respectively.
𝐸𝑟 = 442.72𝜃0.5873 (2.11)
𝐸𝑟 = 877.37𝑞0.2384𝜎30.3828(2.12)
Where 𝑞 is the differential stress.
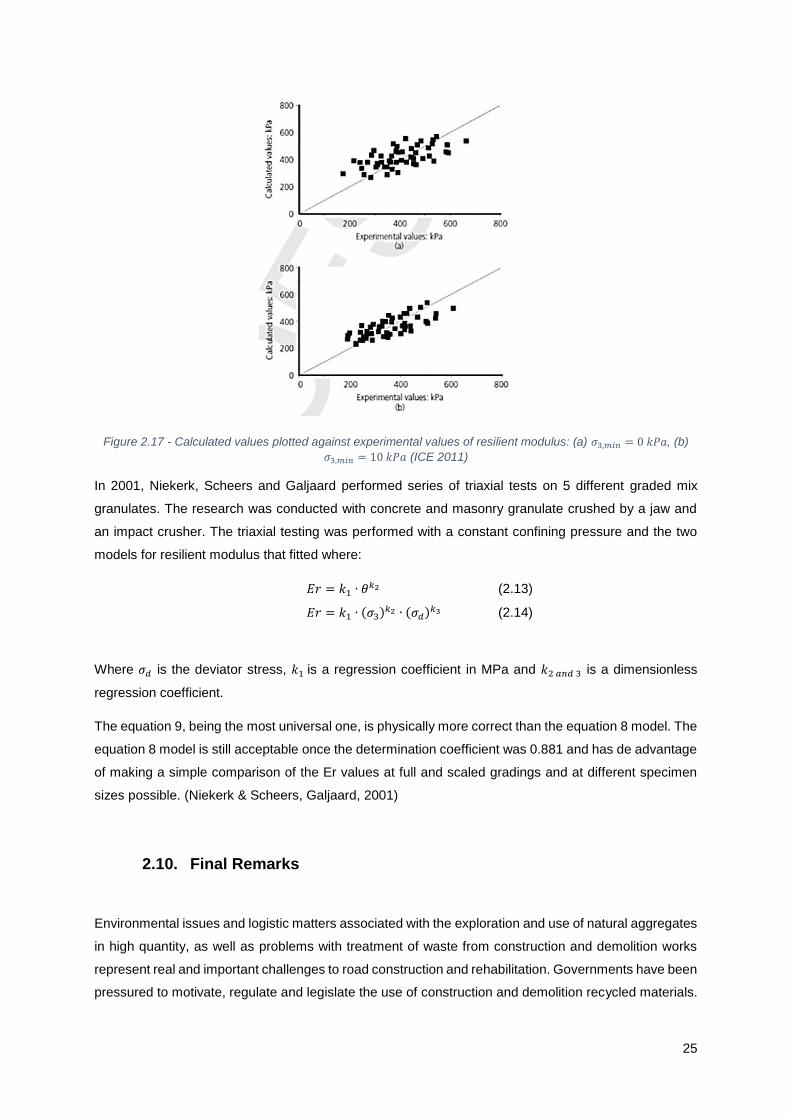
The values for the resilient modulus for each specimen are shown in Figure 2.17:
Page 36
25
Figure 2.17 - Calculated values plotted against experimental values of resilient modulus: (a) 𝜎3,𝑚𝑖𝑛 = 0 𝑘𝑃𝑎, (b)
𝜎3,𝑚𝑖𝑛 = 10 𝑘𝑃𝑎 (ICE 2011)
In 2001, Niekerk, Scheers and Galjaard performed series of triaxial tests on 5 different graded mix
granulates. The research was conducted with concrete and masonry granulate crushed by a jaw and
an impact crusher. The triaxial testing was performed with a constant confining pressure and the two
models for resilient modulus that fitted where:
𝐸𝑟 = 𝑘1 ∙ 𝜃𝑘2 (2.13)
𝐸𝑟 = 𝑘1 ∙ (𝜎3)𝑘2 ∙ (𝜎𝑑)𝑘3 (2.14)
Where 𝜎𝑑 is the deviator stress, 𝑘1 is a regression coefficient in MPa and 𝑘2 𝑎𝑛𝑑 3 is a dimensionless
regression coefficient.
The equation 9, being the most universal one, is physically more correct than the equation 8 model. The
equation 8 model is still acceptable once the determination coefficient was 0.881 and has de advantage
of making a simple comparison of the Er values at full and scaled gradings and at different specimen
sizes possible. (Niekerk & Scheers, Galjaard, 2001)
2.10. Final Remarks
Environmental issues and logistic matters associated with the exploration and use of natural aggregates
in high quantity, as well as problems with treatment of waste from construction and demolition works
represent real and important challenges to road construction and rehabilitation. Governments have been
pressured to motivate, regulate and legislate the use of construction and demolition recycled materials.
Page 37
26
These facts lead construction companies to adopt these materials in works and represent an important
motivation to studies and researches in this field.
Has stated before, recent studies revealed great potential of using C&DRM in road unbound pavement
layers. These materials are not so well known and so predictable has natural materials. In what concerns
road construction, there is an evident challenge in the characterization of the materials used due to the
dynamic character of loads from the moving traffic. With poor knowledge of these materials behaviour
is difficult to support a justified a design model used in project.
The current tests used for characterise materials behaviour do not simulate the deviatoric load and
confining pressure experienced in the field which is crucial to understand and predict the materials
behaviour. The need of knowledge motivates repeated load triaxial tests on C&DRM once is the most
efficient test to simulate the real conditions of the material as described.
Page 38
27
3. Experimental Study
3.1. Methods
In this chapter several considerations regarding the main guidelines used in this work were made.
Afterwards is a description of the instrumentation used at the cyclic load triaxial test and the data
acquisition system. The description is divided in several different specific parts related to each specific
function: The triaxial cell; cell base; axial measure system; axial load transferring device; axial
deformation measure system; radial deformations measure system; exterior of the cell chamber;
application, control and measurement confining pressure system; data acquisition system; connections;
axial load system; accessories; compaction mould.
This chapter also contains a description of the C&DRM specimen mixtures and their origin. The
preparation method is described as well as the state conditions regarding the water content, dry density
and the compaction method used.
The repeated load triaxial test procedure performed at a constant confining pressure is described for
resilient behaviour and permanent deformation testing. The specifications related to the assembly of the
equipment and other special aspects are also referred.
The experimental procedures were conducted at LNEC in Lisbon.
A research was conducted in order to understand which proper regulated test presents a reliable way
to simulate the state of an aggregate mixture of a base road layer. This research lead to the cyclic load
triaxial test.
The cyclic load triaxial test performed follows the methods and procedures regarding the Standard EN
13286-7: 2004. This test is conceived to simulate the conditions of the unbound materials in pavement
layers subjected to moving loads concerning stress states and conditions. These procedures allow to
determine mechanical properties that can be used for performance ranking of materials and for
calculating the structural responses of pavement structures.
The test is applicable to cylindrical specimens of unbound mixtures prepared by laboratory compaction,
with an absolute maximum particle size smaller than one fifth of the specimen diameter.
For the loading of the specimen, two methods are provided:
- Method A: The Variable Confining Pressure method in which the cell pressure is cycled in phase
with the axial load.
- Method B: The Constant Confining Pressure method in which only cyclic axial loading and
constant confining pressure are performed.
Page 39
28
The apparatus for the two methods only vary in the need of using the triaxial cell. In the method B the
triaxial cell is optional and the deviator stress can be applied by vacuum inside the specimen.
General procedures
The Standard proposes three different test procedures:
- Procedure for the study of the resilient behaviour: A cyclic conditioning is first applied to stabilise
the permanent strains of the material and attain a resilient behaviour. The resilient behaviour is
observed for several stress paths applied to the same specimen. The results of this test can be
used to determine values of the elastic modulus of the material for different stress levels, or
parameter of non-linear elastic models which can be used for pavement design;
- Procedure for the study of permanent deformations: There is no need of a prior conditioning. A
large number of load cycles are applied to the specimen for each permanent deformation test.
Each set of load cycles is made for a specific load combination to associate with the
deformation. With these results is possible to predict the deformation of the material for a
specific stress level or to determine parameters of model prediction of permanent deformations
for pavement design;
- Multi-Stage procedure: Several load sequences with increasing stress levels are applied to the
same specimen until a specified total deformation limit. The objective with this procedure is to
determine maximum stress levels which should not be exceeded to avoid the development of
excessive permanent deformations. The procedure consists in applying different stress paths,
with constant confining pressure, on the same specimen.
Test conditions
Several compaction methods can be used in order to achieve uniform density and water content.
Regarding the specimens, the water content and density must be representative of the field
conditions. There is a variation regarding the mechanical properties of unbound mixtures with the
water content and degree of compaction.
The Standard EN-13286-7 gives an example of state conditions for the specimen preparation that
can be used for studying the sensitivity of the specimen about water content and density. The
example states a relation between the density and water content Table 3.1:
Table 3.1 - Example of state conditions for specimen preparation
Water content % Dry density
𝑊𝑂𝑃𝑀−4 𝑊𝑂𝑃𝑀−2 𝑊𝑂𝑃𝑀−1 𝜌𝑑
1 Specimen 100% 𝜌𝑑 𝑂𝑃𝑀
1 Specimen 2 Specimens 1 Specimen 97% 𝜌𝑑 𝑂𝑃𝑀
1 Specimen 95% 𝜌𝑑 𝑂𝑃𝑀
Where:
𝑊𝑂𝑃𝑀 is the optimum water content;
𝜌𝑑 𝑂𝑃𝑀 is the laboratory reference density
Page 40
29
3.2. Materials
The materials used at the experimental study where chosen at the scope of the investigation project
“SUPREMA - Sustainable application of Construction and Demolition Recycled Materials (C&DRM) in
road infrastructures” developed by LNEC in association with IST.
Two unbound mixtures where used:
1. Natural grinded aggregate mixture with extensive particle size distribution (ABGE(T));
2. Mixture composed by 30% recycled aggregates from reclaimed asphalt pavement (BET-F(T))
and 70% natural grinded aggregate mixture with extensive particle size distribution (ABGE(T)).
Aggregate classification
The classification and identification of the C&DRM mixture components, was made according to the
methods recommended in the standard EN 933-11:2009.
The reclaimed asphalt pavement obtained mixture is described in Figure 3.1.
Figure 3.1 - Composition the recycled aggregates from reclaimed asphalt pavement mixture (BET-F(T)) regarding
the EN 933-11:2009 Standard.
17
83
Ru [%]
Ra [%]
Subtitle:
Ra – Bituminous material;
Ru – Unbound aggregates, natural stone, hydraulic binder treated aggregates.
Page 41
30
Particle size distribution composition
The analysis of the particle size distribution characteristics of the C&DRM samples used was done
according to the Standard NP EN 933-1:2000 and EN 933-1:1997/A 1: 2005.
The Figure 3.2 shows a particle size distribution chart obtained for several samples used in the
SUPREMA investigation. For this work it is important to take in consideration results for ABGE(T) and
BET-F(T) as well as the required results by Estradas de Portugal Specifications (EP, 2010) of base and
sub-base granular layers.
Figure 3.2 – Graphical presentation of results for several tested materials (SUPREMA 2012)
3.3. Equipment description
The Transportations Department of LNEC acquired a cyclic load triaxial test equipment for cylindrical
specimens. This equipment is mainly designed for the mechanical characterization of granular materials
frequently used in road construction. It makes possible to apply axial and radial cyclic loads. The
confining pressure is acquired by using pressured air or water if proper equipment modifications are
made.
Com
ula
tive m
ate
rial passin
g [%
]
Sieved aperture size [mm]
EP Limits
Page 42
31
3.3.1. Triaxial Cell
The equipment is designed for cylindrical specimens with two different dimensions: i) 203 mm diameter
and 410 mm high; ii) 152 mm diameter and 310 mm high. The mounting of these two specimen sizes
requires a different configuration. In Figure 3.3 is a view of the triaxial cell base and the mechanical
equipment needed. In the case of this study, specimens with ii) sized specimens were tested and it is
possible to identify the following constituent parts Figure 3.3:
- [1] – Base cell;
- [2] – Load cell;
- [3] – Top and Base end platen;
- [4] – Axial deformation transducers;
- [5] – Radial Deformation transducer;
- [6] – Load Piston.
Figure 3.3 - Interior triaxial cell base equipment
Page 43
32
Base Cell
The circular cell base, in which the load cell is placed, has a 381 mm diameter and 290 mm thickness,
Figure 3.4 - Cell base, connection cables and measurement equipment. It is responsible for the exterior
support (hood) of the cell and allows the set to be sealed. The cell base has bolts to assure the fixation
to the hood .
Figure 3.4 - Cell base, connection cables and measurement equipment
At the cell base upper part has several electric plugs, Figure 3.5 - Contact plugs at the cell base: 3
connecting cables of three deformation transducers; one load cell connection cable. In this place there
is a fifth available plug, in which there is no connected cable, to any extra connection needed.
Figure 3.5 - Contact plugs at the cell base
Page 44
33
At the base lateral side is a plug that enables the connection between the plugged cable set and the
acquisition data system.
At the diametric opposed place is a set of three valves (Figure 3.6 – Valves): two lateral valves that
enable the connection between the exterior and two tubes responsible to connect existing holes placed
at the upper part of the cell base, to saturate the specimen; a central valve to communicate with the
interior of the cell and enables water to act as a confining pressure.
Figure 3.6 – Valves
3.3.2. Measurement Systems
Axial measurement system
To enable the measurement of the load transmitted to the specimen, a circular load cell is used, Figure
3.7.
It is placed on the cell base in which settles the specimen platen base. The load cell has a diameter of
157 mm.
Figure 3.7 - Load cell
Page 45
34
Axial deformation measurement system
The axial deformations are measured with LVDT (linear variable differential transducer) deformation
(Figure 3.8). The LVDT are mouted in the specimen axial direction with two steel rings (Figure 3.9)
placed arrounf each LVDT. There is a different set of rings for eatch specimen dimentions. The body of
each LVDT is fixated with a screw (1) and the moving axle is underpinned on other ring (2) composed
of two elements (3). These rings have a device (4) that enables diameter variations in order to follow
the specimen deformation.
Figure 3.9 - LVDT support rings
Figure 3.8 - Axial deformation LVDT
Page 46
35
Application, control and measurement confining pressure system
At the top of the triaxial cell hood are placed the confining pressure application and control system
devices. These devices communicate with the interior of the hood. (Figure 3.10)
o (1) – confining pressure application controller;
o (2) – purge valve;
o (3) – pressure measurement transducer.
At the compressed air system to enable confining pressure, is an air filter (Figure 3.13).
Figure 3.10 - Confining pressure application, control and measurement system placed at the top of the hood
Figure 3.11 - Confining pressure application controller details
Page 47
36
Figure 3.12 - Confining pressure measurement transducer detail
Circular plates of base and top axial load transferring device
Two circular plates are placed in contact with the top and base surface of the specimen. At the () two
sets of plates are shown and correspond to the different diameters (203 mm and 105 mm). The
specimen support is assured by the base plate (1). The axial force is transmitted to the specimen by the
top plate (2) with the load piston. The dimensions of the load piston depend if specimen size i) or ii) is
used. The load piston is 26 mm diameter and for specimen dimensions of i) or ii) corresponds a length
of 183 and 234 mm (3). The load piston is attached to the load equipment with a mechanical element
and swivel joint (Figure 3.15).
Figure 3.13 - Air filter
Page 48
37
Exterior of triaxial cell chamber
In (Figure 3.16) is possible to see some views of the triaxial cell chamber. This element is 300 mm
internal diameter and its main function is to enable the implementation of confining pressure to the
specimen. At the top of the hood there is an opening to allow the load piston to apply the axial load. Still
at the top of the hood, the confining pressure system devices are placed.
Figure 3.15 - Mechanical connecting device of the load
Figure 3.14 - Two cell base sets (1) and top (2)
Page 49
38
Figure 3.16 - Triaxial cell chamber
3.3.3. Data acquisition software
The software used to control the equipment works with a LabVIEW graphic tool under a MS Windows
platform.
BridgeLab is the software tool used to control the testing equipment. It allows the user to access reports
with data obtained during the test in real time.
This tool is composed of two distinguished parts, real time machine control (RTC: Real Time Core) and
its supervision.
In order to control this tool, it is only necessary to understand the test supervision, which includes the
preparation, the testing itself and data conclusions.
The software allows a manual and an automatic mode. The manual mode consists of a direct control of
the hydraulic piston witch gives a perception of the equipment response and can be used for calibration
purpose (Figure 3.17). The automatic mode consists of the application of a predefined repetitive
movement and it is used at the real test (Figure 3.18).
Page 50
39
Figure 3.17 – Manual Mode
Figure 3.18 – Automatic mode
3.3.4. Compaction mould
There are two cylindrical moulds associated with the test equipment that allow to carry with the
compaction of the specimen. The interior diameters are 204 and 153 mm and high of 510 and 433 mm
(Figure 3.20). In order to enable the mould removal after compaction it is possible unscrew blots placed
on their generating line to open them. (sem perturbação da amostra, ver a distribuição do teor de
humidade ao longo da amostra).
Page 51
40
Figure 3.20 - Compaction mould
3.4. Specimen preparation
The preparation consists in several steps: material preparation, mixing and moistening, compaction and
test specimen wrapping.
The mixture was set at a proportion of 30% recycled aggregates from reclaimed asphalt pavement
(BET-F(T)) and 70% natural grinded aggregate mixture with extensive particle size distribution
(ABGE(T)).
The compaction test adopted, to achieve the optimum water content, was the vibrating hammer
– 2nd method EN 13286-4 using as reference the results of Proctor test NP EN 3286-2.
Figure 3.19 - Open mould
Page 52
41
The first step consist of moistening the material with water at the laboratory balcony in order to achieve
the ideal water content. Figure 3.21
The specimens were compacted at the total of 6 layers of 30 cm each, using a vibration process. The
apparatus used includes the cylindrical metal mould, described at chapter 3.3., with a membrane
designed to avoid water loss (Figure 3.22) and a detachable baseplate. The vibrating hammer was used
without any structure.
Figure 3.21 – Material moistening
Figure 3.22 - Compaction mould with membrane
Repeated load triaxial test
The tests were conducted under controlled temperature for different compaction degrees in order to
proper describe the material´s behavior under different possible situations and therefore perform a much
more complete study.
Six specimens were prepared according the method described in chapter 3.4. The temperatures chosen
were 20, 30 and 40oC in order to simulate the temperature range that subbase layer materials are
exposed. The degrees of summarization chosen were 95% and 100%.
The method adopted for this test was the method B of EN 13286-7: Unbound and hydraulically bound
mixtures - Part 7: Cyclic load triaxial test for unbound mixtures. In this test method, the confining
pressure is not cycled. The maximum stress level was selected for the conditioning and the subsequent
stress as a high stress level with a maximum deviator stress𝜎𝑑 = 340 𝑘𝑃𝑎. The applied stress levels
should cover the stress range to which the material will be submitted in the field.
Page 53
42
3.4.1. Study of permanent deformations
The objective of this test procedure is to analyze the development of permanent strains with the number
of cycles of loading for different stress levels.
The tests were performed for each material using two replicates in order to proper define the permanent
deformations.
The conditioning started by applying an initial stress, 𝜎3 = 70 𝑘𝑃𝑎 followed by 20.000 cycles of cyclic
deviator stresses from 𝜎𝑑 = 0 to 𝜎𝑑 = 340 𝑘𝑃𝑎.
The conditioning may be stopped at a lesser number of cycles if the permanent axial strain and the
resilient modulus become stable. (This condition is satisfied if the axial permanent strain rate becomes
less than 10–7 per cycle, and if the rate of variation of the resilient modulus becomes less than 5 kPa
per cycle) (EN 13286-7).
The following values were registered:
-load cycle number,
-minimum and maximum axial stresses: 𝜎1𝑚𝑖𝑛 and 𝜎1𝑚𝑎𝑥,
-minimum and maximum confining stresses: 𝜎3𝑚𝑖𝑛 and 𝜎3𝑚𝑎𝑥 ,
-resilient and permanent axial strains: 𝜀1𝑟 and 𝜀1𝑝,
-resilient and permanent radial strains: 𝜀3𝑟 and 𝜀3𝑝.
Readings were taken continuously during the first 20 cycles, and then at the following cycle numbers
50, 80, 200, 400,1000, 25000, 5000, 7500, 10000, 12500, 15000, 17500, 20000 for 10 consecutive
cycles.
3.4.2. Repeated loading for resilient testing
The standard recommends to reduce the confining stress to 𝜎3 = 20𝑘𝑃𝑎 and allow sufficient time for
strain stabilization. Then, according to the selected maximum stress level, it is recommended to apply
the stress levels with confining pressures of 20 kPa to 70 kPa according to Error! Reference source
not found.. If higher values of stress 𝜎3 are likely to occur in the application envisaged for the material,
it is advised also to apply the remaining stress levels in Error! Reference source not found.. Each
cyclic loading must be applied during 100 cycles.
Page 54
43
Table 3.2 – Stress Levels for resilient behaviour (method B), (EN-1386-7:2004)
During the testing procedures, it was found that the equipment worked better if the application of the
strain paths in an inverse order. This impacts directly on the resilient modulus and will be referred in
chapter 45.
For each mixture, the 19 high stress level paths with 𝜎3 ∈ {20, 35, 50, 70}𝑘𝑃𝑎 were tested. 100
cycles were applied at each stress path. The recordings were performed between cycles number:
1 – 20, 50 – 61, 88 – 102.
During a stress path testing, the values measured are:
The force transmitted by the axial piston;
Radial deformation of the specimen;
Page 55
44
𝜎3, confining pressure;
𝜀1, axial deformation LVDT’s measurements.
In addition to the detail programation of the application of the intended stress paths, the used software
was programed to identify at each measurement:
The cycle number;
Time of the testing;
The measurements of the axial piston force and the radial deformation of the specimen were used to
calculate 𝜎1 at each moment. 𝐴𝑐𝑜𝑟𝑟𝑒𝑐𝑡𝑒𝑑 takes in to consideration the radial expansion of the specimen
when the piston force is applied.
𝜎1 =𝐹
𝐴𝑐𝑜𝑟𝑟𝑒𝑐𝑡𝑒𝑑 (3.1)
𝜀1 values were obtained by the average of the 3 LVDT’s at each measurement.
When 𝜎3𝑟 = 0, witch represents a constant confining pressure, the resilient modulus is calculated by
the following expression:
𝐸𝑟 =𝜎1
𝜀1 (3.2)
In order to simplify the calculation of the resilient modulus at each test, recordings of 𝜎1 and 𝜀1 were
taken at the beginning and end of the 10 last cycles. The representative value of the resilient modulus
was obtained of a simple ponderation between the 10 values.
Page 56
45
4. Results and discussion
4.1. Considerations
This experiment translated in to a wide series of cyclic triaxial test. As mentioned at chapter 0, two
unbound mixtures were tested at 3 different temperatures. For each mixture/temperature combination,
permanent deformations and resilient behavior were tested. The permanent deformation study
consisted of 2 tests of 20.000 cycles and the resilient behavior consisted of 20 tests with 100 cycles.
The quantity of data retrieved at the procedure demands a strategy to pinpoint the representative data.
In the study of permanent deformations, the selected test, at each case, was the one that presented
less interruptions.
As mentioned in chapter 0, the equipment presented several interruptions when the stress paths were
performed at the suggested order in Error! Reference source not found.. The solution found to avoid
this situations was to perform the tests in reverse order. The problem associated with this is related to
the reconditioning of the material and the resilient modulus do not present significant changes when
decreasing the maximum deviator stress.
4.2. Study of permanent deformations
The tests were conducted as described in chapter 0. with casual adaptations when needed.
The specimens used were composed of 30% BET-F(T), reclaimed asphalt pavement, and 70%
ABGE(T), natural aggregates. All specimens were prepared with 4% water density and performed
between 0,5 and 1,0 Hz (cycle/second.
The geometry of the specimens used is described at Table 4.1.
Table 4.1 – Specimen Geometry
Test
number
Radius
(m)
Height
(m)
Distance between LVDT’s
(m)
T=20º and CD=95% 1st
0,10
0,355 0,210
T=20º and CD=100% 2nd
0,330
0,200
T=30º and CD=95% 3rd 0,200
T=30º and CD=100% 4th 0,222
T=40º and CD=95% 5th 0,35 0,210
T=40º and CD=100% 6th 0,34 0,219
Page 57
46
Permanent deformation method results:
At the 1st and 5th tests, the readings recorded were at the first 20 cycles followed by readings between
50 and 61, 88 and 111, 200 and 211, 400 and 411, 1000 and 1011, 2500 and 2511, 5000 and 5011,
7500 and 7511, 10000 and 10011, 20000 and 20011.
The remaining tests added cycles between 12.500 and 12.511, 15.000 and 15.011, 17.500 and 17.511
in order to better understand the permanent axial deformation progression. An example of the readings
of 𝜎1 at the specimen tested at 30º Celsius and CD= 95% is represented at Figure 4.1. In this case, the
test was performed at 0,5 Hz.
Figure 4.1 - 𝜎1 readings at T30oC, 100%
During the load application, data from the axial LVDT’s were retrieved. The final measure of the axial
deformation was obtained by the average of the 3 LVDT’s. An example of the readings obtained for the
axial deformation of the test performed at T=20ºC and CD=95% is illustrated in Figure 4.2. It is possible
to visualize the course of the loading and the advancing of the axial deformation with the cycles.
0
50
100
150
200
250
300
350
400
0 2000 4000 6000 8000 10000 12000
𝜎1
(kP
a)
Test time (s)
Page 58
47
Figure 4.2- Average axial deformation at 20.000 cycles, T20oC, 95%
The progression of the permanent deformations can be compared and visualized in figure Figure 4.3.
Figure 4.3 – Progression of the axial deformation at each condition
It is possible to conclude that the Compaction degree influences directly the permanent deformation.
Several interruptions occurred at the conditioning of the specimen tested at T=30ºC and CD=95% which
compromised the conditioning readings.
0
50
100
150
200
250
300
350
400
450
0,00E+00 2,00E-03 4,00E-03 6,00E-03 8,00E-03 1,00E-02 1,20E-02 1,40E-02 1,60E-02
𝜎1
(kP
a)
𝜀1 (mm)
0,00E+00
5,00E-03
1,00E-02
1,50E-02
2,00E-02
2,50E-02
3,00E-02
0 5000 10000 15000 20000
T=20ºC, CD=95% T=20ºC, CD=100% T=30ºC, CD=100ºC
T=40ºC, CD=95% T=40ºC, CD=100%
Page 59
48
At 20000 cycles, the progression of the axial deformation show a tendency to stabilize, but it is possible
to state that 20.000 cycles are not enough to eliminate the permanent deformations of this material.
The results for the permanent axial deformation of the tested specimens are presented at Table 4.2.
Table 4.2 – Permanent axial deformation
𝜺𝒑 (m) % 𝜺𝒑
T=20º and CG=95% 1,40 ∙ 10−2 4.52
T=20º and CG=100% 2,70 ∙ 10−3 0.87
T=30º and CG=95% - -
T=30º and CG=100% 1,88 ∙ 10−3 0.61
T=40º and CG=95% 2,86 ∙ 10−2 9.23
T=40º and CG=100% 7,60 ∙ 10−3 2.45
When comparing obtained results, in Figure 4.4, it is possible to observe that for the same temperature
and moisture, compaction degree directly influences the permanent axial deformation. For higher
degrees of compaction less permanent deformation is obtained. Temperature also represents a direct
influence in deformations and for higher temperatures, the influence of compaction degree is even more
influencing.
It is possible to state that the compaction degree does play an important role in permanent deformations
for lower temperatures. For higher temperatures, due to the bituminous content of RAP, the material is
the most important factor that influences the permanent deformation.
Figure 4.4 - Permanent deformation, comparison between tests
20
30
40
0,00E+00
5,00E-03
1,00E-02
1,50E-02
2,00E-02
2,50E-02
3,00E-02
95
100
Tem
per
atu
re (
oC
)
Axi
al d
efo
rmat
ion
(m
m)
Compaction Degree (%)
2,50E-02-3,00E-02
2,00E-02-2,50E-02
1,50E-02-2,00E-02
1,00E-02-1,50E-02
5,00E-03-1,00E-02
0,00E+00-5,00E-03
Permanent Deformation
Page 60
49
For 100% compaction degree, this material showed permanent deformations of 0.87, 0.61 and 2.45%.
These values are comparable to results obtained in studies performed with limestone and granite.
At a study, using a repeated triaxial load equipment with cylindrical specimens 150 x 320 mm, the
permanent deformation obtained varied between 0.4 and 1.4% for limestone and between 1.2 and 2.4%
for granite (Conceição Luíza, et al, 2011).
This shows that the permanent behaviour of this material can be compared with well know materials
used and base and subbase pavement layers.
4.3. Study of Resilient behaviour
The stress paths where applied in an inverse order from the suggested procedure of the European
standard adopted (EN-13286-7).
Due to the inverted procedure, the resilient modulus, obtained in the first experiment, are very similar to
the following tests performed at lower stress paths. Due to this, the analysis was performed only for the
stress path with σ3 = 70 𝑘𝑃𝑎 and 0 < 𝜎𝑑 ≤ 340. 100 cycles were performed at these tests.
The resilient modulus values were calculated in each test regarding the 10 last cycles. With this
procedure was possible to ensure, no permanent deformation were entering the evaluation of the
resilient behavior of the material.
The recordings were made, in each test, at the first 20 cycles, between cycle 50 and 61, 88 and 102,
which follows the suggested method at the European Standard and is represented at the example in
Figure 4.5.
Figure 4.5 - σ_1readings at T20C, 95% - Resilient Behaviour
0
50
100
150
200
250
300
350
400
0 20 40 60 80 100 120
σ3
(kP
a)
Test time (s)
Page 61
50
Resilient behavior study results
In order to easily demonstrate the variation of axial deformations of the material, Figure 4.6 represents
an example of the axial deformation of the specimens for 100 cycles with 0 < 𝜎𝑑 < 340 𝑘𝑃𝑎 and
𝜎1 = 70𝑘𝑃𝑎. Figure 4.7 represents an example of the axial deformation of the specimens at 10 cycles
and the values used to obtain the resilient module.
Figure 4.6 - Axial deformation at 100 cycles – T=40º, CD=100%
Figure 4.7- Axial deformation at 10 cycles – T=40º, CD=100%
For tests with 20º Celsius and 100% compaction degree, the obtained resilient modulus was not
conclusive. The data obtained in this test was compromised. It is possible to observe erratic behaviour
in Figure 4.8 and Figure 4.9.
0
50
100
150
200
250
300
350
400
0,00E+00 1,00E-04 2,00E-04 3,00E-04 4,00E-04 5,00E-04 6,00E-04
σ3
(kP
a)
𝜀1 (mm)
0
50
100
150
200
250
300
350
400
0,00E+00 1,00E-04 2,00E-04 3,00E-04 4,00E-04 5,00E-04 6,00E-04
σ3
(kP
a)
𝜀1 (mm)
Page 62
51
Figure 4.8 - Axial displacement at 100 cycles – T=20º, CD=100%
Figure 4.9 - axial displacement at 10 cycles – T=20º, CD=100%
The obtained resilient modulus was a result of an average between the calculated values of the 10
cycles. In Table 4.3 it is possible to see the relations between temperature, compaction degree and
resilient modulus performed for the selected stress path.
0
50
100
150
200
250
300
350
400
0,00E+00 5,00E-05 1,00E-04 1,50E-04 2,00E-04 2,50E-04 3,00E-04 3,50E-04
σ3
(kP
a)
𝜀1 (mm)
0
50
100
150
200
250
300
350
400
0,00E+00 5,00E-05 1,00E-04 1,50E-04 2,00E-04 2,50E-04 3,00E-04
σ3
(kP
a)
𝜀1 (mm)
Page 63
52
Table 4.3 – Resilient Modulus Results
Compaction
Degree (%) Temperature (ºC)
Resilient Modulus
(MPa)
Deviator stress 𝜎𝑑
(KPa)
95
20 737.9
0 - 340
30 644.8
40 518.9
100
20 -
30 958.4
40 833.2
When comparing the resilient modulus obtained at the different tests, Figure 4.10, it is possible to
observe that the resilient modulus decreases at higher temperatures and increases at higher compaction
degree.
In Figure 4.11 is represented a relation between Resilient Modulus, Temperature and Compaction
Degree. Temperature and Compaction Degree, represent approximately the same influence in Resilient
Modulus.
Figure 4.10 - Resilient Modulus Comparison between tests
737,9
644,8
958,4
518,9
833,2
0 200 400 600 800 1000 1200
T= 20 C, CD=95%
T= 30 C, CD=95%
T= 30 C, CD=100%
T= 40 C, CD=95%
T= 40 C, CD=100%
Resilient Modulus (MPa)
Page 64
53
Figure 4.11 – Resilient Modulus relations
The resilient modulus values obtained for the selected stress path, 0 < 𝜎𝑑 < 340 𝐾𝑃𝑎, are comparable
to values obtained in previous studies.
A. Gomes Correia, G. Grégoire, B. Dethy & J. Detry, 2009, performed triaxial test with Steel Slag and
crushed concrete aggregate. For the referred stress path, limestone presented resilient modulus of 400
MPa, crushed concrete presented values 470MPa and steel slag with 650 MPa. This leads to the
conclusion that this material may be eligible for use in base and sub base pavement layers.
4.4. Study of Natural Aggregate
Each test procedure is vulnerable to errors related to the apparatus used and the measurement
methods.
In order to mitigate these errors, is fundamental to test well known materials. In this case, two specimens
of limestone were tested for the conditions specified at Table 4.4.
Table 4.4 – Natural aggregate test conditions
20
30
40
0
200
400
600
800
1000
1200
95 100
Tem
per
atu
re (
oC
)
Res
ilien
t M
od
ulu
s (M
Pa)
Compaction Degree (%)
1000-1200
800-1000
600-800
400-600
200-400
0-200
Resilient Modulus (MPa)
Water Content
• 5%
Compaction Degree
• 95%
• 100%
Temperature (ºC)
• 20
Page 65
54
The results at Table 4.5 show that fot temperatures of 20ºC, the mixture of reclaimed asphalt pavement
and natural aggregate tested has potential of being used as road base and sub base pavement layers.
Table 4.5 - Comparisson of natural aggregate results
Compaction Degree Material Permanent
Deformation (m)
Resilient
Modulus
(MPa)
GC=95% Recycled aggregate mixture 1.40E-0.2 737.9
Limestone 3.58E-0.3 1067.2
GC=100% Recycled aggregate mixture 2.70E-0.3 -
Limestone 4.01E-03 811.2
4.5. Mechanical Behaviour Model
As stated at Chapter 2.9, for the resilient modulus modelling, some behaviour models (Lekarp et al.,
2000; NCHRP, 1998) generally used in modelling of the mechanical behaviour of granular materials
were adjusted to the test results, namely the models Dunlap, k–θ (Luzia et al., 2011)
The model intended to use at this study was the following:
𝐸𝑟 = 𝑘1𝜃𝑘2. (4.1)
Where 𝜃 is the first invariant of stress (𝜃 = 𝜎1 + 𝜎2 + 𝜎3). 𝑘1 and 𝑘2 are material constants.
In order to calculate the model, a chart with resilient modulus versus the first invariant of stress (𝜃)
must be obtained at each stress path. Values of 𝐾1 and 𝐾2 would be obtained at a regression.
With this methodology it is possible to define the material representative values 𝐾1 and 𝐾2 for each
tested temperature.
The aspect referred in chapters 0 and 0 regarding the application of an inverse methodology of stress
paths applied at each specimen, lead to problems associated with the reconditioning of the material
and the resilient modulus did not present significant changes when decreasing the maximum deviator
stress. For this reason it was not possible to calculate the resilient modulus for different stress paths at
each test and consequently calculate 𝐾1 and 𝐾2 values.
Page 66
55
5. Conclusions
5.1. General conclusions
Recycling is a common necessity to all areas. Road construction and rehabilitation evolves large
material quantities to be extracted, transported and eventually deposit at a landfill. This dissertation aims
to develop knowledge to wat concerns the usage of construction and demolition recycled materials at
road construction and rehabilitation.
The dissertation focussed on C&DRM use at unbound pavement layers namely base and sub base
pavement layers. In order to access if a certain material can replace well known natural aggregates it is
important to study mechanic and physical characteristics when submitted to the conditions verified at
the designated pavement layers. Repeated load triaxial tests were conducted with mixture composed
by 30% recycled aggregates from reclaimed asphalt pavement (BET-F(T)) and 70% natural grinded
aggregate mixture with extensive particle size distribution (ABGE(T)). This test was chosen once it
simulates real state conditions.
Two main studies were made for the selected material: Study of permanent deformations and resilient
behaviour. In order to better describe the material, the tests were performed at 20, 30 and 40 degrees
Celsius and for two compaction degrees: 95% and 100%.
At the study of permanent deformations, due to technical issues, it was not possible to retrieve data from
the test performed at 30ºC and compaction degree of 95%. For the same reason, at the resilient behavior
study, it was not possible to retrieve data from the test performed at 20ºC and compaction degree of
95%.
At the resilient behavior study, the equipment showed problems in the application of low stress paths at
first. The solution found was to initiate the study in reverse order. This resulted in the reconditioning of
the material and the resilient modulus did not present significant changes when decreasing the
maximum deviator stress. For this reason, the data discussion focused exclusively at the stress path
characterized by 0 < 𝜎𝑑 < 340 𝐾𝑃𝑎.
The axial permanent deformation obtained is comparable with results found on natural aggregates and
for higher degrees of compaction less permanent deformation is obtained. Temperature also represents
a direct influence in deformations and for higher temperatures, the influence of compaction degree
increases.
To what concerns to the resilient behaviour, the resilient modulus obtained is comparable to results
obtained with limestone, crushed concrete and steel slag. It was possible to conclude that resilient
modulus decreases at higher temperatures and increases at higher compaction degree and temperature
and compaction degree, represent approximately the same influence in Resilient Modulus.
Page 67
56
5.2. Future works
In order to improve knowledge related to the usage of construction and demolition recycled materials in
unbound base and sub base road layers it is recommended to perform the cyclic triaxial test for different
state conditions such as: compaction degree, temperature, water content, other stress paths, different
alternative materials.
It is recommended to perform an economic study in order to fully understand the impact of using
alternative materials in unbound base and sub base pavement layers.
Page 68
57
Bibliographic references
Haynes, J. H. & Yoder, E. J. (1963). “Effects of Repeated Loading on Gravel and Crushed Stone Base
Course Materials Used in the AASHO Road Test,” Highway Research Record 39, Highway
Research Board, Washington, DC.
COM(96) 399 Final, (1996). “Communication from the commission on the review of the Community
Strategy for Waste Management”, Commission of the European Communities, Brussels.
Brown, S. F. (1977), “Development in Highway Pavement Engineering: Chapter 2 – Material
Characterization for Analytical Pavement Design”, pp 41-92.
Shahin, M. Y. (1994). “Pavement Management for Airports, Roads, and Parking Lots”, NY Chapman &
Hall.
Freire, A. C. (1994). “Estudos Relativos a Camadas de Pavimentos Constituídas por Materiais
Granulares”. Masters degree thesis. Nova University, Laboratório Nacional de Engenharia
Civil, Lisbon.
Correia, A. G. & Gilletti, S. (1996). “A large triaxial apparatus for the study of granular materials under
repeated loading used at LNEC”. Instituto Superior Técnico & Labooratório Nacional de
Engenharia Civil, Lisbon.
Dawson, A. D., (2000). “Unbound Aggregates in Road Construction”, Proceedings of the fifth
international symposium on unbound aggregates in roads, University of Nottingham, United
Kingdom.
Nataatmadja, A., Tan, Y. L., (2000). “The performance of recycled crushed concrete aggregates”,
School of Engineering, Griffith University, Gold Coast, Qld, Australia.
Khogali, W. E. I. & Zeghal M. (2000). “On the resiliente behaviour of unbound aggregates”, National
Research council Canada, Institute for Research in Construction, Urban Infrastructure
Rehabilitation Program, Otawa, Ontario, Canada.
Aurstad, J. & Uthus, N. S., (2000). “Use of stockpiled asphalt and demolition debris in road construction
in Norway”, Published at “Unboun Aggregates in road construction”, Dawson, SINTEF Civil
and Environmental Engineering
Saeed, A., Hall. J. W. & Barker W. (2001). “Performance-Related Tests of Aggregates for Use in
Unbound Pavement Layers”, National Cooperative Highway Research Program, Report 453,,
USA.
Neves, J., (2001), “Contribuição para a modelação do comportamento estrutural de pavimentos
flexíveis”, PhD Thesis, Instituto Superior Técnico, Lisbon.
Reid, J. M., (2001), “Alternative materials in road construction”, ALT-MAT Report, Transport Research
Laboratory, UK.
Page 69
58
A. A. van Niekerk & J. Van Scheers, P. J. Galjaard (2001), „Triaxial testing of coarse grained mix
granulates at scaled gradings and smaller specimen sizes“, Delft university of technology,
Netherlands.
Magnusdottir, B., Erlingsson, S., (2002), “Repeated Load Triaxial Testing for Quality Assessment of
Unbound Granular Base Course Material”, Engineering Research Institute, University of
Iceland.
Arm, M., (2003). “Mechanical Properties of Residues as Unbound Road Materials”. PhD Thesis, KTH
Land and water Resources Engineering, stockholm.
Hoff, I., (2004), “GARAP Improvement of equipment for cyclic triaxial testing”, Report STF22 A04321
SINTEF Civil and Environmental Engineering, Roads and Transport.
Prochaska, E. I. T., Drnevich, P. E., Kim, D., & Sommer, K. E. (2005). “A vibrating Hammer Compaction
Test for Granular Soils and Dense Graded Aggregates”, From TRB 84th Annual Meeting,
Washington, D.C.
Drnevich V., Evans, A., Prochaska, A. (2007). “A study of effective soil compactions control of granular
soils”,
SUPREMA, (2008), “Aplicação Sustentável de Resíduos de Construção e Demolição (RCD) em Infra-
estruturas Rodoviárias”, Progress report PTDC7ECM7100931/2008 – Year 3
Pestana, R. M. (2008). “Contribuição para o Estudo do Comportamento Mecânico de Resíduos de
Construção e Demolição Aplicados em Estradas de Baixo Tráfego” Masters Thesis, Instituto
Superior Técnico.
Molenaar, A. A. A. (2009). “Design of Flexible Pavements”, Structural Design of Pavements Part III.
Ferreira, J. (2009), “Aplicação de Resíduos de Construção e Demolição (RCD) em Camadas de Sub-
base Não Ligadas de Estradas de Baixo Tráfego”, Masters Thesis, Instituto Superior Técnico,
Lisboa.
Melo, A., Gonçalves, A., Martins, I., (2009) “Gestão dos resíduos de construção e demolição: Estudo
comparativo Brasil – Portugal”, Relatório 71/2010 – NB, Postdoc internship report, LNEC.
Freire, A., Neves, J., Pestana, R., (2010) ”Analysis of Recycled Aggregates Properties for Unbound
granular Asphalt Pavement Layers”.
Luzia, R., Santos, L., Neves, J., Gardete, D., (2011) “Portuguese UGM characterisation using cyclic
triaxial tests”, ICE Institution of Civil Engineers publishing.
Leite, A., Motta, R., Vasconcelos, K. (2011) “Laboratory evaluation of recycled construction and
demolition waste for pavements”. Construction and Building Materials Vol 25 pp. 2972–2979.
Edil, T.B., (2011), “Specifications and recommendations for recycled materials used as inbound base
course”, Recycled Materials Resource Center, University of Winsonsin-Madisson, USA
Page 70
59
Proteau, M. (2012), “Advanced technologies to reclaim roadways”, APWA Annual Meeting, Tampa FL,
EUROVIA, North American Technical Center, NATC.
Simões, R. (2013), “Estudo do comportamento de Resíduos de Construção e Demolição aplicados em
camadas não ligadas de pavimentos”, Masters Thesis, Instituto Superior Téncino, Lisboa.
Lakisic, S. (2014), “Deformational properties of unbound granular pavement materials”, 3rd International
conference on Road and Rail infrastructure (CETRA).
Taherkhani, H., Pour, A. F., (2014) “Investigating the Viability of using Recycled Aggregates in Unbound
Base layer”, MAGNT Research Report (ISSN. 14444-8939).
Freire, A. C. (2014), “Aplicação de Agregados Reciclados em Vias de Comunicação Especificações de
Projeto e Construção”, Formação FUNDEC AGREC, Instituto Superior Técnico, Lisboa.
Agência Portuguesa do Ambiente 2015, (APA) (por o site, consultado na data)
European Comission 2015 (EC) http://ec.europa.eu/environment/waste/construction_demolition.htm
Griffin soil, (2015), “Pavement base and Subbase stabilization”, Chemical Stabilization Bases and
Subbase section.
Page 71
60
Normative references
European Standard EN 13284-5 (2003), “Unbound and hydraulically bound mixtures – Part 5: Test
methods for laboratory reference density and water content – Vibrating table”, European
committee for normalisation CEN.
European Standard EN 13284-4 (2003), “Unbound and hydraulically bound mixtures – Part 4: Test
methods for laboratory reference density and water content – Vibrating hammer”, European
committee for normalisation CEN.
European Standard EN 13284-3 (2003), “Unbound and hydraulically bound mixtures – Part 3: Test
methods for laboratory reference density and water content – Vibrocompression with
controlled parameters”, European committee for normalisation CEN.
European Standard EN 13284-2 (2004), “Unbound and hydraulically bound mixtures – Part 2: Test
methods for the determination of the laboratory reference density and water content –
Proctor compaction”, European committee for normalisation CEN.
European Standard EN 13286-7 (2004), “Unbound and hydraulically bound mixtures – Part 7: Cyclic
load triaxial test for unbound mixtures”, European committee for normalisation CEN.
Page 73
62
The figures represented are related to the results obtained at each test for permanent deformation and
resilient behaviour studies.
- 𝜎1readings at T20oC, 95%
𝜎1 readings at T20oC, 100%
0
50
100
150
200
250
300
350
400
450
0 2000 4000 6000 8000 10000 12000
𝜎1
(kP
a)
Test Time (s)
0
50
100
150
200
250
300
350
400
0 5000 10000 15000 20000
𝜎1
(kP
a)
Test Time (s)
Page 74
63
Average axial displacement at 20.000 cycles, T20oC, 95%
Average axial displacement at 20.000 cycles, T20oC, CD= 100%
0
50
100
150
200
250
300
350
400
450
0,00E+00 2,00E-03 4,00E-03 6,00E-03 8,00E-03 1,00E-02 1,20E-02 1,40E-02 1,60E-02
𝜎1
(kP
a)
𝜀1 (mm)
0
50
100
150
200
250
300
350
400
0,00E+00 5,00E-04 1,00E-03 1,50E-03 2,00E-03 2,50E-03 3,00E-03 3,50E-03
𝜎1
(kP
a)
𝜀1 (mm)
Page 75
64
Permanent axial deformation progression, T = 20ºC and CD = 95%
Average axial displacement at 20.000 cycles, T30oC, 100%
0,00E+00
5,00E-04
1,00E-03
1,50E-03
2,00E-03
2,50E-03
3,00E-03
3,50E-03
0 5000 10000 15000 20000 25000
𝜀1 (
mm
)
Nº cycles
0
50
100
150
200
250
300
350
400
0,00E+00 2,00E-04 4,00E-04 6,00E-04 8,00E-04 1,00E-03 1,20E-03 1,40E-03 1,60E-03 1,80E-03 2,00E-03
𝜎1
(kP
a)
𝜀1 (mm)
Page 76
65
Permanent axial deformation progression, T = 20ºC and CD = 95%
𝜎1readings at T40oC, 95%
0,00E+00
2,00E-04
4,00E-04
6,00E-04
8,00E-04
1,00E-03
1,20E-03
1,40E-03
1,60E-03
1,80E-03
2,00E-03
0 5000 10000 15000 20000 25000
𝜀1 (
mm
)
Nº cycles
0
50
100
150
200
250
300
350
400
0 2000 4000 6000 8000 10000 12000
𝜎1
(kP
a)
Test time (s)
Page 77
66
Average axial displacement at 20.000 cycles, T40oC, 95%
Permanent axial deformation progression, T = 40ºC and CD = 95%
0
50
100
150
200
250
300
350
400
0,00E+00 5,00E-03 1,00E-02 1,50E-02 2,00E-02 2,50E-02 3,00E-02
𝜎1
(kP
a)
𝜀1 (mm)
0,00E+00
5,00E-03
1,00E-02
1,50E-02
2,00E-02
2,50E-02
3,00E-02
3,50E-02
0 5000 10000 15000 20000 25000
𝜀1 (
mm
)
Nº cycles
Page 78
67
𝜎1readings at T40oC, 100%
Average axial displacement at 20.000 cycles, T40oC, 100%
0
50
100
150
200
250
300
350
400
450
0 2000 4000 6000 8000 10000
𝜎1
(kP
a)
Test time (s)
0
50
100
150
200
250
300
350
400
450
0,00E+00 1,00E-03 2,00E-03 3,00E-03 4,00E-03 5,00E-03 6,00E-03 7,00E-03 8,00E-03
𝜎1
(kP
a)
𝜀1 (mm)
Average axial displacement at 20.000 cycles
Page 79
68
Permanent axial deformation progression, T = 40ºC and CD = 100%
𝜎1readings at T20oC, 95% - Resilient Behavior
0,00E+00
1,00E-03
2,00E-03
3,00E-03
4,00E-03
5,00E-03
6,00E-03
7,00E-03
8,00E-03
9,00E-03
0 5000 10000 15000 20000 25000
0
50
100
150
200
250
300
350
400
0 20 40 60 80 100 120
σ3
(kP
a)
Test time (s)
Page 80
69
Axial displacement at 100 cycles – T=20º, CD=95%
Average axial displacement at 10 cycles – T=20º, CD=95%
0
50
100
150
200
250
300
350
400
0,00E+00 1,00E-04 2,00E-04 3,00E-04 4,00E-04 5,00E-04 6,00E-04 7,00E-04 8,00E-04
σ3
(kP
a)
𝜀1 (mm)
0
50
100
150
200
250
300
350
400
0,00E+00 1,00E-04 2,00E-04 3,00E-04 4,00E-04 5,00E-04 6,00E-04 7,00E-04 8,00E-04
σ3
(kP
a)
𝜀1 (mm)
Page 81
70
𝜎1readings at T20oC, 100% - Resilient Behavior
Average axial displacement at 100 cycles – T=20º, CD=100%
0
50
100
150
200
250
300
350
400
0 20 40 60 80 100 120
σ3
(kP
a)
Test time (s)
0
50
100
150
200
250
300
350
400
0,00E+00 5,00E-05 1,00E-04 1,50E-04 2,00E-04 2,50E-04 3,00E-04 3,50E-04
σ3
(kP
a)
𝜀1 (mm)
Page 82
71
Average axial displacement at 10 cycles – T=20º, CD=100%
Resilient behaviour results
𝜎1readings at T30oC, 95% - Resilient Behavior
0
50
100
150
200
250
300
350
400
0,00E+00 5,00E-05 1,00E-04 1,50E-04 2,00E-04 2,50E-04 3,00E-04
σ3
(kP
a)
𝜀1 (mm)
0
50
100
150
200
250
300
350
400
0 20 40 60 80 100 120 140
σ3
(kP
a)
Test time (s)
Page 83
72
Average axial deformation at 100 cycles – T=40º, CD=95%
Average axial deformation at 10 cycles – T=40º, CD=95%
0
50
100
150
200
250
300
350
400
0,00E+00 1,00E-04 2,00E-04 3,00E-04 4,00E-04 5,00E-04 6,00E-04 7,00E-04 8,00E-04 9,00E-04
σ3
(kP
a)
𝜀1 (mm)
0
50
100
150
200
250
300
350
400
0,00E+00 1,00E-04 2,00E-04 3,00E-04 4,00E-04 5,00E-04 6,00E-04 7,00E-04 8,00E-04 9,00E-04
σ3
(kP
a)
𝜀1 (mm)
Page 84
73
Average axial displacement at 100 cycles – T=30º, CD=95%
Average axial displacement at the last 10 cycles – T=30º, CD=95%
0
50
100
150
200
250
300
350
400
0,00E+00 1,00E-04 2,00E-04 3,00E-04 4,00E-04 5,00E-04 6,00E-04 7,00E-04 8,00E-04
σ3
(kP
a)
𝜀1 (mm)
0
50
100
150
200
250
300
350
400
0,00E+00 1,00E-04 2,00E-04 3,00E-04 4,00E-04 5,00E-04 6,00E-04 7,00E-04 8,00E-04
σ3
(kP
a)
𝜀1 (mm)
Page 85
74
𝜎1readings at T30oC, 100% - Resilient Behavior
Average axial displacement at 100 cycles – T=30º, CD=100%
0
50
100
150
200
250
300
350
400
0 20 40 60 80 100 120 140
σ3
(kP
a)
Test time (s)
0
50
100
150
200
250
300
350
400
0,00E+00 5,00E-05 1,00E-04 1,50E-04 2,00E-04 2,50E-04 3,00E-04 3,50E-04 4,00E-04 4,50E-04 5,00E-04
σ3
(kP
a)
𝜀1 (mm)
Page 86
75
Average axial displacement at 10 cycles – T=30º, CD=100%
𝜎1readings at 40oC, 95% - Resilient Behavior
0
50
100
150
200
250
300
350
400
0,00E+00 5,00E-05 1,00E-04 1,50E-04 2,00E-04 2,50E-04 3,00E-04 3,50E-04 4,00E-04 4,50E-04 5,00E-04
σ3
(kP
a)
𝜀1 (mm)
0
50
100
150
200
250
300
350
400
0 20 40 60 80 100 120
σ3
(kP
a)
Test time (s)
Page 87
76
Average axial displacement at 100 cycles – T=40º, CD=95%
Average axial displacement at 10 cycles – T=40º, CD=95%
0
50
100
150
200
250
300
350
400
0,00E+00 1,00E-04 2,00E-04 3,00E-04 4,00E-04 5,00E-04 6,00E-04 7,00E-04 8,00E-04 9,00E-04
σ3
(kP
a)
𝜀1 (mm)
0
50
100
150
200
250
300
350
400
0,00E+00 1,00E-04 2,00E-04 3,00E-04 4,00E-04 5,00E-04 6,00E-04 7,00E-04 8,00E-04 9,00E-04
σ3
(kP
a)
𝜀1 (mm)
Page 88
77
𝜎1readings at T40oC, 100% - Resilient Behavior
Average axial displacement at 100 cycles – T=40º, CD=100%
0
50
100
150
200
250
300
350
400
0 20 40 60 80 100 120 140
σ3
(kP
a)
Test time (s)
0
50
100
150
200
250
300
350
400
0,00E+00 1,00E-04 2,00E-04 3,00E-04 4,00E-04 5,00E-04 6,00E-04
σ3
(kP
a)
𝜀1 (mm)
Page 89
78
Average axial displacement at 10 cycles – T=40º, CD=100%
0
50
100
150
200
250
300
350
400
0,00E+00 1,00E-04 2,00E-04 3,00E-04 4,00E-04 5,00E-04 6,00E-04
σ3
(kP
a)
𝜀1 (mm)