Page 1
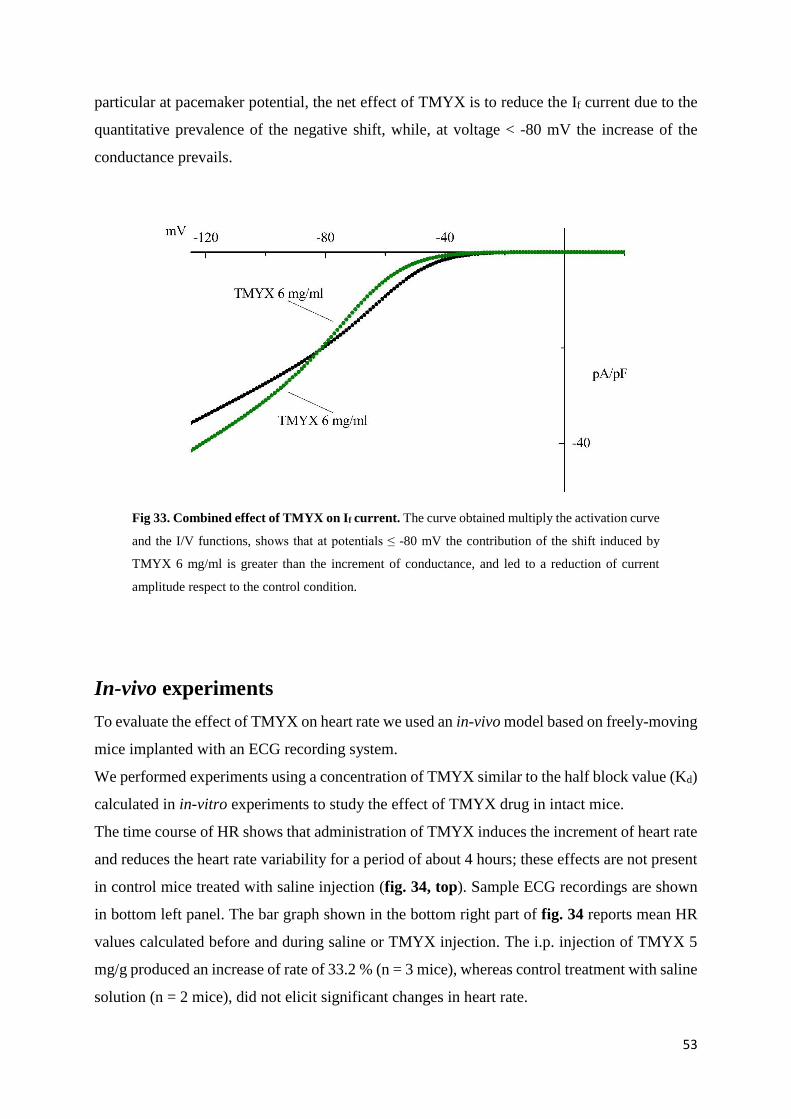
CORSO DI DOTTORATO
Fisiologia XXVIII ciclo
BIO-09
TESI DI DOTTORATO DI RICERCA
Cardiac pacemaking: pathophysiology and
pharmacology of the If current
Dott. Manuel Paina
Tutor: Prof. Mirko Baruscotti
Coordinatore: Prof. Michele Mazzanti
Anno Accademico 2014-2015
Page 2
1
SUMMARY
1. ABSTRACT page 5
2. GENERAL INTRODUCTION page 7
2.1 The heart page 7
Heart anatomy page 7
Cardiac innervation page 10
Cardiac conduction system page 12
2.2. Action potentials page 13
Fast response action potentials page 13
Slow response action potentials page 14
2.3. If current page 16
Kinetics page 19
Tissue distribution of If in the heart page 19
2.4. HCN channels page 20
HCN channels isoforms page 22
2.5. The electrocardiogram page 24
Bipolar leads page 25
Unipolar leads page 25
Normal ECG page 25
Monitoring page 27
Normal cardiac rate page 27
2.6. Radiotelemetry in freely-moving mice page 28
2.7. Heart-rate reducing agents page 29
Alinidine page 29
Zatebradine page 30
Cilobradine page 30
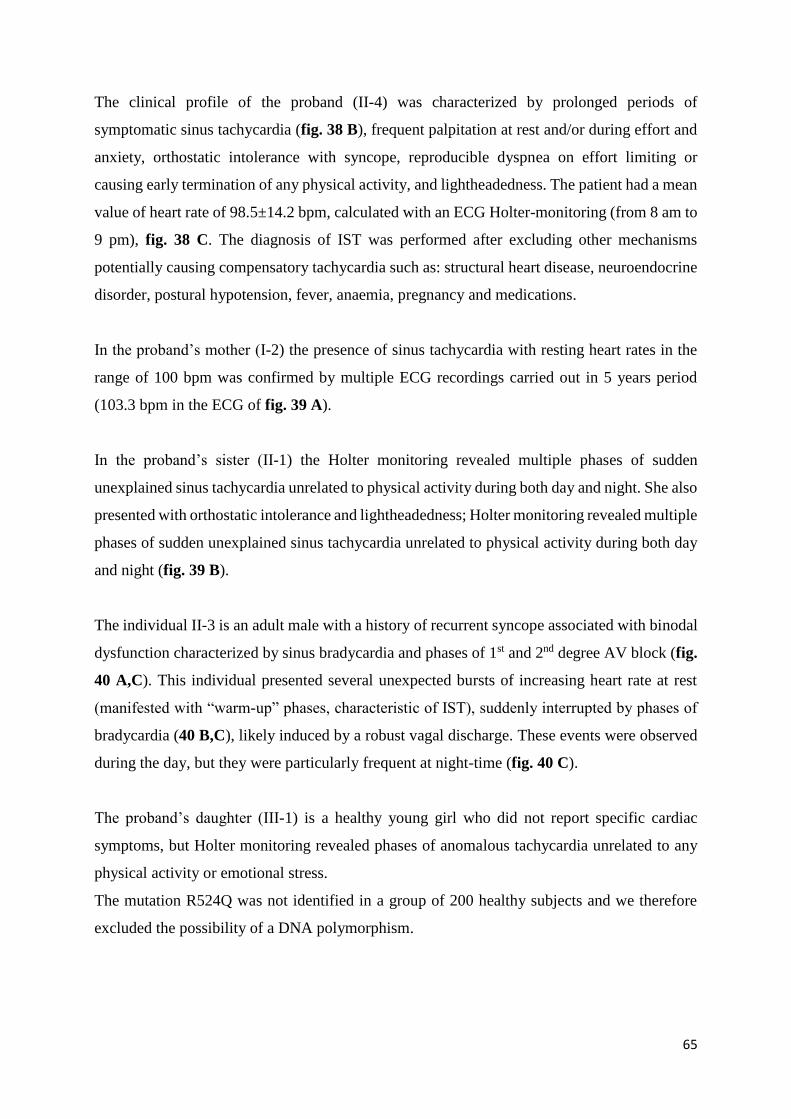
ZD7288 page 30
Ivabradine page 31
3. TRADITIONAL CHINESE MEDICINE page 33
3.1. Introduction page 33
Tong Mai Yan Xin page 35
Page 3
2
3.2. Materials and methods page 36
Animals page 36
In-vitro experiments page 36
Cell isolation page 36
Patch-clamp solutions page 37
Equipment page 38
Protocols and data analysis page 38
Treatments page 41
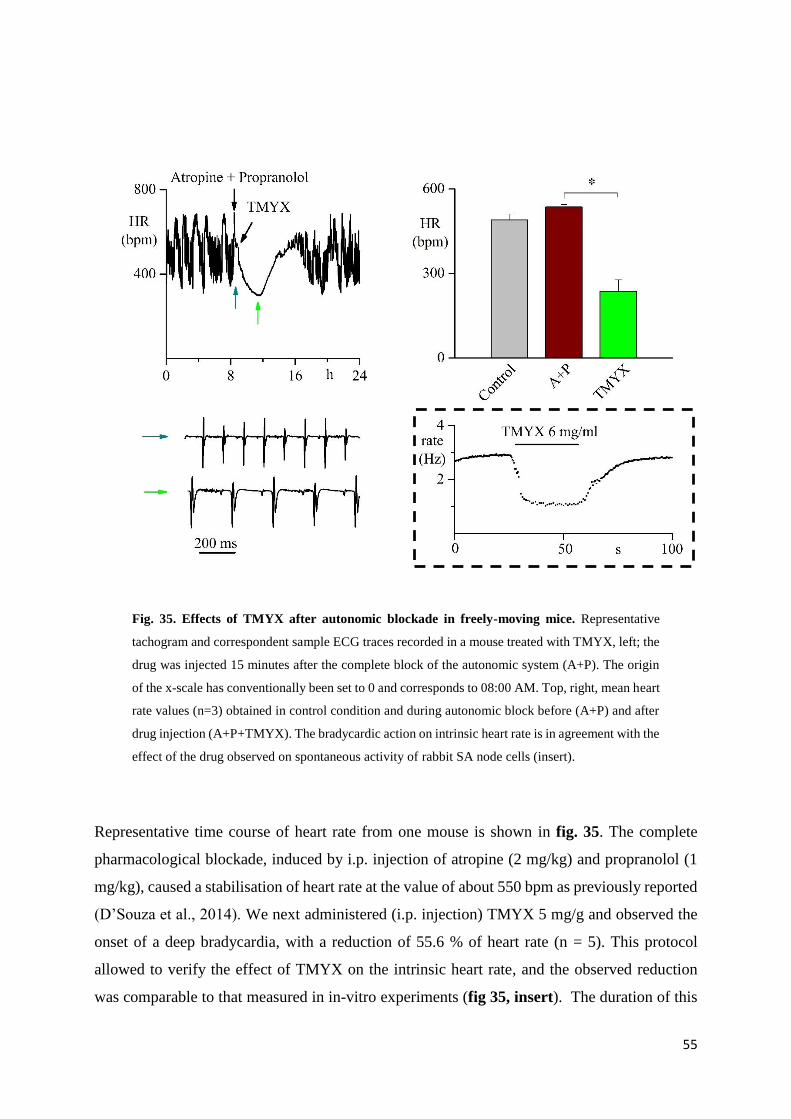
In-vivo experiments page 42
Telemetric setup page 42
Implantation protocol page 43
Telemetric protocols page 43
3.3. Results page 45
In-vitro experiments page 45
Action potential parameters page 45
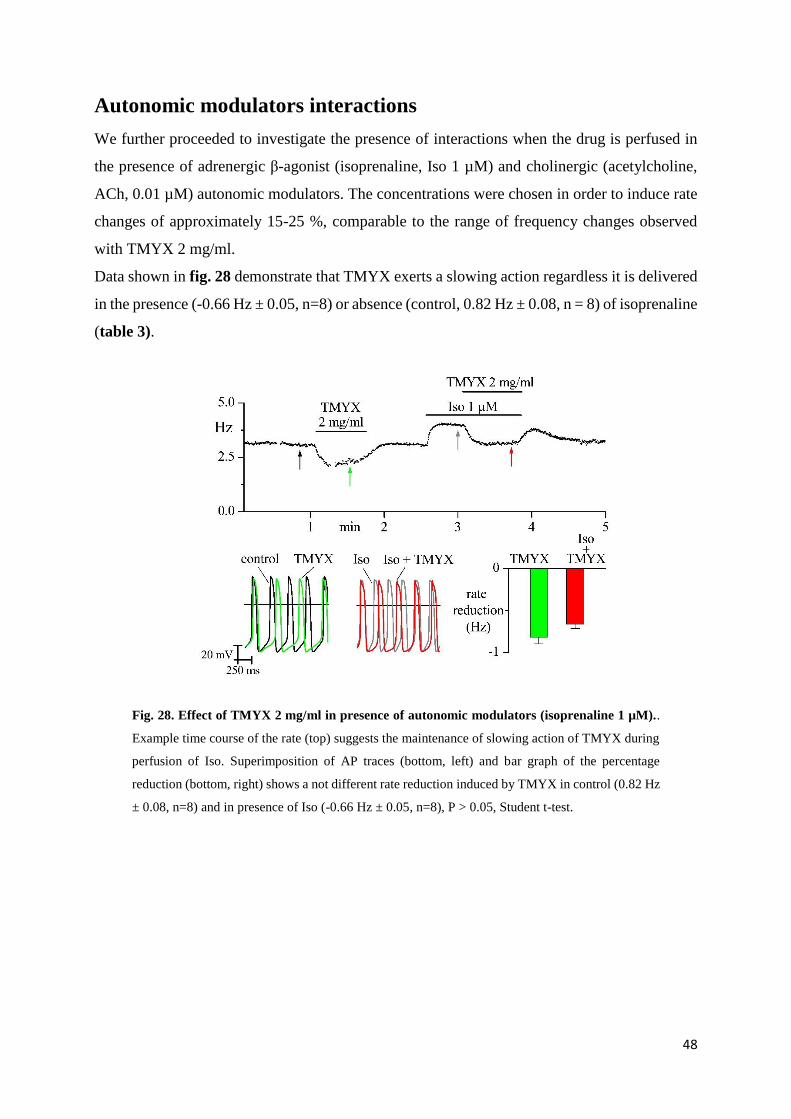
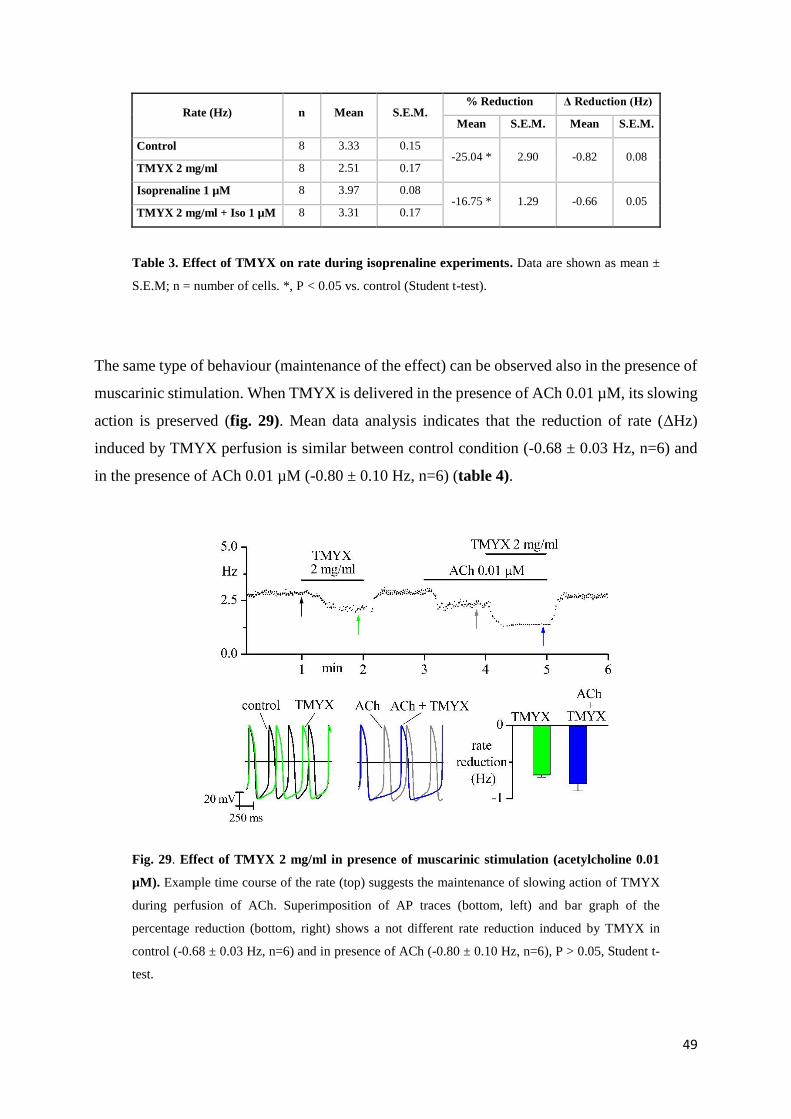
Autonomic modulators interactions page 49
If current page 52
In-vivo experiments page 54
4. INAPPROPRIATE SINUS TACHYCARDIA page 59
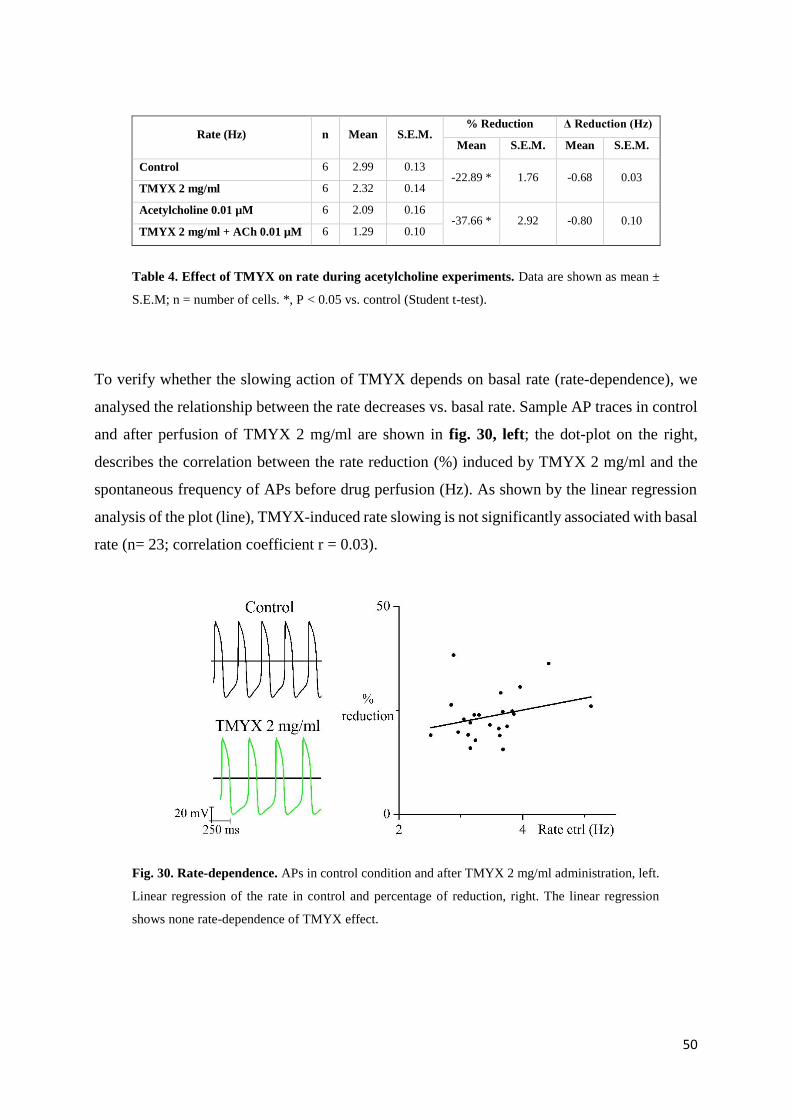
4.1. Introduction page 59
4.2. Materials and methods page 61
Including criteria page 61
Genomic DNA analysis and mutagenesis page 61
Functional studies in HEK 293 cells page 61
Whole-cell studies page 62
Inside-out macropatch studies page 62
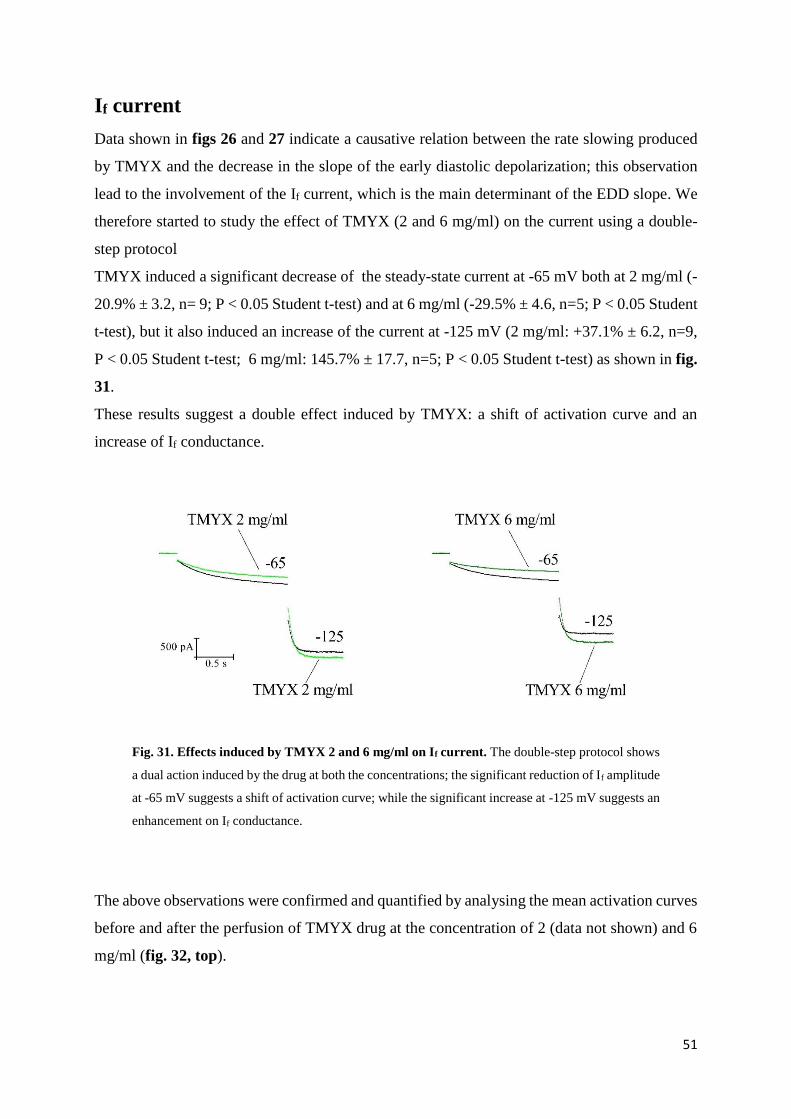
Functional studies in neonatal rat cardiac myocytes cultures page 63
Action potential studies page 63
Current density and kinetics properties page 63
Video detection of cell rate page 64
4.3. Results page 65
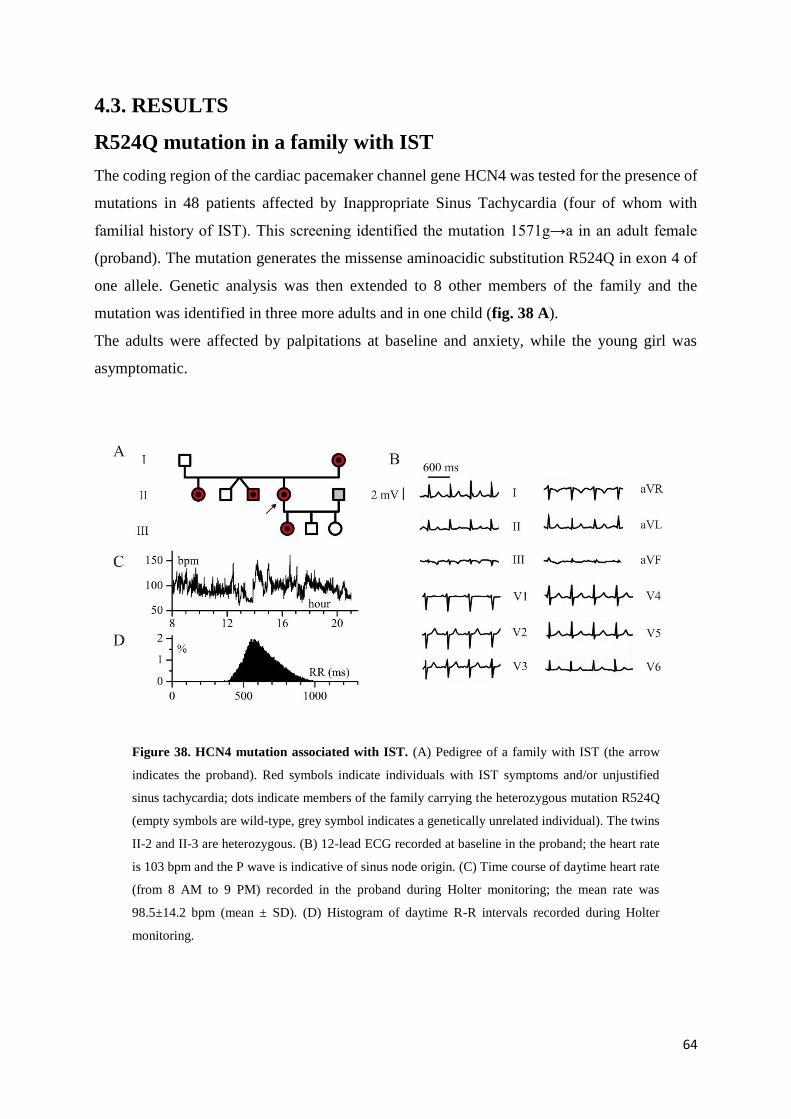
R524Q mutation in a family with IST page 65
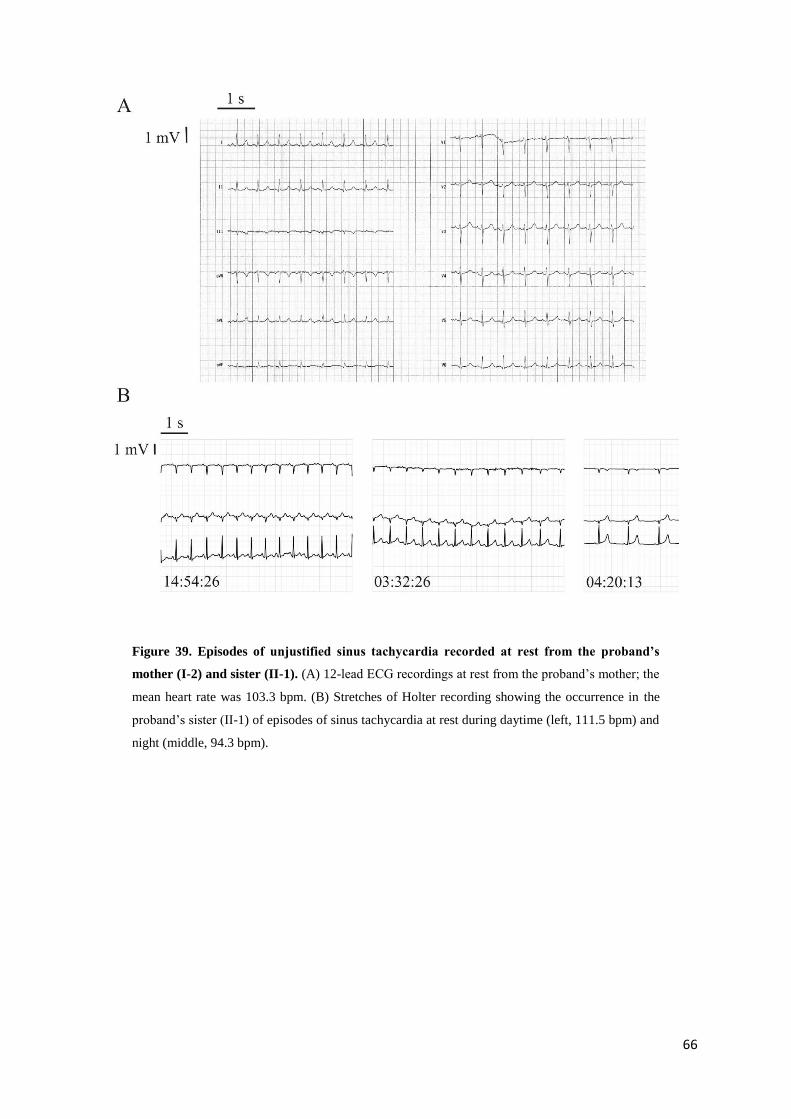
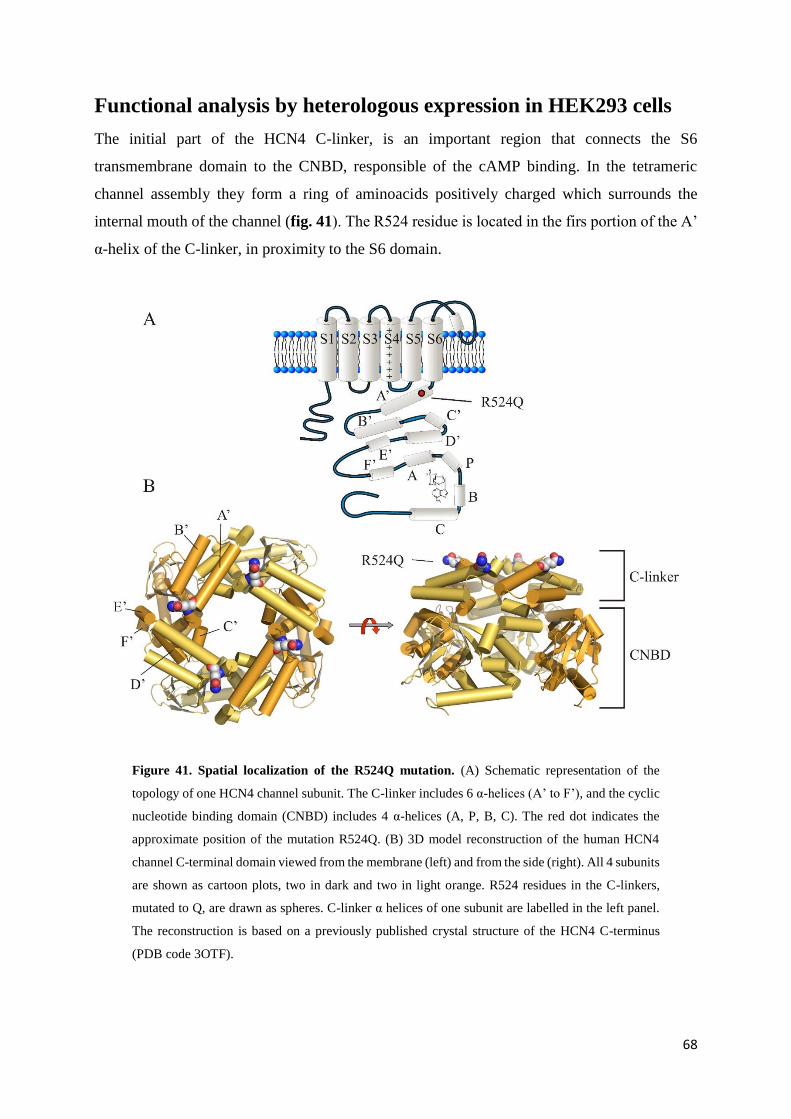
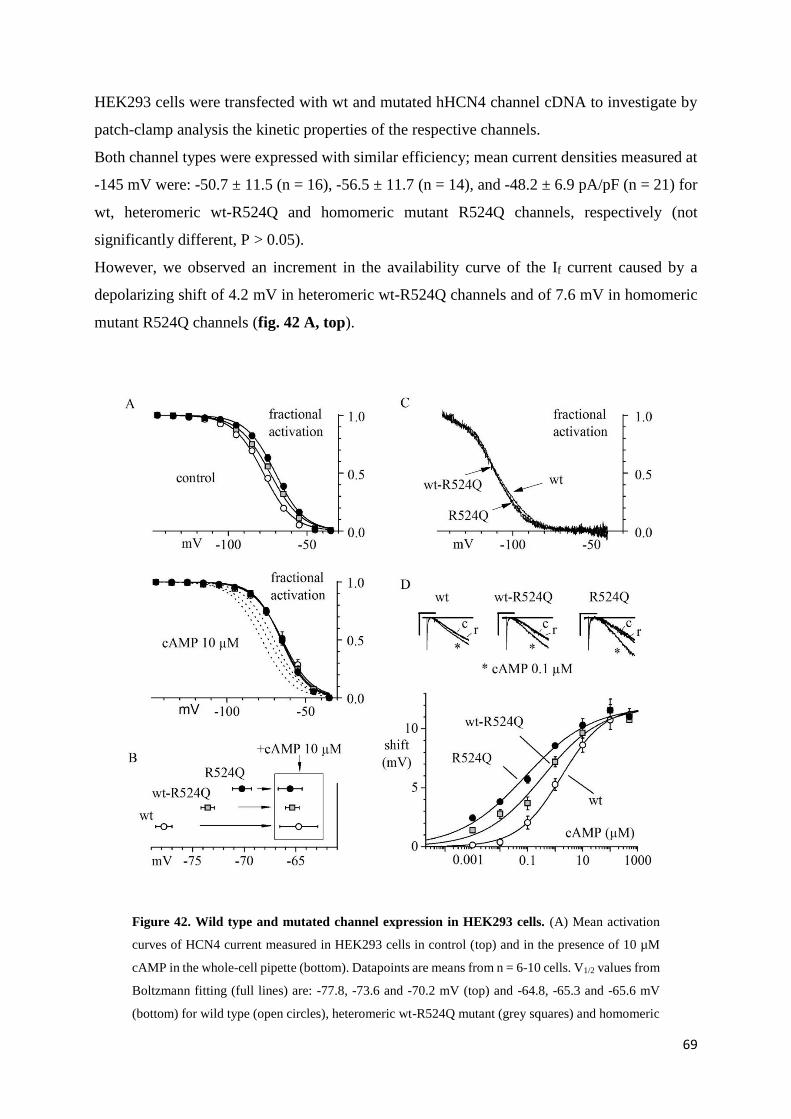
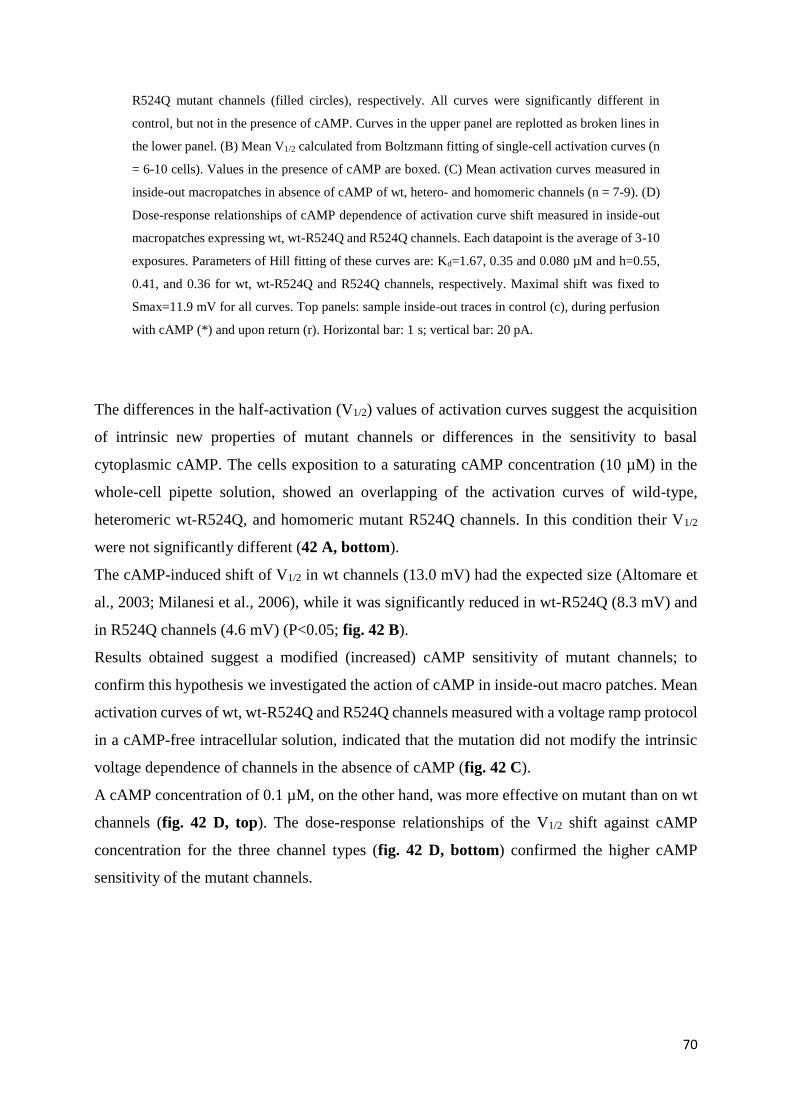
Functional analysis by heterologous expression in
HEK293 cells page 69
Page 4
3
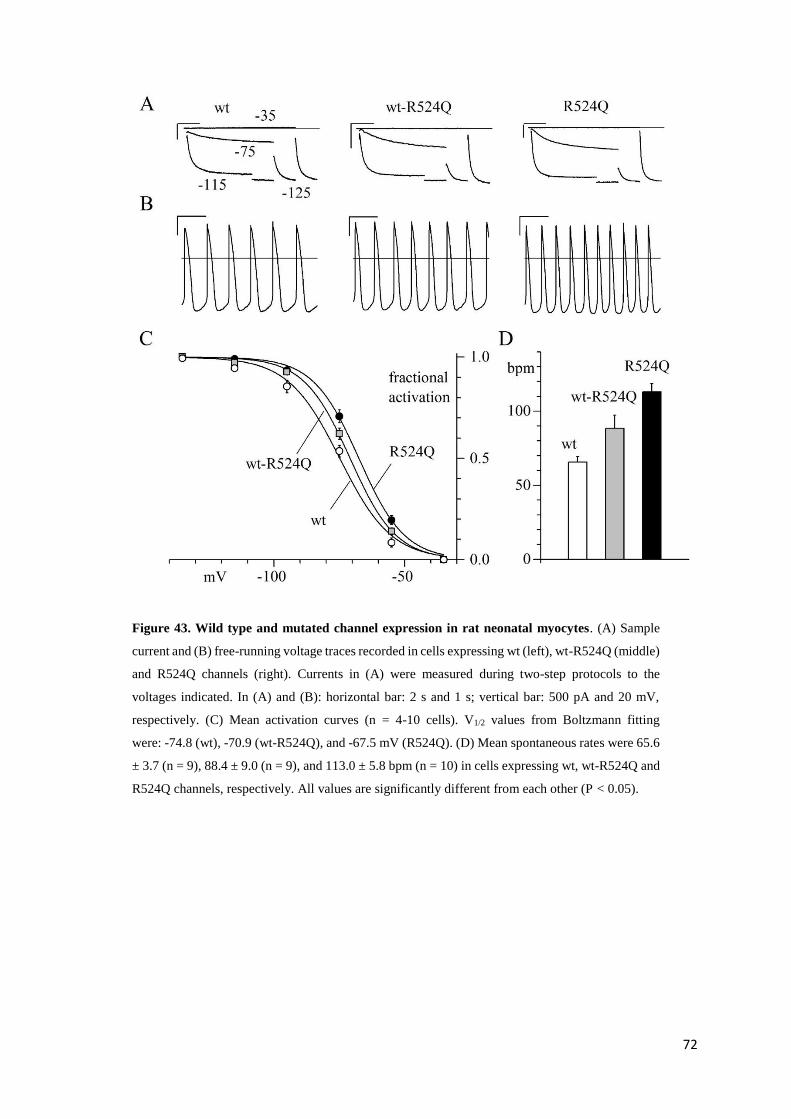
R524Q mutant proteins increase automaticity in
neonatal cardiac myocytes page 72
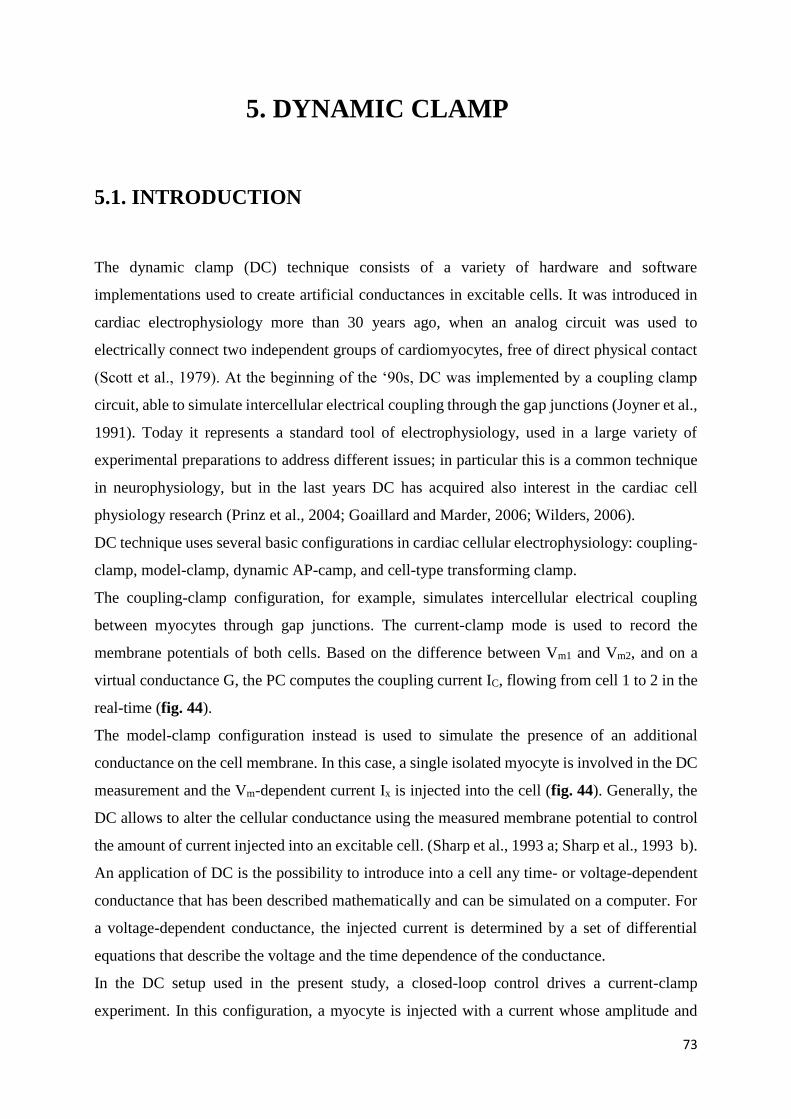
5. DYNAMIC CLAMP page 74
5.1. Introduction page 74
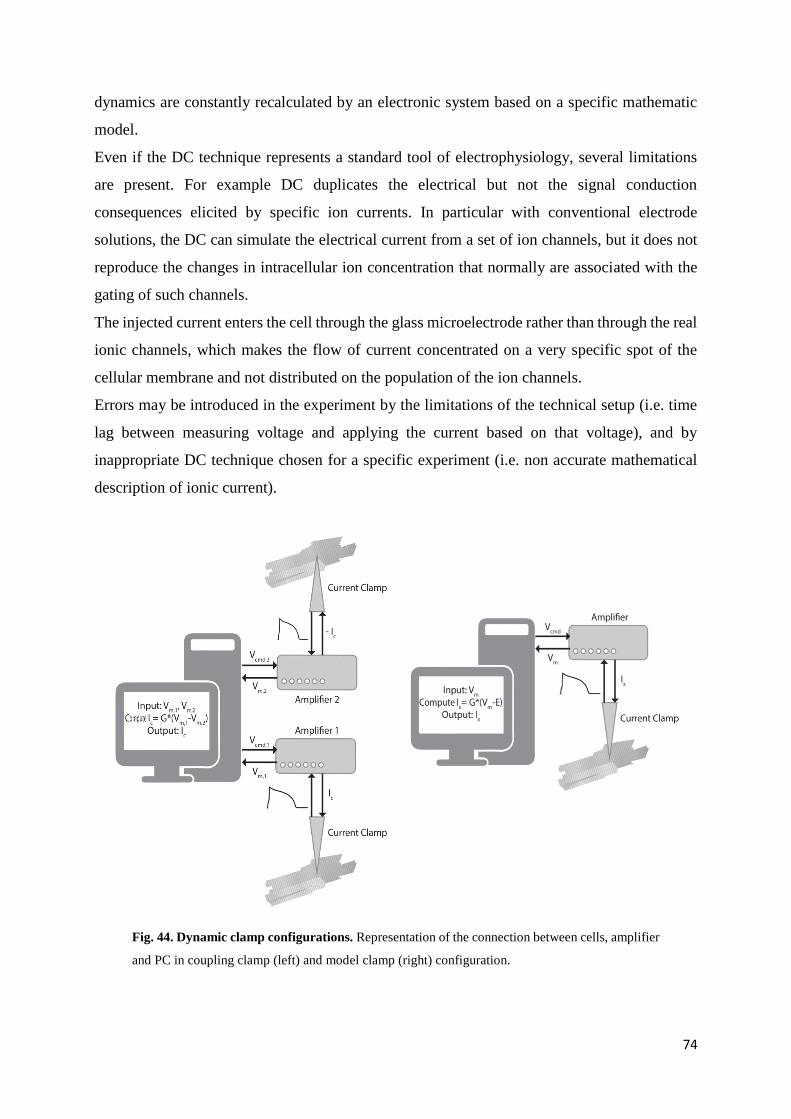
5.2. Materials and methods page 76
Experimental setup page 76
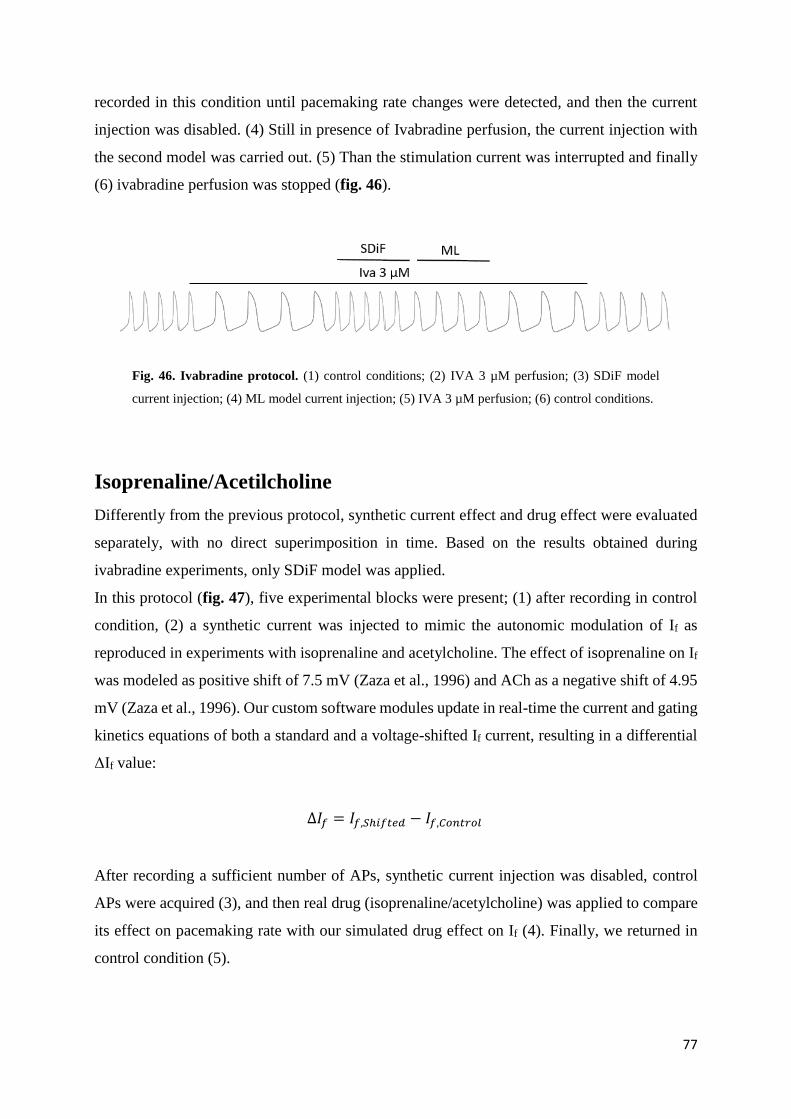
Dynamic clamp protocols page 77
Ivabradine page 77
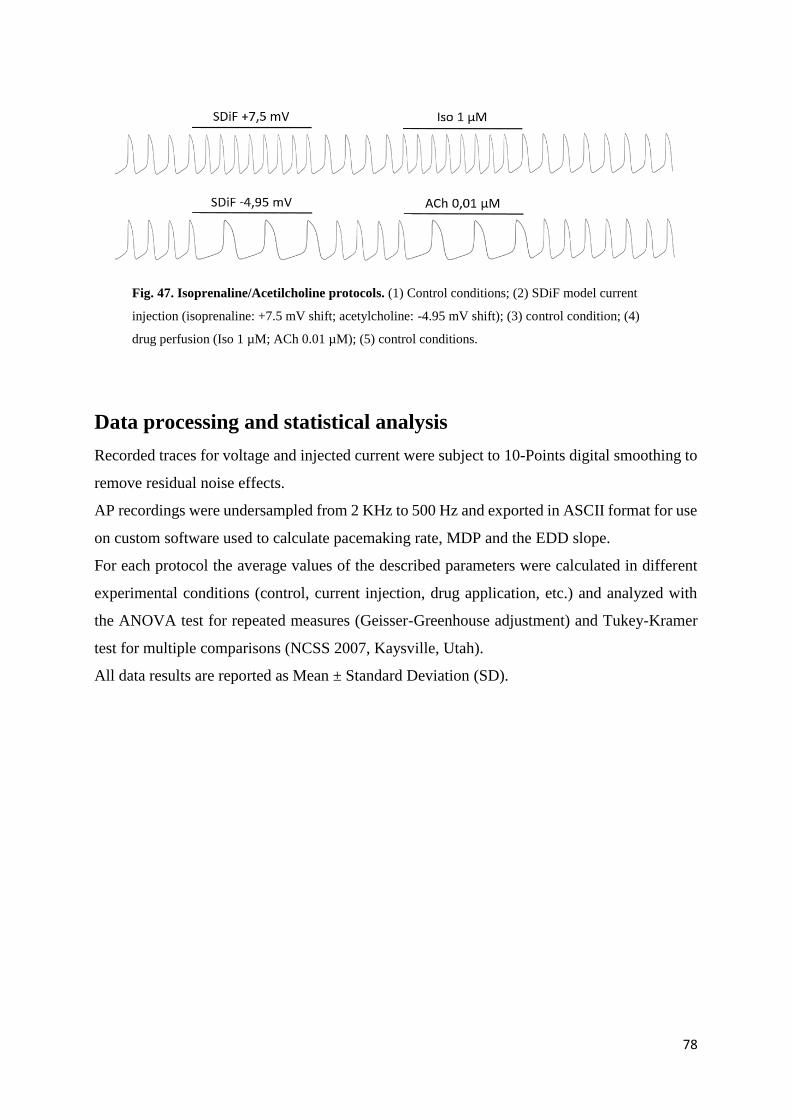
Isoprenaline/Acetylcholine page 78
Data processing and statistical analysis page 79
5.3. Results page 80
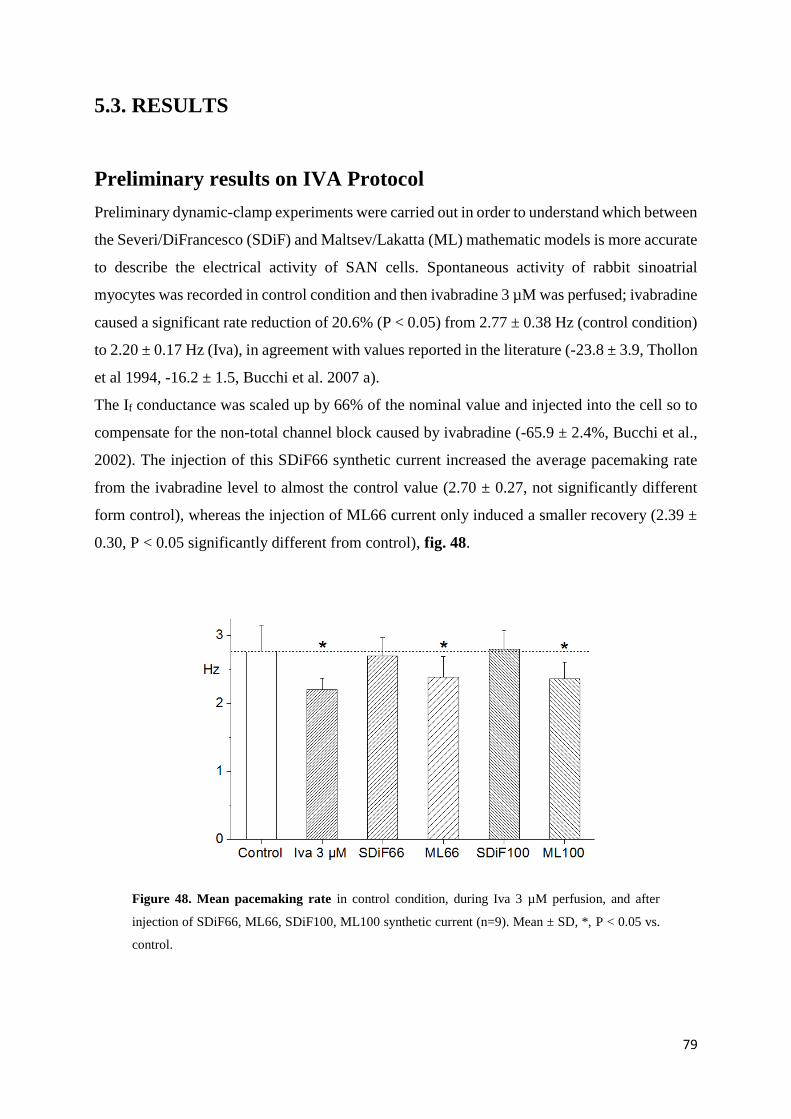
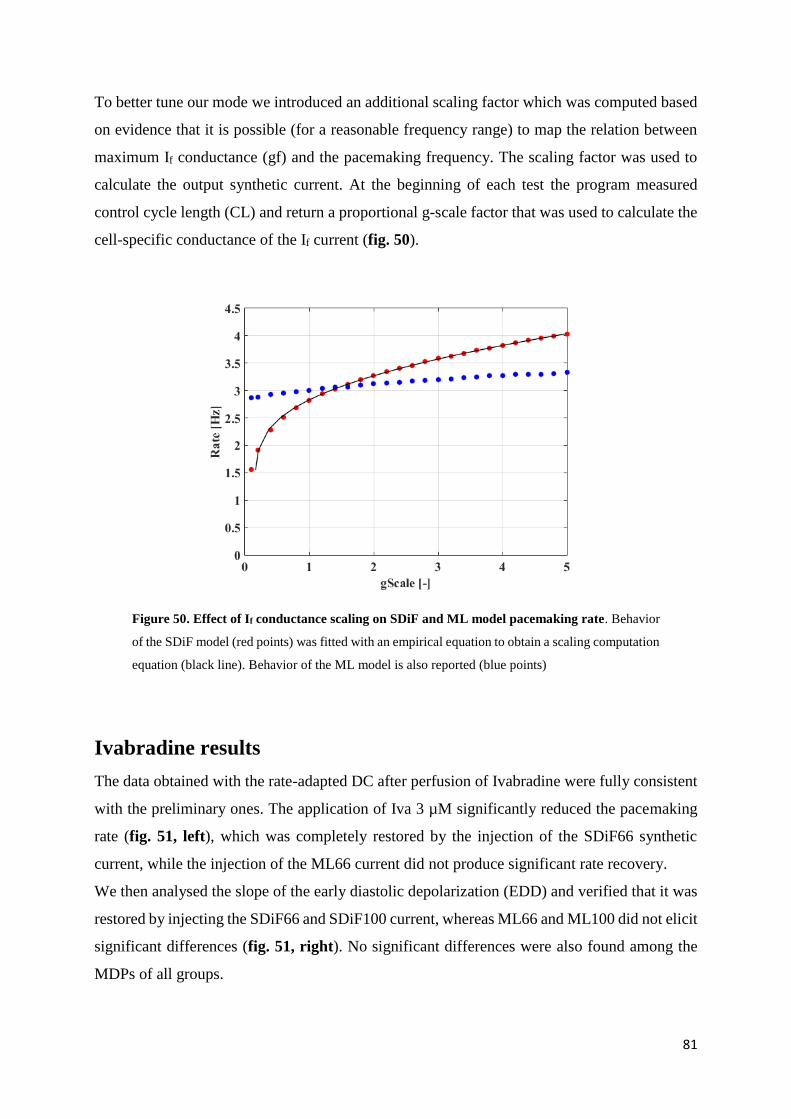
Preliminary results on IVA protocol page 80
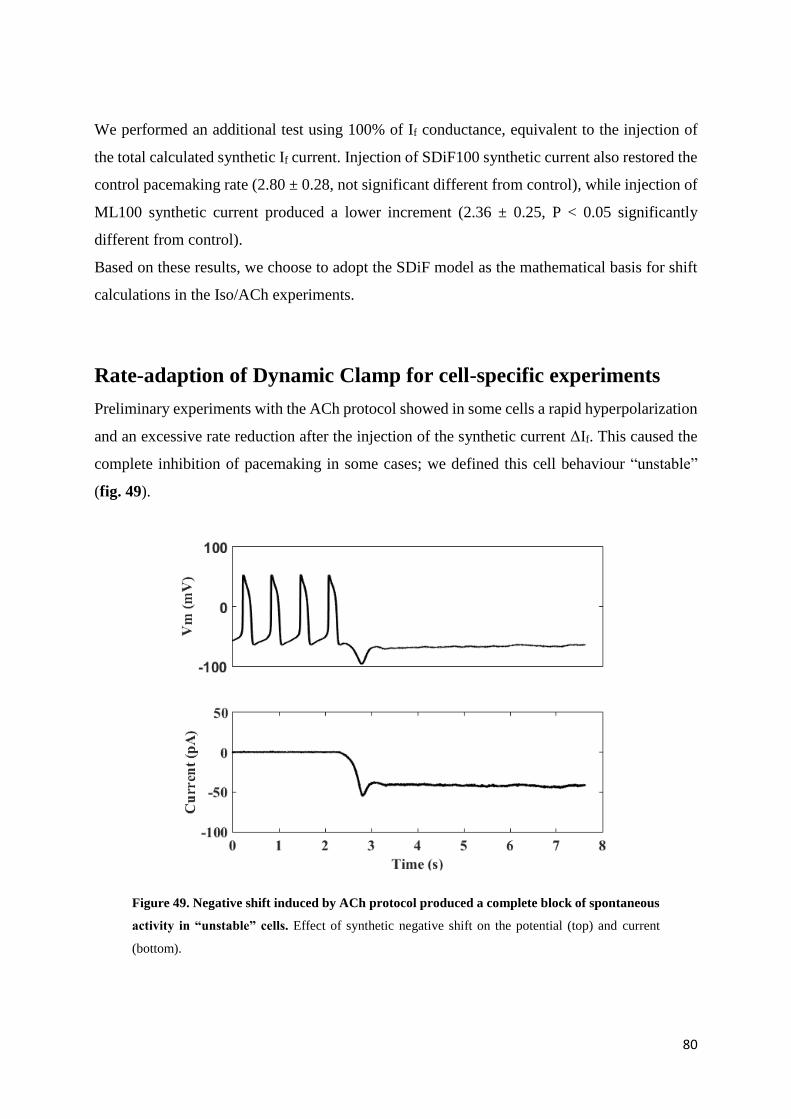
Rate-adaption of Dynamic Clam for cell-specific
experiments page 81
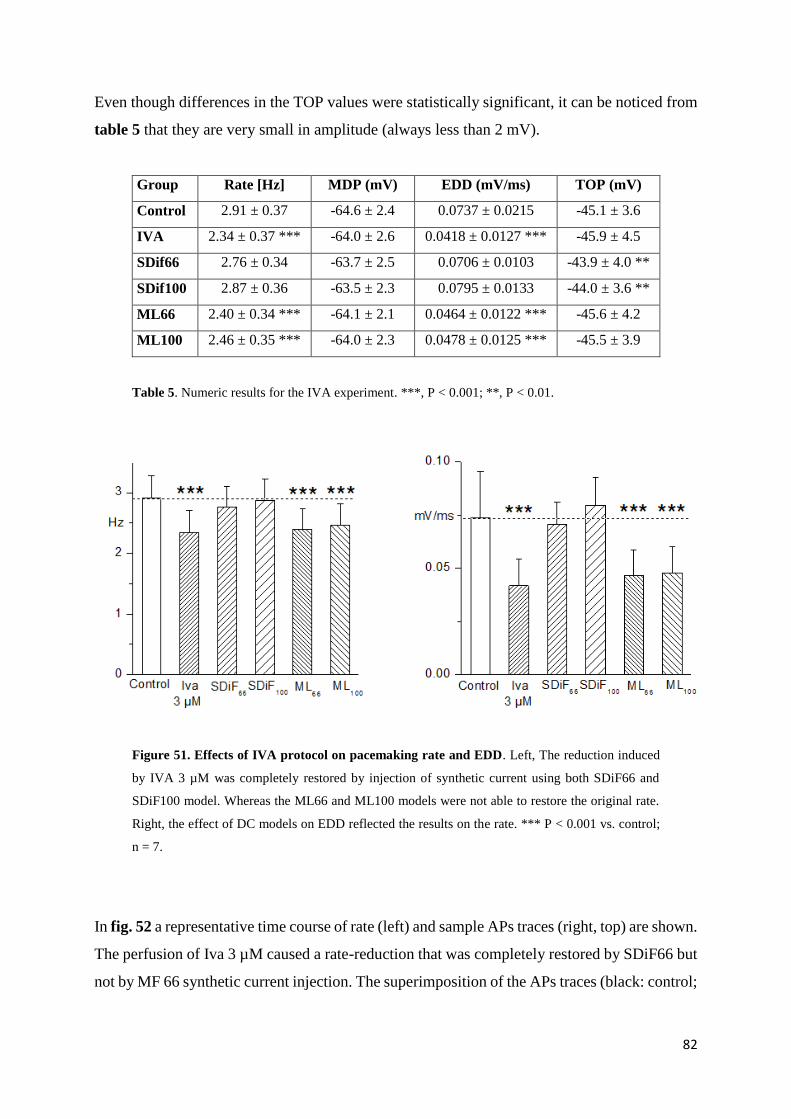
Ivabradine results page 82
Isoprenaline results page 84
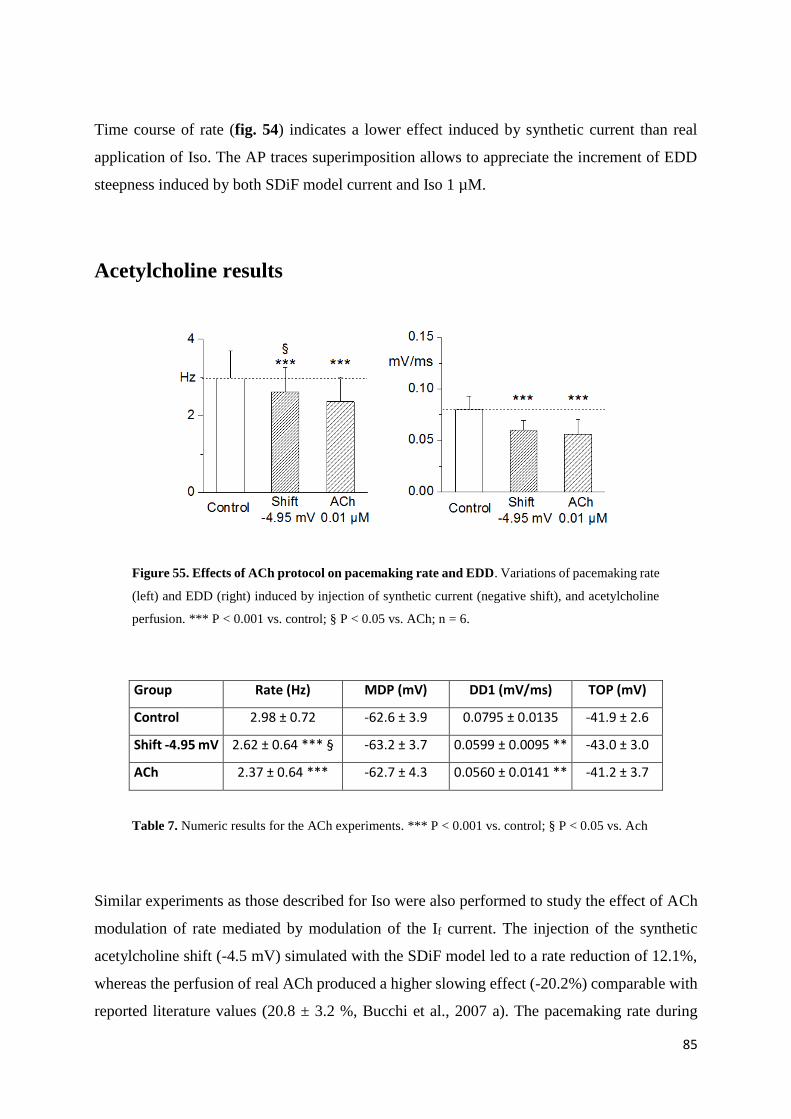
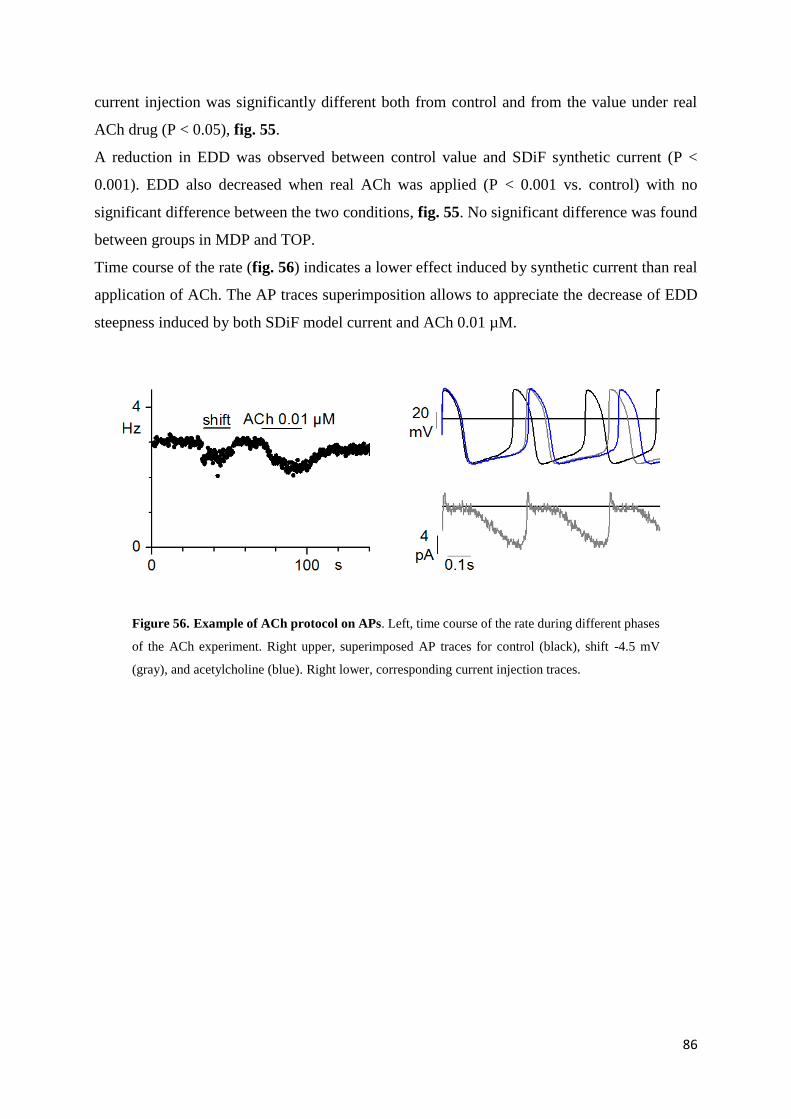
Acetylcholine results page 86
6. DISCUSSION page 88
7. BIBLIOGRAPHY page 94
Page 5
4
1. ABSTRACT
During my Ph.D. I focussed my experiments on the investigation of physiopathological and
pharmacological role of the cardiac sinoatrial If since it has a key role in the generation and
modulation of cardiac pacemaker activity.
The identification of pharmacological agents able to reduce sinus heart rate has a strong interest
in the clinic since they could be useful in the treatment of ischemic heart disease. Despite
longstanding and intense investigation at present there is only one such agent (ivabradine) that
has reached therapeutic application since all other compounds tested have shown undesired
side-effects. I therefore investigated the effect of Tong Mai Yan Xin (TMYX), a drug currently
used in China as a cardiac regulator of both brady- and tachy-cardic condition.
Electrophysiological experiments performed on rabbit SA node cells have shown a dose-
dependent slowing effect of TMYX on pacemaking rate, associated with a reduction of the early
part of the pacemaker depolarization and with a moderate prolongation of APD50. The
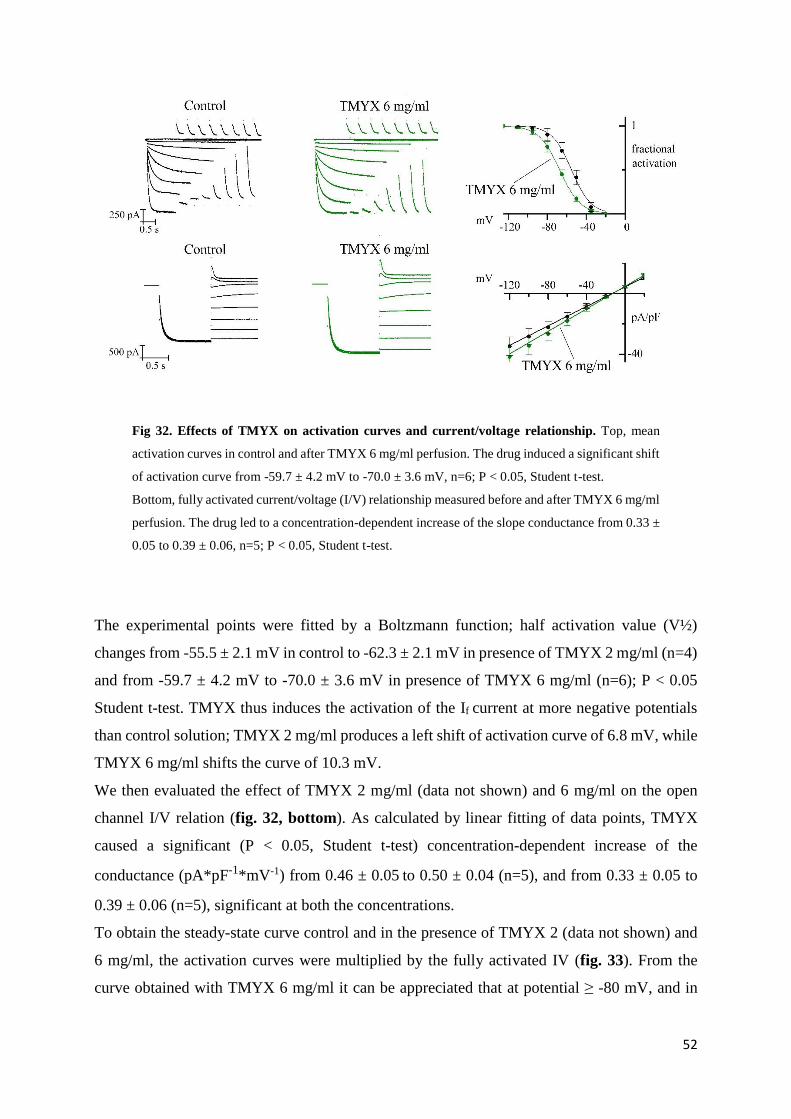
investigation of the effects of TMYX on the If current, the major contributor of diastolic
depolarization phase, has revealed a dual effect: TMYX causes a leftward-shift of the activation
current curve and an increase of the channel conductance. At physiological potential the
bradycardic action (leftward shift) strongly prevails, thus confirming the effect on the
spontaneous automaticity observed in SA node cells.
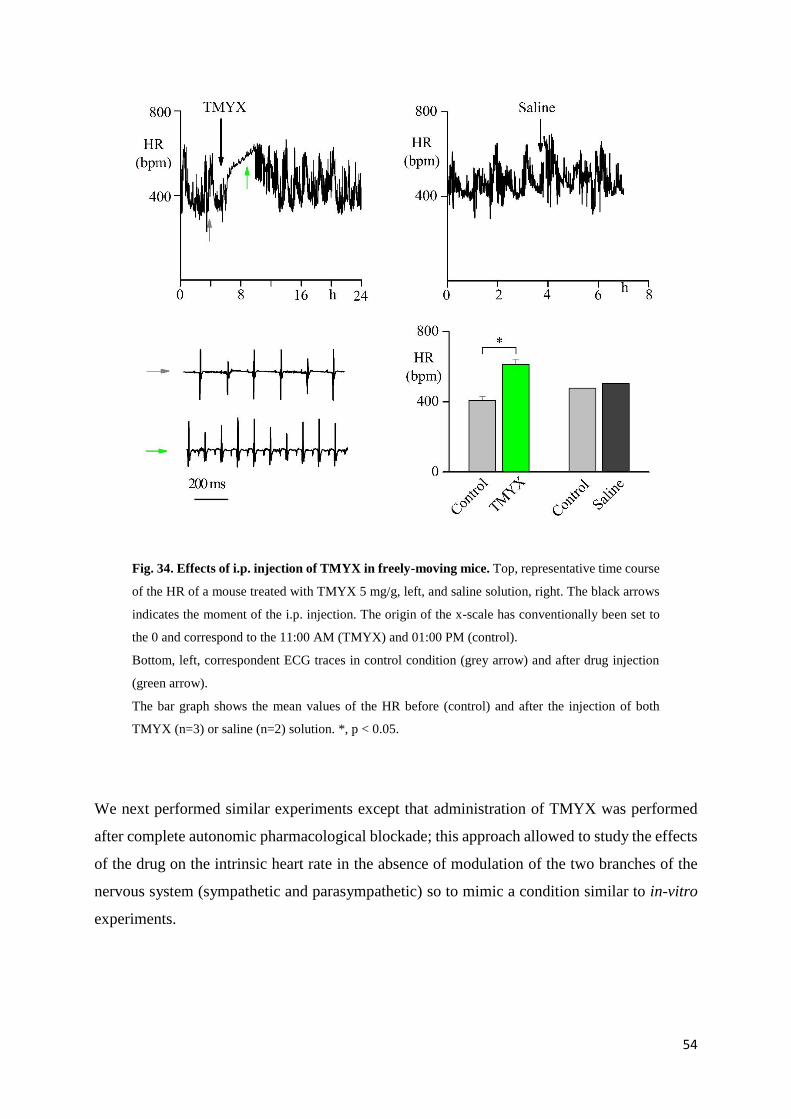
The effect of TMYX was also evaluated in freely moving mice implanted with ECG
transmitters. Preliminary experiments surprisingly show an increment of heart rate after the i.p.
injection of the drug, while when TMYX was delivered during pharmacological blockade of
only sympathetic or both sympathetic and parasympathetic autonomic system, a deep
bradycardia was observed.
Given the importance of the If current in the pacemaking process, it is important characterize
the functional role of mutations in the HCN4 channels, the molecular constituent of If current,
that are associated with clinically relevant modification of heart rate. So far all mutations
reported in the literature are associated with tachycardic conditions. During my study I had the
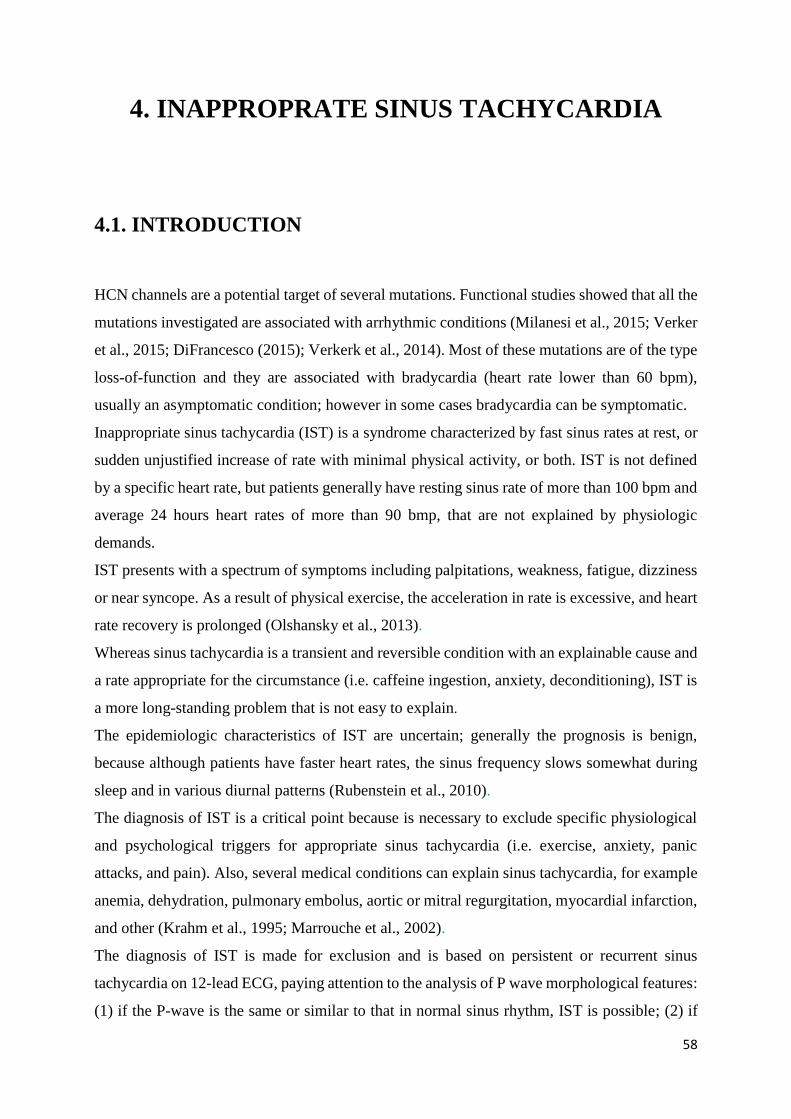
opportunity to investigate the properties of the R524Q mutation which is located in the first
Page 6
5
portion of C-linker, a region connecting the S6 transmembrane domain to the CNBD; this
mutation cosegregates in familial members affected by inappropriate sinus tachycardia.
Electrophysiological analysis carried out on HEK 293 cells showed an increment of cAMP
sensitivity in the R524Q channels resulting in a rightward shift of the activation curve that
mimic the effect of β-adrenergic stimulation. When transfected with mutant rather than wild-
type HCN channels newborn ventricular myocytes, an excitable cellular model used to test the
effect of mutations on spontaneous rate, showed a faster pacemaking rate.
Finally I carried out some experiments to test the quantitative relevance of the If current during
pacemaking. The study was carried out by means of an indirect approach based on mathematical
models of SA node action potentials combined with the dynamic-clamp technique. I compared
the models developed by Maltsev-Lakatta and Severi-DiFrancesco. Both these formulations
describe the SA node automaticity, but they have differences in quantitative contribution of If
current. My experiments allowed to validate the Severi-DiFrancesco model, that is associate
with a higher contribution of If current during the diastolic depolarization than Maltsev-Lakatta
formulation.
In conclusion, using independent and separate approaches, my experiments confirm that
alterations of the amount of the If current flowing during the diastolic depolarization leads to
robust effect on automaticity of the SA node.
Page 7
6
2. GENERAL INTRODUCTION
2.1. THE HEART
Heart anatomy
The heart is a muscular organ located under the ribcage in the center of the chest between the
right and left lungs. The inferior tip of the heart, known as the apex, rests just superior to the
diaphragm. Because the heart points to the left, about 2/3 of the heart’s mass is found on the
left side of the body and the rest is on the right. The superior end, termed base of the heart, is
located along the body’s midline with the apex pointing toward the left side. A normal heart
has the size of a closed fist and it weighs between 200 and 425 grams. By the end of a long life,
a human heart may have beaten (expanded and contracted) more than 3.5 billion times. In fact,
each day, the average heart beats 100.000 times, pumping about 7.500 liters of blood.
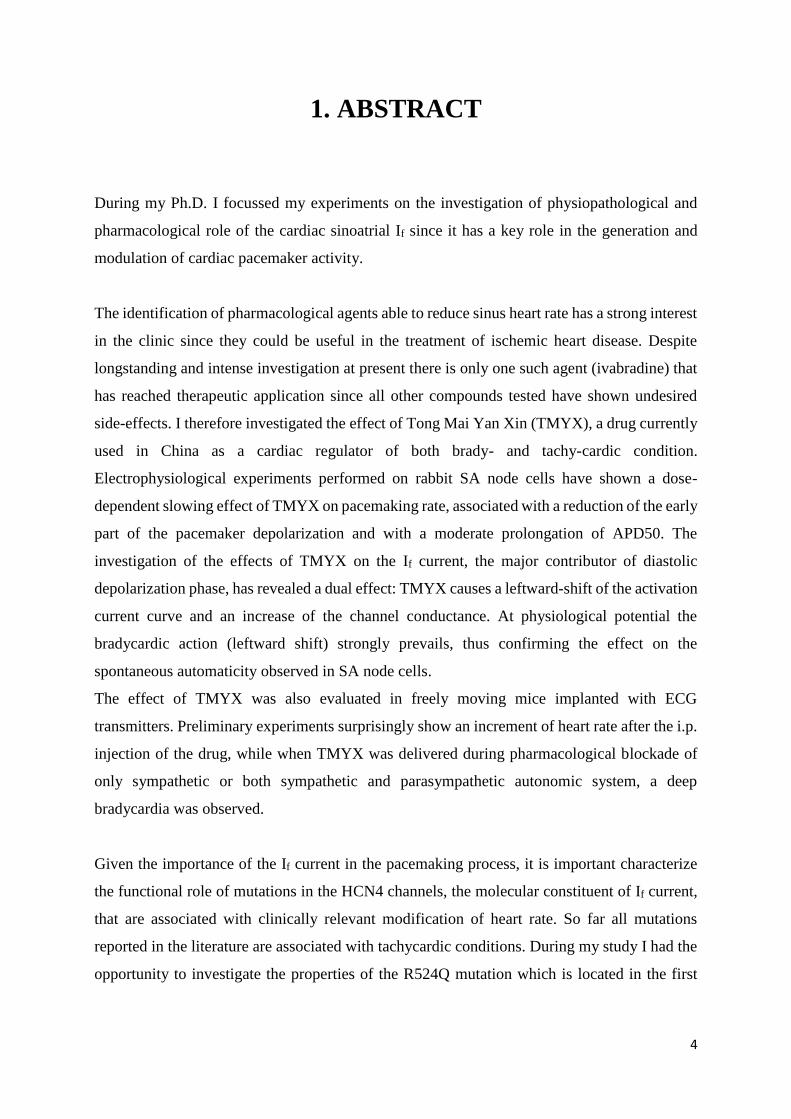
The heart contains 4 chambers: the upper chambers (atria), and the lower chambers (ventricles);
the septum, a wall of muscular tissue, separates the left and the right atria and ventricles (fig.
1).
Fig. 1. Anatomy of the heart.
Page 8
7
The atria are smaller than the ventricles and have thinner muscular walls than the ventricles,
because they have to pump blood only to the nearby ventricles. The ventricles, on the other
hand, have a very thick myocardium which is necessary to pump blood to or throughout the
entire body. The atria are connected to the veins that carry blood to the heart (superior and
inferior vena cava on the right, and pulmonary veins on the left atrium), while the ventricles,
connected to the arteries (pulmonary artery on the right, and aorta on the left), send blood out
of the heart.
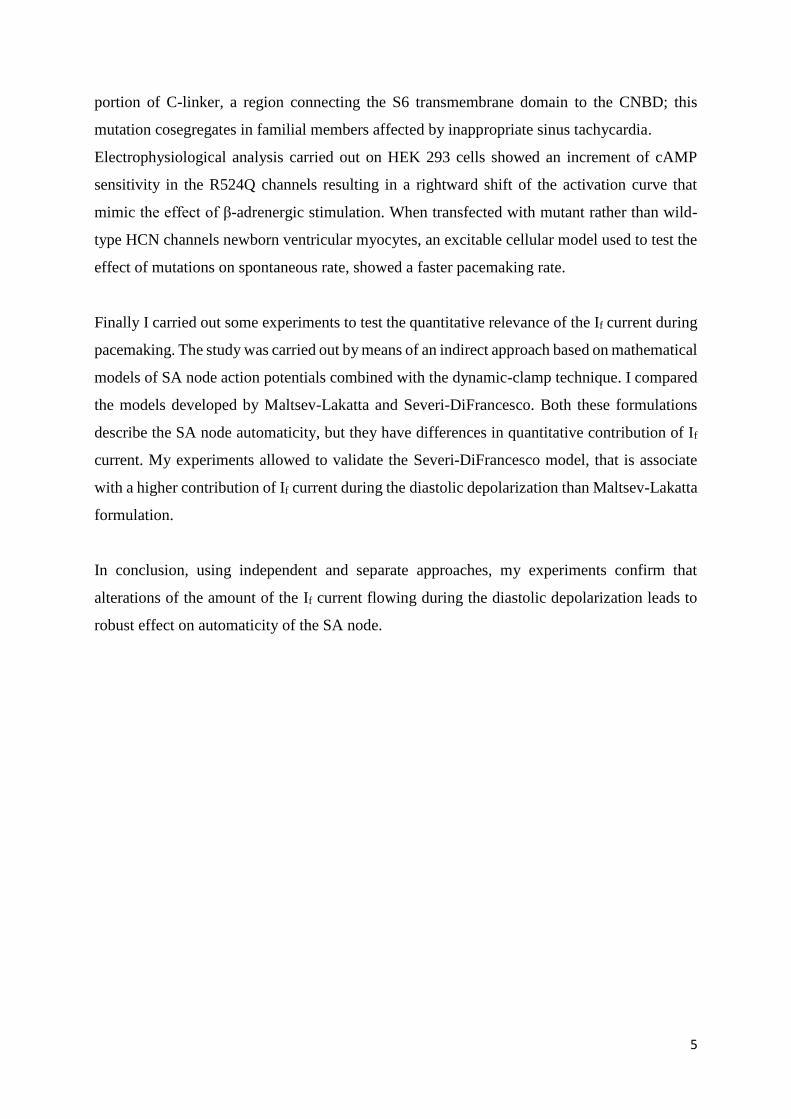
The heart wall of the right chamber is smaller and has less myocardium then the left side of the
heart; this difference in size depends on the specific function. In fact, the right side of the heart
maintains the pulmonary circulation to the nearby lungs, while the left side pumps the blood all
the way to the extremities of the body throughout the systemic circulatory loop (fig. 2).
Fig. 2. Circulatory loop. In the pulmonary circuit the blood poor of oxygen and rich of CO2 moves
from right ventricle to the lungs; after the oxygenation process the blood returns on the left side of
the heart, where starts the systemic circuit. Oxygen rich and CO2 poor blood reaches the entire body
and comes back in the right atrium.
Page 9
8
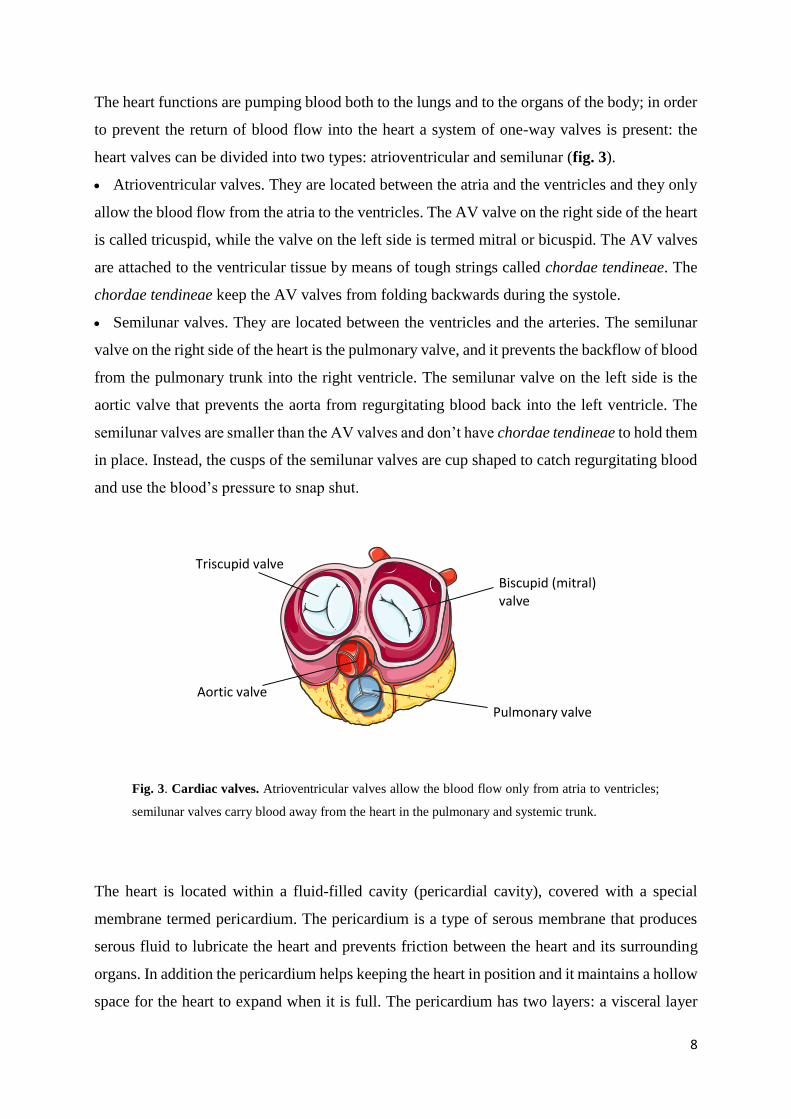
The heart functions are pumping blood both to the lungs and to the organs of the body; in order
to prevent the return of blood flow into the heart a system of one-way valves is present: the
heart valves can be divided into two types: atrioventricular and semilunar (fig. 3).
Atrioventricular valves. They are located between the atria and the ventricles and they only
allow the blood flow from the atria to the ventricles. The AV valve on the right side of the heart
is called tricuspid, while the valve on the left side is termed mitral or bicuspid. The AV valves
are attached to the ventricular tissue by means of tough strings called chordae tendineae. The
chordae tendineae keep the AV valves from folding backwards during the systole.
Semilunar valves. They are located between the ventricles and the arteries. The semilunar
valve on the right side of the heart is the pulmonary valve, and it prevents the backflow of blood
from the pulmonary trunk into the right ventricle. The semilunar valve on the left side is the
aortic valve that prevents the aorta from regurgitating blood back into the left ventricle. The
semilunar valves are smaller than the AV valves and don’t have chordae tendineae to hold them
in place. Instead, the cusps of the semilunar valves are cup shaped to catch regurgitating blood
and use the blood’s pressure to snap shut.
Fig. 3. Cardiac valves. Atrioventricular valves allow the blood flow only from atria to ventricles;
semilunar valves carry blood away from the heart in the pulmonary and systemic trunk.
The heart is located within a fluid-filled cavity (pericardial cavity), covered with a special
membrane termed pericardium. The pericardium is a type of serous membrane that produces
serous fluid to lubricate the heart and prevents friction between the heart and its surrounding
organs. In addition the pericardium helps keeping the heart in position and it maintains a hollow
space for the heart to expand when it is full. The pericardium has two layers: a visceral layer
Biscupid (mitral) valve
Triscupid valve
Aortic valve
Pulmonary valve
Page 10
9
that covers the outside of the heart and a parietal layer that forms a sac around the outside of
the pericardial cavity.
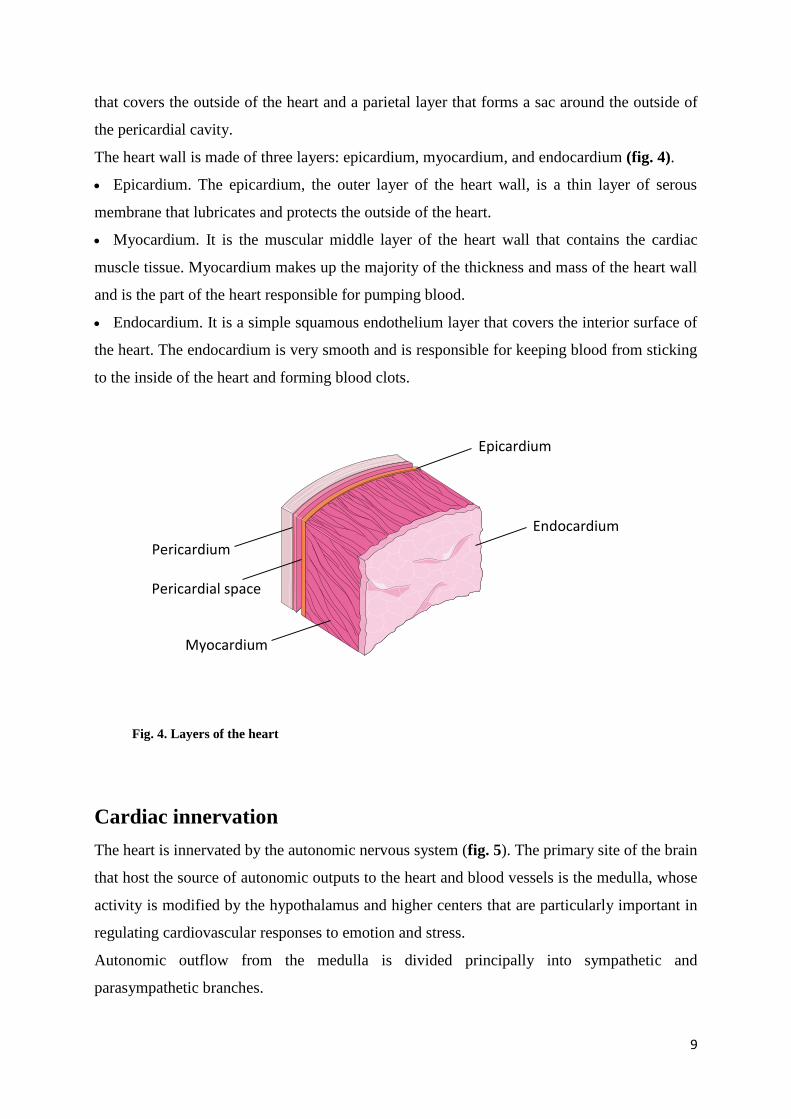
The heart wall is made of three layers: epicardium, myocardium, and endocardium (fig. 4).
Epicardium. The epicardium, the outer layer of the heart wall, is a thin layer of serous
membrane that lubricates and protects the outside of the heart.
Myocardium. It is the muscular middle layer of the heart wall that contains the cardiac
muscle tissue. Myocardium makes up the majority of the thickness and mass of the heart wall
and is the part of the heart responsible for pumping blood.
Endocardium. It is a simple squamous endothelium layer that covers the interior surface of
the heart. The endocardium is very smooth and is responsible for keeping blood from sticking
to the inside of the heart and forming blood clots.
Fig. 4. Layers of the heart
Cardiac innervation
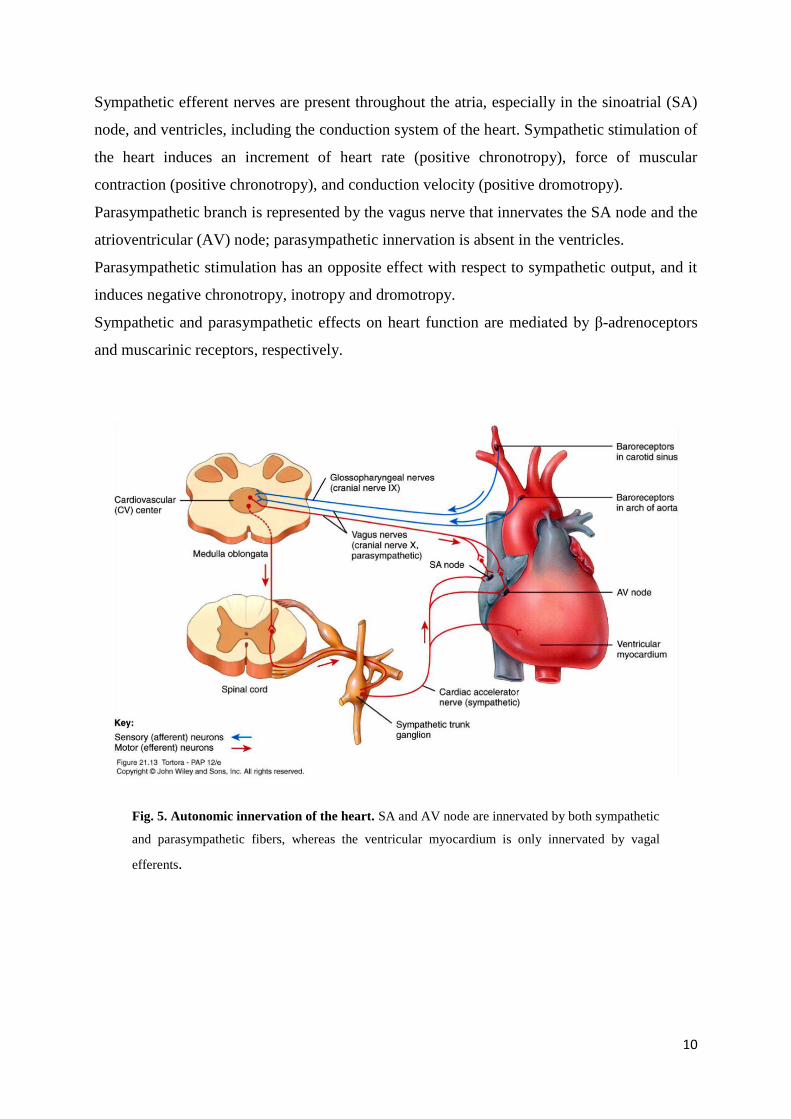
The heart is innervated by the autonomic nervous system (fig. 5). The primary site of the brain
that host the source of autonomic outputs to the heart and blood vessels is the medulla, whose
activity is modified by the hypothalamus and higher centers that are particularly important in
regulating cardiovascular responses to emotion and stress.
Autonomic outflow from the medulla is divided principally into sympathetic and
parasympathetic branches.
Myocardium
Pericardial space
Pericardium
Endocardium
Epicardium
Page 11
10
Sympathetic efferent nerves are present throughout the atria, especially in the sinoatrial (SA)
node, and ventricles, including the conduction system of the heart. Sympathetic stimulation of
the heart induces an increment of heart rate (positive chronotropy), force of muscular
contraction (positive chronotropy), and conduction velocity (positive dromotropy).
Parasympathetic branch is represented by the vagus nerve that innervates the SA node and the
atrioventricular (AV) node; parasympathetic innervation is absent in the ventricles.
Parasympathetic stimulation has an opposite effect with respect to sympathetic output, and it
induces negative chronotropy, inotropy and dromotropy.
Sympathetic and parasympathetic effects on heart function are mediated by β-adrenoceptors
and muscarinic receptors, respectively.
Fig. 5. Autonomic innervation of the heart. SA and AV node are innervated by both sympathetic
and parasympathetic fibers, whereas the ventricular myocardium is only innervated by vagal
efferents.
Page 12
11
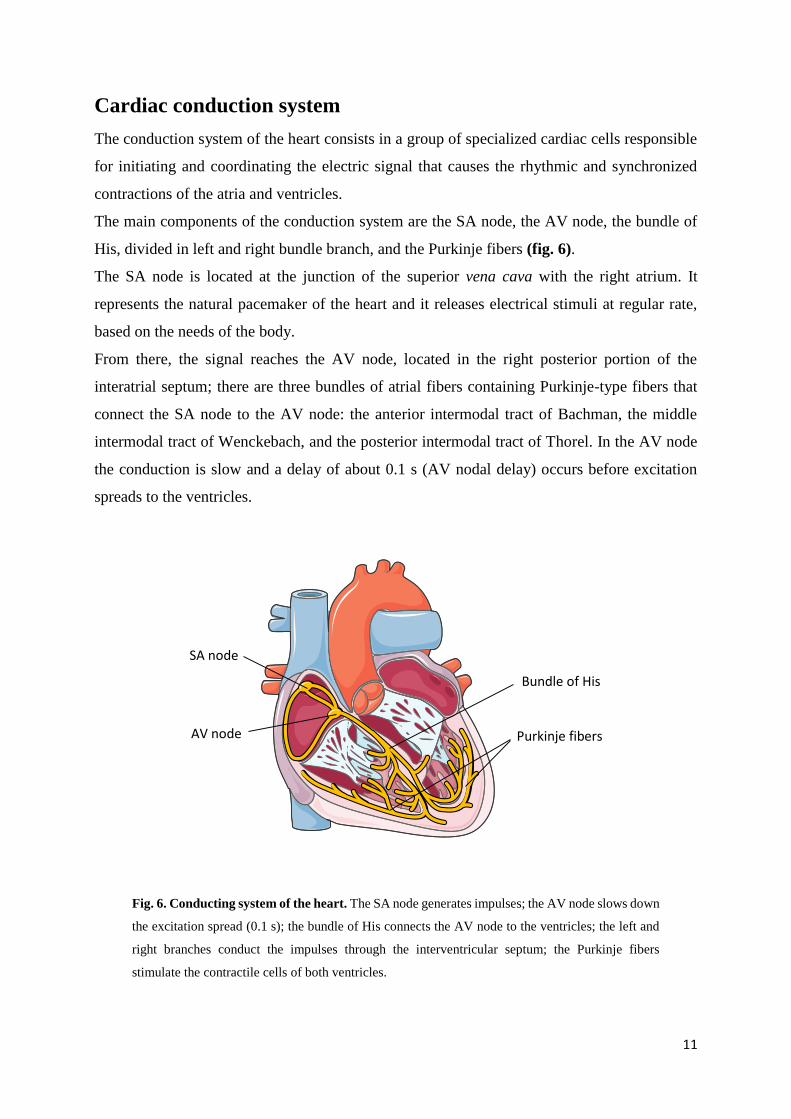
Cardiac conduction system
The conduction system of the heart consists in a group of specialized cardiac cells responsible
for initiating and coordinating the electric signal that causes the rhythmic and synchronized
contractions of the atria and ventricles.
The main components of the conduction system are the SA node, the AV node, the bundle of
His, divided in left and right bundle branch, and the Purkinje fibers (fig. 6).
The SA node is located at the junction of the superior vena cava with the right atrium. It
represents the natural pacemaker of the heart and it releases electrical stimuli at regular rate,
based on the needs of the body.
From there, the signal reaches the AV node, located in the right posterior portion of the
interatrial septum; there are three bundles of atrial fibers containing Purkinje-type fibers that
connect the SA node to the AV node: the anterior intermodal tract of Bachman, the middle
intermodal tract of Wenckebach, and the posterior intermodal tract of Thorel. In the AV node
the conduction is slow and a delay of about 0.1 s (AV nodal delay) occurs before excitation
spreads to the ventricles.
Fig. 6. Conducting system of the heart. The SA node generates impulses; the AV node slows down
the excitation spread (0.1 s); the bundle of His connects the AV node to the ventricles; the left and
right branches conduct the impulses through the interventricular septum; the Purkinje fibers
stimulate the contractile cells of both ventricles.
SA node
AV node
Bundle of His
Purkinje fibers
Page 13
12
The AV node is in conjunction with the bundle of His, which gives off a left bundle branch and
a right bundle branch. The bundle branches divide into an anterior fascicle and a posterior
fascicle. The branches and fascicles run in the sub-endocardium down to either side of the
septum and come into contact with the Purkinje system, whose fibers spread to all parts of the
ventricular myocardium.
Failure in the function of the nodes or bundles leads to arrhythmias. On the other side, ectopic
pacemaker or conductive activity may cause arrhythmias requiring intervention.
2.2. ACTION POTENTIALS
The action potential represents the changes in voltage of a single cardiac cell. Different action
potentials are recorded in different regions of the heart.
Atrial and ventricular myocardium have fast response action potentials, characterized by a
rapid depolarization (phase 0).
SA node and AV node cells show slow response action potentials, characterized by a slower
initial depolarization phase.
Fast response action potentials
Atrial and ventricular myocytes are examples of non-pacemaker cells in the heart. Because
these action potentials undergo very rapid depolarization, they are sometimes referred to as
"fast response" action potentials (fig. 7). They can be divided into 5 phases:
Phase 0 (depolarization). When these cells are depolarized from -90 mV to a threshold
voltage of about -70 mV (i.e. by an action potential in an adjacent cell), a rapid depolarization
caused by a transient increase in the fast Na+ channel conductance through the opening of
cardiac fast sodium channels (hNav1.5) occurs. This increases the inward, depolarizing Na+
current (INa) responsible for the generation of the "fast-response" action potentials.
Phase 1. It represents an initial repolarization caused by the opening of a special type of
transient outward K+ channel (Kto).
Phase 2. It is the plateau phase in the action potential. This inward calcium movement is
through long-lasting (L-type) calcium channels that open when the membrane potential
depolarizes to about -40 mV. This plateau phase prolongs the action potential duration and
Page 14
13
permits the excitation-contraction coupling. The balance of inward calcium current generated
by L-type calcium channels and outward potassium current (IKrs, IKs) allows the maintenance
of the membrane potential near 0 mV for about 200 ms. The influx of calcium ions during the
plateau phase is necessary for the activation of ryanodine receptors (RyR) located on the
endoplasmic reticulum. The activation of RyR induces the outflow of the calcium from the
cisternae of endoplasmic reticulum.
Phase 3. During this phase the membrane potential repolarizes to the resting value. The
processes involved in the repolarization are: the inactivation of L-type calcium channels and
the active presence of potassium channels; the potassium current described in this phase are
rapid (IKr) and slow (IKs), resulting in an outward, repolarizing current.
Phase 4. The membrane potential is maintained at the resting value of about -90 mV by the
inward rectifier current (IK1) until it reaches a new depolarizing stimulus.
Slow response action potentials
The main characteristics of SA node cells are the absence of both a true resting potential and a
plateau phase, but they are able to generate regular and spontaneous action potentials. These
pacemaker action potentials are referred to as "slow response" action potentials (fig. 7). They
are divided into the phases described below:
Phase 4. At the end of repolarization, the membrane potential reaches its more negative
value (maximum diastolic potential, MDP) of about -60 mV. In the SA node the MDP is
determined by the potassium currents (IKr, IKs) (Ono & Ito, 1995) and by the activation of the
If current. When the membrane potential reaches the value of about -60 mV, a class of ion
channels conducting a slow, inward (depolarizing) Na+/K+ current gets activated. This current
is called "funny" and abbreviated as "If" (DiFrancesco et al., 1986). This depolarizing current
causes the depolarization of the membrane potential, thereby initiating phase 4. Besides, a
spontaneous calcium release from endothelial reticulum contributes to the late phase of
diastolic depolarization by activating the Na+/Ca++ exchanger (Lakatta & DiFrancesco, 2009).
During the early part of phase 4 there is also a slow decline in the outward movement of K+
induced by delayed rectifier potassium channels (IKr).
Phase 0. As the membrane potential reaches about -50 mV, another type of channel opens.
This channel is called transient or T-type Ca++ channel. As Ca++ enters the cell through these
channels down its electrochemical gradient, the inward directed Ca++ currents further
depolarize the cell. However this current appears to be present only in some mammalian
Page 15
14
species. When the membrane depolarizes to about -40 mV, a second type of Ca++ channel
opens. These are the so-called long-lasting, or L-type Ca++ channels. Opening of these
channels causes more Ca++ to enter the cell and to further depolarize the cell causing an action
potential. It should be noted that a hyperpolarized state is necessary for pacemaker channels
to become activated. Without the membrane voltage becoming negative at the end of phase 3
pacemaker channels cannot be activated and no pacemaker activity can take place. This is the
reason why cellular hypoxia, which depolarizes the cell and alters phase 3 hyperpolarization,
leads to a reduction in pacemaker rate (i.e. bradycardia).
Phase 3. Repolarization occurs as K+ channels open, thereby increasing the outward
directed, hyperpolarizing K+ currents. At the same time, the L-type Ca++ channels become
inactivated and close, which decreases Ca++ conductance and the inward depolarizing Ca++
currents.
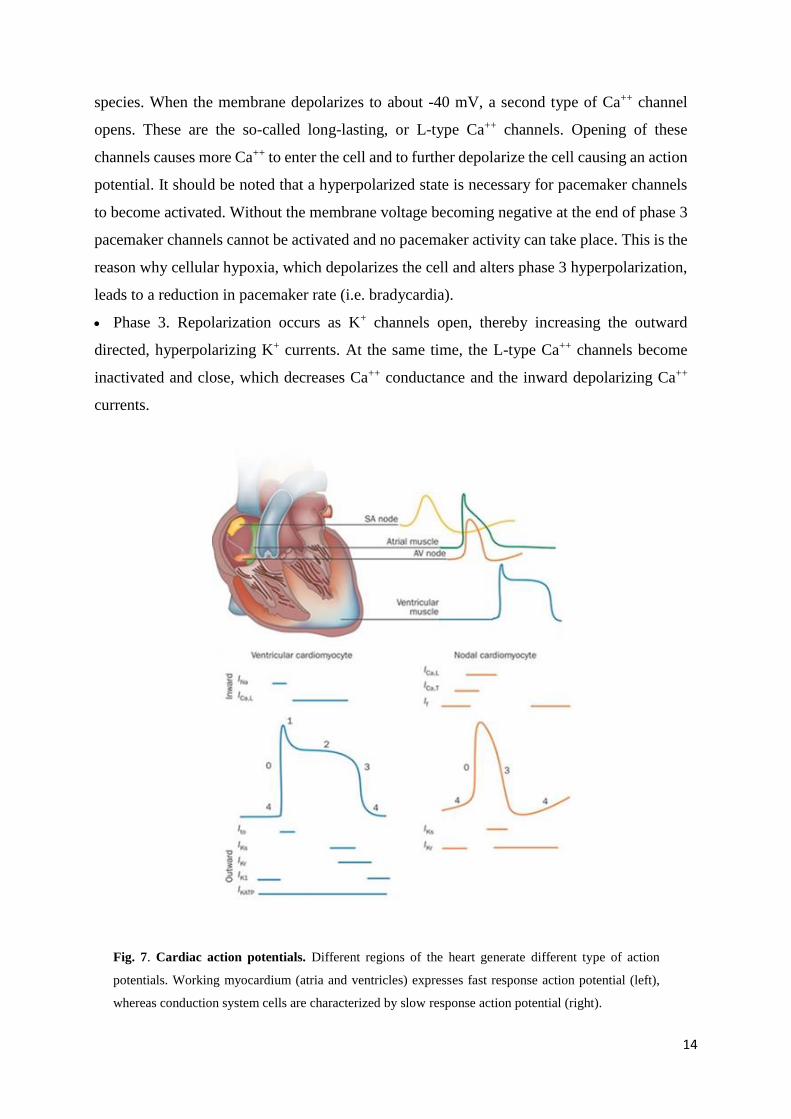
Fig. 7. Cardiac action potentials. Different regions of the heart generate different type of action
potentials. Working myocardium (atria and ventricles) expresses fast response action potential (left),
whereas conduction system cells are characterized by slow response action potential (right).
Page 16
15
It is important to note that action potentials described for SA node cells are very similar to those
found in the AV node. Therefore, action potentials in the AV node, like the SA node, are
determined primarily by changes in slow inward Ca++ and K+ currents, and do not involve fast
Na+ currents. AV nodal action potentials also have intrinsic pacemaker activity produced by the
same ionic currents as described above for SA nodal cells.
Once an action potential is initiated in both SA node, atrium, and ventricle, there is a period of
time during which a new action potential cannot be initiated. This is termed the effective
refractory period (ERP) or the absolute refractory period (ARP) of the cell. During the ERP,
stimulation of the cell by an adjacent cell undergoing depolarization does not produce new
action potentials. The ERP acts as a protective mechanism in the heart by preventing multiple
action potentials (i.e. limiting the frequency of depolarization and therefore heart rate). This is
important because at very high heart rates, the heart would be unable to adequately fill with
blood and therefore ventricular ejection would be reduced.
2.3. If CURRENT
The funny (If) current was first described in the SA node (Brown et al., 1979) and was
extensively characterized originally in this tissue and in Purkinje fibers (DiFrancesco et al.,
1986 a; Brown et al., 1980; DiFrancesco et al., 1980; DiFrancesco, 1981 a; DiFrancesco, 1981
b; DiFrancesco, 1986 b). The current was defined “funny” because it is characterized by several
unusual features (DiFrancesco, 1993):
Voltage-dependence. If is activated by hyperpolarization with a threshold of approximately
-30/-40 mV in the SA node.
Ion permeability. Values of the reversal potential measured in the early experiments in
Purkinje fibers and in isolated rabbit SA node myocytes were in the range of -10 to -20 mV
(DiFrancesco, 1981 a; DiFrancesco et al., 1986 a), indicating a mixed ionic permeability. Ionic
substitution experiments indeed identified Na+ and K+ ions as the physiological carriers of the
current, with a Na+/K+ permeability ratio of about 0.27 (DiFrancesco, 1981; Frace et al., 1992).
The conductance of f-channels was also shown to increase with external K+ concentration
(DiFrancesco, 1981 a) in a way similar to that of other potassium permeable channels (Hille,
2000).
Page 17
16
Autonomic control. A major contribution to the autonomic control of rate is provided by the
cAMP dependence of f-channels. cAMP is an intracellular second messenger activating several
cellular processes, and its concentration is strictly controlled by cellular compartmentation of
the biochemical factors responsible for cAMP synthesis and degradation (i.e. adenylyl cyclase
and phosphodiesterase) in order to prevent unwanted spreading of cAMP signaling (Jurevicius
et al., 1996; Rich et al., 2000; Rich et al., 2001; Zaccolo et al., 2002; Jurevicius et al., 2003).
Direct binding of cAMP molecules to the C-terminus of pacemaker channels increases the
probability of f-channel opening via a positively-directed shift of the voltage dependence of the
activation curve, (DiFrancesco & Tortora, 1991), whereas a reduced intracellular cAMP
concentration gives rise to the opposite action (i.e. a negative shift of the activation curve and
a reduction of open probability at any given voltage), fig. 8.
By activating β-adrenergic (β1 and β2) and muscarinic M2 receptors, respectively, the
sympathetic and parasympathetic neurotransmitters control the cytosolic concentration of the
second messenger cAMP. This induces an increase/decrease of the net inward current during
diastolic depolarization and a consequent increase/decrease of firing rate, respectively.
The adaptive function of sympathetic and parasympathetic innervation relies on the ability of
the autonomic nervous system to respond effectively to rapidly changing physiological
demands. Pacemaker channels, and specifically HCN4 subunits (see point 1.4), are confined,
together with the β2-adrenergic receptors (β2-ARs), to membrane caveolae, cellular
microdomains whose function is to keep in close proximity proteins involved in a specific signal
transduction pathway (Anderson, 1998; Rybin et al., 2000; Steinberg et al., 2001; Parton et al.,
2003; Deurs et al., 2003).
In cardiac cells, the physiological response to sympathetic stimulation is mediated by both β1
and β2 subtypes of β-ARs. In their expression patterns in cardiac cells, these two subtypes differ
in density and localization. β1-ARs are generally more abundant and widely distributed than
β2-ARs in the whole heart; in the SAN, however, β2-ARs are expressed at a much higher level
than in the rest of the heart (Brodde et al., 1982; Del Monte et al., 1993; Levy et al., 1993;
Rodefeld et al., 1996; Brodde et al., 2001).
Furthermore, whereas β2-ARs are specifically localized in caveolae, β1-ARs are for the most
part excluded from these structures (Rybin et al., 2000; Li et al., 1995; Steinberg et al., 2004)
and in rabbit SAN myocytes, β2-ARs co-localize with the HCN4 isoform of pacemaker
channels in membrane caveolae (Barbuti et al., 2007).
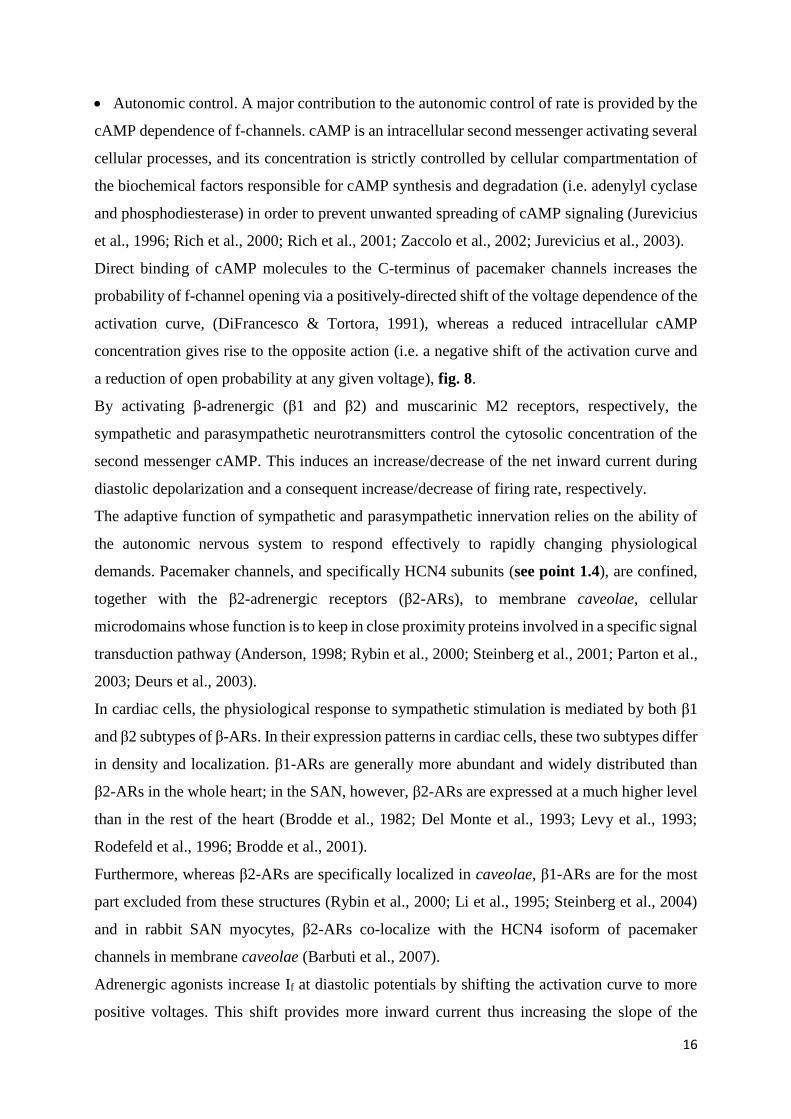
Adrenergic agonists increase If at diastolic potentials by shifting the activation curve to more
positive voltages. This shift provides more inward current thus increasing the slope of the
Page 18
17
diastolic depolarization and accelerating heart rate. Muscarinic agonists have opposite effects
on If and shift the activation curve to more negative voltages. Thus less inward current is
available at diastolic potentials, causing a decreased slope of this phase and decelerating heart
rate.
Fig. 8. Effects of autonomic modulators on action potentials and If current recorded in rabbit
SA node myocytes. (A) The administration of the autonomic modulators (Isoprenaline, Iso, and
AcetylCholine, ACh) induces changing in spontaneous rate of action potentials: the frequency is
accelerated by Iso and slowed by ACh. (B) The If current amplitude increases with Iso and decreases
with Ach. (C) The activation curves, reflecting the steady-state fraction of open channels, is shifted
to more positive (Iso) or negative (ACh) voltages.
Page 19
18
Kinetics
If current activation and deactivation processes were described using several types of
mechanisms, including single- (DiFrancesco & Noble, 1985; McCormick & Pape, 1990) and
double-exponential Hodgkin–Huxley kinetics (Noble et al., 1989; van Ginneken & Giles, 1991;
Demir et al., 1994), and more complex, non-Hodgkin–Huxley kinetics (DiFrancesco, 1984).
Detailed investigation reveals that If kinetics cannot be described using simple Hodgkin–
Huxley type of gating, but require complex multistate kinetic modelling based on the existence
of distinct delaying and proper gating processes (DiFrancesco, 1984). A similar approach has
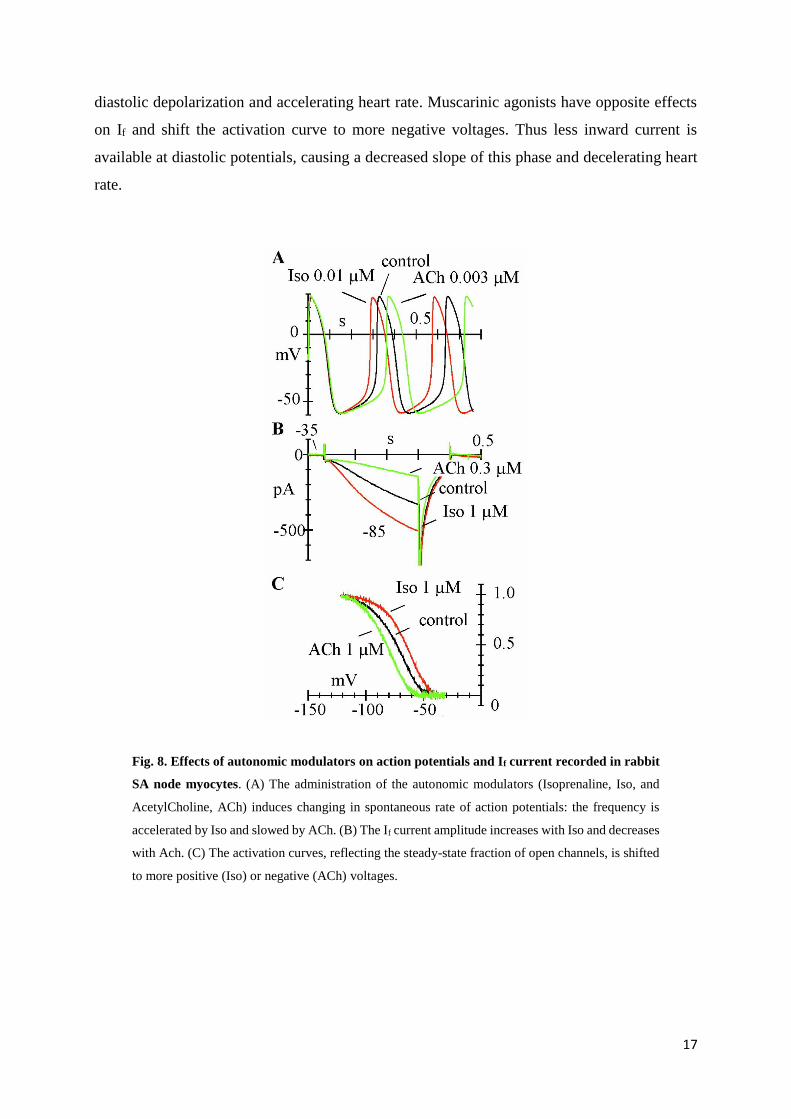
been used to describe the kinetics of HCN channels. These are reproduced using an allosteric
dual voltage- and cAMP-dependent kinetic model. In this model, the HCN are represented as
tetramers carrying voltage sensors that can be gated individually by voltage and undergo
concerted open/closed allosteric transitions (fig. 9) (DiFrancesco, 1999; Altomare et al., 2001).
Fig. 9. The f channel kinetics are described using an allosteric voltage-dependent gating model.
The HCN channel is represented as a homotetramer; each subunits as a voltage sensor (cylindrical
shape) that can occupy a reluctant (hidden) or a willing state (protruding from the subunit). Voltage
sensors are independently gated by voltage, whereas subunits switch from the closed to the open
configuration all at once. The probability of the opening increases every time 1 voltage sensor enters
the willing state (Accili et al.,2002).
Tissue distribution of If in the heart
In the adult heart f-channels are densely expressed throughout the cardiac conduction system
(SA node, AV node, Purkinje fibers), while their presence is at a much lower level if not absent
in the rest of the myocardium. During embryonic and neonatal development, HCN channels are
Page 20
19
functionally expressed also in myocytes programmed to develop into working myocardial cells
(atrial and ventricular myocytes). In adult ventricular and atrial myocytes, a clear-cut
physiological role of If is not apparent: this is because either the channel density is very low, or
the voltage range of channel activation is too negative, or both (Robinson et al., 1997; Cerbai
et al., 1999).
Nevertheless, expression of f-channels in working myocardium may become important under
several pathological conditions. For example, If is upregulated in ventricular myocytes of
hypertrophic hearts as a consequence of remodeling, leading to the hypothesis that it may
contribute to arrhythmias in chronic hypertension and cardiac failure, a condition associated
with increased risk for sudden cardiac death (Cerbai et al., 2006).
It is well known that cardiac fibers surrounding atrioventricular valves may display rhythmic
activity (Wit et al., 1973; Wit et al., 1979). Beating cells from the region surrounding the mitral
valve in the rabbit express a large If, indicating a correlation between spontaneous activity and
the pacemaker current (Anumonwo et al., 1990). More recently, it’s observed that the tissue
surrounding canine and human pulmonary veins contains pacing cells expressing If (Chen et
al., 2000; Chen et al., 2001 a; Greenwood & Prestwich, 2002; Perez-Lugones et al., 2003).
2.4. HCN CHANNELS
The Hyperpolarization-activated Cyclic Nucleotide-gated (HCN) is a family of channels cloned
in the late 1990s (Zagotta et al., 2003), composed by 4 isoforms (from HCN1 to HCN4) with
different biophysical properties and pattern of expression.
HCN channels are classified on the basis of their sequence as members of the superfamily of
voltage-gated K+ (Kv) and CNG channels; they have a tetrameric composition (Ulens &
Siegelbaum, 2003; Zagotta et al., 2003), and each subunit is composed of 6 transmembrane
domains (S1–6), fig. 10. Similarly to Kv channels, they have a positive charged S4 domain,
with the function of voltage sensor that in HCN channels includes 10 basic residues whose
mutation strongly affects the channel voltage dependence (Chen et al., 2000; Vaca et al., 2000).
However, while Kv channels open on depolarization, HCN channels open on hyperpolarization.
This difference could be due to an inverted movement of the voltage sensor of HCN compared
to Kv channels in response to the same voltage change, or to an inverted coupling between S4
movement and channel gating. The second possibility appears more likely since cysteine
Page 21
20
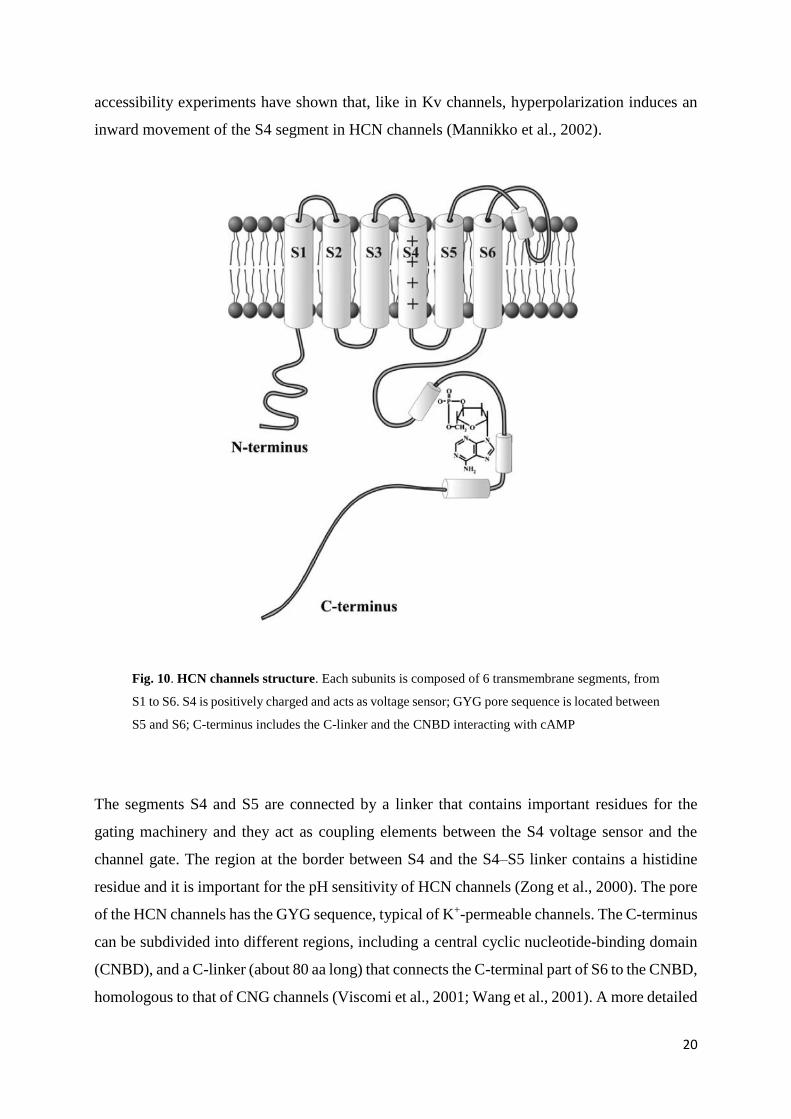
accessibility experiments have shown that, like in Kv channels, hyperpolarization induces an
inward movement of the S4 segment in HCN channels (Mannikko et al., 2002).
Fig. 10. HCN channels structure. Each subunits is composed of 6 transmembrane segments, from
S1 to S6. S4 is positively charged and acts as voltage sensor; GYG pore sequence is located between
S5 and S6; C-terminus includes the C-linker and the CNBD interacting with cAMP
The segments S4 and S5 are connected by a linker that contains important residues for the
gating machinery and they act as coupling elements between the S4 voltage sensor and the
channel gate. The region at the border between S4 and the S4–S5 linker contains a histidine
residue and it is important for the pH sensitivity of HCN channels (Zong et al., 2000). The pore
of the HCN channels has the GYG sequence, typical of K+-permeable channels. The C-terminus
can be subdivided into different regions, including a central cyclic nucleotide-binding domain
(CNBD), and a C-linker (about 80 aa long) that connects the C-terminal part of S6 to the CNBD,
homologous to that of CNG channels (Viscomi et al., 2001; Wang et al., 2001). A more detailed
Page 22
21
identification of functionally relevant sub-domains of the C-terminus and of the CNBD has
been established based on the homology with the CNBD structure of both the bacterial
catabolite-activating protein and the regulatory subunit of cAMP-dependent protein kinase, and
recent data obtained from X-ray crystallography of the C-terminus of HCN2 (Weber & Steitz,
1987; Wainger et al., 2001; Zagotta et al., 2003). The CNBD structure includes an h-roll sub-
domain, acting as a constitutive inhibitor of the channel, and a helix located at the C-terminal
end (termed C-helix), which contributes to the interaction with the purine ring of cAMP. cAMP
binds with a greater affinity to the open, rather than the closed state of the channel (Varnum et
al., 1995; Matulef et al., 1999; Wainger et al., 2001; Zagotta et al., 2003).
HCN channel isoforms
The HCN core region, including the transmembrane domain and the CNBD, is highly conserved
among the different isoforms (80% identity), from sequence alignment studies. Whereas the
sequences diverge at the N- and C-termini, suggesting a relevant role of the terminal region for
some of the differences in the biophysical properties among isoforms (Viscomi et al., 2001).
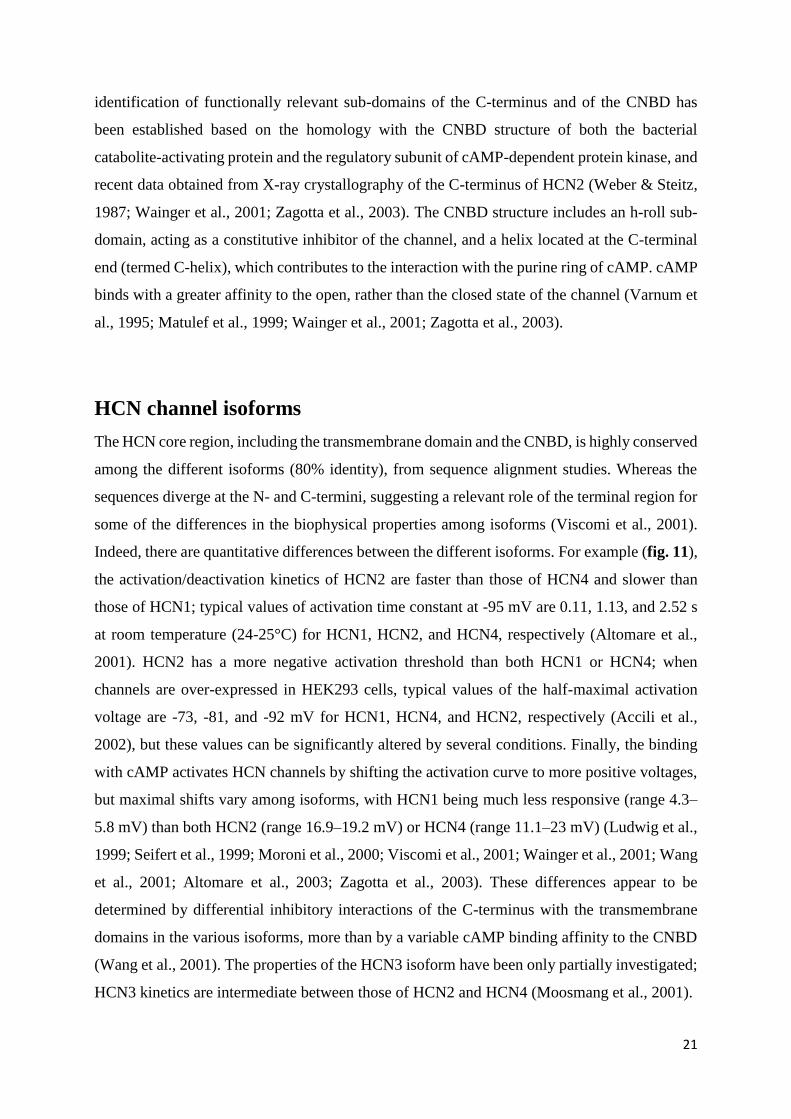
Indeed, there are quantitative differences between the different isoforms. For example (fig. 11),
the activation/deactivation kinetics of HCN2 are faster than those of HCN4 and slower than
those of HCN1; typical values of activation time constant at -95 mV are 0.11, 1.13, and 2.52 s
at room temperature (24-25°C) for HCN1, HCN2, and HCN4, respectively (Altomare et al.,
2001). HCN2 has a more negative activation threshold than both HCN1 or HCN4; when
channels are over-expressed in HEK293 cells, typical values of the half-maximal activation
voltage are -73, -81, and -92 mV for HCN1, HCN4, and HCN2, respectively (Accili et al.,
2002), but these values can be significantly altered by several conditions. Finally, the binding
with cAMP activates HCN channels by shifting the activation curve to more positive voltages,
but maximal shifts vary among isoforms, with HCN1 being much less responsive (range 4.3–
5.8 mV) than both HCN2 (range 16.9–19.2 mV) or HCN4 (range 11.1–23 mV) (Ludwig et al.,
1999; Seifert et al., 1999; Moroni et al., 2000; Viscomi et al., 2001; Wainger et al., 2001; Wang
et al., 2001; Altomare et al., 2003; Zagotta et al., 2003). These differences appear to be
determined by differential inhibitory interactions of the C-terminus with the transmembrane
domains in the various isoforms, more than by a variable cAMP binding affinity to the CNBD
(Wang et al., 2001). The properties of the HCN3 isoform have been only partially investigated;
HCN3 kinetics are intermediate between those of HCN2 and HCN4 (Moosmang et al., 2001).
Page 23
22
Fig. 11. Kinetic properties of HCN1, HCN2, and HCN4 isoforms. (Top) activation traces
recorded on hyperpolarizing steps from a holding potential of -35 mV in HEK293 cells. (Middle)
mean activation curves of HCN1, HCN2, HCN4, respectively. (Bottom) mean time constants of
activation obtained by single exponential fitting of activation traces.
The various regions of the heart and the brain are characterized by different kinetics and
modulatory properties of native currents that partly reflect a different tissue distribution of HCN
isoforms (DiFrancesco, 1993; Pape, 1996). However, the channel properties can be modified
by several factors, and simple electrophysiological analysis is not sufficient to reveal the
isoform composition of native channels. For example, native channels can be formed by
heteromultimers of different isoforms, with properties intermediate between those of individual
components (Chen et al., 2001 b; Ishii et al., 2001; Ulens & Tytgat, 2001; Xue et al., 2002;
Altomare et al., 2003); also, HCN activity can be modified by interaction with auxiliary
subunits such as MiRP1 (Qu et al., 2004) or with scaffold proteins such as filamin-A for HCN1
(Gravante et al., 2004), or by specific subcellular compartmentation such as the caveolar
compartmentation of HCN4 in SA node cells (Barbuti et al., 2004). The kinetic properties and
expression levels of HCN channels are also regulated by auxiliary proteins (TRP8), and lipids
(phosphatidylinositol 4,5-bisphosphate); finally, the expression of a given isoform may yield
quantitatively different biophysical properties according to whether the isoform is expressed in
Page 24
23
heterologous or in homologous expression systems, suggesting that a contextdependent
modulation occurs (Qu et al., 2002).
In the heart, HCN1, HCN2, and HCN4 are all expressed with HCN4 being the major component
in the pacemaker region, although low expressions of HCN1 and HCN2 have also been reported
(Santoro et al., 1999; Shi et al., 1999; Moroni et al., 2001).
2.5. THE ELECTROCARDIOGRAM
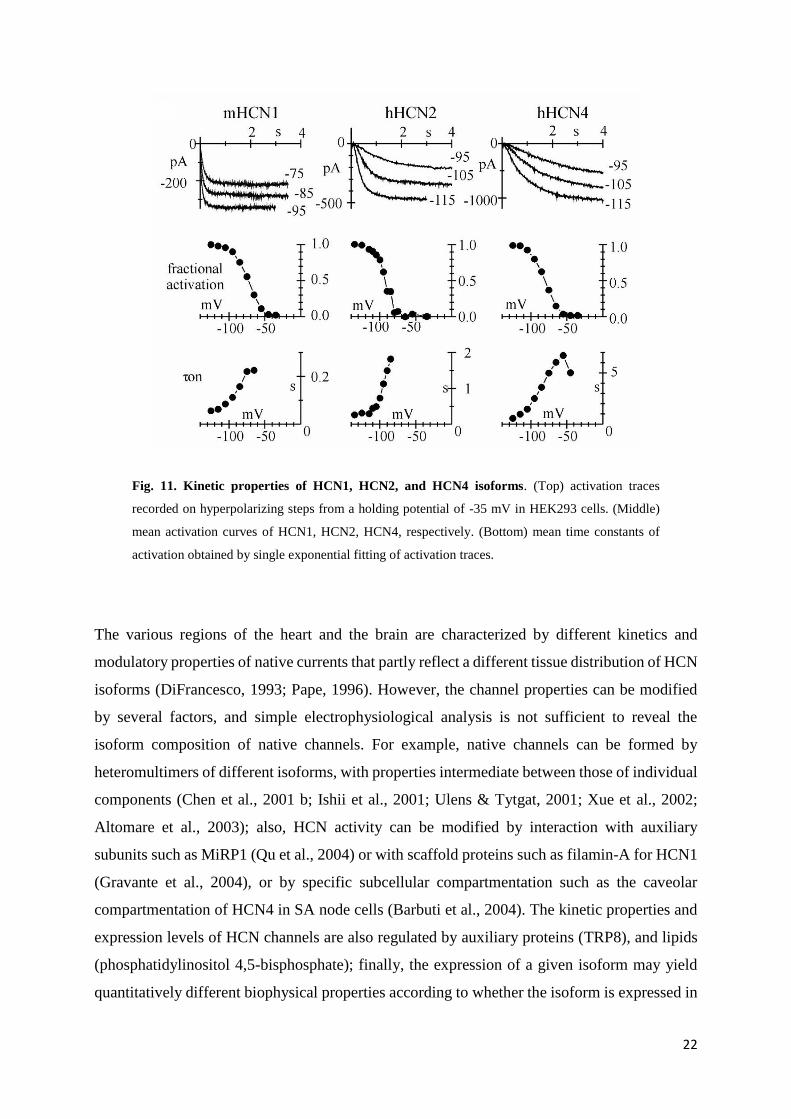
The electrocardiogram (ECG) allows to record on the body surface the potential fluctuations
which originate during the cardiac cycle. The ECG may be recorded using two different
methods: unipolar recording that consists of an electrode connected to an indifferent electrode
at zero potential, and bipolar recording that uses two active electrodes. In a volume conductor,
the sum of the potentials at the points of an equilateral triangle with a current source in the
centre is zero at all times. A triangle with the heart located in the centre (Einthoven’s triangle,
fig. 12) can be approximated by placing electrodes on both arms and on the left leg. These are
the three standard limb leads used in electrocardiography. If these electrodes are connected to
a common terminal, an indifferent electrode that stays near zero potential is obtained.
Fig. 12. Graphical representation of Einthoven’s triangle. (Lead I) the axis moves from right arm
(negative electrode) to left arm (positive electrode). (Lead II) The axis goes from the right arm
(negative electrode) to left leg (positive electrode). (Lead III) the axis moves from the left leg
(positive electrode) to the left arm (negative electrode).
Page 25
24
Depolarization moving toward an active electrode in a volume conductor produces a positive
deflection, whereas depolarization moving in the opposite direction produces a negative
deflection. By convention, an upward deflection is written when the active electrode becomes
positive relative to the indifferent electrode, and a downward deflection is written when the
active electrode becomes negative. The P wave is produced by atrial depolarization, the QRS
complex by ventricular depolarization, and the T wave by ventricular repolarization. The U
wave is an inconstant finding, believed to be due to slow repolarization of the papillary muscles.
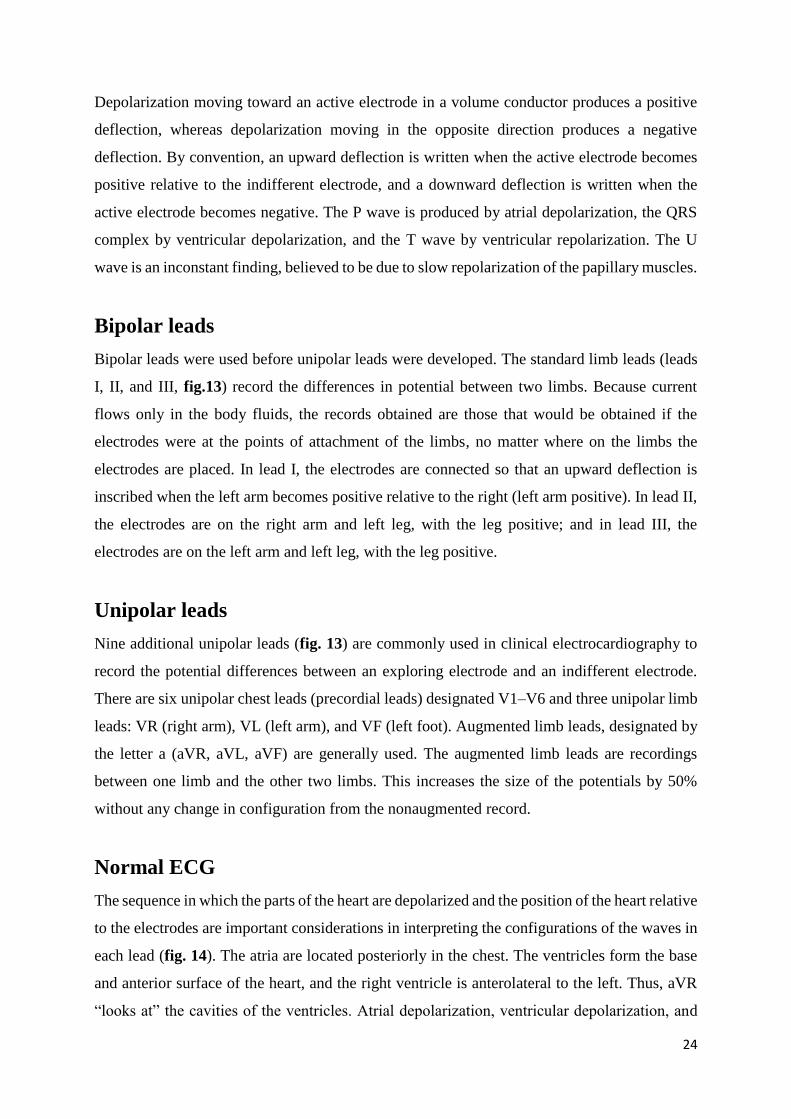
Bipolar leads
Bipolar leads were used before unipolar leads were developed. The standard limb leads (leads
I, II, and III, fig.13) record the differences in potential between two limbs. Because current
flows only in the body fluids, the records obtained are those that would be obtained if the
electrodes were at the points of attachment of the limbs, no matter where on the limbs the
electrodes are placed. In lead I, the electrodes are connected so that an upward deflection is
inscribed when the left arm becomes positive relative to the right (left arm positive). In lead II,
the electrodes are on the right arm and left leg, with the leg positive; and in lead III, the
electrodes are on the left arm and left leg, with the leg positive.
Unipolar leads
Nine additional unipolar leads (fig. 13) are commonly used in clinical electrocardiography to
record the potential differences between an exploring electrode and an indifferent electrode.
There are six unipolar chest leads (precordial leads) designated V1–V6 and three unipolar limb
leads: VR (right arm), VL (left arm), and VF (left foot). Augmented limb leads, designated by
the letter a (aVR, aVL, aVF) are generally used. The augmented limb leads are recordings
between one limb and the other two limbs. This increases the size of the potentials by 50%
without any change in configuration from the nonaugmented record.
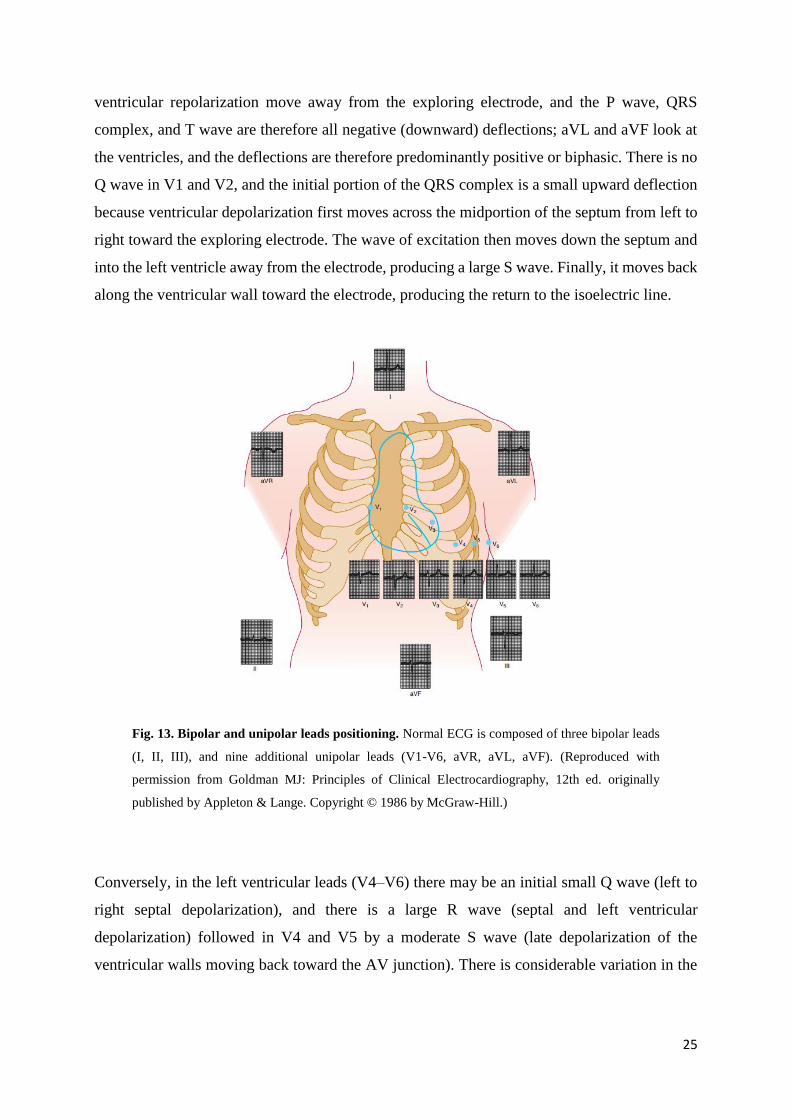
Normal ECG
The sequence in which the parts of the heart are depolarized and the position of the heart relative
to the electrodes are important considerations in interpreting the configurations of the waves in
each lead (fig. 14). The atria are located posteriorly in the chest. The ventricles form the base
and anterior surface of the heart, and the right ventricle is anterolateral to the left. Thus, aVR
“looks at” the cavities of the ventricles. Atrial depolarization, ventricular depolarization, and
Page 26
25
ventricular repolarization move away from the exploring electrode, and the P wave, QRS
complex, and T wave are therefore all negative (downward) deflections; aVL and aVF look at
the ventricles, and the deflections are therefore predominantly positive or biphasic. There is no
Q wave in V1 and V2, and the initial portion of the QRS complex is a small upward deflection
because ventricular depolarization first moves across the midportion of the septum from left to
right toward the exploring electrode. The wave of excitation then moves down the septum and
into the left ventricle away from the electrode, producing a large S wave. Finally, it moves back
along the ventricular wall toward the electrode, producing the return to the isoelectric line.
Fig. 13. Bipolar and unipolar leads positioning. Normal ECG is composed of three bipolar leads
(I, II, III), and nine additional unipolar leads (V1-V6, aVR, aVL, aVF). (Reproduced with
permission from Goldman MJ: Principles of Clinical Electrocardiography, 12th ed. originally
published by Appleton & Lange. Copyright © 1986 by McGraw-Hill.)
Conversely, in the left ventricular leads (V4–V6) there may be an initial small Q wave (left to
right septal depolarization), and there is a large R wave (septal and left ventricular
depolarization) followed in V4 and V5 by a moderate S wave (late depolarization of the
ventricular walls moving back toward the AV junction). There is considerable variation in the
Page 27
26
position of the normal heart, and the position affects the configuration of the
electrocardiographic complexes in the various leads.
Fig. 14. Sequence of cardiac excitation. Top: Anatomical position of electrical activity. Bottom:
corresponding electrocardiogram. The yellow colour denotes areas that are depolarized.
(Reproduced with permission from Goldman MJ: Principles of Clinical Electrocardiography, 12th
ed. originally published by Appleton & Lange. Copyright © 1986 by McGraw-Hill.)
Monitoring
Using a small portable tape recorder (Holter monitor), it is also possible to record the ECG in
patients during their normal activities. The recording is later played back at high speed and
analysed. Long-term continuous records can be obtained. Recordings obtained with monitors
have proved valuable in the diagnosis of arrhythmias and in planning the treatment of patients
recovering from myocardial infarctions.
Normal cardiac rate
In the normal human heart, each beat originates in the SA node. The heart beats about 70 times
per minute at rest. The rate is slowed (bradycardia) during sleep and accelerated (tachycardia)
by several stimuli (i.e. emotion, exercise, fever, and many other). In healthy young individuals
the heart rate varies with the phases of respiration: it accelerates during inspiration and
Page 28
27
decelerates during expiration, especially if the depth of breathing is increased. This normal
phenomenon, termed “sinus arrhythmia”, is due primarily to fluctuations in parasympathetic
output to the heart. During inspiration, impulses in the vagi from the stretch receptors in the
lungs inhibit the cardio-inhibitory area in the medulla oblongata. The tonic vagal discharge that
keeps the heart rate slow decreases, and the heart rate rises. Disease processes affecting the
sinus node lead to marked bradycardia accompanied by dizziness and syncope (sick sinus
syndrome), sinus pause/arrest, chronotropic incompetence, and sinoatrial exit block. Sinus node
dysfunction are also associated with alteration in conduction system and different
supraventricular tachyarrhythmias (i.e. atrial fibrillation and atrial flutter).
2.6. RADIOTELEMETRY IN FREELY-MOVING MICE
Cardiovascular research requires an accurate measurement of parameters relating to the
circulatory system of laboratory animals. Determination of heart rate and heart rate variability
are based on electrocardiogram (ECG) recordings.
Radiotelemetry combines miniature sensors and transmitters to detect and record biological
signal in animals to remote receiver. The receiver converts the analog frequency signal into a
digital signal to be imputed into a computerized data acquisition system.
Radiotelemetry enables recording of data from conscious and freely-moving animals without
requiring the presence of investigators in the proximity of the animal.
This methodology also reduces the number of animals used, rendering this technology the
favourite method of monitoring physiological parameters in laboratory animals (Kramer &
Kinter, 2003; Kramer et al., 1993). The constant innovations in radiotelemetry technology (i.e.
implant miniaturization) make possible the recording of physiological parameters and
locomotors activity continuously and in real time over longer periods such as hours, days or
even weeks (Kramer & Kinter, 2003; Arras et al., 2007).
Telemetry setup consists of an implantable hermetically sealed transmitter, coated with a
biocompatible material, and an external receiver system. Using sterile procedures, the
transmitter is implanted directly within the peritoneal cavity (Sgoifo et al., 1996). The mice
implanted with a transmitter is located in plastic cage placed on top of the receiver that provides
reliable reception of data transmitted via digital telemetry. Several receivers are connected to a
Page 29
28
matrix that detects changes in signal strength to indicate movement in the animal, and provides
one or more digital pulses to the computer upon each movement.
Miniaturized cardiovascular telemetry technology can be used to study the effects of several
drugs with cardiovascular action. Measurements of ECG and HR using telemetry in mouse
treated with pharmacological compounds have resulted in qualitative and quantitative changes
in definitions of ECG waveforms, in baseline values of HR, and in responses to autonomic
agents, compared with placebo control mice (Anderson et al., 1993; Mattes & Lemmer, 1991;
Wood et al., 2005; Parisella et al., 2012)
2.7. HEART-RATE REDUCING AGENTS
The relevance of the If current to cardiac pacemaking makes it the obvious target for the search
of drugs able to modify this ionic current, and acquires a large interest for the pharmacological
research. In the past few years, substances able to act as specific blockers of the pacemaker
current have been developed. These molecules, originally known as “pure bradycardic” agents
and termed today “heart rate-lowering” agents, are potentially important therapeutic agents able
to induce rate slowing without the inotropic side effects typical of drugs currently used to slow
heart rate, such as Ca2+ antagonists or β-blockers (Yusuf & Camm, 2003; DiFrancesco &
Camm, 2004).
Specific heart rate-lowering agents include, ST567 (alinidine), UL-FS49 (zatebradine), DK-
AH269 (cilobradine), ZD-7288, and S16257 (ivabradine).
The main action of these substances is to induce a reduction of the diastolic depolarization slope
by blocking If (Baruscotti et al., 2005); however some of these drugs, particularly at high
concentrations, might affect other channels and lead to arrhythmias (Bois et al., 1996).
Alinidine
One of the first compounds developed as a bradycardic agent was alinidine. It is able to reduce
heart rate by prolonging the diastolic depolarization phase, an effect caused by a dual inhibitory
action on the pacemaker current. First, it induces a reduction of the maximal channel
conductance, and second, it shifts the activation curve of the current to more negative voltages;
furthermore, the action of alinidine is not use- or frequency-dependent (Snyders & Van Bogaert,
1987). Despite its efficacy in reducing heart rate, alinidine also blocks calcium and potassium
Page 30
29
currents and prolongs the action potential repolarization process (Satoh & Hashimoto, 1986)
and therefore is potentially an arrhythmic compound.
Zatebradine
Zatebradine (UL-FS49) is a bradycardic agent derived from verapamil, a Ca++ channel blocker.
The effect induced by this drug is mediated by a use-dependent block of the pacemaker current,
without modification of the voltage dependence (Van Bogaert & Goethals, 1987; Goethals et
al., 1993; Van Bogaert & Pittoors, 2003), but zatebradine has a secondary effect since it can
also block the Ih current, the neuronal counterpart of If, a current that plays a major functional
role in the transduction of light signal in photoreceptors (Satoh & Yamada, 2002; Gargini et al.,
1999). These undesired symptoms limited possible clinical application, despite zatebradine
resulted more specific than alinidine.
Cilobradine
Cilobradine is a compound similar to zatebradine, but with improved selectivity for If. In in-
vitro experiments performed on cardiac myocytes, cilobradine (1 µM) reduced the If current by
80% and, at a concentration of 0.3 µM, slowed the rate of diastolic depolarization without
apparent changes in action potential shape and duration (Van Bogaert & Pittoors, 2003), and
without substantial inotropic or vascular alterations (Schmitz-Spanke et al., 2004).
ZD7288
ZD7288 is a compound able to reduce the spontaneous rate of intact right atria, without
modifying ventricular contractility (Marshall et al., 1993.). Experiments in single SA node
myocytes isolated from guinea pig hearts showed that the primary effect of ZD7288 is to block
the If current, but this drug has a minor effects also on Ca++ and K+ currents, that limited the
clinical use of ZD7288 (BoSmith et al., 1993). In fact, when tested in intact SA node, ZD7288
(0.3 µM) induced a slowing of rate (-61%), but also caused a modest prolongation (+10%) of
action potential duration (Briggs & Heapy, 1992). The effect of ZD7288 on the If current
depends on a use independent block associated with a shift of the channel activation curve to
more negative potentials (-16.2 mV) and a decrease of maximal channel conductance (-52% at
0.3 mM) (BoSmith et al., 1993). In addition it also affects the neuronal Ih current in several
Page 31
30
regions of the central nervous system (Harris & Constanti, 1995; Gasparini & DiFrancesco,
1997).
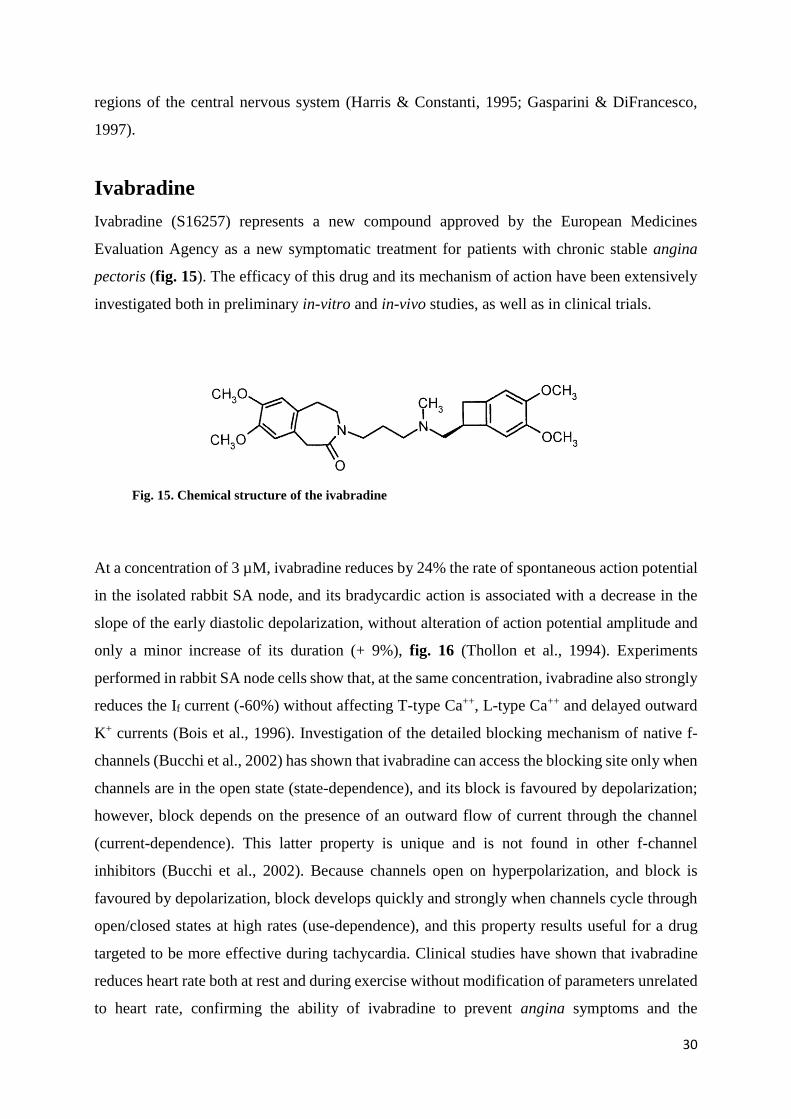
Ivabradine
Ivabradine (S16257) represents a new compound approved by the European Medicines
Evaluation Agency as a new symptomatic treatment for patients with chronic stable angina
pectoris (fig. 15). The efficacy of this drug and its mechanism of action have been extensively
investigated both in preliminary in-vitro and in-vivo studies, as well as in clinical trials.
Fig. 15. Chemical structure of the ivabradine
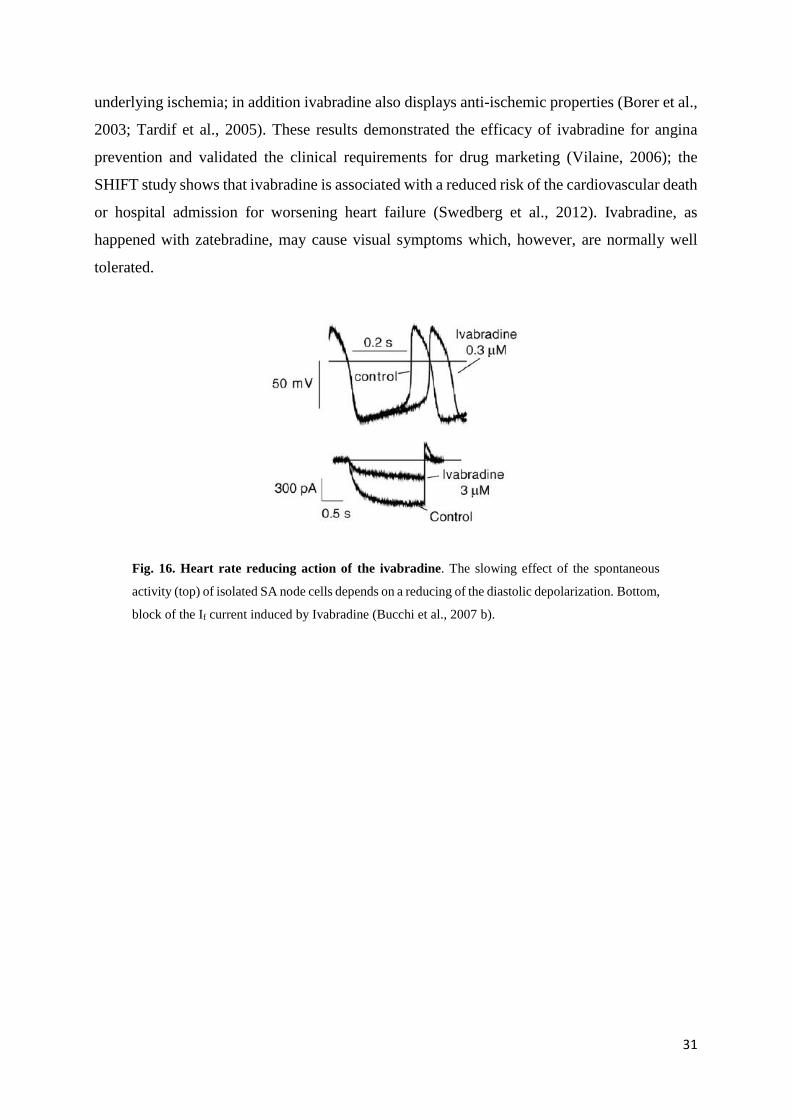
At a concentration of 3 µM, ivabradine reduces by 24% the rate of spontaneous action potential
in the isolated rabbit SA node, and its bradycardic action is associated with a decrease in the
slope of the early diastolic depolarization, without alteration of action potential amplitude and
only a minor increase of its duration (+ 9%), fig. 16 (Thollon et al., 1994). Experiments
performed in rabbit SA node cells show that, at the same concentration, ivabradine also strongly
reduces the If current (-60%) without affecting T-type Ca++, L-type Ca++ and delayed outward
K+ currents (Bois et al., 1996). Investigation of the detailed blocking mechanism of native f-
channels (Bucchi et al., 2002) has shown that ivabradine can access the blocking site only when
channels are in the open state (state-dependence), and its block is favoured by depolarization;
however, block depends on the presence of an outward flow of current through the channel
(current-dependence). This latter property is unique and is not found in other f-channel
inhibitors (Bucchi et al., 2002). Because channels open on hyperpolarization, and block is
favoured by depolarization, block develops quickly and strongly when channels cycle through
open/closed states at high rates (use-dependence), and this property results useful for a drug
targeted to be more effective during tachycardia. Clinical studies have shown that ivabradine
reduces heart rate both at rest and during exercise without modification of parameters unrelated
to heart rate, confirming the ability of ivabradine to prevent angina symptoms and the
Page 32
31
underlying ischemia; in addition ivabradine also displays anti-ischemic properties (Borer et al.,
2003; Tardif et al., 2005). These results demonstrated the efficacy of ivabradine for angina
prevention and validated the clinical requirements for drug marketing (Vilaine, 2006); the
SHIFT study shows that ivabradine is associated with a reduced risk of the cardiovascular death
or hospital admission for worsening heart failure (Swedberg et al., 2012). Ivabradine, as
happened with zatebradine, may cause visual symptoms which, however, are normally well
tolerated.
Fig. 16. Heart rate reducing action of the ivabradine. The slowing effect of the spontaneous
activity (top) of isolated SA node cells depends on a reducing of the diastolic depolarization. Bottom,
block of the If current induced by Ivabradine (Bucchi et al., 2007 b).
Page 33
32
3. TRADITIONAL CHINESE MEDICINE
3.1. INTRODUCTION
Given the importance of the pharmacological aspects of the pacemaker current, the search for
new drugs used in the Traditional Chinese Medicine (TCM) as bradycardic agents has acquired
a large interest.
TCM, born more than 2000 years ago in ancient China, is still currently used as a system of
medical practice. According to the ancient tradition, TCM is based on the yin-yang and the five
elements theories; taken together this philosophical system explains all change as well as all
natural phenomena in the universe (Lao et al., 2012). The yin-yang theory describes the universe
as a whole composed of two opposites, yin and yang, which are interdependent and can
transform into each other. Their equilibrium ensures that harmony, including the harmony for
the body, is maintained. In this perspective, the yin-yang theory reposition the human beings
within a rich and deep perspective highlighting the interrelationship of the cosmos and human
nature. The five element theory developed from an ancient Chinese philosophical system in
which the universe was supposed to consist of five basic elements: wood, fire, earth, metal and
water. The five element theory describes the relationship between the human body and the
external environment and the physiological and pathological interactions among the internal
organs within the body (Lao et al., 2012).
The holistic view of human and nature is also present in medicine; TCM treatments are in
contrast to the disease-target approach used by Western medicine, where each disease is treated
with a standard protocol. TCM is widely practiced in Asian populations, but in the last decades,
many non-Asian countries have recognized the huge therapeutic potential of this traditional
practice. Large amount of basic research has been conducted on TCM herbs, mostly in
characterizing the multiple-herb constituents and testing their pharmacological activities in the
pursuit of new drug discovery; in order for TCM to be rationally used, it is essential to
demonstrate its efficacy and safety by high-level evidence using methods accepted in Western
medicine (Fung & Linn, 2015).
Page 34
33
TCM modalities include Chinese herbal medicine, acupuncture, Chinese massage (tui na),
mind/body exercise, and dietary therapy. Of these, Chinese herbal medicine and acupuncture
are the most commonly used.
Chinese herbal medicine (zhong yao) is an integral part of traditional Chinese culture and
medical practice. The Chinese materia medica includes plants, minerals, and animal parts.
These are categorized by nature, flavor, and function. There are four natures (cold, cool, hot,
and warm), and five flavors (pungent, sweet, sour, bitter, and salty). Functions include heat-
clearing, expectoration and antitussive action, dampness elimination, and interior warming.
Typically, an herbal practitioner will prescribe a formula containing ten or more herbs with
differing functions, natures, and flavors, which are selected based on the syndrome to be treated.
In these constructed formulas, the herbs are believed to act synergistically to harmonize their
effects and to neutralize or minimize any toxicity of the individual constituents (Bensky &
Barolet, 1990; Bensky & Gamble, 1993).
Recently, several compounds of TCM have acquired importance in Western countries for their
therapeutic properties. For example berberine (JKL1073A), an alkaloid found in many
medicinal plants of the genera Berberis and Coptis, has important cardiovascular effects: it
induces vasodilatation in smooth muscle (Chiou et al., 1991; Bova et al., 1992) and has been
reported to exert both positive inotropic and negative chronotropic actions, exerting a blockade
on the ionic currents Ito e Ik1 (Chi et al., 1996).
Another compound characterized by cardiac activity is Wenxin Keli, a Chinese herb extract
reported to prevent the induction of persistent atrial fibrillation in isolated canine right atria
preparations (Burashnikov et al., 2012).
Wenxin Keli is comprised of 5 components: Nardostachys chinensin batal extract (NcBe),
Codonopsis, Notoginseng, Amber, and Rhizoma polygonati (Burashnikov et al., 2012). Very
limited data are available in the literature concerning the electrophysiological actions of the
individual components of Wenxin keli, but is reported that NcBe, a traditional Tibetan
medicinal compound extracted from Valerinanaceae plants, significantly blocks INa and Ito in
rat ventricular myocytes (Liu et al., 2009). Using rabbit ventricular myocytes, NcBe is able to
block INa, ICa-L, IK and Ito in a concentration dependent manner using rabbit ventricular myocytes
(Tang et al., 2004; Tang et al., 2008).
Page 35
34
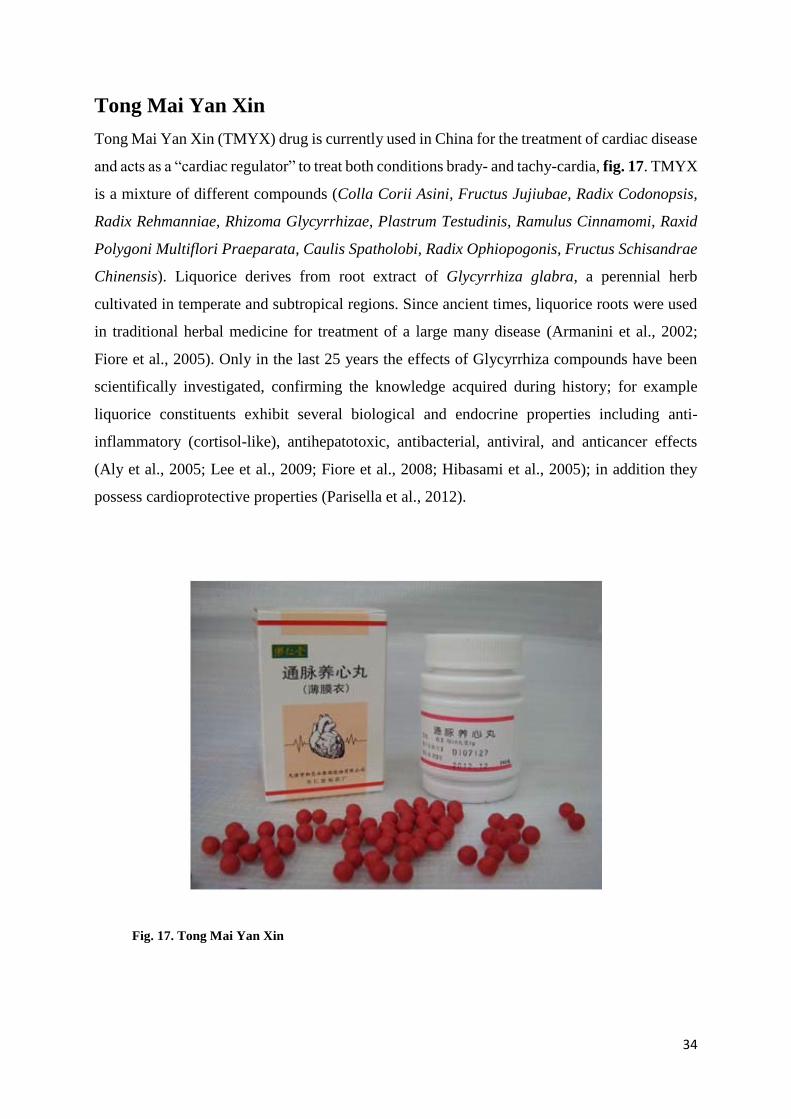
Tong Mai Yan Xin
Tong Mai Yan Xin (TMYX) drug is currently used in China for the treatment of cardiac disease
and acts as a “cardiac regulator” to treat both conditions brady- and tachy-cardia, fig. 17. TMYX
is a mixture of different compounds (Colla Corii Asini, Fructus Jujiubae, Radix Codonopsis,
Radix Rehmanniae, Rhizoma Glycyrrhizae, Plastrum Testudinis, Ramulus Cinnamomi, Raxid
Polygoni Multiflori Praeparata, Caulis Spatholobi, Radix Ophiopogonis, Fructus Schisandrae
Chinensis). Liquorice derives from root extract of Glycyrrhiza glabra, a perennial herb
cultivated in temperate and subtropical regions. Since ancient times, liquorice roots were used
in traditional herbal medicine for treatment of a large many disease (Armanini et al., 2002;
Fiore et al., 2005). Only in the last 25 years the effects of Glycyrrhiza compounds have been
scientifically investigated, confirming the knowledge acquired during history; for example
liquorice constituents exhibit several biological and endocrine properties including anti-
inflammatory (cortisol-like), antihepatotoxic, antibacterial, antiviral, and anticancer effects
(Aly et al., 2005; Lee et al., 2009; Fiore et al., 2008; Hibasami et al., 2005); in addition they
possess cardioprotective properties (Parisella et al., 2012).
Fig. 17. Tong Mai Yan Xin
Page 36
35
3.2. MATERIALS AND METHODS
Animals
The in-vitro experiments were performed on sinoatrial myocytes isolated from female New
Zealand rabbits of about 0.8-1.2 Kg weight. The in-vivo telemetric recordings were carried out
on male wild type mice ≥ 2 months old.
Animal protocols conformed to the guidelines of the care and use of laboratory animals
established by Italian (DL. 26/2014) and European (2010/63/UE) directives.
In-vitro experiments
Cell isolation
Young white albino rabbits were deeply anesthetized by intramuscular injection of
acepromazine (1 mg/Kg) and euthanized with intravenous injection of sodium thiopental (60
mg/Kg), and exsanguination.
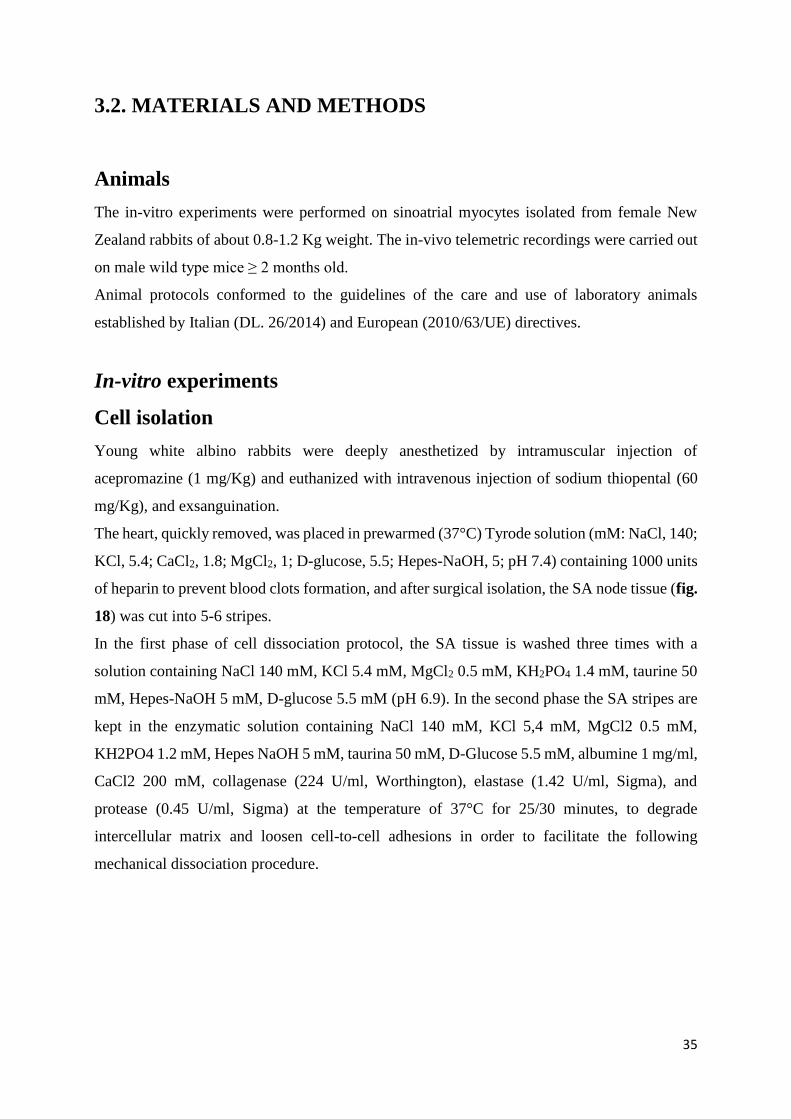
The heart, quickly removed, was placed in prewarmed (37°C) Tyrode solution (mM: NaCl, 140;
KCl, 5.4; CaCl2, 1.8; MgCl2, 1; D-glucose, 5.5; Hepes-NaOH, 5; pH 7.4) containing 1000 units
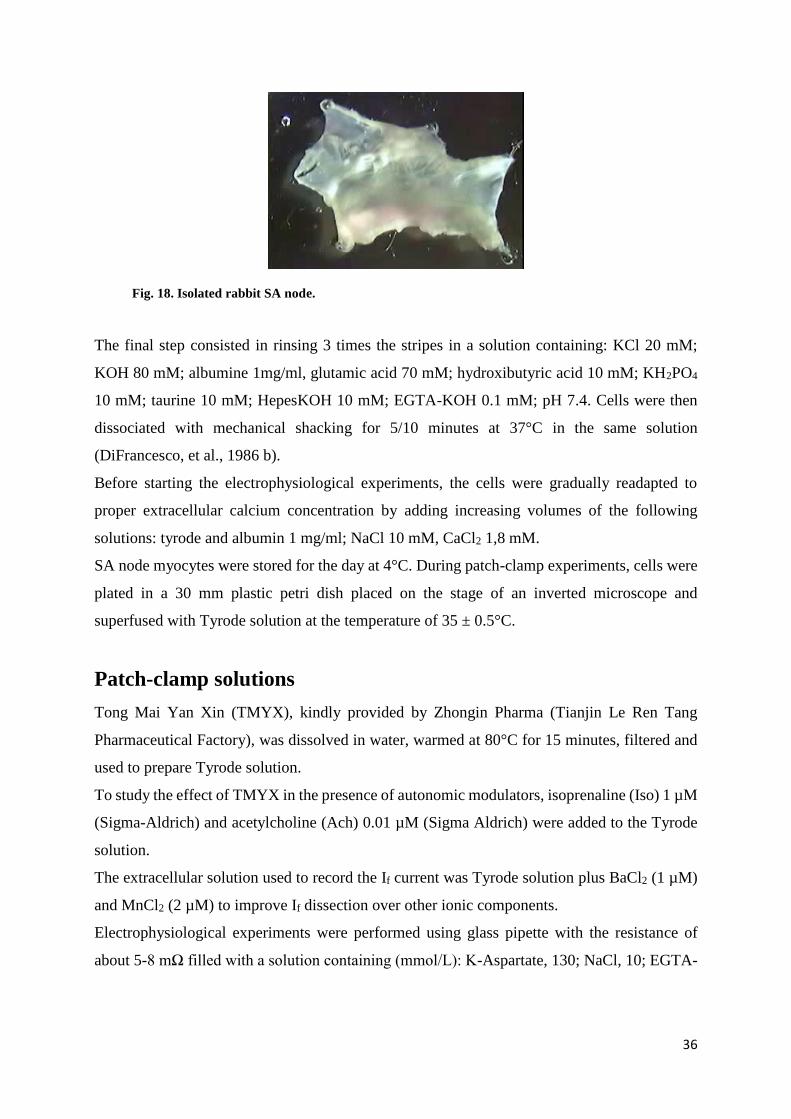
of heparin to prevent blood clots formation, and after surgical isolation, the SA node tissue (fig.
18) was cut into 5-6 stripes.
In the first phase of cell dissociation protocol, the SA tissue is washed three times with a
solution containing NaCl 140 mM, KCl 5.4 mM, MgCl2 0.5 mM, KH2PO4 1.4 mM, taurine 50
mM, Hepes-NaOH 5 mM, D-glucose 5.5 mM (pH 6.9). In the second phase the SA stripes are
kept in the enzymatic solution containing NaCl 140 mM, KCl 5,4 mM, MgCl2 0.5 mM,
KH2PO4 1.2 mM, Hepes NaOH 5 mM, taurina 50 mM, D-Glucose 5.5 mM, albumine 1 mg/ml,
CaCl2 200 mM, collagenase (224 U/ml, Worthington), elastase (1.42 U/ml, Sigma), and
protease (0.45 U/ml, Sigma) at the temperature of 37°C for 25/30 minutes, to degrade
intercellular matrix and loosen cell-to-cell adhesions in order to facilitate the following
mechanical dissociation procedure.
Page 37
36
Fig. 18. Isolated rabbit SA node.
The final step consisted in rinsing 3 times the stripes in a solution containing: KCl 20 mM;
KOH 80 mM; albumine 1mg/ml, glutamic acid 70 mM; hydroxibutyric acid 10 mM; KH2PO4
10 mM; taurine 10 mM; HepesKOH 10 mM; EGTA-KOH 0.1 mM; pH 7.4. Cells were then
dissociated with mechanical shacking for 5/10 minutes at 37°C in the same solution
(DiFrancesco, et al., 1986 b).
Before starting the electrophysiological experiments, the cells were gradually readapted to
proper extracellular calcium concentration by adding increasing volumes of the following
solutions: tyrode and albumin 1 mg/ml; NaCl 10 mM, CaCl2 1,8 mM.
SA node myocytes were stored for the day at 4°C. During patch-clamp experiments, cells were
plated in a 30 mm plastic petri dish placed on the stage of an inverted microscope and
superfused with Tyrode solution at the temperature of 35 ± 0.5°C.
Patch-clamp solutions
Tong Mai Yan Xin (TMYX), kindly provided by Zhongin Pharma (Tianjin Le Ren Tang
Pharmaceutical Factory), was dissolved in water, warmed at 80°C for 15 minutes, filtered and
used to prepare Tyrode solution.
To study the effect of TMYX in the presence of autonomic modulators, isoprenaline (Iso) 1 µM
(Sigma-Aldrich) and acetylcholine (Ach) 0.01 µM (Sigma Aldrich) were added to the Tyrode
solution.
The extracellular solution used to record the If current was Tyrode solution plus BaCl2 (1 µM)
and MnCl2 (2 µM) to improve If dissection over other ionic components.
Electrophysiological experiments were performed using glass pipette with the resistance of
about 5-8 mΩ filled with a solution containing (mmol/L): K-Aspartate, 130; NaCl, 10; EGTA-
Page 38
37
KOH, 5; CaCl2, 2; MgCl2, 2; ATP (Na-salt), 2; creatine phosphate, 5; GTP (Na-salt), 0.1; pH
7.2.
Equipment
Standard patch-clamp setup which includes:
- Inverted microscope (Axiovert S100) positioned on an anti-vibration table.
- Patch-clamp amplifier (Axopatch 200B, Axon Instruments).
- Digital interface (Digidata 1440, Axon Instruments).
- Micromanipulators.
- Solution temperature control.
- pClamp 10.0 software (Axon Instruments).
All the electrical devices are positioned inside a Faraday cage, to shield from electrical noise.
Protocols and data analysis
Electrophysiological protocols were designed with pClamp software. All data were acquired
with pClamp software and an Axopatch 200B amplifier. To record the capacitive current, we
used a protocol with a single hyperpolarizing step of 10 mV amplitude (from -35 to -45 mV)
for 30 ms of duration.
Action potentials were recorded in current-clamp configuration from single SA node cells or
small uniformly-beating aggregates as continuous traces for several hundred seconds at a
sampling rate of 2 KHz and filtered at 1 KHz with pClamp software. Raw AP records were
digitally smoothed by a 10-point adjacent averaging smoothing procedure and the time
derivative calculated according to a second polynomial, 8-point smoothing differentiating
routine (Origin 7, Origin Lab, Northampton, MA).
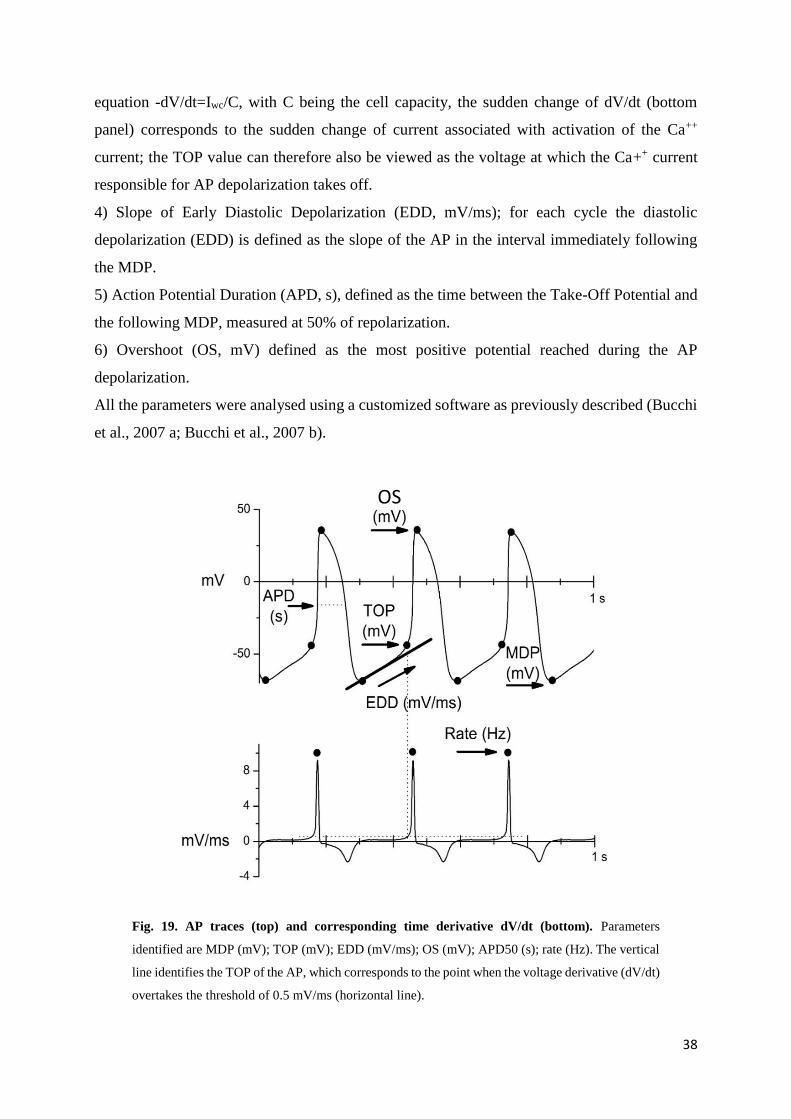
For each AP cycle the following parameters were analysed (fig. 19):
1) Rate (Hz), calculated as the reciprocal of the cycle length from peak-to-peak dV/dt traces.
2) Maximum Diastolic Potential (MDP, mV), defined as the most negative potential reached
during AP repolarization.
3) Take-Off Potential (TOP, mV), defined as the voltage measured at the time when the voltage
derivative (dV/dt) overtakes a given threshold, set to 0.5 mV/ms (dashed horizontal line in the
bottom panel of fig. 19); this value normally represents a level across which, regardless of rate,
the voltage derivative dV/dt changes abruptly during the transition from phase 4 to phase 0 of
the AP; since dV/dt is proportional to the whole-cell current density (Iwc) according to the
Page 39
38
equation -dV/dt=Iwc/C, with C being the cell capacity, the sudden change of dV/dt (bottom
panel) corresponds to the sudden change of current associated with activation of the Ca++
current; the TOP value can therefore also be viewed as the voltage at which the Ca++ current
responsible for AP depolarization takes off.
4) Slope of Early Diastolic Depolarization (EDD, mV/ms); for each cycle the diastolic
depolarization (EDD) is defined as the slope of the AP in the interval immediately following
the MDP.
5) Action Potential Duration (APD, s), defined as the time between the Take-Off Potential and
the following MDP, measured at 50% of repolarization.
6) Overshoot (OS, mV) defined as the most positive potential reached during the AP
depolarization.
All the parameters were analysed using a customized software as previously described (Bucchi
et al., 2007 a; Bucchi et al., 2007 b).
Fig. 19. AP traces (top) and corresponding time derivative dV/dt (bottom). Parameters
identified are MDP (mV); TOP (mV); EDD (mV/ms); OS (mV); APD50 (s); rate (Hz). The vertical
line identifies the TOP of the AP, which corresponds to the point when the voltage derivative (dV/dt)
overtakes the threshold of 0.5 mV/ms (horizontal line).
OS
Page 40
39
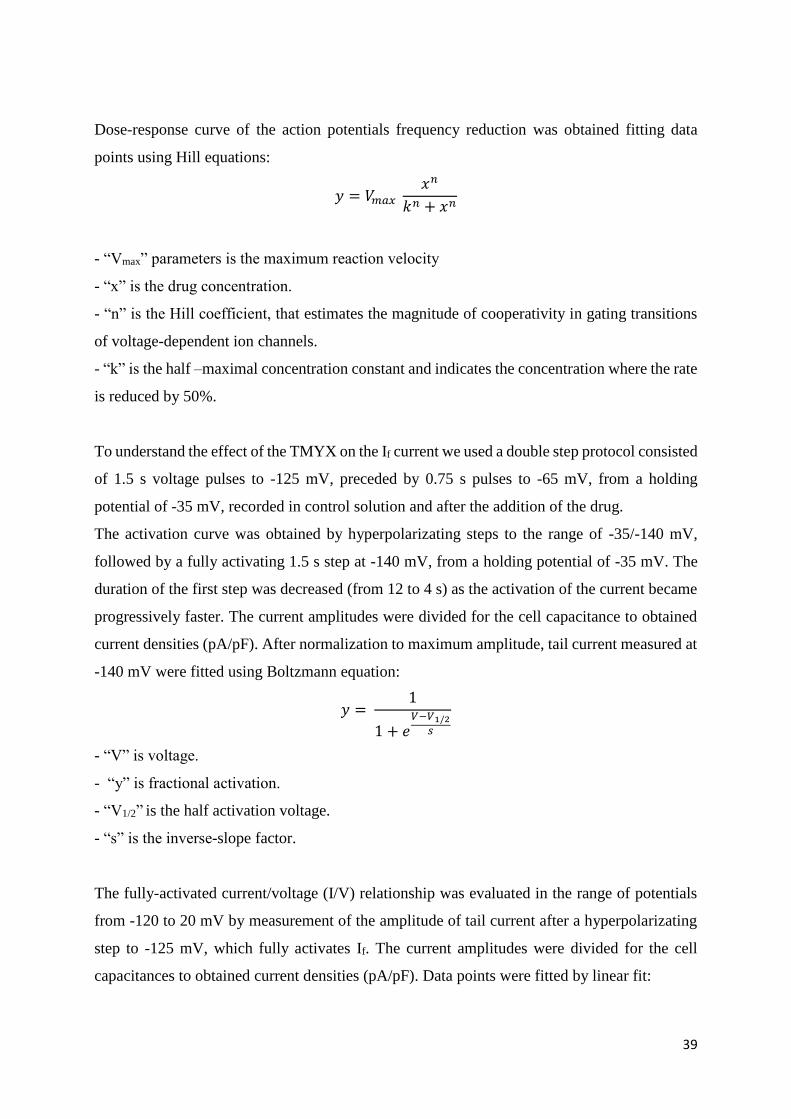
Dose-response curve of the action potentials frequency reduction was obtained fitting data
points using Hill equations:
𝑦 = 𝑉𝑚𝑎𝑥 𝑥𝑛
𝑘𝑛 + 𝑥𝑛
- “Vmax” parameters is the maximum reaction velocity
- “x” is the drug concentration.
- “n” is the Hill coefficient, that estimates the magnitude of cooperativity in gating transitions
of voltage-dependent ion channels.
- “k” is the half –maximal concentration constant and indicates the concentration where the rate
is reduced by 50%.
To understand the effect of the TMYX on the If current we used a double step protocol consisted
of 1.5 s voltage pulses to -125 mV, preceded by 0.75 s pulses to -65 mV, from a holding
potential of -35 mV, recorded in control solution and after the addition of the drug.
The activation curve was obtained by hyperpolarizating steps to the range of -35/-140 mV,
followed by a fully activating 1.5 s step at -140 mV, from a holding potential of -35 mV. The
duration of the first step was decreased (from 12 to 4 s) as the activation of the current became
progressively faster. The current amplitudes were divided for the cell capacitance to obtained
current densities (pA/pF). After normalization to maximum amplitude, tail current measured at
-140 mV were fitted using Boltzmann equation:
𝑦 = 1
1 + 𝑒𝑉−𝑉1/2
𝑠
- “V” is voltage.
- “y” is fractional activation.
- “V1/2” is the half activation voltage.
- “s” is the inverse-slope factor.
The fully-activated current/voltage (I/V) relationship was evaluated in the range of potentials
from -120 to 20 mV by measurement of the amplitude of tail current after a hyperpolarizating
step to -125 mV, which fully activates If. The current amplitudes were divided for the cell
capacitances to obtained current densities (pA/pF). Data points were fitted by linear fit:
Page 41
40
𝑦 = 𝑎 + 𝑏𝑥
- “a” is the intercept.
- “b” is the slope.
Data are presented as mean standard error of the mean (S.E.M.); the statistic test used is the
Student t-test; statistical significance: P < 0.05.
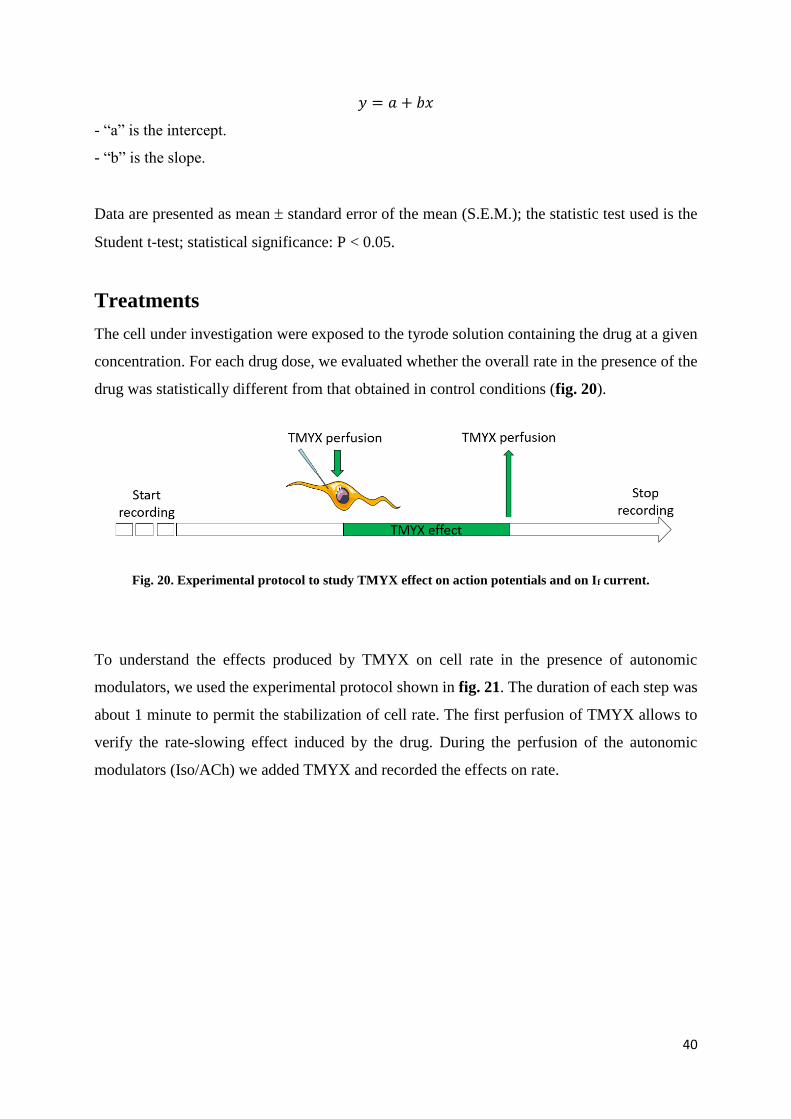
Treatments
The cell under investigation were exposed to the tyrode solution containing the drug at a given
concentration. For each drug dose, we evaluated whether the overall rate in the presence of the
drug was statistically different from that obtained in control conditions (fig. 20).
Fig. 20. Experimental protocol to study TMYX effect on action potentials and on If current.
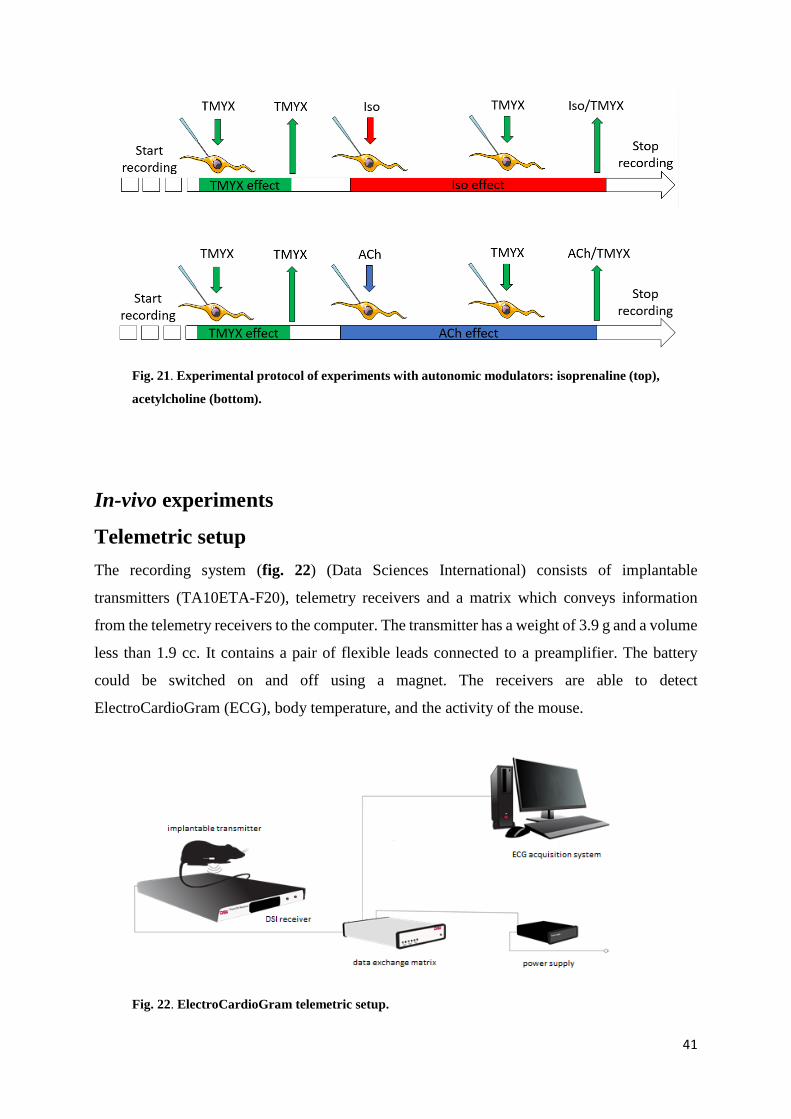
To understand the effects produced by TMYX on cell rate in the presence of autonomic
modulators, we used the experimental protocol shown in fig. 21. The duration of each step was
about 1 minute to permit the stabilization of cell rate. The first perfusion of TMYX allows to
verify the rate-slowing effect induced by the drug. During the perfusion of the autonomic
modulators (Iso/ACh) we added TMYX and recorded the effects on rate.
Page 42
41
Fig. 21. Experimental protocol of experiments with autonomic modulators: isoprenaline (top),
acetylcholine (bottom).
In-vivo experiments
Telemetric setup
The recording system (fig. 22) (Data Sciences International) consists of implantable
transmitters (TA10ETA-F20), telemetry receivers and a matrix which conveys information
from the telemetry receivers to the computer. The transmitter has a weight of 3.9 g and a volume
less than 1.9 cc. It contains a pair of flexible leads connected to a preamplifier. The battery
could be switched on and off using a magnet. The receivers are able to detect
ElectroCardioGram (ECG), body temperature, and the activity of the mouse.
Fig. 22. ElectroCardioGram telemetric setup.
Page 43
42
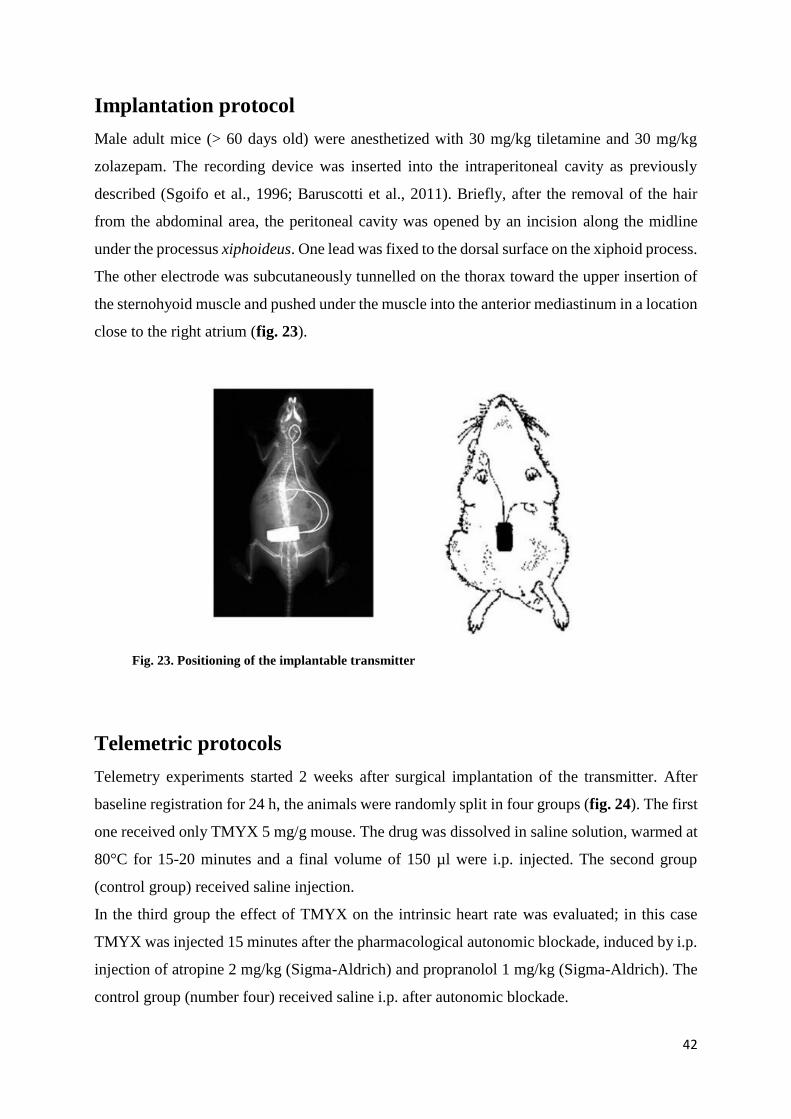
Implantation protocol
Male adult mice (> 60 days old) were anesthetized with 30 mg/kg tiletamine and 30 mg/kg
zolazepam. The recording device was inserted into the intraperitoneal cavity as previously
described (Sgoifo et al., 1996; Baruscotti et al., 2011). Briefly, after the removal of the hair
from the abdominal area, the peritoneal cavity was opened by an incision along the midline
under the processus xiphoideus. One lead was fixed to the dorsal surface on the xiphoid process.
The other electrode was subcutaneously tunnelled on the thorax toward the upper insertion of
the sternohyoid muscle and pushed under the muscle into the anterior mediastinum in a location
close to the right atrium (fig. 23).
Fig. 23. Positioning of the implantable transmitter
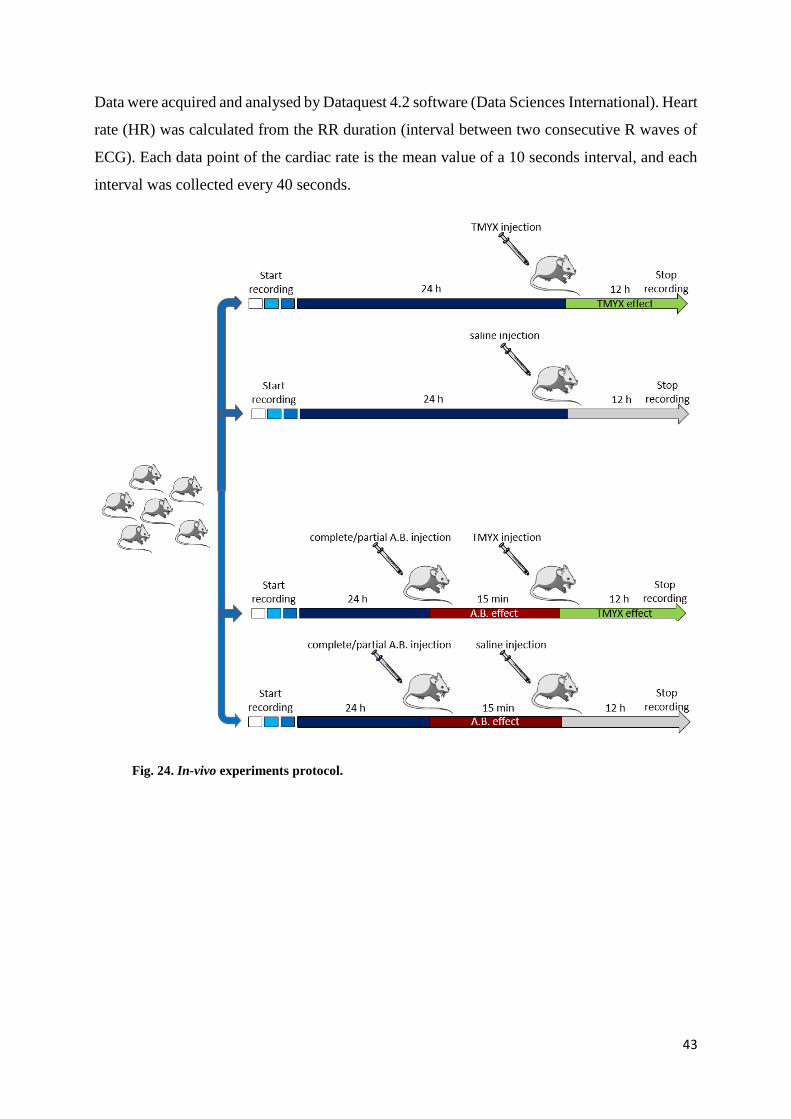
Telemetric protocols
Telemetry experiments started 2 weeks after surgical implantation of the transmitter. After
baseline registration for 24 h, the animals were randomly split in four groups (fig. 24). The first
one received only TMYX 5 mg/g mouse. The drug was dissolved in saline solution, warmed at
80°C for 15-20 minutes and a final volume of 150 µl were i.p. injected. The second group
(control group) received saline injection.
In the third group the effect of TMYX on the intrinsic heart rate was evaluated; in this case
TMYX was injected 15 minutes after the pharmacological autonomic blockade, induced by i.p.
injection of atropine 2 mg/kg (Sigma-Aldrich) and propranolol 1 mg/kg (Sigma-Aldrich). The
control group (number four) received saline i.p. after autonomic blockade.
Page 44
43
Data were acquired and analysed by Dataquest 4.2 software (Data Sciences International). Heart
rate (HR) was calculated from the RR duration (interval between two consecutive R waves of
ECG). Each data point of the cardiac rate is the mean value of a 10 seconds interval, and each
interval was collected every 40 seconds.
Fig. 24. In-vivo experiments protocol.
Page 45
44
3.3. RESULTS
In-vitro experiments
Action potential parameters
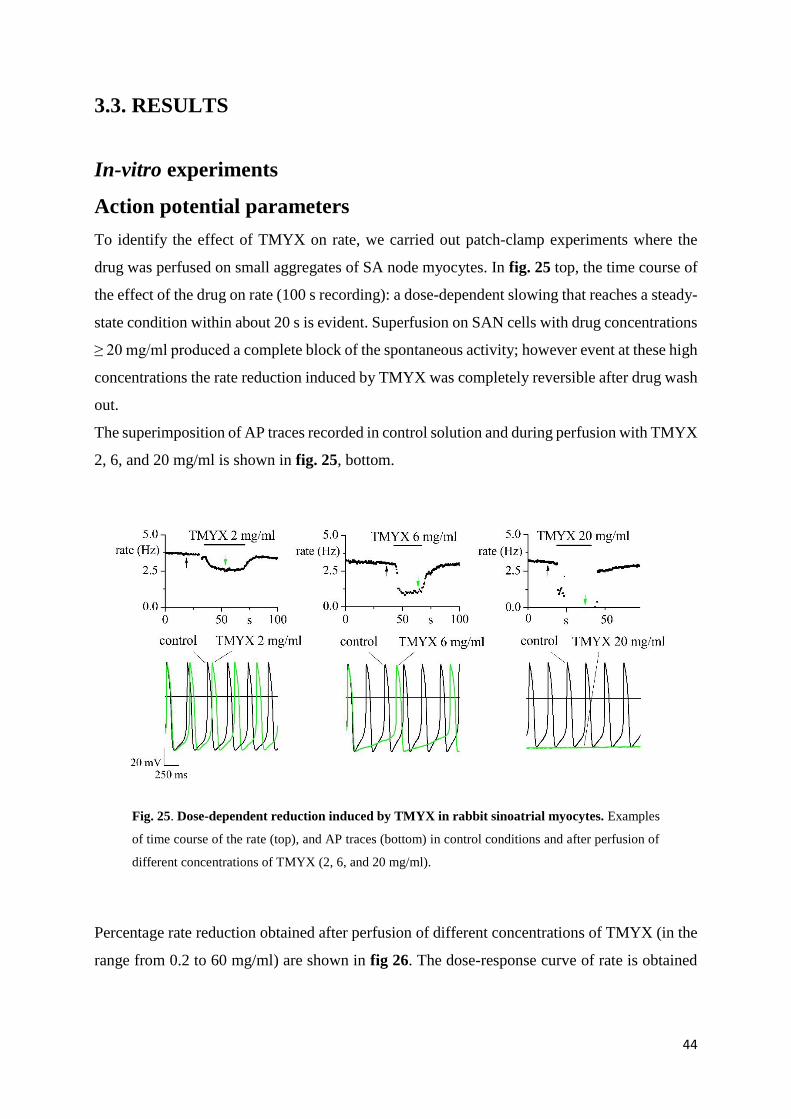
To identify the effect of TMYX on rate, we carried out patch-clamp experiments where the
drug was perfused on small aggregates of SA node myocytes. In fig. 25 top, the time course of
the effect of the drug on rate (100 s recording): a dose-dependent slowing that reaches a steady-
state condition within about 20 s is evident. Superfusion on SAN cells with drug concentrations
≥ 20 mg/ml produced a complete block of the spontaneous activity; however event at these high
concentrations the rate reduction induced by TMYX was completely reversible after drug wash
out.
The superimposition of AP traces recorded in control solution and during perfusion with TMYX
2, 6, and 20 mg/ml is shown in fig. 25, bottom.
Fig. 25. Dose-dependent reduction induced by TMYX in rabbit sinoatrial myocytes. Examples
of time course of the rate (top), and AP traces (bottom) in control conditions and after perfusion of
different concentrations of TMYX (2, 6, and 20 mg/ml).
Percentage rate reduction obtained after perfusion of different concentrations of TMYX (in the
range from 0.2 to 60 mg/ml) are shown in fig 26. The dose-response curve of rate is obtained
Page 46
45
by fitting the experimental points (reported in table 1) with Hill equations, and yields half block
concentration (Kd) of 4.8 mg/ml, and Hill coefficient of 1.6.
These data indicate that the superfusion of Traditional Chinese drug TMYX produces a
reversible, dose-dependent reduction of the rate at all the concentrations tested.
Fig. 26. Dose-response curve of the rate; the lines indicate the half block concentration (Kd value
= 4.8 mg/ml); Hill coefficient = 1.6; * P < 0.05, Student t-test.
Table 1. AP rate. Data are shown as mean ± S.E.M; n = number of cells. *, P<0.05 vs. control
(Student t-test).
Current clamp experiments were carried out to identify which of the AP parameters are affected
when small aggregates of SAN myocytes were perfused with different concentrations of TMYX
(in the range from 0.2 to 6 mg/ml) (fig. 27).
TMYX n
Rate
Ctrl (Hz) TMYX (Hz) % Reduction
Mean S.E.M. Mean S.E.M. Mean S.E.M.
0.2 mg/ml 7 3.34 0.28 3.21 0.27 -3.96 * 0.55
0.6 mg/ml 6 3.59 0.18 3.32 0.18 -7.58 * 1.17
2 mg/ml 23 3.50 0.12 2.67 0.09 -23.55 * 1.20
6 mg/ml 6 3.17 0.19 01.52 0.16 -51.64 * 5.02
20 mg/ml 7 2.94 0.22 0 0 -100 * 0
60 mg/ml 3 2.25 0.25 0 0 -100 * 0
Page 47
46
Data analysis shows that at the concentration used slowing of spontaneous rate is associated
with EDD % reduction of 12.35 ± 1.90; 22.18 ± 4.17; 53.27 ± 2.63; 80.98 ± 5.00 (n = 6-23, P
< 0.05, Student t-test), while the TOP, the MDP and the overshoot did not vary. APD50 was
instead slightly increased at all concentrations (+3.60 ± 1.53; +8.46 ± 2.10; +6.50 ± 0.87;
+24.68 ± 7.12, n=6-23; P < 0.05, Student t-test). Experimental data are reported in table 2.
Fig. 27. AP parameters modified by perfusion of different concentration of TMYX drug. Bar
graphs show normalized means of EDD, APD50, MDP, OS, TOP in presence of TMYX at the
concentrations of 0.2 (n=7), 0.6 (n=6), 2 (n=23), 6 (n=6) mg/ml. * P < 0.05, Student t-test.
Page 48
47
TMYX n
EDD
Ctrl (mV/ms) TMYX (mV/ms) % Reduction
Mean S.E.M. Mean S.E.M. Mean S.E.M.
0.2 mg/ml 7 0.079 0.020 0.069 0.018 -12.35 * 1.90
0.6 mg/ml 6 0.120 0.019 0.096 0.017 -22.18 * 4.17
2 mg/ml 23 0.130 0.005 0.061 0.004 -53.27 * 2.63
6 mg/ml 6 0.119 0.009 0.022 0.005 -80.98 * 5.00
TMYX n
TOP
Ctrl (mV) TMYX (mV) % Reduction
Mean S.E.M. Mean S.E.M. Mean S.E.M.
0.2 mg/ml 7 -40.58 1.71 -40.28 1.66 -0.68 0.87
0.6 mg/ml 6 -41.75 0.69 -41.67 0.52 -0.16 0.59
2 mg/ml 23 -40.50 1.22 -39.97 1.37 -1.41 0.37
6 mg/ml 6 -37.57 2.09 -37.54 1.95 +0.23 2.88
TMYX n
MDP
Ctrl (mV) TMYX (mV) % Reduction
Mean S.E.M. Mean S.E.M. Mean S.E.M.
0.2 mg/ml 7 -57.95 3.32 -57.87 3.58 -0.16 0.60
0.6 mg/ml 6 -60.27 0.83 -59.75 1.04 -0.88 0.79
2 mg/ml 23 -60.91 1.04 -60.19 1.04 -1.11 0.84
6 mg/ml 6 -61.36 1.89 -58.83 1.87 -4.07 1.59
TMYX n
APD50
Ctrl (s) TMYX (s) % Reduction
Mean S.E.M. Mean S.E.M. Mean S.E.M.
0.2 mg/ml 7 0.097 0.008 0.100 0.008 +3.60 * 01.53
0.6 mg/ml 6 0.090 0.005 0.098 0.007 +8.46 * 02.10
2 mg/ml 23 0.089 0.003 0.095 0.004 +6.50 * 0.87
6 mg/ml 6 0.083 0.002 0.104 0.007 +24.68 * 07.12
TMYX n
OS
Ctrl (mV) TMYX (mV) % Reduction
Mean S.E.M. Mean S.E.M. Mean S.E.M.
0.2 mg/ml 7 35.39 2.70 35.96 2.91 +1.28 1.47
0.6 mg/ml 6 33.29 2.75 34.47 3.08 +3.12 1.60
2 mg/ml 23 39.70 1.79 39.62 1.79 -0.13 1.01
6 mg/ml 6 37.82 2.20 38.52 1.68 +3.74 7.35
Table 2. AP parameters analyzed in control and in presence of different concentrations of
TMYX. Data are shown as mean ± S.E.M; n = number of cells. *, P < 0.05 vs. control (Student t-
test).
Page 49
48
Autonomic modulators interactions
We further proceeded to investigate the presence of interactions when the drug is perfused in
the presence of adrenergic β-agonist (isoprenaline, Iso 1 µM) and cholinergic (acetylcholine,
ACh, 0.01 µM) autonomic modulators. The concentrations were chosen in order to induce rate
changes of approximately 15-25 %, comparable to the range of frequency changes observed
with TMYX 2 mg/ml.
Data shown in fig. 28 demonstrate that TMYX exerts a slowing action regardless it is delivered
in the presence (-0.66 Hz ± 0.05, n=8) or absence (control, 0.82 Hz ± 0.08, n = 8) of isoprenaline
(table 3).
Fig. 28. Effect of TMYX 2 mg/ml in presence of autonomic modulators (isoprenaline 1 µM)..
Example time course of the rate (top) suggests the maintenance of slowing action of TMYX during
perfusion of Iso. Superimposition of AP traces (bottom, left) and bar graph of the percentage
reduction (bottom, right) shows a not different rate reduction induced by TMYX in control (0.82 Hz
± 0.08, n=8) and in presence of Iso (-0.66 Hz ± 0.05, n=8), P > 0.05, Student t-test.
Page 50
49
Rate (Hz) n Mean S.E.M. % Reduction Δ Reduction (Hz)
Mean S.E.M. Mean S.E.M.
Control 8 3.33 0.15 -25.04 * 2.90 -0.82 0.08
TMYX 2 mg/ml 8 2.51 0.17
Isoprenaline 1 µM 8 3.97 0.08 -16.75 * 1.29 -0.66 0.05
TMYX 2 mg/ml + Iso 1 µM 8 3.31 0.17
Table 3. Effect of TMYX on rate during isoprenaline experiments. Data are shown as mean ±
S.E.M; n = number of cells. *, P < 0.05 vs. control (Student t-test).
The same type of behaviour (maintenance of the effect) can be observed also in the presence of
muscarinic stimulation. When TMYX is delivered in the presence of ACh 0.01 µM, its slowing
action is preserved (fig. 29). Mean data analysis indicates that the reduction of rate (ΔHz)
induced by TMYX perfusion is similar between control condition (-0.68 ± 0.03 Hz, n=6) and
in the presence of ACh 0.01 µM (-0.80 ± 0.10 Hz, n=6) (table 4).
Fig. 29. Effect of TMYX 2 mg/ml in presence of muscarinic stimulation (acetylcholine 0.01
µM). Example time course of the rate (top) suggests the maintenance of slowing action of TMYX
during perfusion of ACh. Superimposition of AP traces (bottom, left) and bar graph of the
percentage reduction (bottom, right) shows a not different rate reduction induced by TMYX in
control (-0.68 ± 0.03 Hz, n=6) and in presence of ACh (-0.80 ± 0.10 Hz, n=6), P > 0.05, Student t-
test.
Page 51
50
Rate (Hz) n Mean S.E.M. % Reduction Δ Reduction (Hz)
Mean S.E.M. Mean S.E.M.
Control 6 2.99 0.13 -22.89 * 1.76 -0.68 0.03
TMYX 2 mg/ml 6 2.32 0.14
Acetylcholine 0.01 µM 6 2.09 0.16 -37.66 * 2.92 -0.80 0.10
TMYX 2 mg/ml + ACh 0.01 µM 6 1.29 0.10
Table 4. Effect of TMYX on rate during acetylcholine experiments. Data are shown as mean ±
S.E.M; n = number of cells. *, P < 0.05 vs. control (Student t-test).
To verify whether the slowing action of TMYX depends on basal rate (rate-dependence), we
analysed the relationship between the rate decreases vs. basal rate. Sample AP traces in control
and after perfusion of TMYX 2 mg/ml are shown in fig. 30, left; the dot-plot on the right,
describes the correlation between the rate reduction (%) induced by TMYX 2 mg/ml and the
spontaneous frequency of APs before drug perfusion (Hz). As shown by the linear regression
analysis of the plot (line), TMYX-induced rate slowing is not significantly associated with basal
rate (n= 23; correlation coefficient r = 0.03).
Fig. 30. Rate-dependence. APs in control condition and after TMYX 2 mg/ml administration, left.
Linear regression of the rate in control and percentage of reduction, right. The linear regression
shows none rate-dependence of TMYX effect.
Page 52
51
If current
Data shown in figs 26 and 27 indicate a causative relation between the rate slowing produced
by TMYX and the decrease in the slope of the early diastolic depolarization; this observation
lead to the involvement of the If current, which is the main determinant of the EDD slope. We
therefore started to study the effect of TMYX (2 and 6 mg/ml) on the current using a double-
step protocol
TMYX induced a significant decrease of the steady-state current at -65 mV both at 2 mg/ml (-
20.9% ± 3.2, n= 9; P < 0.05 Student t-test) and at 6 mg/ml (-29.5% ± 4.6, n=5; P < 0.05 Student
t-test), but it also induced an increase of the current at -125 mV (2 mg/ml: +37.1% ± 6.2, n=9,
P < 0.05 Student t-test; 6 mg/ml: 145.7% ± 17.7, n=5; P < 0.05 Student t-test) as shown in fig.
31.
These results suggest a double effect induced by TMYX: a shift of activation curve and an
increase of If conductance.
Fig. 31. Effects induced by TMYX 2 and 6 mg/ml on If current. The double-step protocol shows
a dual action induced by the drug at both the concentrations; the significant reduction of If amplitude
at -65 mV suggests a shift of activation curve; while the significant increase at -125 mV suggests an
enhancement on If conductance.
The above observations were confirmed and quantified by analysing the mean activation curves
before and after the perfusion of TMYX drug at the concentration of 2 (data not shown) and 6
mg/ml (fig. 32, top).
Page 53
52
Fig 32. Effects of TMYX on activation curves and current/voltage relationship. Top, mean
activation curves in control and after TMYX 6 mg/ml perfusion. The drug induced a significant shift
of activation curve from -59.7 ± 4.2 mV to -70.0 ± 3.6 mV, n=6; P < 0.05, Student t-test.
Bottom, fully activated current/voltage (I/V) relationship measured before and after TMYX 6 mg/ml
perfusion. The drug led to a concentration-dependent increase of the slope conductance from 0.33 ±
0.05 to 0.39 ± 0.06, n=5; P < 0.05, Student t-test.
The experimental points were fitted by a Boltzmann function; half activation value (V½)
changes from -55.5 ± 2.1 mV in control to -62.3 ± 2.1 mV in presence of TMYX 2 mg/ml (n=4)
and from -59.7 ± 4.2 mV to -70.0 ± 3.6 mV in presence of TMYX 6 mg/ml (n=6); P < 0.05
Student t-test. TMYX thus induces the activation of the If current at more negative potentials
than control solution; TMYX 2 mg/ml produces a left shift of activation curve of 6.8 mV, while
TMYX 6 mg/ml shifts the curve of 10.3 mV.
We then evaluated the effect of TMYX 2 mg/ml (data not shown) and 6 mg/ml on the open
channel I/V relation (fig. 32, bottom). As calculated by linear fitting of data points, TMYX
caused a significant (P < 0.05, Student t-test) concentration-dependent increase of the
conductance (pA*pF-1*mV-1) from 0.46 ± 0.05 to 0.50 ± 0.04 (n=5), and from 0.33 ± 0.05 to
0.39 ± 0.06 (n=5), significant at both the concentrations.
To obtain the steady-state curve control and in the presence of TMYX 2 (data not shown) and
6 mg/ml, the activation curves were multiplied by the fully activated IV (fig. 33). From the
curve obtained with TMYX 6 mg/ml it can be appreciated that at potential ≥ -80 mV, and in
Page 54
53
particular at pacemaker potential, the net effect of TMYX is to reduce the If current due to the
quantitative prevalence of the negative shift, while, at voltage < -80 mV the increase of the
conductance prevails.
Fig 33. Combined effect of TMYX on If current. The curve obtained multiply the activation curve
and the I/V functions, shows that at potentials ≤ -80 mV the contribution of the shift induced by
TMYX 6 mg/ml is greater than the increment of conductance, and led to a reduction of current
amplitude respect to the control condition.
In-vivo experiments
To evaluate the effect of TMYX on heart rate we used an in-vivo model based on freely-moving
mice implanted with an ECG recording system.
We performed experiments using a concentration of TMYX similar to the half block value (Kd)
calculated in in-vitro experiments to study the effect of TMYX drug in intact mice.
The time course of HR shows that administration of TMYX induces the increment of heart rate
and reduces the heart rate variability for a period of about 4 hours; these effects are not present
in control mice treated with saline injection (fig. 34, top). Sample ECG recordings are shown
in bottom left panel. The bar graph shown in the bottom right part of fig. 34 reports mean HR
values calculated before and during saline or TMYX injection. The i.p. injection of TMYX 5
mg/g produced an increase of rate of 33.2 % (n = 3 mice), whereas control treatment with saline
solution (n = 2 mice), did not elicit significant changes in heart rate.
Page 55
54
Fig. 34. Effects of i.p. injection of TMYX in freely-moving mice. Top, representative time course
of the HR of a mouse treated with TMYX 5 mg/g, left, and saline solution, right. The black arrows
indicates the moment of the i.p. injection. The origin of the x-scale has conventionally been set to
the 0 and correspond to the 11:00 AM (TMYX) and 01:00 PM (control).
Bottom, left, correspondent ECG traces in control condition (grey arrow) and after drug injection
(green arrow).
The bar graph shows the mean values of the HR before (control) and after the injection of both
TMYX (n=3) or saline (n=2) solution. *, p < 0.05.
We next performed similar experiments except that administration of TMYX was performed
after complete autonomic pharmacological blockade; this approach allowed to study the effects
of the drug on the intrinsic heart rate in the absence of modulation of the two branches of the
nervous system (sympathetic and parasympathetic) so to mimic a condition similar to in-vitro
experiments.
Page 56
55
Fig. 35. Effects of TMYX after autonomic blockade in freely-moving mice. Representative
tachogram and correspondent sample ECG traces recorded in a mouse treated with TMYX, left; the
drug was injected 15 minutes after the complete block of the autonomic system (A+P). The origin
of the x-scale has conventionally been set to 0 and corresponds to 08:00 AM. Top, right, mean heart
rate values (n=3) obtained in control condition and during autonomic block before (A+P) and after
drug injection (A+P+TMYX). The bradycardic action on intrinsic heart rate is in agreement with the
effect of the drug observed on spontaneous activity of rabbit SA node cells (insert).
Representative time course of heart rate from one mouse is shown in fig. 35. The complete
pharmacological blockade, induced by i.p. injection of atropine (2 mg/kg) and propranolol (1
mg/kg), caused a stabilisation of heart rate at the value of about 550 bpm as previously reported
(D’Souza et al., 2014). We next administered (i.p. injection) TMYX 5 mg/g and observed the
onset of a deep bradycardia, with a reduction of 55.6 % of heart rate (n = 5). This protocol
allowed to verify the effect of TMYX on the intrinsic heart rate, and the observed reduction
was comparable to that measured in in-vitro experiments (fig 35, insert). The duration of this
Page 57
56
effect is variable from 5 to 14 hours, and during this period the heart rate variability was
completely removed.
No significant changes in heart rate were observed after the injection of saline solution (data
not shown).
These data indicate an increment of mean heart rate after complete pharmacological blockade,
suggesting a major contribution of parasympathetic system in normal condition; the deep
bradycardia induced by TMYX reflects the slowing effect on pacemaking observed during in-
vitro experiments.
These results suggest a relation between TMYX and autonomic nervous system. To better
define this behaviour, we tested the effect of TMYX after blocking either one arm or the other
of the sympahovagal balance. When TMYX was delivered after blockade of parasympathetic
nervous system, obtained by i.p. injection of atropine (fig. 36, top), a competitive antagonist of
the muscarinic acetylcholine receptors, the drug produced an effect similar to that observed
when TMYX was administered alone, that is an increase of heart rate of 33.6 % (n = 3).We then
proceeded by testing the effect of TMYX after blocking the sympathetic nervous system with
propranolol, a nonselective β-blocker (fig. 36, middle). In this condition the injection of TMYX
5 mg/g induced a deep bradycardia with a rate reduction similar to that observed with complete
autonomic blockade (-38.5 %, n = 3). To confirm the relation between TMYX and sympathetic
nervous system, we performed the same experiment inverting the order of the drug
administration and we observed similar results since the injection of propranolol after TMYX
caused a reduction of heart rate of 33.6 %, n = 2 (fig. 36, bottom).
Page 58
57
Fig. 36. Representative tachograms recorded in a mouse treated with (top) TMYX 15 minutes
after the administration of atropine (2 mg/kg); (middle) TMYX 15 minutes after propranolol
injection (1 mg/kg); (bottom) propranolol (1 mg/kg) 15 minutes after TMYX. The origin of the
x-scale has conventionally been set to 0 and corresponds to 08:00 AM. Mean heart rate values (n=3)
obtained in control condition and during atropine + TMYX injection (A) show an increment of heart
rate. The injection of TMYX, before or after propranolol produces a reduction of heart rate.
Page 59
58
4. INAPPROPRATE SINUS TACHYCARDIA
4.1. INTRODUCTION
HCN channels are a potential target of several mutations. Functional studies showed that all the
mutations investigated are associated with arrhythmic conditions (Milanesi et al., 2015; Verker
et al., 2015; DiFrancesco (2015); Verkerk et al., 2014). Most of these mutations are of the type
loss-of-function and they are associated with bradycardia (heart rate lower than 60 bpm),
usually an asymptomatic condition; however in some cases bradycardia can be symptomatic.
Inappropriate sinus tachycardia (IST) is a syndrome characterized by fast sinus rates at rest, or
sudden unjustified increase of rate with minimal physical activity, or both. IST is not defined
by a specific heart rate, but patients generally have resting sinus rate of more than 100 bpm and
average 24 hours heart rates of more than 90 bmp, that are not explained by physiologic
demands.
IST presents with a spectrum of symptoms including palpitations, weakness, fatigue, dizziness
or near syncope. As a result of physical exercise, the acceleration in rate is excessive, and heart
rate recovery is prolonged (Olshansky et al., 2013).
Whereas sinus tachycardia is a transient and reversible condition with an explainable cause and
a rate appropriate for the circumstance (i.e. caffeine ingestion, anxiety, deconditioning), IST is
a more long-standing problem that is not easy to explain.
The epidemiologic characteristics of IST are uncertain; generally the prognosis is benign,
because although patients have faster heart rates, the sinus frequency slows somewhat during
sleep and in various diurnal patterns (Rubenstein et al., 2010).
The diagnosis of IST is a critical point because is necessary to exclude specific physiological
and psychological triggers for appropriate sinus tachycardia (i.e. exercise, anxiety, panic
attacks, and pain). Also, several medical conditions can explain sinus tachycardia, for example
anemia, dehydration, pulmonary embolus, aortic or mitral regurgitation, myocardial infarction,
and other (Krahm et al., 1995; Marrouche et al., 2002).
The diagnosis of IST is made for exclusion and is based on persistent or recurrent sinus
tachycardia on 12-lead ECG, paying attention to the analysis of P wave morphological features:
(1) if the P-wave is the same or similar to that in normal sinus rhythm, IST is possible; (2) if
Page 60
59
tachycardia occurs gradually with postural change, a tilt-table test may indicate POTS (Postural
Orthostatic Tachycardia Syndrome); (3) if tachycardia is persistent and an underlying cause can
be determined, IST is not present; (4) in patients with generally persistent episodes for which
no cause can be determined, IST may be diagnosed (Olshansky et al., 2013).
Although the first cases of unexplained sinus tachycardia were described more than 60 years
ago, the exact mechanism(s) underlying IST remain poorly understood. Several studies indicate
that either excess sensitivity to sympathetic stimuli or blunted response to parasympathetic
activity may be involved. Other possible mechanisms include a global decrease in
parasympathetic tone, and an ectopic focus in the immediate vicinity of the sinus node (Still et
al., 2002). Before the present study no specific channelopathy is implicated in IST.
In this study we performed a genetic screening in patients with inappropriate sinus
tachyarrhythmias and found a glutamine-arginine substitution in the HCN4 gene at position
524. This aminoacid is located in the first portion of the A’ α-helix of the C-linker, a region
connecting the S6 transmembrane domain to the CNBD which functionally couples the binding
of the second messenger cAMP to channel activation (fig. 37). When the HCN4 channels are
assembled as a tetramer, these regions form a ring of positively charged aminoacids which
surrounds the internal mouth of the channel. The R524Q mutation acquires large importance
since it causes the substitution of a positive charged aminoacid with one uncharged.
Fig. 37. Spatial localization of the R524Q mutation. The C-linker includes 6 α-helices (A’ to F’),
and the cyclic nucleotide binding domain (CNBD) includes 4 α-helices (A, P, B, C). The mutation
R524Q (indicated by the red dot) is located in the first portion of the A’ α-helix of the C-linker
Page 61
60
4.2. MATERIAL AND METHODS
Including criteria
The criteria to include patients in our study were (1) symptomatic mean resting heart rate ≥ 95
bpm during the daytime hours of 24 hours Holter monitoring; (2) rapid stable symptomatic
increase in resting HR > 25 bpm when moving from a supine to a standing position or in
response to biological stress (Cappato et al., 2012).
Genomic DNA analysis and mutagenesis
All the genetic analysis were performed after obtaining the written informed consent. The
coding sequence of the hHCN4 gene was amplified by PCR starting from genomic DNA
extracted from whole blood or saliva (Puragene Blood Kit, Qiagen). The primers were designed
to amplify DNA fragments of 149 to 395 bp in order to screen all the coding portion of the
hHcn4 gene. The PCR reaction mixture included 100 ng of genomic DNA, 1 µM primers and
the FastStart Taq DNA Polymerase (Roche Diagnostics). The PCR cycling reaction consisted
of initial denaturation for 5 minutes at 95° C, and 30 cycles with denaturation of 30 s at 95° C,
annealing for 30 s at different temperature and extension for 30 s at 72° C.
The primers 5’TTCCCTCTCATCCACTGTCCC3’ (F), 5’GACCAATGTGCGGGTGCTCC3’
(R) were used to amplify exon 4 where the pathological mutation 1571g→a (R524Q) is located.
Analysis of the amplicons was carried out by Single-Strand Conformation Polymorphism
(SSCP). The presence of mutations was confirmed by DNA sequencing (Bio-Fab Research).
The mutation of interest was not identified in a group of 200 healthy subjects, and it allowed to
exclude the possibility of a DNA polymorphism.
For functional studies in both HEK293 cells and neonatal rat myocyte cultures the mutation
was incorporated into the pcDNA 1.1 vector (Clontech Laboratories) containing the hHCN4
cDNA sequence by means of a commercial kit (QuikChange® Site Directed Mutagenesis,
Agilent Technologies). The primers used were:
- 5’CTGGACTCCTCCCAGCGCCAGTACCAG3’ (F);
- 5’CTGGTACTGGCGCTGGGAGGAGTCCAG3’ (R).
Functional studies in HEK 293 cells
HEK293 cells were transiently transfected (FuGENE® HD Promega) with:
Page 62
61
- hHCN4 wild-type 0.8 µg (wt).
- hHCN4 R524Q 0.8 µg (homo).
- hHCN4 wild-type 0.4 µg and R524Q 0.4 µg (hetero).
For each condition we used 0.3 µg of GFP-containing plasmid (pmaxGFP, AmaxaBiosystems).
Only GFP-expressing cells were selected for patch-clamp analysis at room temperature. Patch
clamp analysis were performed 48-72 hours after transfection.
Whole-cell studies
Electrophysiological studies were carried out using an extracellular solution containing (mM):
110 NaCl, 30 KCl, 1.8 CaCl2, 0.5 MgCl2, and 5 HEPES-NaOH buffer (pH 7.4); 1 mM BaCl2,
2 mM MnCl2 were added to improve If dissection over other ionic components. Intracellular
solution contained (mM): 10 NaCl, 130 KCl, 1 egtazic acid (EGTA), 0.5 MgCl2, 2 ATP (Na
salt), 0.1 GTP (Na salt), 5 phosphocreatine, and 5 HEPES-KOH buffer (pH 7.2).
To understand differences between wt and mutant channels (homomeric and heteromeric
configurations) we analysed (1) If current densities, measured at the steady-state current
amplitude of each test potential and normalized to cell capacitance; (2) activation curves for
HCN4 currents obtained by activation and deactivation protocols and analysed by the
Boltzmann equation.
Inside-out macropatch studies
Solution used to perfuse the intracellular sides of the patches contained (mM): 130 mM K-
aspartate, 10 NaCl, 2 CaCl2, 5 EGTA-KOH, and 10 HEPES-KOH buffer (pH 7.2; pCa, 7).
Solution used in patch pipettes contained (mM): 70 NaCl, 70 KCl, 1.8 CaCl2, 1 MgCl2, 1 BaCl2,
2 MnCl2, and 5 HEPES-NaOH buffer (pH 7.4). The activation curves and the shifts induced by
cAMP were calculated as previously reported (DiFrancesco & Mangoni, 1994).
Briefly to investigate the action of cAMP on single If channel, patches were exposed in
sequence to a control solution, a solution containing cAMP 0.1 µM, and back to the control
solution, while single channel activity was recorded. The dose-response curves of cAMP-
induced shifts were analysed by the Hill equation. Each patch was exposed to cAMP only once.
The holding potential was -35 mV in all experiments.
Page 63
62
Functional studies in neonatal rat cardiac myocytes cultures
Neonatal ventricular myocytes were isolated from 2 days-old neonatal rats. The hearts were
quickly removed and placed in phosphate buffer solution (mM): (137 NaCl, 2.6 KCl,10
Na2HPO4, 2 KH2PO4, pH 7.4); the ventricles were isolated, cut into 2 mm x 2 mm pieces, and
placed in enzymatic solution (mM): 116.4 NaCl, 5.4 KCl; 1 NaH2PO4, 0.8 MgSO4, 5.5 Glucose,
20 Hepes, 0,4 mg/ml Pancreatin (Sigma), 136 U/ml Collagenase type 1 (Worthington), and
dissociated by mechanical agitation for 15 minutes at 37°C. At the end, the solution containing
the cells was centrifuged and kept on ice. The enzymatic dissociation procedure was repeated
5 times. Finally, the cells obtained were centrifuged, resuspended in the medium and plated in
a Petri dish containing DMEM/M199, 10% Horse serum, 5% Fetal Bovine Serum (FBS), 2 mM
L-Glutamine, 100 units/ml Penicillin, 0.10 mg/ml Streptomycin. Cardiomyocytes were
incubated 1 hour at 37°C in 5% CO2 for two times to remove contaminating fibroblast in the
cells culture.
Cardiomyocytes (~2*106) were transfected by electroporation with Rat Cardiomyocytes-
Neonatal Nucleofector® Kit (Lonza) as follows:
- hHCN4 wild-type 1.3 µg (wt);
- hHCN4 R524Q 1.3 µg (homo);
- hHCN4 wild-type 0.65 µg and R524Q 0.65 µg (hetero).
Cells were then plated at the density of 1*105 cells/ml onto gelatin-coated dishes filled with the
medium previously described and incubated at 37°C in 5% CO2. Only GFP-expressing cells
were selected for patch-clamp analysis at 35°C. Electrophysiological experiments were carried
out 36-60 hours after transfection.
Action potential studies
Action potentials were recorded from spontaneously myocytes superfused with normal
Tyrode’s solution. Patch pipette solution was the same used in HEK cells electrophysiological
experiments. For each AP cycle we analyzed the rate to find differences between wild-type and
homo/heteromeric HCN4 expression.
Current density and kinetics properties
The If current was recorded from single cells superfused with Tyrode’s solution to which BaCl2
(1 mM) and MnCl2 (2 mM) were added to improve If dissection over other ionic components.
As in HEK cells we analyzed (1) If current densities, measured at the steady-state current
Page 64
63
amplitude of each test potential and normalized to cell capacitance; (2) activation curves for
HCN4 currents obtained by activation and deactivation protocols and analyzed by the
Boltzmann equation cells, to understand differences between wt and mutant channels
(homomeric and heteromeric configurations).
Video detection of cell rate
During the video recording experiments, cells were kept in Tyrode’s solution at 35°C. The
experimental setup consisted of inversion microscope Nikon Eclipse TS100, camera Cohu DSP
3600, VirtualDub software. Only green myocytes expressing the GFP protein were selected for
the experiment. For each cells a 30 seconds-long video acquisition (acquisition rate 40 Hz) was
recorded and the offline analysis of rate (bpm) was calculated by measuring the time necessary
to have 10 complete beats (except for some wt myocytes transfected only with GFP since rate
was too slow and highly arrhythmic).
Page 65
64
4.3. RESULTS
R524Q mutation in a family with IST
The coding region of the cardiac pacemaker channel gene HCN4 was tested for the presence of
mutations in 48 patients affected by Inappropriate Sinus Tachycardia (four of whom with
familial history of IST). This screening identified the mutation 1571g→a in an adult female
(proband). The mutation generates the missense aminoacidic substitution R524Q in exon 4 of
one allele. Genetic analysis was then extended to 8 other members of the family and the
mutation was identified in three more adults and in one child (fig. 38 A).
The adults were affected by palpitations at baseline and anxiety, while the young girl was
asymptomatic.
Figure 38. HCN4 mutation associated with IST. (A) Pedigree of a family with IST (the arrow
indicates the proband). Red symbols indicate individuals with IST symptoms and/or unjustified
sinus tachycardia; dots indicate members of the family carrying the heterozygous mutation R524Q
(empty symbols are wild-type, grey symbol indicates a genetically unrelated individual). The twins
II-2 and II-3 are heterozygous. (B) 12-lead ECG recorded at baseline in the proband; the heart rate
is 103 bpm and the P wave is indicative of sinus node origin. (C) Time course of daytime heart rate
(from 8 AM to 9 PM) recorded in the proband during Holter monitoring; the mean rate was
98.5±14.2 bpm (mean ± SD). (D) Histogram of daytime R-R intervals recorded during Holter
monitoring.
Page 66
65
The clinical profile of the proband (II-4) was characterized by prolonged periods of
symptomatic sinus tachycardia (fig. 38 B), frequent palpitation at rest and/or during effort and
anxiety, orthostatic intolerance with syncope, reproducible dyspnea on effort limiting or
causing early termination of any physical activity, and lightheadedness. The patient had a mean
value of heart rate of 98.5±14.2 bpm, calculated with an ECG Holter-monitoring (from 8 am to
9 pm), fig. 38 C. The diagnosis of IST was performed after excluding other mechanisms
potentially causing compensatory tachycardia such as: structural heart disease, neuroendocrine
disorder, postural hypotension, fever, anaemia, pregnancy and medications.
In the proband’s mother (I-2) the presence of sinus tachycardia with resting heart rates in the
range of 100 bpm was confirmed by multiple ECG recordings carried out in 5 years period
(103.3 bpm in the ECG of fig. 39 A).
In the proband’s sister (II-1) the Holter monitoring revealed multiple phases of sudden
unexplained sinus tachycardia unrelated to physical activity during both day and night. She also
presented with orthostatic intolerance and lightheadedness; Holter monitoring revealed multiple
phases of sudden unexplained sinus tachycardia unrelated to physical activity during both day
and night (fig. 39 B).
The individual II-3 is an adult male with a history of recurrent syncope associated with binodal
dysfunction characterized by sinus bradycardia and phases of 1st and 2nd degree AV block (fig.
40 A,C). This individual presented several unexpected bursts of increasing heart rate at rest
(manifested with “warm-up” phases, characteristic of IST), suddenly interrupted by phases of
bradycardia (40 B,C), likely induced by a robust vagal discharge. These events were observed
during the day, but they were particularly frequent at night-time (fig. 40 C).
The proband’s daughter (III-1) is a healthy young girl who did not report specific cardiac
symptoms, but Holter monitoring revealed phases of anomalous tachycardia unrelated to any
physical activity or emotional stress.
The mutation R524Q was not identified in a group of 200 healthy subjects and we therefore
excluded the possibility of a DNA polymorphism.
Page 67
66
Figure 39. Episodes of unjustified sinus tachycardia recorded at rest from the proband’s
mother (I-2) and sister (II-1). (A) 12-lead ECG recordings at rest from the proband’s mother; the
mean heart rate was 103.3 bpm. (B) Stretches of Holter recording showing the occurrence in the
proband’s sister (II-1) of episodes of sinus tachycardia at rest during daytime (left, 111.5 bpm) and
night (middle, 94.3 bpm).
Page 68
67
Figure 40. ECG-Holter recordings from the proband’s brother (II-3). (A) Plot of heart rate
(from 8 PM to 9 AM) during Holter monitoring indicates that sinus rhythm was prevalently
bradycardic with several episodes of 2:1 AV block particularly during sleep. Arrows indicate
correspondence with enlargements in panels B and C. (B) Time course of heart rate (bottom) and
corresponding ECG recording (top) associated with symptomatic palpitation and anxiety at rest
during the day, as reported by the patient. (C) Time course of heart rate (bottom) and corresponding
ECG recordings (top) showing an episode of asymptomatic sinus tachycardia recorded at night
during sleeping (top, right). “Warm-up” events characterized by inappropriate sinus tachycardia
followed by sudden rate slowing are apparent in both panels.
Page 69
68
Functional analysis by heterologous expression in HEK293 cells
The initial part of the HCN4 C-linker, is an important region that connects the S6
transmembrane domain to the CNBD, responsible of the cAMP binding. In the tetrameric
channel assembly they form a ring of aminoacids positively charged which surrounds the
internal mouth of the channel (fig. 41). The R524 residue is located in the firs portion of the A’
α-helix of the C-linker, in proximity to the S6 domain.
Figure 41. Spatial localization of the R524Q mutation. (A) Schematic representation of the
topology of one HCN4 channel subunit. The C-linker includes 6 α-helices (A’ to F’), and the cyclic
nucleotide binding domain (CNBD) includes 4 α-helices (A, P, B, C). The red dot indicates the
approximate position of the mutation R524Q. (B) 3D model reconstruction of the human HCN4
channel C-terminal domain viewed from the membrane (left) and from the side (right). All 4 subunits
are shown as cartoon plots, two in dark and two in light orange. R524 residues in the C-linkers,
mutated to Q, are drawn as spheres. C-linker α helices of one subunit are labelled in the left panel.
The reconstruction is based on a previously published crystal structure of the HCN4 C-terminus
(PDB code 3OTF).
Page 70
69
HEK293 cells were transfected with wt and mutated hHCN4 channel cDNA to investigate by
patch-clamp analysis the kinetic properties of the respective channels.
Both channel types were expressed with similar efficiency; mean current densities measured at
-145 mV were: -50.7 ± 11.5 (n = 16), -56.5 ± 11.7 (n = 14), and -48.2 ± 6.9 pA/pF (n = 21) for
wt, heteromeric wt-R524Q and homomeric mutant R524Q channels, respectively (not
significantly different, P > 0.05).
However, we observed an increment in the availability curve of the If current caused by a
depolarizing shift of 4.2 mV in heteromeric wt-R524Q channels and of 7.6 mV in homomeric
mutant R524Q channels (fig. 42 A, top).
Figure 42. Wild type and mutated channel expression in HEK293 cells. (A) Mean activation
curves of HCN4 current measured in HEK293 cells in control (top) and in the presence of 10 µM
cAMP in the whole-cell pipette (bottom). Datapoints are means from n = 6-10 cells. V1/2 values from
Boltzmann fitting (full lines) are: -77.8, -73.6 and -70.2 mV (top) and -64.8, -65.3 and -65.6 mV
(bottom) for wild type (open circles), heteromeric wt-R524Q mutant (grey squares) and homomeric
Page 71
70
R524Q mutant channels (filled circles), respectively. All curves were significantly different in
control, but not in the presence of cAMP. Curves in the upper panel are replotted as broken lines in
the lower panel. (B) Mean V1/2 calculated from Boltzmann fitting of single-cell activation curves (n
= 6-10 cells). Values in the presence of cAMP are boxed. (C) Mean activation curves measured in
inside-out macropatches in absence of cAMP of wt, hetero- and homomeric channels (n = 7-9). (D)
Dose-response relationships of cAMP dependence of activation curve shift measured in inside-out
macropatches expressing wt, wt-R524Q and R524Q channels. Each datapoint is the average of 3-10
exposures. Parameters of Hill fitting of these curves are: Kd=1.67, 0.35 and 0.080 µM and h=0.55,
0.41, and 0.36 for wt, wt-R524Q and R524Q channels, respectively. Maximal shift was fixed to
Smax=11.9 mV for all curves. Top panels: sample inside-out traces in control (c), during perfusion
with cAMP (*) and upon return (r). Horizontal bar: 1 s; vertical bar: 20 pA.
The differences in the half-activation (V1/2) values of activation curves suggest the acquisition
of intrinsic new properties of mutant channels or differences in the sensitivity to basal
cytoplasmic cAMP. The cells exposition to a saturating cAMP concentration (10 µM) in the
whole-cell pipette solution, showed an overlapping of the activation curves of wild-type,
heteromeric wt-R524Q, and homomeric mutant R524Q channels. In this condition their V1/2
were not significantly different (42 A, bottom).
The cAMP-induced shift of V1/2 in wt channels (13.0 mV) had the expected size (Altomare et
al., 2003; Milanesi et al., 2006), while it was significantly reduced in wt-R524Q (8.3 mV) and
in R524Q channels (4.6 mV) (P<0.05; fig. 42 B).
Results obtained suggest a modified (increased) cAMP sensitivity of mutant channels; to
confirm this hypothesis we investigated the action of cAMP in inside-out macro patches. Mean
activation curves of wt, wt-R524Q and R524Q channels measured with a voltage ramp protocol
in a cAMP-free intracellular solution, indicated that the mutation did not modify the intrinsic
voltage dependence of channels in the absence of cAMP (fig. 42 C).
A cAMP concentration of 0.1 µM, on the other hand, was more effective on mutant than on wt
channels (fig. 42 D, top). The dose-response relationships of the V1/2 shift against cAMP
concentration for the three channel types (fig. 42 D, bottom) confirmed the higher cAMP
sensitivity of the mutant channels.
Page 72
71
R524Q mutant proteins increase automaticity in neonatal cardiac
myocytes
The data in fig. 42 show that R524Q channels respond more strongly to cAMP, and provide a
basis to predict an abnormally fast, β-adrenergic sensitive cardiac rhythm of patients carrying
the mutation. For a direct evaluation of the effects of the mutation on beating rate, we performed
functional analysis using an excitable cellular model. We transfected wt and/or mutant channels
into rat neonatal cardiac myocytes (Qu et al., 2001), fig. 43. Cardiomyocytes were co-
electroporated with wt and/or mutant channel cDNA and with GFPmax-containing plasmids to
allow for the identification of green cells. HCN4 channels were equally expressed in all groups
and mean current densities measured at -125 mV values were not significantly different: -39.4
± 8.2 (n = 6), -34.6 ± 6.6 (n = 6), and -37.6 ± 6.1 (n = 7) pA/pF for wt, wt-R524Q and R524Q
channels, respectively (P > 0.05); for comparison, cells expressing only the GFPmax had a
current density of -3.6 ± 0.8 pA/pF (n = 9; P < 0.05 vs. control).
Transfected cells acquired a constant, regular rate as previously shown (Qu et al., 2001), and
we compared their activity. Relative to wt (65.6 ± 3.7 bpm, n = 9), the mean spontaneous rate
was 34.7% (88.4 ± 9.0 bpm, n = 9) and 72.2% faster (113.0 ± 5.8 bpm, n = 10) in cells
expressing wt-R524Q and R524Q channels, respectively (P < 0.05; fig. 43 D). Video detection
measurements of rate contraction were also performed, and mean rates of 65.2 ± 5.4 bpm (n =
10) and 96.6 ± 9.3 bpm (n = 10, 48.2% acceleration) were measured from wt and R524Q-
channel expressing cells, respectively.
The faster spontaneous rate suggested the presence of a larger pacemaker current; the analysis
of the fractional current activation confirmed, as observed in HEK293 cells, the shift of the
mean activation curves to more positive voltages by 3.9 and 7.3 mV in wt-R524Q and R524Q
channels, respectively (fig. 43 C)
Page 73
72
Figure 43. Wild type and mutated channel expression in rat neonatal myocytes. (A) Sample
current and (B) free-running voltage traces recorded in cells expressing wt (left), wt-R524Q (middle)
and R524Q channels (right). Currents in (A) were measured during two-step protocols to the
voltages indicated. In (A) and (B): horizontal bar: 2 s and 1 s; vertical bar: 500 pA and 20 mV,
respectively. (C) Mean activation curves (n = 4-10 cells). V1/2 values from Boltzmann fitting
were: -74.8 (wt), -70.9 (wt-R524Q), and -67.5 mV (R524Q). (D) Mean spontaneous rates were 65.6
± 3.7 (n = 9), 88.4 ± 9.0 (n = 9), and 113.0 ± 5.8 bpm (n = 10) in cells expressing wt, wt-R524Q and
R524Q channels, respectively. All values are significantly different from each other (P < 0.05).
Page 74
73
5. DYNAMIC CLAMP
5.1. INTRODUCTION
The dynamic clamp (DC) technique consists of a variety of hardware and software
implementations used to create artificial conductances in excitable cells. It was introduced in
cardiac electrophysiology more than 30 years ago, when an analog circuit was used to
electrically connect two independent groups of cardiomyocytes, free of direct physical contact
(Scott et al., 1979). At the beginning of the ‘90s, DC was implemented by a coupling clamp
circuit, able to simulate intercellular electrical coupling through the gap junctions (Joyner et al.,
1991). Today it represents a standard tool of electrophysiology, used in a large variety of
experimental preparations to address different issues; in particular this is a common technique
in neurophysiology, but in the last years DC has acquired also interest in the cardiac cell
physiology research (Prinz et al., 2004; Goaillard and Marder, 2006; Wilders, 2006).
DC technique uses several basic configurations in cardiac cellular electrophysiology: coupling-
clamp, model-clamp, dynamic AP-camp, and cell-type transforming clamp.
The coupling-clamp configuration, for example, simulates intercellular electrical coupling
between myocytes through gap junctions. The current-clamp mode is used to record the
membrane potentials of both cells. Based on the difference between Vm1 and Vm2, and on a
virtual conductance G, the PC computes the coupling current IC, flowing from cell 1 to 2 in the
real-time (fig. 44).
The model-clamp configuration instead is used to simulate the presence of an additional
conductance on the cell membrane. In this case, a single isolated myocyte is involved in the DC
measurement and the Vm-dependent current Ix is injected into the cell (fig. 44). Generally, the
DC allows to alter the cellular conductance using the measured membrane potential to control
the amount of current injected into an excitable cell. (Sharp et al., 1993 a; Sharp et al., 1993 b).
An application of DC is the possibility to introduce into a cell any time- or voltage-dependent
conductance that has been described mathematically and can be simulated on a computer. For
a voltage-dependent conductance, the injected current is determined by a set of differential
equations that describe the voltage and the time dependence of the conductance.
In the DC setup used in the present study, a closed-loop control drives a current-clamp
experiment. In this configuration, a myocyte is injected with a current whose amplitude and
Page 75
74
dynamics are constantly recalculated by an electronic system based on a specific mathematic
model.
Even if the DC technique represents a standard tool of electrophysiology, several limitations
are present. For example DC duplicates the electrical but not the signal conduction
consequences elicited by specific ion currents. In particular with conventional electrode
solutions, the DC can simulate the electrical current from a set of ion channels, but it does not
reproduce the changes in intracellular ion concentration that normally are associated with the
gating of such channels.
The injected current enters the cell through the glass microelectrode rather than through the real
ionic channels, which makes the flow of current concentrated on a very specific spot of the
cellular membrane and not distributed on the population of the ion channels.
Errors may be introduced in the experiment by the limitations of the technical setup (i.e. time
lag between measuring voltage and applying the current based on that voltage), and by
inappropriate DC technique chosen for a specific experiment (i.e. non accurate mathematical
description of ionic current).
Fig. 44. Dynamic clamp configurations. Representation of the connection between cells, amplifier
and PC in coupling clamp (left) and model clamp (right) configuration.
Page 76
75
5.2. MATERIALS AND METHODS
Experimental setup
In this study we used a combination of traditional electrophysiological setup and an additional
hardware and software for the dynamic clamp.
This instrumentation consists of an amplifier (Axopatch 200B, Molecular Devices), set in
current clamp mode, that injects a stimulation current (Istim) and records cellular activity in the
form of membrane potential (Vm), fig. 45. The shape and intensity of Istim may be modified in
real-time through an input voltage signal (VCmd), using the external command. The amplifier’s
Vm and VCmd channels were connected to a data acquisition board, outfitted with a 16-bit
resolution analog I/O channels. The board was mounted in a PCI slot of a PC running the RT-
Linux Opertive System. The RTXI (Real-Time eXperiment Interface) software platform was
used to implement and run the dynamic clamp protocols.
The membrane potential Vm is acquired by the DAQ board input channel, then the specific
model for the stimulus current is updated and a new VCmd value is returned to pilot the
amplifier’s headstage current injection (Istim).
The updating process of the model-based current includes simple arithmetical operations and
the integration of an ordinary differential equation, formulated as a gating variable. The
forward-Eulero method was used for this task: between each Vm sampling step, 100 integration
steps are performed. The system update frequency was set to 1 KHz, performing these
operations every millisecond, much faster than the simulated process.
Since If a small current, the computed Vcmd was multiplied by a factor of 100 before analog
output. After digital/analog conversion, the signal was processed by a passive first-order circuit
to restore the correct level (100-factor attenuation) and for low-pass filtering. The cut-off
frequency of the smoothing filter was 40 Hz.
Either Vm and VCmd signals were also recorded by a PC running PCLAMP software. The APs
were analyzed with a customized software.
Page 77
76
Fig. 45. Experimental setup of dynamic clamp. It consists of a typical electrophysiological tools
combined with hardware and software for the dynamic clamp. Istim: stimulation current; Vm:
membrane potential; VCmd: command voltage.
Dynamic clamp protocols
Before starting the dynamic clamp protocols, it was necessary to evaluate the membrane
capacitance of each cell under examination. The estimated value was used to scale the injected
current amplitude and maintain the same current density regardless of the cell size.
Ivabradine
Two different mathematical models of If were tested: (1) Severi/DiFrancesco model (SDiF,
Severi et al., 2012), (2) Maltsev/Lakatta model (ML, Maltsev & Lakatta, 2009). These models
greatly differ for the intensity of If current reached during the slow diastolic depolarization
phase.
The IVA protocol consisted of 6 experimental steps: (1) it started with the acquisition of control
APs to evaluate basal pacemaking rate; when the AP frequency was stable, (2) 3 µM Ivabradine
was perfused. At this concentration, the drug reduced the rate of 65.9 ± 2.4 % (Bucchi et al.,
2002). The following step (3) was the injection of the synthetic current using the DC software
interface. The current value was computed in real time using one of the two models, and it was
scaled to 66% to reproduce the non-total channel block induced by Ivabradine. APs were
Page 78
77
recorded in this condition until pacemaking rate changes were detected, and then the current
injection was disabled. (4) Still in presence of Ivabradine perfusion, the current injection with
the second model was carried out. (5) Than the stimulation current was interrupted and finally
(6) ivabradine perfusion was stopped (fig. 46).
Fig. 46. Ivabradine protocol. (1) control conditions; (2) IVA 3 µM perfusion; (3) SDiF model
current injection; (4) ML model current injection; (5) IVA 3 µM perfusion; (6) control conditions.
Isoprenaline/Acetilcholine
Differently from the previous protocol, synthetic current effect and drug effect were evaluated
separately, with no direct superimposition in time. Based on the results obtained during
ivabradine experiments, only SDiF model was applied.
In this protocol (fig. 47), five experimental blocks were present; (1) after recording in control
condition, (2) a synthetic current was injected to mimic the autonomic modulation of If as
reproduced in experiments with isoprenaline and acetylcholine. The effect of isoprenaline on If
was modeled as positive shift of 7.5 mV (Zaza et al., 1996) and ACh as a negative shift of 4.95
mV (Zaza et al., 1996). Our custom software modules update in real-time the current and gating
kinetics equations of both a standard and a voltage-shifted If current, resulting in a differential
ΔIf value:
∆𝐼𝑓 = 𝐼𝑓,𝑆ℎ𝑖𝑓𝑡𝑒𝑑 − 𝐼𝑓,𝐶𝑜𝑛𝑡𝑟𝑜𝑙
After recording a sufficient number of APs, synthetic current injection was disabled, control
APs were acquired (3), and then real drug (isoprenaline/acetylcholine) was applied to compare
its effect on pacemaking rate with our simulated drug effect on If (4). Finally, we returned in
control condition (5).
Page 79
78
Fig. 47. Isoprenaline/Acetilcholine protocols. (1) Control conditions; (2) SDiF model current
injection (isoprenaline: +7.5 mV shift; acetylcholine: -4.95 mV shift); (3) control condition; (4)
drug perfusion (Iso 1 µM; ACh 0.01 µM); (5) control conditions.
Data processing and statistical analysis
Recorded traces for voltage and injected current were subject to 10-Points digital smoothing to
remove residual noise effects.
AP recordings were undersampled from 2 KHz to 500 Hz and exported in ASCII format for use
on custom software used to calculate pacemaking rate, MDP and the EDD slope.
For each protocol the average values of the described parameters were calculated in different
experimental conditions (control, current injection, drug application, etc.) and analyzed with
the ANOVA test for repeated measures (Geisser-Greenhouse adjustment) and Tukey-Kramer
test for multiple comparisons (NCSS 2007, Kaysville, Utah).
All data results are reported as Mean ± Standard Deviation (SD).
Page 80
79
5.3. RESULTS
Preliminary results on IVA Protocol
Preliminary dynamic-clamp experiments were carried out in order to understand which between
the Severi/DiFrancesco (SDiF) and Maltsev/Lakatta (ML) mathematic models is more accurate
to describe the electrical activity of SAN cells. Spontaneous activity of rabbit sinoatrial
myocytes was recorded in control condition and then ivabradine 3 µM was perfused; ivabradine
caused a significant rate reduction of 20.6% (P < 0.05) from 2.77 ± 0.38 Hz (control condition)
to 2.20 ± 0.17 Hz (Iva), in agreement with values reported in the literature (-23.8 ± 3.9, Thollon
et al 1994, -16.2 ± 1.5, Bucchi et al. 2007 a).
The If conductance was scaled up by 66% of the nominal value and injected into the cell so to
compensate for the non-total channel block caused by ivabradine (-65.9 ± 2.4%, Bucchi et al.,
2002). The injection of this SDiF66 synthetic current increased the average pacemaking rate
from the ivabradine level to almost the control value (2.70 ± 0.27, not significantly different
form control), whereas the injection of ML66 current only induced a smaller recovery (2.39 ±
0.30, P < 0.05 significantly different from control), fig. 48.
Figure 48. Mean pacemaking rate in control condition, during Iva 3 µM perfusion, and after
injection of SDiF66, ML66, SDiF100, ML100 synthetic current (n=9). Mean ± SD, *, P < 0.05 vs.
control.
Page 81
80
We performed an additional test using 100% of If conductance, equivalent to the injection of
the total calculated synthetic If current. Injection of SDiF100 synthetic current also restored the
control pacemaking rate (2.80 ± 0.28, not significant different from control), while injection of
ML100 synthetic current produced a lower increment (2.36 ± 0.25, P < 0.05 significantly
different from control).
Based on these results, we choose to adopt the SDiF model as the mathematical basis for shift
calculations in the Iso/ACh experiments.
Rate-adaption of Dynamic Clamp for cell-specific experiments
Preliminary experiments with the ACh protocol showed in some cells a rapid hyperpolarization
and an excessive rate reduction after the injection of the synthetic current ΔIf. This caused the
complete inhibition of pacemaking in some cases; we defined this cell behaviour “unstable”
(fig. 49).
Figure 49. Negative shift induced by ACh protocol produced a complete block of spontaneous
activity in “unstable” cells. Effect of synthetic negative shift on the potential (top) and current
(bottom).
Page 82
81
To better tune our mode we introduced an additional scaling factor which was computed based
on evidence that it is possible (for a reasonable frequency range) to map the relation between
maximum If conductance (gf) and the pacemaking frequency. The scaling factor was used to
calculate the output synthetic current. At the beginning of each test the program measured
control cycle length (CL) and return a proportional g-scale factor that was used to calculate the
cell-specific conductance of the If current (fig. 50).
Figure 50. Effect of If conductance scaling on SDiF and ML model pacemaking rate. Behavior
of the SDiF model (red points) was fitted with an empirical equation to obtain a scaling computation
equation (black line). Behavior of the ML model is also reported (blue points)
Ivabradine results
The data obtained with the rate-adapted DC after perfusion of Ivabradine were fully consistent
with the preliminary ones. The application of Iva 3 µM significantly reduced the pacemaking
rate (fig. 51, left), which was completely restored by the injection of the SDiF66 synthetic
current, while the injection of the ML66 current did not produce significant rate recovery.
We then analysed the slope of the early diastolic depolarization (EDD) and verified that it was
restored by injecting the SDiF66 and SDiF100 current, whereas ML66 and ML100 did not elicit
significant differences (fig. 51, right). No significant differences were also found among the
MDPs of all groups.
Page 83
82
Even though differences in the TOP values were statistically significant, it can be noticed from
table 5 that they are very small in amplitude (always less than 2 mV).
Group Rate [Hz] MDP (mV) EDD (mV/ms) TOP (mV)
Control 2.91 ± 0.37 -64.6 ± 2.4 0.0737 ± 0.0215 -45.1 ± 3.6
IVA 2.34 ± 0.37 *** -64.0 ± 2.6 0.0418 ± 0.0127 *** -45.9 ± 4.5
SDif66 2.76 ± 0.34 -63.7 ± 2.5 0.0706 ± 0.0103 -43.9 ± 4.0 **
SDif100 2.87 ± 0.36 -63.5 ± 2.3 0.0795 ± 0.0133 -44.0 ± 3.6 **
ML66 2.40 ± 0.34 *** -64.1 ± 2.1 0.0464 ± 0.0122 *** -45.6 ± 4.2
ML100 2.46 ± 0.35 *** -64.0 ± 2.3 0.0478 ± 0.0125 *** -45.5 ± 3.9
Table 5. Numeric results for the IVA experiment. ***, P < 0.001; **, P < 0.01.
Figure 51. Effects of IVA protocol on pacemaking rate and EDD. Left, The reduction induced
by IVA 3 µM was completely restored by injection of synthetic current using both SDiF66 and
SDiF100 model. Whereas the ML66 and ML100 models were not able to restore the original rate.
Right, the effect of DC models on EDD reflected the results on the rate. *** P < 0.001 vs. control;
n = 7.
In fig. 52 a representative time course of rate (left) and sample APs traces (right, top) are shown.
The perfusion of Iva 3 µM caused a rate-reduction that was completely restored by SDiF66 but
not by MF 66 synthetic current injection. The superimposition of the APs traces (black: control;
Page 84
83
gray: Iva; green: SDiF66; blue: ML66) indicates the reduction of the steepness of EDD induced
by Iva and the restore produced only by SDiF model.
Figure 52. Example of IVA protocol on APs. Left, time course of the rate during different phases
of the IVA experiment. Right upper, superimposed AP traces for control (black), ivabradine (gray),
SDiF66 model (green), and ML66 model (blue). Right lower, corresponding current injection traces.
Isoprenaline results
Figure 53. Effects of Iso protocol on pacemaking rate and EDD. Variations of pacemaking rate
(left) and EDD (right) induced by injection of synthetic current (positive shift), and isoprenaline
perfusion. ** P < 0.01 vs. control; § P < 0.01 vs. Iso; n = 6.
Page 85
84
Group Rate (Hz) MDP (mV) DD1 (mV/ms) TOP (mV)
Control 2.46 ± 0.47 -64.8 ± 3.0 0.0666 ± 0.0209 -44.5 ± 5.2
Shift +7.5 mV 2.92 ± 0.62 ** § -64.1 ± 3.3 0.102 ± 0.041 ** -42.7 ± 5.5
Iso 1 µM 3.43 ± 0.31 ** -63.9 ± 3.3 0.114 ± 0.023 ** -45.7 ± 5.3
Table 6. Numeric results for the Iso experiments. ** P < 0.01 vs. control; § P < 0.01 vs. Iso
We then proceeded to verify whether the SDiF model could reproduce the effect of isoprenaline
stimulation of cell rate. In particular using the SDiF model we calculated the synthetic If current
predicted by the model based on an isoprenaline-induced shift of the If current by +7.5 mV.
This injection led to a significant increment of 18.7% of the pacemaking rate (P < 0.01 vs.
control), fig. 53. This rate increase was compared with the real one obtained by perfusing the
cell with Iso 1 µM and the acceleration of AP rate was 34.9% (P < 0.01 vs. control). The
pacemaking rate during current injection was significantly different from control, but it was
also significantly different from the value under real Iso drug (P < 0.01).
MDP was statistically different between two groups (P < 0.05) but the maximum difference is
less than 1 mV. During the application of either SDiF synthetic current and real Iso, an increase
in EDD was observed (P < 0.01), but no significant difference between the two conditions were
found, fig. 53. During Iso perfusion, TOP was more negative than after synthetic current
injection (P < 0.01).
Figure 54. Example of Iso protocol on APs. Left, time course of the rate during different phases
of the Iso experiment. Right upper, superimposed AP traces for control (black), shift +7.5 mV (gray),
and isoprenaline (blue). Right lower, corresponding current injection traces.
Page 86
85
Time course of rate (fig. 54) indicates a lower effect induced by synthetic current than real
application of Iso. The AP traces superimposition allows to appreciate the increment of EDD
steepness induced by both SDiF model current and Iso 1 µM.
Acetylcholine results
Figure 55. Effects of ACh protocol on pacemaking rate and EDD. Variations of pacemaking rate
(left) and EDD (right) induced by injection of synthetic current (negative shift), and acetylcholine
perfusion. *** P < 0.001 vs. control; § P < 0.05 vs. ACh; n = 6.
Group Rate (Hz) MDP (mV) DD1 (mV/ms) TOP (mV)
Control 2.98 ± 0.72 -62.6 ± 3.9 0.0795 ± 0.0135 -41.9 ± 2.6
Shift -4.95 mV 2.62 ± 0.64 *** § -63.2 ± 3.7 0.0599 ± 0.0095 ** -43.0 ± 3.0
ACh 2.37 ± 0.64 *** -62.7 ± 4.3 0.0560 ± 0.0141 ** -41.2 ± 3.7
Table 7. Numeric results for the ACh experiments. *** P < 0.001 vs. control; § P < 0.05 vs. Ach
Similar experiments as those described for Iso were also performed to study the effect of ACh
modulation of rate mediated by modulation of the If current. The injection of the synthetic
acetylcholine shift (-4.5 mV) simulated with the SDiF model led to a rate reduction of 12.1%,
whereas the perfusion of real ACh produced a higher slowing effect (-20.2%) comparable with
reported literature values (20.8 ± 3.2 %, Bucchi et al., 2007 a). The pacemaking rate during
Page 87
86
current injection was significantly different both from control and from the value under real
ACh drug (P < 0.05), fig. 55.
A reduction in EDD was observed between control value and SDiF synthetic current (P <
0.001). EDD also decreased when real ACh was applied (P < 0.001 vs. control) with no
significant difference between the two conditions, fig. 55. No significant difference was found
between groups in MDP and TOP.
Time course of the rate (fig. 56) indicates a lower effect induced by synthetic current than real
application of ACh. The AP traces superimposition allows to appreciate the decrease of EDD
steepness induced by both SDiF model current and ACh 0.01 µM.
Figure 56. Example of ACh protocol on APs. Left, time course of the rate during different phases
of the ACh experiment. Right upper, superimposed AP traces for control (black), shift -4.5 mV
(gray), and acetylcholine (blue). Right lower, corresponding current injection traces.
Page 88
87
6. DISCUSSION
During my Ph.D. I investigated the physiopathologic and pharmacologic role of the If current
in the sinoatrial node region. I carried out three separate type of experiments: 1)
pharmacological control of the current operated by a drug used in the traditional Chinese
medicine, 2) analysis of the effect of a HCN4 channel mutation associated with IST, and 3) use
of the dynamic-clamp approach to evaluate the quantitative contribution of the current.
My experiments confirm through independent and separate approaches that any alteration of
the amount of the If current flowing during the diastolic depolarization leads to robust effect on
automaticity of the SA node.
Although the results have been presented according to the chronological order of experiments
during my Ph.D. here I prefer to discuss these data in a more logic order. I will start from the
dynamic clamp experiments since they shed light on the physiological quantitative aspects of
the current contribution to SA nide activity, and I will then discuss the patho-genetic finding
and the pharmacological modulation.
Using an indirect approach based on mathematical models of SA node action potential, we
studied the contribution of If current in the pacemaking. In the last years many models that
describe the electrical behavior of SA node AP cells have been developed; among these models
we chose to compare the models developed by Maltsev & Lakatta (2009) and by Severi-
DiFrancesco (2012) with the dynamic-clamp approach. The ML model is based on the
implementation of the interactions between intracellular calcium handling and membrane
currents while the Severi-DiFrancesco formulation places a stronger focus on the role of the If
current. So these two models attempt to describe the SA node automaticity although they place
a different quantitative contribution to the If current. The SDiF model is associated with a higher
contribution of If current during the diastolic depolarization, while the ML formulation leads to
a smaller role of If in this phase. The experiments were therefore carried out with the specific
aim to evaluate which of this model performs better since the dynamic-clamp approach allows
to estimate amount of the If current flowing in a SAN cell as predicted by each of the two
models. We then experimentally modified the real current by means of ivabradine and
Page 89
88
substituted the delta current induced by this agent with synthetic currents calculated from the
models. The synthetic delta currents were theoretically calculated from the models, but they
were really injected into the cells to substitute for the currents variations induced by ivabradine.
The synthetic current (SDiF or ML) that more properly compensate for ivabradine induced
current reduction and therefore restores proper cell pacemaker rate (i.e the rate before agents
were delivered) will therefore define which of the two models is more quantitative correct in
identifying the amount of If flowing during diastole.
We used used ivabradine (3 µM) which should block about 66% of the physiological If current
in rabbit sinoatrial node cells (Bucchi et al., 2002).
Results of the injection of synthetic currents show that the SDiF synthetic current is able to
restore the original pacemaking rate of the cells, while the ML-based current not.
These data confirm the importance of the If current (and HCN channels) in SA node region, and
validate the SDiF model thus suggesting that its quantitative formulation of the If current is
appropriate.
Once the SDiF model was validated we moved to investigate the importance of If current in
autonomic modulation by repeated the same protocol approach this time using isoprenaline as
the mechanism causing If changes.
The injection of SDiF synthetic current miming the positive shift induced by isoprenaline 1 µM
on If current, causes a +18.7% increase in pacemaking rate versus +39.4% effect observed
during real isoprenaline administration. We interpreted this result considering that real
isoprenaline affects other ionic current in addition to If, while our protocols only reproduce the
effects on pacemaker current. This interpretation is confirmed by analysis of EDD (fig. 53),
where no differences in the steepness are observed between real Iso and synthetic current
injection, underlying that their effect on EDD is the same. This is in accordance with the work
of Bucchi and colleagues (Bucchi et al., 2007 a) where it is demonstrated that the If current is
responsible for pacemaking rate modulation in the EDD phase, while in late diastolic
depolarization other mechanisms are involved.
Similar results were obtained during acetylcholine experiments, where the rate reduction
induced by synthetic current is lower than the one produced by real drug (-12.1% vs. -20.2). No
differences in EDD steepness were observed in either the conditions, confirming the main
contribution of If to this phase (fig. 55).
Given the importance of the If current in the pacemaker process, it is important to study how
mutations in HCN4 channel alter the If contribution in cardiac rate. Mutations on HCN channels
Page 90
89
have long been associated with arrhythmogenic conditions; however, until today, all these
mutations are of the loss-of-function type and are associated with bradycardia (Milanesi et al.,
2015; Verkerk et al., 2015; DiFrancesco, 2015).
We found family members affected by inappropriate sinus tachycardia (IST), carrying the
mutation R524Q. IST is a syndrome that causes unexpectedly fast sinus rate at rest, with
minimal or no physical activity. The spectrum of symptoms of IST includes palpitations,
weakness, fatigue, dizziness, or syncope (Olshansky et al., 2013).
IST is not defined by a specific heart rate, but patients generally have resting daytime sinus
rates of more than 100 bpm and average 24-h heart rates of more than 90 bpm, that are not
caused by physiologic demands or conditions known commonly to increase heart rate.
In IST no one therapy reduces heart rate and symptoms in complete and efficient manner; β-
adrenergic blockers, even at high doses, generally are ineffective and tend to be associated with
other symptoms. Other treatments (i.e. fludrocortisone, volume expansion, pressure stockings,
phenobarbital, clonidine, psychiatric evaluation, and erythropoietin) have been suggested, but
may be harmful and have not been proven (Still et al., 2002). Furthermore, patients resistant to
conventional treatments respond successfully to ivabradine, a specific inhibitor of the If current
(Cappato et al., 2012; Calo et al., 2010; Romeo et al., 2011; Zellerhoff et al., 2010; Femenia et
al., 2012).
No specific channelopathy implicated in IST have been described before my study; indeed here
I report the first evidence of a heterozygous gain-of-function mutation in the HCN4 channel
associated with IST.
The position of the HCN4 mutation is crucial for the biophysical properties of the channel.
Residue R524Q is located in the first α-helix (A’) of the C-linker, a stretch of 81 residues
connecting the cytoplasmic end of the S6 segment to the CNBD. This region acquired large
importance since functional studies of mHCN2 channels have shown that C-linkers is involved
in the cAMP-induced modulation (Zagotta et al., 2003; Craven et al., 2004; Craven et al., 2008).
The mutation R524Q causes the substitution of the positively charged arginine with the polar,
uncharged glutamine in the residue 524, and it is involved in the change of electrical charge
distribution in the C-linker.
Page 91
90
No differences in the intrinsic voltage-dependence of channel activation were observed between
R524Q and wild-type channels. cAMP sensitivity was instead different: the dose-response
curves for cAMP induced shift of the activation curves show that the half-maximal cAMP
concentration decreased of about 4.6-fold (from 1.67 to 0.35 µM) in heterozygous wt-R524Q,
and of more than 20-fold (from 1.67 to 0.08 µM) in homozygous R524Q mutant channels when
compared to WT channels (1.67 µM).
Our data show an increment of cAMP sensitivity in the R524Q mutated channels, that results
in a right shift of the activation curve, miming the effect of β-adrenergic stimulation.
In according to the results observed in HEK cells, newborn ventricular myocytes show a faster
pacemaking rate when transfected with mutant rather than wild-type channels.
Our study represents the first evidence of a gain-of-function mutation in hHCN4 associated
with IST, because it generates a condition where the pacemaker channel is in a permanent state
of higher activation than normal channel, resulting in an increment of cardiac pacemaking. Our
results allow to explain the faster intrinsic heart rate and the hypersensitivity to sympathetic
stimulation, conditions tipical of IST. Finally, the data also explain the efficacy of the
ivabradine treatment of IST condition observed during clinical practice.
The pharmacological research of agents able to reduce sinus heart rate has a strong interest for
the treatment of ischemic heart disease, because myocardial ischemia represents one of the most
common cause of death in the Western world and determines high morbidity, due to irreversible
myocardial damage, produced by an imbalance between oxygen supply and demand.
The classical pharmacological approach to reduce heart rate is the use of β-blockers which are
a class of agent able to antagonize the effect of adrenergic stimuli on β-receptors. Unfortunately,
in addition to the desired bradycardic effects these agents also have several undesired side
effects on the cardiovascular system and therefore in some cases are not tolerated by the
patients. To overcome this limitation in the course of the years there has been an intense
investigation aiming at identifying novel
Pharmacological agents able to specifically act only on SAN rate: these class of substances has
been named “specific bradycardic agents” (Kobinger & Lillie, 1987). To date ivabradine is the
sole specific bradycardic agent the has reached the clinic; ivabradine is a specific blocker of the
If current and as such it modulates the steepness of the diastolic depolarization in SA node
Page 92
91
myocytes, without altering action potential duration or causing negative inotropy (DiFrancesco
& Borer, 2007).
Recently several compounds of TCM have acquired importance in the Western world for their
therapeutic properties. For example, berberine (JKL1073A) and Wenxin Keli have important
cardiovascular effects in the treatment of cardiac arrhythmias (Chiou et al., 1991; Bova et al.,
1992; Chi et al., 1996; Burashnikov et al., 2012).
In this research project, we investigated TMYX drug, currently used in China for the treatment
of cardiac disease, like cardiac regulator of both brady- and tachy-cardia. TMYX is a mixture
of different substances amongst which liquorice. Liquorice derives from root extract of
Glycyrrhiza glabra, a perennial herb cultivated in temperate and subtropical regions. Since
ancient times, liquorice roots were used in traditional herbal medicine for the treatment of many
disease (Armanini et al., 2002; Fiore et al., 2005). Only in the last 25 years the effects of
Glycyrrhiza compounds have been scientifically investigated, confirming the knowledge
acquired during history; for example liquorice constituents exhibit several biological and
endocrine properties including anti-inflammatory (cortisol-like), antihepatotoxic, antibacterial,
antiviral, and anticancer effects (Aly et al., 2005; Lee et al., 2009; Fiore et al., 2008; Hibasami
et al., 2005); in addition they possess cardioprotective properties and modulate cardiac
performance in Langendorff perfused rat heart, increasing heart rate (Parisella et al., 2012).
Our experiments show that TMYX acts as a dose-dependent rate-lowering agent in rabbit SA
node cells. Based on the dose-response curve of the rate (fig. 26), I intend focus the discussion
on the 2 mg/ml concentration because it produces a rate reduction similar to that caused by
ivabradine 3 µM (23.6% vs. 24%, Bucchi et al., 2007 a), a bradycardic agent recently approved
by European Evaluation Agency in the treatment of angina pectoris and heart failure (Borer et
al., 2003; Swedberg et al., 2010).
At this concentration the prolongation of APD50, an important parameter to verify the safety
of bradycardic agent (Thollon et al., 1994; Bois et al., 1996; Savelieva et al., 2006), is 6.5%, a
value lower than ivabradine (8.9%, Thollon et al., 1994). At higher concentrations, for example
6 mg/ml, the prolongation of APD50 (+24.7%) combined with the strong reduction of the rate
(-51.6%), produces a strongly arrhythmogenic substrate. Indeed it is known that ventricular
tachyarrhythmia (torsades de pointes) occurs more frequently when the cardiac rate is slow and
the duration of action potential is prolonged (Damiano & Rosen, 1984).
At first we demonstrated that percentage of bradycardic effect produced by TMYX is
independent from cardiac rate and therefore no use-dependence is present (fig. 30).
Page 93
92
Furthermore, the TMYX-dependent rate reduction is not influenced by autonomic modulators
(isoprenaline and acetylcholine); this finding therefore suggests that TMYX and the neuro-
modulators act with two different mechanisms.
The EDD reduction observed during current-clamp experiments suggests an effect of TMYX
on If current. Interestingly, at the 2 mg/ml concentration (where the rate reduction is similar
between TMYX and ivabradine) the blockade on the If current induced by TMYX results lower
(20.9%) than ivabradine (~60%) (Bucchi et al., 2007 b).
The patch-clamp experiments on the If current show a dual effect induced by TMYX (fig. 31),
a left shift of the activation curve and an enhancement of the current at the higher (not
physiological) potential. In fact the activation curve and I/V function combined curve (that is
the strady-state IV curve) suggests that at physiological potentials ≤ -80 mV, the contribution
of the shift induced by TMYX is greater than the increment of the conductance, and leads to a
reduction of current amplitude respect to the control condition.
Single cell electrophysiological data were then complemented by experiments on freely-
moving mice implanted with an ECG transmitter.
Preliminary experiments surprisingly show an increment of heart rate after the i.p. injection of
TMYX; however when TMYX was delivered during pharmacological blockade of only
sympathetic or both sympathetic and parasympathetic autonomic system branches we observed
a deep bradycardia.
These data thus confirm that when intrinsic heart rate is considered (i.e. during autonomic
block) the pacemaking reduction observed is in agreement with data obtained in-vitro.
The increase in rate observed in intact animals is still unexplained. At first one could argue that
increase of heart rate could be caused by the baroreflex, although this is possible, it remains
obscure why in in-vitro experiments maximal adrenergic activation obtained by 10 µM
isoprenaline in the presence of TMYX does not produce a net tachycardic action, although it
partly reverses the bradycardic action of the drug.
Page 94
93
7. BIBLIOGRAPHY
Accili EA, Proenza C, Baruscotti M, DiFrancesco D (2002)
From funny current to HCN channels: 20 years of excitation.
News Physiol Sci;17:32-7.
Altomare C, Bucchi A, Camatini E, Baruscotti M, Viscomi C, Moroni A, DiFrancesco D (2001)
Integrated allosteric model of voltage gating of HCN channels.
J Gen Physiol;117(6):519-32.
Altomare C, Terragni B, Brioschi C, Milanesi R, Pagliuca C, Viscomi C, Moroni A, Baruscotti M, DiFrancesco D
(2003)
Heteromeric HCN1-HCN4 channels: a comparison with native pacemaker channels from the rabbit
sinoatrial node.
J Physiol;549(Pt 2):347-59. Epub 2003 Apr 17.
Aly A, Al-Alousi L, Salem HA (2005)
Licorice: A possible anti-inflammatory and anti-ulcer drug
AAPS PharmSciTech. Volume 6, Issue 1, pp E74-E82
Anderson NH, Devlin AM, Graham D, Morton JJ, Hamilton CA, Reid JL, Schork NJ, Dominiczak AF (1993)
Telemetry for cardiovascular monitoring in a pharmalogical study: new approaches to data analysis.
Hypertension;33(1 Pt 2):248-55.
Anderson RG (1998).
The caveolae membrane system.
Annu. Rev. Biochem. 67: 199–225.
Anumonwo JM, Delmar M, Jalife J (1990)
Electrophysiology of single heart cells from the rabbit tricuspid valve.
J Physiol (Lond);425:145-167
Armanini D, Fiore C, Mattarello MJ, Bielenberg J, Palermo M (2002)
History of the endocrine effects of licorice.
Exp Clin Endocrinol Diabetes;110(6):257-61.
Arras M, Rettich A, Cinelli P, Kasermann HP, Burki K (2007)
Page 95
94
Assessment of post-laparotomy pain in laboratory mice by telemetric recording of heart rate and heart rate
variability.
BMC. Vet. Res. 3, 16
Barbuti A, Gravante B, Riolfo M, Milanesi R, Terragni B, DiFrancesco D (2004)
Localization of pacemaker channels in lipid rafts regulates channel kinetics.
Circ Res;94(10):1325-31. Epub 2004 Apr 8.
Barbuti A, Terragni B, Brioschi C, DiFrancesco D (2007)
Localization of f-channels to caveolae mediates specific β2-adrenergic receptor modulation of rate in
sinoatrial myocytes.
J. Mol. Cell Cardiol. 42:71–78
Baruscotti M, Bucchi A, DiFrancesco D (2005)
Physiology and pharmacology of the cardiac pacemaker (‘‘funny’’) current.
Pharmacol Ther, 107:59-79
Baruscotti M, Bucchi A, Viscomi C, Mandelli G, Consalez G, Gnecchi-Rusconi T, Montano N, Casali KR,
Micheloni S, Barbuti A, DiFrancesco D (2011)
Deep bradychardia and heart block caused by inducible cardiac-specific knockout of the pacemaker
channel gene Hcn4.
Proc Natl Acad Sci U S A.;108(4):1705-10. doi: 10.1073/pnas.1010122108
Bensky D, Barolet R (1990)
Formulas and Strategies.
Bensky D. Gamble A. Kaptchuk TJ (1993)
Chinese herbal medicine: materia medica.
Bois P, Bescond J, Renaudon B, Lenfant J (1996)
Mode of action of bradycardic agent, S 16257, on ionic currents of rabbit sinoatrial node cells.
Br J Pharmacol, 118:1051-1057.
Borer JS, Fox K, Jaillon P, Lerebours G, ivabradine Investigators Group (2003)
Antianginal and antiischemic effects of ivabradine, an If inhibitor, in stable angina: a randomized, double-
blind, multicentered, placebo-controlled trial.
Circulation, 107:817-823.
BoSmith RE, Briggs I, Sturgess NC (1993)
Page 96
95
Inhibitory actions of ZENECA ZD7288 on whole-cell hyperpolarization activated inward current (If) in
guinea-pig dissociated sinoatrial node cells.
Br J Pharmacol, 110:343-349
Bova S, Padrini R, Goldman WF, Berman DM, Cargnelli G (1992)
On the mechanism of vasodilating action of berberine: possible role of inositol lipid signaling system.
JPET vol. 261 no. 1318-323
Briggs I, Heapy CG (1992)
Actions of ICI D7288 on sino-atrial node cellular electrophysiology: action potentials.
Br J Pharmacol, 107:382P
Brodde OE, Leifert FJ, Krehl HJ (1982).
Coexistence of beta 1- and beta 2-adrenoceptors in the rabbit heart: quantitative analysis of the regional
distribution by (-)-3H-dihydroalprenolol binding.
J. Cardiovasc. Pharmacol. 4: 34–43.
Brodde OE, Bruck H, Leineweber K, Seyfarth T (2001).
Presence, distribution and physiological function of adrenergic and muscarinic receptor subtypes in the
human heart.
Basic Res. Cardiol. 96: 528–538
Brown HF, DiFrancesco D, Noble SJ (1979)
How does adrenaline accelerate the heart?
Nature; 280:235-236
Brown HF, DiFrancesco D (1980)
Voltage clamp investigations of membrane currents underlying pacemaker activity in rabbit sino-atrial
node.
J Physiol (Lond); 308:331-351.
Bucchi A, Baruscotti M, DiFrancesco D (2002)
Current-dependent block of rabbit sino-atrial node If channels by ivabradine.
J Gen Physiol, 120:1-13
Bucchi A, Baruscotti M, Robinson RB, DiFrancesco D (2007) a
I(f)-dependent modulation of pacemaker rate mediated by cAMP in the presence of ryanodine on rabbit
sinoatrial node cells.
J Mol Cell Cardiol.;35(8):905-13.
Page 97
96
Bucchi A, Baruscotti M, Robinson RB, DiFrancesco C (2007) b
Modulation of rate by autonomic agonists in SAN cells involves changes in diastolic depolarization and the
pacemaker current.
J Mol Cell Cardiol.;43(1):39-48.
Burashnikov A, Petroski A, Hu D, Barajas-Martinez H, Antzelevitch C (2012)
Atrial-selective inhibition of sodium-channel current by Wenxin Keli is effective in suppressing atrial
fibrillation.
Heart Rhythm, Volume 9, Issue 1, Pages 125–131
Calo L, Rebecchi M, Sette A, Martino A, de Ruvo E, Sciarra L, De Luca L, Zuccaro LM, Giunta G, Ciccaglioni
A, Lioy E, Fedele F. (2010)
Efficacy of ivabradine administration in patients affected by inappropriate sinus tachycardia.
Heart Rhythm 2010;7(9):1318-23
Cappato R, Castelvecchio S, Ricci C, Bianco E, Vitali-Serdoz L, Gnecchi-Ruscone T, Pittalis M, De Ambroggi L,
Baruscotti M, Gaeta M, Furlanello F, DiFrancesco D, Lupo PP (2012)
Clinical efficacy of Ivabradine in patients with inappropriate sinus tachycardia
J Am Coll Cardiol. 2012;60(15):1323-1329
Cerbai E, Pino R, Sartiani L, Mugelli A (1999)
Influence of postnatal development on I(f) occurrence and properties in neonatal rat ventricular myocytes.
Cardiovasc Res;42:416-423
Cerbai E, Mugelli A (2006)
I(f) in non-pacemaker cells: Role and pharmacological implications.
Pharmacol Res;53:416-423
Chen YJ, Chen SA, Chang MS, Lin CI (2000)
Arrhythmogenic activity of cardiac muscle in pulmonary veins of the dog: Implication for the genesis of
atrial fibrillation.
Cardiovasc Res;48:265-273.
Chen YJ, Chen SA, Chen YC, Yeh HI, Chan P, Chang MS, Lin CI (2001) a
Effects of rapid atrial pacing on the arrhythmogenic activity of single cardiomyocytes from pulmonary
veins: Implication in initiation of atrial fibrillation.
Circulation;104:2849-2854.
Chen J, Mitcheson JS, Tristani-Firouzi M, Lin M, Sanguinetti MC (2001) b
The S4-S5 linker couples voltage sensing and activation of pacemaker channels.
Page 98
97
Proc Natl Acad Sci U S A;98(20):11277-82. Epub 2001 Sep 11.
Chi JF, Chu SH, Lee CS, Chou NK, Su MJ (1996)
Mechanical and electrophysiological effects of 8-oxoberberine (JKL1073A) on atrial tissue.
British Journal of Pharmacology Volume 118, Issue 3, pages 503–512
Chiou WF, Yen MH, Chen CF (1991)
Mechanism of vasodilatory effect of berberine in rat mesenteric artery.
European Journal of Pharmacology, 204, pp. 35–40
Craven KB, Zagotta WN. (2004)
Salt bridges and gating in the COOH-terminal region of HCN2 and CNGA1 channels.
J Gen Physiol;124(6):663-77.
Craven KB, Olivier NB, Zagotta WN. (2008)
C-terminal movement during gating in cyclic nucleotide-modulated channels.
J Biol Chem 2008;283(21):14728-38
Damiano BP, Rosen MR. (1984)
Effects of pacing on triggered activity induced by early afterdepolarizations.
Circulation;69(5):1013-25.
Del Monte F, Kaumann AJ, Poole-Wilson PA, Wynne DG, Pepper J, Harding SE (1993).
Coexistence of functioning β1- and β2-adrenoceptors in single myocytes from human ventricle.
Circulation 88: 854–863.
Demir SS, Clark JW, Murphey CR, Giles WR (1994)
A mathematical model of a rabbit sinoatrial node cell.
American Journal of Physiology - Cell Physiology. Vol. 266 no. 3, C832-C852
Deurs B, Roepstorff K, Hommelgaard AM, Sandvig K (2003).
Caveolae: anchored, multifunctional platforms in the lipid ocean.
Trends Cell Biol. 13: 92–100
DiFrancesco D, Ojeda C (1980)
Properties of the current if in the sinoatrial node of the rabbit compared with those of the current iK2 in
Purkinje fibres.
J Physiol (Lond); 308:353-367
DiFrancesco D (1981) a
Page 99
98
A study of the ionic nature of the pace-maker current in calf Purkinje fibres.
J Physiol (Lond); 314:377-393
DiFrancesco D (1981) b
A new interpretation of the pace-maker current in calf Purkinje fibres.
J Physiol (Lond); 314:359-376
DiFrancesco D, Noble SG (1984)
A model of sino-atrial node electrical activity based on a modification of the DiFrancesco-Noble (1984)
equations.
Proc R Soc Lond B Biol Sci. 1984 Sep 22;222(1228):295-304.
DiFrancesco D, Noble D (1985)
A model of cardiac electrical activity incorporating ionic pumps and concentration changes.
Philos Trans R Soc Lond B Biol Sci. 307(1133):353-98.
DiFrancesco D, Ferroni A, Mazzanti M and Tromba C (1986) a
Properties of the hyperpolarizing-activated current (if) in cells isolated from the rabbit sino-atrial node.
The Journal of Physiology Volume 377, Issue 1, pages 61–88
DiFrancesco D (1986) b
Characterization of single pacemaker channels in cardiac sino-atrial node cells.
Nature; 324:470-473
DiFrancesco D, Tortora P (1991).
Direct activation of cardiac pacemaker channels by intracellular cyclic AMP.
Nature 351: 145–147
DiFrancesco D. (1993)
Pacemaker mechanisms in cardiac tissue.
Annu Rev Physiol 55: 451-467
DiFrancesco D, Mangoni M (1994)
Modulation of single hyperpolarization-activated channels (if) by cAMP in the rabbit sino-atrial node
Journal of Physiology. 474.3
DiFrancesco D. (1999)
Dual allosteric modulation of pacemaker (f) channels by cAMP and voltage in rabbit SA node.
J Physiol.1;515 ( Pt 2):367-76.
Page 100
99
DiFrancesco & Camm (2004).
Heart rate lowering by specific and selective I(f) current inhibition with ivabradine: a new therapeutic
perspective in cardiovascular disease.
Drugs;64(16):1757-65.
DiFrancesco D, Borer JS. (2007)
The funny current: cellular basis for the control of heart rate.
Drugs.;67 Suppl 2:15-24.
DiFrancesco (2015)
HCN4, Sinus Bradycardia And Atrial Fibrillation.
Arrhythmia & Electrophysiology Review
D’Souza A*, Bucchi A*, Johnsen AB*, Logantha SJRJ*, Monfredi O, Yanni J, Prehar S, Hart G, Cartwright E,
Wisloff U, Dobryznski H, DiFrancesco D, Morris GM, Boyett MR (2014)
Exercise training reduces resting heart rate via downregulation of the funny channel HCN4
Nature Communications; DOI: 10.1038
Femenia F, Baranchuk A, Morillo CA. (2012)
Inappropriate sinus tachycardia: current therapeutic options.
Cardiol Rev 2012;20(1):8-14
Fiore C, Eisenhut M, Ragazzi E, Zanchin G, Armanini D. (2005)
A history of the therapeutic use of liquorice in Europe.
J Ethnopharmacol;99(3):317-24. Review.
Fiore C, Eisenhut M, Krausse R, Ragazzi E, Pellati D, Armanini D, Bielenberg J. (2008)
Antiviral effects of Glycyrrhiza species.
Phytotherapy Research. Volume 22, Issue 2, pages 141–148
Frace AM, Maruoka F, Noma A (1992)
External K+ increases Na+ conductance of the hyperpolarization-activated current in rabbit cardiac
pacemaker cells.
Pflugers Arch; 421(2-3):97-9.
Fung FY, Linn YC. (2015)
Developing traditional Chinese medicine in the era of evidence-based medicine:current evidences and
challenges.
Evid Based Complement Alternat Med.;2015:425037
Page 101
100
Gargini C, Demontis GC, Bisti S, Cervetto L (1999)
Effects of blocking the hyperpolarization-activated current (I(h)) on the cat electroretinogram.
Vision Res, 39:1767-1774
Gasparini S, DiFrancesco D (1997)
Action of the hyperpolarizationactivated current (Ih) blocker ZD 7288 in hippocampal CA1 neurons.
Pflugers Arch, 435:99-106
Goaillard JM, Marder E (2006)
Dynamic clamp analyses of cardiac, endocrine, and neural function.
Physiology (Bethesda). Jun;21:197-207
Goethals M, Raes A, Van Bogaert PP (1993)
Use-dependent block of the pacemaker current If in rabbit sinoatrial node cells by zatebradine (UL-FS 49):
on the mode of action of sinus node inhibitors.
Circulation, 88:2389-2401
Gravante B, Barbuti A, Milanesi R, Zappi I, Viscomi C, DiFrancesco D (2004)
Interaction of the pacemaker channel HCN1 with filamin A.
J Biol Chem;279(42):43847-53. Epub 2004 Jul 30.
Greenwood IA & Prestwich SA (2002)
Characteristics of hyperpolarization activated cation currents in portal vein smooth muscle cells.
Am J Physiol-Cell Ph;282:C744-C753.
Harris NC, Constanti A (1995)
Mechanism of block by ZD 7288 of the hyperpolarization-activated inward rectifying current in guinea pig
substantia nigra neurons in vitro.
J Neurophysiol, 74:2366-2378.
Hibasami H, Iwasw H, Yoshioka K, Takahashi (2005)
Glycyrrhizin induces apoptosis in human stomach cancer KATO III and Human promyelotic leukemia HL-
60 cells.
International Journal of Molecular Medicine. Volume 16 Issue 2, pages: 233-236
Hille, B (2000).
Ionic channels of excitable membranes.
Sinauer Associates, Inc., Sunderland, MA.
Ishii TM, Takano M, Ohmori H (2001)
Page 102
101
Determinants of activation kinetics in mammalian hyperpolarization-activated cation channels.
J Physiol;537(Pt 1):93-100.
Joyner RW, Sugiura H, Tan RC (1991)
Unidirectional block between isolated rabbit ventricular cells coupled by a variable resistance.
Biophys J 1991;60:1038–45.
Jurevicius J, Fischmeister R (1996).
cAMP compartmentation is responsible for a local activation of cardiac Ca2+ channels by beta-adrenergic
agonists.
Proc. Natl. Acad. Sci. USA 93: 295–299.
Jurevicius J, Skeberdis VA, Fischmeister R (2003).
Role of cyclic nucleotide phosphodiesterase isoforms in cAMP compartmentation following β2-adrenergic
stimulation of ICa,L in frog ventricular myocytes.
J. Physiol. 551: 239–252
Kobinger W, Lillie C. (1987)
Specific bradycardic agents--a novel pharmacological class?
Eur Heart J. Suppl L:7-15.
Krahn AD, Yee R, Klein GJ, Morillo C (1995)
Inappropriate sinus tachycardia: evaluation and therapy.
J Cardiovasc Electrophysiol;6: 1124–8
Kramer K, van Acker SA, Voss HP, Grimbergen JA, van der Vijgh WJ, Bast A (1993)
Use of telemetry to record electrocardiogram and heart rate in freely moving mice.
J. Pharmacol. Toxicol. Methods. 30 209-215
Kramer K & Kinter LB (2003)
Evaluation and applications of radiotelemetry in small laboratory animals.
Physiol. Genomics. 13, 197-205.
Lakatta EG, DiFrancesco (2009)
What keeps us ticking: a funny current, a calcium clock, or both?
Journal of Molecular and Cellular Cardiology Volume 47, Issue 2, Pages 157–170
Page 103
102
Lao L, Xu L, Xu S (2012)
Traditional Chinese Medicine.
Integrative Pediatric Oncology, pp 125-135
Lee JR, Park SJ, Lee HS, Jee SY, Seo J, Know YK, Know TK, Kim SC (2009)
Hepatoprotective Activity of Licorice Water Extract against Cadmium-Induced Toxicity in Rats.
Evidence-Based Complementary and Alternative Medicine. Volume 6, Issue 2, Pages 195-201
Levy FO, Zhu X, Kaumann AJ, Birnbaumer L (1993).
Efficacy of β1-adrenergic receptors is lower than that of β2-adrenergic receptors.
Proc. Natl. Acad. Sci. USA 90: 10798–10802.
Li S, Okamoto T, Chun M, Sargiacomo M, Casanova JE, Hansen SH, Nishimoto I, Lisanti MP (1995)
Evidence for a regulated interaction between heterotrimeric G proteins and caveolin.
J. Biol. Chem. 270: 15693–15701,4646.
Liu YW, Guo JH, Zhang P, Li C (2009)
The effects of nardostachys chinensis beta 1 extract on the sodium current and transient outward potassium
current of rat ventricular myocytes.
Chin J Cardiac Paceing Electrophysiol;23:533–5.
Ludwig A, Zong X., Hofmann F, Biel M (1999).
Structure and function of cardiac pacemaker channels.
Cell Physiol Biochem. 9(4-5):179-86.
Maltsev VA, Lakatta EG (2009)
Synergism of coupled subsarcolemmal Ca2+ clocks and sarcolemmal voltage clocks confers robust and
flexible pacemaker function in a novel pacemaker cell model
America Journal of Physiology. Vol. 296 no. 3, H594-H615
Mannikko R, Elinder F, Larsson HP (2002)
Voltage-sensing mechanism is conserved among ion channels gated by opposite voltages.
Nature 419, 837-841
Marrouche NF, Beheiry S, Tomassoni G (2002)
Three-dimensional nonfluoroscopic mapping and ablation of inappropriate sinus tachycardia. Procedural
strategies and long-term outcome.
J Am Coll Cardiol; 39:1046 –54
Marshall PW, Rouse W, Briggs I, Hargreaves RB, Mills SD, McLoughlin BJ (1993)
Page 104
103
ICI D7288, a novel sinoatrial node modulator.
J Cardiovasc Pharmacol, 21:902-906
Mattes A, Lemmer B (1991)
Effects of amlodipine on circadian rhythms in blood pressure, heart rate, and motility: a telemetric study
in rats.
Chronobiol Int;8(6):526-38.
Matulef K, Flynn GE, Zagotta WN (1999)
Molecular rearrangements in the ligand-binding domain of cyclic nucleotide-gated channels.
Neuron;24(2):443-52.
McCormick DA, Pape HC (1990)
Noradrenergic and serotonergic modulation of a hyperpolarization-activated cation current in thalamic
relay neurones.
J Physiol;431:319-42.
Milanesi R, Baruscotti M, Gnecchi-Ruscone T, DiFrancesco D (2006)
Familial sinus bradycardia associated with a mutation in the cardiac pacemaker channel.
N Engl J Med 2006;354(2):151-7.
Milanesi R, Bucchi A, Baruscotti M (2015)
The genetic basis for inherited forms of sinoatrial dysfunction and atrioventricular node dysfunction.
J Interv Card Electrophysiol
Moosmang S, Stieber J, Zong X, Biel M, Hofmann F, Ludwig A (2001)
Cellular expression and functional characterization of four hyperpolarization-activated pacemaker
channels in cardiac and neuronal tissues.
Eur J Biochem;268(6):1646-52.
Moroni A, Barbuti A, Altomare C, Viscomi C, Morgan J, Baruscotti M, DiFrancesco D (2000)
Kinetic and ionic properties of the human HCN2 pacemaker channel.
Pflugers Arch;439(5):618-26.
Moroni A, Gorza L, Beltrame M, Gravante B, Vaccari T, Bianchi ME, Altomare C, Longhi R, Heurteaux C,
Vitadello M, Malgaroli A, DiFrancesco D (2001)
Hyperpolarization-activated cyclic nucleotide-gated channel 1 is a molecular determinant of the cardiac
pacemaker current I(f).
J Biol Chem.;276(31):29233-41. Epub 2001 Apr 27.
Page 105
104
Noble D, DiFrancesco D, Denyer (1989)
Ionic Mechanisms in Normal and Abnormal Cardiac Pacemaker Activity.
Neuronal and Cellular Oscillators, pp. 59-85
Olshansky MD, Renee M, Sullivan MD (2013)
Inappropriate Sinus Tachycardia
Brian Journal of the American College of Cardiology Vol. 61, No. 8
Ono K, Ito H (1995)
Role of rapidly activating delayed rectifier K+ current in sinoatrial node pacemaker activity.
American Journal of Physiology - Heart and Circulatory Physiology Vol. 269 no. 2, H453-462
Pape HC (1996)
Queer current and pacemaker: the Hyperpolarization- Activated Cation Current in Neurons.
Annu Rev. Phyiol. 58:29%327
Parisella ML, Angelone T, Gattuso A, Cerra MC, Pellegrino D (2012)
Glycyrrhizin and glycyrrhetinic acid directly modulate rat cardiac performance.
J Nutr Biochem;23(1):69-75.
Parton RG (2003)
Caveolae–from ultrastructure to molecular mechanisms.
Nat. Rev. Mol. Cell Biol. 4: 162–167.
Perez-Lugones A, McMahon JT, Ratliff NB, Saliba WI, Schweikert RA, Marrouche NF, Saad EB, Navia JL,
McCarthy PM, Tchou P, Gillinov AM, Natale A (2003)
Evidence of specialized conduction cells in human pulmonary veins of patients with atrial fibrillation.
J Cardiovasc Electrophysiol;14:803-809
Prinz AA, Abbott LF, Marder E (2004)
The dynamic clamp comes of age.
Neurosciences 2004;27(4):2218-224.
Qu J, Barbuti A, Protas L, Santoro B, Cohen IS, Robinson RB (2001)
HCN2 overexpression in newborn and adult ventricular myocytes: distinct effects on gating and excitability.
Circ Res;89(1):E8-14.
Qu J, Altomare C, Bucchi A, DiFrancesco D, Robinson RB (2002)
Functional comparison of HCN isoforms expressed in ventricular and HEK 293 cells.
Pflugers Arch;444(5):597-601. Epub 2002 Jun 12.
Page 106
105
Rich TC, Fagan KA, Nakata H, Schaack J, Cooper DM, Karpen JW (2000).
Cyclic nucleotide-gated channels colocalize with adenylyl cyclase in regions of restricted cAMP diffusion.
J. Gen. Physiol. 116: 147–161.
Rich TC, Tse TE, Rohan JG, Schaack J, Karpen JW (2001).
In vivo assessment of local phosphodiesterase activity using tailored cyclic nucleotide-gated channels as
cAMP sensors.
J. Gen. Physiol. 118: 63–78.
Robinson RB, Yu H, Chang F, Cohen IS (1997)
Developmental change in the voltage-dependence of the pacemaker current, if, in rat ventricle cells.
Pflug Arch Eur J Phy;433:533-535.
Rodefeld MD, Beau SL, Schuessler RB, Boineau JP, Saffitz JE (1996)
β-adrenergic and muscarinic cholinergic receptor densities in the human sinoatrial node: identification of
a high β2-adrenergic receptor density.
J. Cardiovasc. Electrophysiol. 7: 1039–1049.
Romeo E, Grimaldi N, Sarubbi B, D'Alto M, Santarpia G, Scognamiglio G, Russo MG, Calabro R. (2011)
A pediatric case of cardiomyopathy induced by inappropriate sinus tachycardia: efficacy of ivabradine.
Pediatr Cardiol;32(6):842-5.
Rubenstein JC, Freher M, Kadish A, Goldberger JJ (2010)
Diurnal heart rate patterns in inappropriate sinus tachycardia.
Pacing Clin Electrophysiol; 33:911–9
Rybin VO, Xu X, Lisanti MP, Steinberg SF (2000)
Differential targeting of betaadrenergic receptor subtypes and adenylyl cyclase to cardiomyocyte caveolae.
A mechanism to functionally regulate the cAMP signaling pathway.
J. Biol. Chem. 275: 41447–41457.
Santoro B, Tibbs GR (1999)
The HCN gene family: molecular basis of the hyperpolarization-activated pacemaker channels.
Ann N Y Acad Sci;868:741-64. Review.
Satoh H, Hashimoto K (1986)
Electrophysiological study of alinidine in voltage clamped rabbit sino-atrial node cells.
Eur J Pharmacol, 121:211-219.
Page 107
106
Satoh TO, Yamada M (2002)
Multiple inhibitory effects of zatebradine (UL-FS 49) on the electrophysiological properties of retinal rod
photoreceptors.
Pflugers Arch, 443:532-540.
Savelieva I, Camm AJ. (2006)
Novel If current inhibitor ivabradine: safety considerations.
Adv Cardiol;43:79-96. Review.
Schmitz-Spanke S, Granetzny A, Stoffels B, Pomblum VJ, Gams E, Schipke JD (2004)
Effects of a bradycardic agent on postischemic cardiac recovery in rabbits.
J Physiol Pharmacol, 55:705-712
Scott S (1979)
Stimulation simulation of young yet cultured beating hearts
PhD Thesis, State Univeristy of New York at Buffalo.
Seifert R, Scholten A, Gauss R, Minchevat A, Lichter P, Kaupp UB (1999)
Molecular characterization of a slowly gating human hyperpolarization-activated channel predominantly
expressed in thalamus, heart, and testis.
PNAS vol. 96 no. 169391-9396
Severi S, Fantini M, Charawi LA, DiFrancesco D (2012)
An updated computational model of rabbit sinoatrial action potential to investigate the mechanisms of heart
rate modulation
The Journal of Physiology. Volume 590, Issue 18, 4483-4499
Sgoifo A, Stilli D, Medici D, Gallo P, Aimi B, Musso E (1996)
Electrode positioning for reliable telemetry ECG recordings during social stress in unrestrained rats.
Physiol Behav;60(6):1397-401.
Sharp AA, O'Neil MB, Abbott LF, Marder E (1993) a
The dynamic clamp: artificial conductances in biological neurons.
Trends Neurosci. 16, 389–394
Sharp AA, O'Neil MB, Abbott LF, Marder E (1993) b
Dynamic clamp: computer-generated conductances in real neurons.
J. Neurophysiol. 69, 992–995
Shi W, Wymore R, Yu H, Wu J, Wymore RT, Pan Z, Robinson RB, Dixon JE, McKinnon D, Cohen IS (1999)
Page 108
107
Distribution and prevalence of hyperpolarization-activated cation channel (HCN) mRNA expression in
cardiac tissues.
Circ Res;85(1):e1-6.
Snyders DJ, Van Bogaert PP (1987)
Alinidine modifies the pacemaker current in sheep Purkinje fibers.
Pflugers Arch, 410:83-91.
Steinberg SF, Brunton LL (2001).
Compartmentation of G protein-coupled signaling pathways in cardiac myocytes.
Annu. Rev. Pharmacol. Toxicol. 4: 7–7.
Steinberg SF (2004)
β2-Adrenergic receptor signaling complexes in cardiomyocyte caveolae/lipid rafts.
J. Mol. Cell Cardiol. 37: 407–415
Still AM, Huikuri HV, Airaksines KEJ, Koistinen MJ, Kettunen R, Hartikainen J, Mitrani RD, Castellanos A,
Myerburg RJ, Raatikainen PJP (2002).
Impaired Negative Chronotropic Response to Adenosine in Patients with Inappropriate Sinus Tachycardia.
Journal of cardiovascular electrophysiology, Volume 13, No. 6
Swedberg K, Komajda M, Böhm M, Borer JS, Ford I, Dubost-Brama A, Lerebours G, Tavazzi L; SHIFT
Investigators. Collaborators (784) (2010)
Ivabradine and outcomes in chronic heart failure (SHIFT): a randomised placebo-controlled study.
Lancet. 2010 Sep 11;376(9744):875-85. doi: 10.1016/S0140-6736(10)61198-1
Tang QZ (2004)
Effect of Nardostachys chinensis Batal extract on sodium and L-type calcium channels of rabbit ventricular
myocytes.
Chin J Cardiol;32:267–70.
Tang QZ (2008)
The effect of NcBe from Buchangwenxin on potassium channels in single rabbit ventricular myocytes.
Chin Physician Tribune;9:56–7.
Tardif JC, Ford I, Tendera M, Bourassa MG, Fox K (2005)
Efficacy of ivabradine, a new selective If inhibitor, compared with atenolol in patients with chronic stable
angina.
Eur Heart J, 26:2529-2536
Page 109
108
Thollon C, Cambarrat C, Vian J, Prost J-F, Peglion JL, Vilaine JP (1994)
Electrophysiological effects of S 16257 a novel sino-atrial node modulator, on rabbit and guinea-pig cardiac
preparations: comparison with UL-FS 49.
Br J Pharmacol, 112:37-42.
Ulens C, Tytgat J (2001)
Functional heteromerization of HCN1 and HCN2 pacemaker channels.
J Biol Chem;276(9):6069-72. Epub 2000 Dec 27.
Ulens C, Siegelbaum SA (2003)
Regulation of Hyperpolarization-Activated HCN Channels by cAMP through a Gating Switch in Binding
Domain Symmetry.
Neuron, Volume 40, Issue 5, Pages 959–970
Vaca L, Stieber J, Zong X, Ludwig A, Hofmann F, Biel M (2000)
Mutations in the S4 domain of a pacemaker channel alter its voltage dependence.
FEBS Lett;479(1-2):35-40.
Van Bogaert PP, Goethals M (1987)
Pharmacological influence of specific bradycardic agents on the pacemaker current of sheep cardiac
Purkinje fibres. A comparison between three different molecules.
Eur Heart J, 8:35-42.
Van Bogaert PP, Pittoors F (2003)
Use-dependent blockade of cardiac pacemaker current (If) by cilobradine and zatebradine.
Eur J Pharmacol, 478:161-171
Van Ginneken AC, Giles W (1991)
Voltage clamp measurements of the hyperpolarization-activated inward current I(f) in single cells
from rabbit sino-atrial node.
jphysiol.1991.sp018459
Varnum MD, Black KD, Zagotta WN (1995)
Molecular mechanism for ligand discrimination of cyclic nucleotide-gated channels.
Neuron;15(3):619-25.
Verkerk AO, Wilders R. (2014)
Pacemaker activity of the human sinoatrial node: effects of HCN4 mutations on the hyperpolarization-
activated current.
Europace 2014;16(3):384-95
Page 110
109
Verkerk AO, Wilders R (2015)
Pacemaker activity of the human sinoatrial node: an update on the effects of mutations in HCN4 on the
hyperpolarization-activated current.
Int J Mol Sci; 16(2):3071-94
Vilaine JP (2006)
The discovery of the selective If current inhibitor ivabradine. A new therapeutic approach to ischemic heart
disease.
Pharmacol Res, 53:424-434
Viscomi C, Altomare C, Bucchi A, Camatine E, Baruscotti M, Moroni A, DiFrancesco D (2001)
C Terminus-mediated Control of Voltage and cAMP Gating of Hyperpolarization-activated Cyclic
Nucleotide-gated Channels.
The American Society for Biochemistry and Molecular Biology, Inc.
Wainger BJ, DeGennaro M, Santoro B, Siegelbaum SA, Tibbs GR (2001)
Molecular mechanism of cAMP modulation of HCN pacemaker channels.
Nature;411(6839):805-10.
Wang J, Chen S, Siegelbaum SA (2001)
Regulation of hyperpolarization-activated HCN channel gating and cAMP modulation due to interactions
of COOH terminus and core transmembrane regions.
J Gen Physiol;118(3):237-50.
Weber I, Steitz T (1987)
Structure of a complex of catabolite gene activator protein and cyclic AMP refined at 2.5 Å resolution.
Journal of Molecular Biology, Volume 198, Issue 2, Pages 311-326
Verkerk AO, Wilders R. (2014)
Pacemaker activity of the human sinoatrial node: effects of HCN4 mutations on the hyperpolarization-
activated current.
Europace. Mar;16(3):384-95. doi: 10.1093/europace/eut348.
Wilders R (2006)
Dynamic clamp: a powerful tool in cardiac electrophysiology
J Physiol. 576:349-59
Wit AL, Fenoglio JJ Jr,Wagner BM, Bassett AL (1973)
Page 111
110
Electrophysiological properties of cardiac muscle in the anterior mitral valve leaflet and the adjacent atrium
in the dog. Possible implications for the genesis of atrial dysrhythmias.
Circ Res;32:731-745.
Wood JM, Schnell CR, Cumin F, Menard J, Webb RL (2005)
Aliskiren, a novel, orally effective renin inhibitor, lowers blood pressure in marmosets and spontaneously
hypertensive rats.
J Hypertens;23(2):417-26.
Xue T, Marbán E, Li RA (2002)
Dominant-negative suppression of HCN1- and HCN2-encoded pacemaker currents by an engineered HCN1
construct: insights into structure-function relationships and multimerization.
Circ Res;90(12):1267-73.
Yusuf & Camm (2003)
Sinus tachyarrhythmias and the specific bradycardic agents: a marriage made in heaven?
J Cardiovasc Pharmacol Ther;8(2):89-105.
Zaccolo M, Pozzan T (2002)
Discrete microdomains with high concentration of cAMP in stimulated rat neonatal cardiac myocytes.
Science 295: 1711–1715.
Zagotta WN, Olivier NB, Black KD, Young EC, Olson R, Gouaux (2003)
Structural basis for modulation and agonist specificity of HCN pacemaker channels.
Nature;425(6954):200-5.
Zaza A, Robinson RB, DiFrancesco (1996)
Basal responses of the L-type Ca2+ and hyperpolarization-activated currents to autonomic agonists in the
rabbit sino-atrial node
The Journal of Physiology. Volume 491, Issue 2, pages 347-355
Zellerhoff S, Hinterseer M, Felix Krull B, Schulze-Bahr E, Fabritz L, Breithardt G, Kirchhof P, Kaab S. (2010)
Ivabradine in patients with inappropriate sinus tachycardia.
Naunyn Schmiedebergs Arch Pharmacol;382(5-6):483-6.
Zong X, Stieber J, Ludwig A, Hofmann F, Biel M (2000)
A Single Histidine Residue Determines the pH Sensitivity of the Pacemaker Channel HCN2.
The American Society for Biochemistry and Molecular Biology, Inc.