Pertanika 12(3), 303-311 (1989) Determination of Calcium in Foods by the Atomic Absorption and TitriInetric Methods TEE E. SIONG, KHOR SWAN CHOO and SITI MIZURA SHAHID Division of Human Nutrition Institute for Medical Research 50588 Kuala Lumpur, Malaysia. Key words: Calcium in foods, atomic absorption spectrophotometry, potassium permanganate titration. ABSTRAK Laporan ini membentangkan hasil satu kajian perbandingan penentuan kandungan kalsium dalam pelbagai jenis makanan dengan kaedah-kaedah spektrofotometri penyerapan atom (AAS) dan titratan dengan kalium permanganat. Larutan abu telah disediakan bagi setiap sampel makanan (dianalisis secara duplikat). Satu alikuot lm'utan terselJ'ut telah dianalisis dengan kaedah AAS, manakala satu lagi dengan kaedah titratan. Sejumlah 132 jenis makanan yang terdiri daripada 8 kumpulan makanan telah dikaji. Nilai min bagi analisis duplikat setiap makanan dengan kedua-dua kaedah itu telah dibentangkan mengikut kumpulan makanan. Hasil yang diperolehi dengan kaedah AAS dan titrimetri didapati mempunyai keselarian dan korelasi yang baik (I' = 0.998). lni telah disahkan dengan ujian "paired t" yang menunjukkan bahawa bagi 6 kumpulan makanan yang dikaji, perbezaan kandungan kalsium yang diberi oleh kedua-dua kaedah tidak bererti (P < 0.05). Walaupun begitu perbezaan bagi 2 kumpulan yang lain iaitu kekacang dan sayuran didapati bererti dan angka statistik t yang diperolehi kecil. Kedua-dua kaedah didapati memberi perbezaan min hasil bilas yang tidak bererti dan menghampiri 100. Didapati juga perbezaan yang tidak bererti bagi varians kaedah-kaedah itu. Hasil kajian ini telah menunjukkan bahawa kedua-dua kaedah dapat digunakan dengan memuaskan bagi analisis wt ini. Walaupun demikian, pilihan sesuatu kaedah juga bergantung kepada beberapa Jaktor yang lain, termasuk adanya alat dan kepakaran yang diperlukan. ABSTRACT This report jJresents results of a comparative study of the determination of calcium in a wide variety of foods using the atomic absorption spectrophotometric (AAS) and potassium permanganate titration methods. Ash solution for each food sample (determined in duplicate) was prepared and an aliquot subjected to AAS analysis, while another aliquot was determined by the titrimetric method. A total oj 132 foods, belonging to 8 food groups were studied. Mean values Jor duplicate analysis of each food determined by the two methods were tabulated according to food groups. Results obtained by the AAS and titrimetric methods showed good general agreement, and a high correlation coefficient (r = 0.998) was obtained. This was confirmed by paired t-test which showed that for 6 of the Jood groups studied, there was no statistically significant difference (p < 0.05) in calcium concentrations determined by the two methods. For the remaining 2 groups, legumes and vegetables, a signifi- cant difference in results was obtained. However, in both cases, the t-statistic calculated was small. Both methods were found to give mean percent recovery values which were not significantly different and close to 100. There was also no significant difference in variances given by the two methods. Results oj the study therefore have shown that either method can be used satisfactorily for the analysis of this nutrient. The choice of method, however, also depends on various other factors, including availability of required instrument and expertise. INTRODUCTION Calcium has been documented in studies of nutrient composition of local foods since the early part of the century. One of the earliest reports was that of Morris and Oliveira (1933) who documented the content of this mineral in
Transcript
Pertanika 12(3), 303-311 (1989)
Determination of Calcium in Foods by the Atomic AbsorptionSpectrophotom~tric and TitriInetric Methods
TEE E. SIONG, KHOR SWAN CHOO and SITI MIZURA SHAHIDDivision of Human NutritionInstitute for Medical Research
50588 Kuala Lumpur, Malaysia.
Key words: Calcium in foods, atomic absorption spectrophotometry, potassium permanganatetitration.
ABSTRAKLaporan ini membentangkan hasil satu kajian perbandingan penentuan kandungan kalsium dalam pelbagaijenis makanan dengan kaedah-kaedah spektrofotometri penyerapan atom (AAS) dan titratan dengan kaliumpermanganat. Larutan abu telah disediakan bagi setiap sampel makanan (dianalisis secara duplikat). Satualikuot lm'utan terselJ'ut telah dianalisis dengan kaedah AAS, manakala satu lagi dengan kaedah titratan.Sejumlah 132 jenis makanan yang terdiri daripada 8 kumpulan makanan telah dikaji. Nilai min bagianalisis duplikat setiap makanan dengan kedua-dua kaedah itu telah dibentangkan mengikut kumpulanmakanan. Hasil yang diperolehi dengan kaedah AAS dan titrimetri didapati mempunyai keselarian dankorelasi yang baik (I' = 0.998). lni telah disahkan dengan ujian "paired t" yang menunjukkan bahawa bagi6 kumpulan makanan yang dikaji, perbezaan kandungan kalsium yang diberi oleh kedua-dua kaedah tidakbererti (P < 0.05). Walaupun begitu perbezaan bagi 2 kumpulan yang lain iaitu kekacang dan sayurandidapati bererti dan angka statistik t yang diperolehi kecil. Kedua-dua kaedah didapati memberi perbezaanmin hasil bilas yang tidak bererti dan menghampiri 100. Didapati juga perbezaan yang tidak bererti bagivarians kaedah-kaedah itu. Hasil kajian ini telah menunjukkan bahawa kedua-dua kaedah dapat digunakandengan memuaskan bagi analisis wt ini. Walaupun demikian, pilihan sesuatu kaedah juga bergantungkepada beberapa Jaktor yang lain, termasuk adanya alat dan kepakaran yang diperlukan.
ABSTRACTThis report jJresents results of a comparative study of the determination of calcium in a wide variety offoodsusing the atomic absorption spectrophotometric (AAS) and potassium permanganate titration methods. Ashsolution for each food sample (determined in duplicate) was prepared and an aliquot subjected to AAS analysis,while another aliquot was determined by the titrimetric method. A total oj132 foods, belonging to 8 food groupswere studied. Mean values Jor duplicate analysis of each food determined by the two methods were tabulatedaccording to food groups. Results obtained by the AAS and titrimetric methods showed good general agreement,and a high correlation coefficient (r = 0.998) was obtained. This was confirmed by paired t-test which showedthat for 6 of the Jood groups studied, there was no statistically significant difference (p < 0.05) in calciumconcentrations determined by the two methods. For the remaining 2 groups, legumes and vegetables, a significant difference in results was obtained. However, in both cases, the t-statistic calculated was small. Both methodswere found to give mean percent recovery values which were not significantly different and close to 100. Therewas also no significant difference in variances given by the two methods. Results oj the study therefore haveshown that either method can be used satisfactorily for the analysis of this nutrient. The choice of method,however, also depends on various other factors, including availability of required instrument and expertise.
INTRODUCTIONCalcium has been documented in studies ofnutrient composition of local foods since the
early part of the century. One of the earliestreports was that of Morris and Oliveira (1933)who documented the content of this mineral in
between the two analytical methods. This couldbe of assistance to laboratory workers intendingto use either methods, such as in situationsmentioned above. The study was carried outtogether with a comparative study of the determination of iron using the AAS and colorimetricmethods (Tee et al. 1989).
TEE E. SIONG, K}-IOR SWAN CHOO AND SITI VIIZURA SHAHID
some 60 types of foods. In that study, calciumwas precipitated as calcium oxalate, convertedto calcium oxide, weighed and reported as such.Some years later, Leong and Morris (1947) useda different procedure for determining thismineral. Calcium was again precipitated asoxalates, but instead of using the more cumbersome gravimetric procedure, calcium presentwas next titrated with potassium permanganate MATERIALS AND METHODSand results expressed as milligram calcium. Samples offoods from various food groups wereSubsequent reports on nutrient analyses oflocal purchased from local markets and retail storesfoods had used this titrimetric method for deter- for analysis. Wherever applicable, refuse in eachmining calcium. food item was removed and its proportion in
The potassium permanganate titration me- the food determined. The edible portions werethod (after precipitation of calcium as oxalate) blended and aliquots taken for analysis.has remained the method of choice for deter- An amount of 5-15 g of the homogenizedmination of calcium in foods for many labora- sample was dried in an air oven at 105°c for 3tories, including this Division. In recent years, hours. The dried sample was next charred untilthe atomic absorption spectrophotometric it ceased to smoke. The charred sample was(AAS) method has been introduced. This, and then ashed in a muffle furnace at 550°C untilthe titrimetric methods, are recognized methods a whitish or greyish ash was obtained. The ashfor determination of calcium in foods, and are was treated with concentrated hydrochloric acid,cited in Pearson's Chemical Analysis of Foods transfered to a volumetric flask and made up(Egan et aZ. 1981). Both methods are currently to 50 ml. For each food studied, two ash solu-in use by laboratories in the country carrying tions were prepared, i.e. duplicate analysis wasout studies into nutrient composition of foods. carried out. An aliquot of each ash solution was
The choice of either the AAS or titrimetric used for the determination of calcium by themethod has relied on various factors, includ- AAS method and another aliquot by the titri-ing availability of the required instrument as metric method.well as expertise. For various reasons, it would For the AAS method, a Varian Atomicbe important to determine if the AAS and titri- Absorption Spectrophotometer model 175 withmetric methods give comparable results. Differ- an air-acetylene flame, and wavelength set toent laboratories participating in a joint pro- 422.7 nm was used. Calcium carbonate was usedgramme for the analysis of calcium using the as standard to prepare a calibration curve withtwo different methods would need to deter- at least 4 concentrations of calcium within themiile if the results obtained are comparable. analytical range. To eliminate phosphorus inter-Before switching over to a newly purchased ference in the determination, lanthanum wasatomic absorption spectrophotometer, a labo- added to the test ash solution and standardratory would need to find out if the results to solutions so that the final solutions containedbe obtained would be comparable to those 1% La. Concentration of calcium in test solu-previously obtained with the titrimetric method. tions was calculated from the standard curveOn the other hand, in a laboratory using the prepared. For each ash solution, at least threeAAS method, it may be necessary to switch to readings were obtained and the average calthe titrimetric method if the spectrophoto- culated.meter breaks down for a considerable length In the titrimetric method, an aliquot ofof time. the ash solution was reacted with ammonium
This report presents results of a compara- oxalate solution to precipitate out the calcium.tive study of the determination of calcium in a After centrifugation and decanting the super-wide variety of foods using the AAS and titri- natant liquid, the precipitate was redissolved inmetric methods. It is hoped that the results in- 4r-\ sulphuric acid. Calcium in solution wasdicate clearly significant differences, if any, titrated against O.OIN potassium permanganate,
304 I'ERT.,-\:\IKA \'01.. 12 \:0. 'I. 1~'H9
DETERMINATIoN OF CALCIUM IN FOODS BYTHE AAS AND TITRIMETRlC METHODS
mg ca/IOO g edible portion
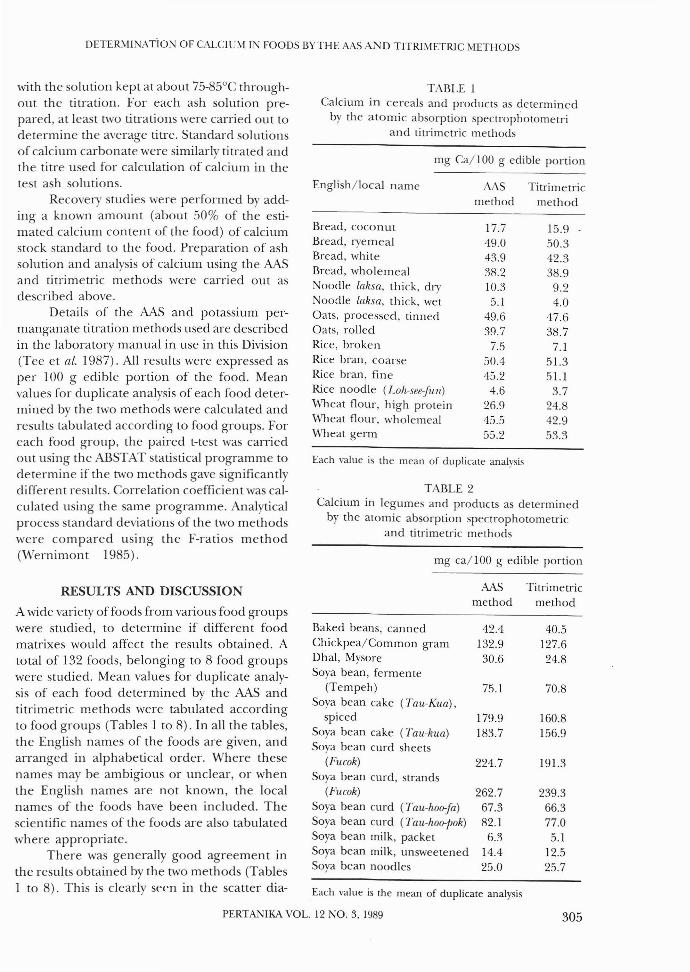
TABLE ICalcium in cereals and products as determined
by the atomic absorption spectrophotometriand titrimetric methods
TABLE 2Calcium in legumes and products as determined
by the atomic absorption spectrophotometricand titrimetric methods
Wheat flour, high proteinWheat flour, wholemealWheat germ
with the solution kept at about 75-85°C throughout the titration. For each ash solution prepared, at least two titrations were carried out todetermine the average titre. Standard solutionsof calcium carbonate were similarly titrated andthe titre used for calculation of calcium in thetest ash solutions.
Recovery studies were performed by adding a known amount (about 50% of the estimated calcium content of the food) of calciumstock standard to the food. Preparation of ashsolution and analysis of calcium using the AASand titrimetric methods were carried out asdescribed above.
Details of the AAS and potassium permanganate titration methods used are describedin the laboratory manual in use in this Division(Tee et al. 1987). All results were expressed asper 100 g edible porrion of the food. Meanvalues for duplicate analysis of each food determined by the two methods were calculated andresults tabulated according to food groups. Foreach food group, the paired t-test was carriedout using the ABSTAT statistical programme todetermine if the two methods gave significantlydifferen t results. Correlation coefficien t was calculated using the same programme. Analyticalprocess standard deviations of the two methodswere compared using the F-ratios method(Wernimont 1985).
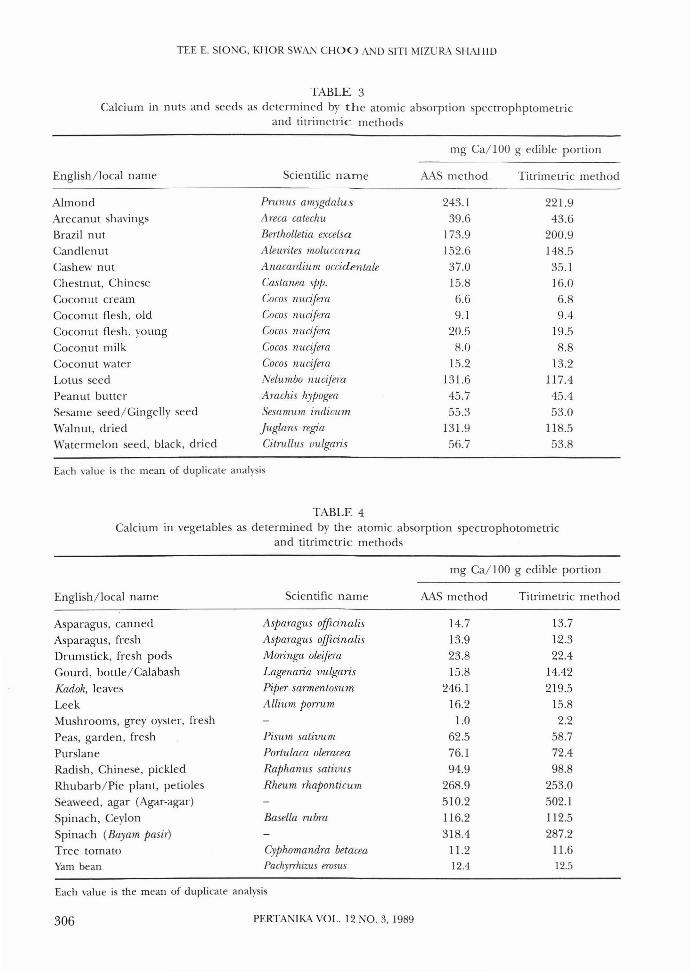
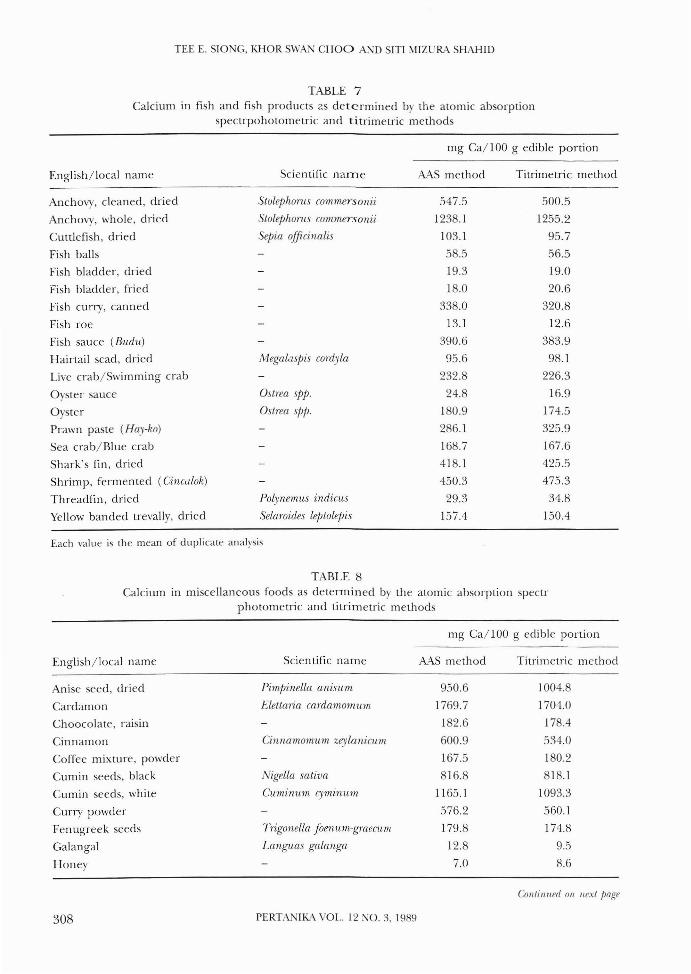
A wide variety of foods from various food groupswere studied, to determine if different foodmatrixes would affect the results obtained. Atotal of 132 foods, belonging to 8 food groupswere studied. Mean values for duplicate analysis of each food determined by the AAS andtitrimetric methods were tabulated accordingto food groups (Tables 1 to 8). In all the tables,the English names of the foods are given, andarranged in alphabetical order. Where thesenames may be ambigious or unclear, or whenthe English names are not known, the localnames of the foods have been included. Thescientific names of the foods are also tabulatedwhere appropriate.
There was generally good agreement inthe results obtained by the two methods (Tables1 to 8). This is clearly seen in the scatter dia-
AASmethod
Titrimetricmethod
PERTANIKA VOL. 12 NO.3, 1989 305
TEE E. SIaNG, KHOR SWAN CHOO AND SITI NIlZURA SHAHID
TABLE 3Calcium in nuts and seeds as determined by the atomic absorption spectrophptometric
and titrimetric methods
mg Ca/l00 g edible portion
English/local name
Almond
Arecanut shavings
Brazil nut
Candlenut
Cashew nut
Chestnut, Chinese
Coconut cream
Coconut flesh, old
Coconut flesh, young
Coconut milk
Coconut water
Lotus seedPeanut butter
Sesame seed/Gingelly seed
Walnut, driedWatermelon seed, black, dried
Scientific name
Pnmus mnygdalus
Areca catechu
Bertholletia excelsa
Aleurites 11loluccana
Anacardi1l1n occidentale
Castanea spp.
Cocos nucifera
Cocos nucifera
Cocos nucifera
Cocos nucifera
Cocos nucifem
Nel1l1nbo nucifera
A mchis hypogea
Sesa11l1l1n indicum
Juglans regia
Citntllus vulgaris
AAS method
243.139.6
173.9152.637.015.86.69.1
20.58.0
15.2131.645.755.3
131.956.7
Titrimetric method
221.943.6
200.9148.535.116.06.89.4
19.58.8
13.2117.4
45.453.0
118.553.8
Each value is the mean of duplicate analysis
TABLE 4Calcium in vegetables as determined by the atomic absorption spectrophotometric
and titrimetric methods
mg Ca/l00 g edible portion
English/local name
Asparagus, canned
Asparagus, fresh
Drumstick, fresh pods
Gourd, bottle/Calabash
Kadok, leaves
LeekMushrooms, grey oyster, fresh
Peas, garden, fresh
Purslane
Radish, Chinese, pickled
Rhubarb/Pie plant, petioles
Seaweed, agar (Agar-agar)
Spinach, Ceylon
Spinach (Baymn PasiT)
Tree tomatoYam bean
Scientific name
Aspamgus oJficinalis
Aspamgl.ls oJficinalis
Moringa oleifem
Lagenaria vulgaris
Piper sarmentosum
Alliu11l POTTI.l11l
Pisu11l sativu11l
Portulaca oleracea
Raphanus sativus
Rheu11l rhaponticu11l
Basella ntbra
Cyphomandm betacea
Pachyrrhiz'Us erosus
AAS method
14.713.923.815.8
246.116.2
1.062.576.194.9
268.9510.2116.2318.4
11.212.4
Titrimetric method
13.71~.3
22.414.42219.5
15.82.2
58.772.498.8
253.0502.1112.5287.2
11.612.5
Each value is the mean of duplicate analysis
306 PERTANIKA VOL. 12 NO.3, 1989
DETERMINATION OF CALCIUM IN FOODS BYTHE AAS AND TITRIMETRIC METHODS
TABLE 5Calcium in fruits as determined by the atomic absorption spectrophotometric and titrimetric methods
mg Ca/lOO g edible portion
English/local name Scientific name AAS method Titrimetric method
Avocado Persea americana 13.8 12.1
Banana (Pisang kelat) Musa sapientium 5.7 6.8
Binjai Mangifera caesia 6.9 6.7
Cashew apple Anacardium occidentale 2.0 2.0
Custard apple Annona squamosa 16.4 15.5
Date, dried Phoenix dactylifera 47.6 42.2
Durian cake Duno zibethinus 9.4 11.1
Grapefruit Cit1US pamdisi 28.5 26.8
JeTing Pithecellobium lobatum 31.3 38.1
Kundang Bouea macrophylla 4.9 5.2
Lychee Litchi chinensis 5.1 5.1
Mango (Bacang gelok) Mangifera foetida 16.0 15.5
Nutmeg, fresh Mynstica fmgrans 26.8 24.1
Persimmon, dried Diospy1'OS kaki 43.1 36.1
Prunes, dried P1Unus spp. 56.3 52.4
Pulasan Nephelium mutamle 7.8 7.1
Soursop Annona muncata 12.0 10.6
Strawberry Fmgana grandiflom 12.0 11.9
TABLE 6Calcium in meat and eggs as determined by the atomic absorption
spectrophotometric and titrimetric methods
mg Ca/100 g edible portion
Beef extract
Beefrendang, canned
Chicken feet, deboned
Chicken gizzard
Chicken heart
Chicken intestines
Duck egg, salted, yolk
Duck egg, yolk
Mutton curry, canned
Ox maw
Turtle egg, white
Turtle egg, yolk
Each value is the mean of duplicate analysis
AAS method
40.4
31.1
25.1
7.4
6.0
7.7
184.1
151.3
16.1
10.7
19.6
165.2
Titrimetric method
43.2
26.6
23.3
7.2
6.0
5.7
188.7
139.7
15.6
9.7
21.0
157.9
PERTANIKA VOL. 12 NO.3. 1989 307
TEE E. SIONG, KHOR SWAN CHOO AND SITI MIZl'RA SHAHID
TABLE 7Calcium in fish and fish products 2.S determined by the atomic absorption
spectrpohotometric and ti trimetric methods
mg Ca/lOO g edible portion
English/local name
Anchovy, cleaned, dried
Anchovy, whole, dried
Cuttlefish, dried
Fish balls
Fish bladder, dried
Fish bladder, fried
Fish curry, canned
Fish roe
Fish sauce (Budu)
Hairtail scad, dried
Live crab/Swimming crab
Oyster sauce
Oyster
Prawn paste (Hay-ko)
Sea crab/Blue crab
Shark's fin, dried
Shrimp, fermented (Cincalok)
Threadfin, dried
Yellow banded trevally, dried
Scientific name
Slulephorus commersonii
Slolephorus commersonii
Sel)ia oJficinalis
ivlegalaspis cordyla
Oslrea SI)I).Oslrea spp.
Polynemus indicus
Selaroides leplolepis
AAS method
547.5
1238.1
103.1
58.5
19.3
18.0
338.0
13.1
390.6
95.6
232.8
24.8
180.9
286.1
168.7
418.1
450.3
29.3
157.4
Titrimetric method
500.5
1255.2
95.7
56.5
19.0
20.6
320.8
12.6
383.9
98.1
226.3
16.9
174.5
325.9
167.6
425.5
475.3
34.8
150.4
Each value is the mean of duplicate analysis
TABLE 8Calcium in miscellaneous foods as determined by the atomic absorption spectr
photometric and titrimetric methods
mg Call00 g edible portion
English/local name
Anise seed, dried
Cardamon
Choocolate, raisin
Cinnamon
Coffee mixture, powder
Cumin seeds, black
Cumin seeds, white
Curry powder
Fenugreek seeds
Galangal
Honey
308
Scientific name
Pimpinella anisum
£lellal'ia cardamomwn
Cinnamomwn uylanicum
Nigella saliva
Cuminum cyminu1n
Tl'igonella foenum-graecum
Langu.as galanga
PERTANlKA VOL. 12 NO.3, 1989
AAS method
950.6
1769.7
182.6
600.9
167.5
816.8
1165. I
576.2
179.8
12.8
7.0
Titrimetric method
1004.8
1704.0
178.4
534.0
180.2
818.1
1093.3
560.1
174.8
9.5
8.6
Continl/nt on lIext page
DETERMINATIO:'\ OF CA.LCIU~11\iFOODS BYTHE AA.S A D TITRJMETRIC METHODS
TABlE 8: Conlinued
mg Ca/l00 g edible portion
English/local name
Jam, egg (Seri kaya)
.lam, pineapple
Jelly crystals
Malted milk powder
Marmalade
Milk-based diet supplement, powder
Pepper, powder, white
Sugar cane juice
Tamarind paste (Asam Jawa)
Treacle, black
Yeast, dried, brewer's
Yeast, granules, tinned
Scientific name
Piper nigl11.m
Sacchal11.m o[fi.cinarum
Tamarindus indica
Sacchammyces cerevisiae
Sacchammyces cerevisiae
AAS method
8.4
1.7
133.2
501.9
7.9
761.3
120.4
6.5
101.7
517.4
400.7
68.6
Titrimetric method
8.0
3.3
124.0
488.1
7.7
711.1
122.1
6.1
89.2
487.6
420.2
65.5
y = 0.2381 + 0.9627x
Each value is the mean of duplicate analysis
600
500
200 300 400 500 600
AtomIc absorption speetrophotometrlc method
Fig. I: Calcium concenlralion delennined by lhe AAS and Tilri1llelric melhods (mg
Calcium IJer J00 g edible porlion).
PERTANlKA VOL. 12 NO.3, 1989 309
TEE E. SIaNG, KHOR SWAN CHaO AND SITI MIZURA SHAHID
gram, plotting 126 pairs of results obtained(Figure 1). The remaining 6 pairs were omittedfrom the plot as they were much higher thanthe majority of the values obtained. A goodcorrelation coefficient (r = 0.998) was obtainedfor all 132 pairs of results obtained.
Results of paired t-test for all food groupsstudied (Table 9) showed that for 6 food groups,there was no statistically significant difference(p <0.05) in calcium concentration determinedby the AAS and titrimetric methods. For theremaining 2 groups, legumes and vegetables, asignificant difference in results was obtained.However, in both cases, particularly for vegetables, the t-statistic calculated was small, justabove the significance level.
Recovery of added calcium to the foodswas determined in 14 separate studies. Resultsobtained (Table 10) showed that mean percentrecqvery values for both methods were close to100, with small coefficient of variation. Therewas no statistically significant difference betweenthe two mean recovery values (p < 0.05).
The pooled standard deviation obtainedfor all the 132 foods studied was 14.5 for theAAS method and 15.8 for the titrimetric method.Comparing the variance obtained for all foods,the observed F-ratio was calculated to be 1.17.There was thus no statistically significant difference (p < 0.05) in the variances given by thetwo methods.
CONCLUSIONSIn this study, the AAS and the potassium permanganate titration methods did not give significantly different calcium concentrations fora wide variety of foods. Both methods gave goodrecovery values, and no significant differencein process variablility was observed. Eithermethod can, therefore, be used satisfactorilyfor this analysis. There are, however, advantages and disadvantages for both methods.
The titration method tends to be moretedious and more prone to errors due to thenumber of steps involved in preparing thesolution for titration. T.his include adjustment
TABLE 9Summary statistics of paired t-test of calcium concentration of various foods
determined by the atomic absorption spectrophotometric and titrimetric methods
Food group
Cereals and productsLegumes and productsNuts and seedsVegetablesFruitsMeat and eggsFish and fish productsMiscellaneous
I at p < 0.05, not statistically significant, statistically significant
n
1513161618121923
Calculatedt-statistic
0.9393.0940.7492.3121.3121.3160.1341.862
Statisticalsignificance'
N.S 2
S~
N.S.S.N.S.N.S.N.S.N.S.
TABLE 10Recovery values obtained by the atomic absorption
spectrophotometric and colorimetric methods
'umber of determinations
Mean ± SD
Coefficient of variation
310
AAS method
14
96.9 ± 9.3%
9.6
PERTANlKA VOL. 12 NO.3, 1989
Titrimetric method
14
93.5 ± 6.8%
7.3
DETERMINATION OF CALCIUM IN FOODS BY THE AAS AND TITRIMETRIC METHODS
of pH of ash solution, precipitation of calciumas oxalate, and collection and cleaning of theprecipitate. The titration itself has to be carefully performed, keeping the test solution at atemperature of 75-85°C. The procedure is,however, relatively much cheaper, requiring noexpensive instrument. In the hands of anexperienced worker, this method can providereliable results.
The AAS method, on the other hand,requires the purchase of an expensive spectrophotometer. It has also to be borne in mindthat maintaining the instrument to ensureoptimal performance is a difficult task. It ishowever, a relatively simpler procedure. Theash solution can be used directly for sprayingin the spectrophotometer, after the instrumenthas been appropriately set up. It would be themethod ofchoice, provided the required budgetis available.
ACKNOWLEDGEMENTS'..\Ie would like to acknowledge the assistance ofMs Chin Suan Kee of this Division and. Ms gYin Kwan of Tunku Abdul Rahman College,Kuala Lumpur, in carrying out some of theanalyses. We thank Dr. M. Jegathesan, Director
of the Institute for Medical Research for permission to publish the results of this study.
REFERENCES
EGAl'\, H., R.S. KIRK and R. SAWYER. 1981. Pearson'sChem.ical Analysis oj Foods. 8th Edn. London:Churchill Livingstone, pp. 26 - 28.
LEONG, P.c. and].P. MORRIS. 1947. Calcium andOxalic Acid of Vegetables. Med. J. Mal. 1 :289 - 297.
MORRIS, J.P. and CJ. OLIVEIRa. 1933. Calcium inTropical Foods. Mal. Med. J. 8 : 236 - 238.
TEE, E.S., S. SlTl MlZURA, R. KULADEVAi'l, S.1. YOUNG,S.c. KHOR and S.K. CHIN (editors). 1987. Laboratory Procedures in Nutrien t Analysis of Foods.Division of Human Nutrition, Institute for Medical Research, Kuala Lumpur. pp. 82 - 84 and92 - 96.
TEE, E.S., S.c. KHOR and S. SITI MlZURA. 1989.Determination of Iron in foods by the AtomicAbsorption Spectrophotometric and Colorimetric Methods. Pertanika. 12(3): 313-322.
WERNIMONT, G.T. 1985. Use of Statistics to
Develop and Evaluate Analytical Methods. Association of Official Analytical Chemists: Virginia.