32
Uttar PradeshDistrict Factbook™
Sonbhadra District
(Key Socio-economic Data of Sonbhadra District, Uttar Pradesh)January, 2017
Editor & DirectorDr. R.K. Thukral
Research EditorDr. Shafeeq Rahman
Compiled, Researched and Published byDatanet India Pvt. Ltd.D-100, 1st Floor,Okhla Industrial Area, Phase-I,New Delhi-110020.Ph.: 91-11-43580781, 26810964-65-66Email : [email protected] : http://www.datanetindia-ebooks.com
Report No.: DFB/UP-200-0616
ISBN : 978-93-86277-44-2
First Edition : June, 2016Updated Edition : January, 2017
Price : Rs. 7500/- US$ 200
© 2017 Datanet India Pvt. Ltd.All right reserved. No part of this book may be reproduced, stored in a retrievalsystem or transmitted in any form or by any means, mechanical, photocopying,recording or otherwise without the prior written permission of the publisher.
Printed in India
Sonbhadra District at a Glance
District came into Existence Year 1989
District Headquarter Robertsganj
Distance from State Capital 380 Kms.
Geographical Area (In Square km.) 6,905 (Ranks 2nd in State and 137th in India)Wastelands Area (In Square km.)(2008-2009)
372.92
Total Number of Households 3,26,918
Population 18,62,559 (Persons), 9,71,344 (Males), 8,91,215 (Females) (Ranks 51st in Stateand 255th in India)
Population Growth Rate (2001-2011)
27.27 (Persons), 26 (Males), 28.67 (Females)
Number of SubDistricts/Towns/Villages
Sub-districts (03), Towns (18) and Villages (1,429)
Forest Cover (2015) 37.48% of Total Geographical AreaPercentage of Urban/RuralPopulation
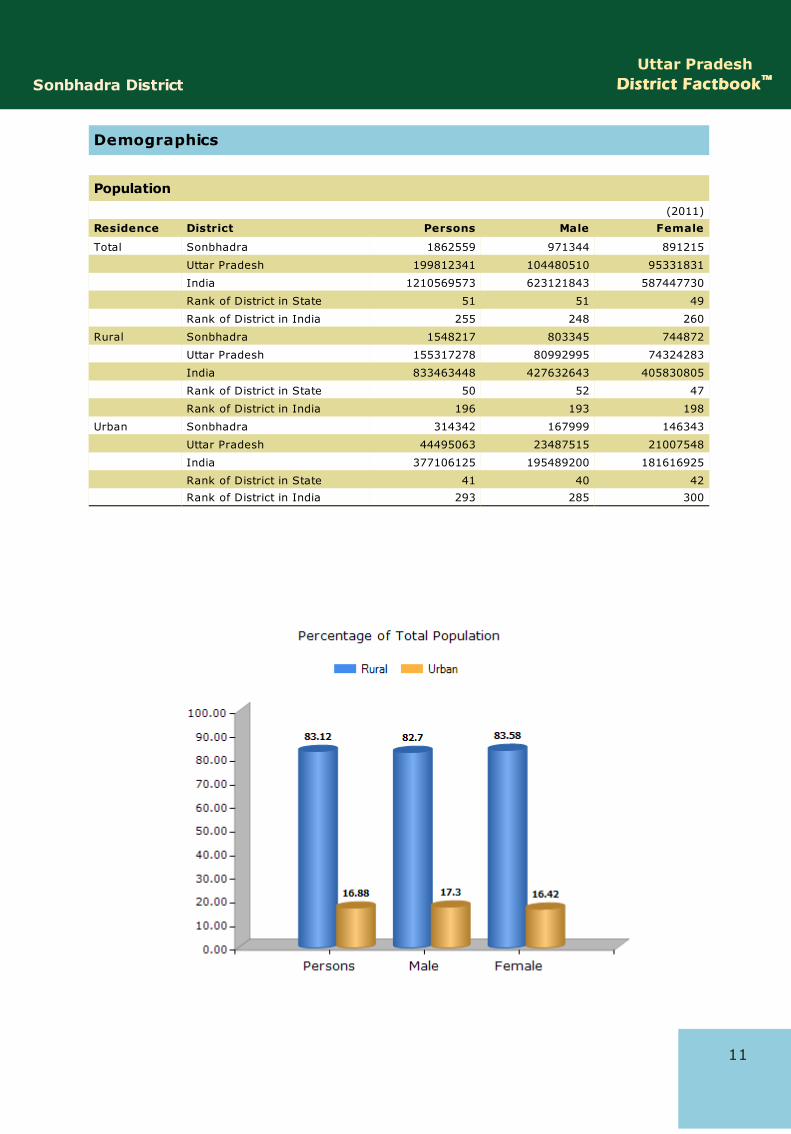
16.88 (Urban), 83.12 (Rural)
Administrative Language Hindi
Principal Languages (2001) Hindi (98.52%), Urdu (0.71%), Bengali (0.19%), Nepali (0.16%), Punjabi (0.09%),Malayalam (0.08%) and Others (0.02%)
Population Density 270 (Persons per Sq. km.)
Sex Ratio 918 (Females per 1000 Males)
Child Ratio (Age Group 0-6 Year) 925 (Females per 1000 Males)
Number of Live Births (2014) 37,920 (Persons), 20,154 (Males), 17,766 (Females)
Number of Deaths (2014) 1,908 (Persons), 1,081 (Males), 827 (Females)
Literacy Rate (In %age) 64.03 (Persons), 74.92 (Males), 52.14 (Females)
Literates 9,85,708 (Persons), 6,01,988 (Males), 3,83,720 (Females)
Illiterates 8,76,851 (Persons), 3,69,356 (Males), 5,07,495 (Females)
Major Religions Hindu (93.35%), Muslim (5.56%), Christian (0.21%), Sikh (0.09%), Buddhist(0.09%) and Jain (0.03%)
Schedule Caste Population 4,21,661 (Persons), 2,18,996 (Males), 2,02,665 (Females), Percentage of SC inTotal Population (1.02)
Major Schedule Caste Population Chamar, Dhusia, Jhusia, Jatava (51.6%); Kol (16.65%); Dhobi (6.17%); Dusadh(4.86%); Dhangar (4.34%)
Schedule Tribe Population 3,85,018 (Persons), 1,97,825 (Males), 1,87,193 (Females), Percentage of ST inTotal Population (33.94)
Major Schedule Tribe Population
Gond, Dhuria, Nayak, Ojha, Pathari, Raj Gond (in the districts of Mehrajganj,Sidharth Nagar, Basti, Gorakhpur, Deoria, Mau, Azamgarh, Jonpur, Balia, Gazipur,Varanasi, Mirzapur and Sonbhadra) (44.44%); Kharwar, Khairwar (in the districtsof Deoria, Balia, Ghazipur, Varanasi and Sonbhadra) (21.3%); Chero (in thedistricts of Sonbhadra and Varanasi) (10.2%); Baiga (in the district of Sonbhadra)(7.79%); Pankha, Panika (in the districts of Sonbhadra and Mirzapur) (6.2%)
Number of Total Workers 7,30,399 (Persons), 4,63,611 (Males), 2,66,788 (Females)Labour Force Participation Rate(2011-2012)
40.39% (Rural), 34.18% (Urban)
Major Source of Income IndustryGross District Domestic Product(2013-14) (Rs. in Lakh)
8,97,040 At Current Price / 5,39,074 At Constant (2004-2005) Prices
Net District Domestic Product(2013-14) (Rs. in Lakh)
6,89,757 At Current Price / 4,41,014 At Constant (2004-2005) Prices
Per Capita Income (NDDP, At FactorCost) (2013-14) (In Rs.)
33,870 At Current Price / 21,656 At Constant (2004-2005) Prices
Number of Tourists (2015) 7,97,520 (Domestic Tourist) / 935 (Foreign Tourist)
Major Tourist PlacesFossils Park- A Geological Heritage, Renukot Alluminium Plant, Mukkha Fall,Renukeshwar Temple, Vijaygarh Fort, Dalla Jp Cement Plant, Veer Lorik Patthar,Shiv Dwar, Echo Point Markundi.
Note: A ll figures for 2011 Census, Otherwise year is mentioned.
No. Particulars Page No.
1 Administrative Setup 1-10
Location Map | District w ith Sub-Districts | Reference Map of District |About District | Administrative Unit | Villages | Towns | Wards |Panchayats
2 Demographics 11-32
Population l Sex Ratio | Density | Child Population | Child Sex Ratio |Decadal Growth | Age Group Population | Age Group Population ofCurrently Married | Economically Active Population | Ageing Population |Dependency Ratio | Single Year Age Population | Scheduled CastePopulation | Scheduled Tribe Population | Religious Population | CD BlockPopulation
3 Economy 33-43
GDP/NDP | Per Capita Income | Households by Income Groups |Disposable Income | Banking | Lead Banks | Revenue Receipts fromEntertainment Tax | Fair Price Shops/Ration Cards Issued | Investmentand Debt
4 Market Size 44-55
Monthly Per Capita Expenditure | Estimated Annual Expenditure /Average Per Capita Consumer Expenditure on Services and DurableGoods
5 Life Style 56-60
Households having Radio/Transistor, Television | Households havingComputer/Laptop/Internet | Households having Telephone/MobilePhone | Households having Bicycle, Scooter/Motor Cycle/Moped &Car/Jeep/Van | Circulation of Dailies | Printing Presses
6 Infrastructure 61-75
Occupied Houses used as Shops/Offices | Amenities | Sanitation | Roadlength | Vehicle Registered | Electricity | Post Office & PIN Code |Tourism | LPG Distributors
7 Industries 76-96
Factories, Capital Invested and Persons Employed (2 & 3 digit levelIndustries) | Factories by Type of Organisation/Ownership |Consumption of Fuels | Manufacturing Industries Share of GDP |Outstanding Credit of SCBs according to Industrial Occupation | Micro,Small and Medium Enterprises | Ongoing Projects
8 Labour and Workforce 97-104
Total Workers | Main Workers | Marginal Workers | Non-Workers |Average Wages/Earning per Day Received by Usual Principal ActivityStatus | Employment Indicators
9 Agriculture 105-122
Land Utilistation | Production of Major Food Crops | Production ofCommercial Crops | Production of Fruit & Vegetable Crops | Productionof Spices | Consumption of Fertilisers | Regulated Markets | VeterinaryInstitutions | Milk Production | Warehouse | Livestock Population |Poultry Population | Irrigation | Land Holdings | Farmer
10 Education 123-129
Literacy Rate | Population by Educational Level | Census Houses Usedas School/College etc. | Enrollment | Enrollment by Medium of Instruction| Gross/Net Enrollment Ratio | Teachers | Gini Coefficient Education |Population by Mother Tongue
11 Health 130-142
Health Institutions | Family Welfare Clinic/Centre | Live Births Registered| Deaths Registered | Infant Deaths Registered | Disabled Population byType of Disability | Houses used for Hospital/Dispensary | Households byMarried Couples per Household and Dwelling Rooms | Maternal and ChildHealth Indicators (HMIS) | Family Welfare Programmes
12 Environment and Pollution 143-146
Geographical Area | Wastelands | Forest Cover | Rainfall | Latitude,Longitude and Altitude | Water Quality
13 Housing 147-158
Households | Houseless Households | Houseless Population | Standardof Living Index | Housing Condition | House and Their Uses | SlumPopulation
14 Crime & Law 159-161
Incidence of IPC Crime | Convicts | Police Stations | Police Officer/Officials| Judicial Officers
15 Social and Welfare Schemes 162-169
Mahatma Gandhi National Rural Employment Guarantee Scheme(MGNREGS) | Indira Awaas Yojana (IAY) | District Rural DevelopmentAgencies (DRDA) | National Rural Drinking Water Programme (NRDWP) |Nirmal Bharat Abhiyan (NBA) | Swachh Bharat Mission (SBM)-Gramin |Self-Help Groups (SHGs) | Aadhaar Card (UIDAI) Enrollments
16 Electoral 170-172
Vote Distribution of Major Parties (Parliamentary Election-2014 andAssembly Election 2012) | Name and Address of MPs/MLAs | Electors
17 Annexure - I to IV 173-239
18 Useful Contacts 240
19 Abbreviations & Sources 241
20 Concepts and Definitions 242-245
21 Disclaimer & Terms of Use 246
Uttar PradeshDistrict FactbookDistrict Factbook™™ Sonbhadra District
1
Sonbhadra DistrictUttar Pradesh
District FactbookDistrict Factbook™™
Administrative Setup
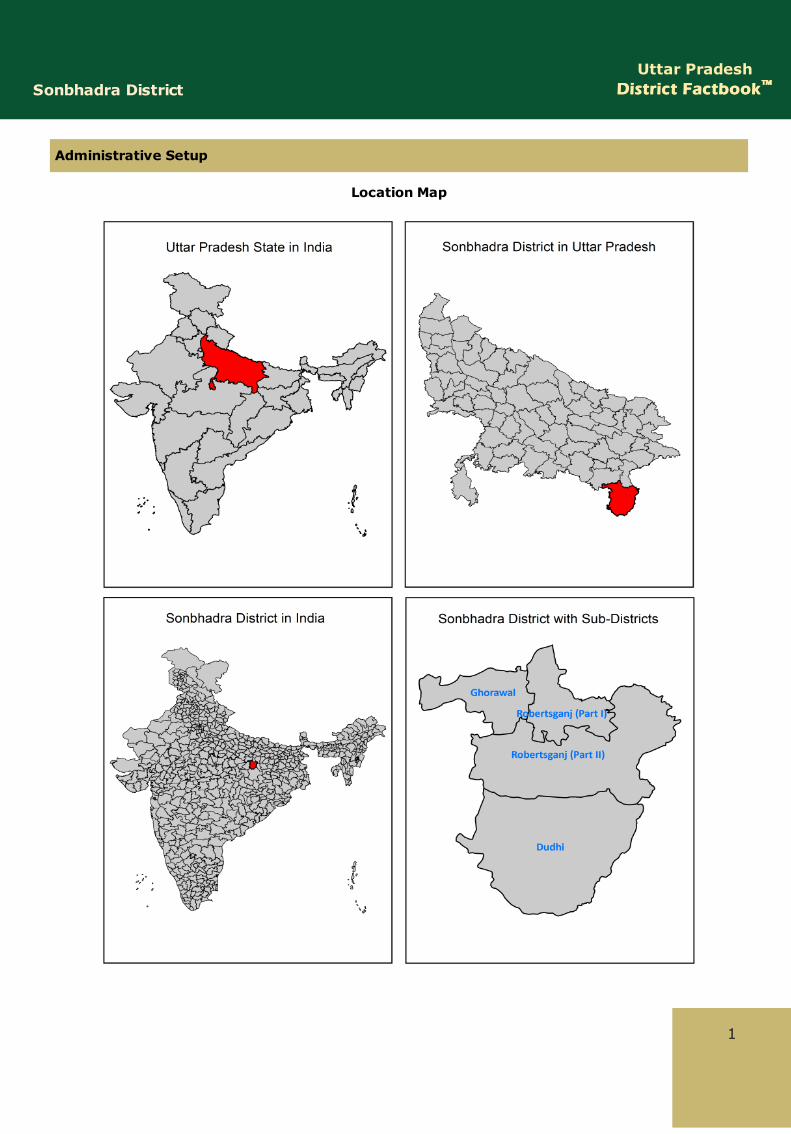
Location Map
Uttar PradeshDistrict FactbookDistrict Factbook™™ Sonbhadra District
Administrative Setup
2
3
Sonbhadra DistrictUttar Pradesh
District FactbookDistrict Factbook™™
Administrative Setup
Uttar PradeshDistrict FactbookDistrict Factbook™™ Sonbhadra District
4
5
Sonbhadra DistrictUttar Pradesh
District FactbookDistrict Factbook™™
About Sonbhadra District
Sonbhadra district, a part of Mirzapur division is a district of Uttar Pradesh state with itsadministrative headquarters located at Robertsganj town. From the religious and culturalperspective the district is quit developed since ancient times which even mentioned inthe great epic Ramayana and Mahabharata. Huyen found in the place is the notablecultural symbol. During the period of Mahabharata war, many rulers were made prisonersin the place by the king called Jarasandh.The King of Kantipuri wakatak Nagvanshidynasty made the place as their capital in the third century and ruled it till ninthcenturies. Later, the place was also ruled by the kings of Abhor dynasty and kings of kol.The place is full of forts built by different rulers during their periods such as Agori Fort byGadanshah, Vijaygarh Fort by Kashi NareshChet Singh and Sodhrigarh Durg by Garhwalkings.
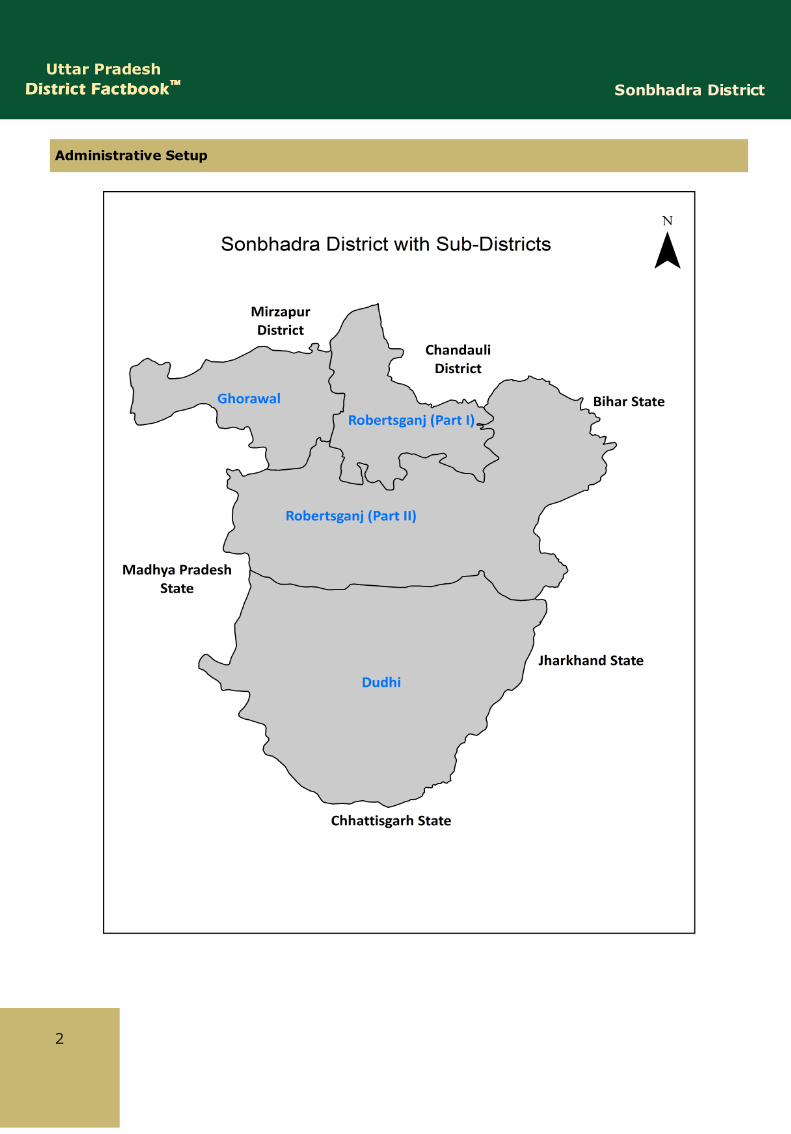
Geographically, the district lies at 24°68’N latitude, 83 °07’E longitude and 87m altitude .The district encompasses a geographical area of 6,905 sq.km. and it is bounded byMirzapur district on the North-West, Chandoli district of Jharkhand on the East, Koriyaand Surguja district of Chhattisgarh on the South and Singrauli district of MadyhaPradesh on the West. The climate of the district remains extremely hot during thesummer and fairly cold during the winter. The actual rainfall in the district was 684.9 mmin the year of 2015-16.
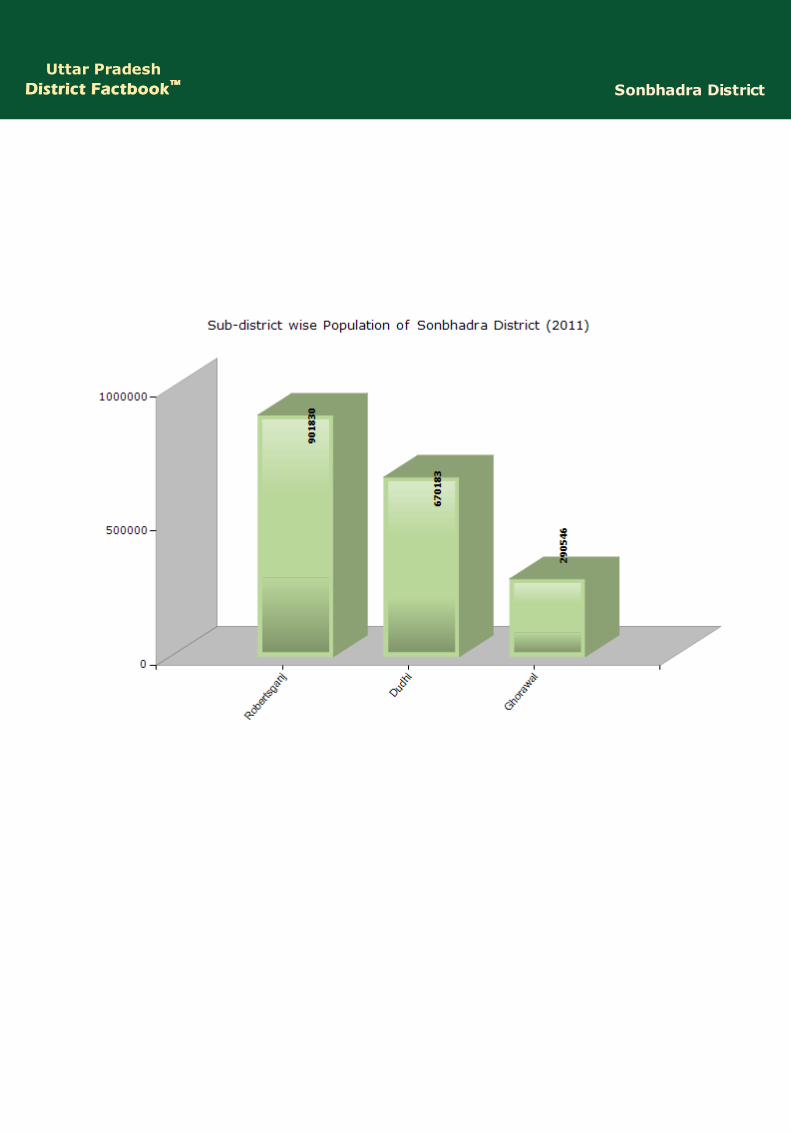
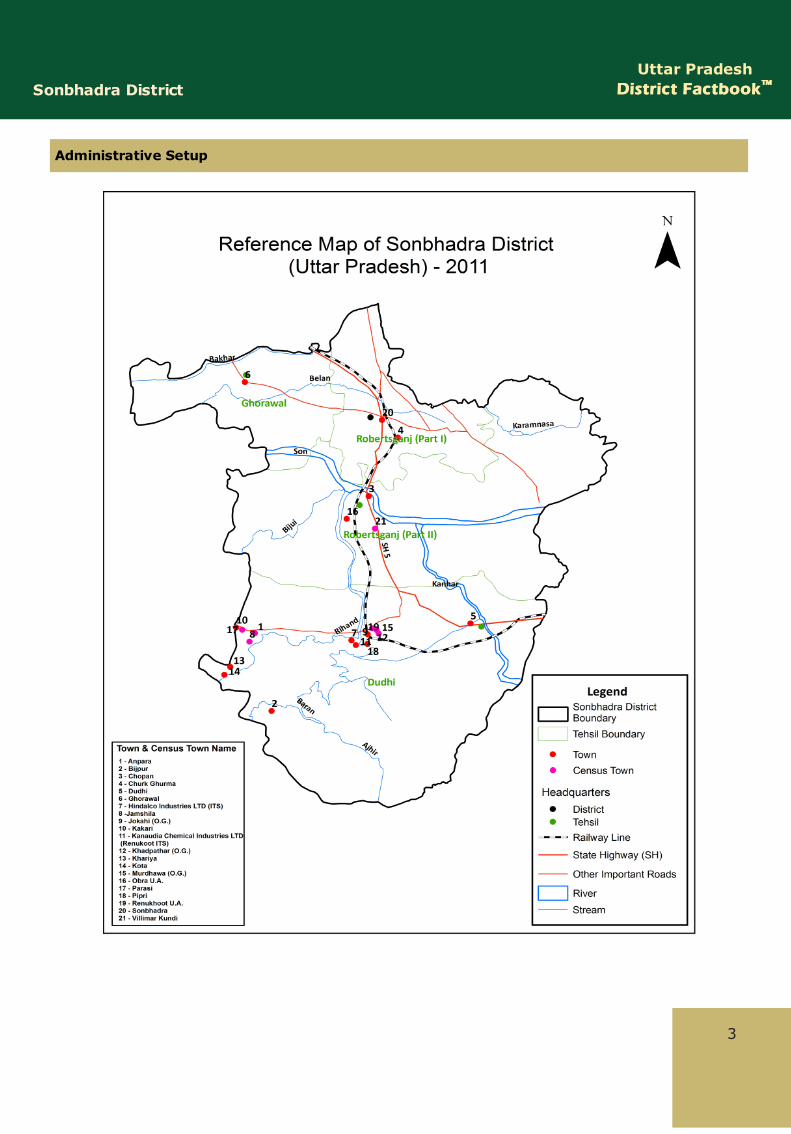
Administration wise, the district is divided into 3 tehsils namely Robertsganj, Ghorawaland Dudhi. Moreover, it companies 18 towns and 1429 villages. There are 1 Lok Sabhaseat and 4 Assembly constituencies in the district.
Uttar PradeshDistrict FactbookDistrict Factbook™™ Sonbhadra District
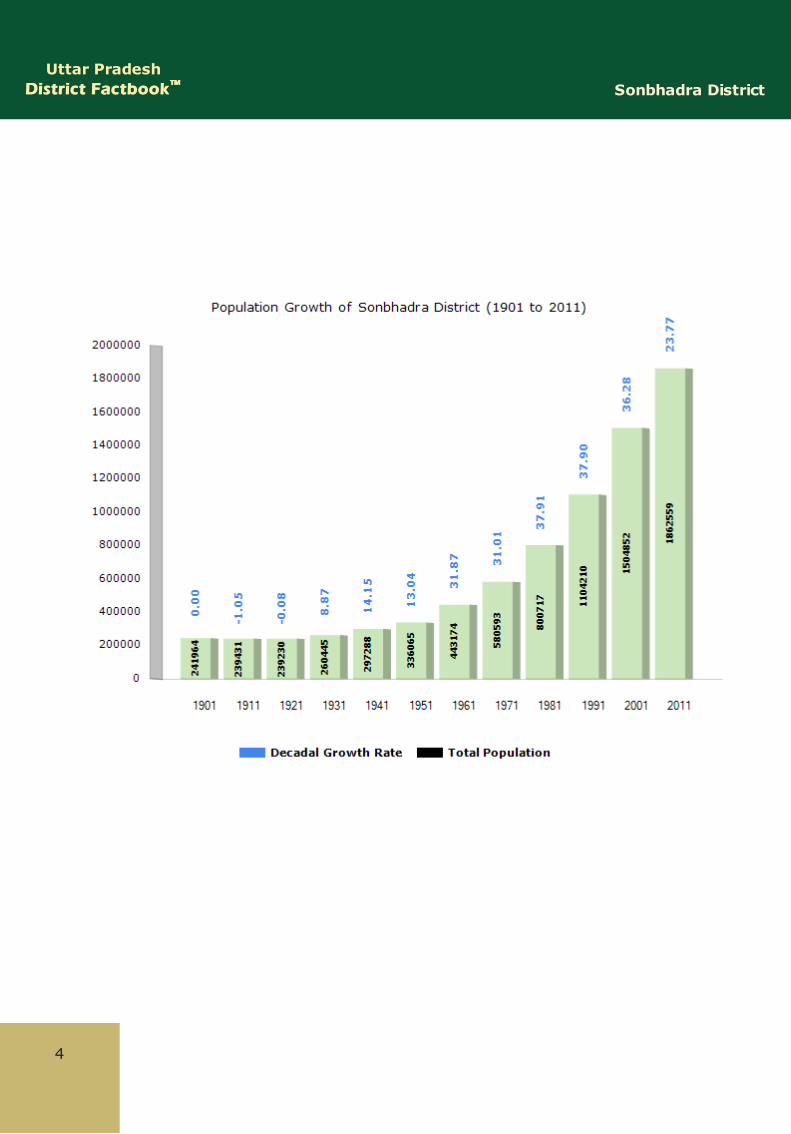
According to 2011 census the district has a population of 18,62,559 (persons) including9,71,344 (males) and 8,91,215 (females). The district has a sex ratio of 918 females forevery 1000 males. In the year 2001-2011 the population growth rate in the district was27.27% (persons) out of which 26.00% (males) and 28.67% (females). The major religionin the district in Hindu with 93.35% of the total population.
The economy of the district is mainly dependent on agriculture. Some of its chiefagricultural products are rice, wheat, rapeseed, mustard, potato, pea, garlic, onion, etc.The adoption of the new agricultural technologies amongst the famers of the districthelps to increase the production of various agricultural items. It is also popularly knownas the “Energy Capital of India” due to having numerous electrical power stations aroundthe Govind Ballabh Pant Sagar. The district has many forests and hills. Most of the hills inthe district have coal whereas some of them have limestone. Therefore, it is also knownas the industrial heaven. Some of the foremost industries in the district are ChurkCement Factory, Kanoria Chemicals, Renusagar Power, Dala Cement Factory, ChunarCement Factory, Rihand Thermal Power Plant, Hi-Tech Carbon, Rihand Thermal PowerPlant, etc. Every year a huge chunk of revenue comes from these industries helps in itseconomy to a remarkable extent. In 2006 the Ministry of Panchayati Raj declaredSonbhadra as one of the country’s 250 most backward districts that is currentlyreceiveing funds from the Backward Regions Grant Fund (BRGF) Programme. In the year2013-2014 the gross domestic product in the district was Rs . 8,97,040 lakh at currentprice.
The district is an abode of numerous reputed educational institutions. It providesplatform for higher education. Some of its recognised educational institutions areGurudwara Inter College, Rail Karmchari Inter College, Govt. Girls Inter College, BharatiyaInter College, G.N. Balika Inter College, R.S.M. Inter College, Babu Ram SinghMahavidyalaya, Sant Keenaram Post Graduate College, etc. As per 2011 census theliteracy rate in the district is 64.03% (persons), 74.92% (males) and 52.14% (females).
Narendra Kumar Kushwaha, an eminent Indian politician and a member of 14th Lok Sabhafrom the Mirzapur constituency was born on 1st July 1967 at Chopan in the district. He isa member of the Bahujan Samaj Party (BSP).
The district has numerous centres of attraction with religious and historical significancewhich allures many travellers from different parts of the country as well as world.Vijaygarh Fort, a ruined fort is located at a distance of 30 km. from Robertsganj. Nativesof the district believe that in the period of Mahabharata, the fort was built by Banasurwhich was renovated byMaharaja Vijay Pal in 1040 AD. Rihand Dam, a solidgravity dam islocated at Pipri in the Sonbhadra district. This reservoir is also popularly known as GovindBallabh Pant Sagar. Salkhan Fossils Park or Sonbhadra Fossils Park is a fossil park issituated 12 km. Away from Robertsganj. The fossils in the park are approximately 1400million years old. Some other prominent places of interest in the district are Agori Fort,Veer Lorik Patthar, Sahid Park, Mukka Fall, Eco point, Dhandhraul Dam, Chil ka lake, AshDam Park, Shivdwar Temple, Mata Vaishnav Temple, Lotus Temple, etc.
6
7
Sonbhadra DistrictUttar Pradesh
District FactbookDistrict Factbook™™
Administrative Setup Administrative UnitAdministrative Division:- Mirzapur
Sub-districts:
1. Dudhi
2. Ghorawal
3. Robertsganj
Towns:
1. Anpara (CT) 11. Khariya (CT)
2. Bijpur (CT) 12. Kota (CT)
3. Chopan (NP) 13. Obra (NP)
4. Churk Ghurma (NP) 14. Parasi (CT)
5. Dudhi (NP) 15. Pipri (NP)
6. Ghorawal (NP) 16. Renukoot (NP)
7. Hindalco Industries Ltd. (Renukoot) (ITS) 17. Sonbhadra (NPP)
8. Jamshila (CT) 18. Villimar Kundi (CT)
9. Kakari (CT)
10. Kanaudia Chamical & Industries Ltd. (Renukoot) (ITS)
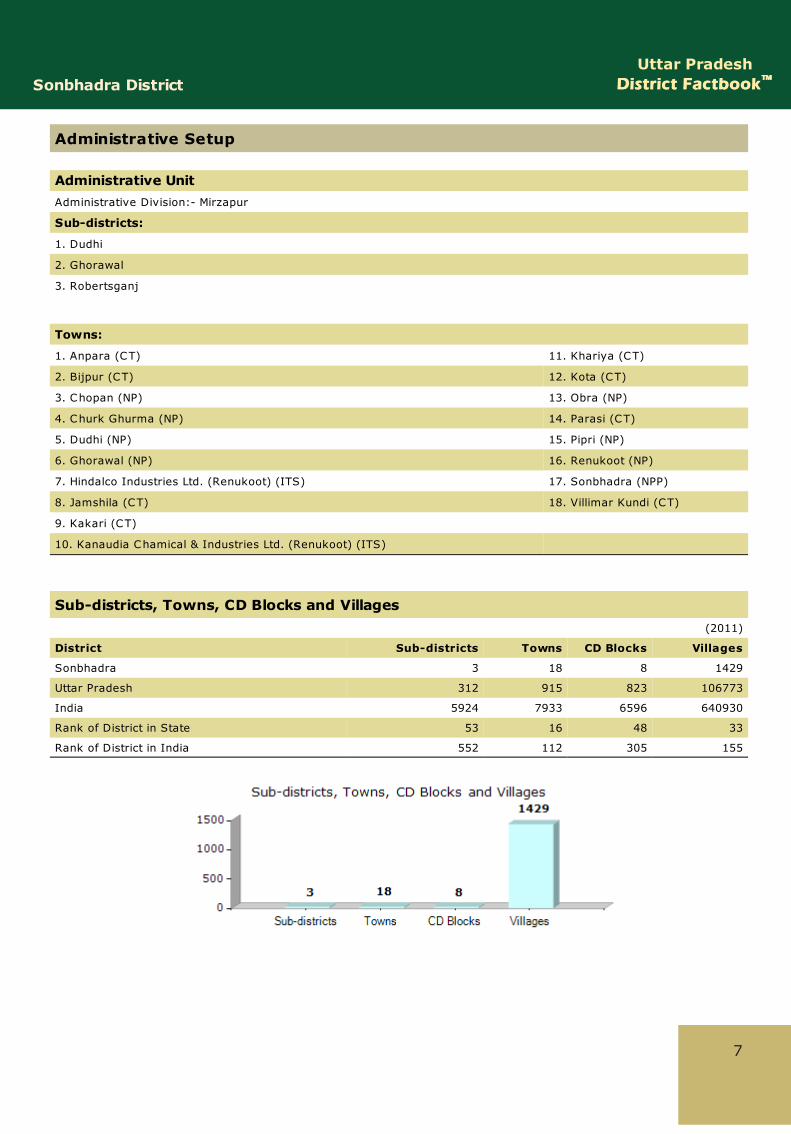
Sub-districts, Towns, CD Blocks and Villages(2011)
District Sub-districts Towns CD Blocks Villages
Sonbhadra 3 18 8 1429
Uttar Pradesh 312 915 823 106773
India 5924 7933 6596 640930
Rank of District in State 53 16 48 33
Rank of District in India 552 112 305 155
11
Sonbhadra DistrictUttar Pradesh
District FactbookDistrict Factbook™™
Demographics
Population(2011)
Residence District Persons Male Female
Total Sonbhadra 1862559 971344 891215
Uttar Pradesh 199812341 104480510 95331831
India 1210569573 623121843 587447730
Rank of District in State 51 51 49
Rank of District in India 255 248 260
Rural Sonbhadra 1548217 803345 744872
Uttar Pradesh 155317278 80992995 74324283
India 833463448 427632643 405830805
Rank of District in State 50 52 47
Rank of District in India 196 193 198
Urban Sonbhadra 314342 167999 146343
Uttar Pradesh 44495063 23487515 21007548
India 377106125 195489200 181616925
Rank of District in State 41 40 42
Rank of District in India 293 285 300
37
Sonbhadra DistrictUttar Pradesh
District FactbookDistrict Factbook™™
Economy
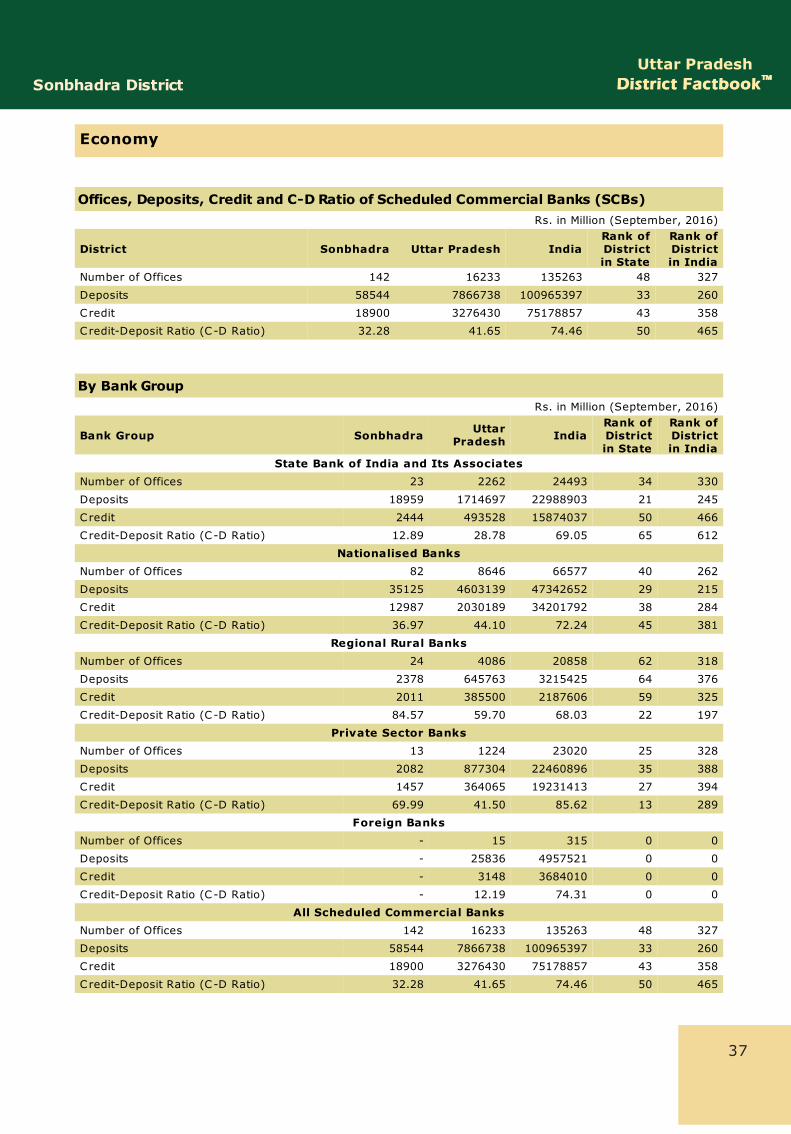
Offices, Deposits, Credit and C-D Ratio of Scheduled Commercial Banks (SCBs)Rs. in Million (September, 2016)
District Sonbhadra Uttar Pradesh IndiaRank ofDistrictin State
Rank ofDistrictin India
Number of Offices 142 16233 135263 48 327
Deposits 58544 7866738 100965397 33 260
Credit 18900 3276430 75178857 43 358
Credit-Deposit Ratio (C-D Ratio) 32.28 41.65 74.46 50 465
By Bank GroupRs. in Million (September, 2016)
Bank Group Sonbhadra UttarPradesh India
Rank ofDistrictin State
Rank ofDistrictin India
State Bank of India and Its AssociatesNumber of Offices 23 2262 24493 34 330
Deposits 18959 1714697 22988903 21 245
Credit 2444 493528 15874037 50 466
Credit-Deposit Ratio (C-D Ratio) 12.89 28.78 69.05 65 612
Nationalised BanksNumber of Offices 82 8646 66577 40 262
Deposits 35125 4603139 47342652 29 215
Credit 12987 2030189 34201792 38 284
Credit-Deposit Ratio (C-D Ratio) 36.97 44.10 72.24 45 381
Regional Rural BanksNumber of Offices 24 4086 20858 62 318
Deposits 2378 645763 3215425 64 376
Credit 2011 385500 2187606 59 325
Credit-Deposit Ratio (C-D Ratio) 84.57 59.70 68.03 22 197
Private Sector BanksNumber of Offices 13 1224 23020 25 328
Deposits 2082 877304 22460896 35 388
Credit 1457 364065 19231413 27 394
Credit-Deposit Ratio (C-D Ratio) 69.99 41.50 85.62 13 289
Foreign BanksNumber of Offices - 15 315 0 0
Deposits - 25836 4957521 0 0
Credit - 3148 3684010 0 0
Credit-Deposit Ratio (C-D Ratio) - 12.19 74.31 0 0
All Scheduled Commercial BanksNumber of Offices 142 16233 135263 48 327
Deposits 58544 7866738 100965397 33 260
Credit 18900 3276430 75178857 43 358
Credit-Deposit Ratio (C-D Ratio) 32.28 41.65 74.46 50 465
Uttar PradeshDistrict FactbookDistrict Factbook™™ Sonbhadra District
Market Size
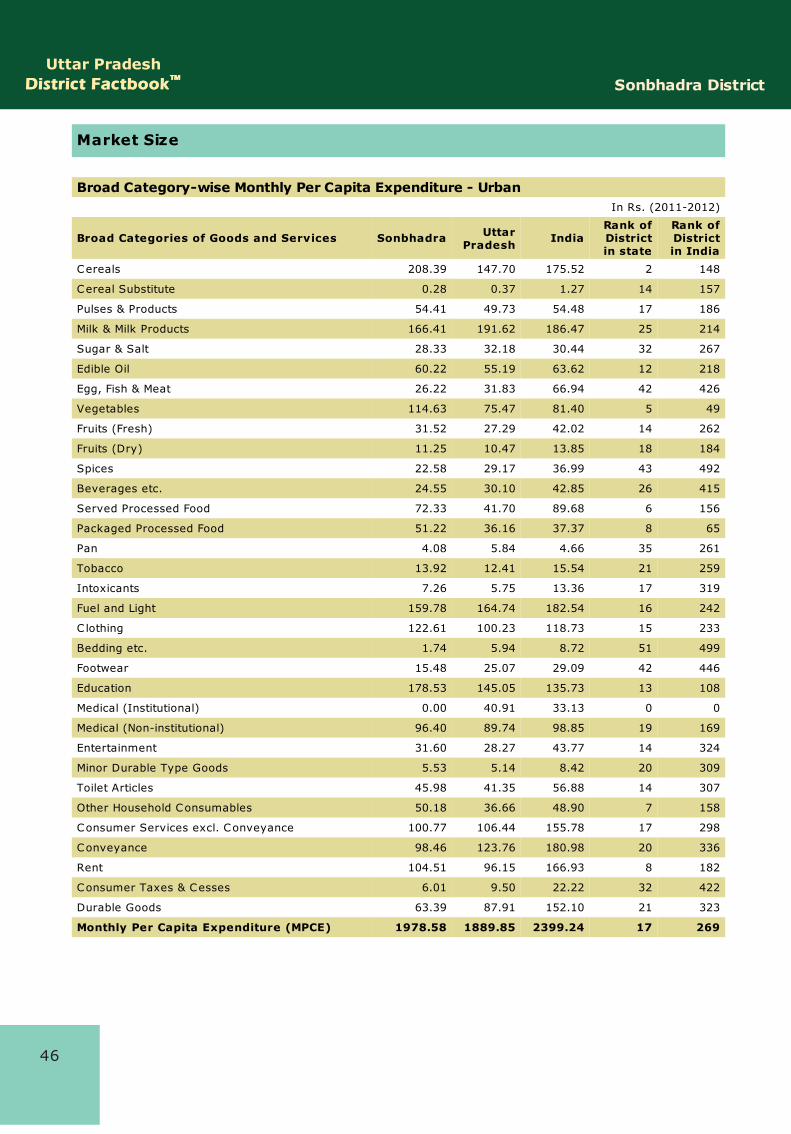
Broad Category-wise Monthly Per Capita Expenditure - Urban In Rs. (2011-2012)
Broad Categories of Goods and Services Sonbhadra UttarPradesh India
Rank ofDistrictin state
Rank ofDistrictin India
Cereals 208.39 147.70 175.52 2 148
Cereal Substitute 0.28 0.37 1.27 14 157
Pulses & Products 54.41 49.73 54.48 17 186
Milk & Milk Products 166.41 191.62 186.47 25 214
Sugar & Salt 28.33 32.18 30.44 32 267
Edible Oil 60.22 55.19 63.62 12 218
Egg, Fish & Meat 26.22 31.83 66.94 42 426
Vegetables 114.63 75.47 81.40 5 49
Fruits (Fresh) 31.52 27.29 42.02 14 262
Fruits (Dry) 11.25 10.47 13.85 18 184
Spices 22.58 29.17 36.99 43 492
Beverages etc. 24.55 30.10 42.85 26 415
Served Processed Food 72.33 41.70 89.68 6 156
Packaged Processed Food 51.22 36.16 37.37 8 65
Pan 4.08 5.84 4.66 35 261
Tobacco 13.92 12.41 15.54 21 259
Intoxicants 7.26 5.75 13.36 17 319
Fuel and Light 159.78 164.74 182.54 16 242
C lothing 122.61 100.23 118.73 15 233
Bedding etc. 1.74 5.94 8.72 51 499
Footwear 15.48 25.07 29.09 42 446
Education 178.53 145.05 135.73 13 108
Medical (Institutional) 0.00 40.91 33.13 0 0
Medical (Non-institutional) 96.40 89.74 98.85 19 169
Entertainment 31.60 28.27 43.77 14 324
Minor Durable Type Goods 5.53 5.14 8.42 20 309
Toilet Articles 45.98 41.35 56.88 14 307
Other Household Consumables 50.18 36.66 48.90 7 158
Consumer Services excl. Conveyance 100.77 106.44 155.78 17 298
Conveyance 98.46 123.76 180.98 20 336
Rent 104.51 96.15 166.93 8 182
Consumer Taxes & Cesses 6.01 9.50 22.22 32 422
Durable Goods 63.39 87.91 152.10 21 323
Monthly Per Capita Expenditure (MPCE) 1978.58 1889.85 2399.24 17 269
46
Uttar PradeshDistrict FactbookDistrict Factbook™™ Sonbhadra District
Life Style
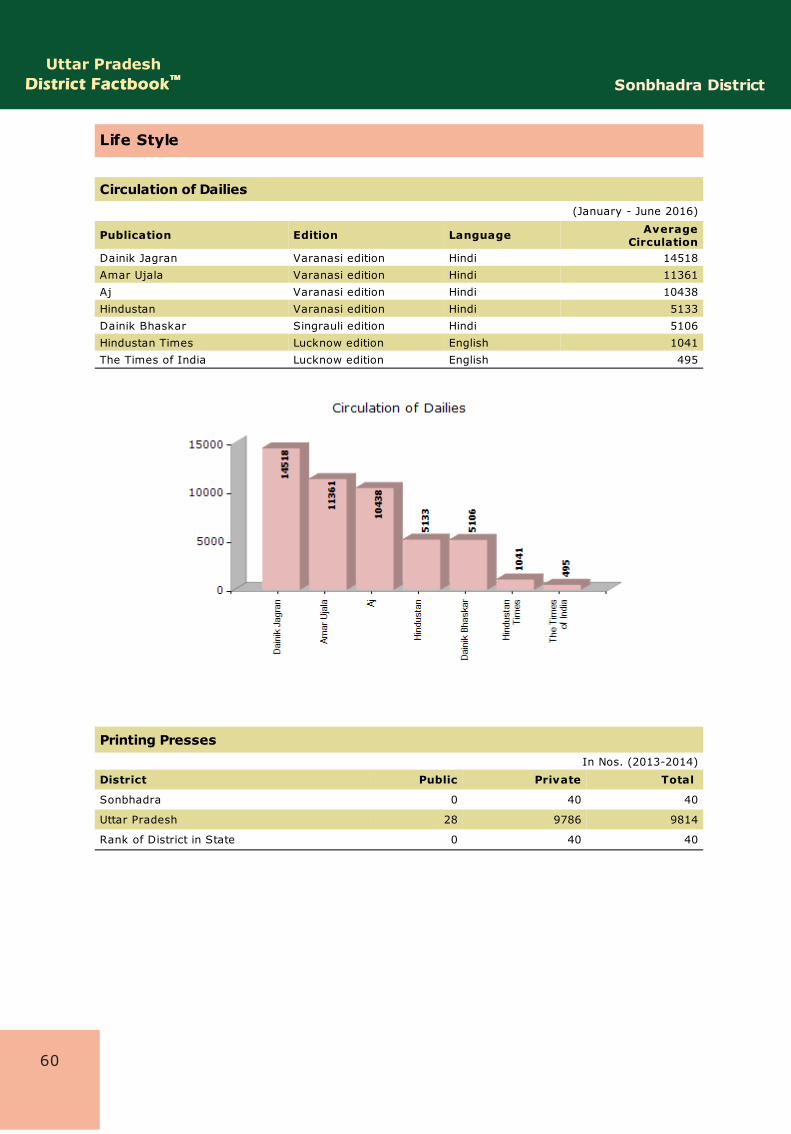
Circulation of Dailies (January - June 2016)
Publication Edition Language AverageCirculation
Dainik Jagran Varanasi edition Hindi 14518
Amar Ujala Varanasi edition Hindi 11361
Aj Varanasi edition Hindi 10438
Hindustan Varanasi edition Hindi 5133
Dainik Bhaskar Singrauli edition Hindi 5106
Hindustan Times Lucknow edition English 1041
The Times of India Lucknow edition English 495
Printing PressesIn Nos. (2013-2014)
District Public Private Total
Sonbhadra 0 40 40
Uttar Pradesh 28 9786 9814
Rank of District in State 0 40 40
60
Uttar PradeshDistrict FactbookDistrict Factbook™™ Sonbhadra District
Infrastructure
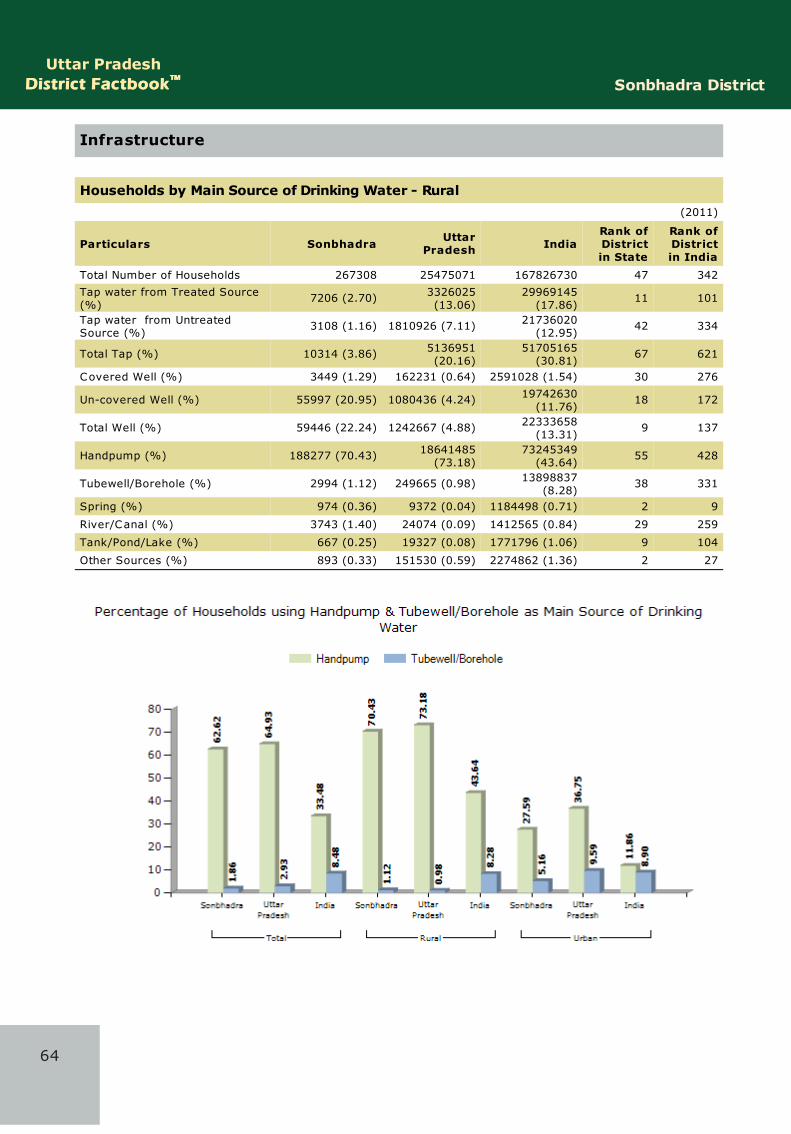
Households by Main Source of Drinking Water - Rural(2011)
Particulars Sonbhadra UttarPradesh India
Rank ofDistrictin State
Rank ofDistrictin India
Total Number of Households 267308 25475071 167826730 47 342
Tap water from Treated Source(%)
7206 (2.70) 3326025(13.06)
29969145(17.86)
11 101
Tap water from UntreatedSource (%)
3108 (1.16) 1810926 (7.11) 21736020(12.95)
42 334
Total Tap (%) 10314 (3.86) 5136951(20.16)
51705165(30.81)
67 621
Covered Well (%) 3449 (1.29) 162231 (0.64) 2591028 (1.54) 30 276
Un-covered Well (%) 55997 (20.95) 1080436 (4.24) 19742630(11.76)
18 172
Total Well (%) 59446 (22.24) 1242667 (4.88) 22333658(13.31)
9 137
Handpump (%) 188277 (70.43) 18641485(73.18)
73245349(43.64)
55 428
Tubewell/Borehole (%) 2994 (1.12) 249665 (0.98) 13898837(8.28)
38 331
Spring (%) 974 (0.36) 9372 (0.04) 1184498 (0.71) 2 9
River/Canal (%) 3743 (1.40) 24074 (0.09) 1412565 (0.84) 29 259
Tank/Pond/Lake (%) 667 (0.25) 19327 (0.08) 1771796 (1.06) 9 104
Other Sources (%) 893 (0.33) 151530 (0.59) 2274862 (1.36) 2 27
64
Uttar PradeshDistrict FactbookDistrict Factbook™™ Sonbhadra District
Infrastructure
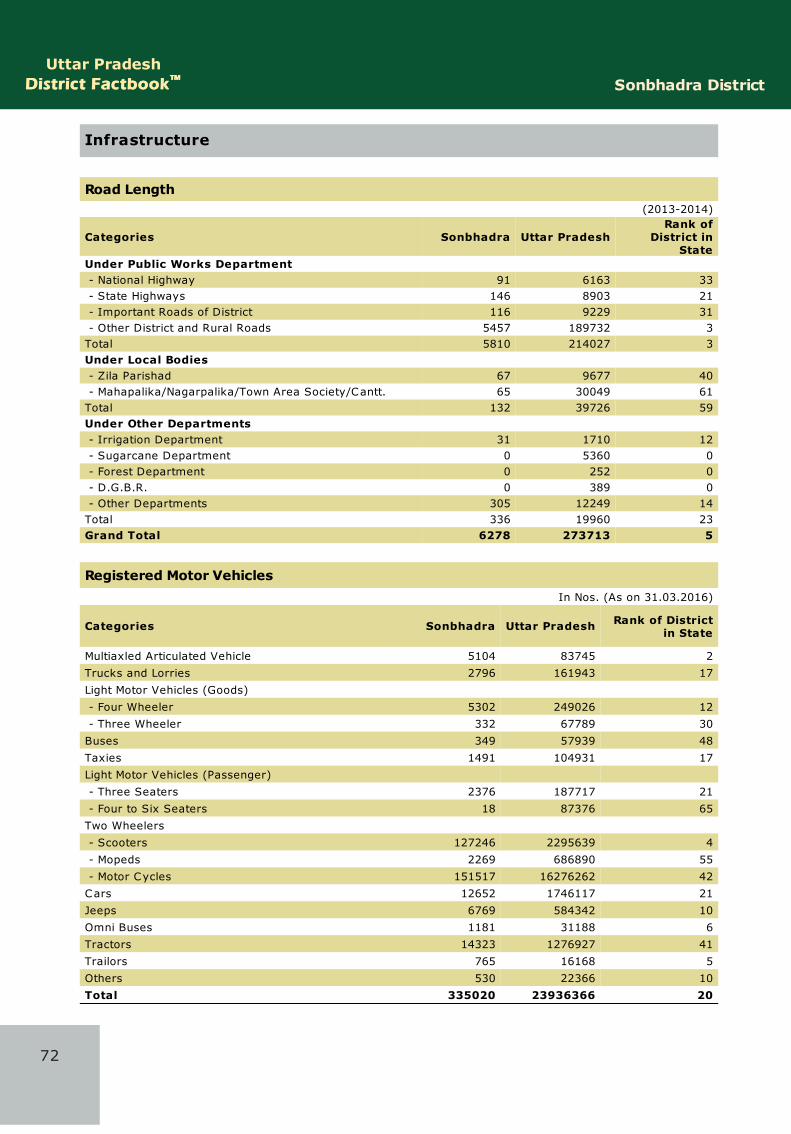
Road Length(2013-2014)
Categories Sonbhadra Uttar PradeshRank of
District inState
Under Public Works Department - National Highway 91 6163 33 - State Highways 146 8903 21 - Important Roads of District 116 9229 31 - Other District and Rural Roads 5457 189732 3Total 5810 214027 3Under Local Bodies - Zila Parishad 67 9677 40 - Mahapalika/Nagarpalika/Town Area Society/Cantt. 65 30049 61Total 132 39726 59Under Other Departments - Irrigation Department 31 1710 12 - Sugarcane Department 0 5360 0 - Forest Department 0 252 0 - D.G.B.R. 0 389 0 - Other Departments 305 12249 14Total 336 19960 23Grand Total 6278 273713 5
Registered Motor VehiclesIn Nos. (As on 31.03.2016)
Categories Sonbhadra Uttar Pradesh Rank of Districtin State
Multiaxled Articulated Vehicle 5104 83745 2
Trucks and Lorries 2796 161943 17
Light Motor Vehicles (Goods)
- Four Wheeler 5302 249026 12
- Three Wheeler 332 67789 30
Buses 349 57939 48
Taxies 1491 104931 17
Light Motor Vehicles (Passenger) - Three Seaters 2376 187717 21
- Four to Six Seaters 18 87376 65
Two Wheelers
- Scooters 127246 2295639 4
- Mopeds 2269 686890 55
- Motor Cycles 151517 16276262 42
Cars 12652 1746117 21
Jeeps 6769 584342 10
Omni Buses 1181 31188 6
Tractors 14323 1276927 41
Trailors 765 16168 5
Others 530 22366 10
Total 335020 23936366 20
72
Uttar PradeshDistrict FactbookDistrict Factbook™™ Sonbhadra District
Industries
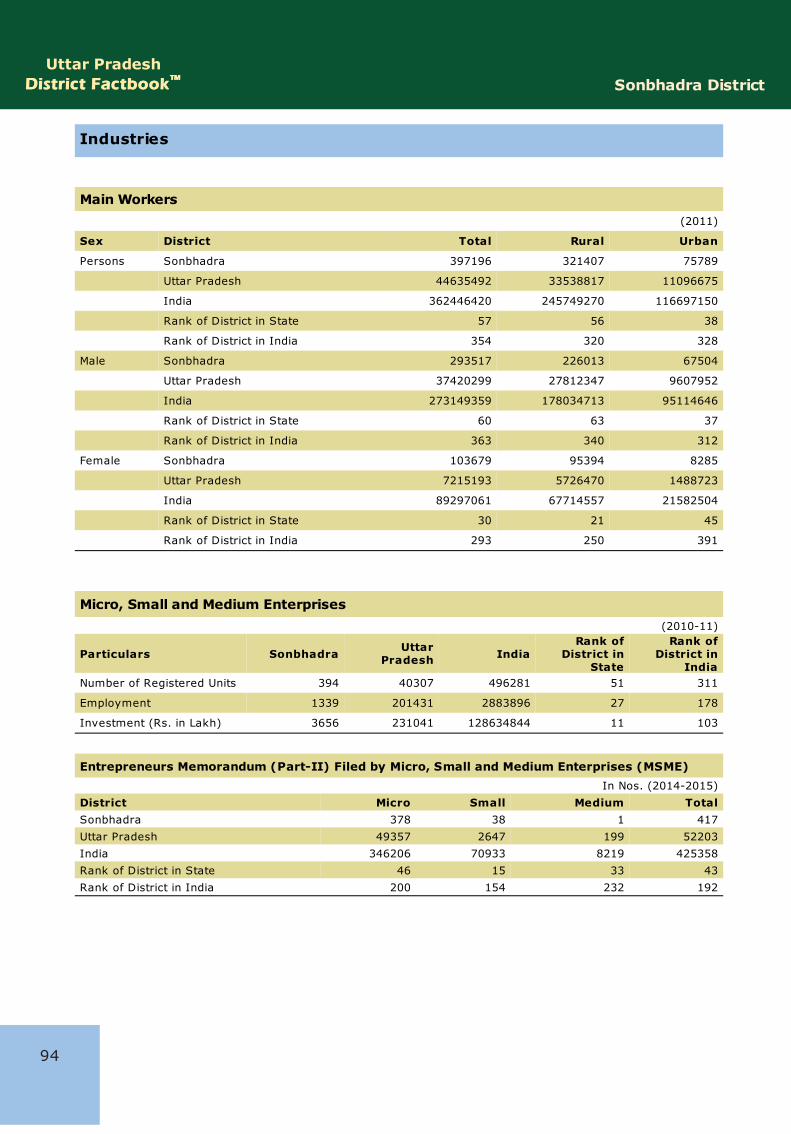
Main Workers(2011)
Sex District Total Rural Urban
Persons Sonbhadra 397196 321407 75789
Uttar Pradesh 44635492 33538817 11096675
India 362446420 245749270 116697150
Rank of District in State 57 56 38
Rank of District in India 354 320 328
Male Sonbhadra 293517 226013 67504
Uttar Pradesh 37420299 27812347 9607952
India 273149359 178034713 95114646
Rank of District in State 60 63 37
Rank of District in India 363 340 312
Female Sonbhadra 103679 95394 8285
Uttar Pradesh 7215193 5726470 1488723
India 89297061 67714557 21582504
Rank of District in State 30 21 45
Rank of District in India 293 250 391
Micro, Small and Medium Enterprises(2010-11)
Particulars Sonbhadra UttarPradesh India
Rank ofDistrict in
State
Rank ofDistrict in
IndiaNumber of Registered Units 394 40307 496281 51 311
Employment 1339 201431 2883896 27 178
Investment (Rs. in Lakh) 3656 231041 128634844 11 103
Entrepreneurs Memorandum (Part-II) Filed by Micro, Small and Medium Enterprises (MSME)In Nos. (2014-2015)
District Micro Small Medium TotalSonbhadra 378 38 1 417
Uttar Pradesh 49357 2647 199 52203
India 346206 70933 8219 425358
Rank of District in State 46 15 33 43
Rank of District in India 200 154 232 192
94
97
Sonbhadra DistrictUttar Pradesh
District FactbookDistrict Factbook™™
Labour and Workforce
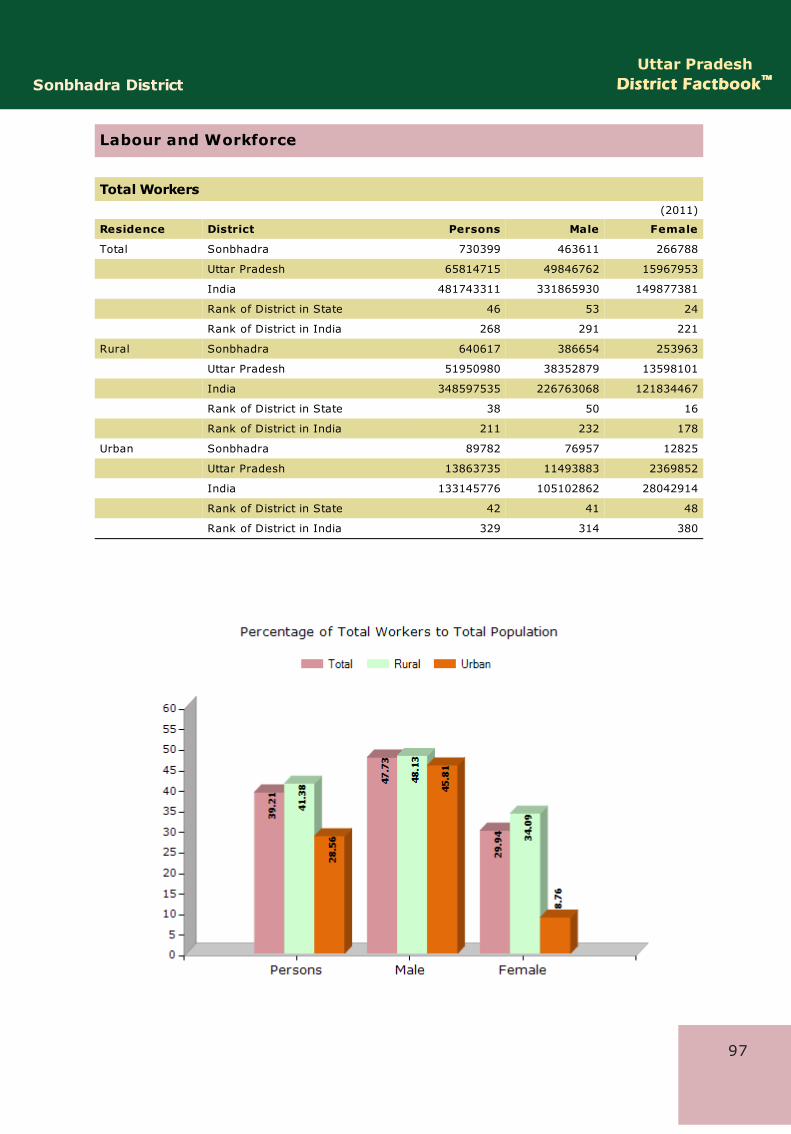
Total Workers(2011)
Residence District Persons Male Female
Total Sonbhadra 730399 463611 266788
Uttar Pradesh 65814715 49846762 15967953
India 481743311 331865930 149877381
Rank of District in State 46 53 24
Rank of District in India 268 291 221
Rural Sonbhadra 640617 386654 253963
Uttar Pradesh 51950980 38352879 13598101
India 348597535 226763068 121834467
Rank of District in State 38 50 16
Rank of District in India 211 232 178
Urban Sonbhadra 89782 76957 12825
Uttar Pradesh 13863735 11493883 2369852
India 133145776 105102862 28042914
Rank of District in State 42 41 48
Rank of District in India 329 314 380
105
Sonbhadra DistrictUttar Pradesh
District FactbookDistrict Factbook™™
Agriculture
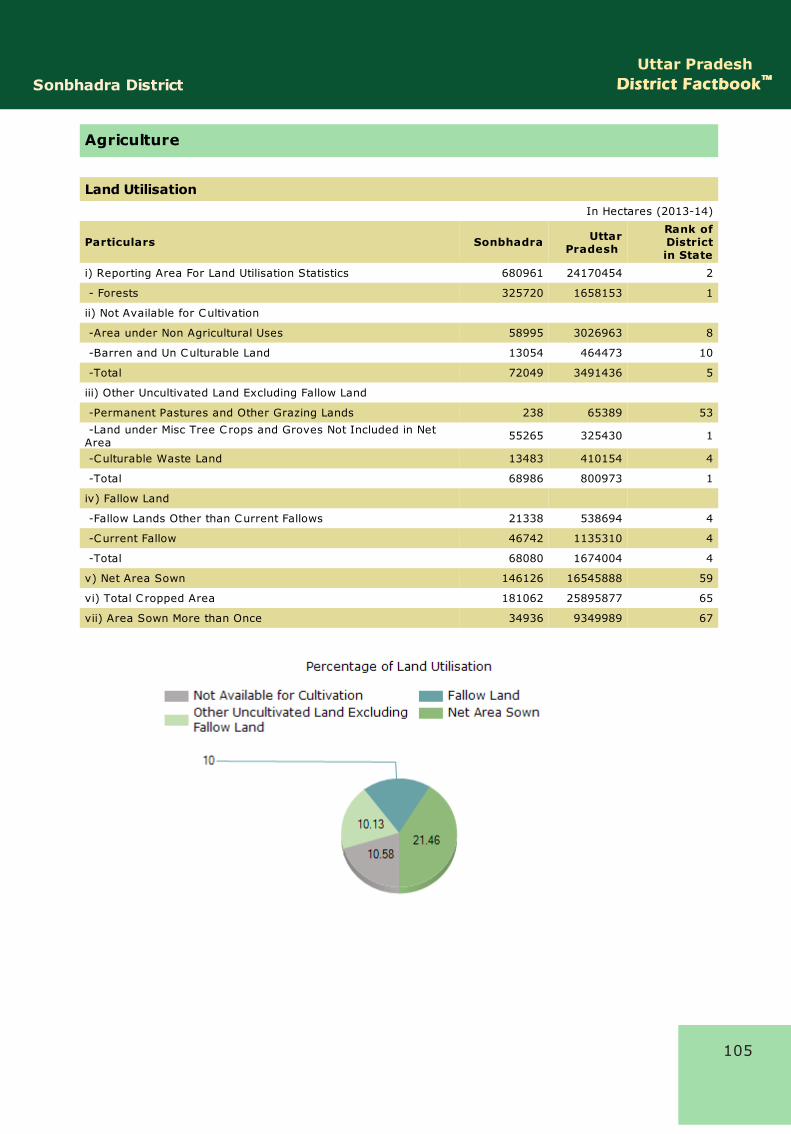
Land UtilisationIn Hectares (2013-14)
Particulars Sonbhadra UttarPradesh
Rank ofDistrictin State
i) Reporting Area For Land Utilisation Statistics 680961 24170454 2
- Forests 325720 1658153 1
ii) Not Available for Cultivation
-Area under Non Agricultural Uses 58995 3026963 8
-Barren and Un Culturable Land 13054 464473 10
-Total 72049 3491436 5
iii) Other Uncultivated Land Excluding Fallow Land
-Permanent Pastures and Other Grazing Lands 238 65389 53
-Land under Misc Tree Crops and Groves Not Included in NetArea
55265 325430 1
-Culturable Waste Land 13483 410154 4
-Total 68986 800973 1
iv) Fallow Land
-Fallow Lands Other than Current Fallows 21338 538694 4
-Current Fallow 46742 1135310 4
-Total 68080 1674004 4
v) Net Area Sown 146126 16545888 59
vi) Total C ropped Area 181062 25895877 65
vii) Area Sown More than Once 34936 9349989 67
123
Sonbhadra DistrictUttar Pradesh
District FactbookDistrict Factbook™™
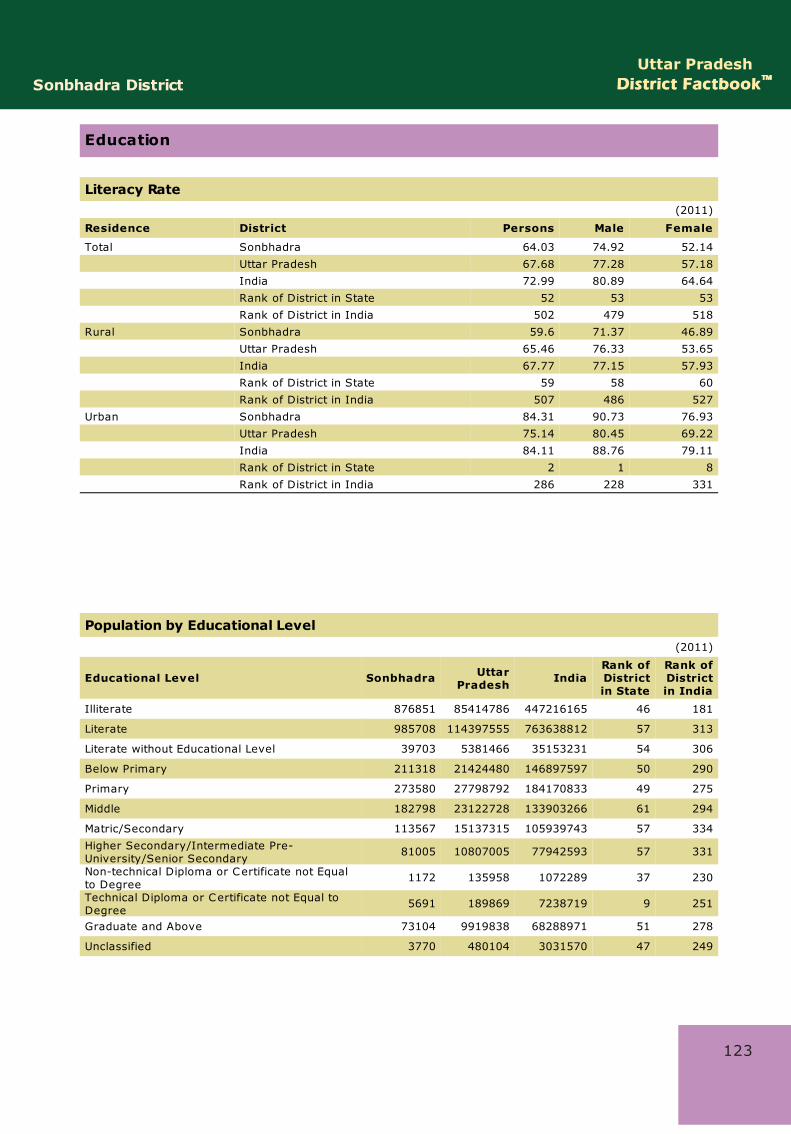
Education
Literacy Rate (2011)
Residence District Persons Male Female
Total Sonbhadra 64.03 74.92 52.14
Uttar Pradesh 67.68 77.28 57.18
India 72.99 80.89 64.64
Rank of District in State 52 53 53
Rank of District in India 502 479 518
Rural Sonbhadra 59.6 71.37 46.89
Uttar Pradesh 65.46 76.33 53.65
India 67.77 77.15 57.93
Rank of District in State 59 58 60
Rank of District in India 507 486 527
Urban Sonbhadra 84.31 90.73 76.93
Uttar Pradesh 75.14 80.45 69.22
India 84.11 88.76 79.11
Rank of District in State 2 1 8
Rank of District in India 286 228 331
Population by Educational Level(2011)
Educational Level Sonbhadra UttarPradesh India
Rank ofDistrictin State
Rank ofDistrictin India
Illiterate 876851 85414786 447216165 46 181
Literate 985708 114397555 763638812 57 313
Literate without Educational Level 39703 5381466 35153231 54 306
Below Primary 211318 21424480 146897597 50 290
Primary 273580 27798792 184170833 49 275
Middle 182798 23122728 133903266 61 294
Matric/Secondary 113567 15137315 105939743 57 334
Higher Secondary/Intermediate Pre-University/Senior Secondary
81005 10807005 77942593 57 331
Non-technical Diploma or Certificate not Equalto Degree
1172 135958 1072289 37 230
Technical Diploma or Certificate not Equal toDegree
5691 189869 7238719 9 251
Graduate and Above 73104 9919838 68288971 51 278
Unclassified 3770 480104 3031570 47 249
131
Sonbhadra DistrictUttar Pradesh
District FactbookDistrict Factbook™™
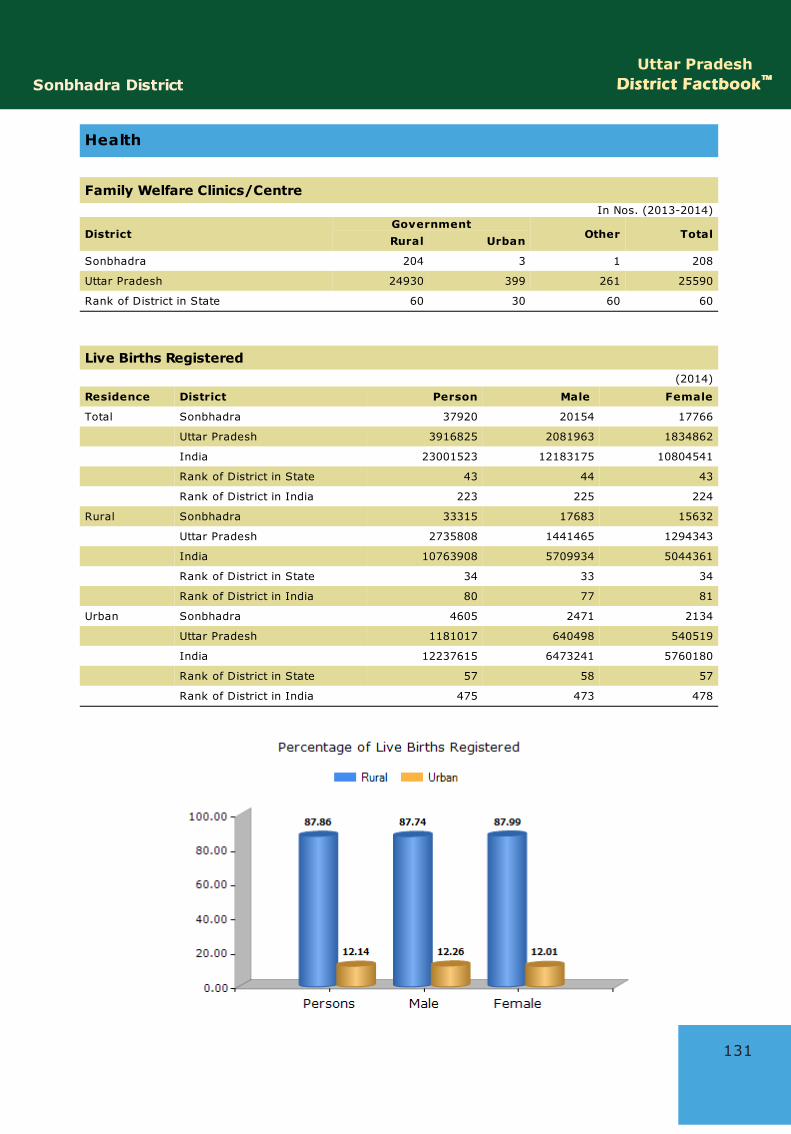
Health
Family Welfare Clinics/CentreIn Nos. (2013-2014)
DistrictGovernment
Other TotalRural Urban
Sonbhadra 204 3 1 208
Uttar Pradesh 24930 399 261 25590
Rank of District in State 60 30 60 60
Live Births Registered(2014)
Residence District Person Male Female
Total Sonbhadra 37920 20154 17766
Uttar Pradesh 3916825 2081963 1834862
India 23001523 12183175 10804541
Rank of District in State 43 44 43
Rank of District in India 223 225 224
Rural Sonbhadra 33315 17683 15632
Uttar Pradesh 2735808 1441465 1294343
India 10763908 5709934 5044361
Rank of District in State 34 33 34
Rank of District in India 80 77 81
Urban Sonbhadra 4605 2471 2134
Uttar Pradesh 1181017 640498 540519
India 12237615 6473241 5760180
Rank of District in State 57 58 57
Rank of District in India 475 473 478
Uttar PradeshDistrict FactbookDistrict Factbook™™ Sonbhadra District
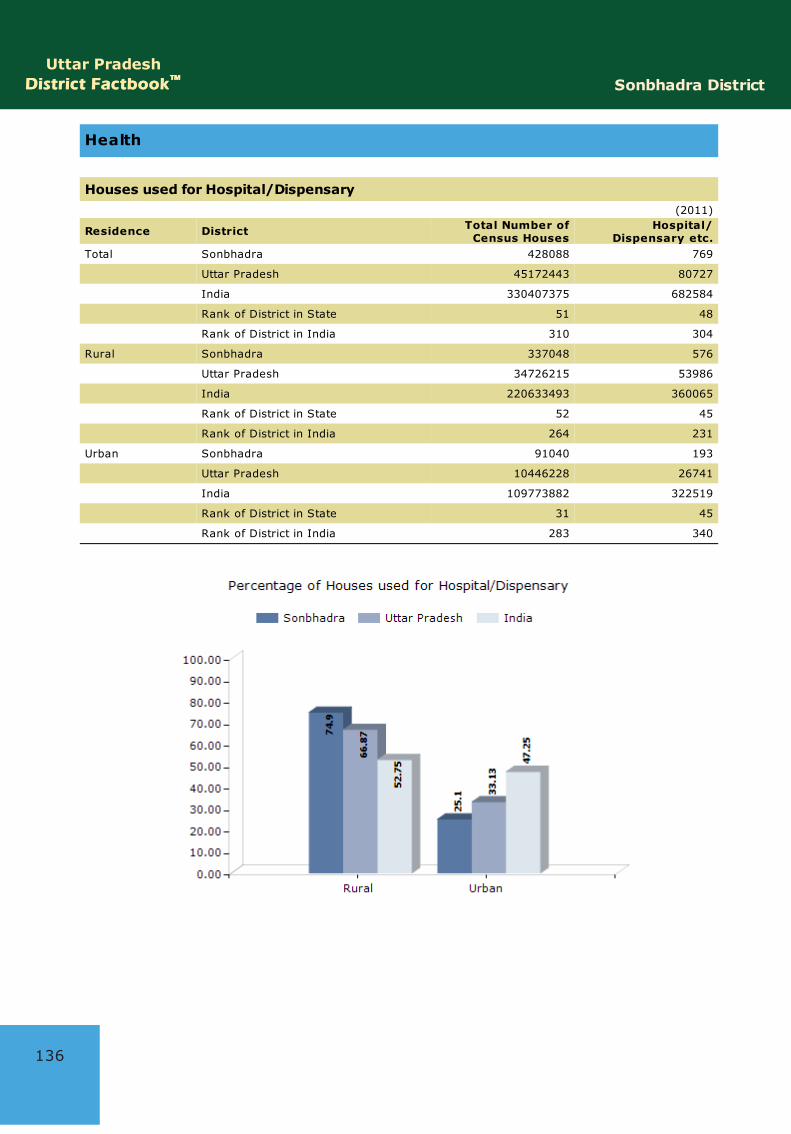
Health
Houses used for Hospital/Dispensary(2011)
Residence District Total Number ofCensus Houses
Hospital/Dispensary etc.
Total Sonbhadra 428088 769
Uttar Pradesh 45172443 80727
India 330407375 682584
Rank of District in State 51 48
Rank of District in India 310 304
Rural Sonbhadra 337048 576
Uttar Pradesh 34726215 53986
India 220633493 360065
Rank of District in State 52 45
Rank of District in India 264 231
Urban Sonbhadra 91040 193
Uttar Pradesh 10446228 26741
India 109773882 322519
Rank of District in State 31 45
Rank of District in India 283 340
136
143
Sonbhadra DistrictUttar Pradesh
District FactbookDistrict Factbook™™
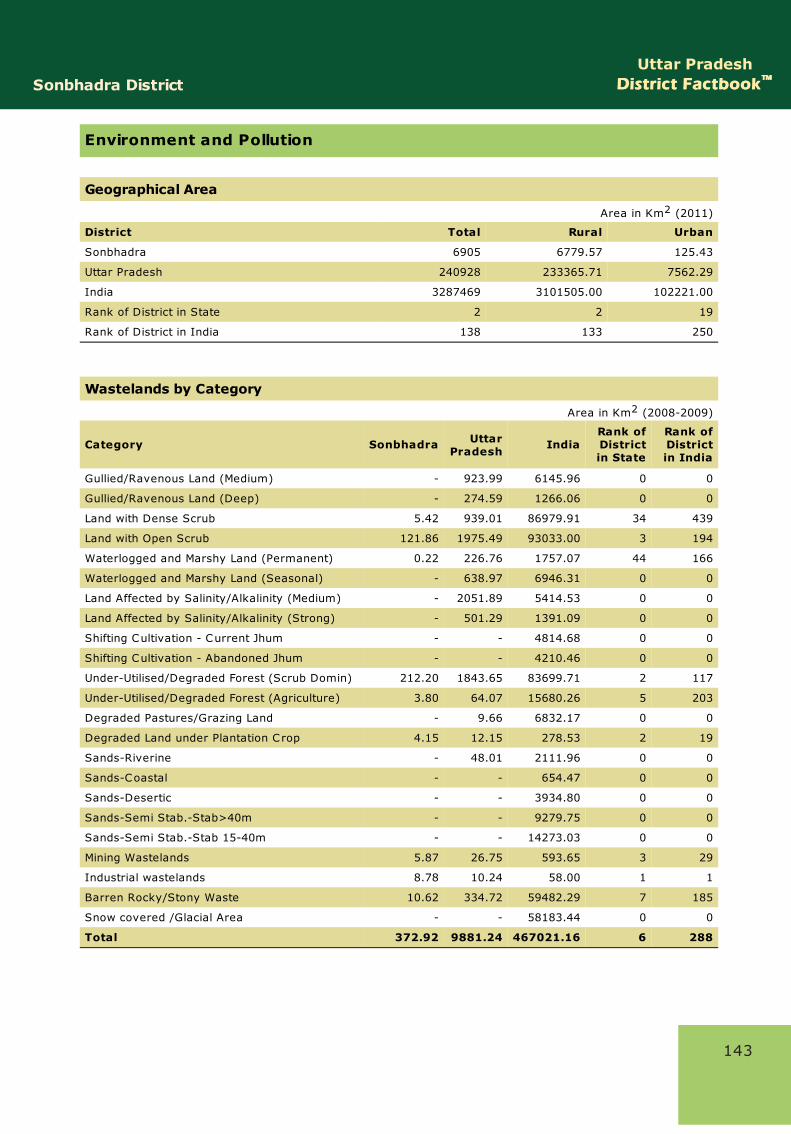
Environment and Pollution
Geographical Area
Area in Km2 (2011)
District Total Rural Urban
Sonbhadra 6905 6779.57 125.43
Uttar Pradesh 240928 233365.71 7562.29
India 3287469 3101505.00 102221.00
Rank of District in State 2 2 19
Rank of District in India 138 133 250
Wastelands by Category
Area in Km2 (2008-2009)
Category Sonbhadra UttarPradesh India
Rank ofDistrictin State
Rank ofDistrictin India
Gullied/Ravenous Land (Medium) - 923.99 6145.96 0 0
Gullied/Ravenous Land (Deep) - 274.59 1266.06 0 0
Land with Dense Scrub 5.42 939.01 86979.91 34 439
Land with Open Scrub 121.86 1975.49 93033.00 3 194
Waterlogged and Marshy Land (Permanent) 0.22 226.76 1757.07 44 166
Waterlogged and Marshy Land (Seasonal) - 638.97 6946.31 0 0
Land Affected by Salinity/Alkalinity (Medium) - 2051.89 5414.53 0 0
Land Affected by Salinity/Alkalinity (Strong) - 501.29 1391.09 0 0
Shifting Cultivation - Current Jhum - - 4814.68 0 0
Shifting Cultivation - Abandoned Jhum - - 4210.46 0 0
Under-Utilised/Degraded Forest (Scrub Domin) 212.20 1843.65 83699.71 2 117
Under-Utilised/Degraded Forest (Agriculture) 3.80 64.07 15680.26 5 203
Degraded Pastures/Grazing Land - 9.66 6832.17 0 0
Degraded Land under Plantation Crop 4.15 12.15 278.53 2 19
Sands-Riverine - 48.01 2111.96 0 0
Sands-Coastal - - 654.47 0 0
Sands-Desertic - - 3934.80 0 0
Sands-Semi Stab.-Stab>40m - - 9279.75 0 0
Sands-Semi Stab.-Stab 15-40m - - 14273.03 0 0
Mining Wastelands 5.87 26.75 593.65 3 29
Industrial wastelands 8.78 10.24 58.00 1 1
Barren Rocky/Stony Waste 10.62 334.72 59482.29 7 185
Snow covered /Glacial Area - - 58183.44 0 0
Total 372.92 9881.24 467021.16 6 288
147
Sonbhadra DistrictUttar Pradesh
District FactbookDistrict Factbook™™
Housing
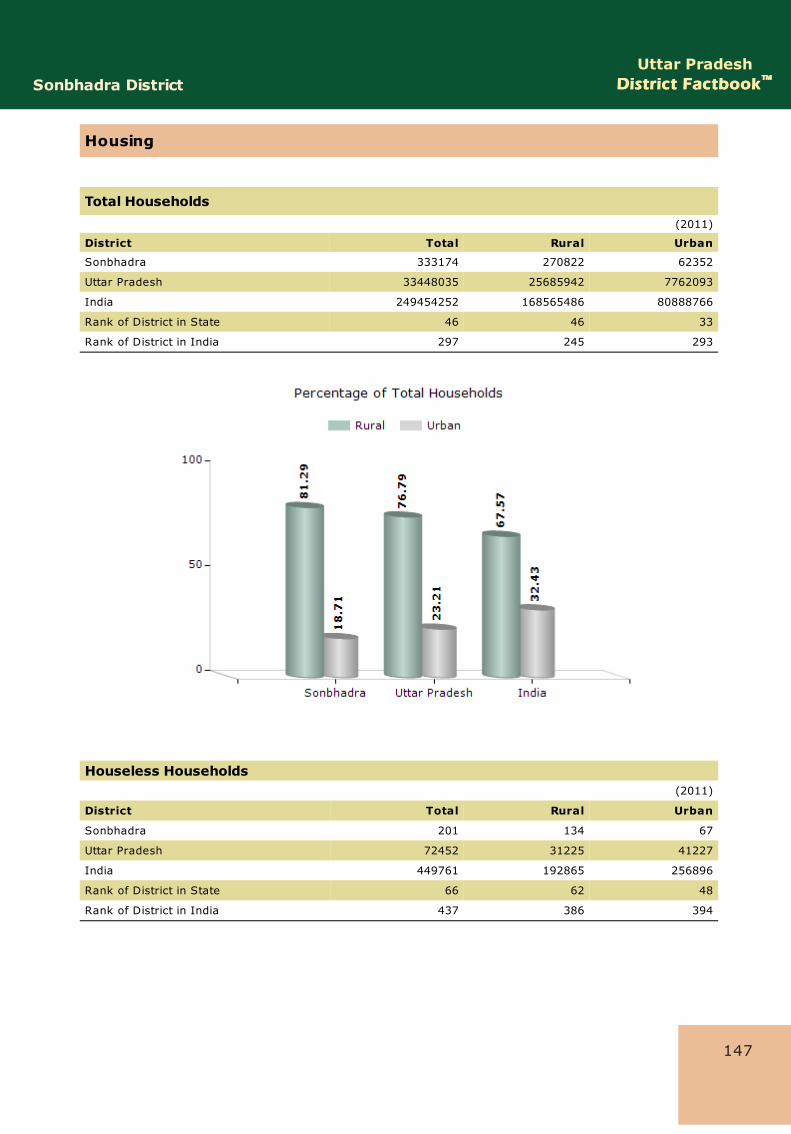
Total Households(2011)
District Total Rural Urban
Sonbhadra 333174 270822 62352
Uttar Pradesh 33448035 25685942 7762093
India 249454252 168565486 80888766
Rank of District in State 46 46 33
Rank of District in India 297 245 293
Houseless Households(2011)
District Total Rural Urban
Sonbhadra 201 134 67
Uttar Pradesh 72452 31225 41227
India 449761 192865 256896
Rank of District in State 66 62 48
Rank of District in India 437 386 394

Sonbhadra DistrictUttar Pradesh
District FactbookDistrict Factbook™™
Crime & Law
Incidence of IPC Crime (2014)
Crime Heads Sonbhadra UttarPradesh India
Rank ofDistrictin State
Rank ofDistrictin India
Murder 32 5150 34134 57 400Attempt to Commit Murder 4 5223 41898 69 572Culpable Homicide Not Amounting To Murder 14 1412 3349 47 71Attempt To Commit Culpable Homicide 5 506 4371 24 74Rape 26 3467 38678 48 417Attempt To Commit Rape 1 324 4310 33 291Kidnapping & Abduction 20 12361 78412 70 519Dacoity 0 294 4399 0 0Making Preparation And Assembly ForCommitting Dacoity 0 75 2835 0 0
Robbery 2 3920 38090 71 554Criminal Trespass/Burglary 28 6921 114667 61 519Theft 77 48380 442464 62 511Unlawful Assembly 0 52 9878 0 0Riots 3 6438 66206 69 531Criminal Breach of Trust 22 4074 20089 56 222Cheating 8 10636 109737 69 558Forgery 17 569 11268 9 108Counterfeiting 1 111 1979 26 220Arson 1 250 9299 38 537Grievous Hurt 152 10867 105560 33 157Dowry Deaths 6 2469 8458 71 324Assault on Women with Intent to Outrage herModesty 24 8605 82411 68 471
Insult to the Modesty of Women 0 29 9738 0 0Cruelty by Husband or his Relatives 13 10471 123163 61 521Importation of Girls From Foreign Country 0 0 14 0 0Causing Death by Negligence 124 14619 128837 51 356Offences Against State 0 0 177 0 0Offences Promoting Enmity Between DifferentGroups 0 26 337 0 0
Extortion 1 609 8210 29 384Disclosure of Identity of Victims 0 0 135 0 0Incidence of Rash Driving 56 16199 409857 67 487Human Trafficking 0 4 726 0 0Unnatural Offence 1 137 1148 29 238Other IPC Crimes 115 66277 944105 67 550Total Cognizable IPC Crimes 753 240475 2858939 67 535
159
163
Sonbhadra DistrictUttar Pradesh
District FactbookDistrict Factbook™™
Social and Welfare Scheme
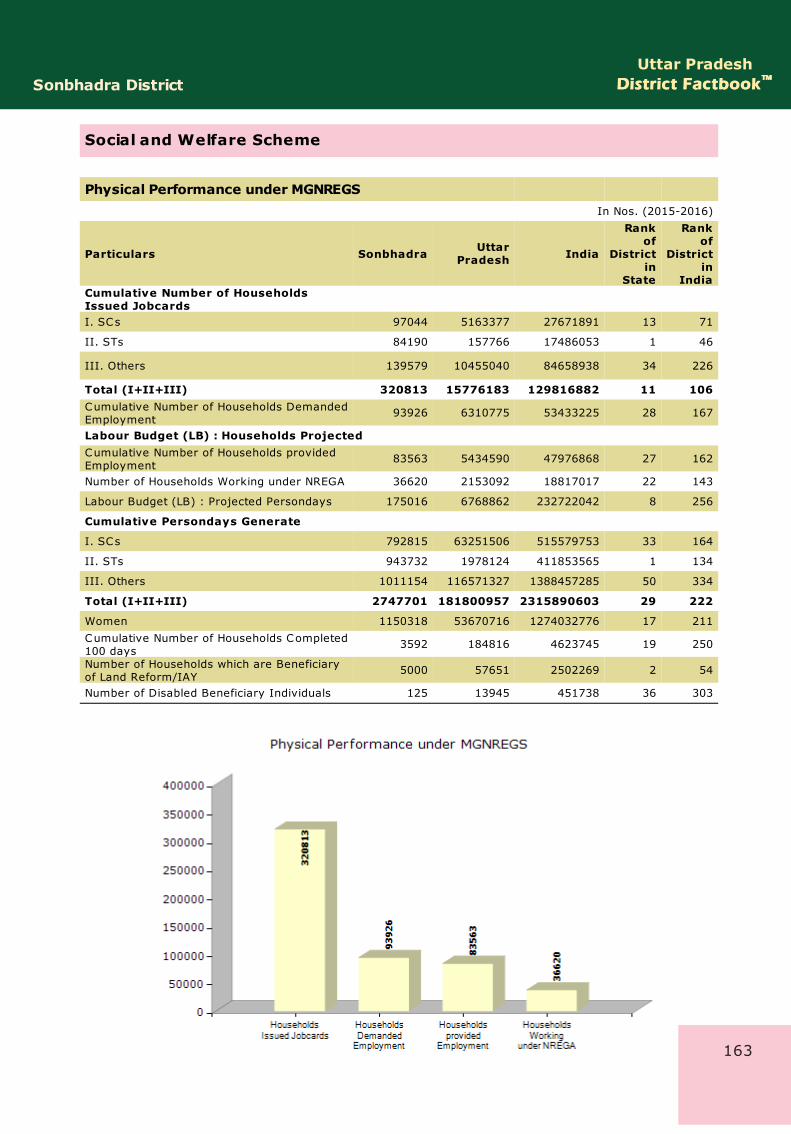
Physical Performance under MGNREGS
In Nos. (2015-2016)
Particulars Sonbhadra UttarPradesh India
Rankof
Districtin
State
Rankof
Districtin
IndiaCumulative Number of HouseholdsIssued Jobcards I. SCs 97044 5163377 27671891 13 71
II. STs 84190 157766 17486053 1 46
III. Others 139579 10455040 84658938 34 226
Total (I+II+III) 320813 15776183 129816882 11 106Cumulative Number of Households DemandedEmployment
93926 6310775 53433225 28 167
Labour Budget (LB) : Households ProjectedCumulative Number of Households providedEmployment
83563 5434590 47976868 27 162
Number of Households Working under NREGA 36620 2153092 18817017 22 143
Labour Budget (LB) : Projected Persondays 175016 6768862 232722042 8 256
Cumulative Persondays Generate
I. SCs 792815 63251506 515579753 33 164
II. STs 943732 1978124 411853565 1 134
III. Others 1011154 116571327 1388457285 50 334
Total (I+II+III) 2747701 181800957 2315890603 29 222
Women 1150318 53670716 1274032776 17 211
Cumulative Number of Households Completed100 days
3592 184816 4623745 19 250
Number of Households which are Beneficiaryof Land Reform/IAY
5000 57651 2502269 2 54
Number of Disabled Beneficiary Individuals 125 13945 451738 36 303
i
Uttar PradeshSonbhadra District District Factbook™
Get Complete BookAt Datanet India eBooks Store
www.datanetindia-ebooks.comor go directly at
http://www.datanetindia-ebooks.com/District_Factbook/Uttar_Pradesh/Sonbhadra