DOCUMENT RESUME. ED 129 330 IR 004 117 AUTHOR Harvey,'Francis A.; And-Others TITLE ' Evaluation of Eight "Infinity Factory" Programs; Part I: Analysis of the Eight-Show Series. INSTITUTION Education Development Center, Inc., Newton, Mass. PUB DATE Jun 76 NOTE 61p.f For related documents see IR 004 116-119 EDRS PRICE MF-$0.83 HC-$3.50 Plus Postage. DESCRIPTORS Attention; Comprehension; *Educational Television; Elementary Education; *Elementary School Mathematics; Grade 3; Grade 4; Grade 5; Graae 6; Humanistic Education; Knowledge Level; *Mathematics Instruction; Media Research; Mexican Americans; *Minority Group Children; Motivation; Negro Students; Prograi Evaluation; Self Esteem; Spanish AmeriCans; Spanish Culture; Student Attitudes; Summative Evaluation; Teacher Attitudes IDENTIFIERS Blacks; *Infinity Factory; Latinos ABSTRACT The "Infinity Factory" television series was developed to help children ages 8 through 11 to understand the usefulness of some basic mathematics skills for everyday life. Aimed primarily at black and Latino children, the series concentrates on: the decimal number system; measurement, especially the metric system; estimation; mapping and scaling; and graphing. Throughout the series there islemphasis on creative problem solving techniques,and on a positive student self-image. An evaluation of eight of the programs was conducted using 1,000 students and their teachers in 39 3rd-6th grade classes ln four cities as subjects. The evaluatibn measured studlent attention, appeal of the overall programs and major segments of each program, student comprehension of stgry line and gains in math skills, attitudes toward math, social attitudes, and teachers' opinions of the effectiveness and usefulness of the series. This report gives a detailed analysis of the evaluation of the series A 'taken a,s a whole. (JY) k. *********************************************************************** Documents acquired 1+1, ERIC include many informal unpublished * * materials not available from other sources. ERIC makes every effort * * to obtain_ the best c4y available. Nevertheless, items of marginal * * reproducibility are often encountered and this affects the quality. * * of the microfiche and hardcopy reproductions ERIC makes available * * via the ERIC Document Reproduction Service (EDRS). EDRS is not * responsible for the quality of the original document. Reproductions * * supplied-by EDRS are the best that can be made from the original. * n***********************************************************************
Transcript
DOCUMENT RESUME.
ED 129 330 IR 004 117
AUTHOR Harvey,'Francis A.; And-OthersTITLE ' Evaluation of Eight "Infinity Factory" Programs; Part
I: Analysis of the Eight-Show Series.INSTITUTION Education Development Center, Inc., Newton, Mass.PUB DATE Jun 76NOTE 61p.f For related documents see IR 004 116-119
EDRS PRICE MF-$0.83 HC-$3.50 Plus Postage.DESCRIPTORS Attention; Comprehension; *Educational Television;
ABSTRACTThe "Infinity Factory" television series was
developed to help children ages 8 through 11 to understand theusefulness of some basic mathematics skills for everyday life. Aimedprimarily at black and Latino children, the series concentrates on:the decimal number system; measurement, especially the metric system;estimation; mapping and scaling; and graphing. Throughout the seriesthere islemphasis on creative problem solving techniques,and on apositive student self-image. An evaluation of eight of the programswas conducted using 1,000 students and their teachers in 39 3rd-6thgrade classes ln four cities as subjects. The evaluatibn measuredstudlent attention, appeal of the overall programs and major segmentsof each program, student comprehension of stgry line and gains inmath skills, attitudes toward math, social attitudes, and teachers'opinions of the effectiveness and usefulness of the series. Thisreport gives a detailed analysis of the evaluation of the series
A 'taken a,s a whole. (JY)k.
***********************************************************************Documents acquired 1+1, ERIC include many informal unpublished *
* materials not available from other sources. ERIC makes every effort ** to obtain_ the best c4y available. Nevertheless, items of marginal ** reproducibility are often encountered and this affects the quality. *
* of the microfiche and hardcopy reproductions ERIC makes available *
* via the ERIC Document Reproduction Service (EDRS). EDRS is not* responsible for the quality of the original document. Reproductions ** supplied-by EDRS are the best that can be made from the original. *n***********************************************************************
EVALOATION OF EIGHT "INFINITY FACTORY" PROGRAMS
A
PART I:
Analysts of the Eight-Show Series
Francis A. Harvey, Senior EvaluatorBarbara Quiroga
Valerie Crane
Charles L. Bottoms
June, 1976
us DEPARTMENT OF HEALTHEDUCATION &WELFARENATIONAL INSTITUTE cyp
ou CATION
.TiiN DOCUVI NT ...AS RE (-N wIPRO.
(Tk)( ED I %.,s(14El F IvE0 I POM
THE_ PI- 1450N OP 01)(..it.NIZAT,ONOPiCONATINC. IT PO,NTS Or V,E 01) OcIN,ONS
AT DO NOTNFCESSAPIH, WF PoE
sENT0C AL NAT 10NAL 11.45TIT E flg
EC))!CATION POS.TONow i(
n cleveloprilent center, inc./5.6chapel stinewton, mass. 02160/ (617)969-7100
2
3copyright C1978 education develop:Cent center, Inc.
.
CONTENTS
Part I Analysis of the Eight-Show Series
Section I Introduction
Section 2 Method
Section 3 Analysis of the Data
Section 4 Results
Section 5 Summary ana Conclusion-s
Section 6 Recommendations
Part II Show-by-show Analysis (Bound Separately)
Section 1 Introduction
Section 2 Method
Section 3 Analysis of the Data
Section 4 Results, Show A
Section 5 Results, Show B
Section 6 Results, Show C
Section 7 Results, Show D
Section 8 Results, Show E
Section 9 Results, Show F ".
Section 10 Results, Show G
Section 11 Results, Show H
Section 12 Summary and Conclusions
Section 13 Recommendations
Appendices (Bound Separately)
,
Appendix A Ab§tracts of Part II: Show-by-Show Analyses
Shows A to H
Appendix B Pretest/Posttest Instruments
Student Attitude Form (Pretest/Posttest)
Student Math Content Form (Pretest/Posttest)
Teacher Semantic Differential (Pretest/Posttest)
Teacher Opinion Form (Posttest Only)
4'
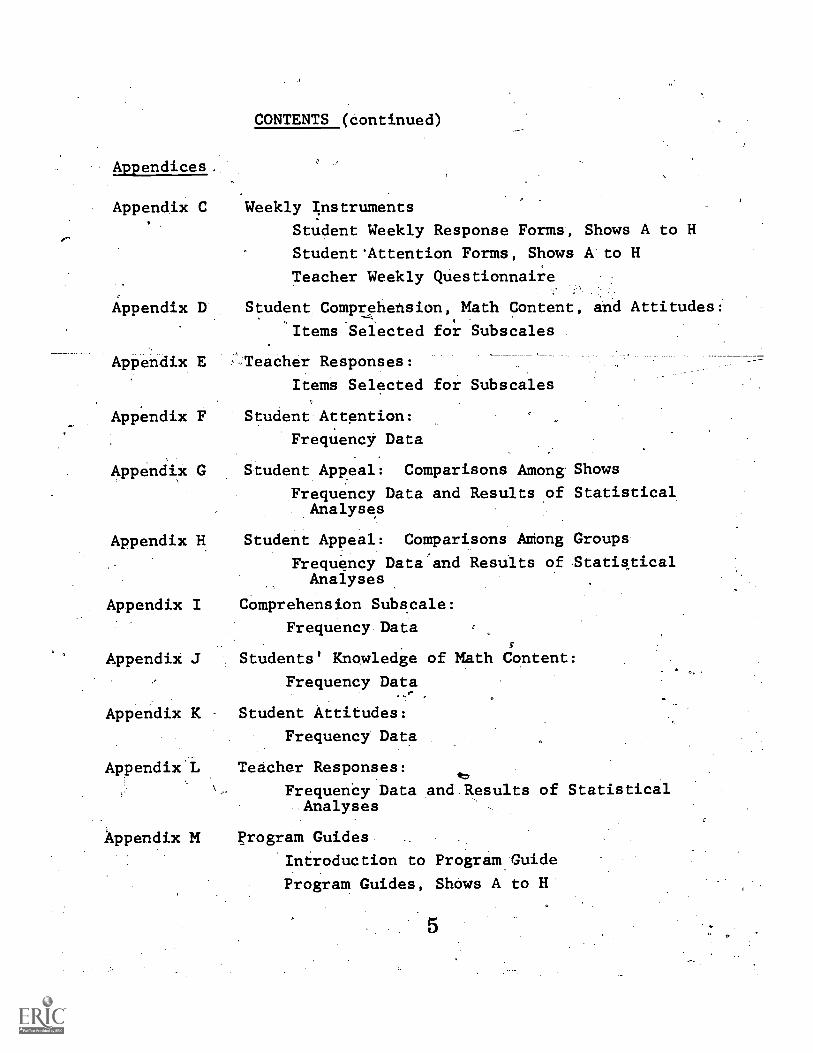
Appendices,
Appendix C
Appendix D
CONTENTS (continued)
Weekly Instruments
Student Weekly Response Forms, Shows A to H
Student*Attention Forms, Shows A to H
Teacher Weekly Questionnaire
Student Comprehension, Math Content, and Attitudes:
'Items 'Selected for Subscales
Appendix E -.Teacher Responses:
Items Selected for Subscales
Appendix F Student Attention:
Frequency Data
Appendix G Student Appeal: Comparisons Among Shows
Frequency Data and Results of StatisticalAnalyses
Appendix H Student Appeal: Comparisons Among Groups
Frequency Data'and Results of StatisticalAnaiyses
Appendix I Comprehension Subscale:
Frequency. Data
Appendix J Students' Knowledge of Math Content:
Frequency Data
Appendix K Student Attitudes:
Frequency Data
Appendix L Teacher Responses:
FrequenCy Data and Results of StatisticalAnalyses
Appendix M l'rogram Guides
Introduction to Program Guide
Program Guides, Shows A to H
5
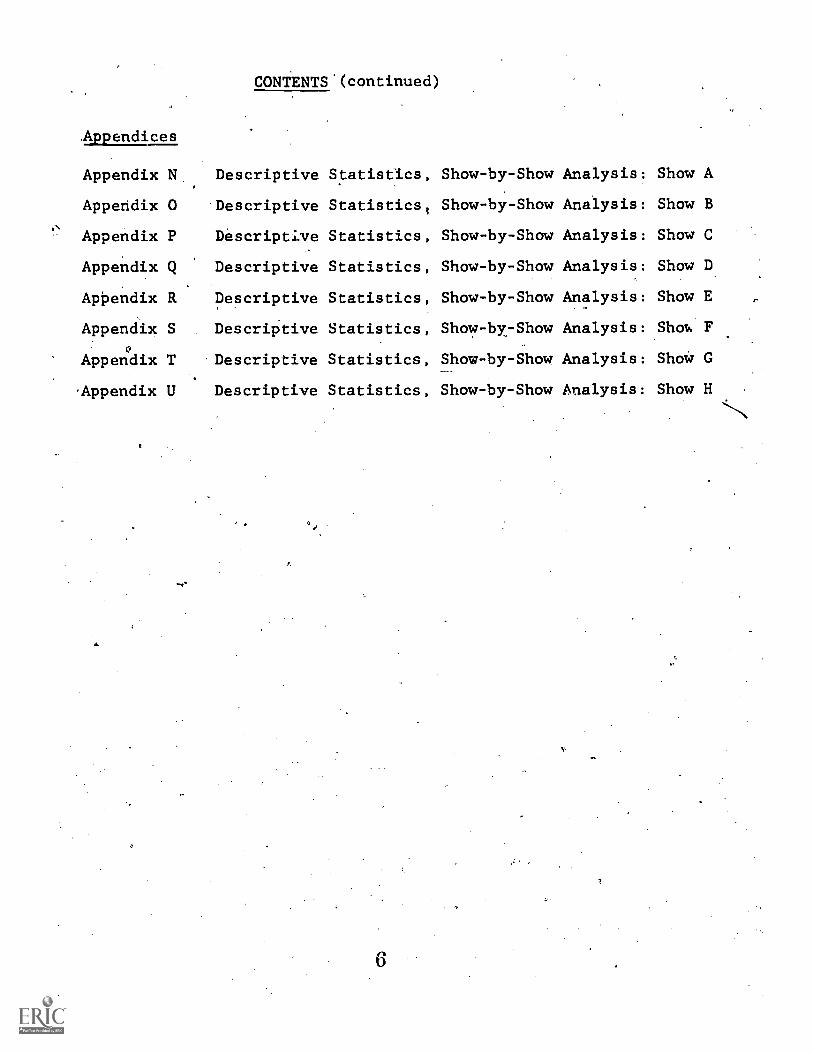
Appendices
CONTENTS.(continued)
Appendix N Descriptive Statistics, Show-by-Show Analysis: Show A
Appendix 0 Descriptive Statistics, Show-by-Show Analysis: Show B
Appendix P Descriptive Statistics, Show-by-Show Analysis: Show C
Appendix Q Descriptive Statistics, Show-by-Show Analysis: Show D
ApPendix R Descriptive Statistics, Show-by-Show Analysis: Show E
Appendix S DescriPtive Statistics, Show-by-Show Analysis: Shots F
Appendix T Descriptive Statistics, Show-by-Show Analysis: Show G
Appendix U Descriptive Statistics, Show-by-Show Analysis: Show H
1. INTRODUCTION
"Infinity Factory" is a television series about
mathematics, people, and people using math. The series
was produced 'by Education Development'Center, Newton,
Mass., under a grant,from the U.S.' Office pf Education,
ESAA, with additional start-up support from the Carnegie
Corporation of New York, John and Mary R. Markle Foundation,
AJDR 3rd -Fund, National,Science Foundation, and Alfred,P.
Sloan Foundation. Designed for both home and classroom
viewing, the series presents mathematics in a .common-sense
way that helps .:..hildren understand the usefulness of math-
ematics in their own lives. The programs are for children
..ages 8 through 11, especially Black and IAtino children.
A series' of 52 half-hour programs has been produced and
is schedul - broadcasting over the Public Broadcasting
Service bginnifrig .in the Fall of 1976:
"Infinity Factory" mathematics concentrates on
five main areas:
1. Decimal number system, including single-digit
arithmetic and Lachniques for getting rough
aiithmetic answers quickly, such as rounding
off;
2. Measurement, with a special emphaais on the
metric system;
3. Estimation;
4. Mapping and scaling, including treatments of
ratio and proportion;
5. Graphing,
Intertwined through all the mathematical areas
are"some useful waysNto solve problems: techniques that
apply to problems in many areas. These.methods are pre-
sented to encourage viewers to think creatively about
problems they encounter themselves.
Along with the mathematics, "Infinity Factory".addresses a set of cultural and ethnic goals that reflect
the special needs of minority children in the audience.
These goals include:
1. presenting positive Black and Latino role
models;
2. helping each viewer to reinforce good feelings
about his or her own group, and to accept people
and relationships in other groups;
3., representing the inner-city enviionment, both'
for'urban audiences and for suburban and rural
viewers,in order to present experiences common
to many members of the target audience;
4. tressing the humanistic-perspectives of'sharing,
.cooperation, equality, and self-respect.
The program follows a magazine format. Each program
centers around one main math theme, usually involving two
or'three skills or concepts. Several short segments in
each io:rOgram treat this mathematical theme from different%
perspectives, developing the mathematics in several related
ways. These segments show math at work in people's every-
day ltves.
. The major segments of each program are:
"Scoops' Place" -- a live-action, dramatic
segment about a Black family who runs a neighborhood
store in.New York City.
"City Flats" ---also-live-action, is about a
Latino family operating a bakery in East Los Angeles.
"Brownstone" segments -- a resident multi-
ethnic cast:of young people act in short skits that
usually take place in and around an urban "Brown-
stone11apartment house built in a television etudio.
Animation segments -- used to present certain
concepte in a humorous and 'direct manner.
8
t 1,3
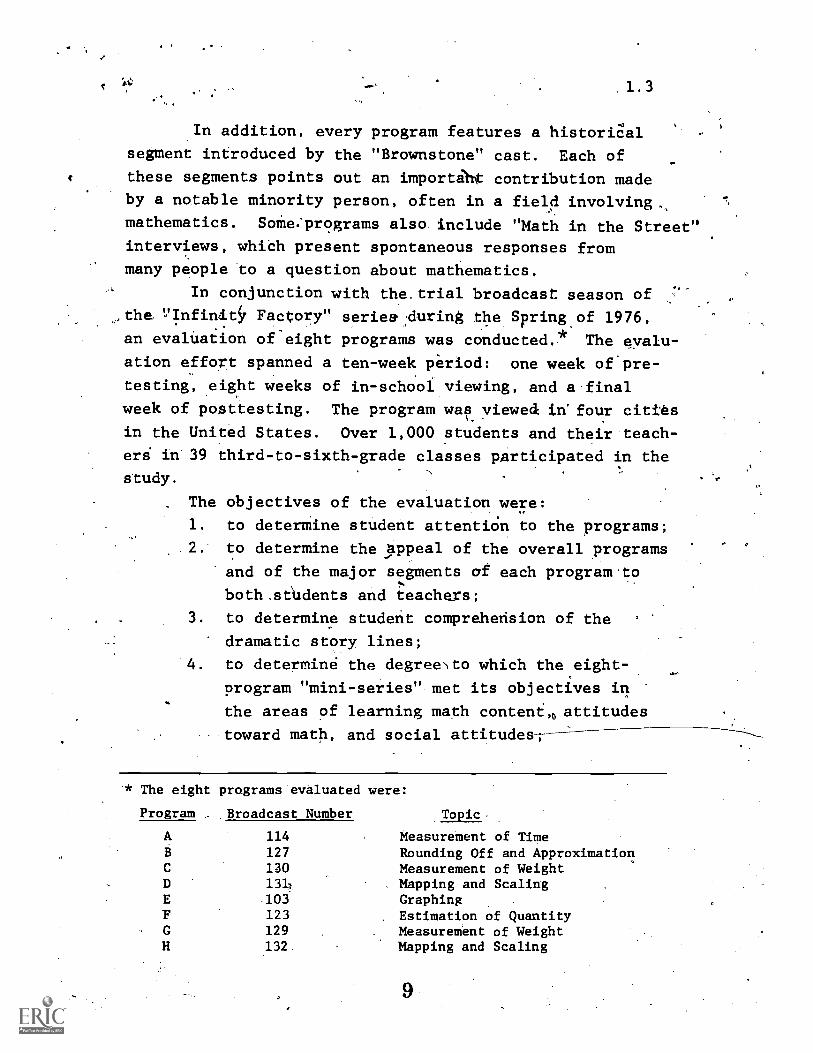
In addition, every program features a histori8a1 -
segment introduced by the "Brownstone" cast. Each of
these segments points out an importil* contribution made
by a notable minority person, often in a field involving,,
mathematics. Some.'programs also include "Math in the Street"
interviews, whi6h present spontaneous responses from
many people to a question about mathematics.
In conjunction with the.trial broadcast season of
the !Infiniti, Factory" seriee during the Spring.of 1976,
an evaluation of-eight programs was conducted.* The evalu-
ation effort spanned a ten-week period: one week of.pre-
testing, eight weeks of in-school viewing, and a final
week of posttesting. The program was. viewed in" four cities
in the United States. Over 1,000 students and their teach-
eri tn 39 third-to-sixth-grade classes participated in the
study.
The objectives of the evaluation were:
1. to determine student attention to the programs;
2. to determine the.)A3peal of the overall programs
and of the major segments af each program.to
both,s6Idents and teachers;
3. to determine student comprehension of the
dramatic story lines;
4. to determine the degreeto which the.eight-
program "mini-series" met its objectives in
the areas of learning math conteni,5 attitudes
toward math, and social attitudes;--
'* The eight programs evaluated were:
Program ._ Broadcast Number
A 114
.Topic.
Measurement of TimeB 127 Rounding Off and ApproximationC 130 Measurement of WeightD 1311, . Mapping and ScalingE .103 GraphingF 123 Estimation of QuantityG 129 . Measurement of WeightH 132 . Mapping and Scaling
a
1 . 4
./ 5: to determine teachers' opinions of the effec-
tiveness of-the series and its Usefulness in .
the classroom.
nits evaluation report will-intlude two parts.,
Part I eXamines the effectiveness of the,eight prograMs
taken as a whale through statistical analyses of pretest/
posttest differences, subscales basecP4h.responses over
eight programs, and trends over eight programs. In par-,
ticular', Part Ilocusses,on student attention, student
appeal-, students' comprehension 'of dramatic story lines,
students' knowledge'of math oontent, students' attitudes,
and teachers' attitudes.
Part II of the report presents aAescriptive report-
on each of the eight programs in the areas of student
instrument together_and students checked boxes if they.
1 5
thought a specific segment was, hard or easy, good or no_fun or no fun, too long or too short, and too fast
too slow. It was determined in the posttesting sessionthat the items "too long or too short," and "too fast ortN'4) slow" were misunderstood by about half_of, the sample,
'411d theref ore these items were dropped from the analysis.
_ The second side of the Student Weekiy gesponse Form
Nasured students' comprehension of story line, knowledge
't ulath c ontent, attitudes a d math, an social atti-
tlides Ten statements which sampled t objectives of
-2,t1-.19 program in the above areas were used each week. The
vksitor and students read through the ten statements
If a student agreed with a statement, he or1!.gether.
yes; if a student disagreed with a state-circledrit, he or she circled no.
preliminary examination of the data revealed a
Nsitive response bias in students' responses to these
tems. The mean score on 'positively worded iterdswas
risistencly higher than Laemean-score on negativelyIltirded items. Comparison of mean scores on positive items
t
14.kth mean scores on negative items revealed that this
tfect was operating equallY across all group6. In ordettN
control for this bias, items were not analyzed separately
were aggregated into subscales with equal numbers JOA sitivelY and negatively worded items.
In ad4tion,-two free responSe items were included
l'ql'en'appropriate. Students were able to comPlete the
vudent weekly Response Form in approximately 15 minutes.
Stodent Attention Form. Visitors were trained to
%serve and record viewing behavior of stu:dents While they
qched the' television program, using-the Stbdent Attention
(see Appendix C). The visitor observed two groups
(4 five'scudents each, alternating between groups every 15
16
2.7
seconds. The visitor recorded the number of students in
each group who were either attending to or actively
responding to the program during that 15-second interval.
Attending,was operationally defined as maintaining eye
contact with the televi-sion screen; responding was defined
es being actively, inVolved with the program, e.g., com-
--Ixtenting on the program, laughing, or moving to the music.
Audio cue6 on the-Student,Attention Form indicated the
end of each 15-second segment.
Teacher Weekly Quetionnaire. Each week the teacher
completed a Teacher Weekly Questionnaire (see Appendfx C).
This instrument was the same for each week and contained
39 statements which teachers checked if they agreed with
the statement. Statements dealt with' 11 areas related to
the program:,
1. educational effectiveness;
2. class preparation;
3. ,program guides;
4. prOgram presentation;
5. use of language;
6. technical quality;
7. student attention;
8. program appeal;
9. math content;
10. thath attitudes; and
11. social attitudes.
In addition, teachers were encouraged to write.any comments
they might have on specific aspects of the program and/or
Chang es they would suggest. Teachers were also asked to
report any follow-up activities which took place during
the week, and to describe any students' reactions tO
Previous weeks' programs.
1 7
2.8
Training Procedures
Visitors attended a one-day training session w.ere
the objectives of the evaluation.study, procedures to be
followed, and instruments to be used were explained.
Detailed, written instructions for using each instrument
were provided, including protocols for instructing
students in the use of the Student Weekly Response Forms
and.for any additional verbal information to be provided
students. Videotapes of groups of_childrenc4tching a
television program were used to train Visitors in the
use of the Student Attention Form\and to maximize inter-
rater reliability among Visitors.\
Teachers attended a half-day orientation session
where the objectives and scope.of the "Infinity. Factory"
series and the procedures of the evaluation study were
explained; Teachera were provided cOpies of Program
Guides for the eight progr-ams (see Appendix M), and were
told to use the programs as they saw fit with-their students.
Tes-ters were provided with specific instructions .
on procedures to be followed during the pre- and post-
testing sessions.
Experimental Procedures
The programs. were broadCast over WGBH-TV for Boston...
:and Lawrence claSses., and over KCBT-TV for Los. AngeleS
classes. Classes in New York viewed the-program using
in-school videotape equipment.
Pretest Ses-sion. The first week of the evaluation,
testers arrived at the classroom_at specified times which
were convenient for the class. The tester gave the
teachers the Teacher Semantic Differential to be filled
1 8
2.9
9ut while the Students Completed the Student Attitude Form
and then the Student Math-Content Form. Each instrument.coo approx mate y minutes. When e Leater di.s4riouted
the Student Attitude Form, he or she asked students to put
their first name and last initial at the top of the page,.
Then the students were asked to give their true feelings'"
in a number of different areas, and told that there were
no right or wrong answers to the statements to be read.
Students were assured that their teachers, principals,
and parents would not see their responses._ When the
Student Math Content Form was distributed to students,
the-y were instructed to leave a statement unanswered if
they did not know the answer.
Experimental Sessions. For each of the eight weekly
viewing sess,ions, the classroom visitor, arrived in the,
classroom about 15 minutes before the program was scheduled
to begin. The vieitor recorded any related classroom
activities which occurred before the program.
The class viewed the-half-hour television program
either in the;r classroom or in another room in the school.
During the viewing session, the visitor recorded eye con-
tact and active responses for two groups of five students
each, alternating from one poup to another at 15-second
intervils, using the Student Attention Form.
Immediately following program viewing, the visitor
and students Completed the Student-Weekl& Response Form.
.The visitor and students read through all items together
as-the students filled,out this form. At the same time,
the teacher completed a Teacher Weekly Questionnaire.
Afterwards, the visitor observed and recorded any-
follow-up classroom activities. Before leaving the class-
-room, the visitor reminded the teacher to take note of
1 9
2.10
any related activities during the coming week, and to take
note of any incidental references to the program made by
the. students.
Visitors monitored what happened in the classroom
before, during, and after program viewing. They reported
and categorized any related activities which occurred
before or acter the program, noting whethdr the teacher
dealt with the math content, cultural, or other attitu-
dinal areas of the program and whether the teacher used
any suggestionsfrom the-Program-Guides.
Posttest Session. During the week following
broadcast of the eighth program, the tester who had
ainisteref the pretest returned to,the same' classroom
and repeated the pretest procedures for the Student
Attitude Form, Student Math Content Form, and Teacher
r Semantic Differential. At .this time the teacher also
completed the Teacher-Opinion_Form.
Limitatidns of the Study
Several factors have been identified which limit the
generalizability of this.study:
1. Technical.problems arose in all cities. In
some oases, statiotts broadcast programs at the
wrong time or In incorrect sequence. Problems
with both hardware and software came up in
classes which used portable videotape equipment
to view the. program. .
2. The sample for the study was selected by school
administrators on very short notice. It is
unlikely that the sample selettion Procedure was
exactly random, but there is reasonable Con-
2 0
2.11
'fidence that the sample is sufficiently repre-
sentative of the population.
3. Background data were collected only on students'
age, sex, and ethnic group.
. The forced choice format used for student instru-
ments has the advantages of being easy for
students to understand and controlling for
reading ability. However, such a format gives
less detailed information than free-response
formats about attitudes and understanding of
path content.
5: Although instrument's and procedureg were designed
so that immediate and individual responses of
students could be obtained, visitors reported
that in some cla-ssroom settings minor'problems
were encountered with interference from peers or
teachers.
6. It was recognized that a potential difficulty in
'Measuring appeal is the tendency for students to
.report what they think adults would like to hear.
. To compensate for, a detected positive response
bias, gtudents' responses were aggregated'into
subscales with equal numbers of positive and 0
negative items,
_8. Test items had content and face validity. Time
constraints did not allow for extensive, rigorous
test construction procedures'(e,g., item analysis),
resulting in minor problems with some test.items
which were later accounted for in the data analysis.
9. In a 10-week study, problems were expected with
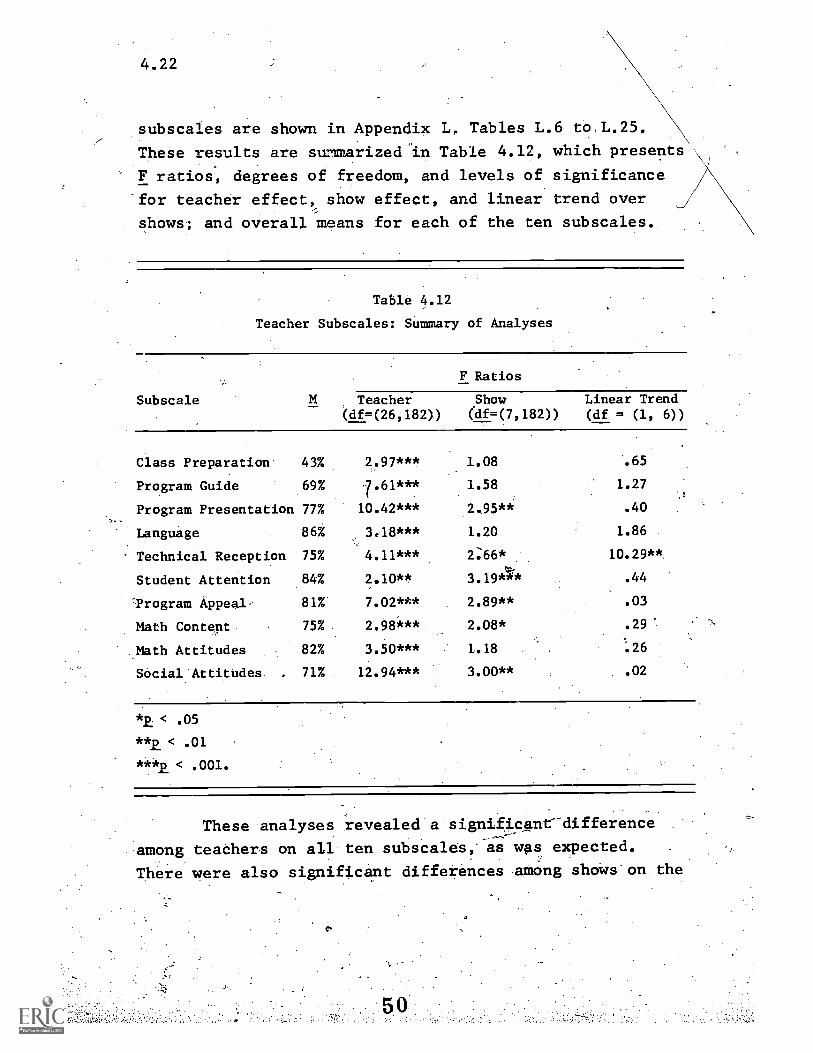
\ tion, Program Appeal, Math Content, and Social Attitudes),
wnen,snowslwere compared pairwise on tne.airrerence'derween
Show C (low) and Show H (high) on the Technical Reception
Subscale was significant. In addition, the only significant
linear trend over shows was a positive trend for the Technical
Receptio/Subscale.
At the end of the eight-week evaluation period, 867
of the 36 teachers responding to the open-ended opinion form
described their overall opinion of the series as positive.
Specific aspects of the programs which received favorable
comments were:
- cultural and social aspects (427);
- - effectiveness of the program in motivating
students toward math and relating math to
real life (447o);
- 1 cultural and social aspects of the program
.(42%);
- - student appeal and program preventation (3370)\; and
- 7 math cOntent (28%).
1
While 287 .commented falicrably about the math
ontentf, 367 commented that there should be more math
c tent or a fuller, developmen.t of math .con ent.- In
g ner.,/l,:.the level of Math:content waatonside ed.more-
ap ro riate-Wteachers.of.younger than older.stiiderita.
NI Wip factors should.be considered\in interpreting
teiteachers' responses to the programs,\ particularly the
fin/ding that in general teachera consideredthe programa \\\\/,
\\
1
56
5.6
more effective in motivating students toward math and
relating math to real life than they did in presenting
math content. First, the programs are designed for home'
viewing,as well as classroom use, and a lower density of
math content may be necessary, in order to compete for
the home viewing audience. Second,"the programs are designed
principally to introduce math topics, show their rele-
vance, and raise students' interest in math; they were not
designed to be a complete instructional package. It is
expected that teachers would be able to develop and carry
out further instructional activities which ,would capital-
ize on the interest developed by the television programs
and complete the learning process which the programs helped
begin.
Conclusions
Results of the evaluation study support the conclu-
sions that the "Infinity Factory"=prOgrams are able to
capture and hold students' ttention; that the programs have
\ high appeal for Black, Latino, and non-target students; that
the mathematical objectives of the series were generally met
for all student groilps; and that teachers consider the pro-
grams effective and useful:
.Significant o4prall improvements were found in two
of the four areas of s udents' attitudes measured (social
and math attitudes relat d to series goals, and attitudes
toward'television program about math). On the whole, how-
ever, results in the areas o student attitudes were not as
dr.amatically positive as resul s in the areas of knowledge
of math content, student attention, and student appeal.
57
6. RECOMMENDATIONS*
The "Infinity Factory" eight-show series was evalua-
ted with over 1,000 students in Boston, Massachusetts;
Lawrence, Massachusetts; New York, New York; and Los Angeles,
California. The program series met with overall success as
determined by measures of attention, appeal, comprehension,
knowledge of math content, students' attitudes, and teacher
responses. The following recommendations are made for
distribution of the series, use in schools, ongoing produc-
'don, and ongoing evaluation.
1. Dissemination efforts should stress the
advantages of the series for a non-target
audience as well as the target audience since
evaluation findings indicate that non-target
students liked the program and benefitted from
math content presented in a multicultural con-
text.
2. Dissemination efforts aimed toward schools
should include more extensive orientation
for teachers, with particular emphasis on the
series' objectives (both math and cultural/
sociazi), the rationale for the series, and
how the television programs and program guides
can be used more effectively in schools.
3. The program guides should include more ways to
develop poditive social, cultural, and math
attitudes in a classroom setting since many
teachers rate&the program very high in these
areas but focussed mainly on math content in
related classroom activities they conducted.
*These .
recommendations are based on the findings of both Part. I and.Part IIof the evaluation study, and on the experientes of the evaluators in con-ducting the study. The recommendations are also included.as Section 13
.Of Part I.
58
6.2
4. In ongoing producdon, special attention should
be given to defining both math and cultural/
social program objectives more clearly, and to
carefully translating these objectives into
program content.
5. Since the historical and "Math in the Street"
segments did not hold attention over the eight-
show series, alternative presentation of the
contant in these sequences should be considered.
Also, certain "Math Fact" segments were found to
have low appeal for students, and alternatives
for these should be considered.
6. Evaluators found that show segments which fea-
ture Black or Latino families are well re eived
by both Black and Latino students. There ore,
this type of approach to multicultural edu ation
should be continued in future productions.
7. Since measures of appeal and comprehension of
story line were quite high for the target aAdi-
ence and math content measures somewhat lower,
it is suggested that one possible route to
improving students' math learning might be a
better integration of dramatic story line and
math content.
8. Special attention should be paid to the diction
of cast members. It is,recommended that the
series use only actors who can be clearly under-
stood by all segments of the target audience.
The evaluation\findings indicate that younger
and older students respond differently to the
programs, especially in the areas of math con-
tent, attitudes, and comprehension of story line.
Therefore, special attention should be given to
the development of material appropriate for.spe-
cific age groups, and each program should contain
6,.3.
material appropriate for different age levels of
the target audience.
10. The purpose of some shorter segments of the shows
was not clear to the evaluators. It is recommnded
that the educational objectives, both math and
cultural/social, of these shorter segments be
planned and integrated into the context of the
overAll program as carefully as the major segmen/ts.
11 Ongoing content analysis of pro'grame-ShOuld be/
implemented during production in order to monitor
the degree to which each program segment meets
its objectives. This information would also be
useful to evaluators in developing items for/
criterion-referenced measures of program impact.
12. More careful attention should be given to /
relating programs and program segments to Oe-
cific cultural and social objectives of the series.
t?/13.
Although the eight-show series was evalua ed in
the schools, the programs were designed primarily
for home-viewing. Ongoing formative eve 3/ uation
efforts should attempt to exmine program impact/
in a non-school setting. ,
14. A further examination of the effects of attention
and appeal on,comprehension, math attitudes, and
knowledge of math content is recommended.
15 Due to the cumbersome and time-consuming nature
of a large-scale evaluation effort, more informal
evaluation efforts are recommended with smaller
uoups of children. Itis further recommended
that this'process be built into the program develop-
ment process from the-planning stages on. in order
to provide ongoing and more immediate feedbick
throughout all phases of program development.
16. Greater time should be allowed for.the develop-