Page 1
DYNAMIC IMPACT TESTING OF GUARDRAIL POSTS
EMBEDDED IN SOIL
Submitted by
Brian A Coon, B.S.M.E., E.lT. Graduate Research Assistant
JohnR. Rohde, Ph.D., P.E. Associate Professor
John D. Reid, Ph.D. Assistant Professor
MIDWEST ROADSIDE SAFETY FACILITY University of Nebraska-Lincoln 1901 "Y" Street, Building "CIt
Lincoln, Nebraska 68588-0601 (402) 472-6864
Submitted to
FEDERALmGHWAY ADMINISTRATION Turner-Fairbank Highway Research Center
6300 Georgetown Pike McLean, Virginia 22101-2296
MwRSF Research Report No. TRP-03-77-98
July 21, 1999
Page 2
T h· IR ee Olea eport D t· P ocumen ation age 1. Report No. 2. 3. Recipient's Accession No.
TRP-03-77-98 4. Title and Subtitle 5. Report Date
Dynamic Impact Testing of Guardrail Posts Embedded in July 21, 1999 Soil
6.
7. Author{s) 8. Perfonning Organization Report No.
Coon, B.A., Reid, J.D., and Rohde, JR. TRP-03-77-98 9. Performing Organization Name and Address 10. ~ectffask/Work. Unit No.
Midwest Roadside Safety Facility (MwRSF) University of Nebraska-Lincoln 1901 Y St., Bldg. C Lincoln, NE 68588-0601
11. Contract (R) or Grant (0) No.
12. Sponsoring Organization Name and Address 13. Type of Report and Period Covered
Federal Highway Administration (FHW A) Draft Renort 1997 - 1999 Turner-Fairbank Highway Research Center 14. Sponsoring Agency Code
6300 Georgetown Pike McLean Vinrinia 2210 1-2296 15. Supplementary Notes
Prepared in cooperation with the Federal Highway Administration (FHW A), United States Department of Transportation
16. Abstract (Limit: 200 words)
Dynamic properties of steel and wooden guardrail posts rotating in AASHTO M 147-65 Gradation "B" specifications were obtained and documented (NCHRP Report 350 Strong Soil). The steel and wooden posts were impacted with a bogie vehicle at 5.5, 8.9, and 13.4 mls (12.3, 20, and 30 mph). Devices used to collect data consisted of an accelerometer on the bogie vehicle, strain gauges, S-VHS video, and high speed photography. WI5Ox13.5 (W6x9) posts were initially used for testing, later WI50x23.5 (W6xI6) posts were used to prevent post deformations and to ensure only soil failure behavior. 150x200mm . (6x8 in.) Southern Yellow Pine posts of DS-65 grading were used for wooden post tests.
Dynamic effects were observed between the 5.5 and 8.9 mls (12.3 and 20 mph) steel post tests. There were no measurable differences between the 5.9 and 13.4 mls (20 and 30 mph) steel post tests.
No dynamic effects for wooden posts were obtained due to wooden post fractures that occurred at higher velocities. A significant decrease in energy absorption was observed when a wooden posts fracture instead of rotating in soil.
17. Document AnalysislDescriptors 18. Availability Statement
Guardrail Posts Roadside Appurtenances No restrictions. Soil-Post Interaction Crash Test Document available from: Highway Safety Bogie Test National Technical Information Services,
Springfield, Virginia 22161 19. Security Class (this report) 20. Security Class (this page) 21. No. of Pages 22. Price
Unclassified Unclassified 69
MwRSF TRP-03-77-98
Page 3
DISCLAIMER STATEMENT
The contents of this report reflect the views of the authors who are responsible for the
facts and the accuracy of the data presented herein. The contents do not necessarily reflect the
official views or policies of the Federal Highway Administration. This report does not constitute
a standard, specification, or regulation.
This report replaces the draft report of Octo her 14, 1998, entitled "Dynamic Impact Testing of
Guardrail Posts Embedded in Soil Phase I: Wide Flange Steel Posts. "
MwRSF TRP-03-77-98 11
Page 4
ACKNOWLEDGMENTS
The authors wish to acknowledge several sources that made a contribution to this project:
(1) the Federal Highway Administration for sponsoring this project; and (2) MwRSF personnel
for their assistance in conducting the bogie tests.
A special thanks is also given to the following individuals who made a contribution to the
completion of this research project.
Midwest Roadside Safety Facility
D.L. Sicking, Ph.D., P.E., MwRSF Director and Associate Professor R.K. Faller, Ph.D., P.E., Research Assistant Professor lE. Herr, Graduate Research Assistant lC. Holloway, M.S.C.E., E.lT., Research Associate Engineer M.L. Hanau, Laboratory Mechanic I E.A. Keller, B.S.M.E., E.I.T., Research Associate Engineer K.L. Krenk, B.S.M.A. Field Operations Manager Undergraduate and Graduate Assistants
Federal Highway Administration
Martin Hargrave, COTR, Turner-Fairbank Highway Research Center
MwRSF TRP-03-77-98 III
Page 5
TABLE OF CONTENTS Page
TECHNICAL REPORT DOCUMENTATION PAGE ................................................................. i
DISCLA.ThffiR STATE~NT .................................................................................................... ii
ACKN"OWI.,EDG~NTS .......................................................................................................... iii
TABLE OF CONTENTS ........................................................................................................... iv List of Figures ................................................................................................................ vi List of Tables ................................................................................................................ viii
1 INTRODUCTION ................................................................................................................... 1 1.1 Background ....................................................................................................................... 1 1.2 Objectives .......................................................................................................................... 1
2 LITERATURE REVIEW ......................................................................................................... 2 2.1 Prior Post Testing Studies ................................................................................................. 2
3 SCOPE OF TESTING ............................................................................................................. 9 3.1 Steel Post Test Matrix ....................................................................................................... 9 3.2 Wooden Post Test Matrix ................................................................................................. 10 3.3 Accelerometer Data Analysis and Processing ................................................................... 11
3.3.1 End of Test Determination ........................................................................................ 11 3.4 Strain Gauge Data ........................................................................................................... 13 3.5 String Potentiometer Data ............................................................................................... 14
4 POST INSTRUMENTATION ............................................................................................... 15 4.1 Steel Post Instrumentation ........ : ....................................................................................... 15 4.2 WOODEN POST INSTRUMENTATION ...................................................................... 18
5 TEST CONDITIONS ............................................................................................................ 23 5.1 Test Facility ..................................................................................................................... 23
5.1.1 Bogie tow and guidance system ................................................................................ 23 5.1.2 Post Installation Procedure ....................................................................................... 24 5.1.3 Steel Post Material Properties ................................................................................... 25 5.1.4 Wooden Post Material Properties .............................................................................. 26 5.1.5 Soil Material Properties ............................................................................................ 26
5.2 Data Acquisition System .................................................................................................. 26 5.2.1 Accelerometer .......................................................................................................... 26 5.2.2 High Speed Photography .......................................................................................... 27 5.2.3 Pressure Tape Switches ............................................................................................ 27 5.2.4 Strain Gauges ........................................................................................................... 27 5.2.5 String Potentiometers ............................................................................................... 28
MwRSF TRP-03-77-98 IV
Page 6
6 TEST RESULTS ............................................................................................................ ....... 30 6.1 Steel Post Impacts ........................................................................................................... 30
6.1.1 Low speed steel post tests ................................................. ........................................ 32 6.1.2 High speed steel post tests ...................................................... .................................. 34 6.1.3 Offset Steel Post Impacts ..... ................................................................................. .... 34
6.2 Wooden Post Impacts ...................................................................................................... 35 6.3 Test Summary Information ........................................................................................ ...... 38
7 SUMMARY AND CONCLUSIONS ........................................... ........................................... 57
8 RECOMMENDATIONS AND FUTURE WORK .................................................................. 58
9 REFERENCES ................................................................................................................. ..... 59
MwRSF TRP-03-77-98 v
Page 7
List of Figures
Page Figure 1. MwRSF Bogie Vehicle - Frontal Impact. ...................................................................... 9
Figure 2. Offset Bogie Head ..................................................................................................... 10
Figure 3. Discrepancy Between Bogie Force and Normal Force ................................................ 12
Figure 4. Three Point Loading Used To Calibrate Posts ............................................................ 13
Figure 5. Strain Gauge Configuration for Test Nos. 3 and 4 ...................................................... 16
Figure 6. Strain Gauge Configuration for Test Nos. 5, 6, 10, and 11 .......................................... 17
Figure 7. Slightly Deformed Flange ofWI50x13.5 (W6x9) (Test No.3) ................................... 18
Figure 8. Structurally Compromised WI50x13.5 (W6x9) Posts from Previous Post Testing ..... 18
F 9 Ini' I' . . d' 19 Igure. tla stram gauge mstrumentatlon esIgn ................................................................. .
Figure 10. Longitudinally Cut Instrumented Post. ..................................................................... 20
Figure 11. Notched design for strain gauge instrumentation ...................................................... 21
Figure 12. Slotted Wooden Instrumented Post. ......................................................................... 22
Figure 13. Bogie Positioned in Guide Track Configuration ........................................................ 24
Figure 14. Plan View of Excavated Area ................................................................................... 25
Figure 15. String Potentiomenter Configuration ........................................................................ 29
Figure 16. Velocity-Force Relationship for Steel Post Tests ...................................................... 31
Figure 17. Velocity-Energy Relationship For Steel Post Tests ................................................... 32
Figure 18. Typical Low-speed Bogie Impact (Test Nos. 1 and 2) .............................................. 33
Figure 19. Typical High-speed Bogie Impact (Test No.5) ........................................................ 34
Figure 20. Velocity-Force Relationship for Wooden Post Tests ................................................ 36
Figure 21. Velocity-Energy Relationship For Wooden Post Tests ............................................. 37
Figure 22. Results ofWisc-l ..................................................................................................... 39
Figure 23. Results ofWisc-2 ..................................................................................................... 40
Figure 24. Results ofWisc-3 ..................................................................................................... 41
Figure 25. Results ofWisc-4 ..................................................................................................... 42
Figure 26. Results ofWisc-5 ..................................................................................................... 43
Figure 27. Results ofWisc-6 ..................................................................................................... 44
Figure 28. Results ofWisc-7 ..................................................................................................... 45
MwRSF TRP-03-77-98 VI
Page 8
Figure 29. Results ofWise-8 . ...................................................... .............................................. 46
Figure 30. Results of Wise-l o . ............................................................................................. ..... 47
Figure 31 .. Results of Wise-II ............................................................................................. ...... 48
Figure 32. Results of Wood-I .................................................................................................... 49
Figure 33. Results ofWood-2 .................................................................................................... 50
Figure 34. Results ofWood-3 .................................................................................................... 51
Figure 35. Results ofWood-4 .................................................................................................... 52
Figure 36. Results ofWood-5 .................................................................................................... 53
Figure 37. Results ofWood-6 .................................................................................................... 54
Figure 38. Results ofWood-8 .................................................................................................... 55
Figure 39. Results ofWood-9 .................................................................................................... 56
MwRSF TRP-03-77-98 VII
Page 9
List of Tables
Page Table 1. Michie Post Test Results ................................................................................................ 3
Table 2. Calcote Post Test Results .............................................................................................. 4
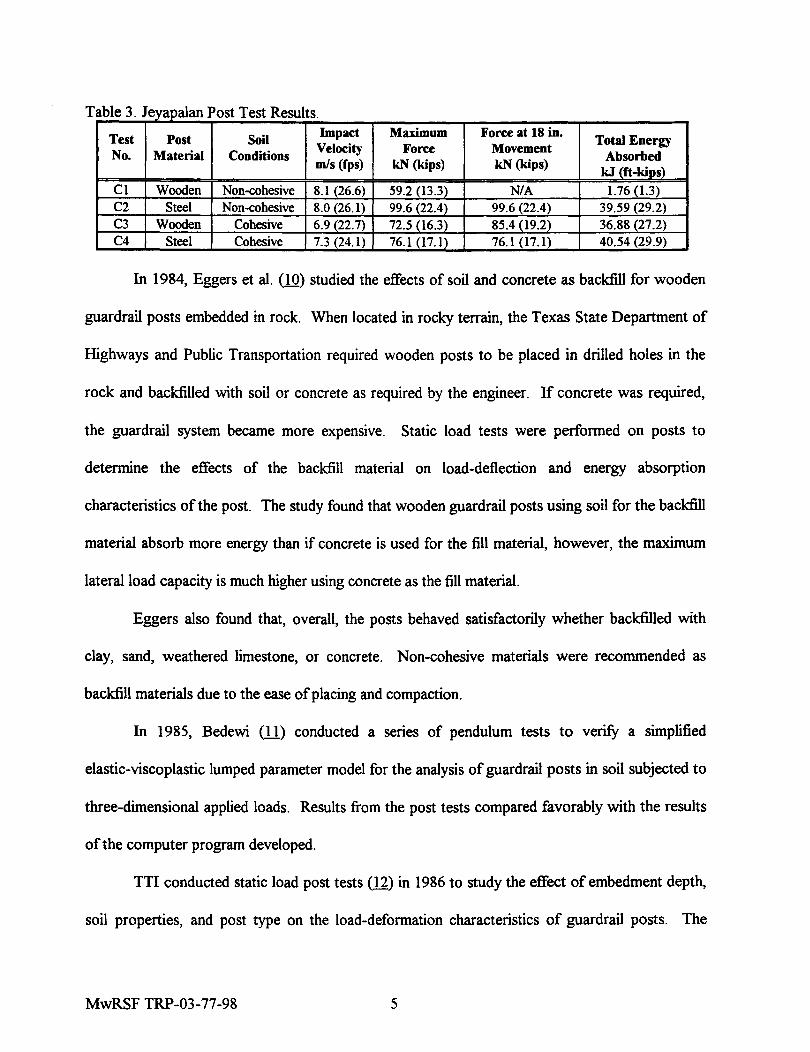
Table 3. Jeyapalan Post Test Results ........................................................................................... 5
Table 4. Bronstad Post Test Results ..... : ...................................................................................... 7
Table 5. Initial Steel Post Frontal Impact Test Matrix .................................................................. 9
Table 6. Initial Wooden Post Frontal Impact Test Matrix ........................................................... 11
Table 7. Steel Post Material Properties ..................................................................................... 26
Table 8. Wooden Post Material Properties ................................................................................. 26
Table 9. Steel Post Test Matrix ................................................................................................. 30
Table 10. Dynamic Steel Test Results Summary ........................................................................ 31
Table 11. Wooden Post Test Matrix .......................................................................................... 35
Table 12. Dynamic Wooden Test Results Summary ................................................................... 36
Table 13. Post Tests Performed ................................................................................................ 38
MwRSF TRP-03-77-98 V111
Page 10
1 INTRODUCTION
1.1 Background
The behavior of a guardrail system during an impact is a very complex event, requiring
extensive analysis. One important aspect of this event is the post-soil interaction. The dynamic
properties of this interaction are of great theoretical and practical importance in understanding
how posts behave in soil. This understanding is also critical in determining parameters for
computer simulation modeling.
The failure mode for a guardrail post drastically affects performance. Post rotation,
fracture of the post, bending of the post, twisting of the post, or a combination of failure modes
radically affect how much energy is absorbed by a post in a guardrail system. If the post is not
allowed to rotate sufficiently and fractures or yields soon after impact, the force levels may be
lower than what is commonly observed in full-scale vehicle crash tests on guardrail systems using
strong posts embedded in soil (1). Because the interaction between the soil and guardrail posts is
so important, it is necessary to conduct bogie testing to better quantify these parameters.
1.2 Objectives
The purpose of this study was to gather data for documenting the post-soil interaction of
guardrail posts rotating in soil. The behavior of steel and wooden posts in both frontal impacts
and frontal offset impacts are to be examined. Wide-flanged steel posts and wooden posts were
tested to determine the dynamic properties of the post-soil interaction. Those results are included
in this report.
MwRSF TRP-03-77-98 1
Page 11
2 LITERATURE REVIEW
2.1 Prior Post Testing Studies
Due to the complexity of post-soil interaction, much effort has been devoted to the
behavior of posts under lateral load. Many different aspects of the post and soil interaction have
been studied in prior research projects (1). In 1961, General Motors studied the performance
characteristics of various materials and found that reinforced concrete is undesirable for guardrail
posts (Z). However, wooden and steel posts were found to be acceptable for strong and weak
post designs.
In 1967, the New York State Department of Public Works (1) found that the behavior of
guardrail posts directly affects the performance of guardrails. This was determined using the
results of dynamic post test results. They also found that a 20.3-cm wide by 61.0-cm high (8-in.
wide by 24-in. high) steel plate attached to the posts was adequate at replacing a more expensive
concrete footing.
In 1970, the Southwest Research Institute (~) conducted a study of the post-soil
interaction behavior of guardrail posts. A total of 72 tests were conducted. Both dynamic and
static tests were completed using two types of soils, four embedment depths, and three different
types of posts. The study found that the dynamic response of the post and the energy absorbed by
the soil is directly related to the shear strength of non-cohesive soils, embedment depth, and post
width. Also, the study found that the dynamic response of guardrail posts was greater than what
was indicated by static tests. Results also showed that the performance of a highway guardrail
system is clearlyaffected by the post-soil characteristics of the system.
Michie et al. (~) conducted pendulum tests to experimentally determine the performance
properties of guardrail posts under impact loads. Steel and wooden posts were also tested for
MwRSF TRP-03-77-98 2
Page 12
companson. The posts were secured to a rigid fixture to test the post strength and not the more
complex post-soil composite properties. The post dynamic peak force, average force and fracture
energy were found to vary directly with the moment of inertia. Presented in Table 1 is a summary
of the results obtained from the study.
Table 1. Michie Post Test Results.
Post Material Dimensions or Specifications Average Force Deflection
em (in.) kN (kij)s) em (in.)
Douglas Fir 20.3 x 20.3 (8 x 8) 40.39 (9.08) 29.7 (11.7) Douglas Fir 15.2 x 20.3 (6 x 8) 30.43 (6.84) 24.9 (9.8) Douglas Fir 10.2 x 15.2 (4 x 6) 13.34 (3.00) 23.1 (9.1) Douglas Fir 10.2 x 10.2 (4 x 4) 7.92 (1.78) 22.6 (8.9)
Steel 152B12.8 (6B8.5) 32.92 (7.40) 24.6 (9.7) Steel 76218.6 (315.7) 15.92 (3.58) 30.5 (12.0)
In 1974, a series of pendulum tests was performed by Gatchell (§) to evaluate the dynamic
performance of wooden guardrail posts. The major finding was that specifications for wooden
guardrail posts based on grades or stress ratings can be eliminated. Wooden guardrail post
specifications should be based on the amount of knot-associated grain distortion in the middle
third of the tension face. Such knot-associated grain distortion should not exceed one-third the
width of the tension face.
A series of 102 pendulum tests on two typical guardrail posts installed in five different soil
types was performed by Calcote, et al. (7-8) of the Southwest Research Institute (SwRI) in 1978.
The purpose of the tests was to determine post property variations as a function of soil
conditions. The results were then used as post parameters in the BARRIER VII computer
program to estimate the ultimate effect soil conditions have on guardrail performance. It was
concluded that guardrail failure could be expected for severe impacts on short installations, less
than 45.7 m (150 ft), with poor soil conditions and that guardrails of this length or shorter should
not be used unless precautions are taken to ensure the integrity of each post, particularly if the
MwRSF TRP-03-77-98 3
Page 13
available space behind the barrier is limited. It was felt that embedding the post in a concrete
footing or lengthening the embedment depth in the soil could provide the necessary integrity of
the posts. The parameters developed as a result of this study are shown in Table 2.
Table 2. Calcote Post Test Results Soil and Post Type
Fixed Support Base Material StitT Clay Sat Clay Sand Loam Parameter Steel Wood Steel Wood Steel Wood Steel Wood Steel Wood
Stiffitess Strong Axis, kN/m 178.6 623.5 201.4 341.5 106.8 206.6 129.6 245.2 136.6 274.9 KA (k/in.) (1.02) (3.56) (1.15) (1.95) (0.61) (l.18) (0.74) (1.40) (0.78) (1.57) Stiffitess Weak Axis, kN/m 691.8 796.8 430.8 273.2 203.1 248.7 197.9 213.7 339.7 224.2 KB (k/in.) (3.95) (4.55) (2.46) (1.56) (1.16) (1.42) (Ll3) (1.22) (1.94) (1.28) Base Yield Moment kN*m 39.89 38.40 26.10 19.50 14.20 12.30 8.10 8.30 15.70 12.10 Strong Axis, MB (k*in.) (353) (340) (231) (173) (126) (109) (71.7) (73.5) (139) (107) Base Yield Moment kN*m 12.09 28.02 10.09 21.81 8.10 11.64 6.39 8.80 8.30 .13.56 Weak Axis. MA (k*in.) (107) (248) (96.5) (193) (71.7) (103) (56.6) (77.9) (73.5) (120) Shear Force Strong kN 476 1103 429 859 319 458 252 347 327 534 Axis, FA (kips) (5.10) (11.8) (4.61) (9.19) (3.39) (4.90) (2.70) (3.71) (3.51) (5.71) Shear Force Weak kN 74.3 72.1 48.9 36.5 26.7 23.1 15.1 15.6 29.4 22.7 Axis, FB (kips) (l6.7) (16.2) (11.0) (8.21) (6.00) (5.19) (3.39) (3.51) (6.61) (5.10) Max. Deflection em 12.6 8.4 10.1 12.0 14.1 10.6 9.3 6.7 11.4 9.2 Strong Axis, DA (in.) (4.96) (3.31) (3.98) (4.72) (5.55) (4.17) (3.66) (2.64) (4.49) (3.62) Max. Deflection Weak em 10.8 9.0 11.4 13.4 13.1 9.3 7.6 7.3 8.6 10.1 Axis, DB (in.) (4.25) (3.54) (4.49) (5.28) (5.16) (3.66) (2.99) (2.87) (3.39) (3.98)
In 1983, JeyapaIan et aI. (2) of the Texas Transportation Institute (TTl) conducted a
limited study of the post-soil interaction to determine the relationship between laterally applied
loads and the rotational displacements of steel and wooden guardrail posts in dry soils. Because
the Texas State Department of Highways and Public Transportation at the time required steel
posts to be placed in concrete footings that were not required for wooden posts, steel post
guardrail systems were not considered to be as economical as the wooden post guardrail systems.
The load-displacement relationship was idealized as elastic-plastic with complete failure
occurring at a post deflection of 50.8 cm (20 in.). Series of both static and dynamic tests were
conducted to verify the performance capabilities of the posts.
The JeyapaIan tests indicated that the steel guardrail post, embedded without the concrete
footing that was required by specifications at the time, performed similarly to the wooden post for
cohesive soil. The results of the dynamic testing program are presented in Table 3.
MwRSF TRP-03-77-98 4
Page 14
T hI 3 J a e eyapi an ost est al P T R esu ts.
Test Post Soil Impact Maximum Force at 18 in.
Total Energy No. Material Conditions
Velocity Force Movement Absorbed
mls (fps) kN (kips) kN (kips) kJ (ft-kips)
C1 Wooden Non-cohesive 8.1 (26.6) 59.2 (13.3) N/A 1.76 (1.3) C2 Steel Non-cohesive 8.0 (26.1) 99.6 (22.4) 99.6 (22.4) 39.59 (29.2) C3 Wooden Cohesive 6.9 (22.7) 72.5 (16.3) 85.4J19.2) 36.88 (27.2) C4 Steel Cohesive 7.3 (24.1) 76.1 (17.1) 76.1 (17.1) 40.54 (29.9)
In 1984, Eggers et al. (10) studied the effects of soil and concrete as backfill for wooden
guardrail posts embedded in rock. When located in rocky terrain, the Texas State Department of
Highways and Public Transportation required wooden posts to be placed in drilled holes in the
rock and backfilled with soil or concrete as required by the engineer. If concrete was required,
the guardrail system became more expensive. Static load tests were performed on posts to
determine the effects of the backfill material on load-deflection and energy absorption
characteristics of the post. The study found that wooden guardrail posts using soil for the backfill
material absorb more energy than if concrete is used for the fill material, however, the maximum
lateral load capacity is much higher using concrete as the fill material.
Eggers also found that, overall, the posts behaved satisfactorily whether backfilled with
clay, sand, weathered limestone, or concrete. Non-cohesive materials were recommended as
backfill materials due to the ease of placing and compaction.
In 1985, Bedewi (11) conducted a series of pendulum tests to verify a simplified
elastic-viscoplastic lumped parameter model for the analysis of guardrail posts in soil subjected to
three-dimensional applied loads. Results from the post tests compared favorably with the results
of the computer program developed.
TTl conducted static load post tests (12) in 1986 to study the effect of embedment depth,
soil properties, and post type on the load-deformation characteristics of guardrail posts. The
MwRSF TRP-03-77-98 5
Page 15
study found that a successful guardrail can be designed using more posts when full embedment is
not possible. Posts with only 45.72 or 60.96-cm (18 or 24-in.) embedment could be used at 95.25
cm (37.5 in.) spacing and still produce the required strength.
In 1988 Bronstad, et al. OJ) conducted twelve pendulum tests on wooden and steel posts.
Bronstad's findings were different from the results of previous research conducted by Calcote
(~). Bronstad concluded that the posts maintained significant reserve strength after the maximum
load was reached when strong posts yield the soil. Bronstad used BARRIER VII computer
simulations for guidance in selecting test conditions for the various transition configurations. For
systems using larger posts, pendulum tests were conducted to determine post properties for
BARRIER VII input. Results from testing indicated that the 45.7 x 61.0-cm (18 x 24-in.) soil
paddle used on W150 x 23.3 (W6 x 15.5) posts apparently has little effect on the stiffitess or
maximum force, and a W150 x 23.3 (W6 x 15.5) post is only slightly less stiff than a 25.4 x
25.4-cm (10 x 10-in.) wood post but yield a greater maximum force. The results of the post
testing study are summarized in Table 4
In 1988, Ataullah (14) utilized BARRIER VII for analyzing Nebraska's bridge rail to
guardrail transition designs. From the simulations, Ataullah calculated the post properties of the
transition and found that guardrail posts in wet soil are not as stiff as they are in dry soil. The
deflections of guardrail posts in wet soil were found to be considerably higher than that of
guardrail posts in dry soil. The wet and dry soil parameters were calculated by multiplying the
experimentally collected data by a factor of 0.75 and 0.50, respectively. Although the parameters
were not obtained directly and were altered in order to be used in the simulation, the effect of
moisture content on the performance of a guardrail system was evident and found to be
significant. It was also found that for smooth redirection of vehicles, the impact point needed to
MwRSF TRP-03-77-98 6
Page 16
be farther downstream from the transition for the weaker wet soil.
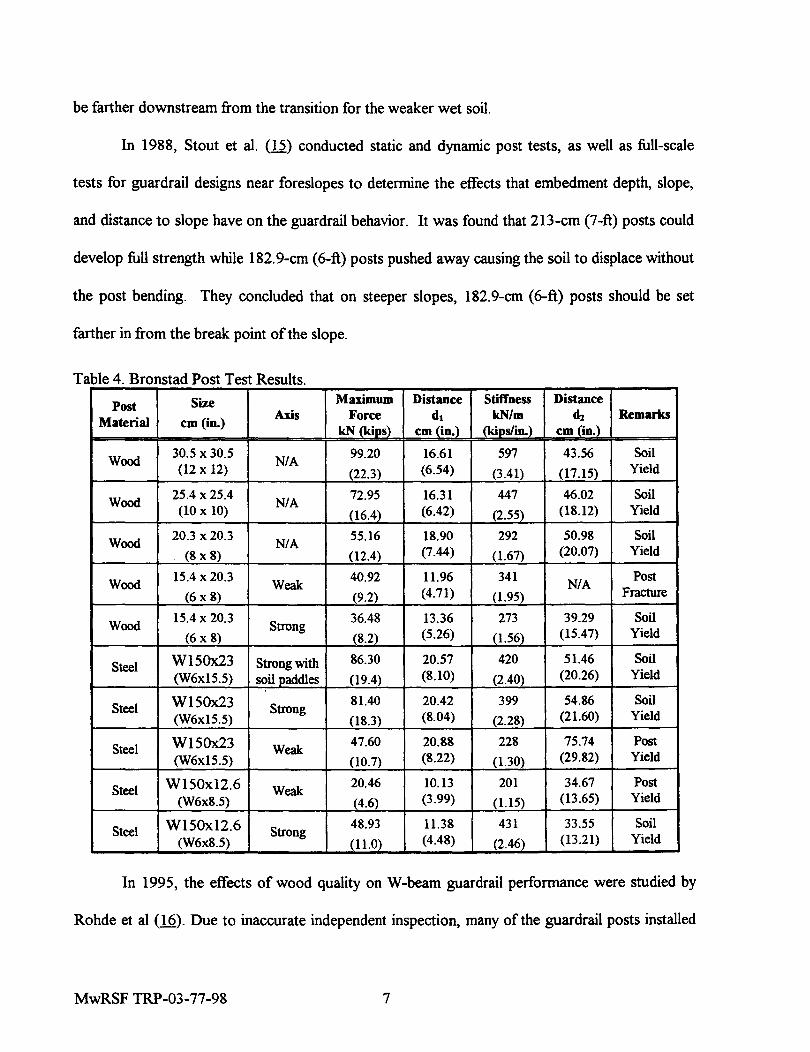
In 1988, Stout et al. (15) conducted static and dynamic post tests, as well as full-scale
tests for guardrail designs near foreslopes to determine the effects that embedment depth, slope,
and distance to slope have on the guardrail behavior. It was found that 213-cm (7-ft) posts could
develop full strength while 182.9-cm (6-ft) posts pushed away causing the soil to displace without
the post bending. They concluded that on steeper slopes, 182.9-cm (6-ft) posts should be set
farther in from the break point of the slope.
Table 4. Bronstad Post Test Results
Post Size Maximum Distance Stiffness Distance
Material em (in.) ADs Force d1 kN/m d1 Remarks
kN (kiJl~ em (in.) (kips/in.) em (in.)
Wood 30.5 x 30.5 N/A 99.20 16.61 597 43.56 Soil (12 x 12) (22.3) (6.54) (3.41) (17.15) Yield
Wood 25.4 x 25.4 N/A 72.95 16.31 447 46.02 Soil (10 x 10) (16.4) (6.42) (2.55) (18.12) Yield
Wood 20.3 x 20.3 N/A 55.16 18.90 292 50.98 Soil
(8 x 8) (12.4) (7.44) (1.67) (20.07) Yield
Wood 15.4 x 20.3
Weak 40.92 11.96 341 N/A Post
(6x8) (9.2) (4.71) (1.95) Fracture
Wood 15.4 x 20.3
Strong 36.48 13.36 273 39.29 Soil
(6 x 8) (8.2) (5.26) (1.56) (15.47) Yield
Steel W150x23 Strong with 86.30 20.57 420 51.46 Soil (W6x15.5) soil J.lClddles (19.4) (8.10) (2.40) (20.26) Yield
Steel W150x23 Strong 81.40 20.42 399 54.86 Soil
(W6xI5.5) (18.3) (8.04) (2.28) (21.60) Yield
Steel W150x23 Weak 47.60 20.88 228 75.74 Post
(W6x15.5) (10.7) (8.22) (1.30) (29.82) Yield
Steel W150x12.6 Weak 20.46 10.13 201 34.67 Post
(W6x8.5) (4.6) (3.99) (1.15) (13.65) Yield
Steel W150x12.6 Strong 48.93 11.38 431 33.55 Soil
(W6x8.5) (11.0) (4.48) (2.46) (13.21) Yield
In 1995, the effects of wood quality on W-beam guardrail performance were studied by
Rohde et al (16). Due to inaccurate independent inspection, many of the guardrail posts installed
MwRSF TRP-03-77-98 7
Page 17
by the Nebraska Department of Roads (NDOR) were below the DS-65 classification specified by
the State. This specification provides a high factor of safety and is more stringent than required
by Federal Guidelines. Researchers concluded that DS-65 posts were significantly stronger than
lower graded posts. However, perfonnance testing resulted in no significant difference in the
strength or energy absorption between Grade 1 Southern Yellow Pine and Douglas Fir posts, the
nationally recognized standard, and any of the lower grade posts that were currently installed in
Nebraska at that time.
In 1996, Bierman et al. (1) validated the interpolation of stifIhess and strength values from
the force-deflection plots obtained from post tests. Twenty-one dynamic post tests were
conducted with wooden and steel posts of 182.9-cm (6 ft) and 198.1-cm (6-Yz ft) lengths.
MwRSF TRP-03-77-98 8
Page 18
3 SCOPE OF TESTING
3.1 Steel Post Test Matrix
The initial phase of the testing program gathered data for documenting the behavior of
steel posts rotating in soil. Steel guardrail posts were embedded in soil material conforming to
AASHTO M 147-65 Gradation liB" specifications (NCHRP Report 350 Strong Soil) and
instrumented with strain gauges and string potentiometers. These posts were impacted with a
bogie vehicle at 5.5, 8.9, and 13.4 mls (12.3, 20, and 30 mph). The initial test matrix is shown in
Table 5. The impacts were documented by accelerometers on the bogie vehicle and either high-
speed photography or Super VHS video cameras.
Tabl 5 Ini . I SIP F al 1m e . tta tee ost ront Ipact est T M atnx. Impact Velocity Post Type Soil Density Embedment Depth
mls (mph) ASTM Designation kg/m3 (pct) m (in.) 5.5 (12.3) W15OX13.5 (W6x9) 2080 (130) 1.09(431 8.9 (20) W15Ox13.5 (W6x9) 2080 (130) 1.09 (43) 13.4 (30) W150x13.5 (W6x9) 2080 (130) 1.09 (43)
The impact type is that of the classical "head-on" or full frontal impact. The post is
impacted 55 cm (21.6 in.) above the ground line perpendicular to the face of the post, as shown in
Figure 1.
Figure 1. MwRSF Bogie Vehicle - Frontal Impact.
MwRSF TRP-03-77-98 9
Page 19
An offset impact was also performed using an angled bogie nose at 8.9 mls (20 mph). The
bogie head used to created the offset impact is shown in Figure 2.
~'" } II .,
II "
" 8"
Top
Left Side Front Right Side
Figure 2. Offset Bogie Head
3.2 Wooden Post Test Matrix
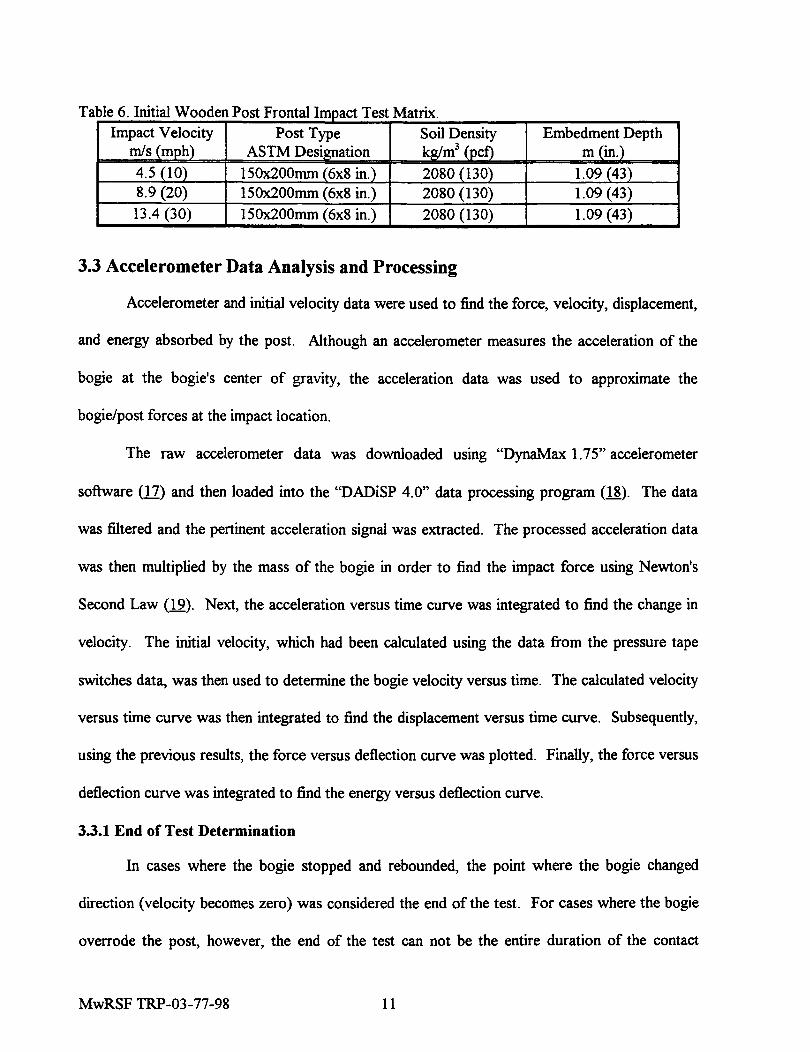
The second phase of the testing program gathered data for documenting the behavior of
wooden 150mm x 200 mm (6x8 in.) posts rotating in soil. Standard 150mm x 200 mm (6x8 in.)
guardrail posts were embedded in soil material conforming to AASHTO M 147-65 Gradation "B"
specifications (NCHRP Report 350 Strong Soil) and instrumented with strain gauges and string
potentiometers. These posts were impacted with a bogie vehicle at 4.5, 8.9, and 13.4 mls (10,20,
and 30 mph). The initial test matrix is shown in Table 6. The impacts were documented by
accelerometers on the bogie vehicle and either high-speed photography or Super VHS video
cameras.
MwRSF TRP-03-77-98 10
Page 20
Tabl 6 I ·fal W d P t F tal I e . ru 1 00 en os ron mpact est atnx. T M .
Impact Velocity Post Type Soil Density Embedment Depth rnIs{mph) ASTM Designation kg/m3 (pet) m (in.) 4.5 (10) 150x200rnrn (6x8 in.) 2080 (130) 1.09 (43) 8.9 (20) 150x200rnrn (6x8 in.) 2080 (130) 1.09 (43) 13.4 (30) 150x200rnrn (6x8 in.) 2080 (130) 1.09 (43)
3.3 Accelerometer Data Analysis and Processing
Accelerometer and initial velocity data were used to find the force, velocity, displacement,
and energy absorbed by the post. Although an accelerometer measures the acceleration of the
bogie at the bogie's center of gravity, the acceleration data was used to approximate the
bogie/post forces at the impact location.
The raw accelerometer data was downloaded usmg "DynaMax 1.75" accelerometer
software (17) and then loaded into the "DADiSP 4.0" data processing program (18). The data
was filtered and the pertinent acceleration signal was extracted. The processed acceleration data
was then multiplied by the mass of the bogie in order to find the impact force using Newton's
Second Law (19). Next, the acceleration versus time curve was integrated to find the change in
velocity. The initial velocity, which had been calculated using the data from the pressure tape
switches data, was then used to determine the bogie velocity versus time. The calculated velocity
versus time curve was then integrated to find the displacement versus time curve. Subsequently,
using the previous results, the force versus deflection curve was plotted. Finally, the force versus
deflection curve was integrated to find the energy versus deflection curve.
3.3.1 End of Test Determination
In cases where the bogie stopped and rebounded, the point where the bogie changed
direction (velocity becomes zero) was considered the end of the test. For cases where the bogie
overrode the post, however, the end of the test can not be the entire duration of the contact
MwRSF TRP-03-77-98 11
Page 21
between the post and the bogie head. This is due to the fact that a portion of the bogie energy is
consumed to lift the bogie in the vertical direction.
It is important to note that when the bogie head impacts the post, the total force exerted
by the bogie is directed perpendicular to the face of the post. As the post begins to rotate,
however, the bogie head is no longer perpendicular to the face of the post and begins to slide
along the face of the post, as shown Figure 3. Additionally, the neoprene on the bogie head used
to minimize stress concentrations increases the frictional forces acting along the surface of the
post.
L I ss an [21.6")
I I 1 I I I
69an[27j I 1 I 1
L ' 1 109 an [43")
lsl~ 1 I 1 1 1 1 I 1 L._.J
r<>j r-, - .... 1 I
I 1 I \ -1 I -I I
1 1 1 1 1 I 1 1
1 , , " , I 1 I
I /1 " I I I , I I I , I, I I
JS" II ,~
, I I I I I I I
(, I, I '..&.;_.J
Figure 3. Discrepancy Between Bogie Force and Normal Force.
In cases where the bogie passed completely over the top of the post, a maximum
deflection of 59.7 cm (23.5 in.) was allowed. This deflection corresponds to a 10% discrepancy
MwRSF TRP-03-77-98 12
Page 22
between the normal force exerted against the post and the force measured by the accelerometer.
The results from the accelerometer data are presented in Section 6. A methodology relating strain
gauge data and accelerometer data is being developed to better verify this discrepancy.
3.4 Strain Gauge Data
Strain gauges were used to find the strain distribution and therefore the distribution of the
moment about the y-axis in the posts. The strain gauge multiplication factors for each gauge were
found by calibrating the post in a simply supported configuration and loading the post with known
loads, as shown in Figure 4. This method was repeated at several points along the post in order
to accurately calibrate each strain gauge. The dynamic moment distribution was then found by
using the multiplication factors and the strain gauge output from the Vishay signal amplifier.
3
L
FORKLIFT
1 L3
Figure 4. Three Point Loading Used To Calibrate Posts.
MwRSF TRP-03-77-98 13
LOAD CELL
3
POST
Page 23
3.5 String Potentiometer Data
String potentiometers were used to measure post displacement at the groundline and
twelve inches above the groundline. An attempt to obtain the location of the post's rotation point
about the x-axis from the string potentiometer data was also attempted. Because the post not
only moves laterally upon impact but also rises up out of the ground, two measured displacements
on the post are not sufficient to determine the post's exact location. Since the post's exact
location cannot be determined, the rotation point can not be obtained using only two string
potentiometers.
Future research is needed to develop a methodology to determine the post's rotation point.
Using strain gauge instrumentation to estimate post loadings and string potentiometers to
determine post displacement, post behavior through rotation can be better determined.
MwRSF TRP-03-77-98 14
Page 24
4 POST INSTRUMENTATION
4.1 Steel Post Instrumentation
Initial testing consisted of two 183-cm (72-in.) long WI5Ox13.5 (W6x9) steel guardrail
posts impacted at approximately 5.S m/s (12.3 mph). The posts were instrumented with twenty
strain gauges spaced at S.71S-cm (2Y4-in.) intervals evenly spaced beginning at the bottom of the
post. The application of these strain gauges required that bare metal be exposed. Therefore, the
galvanization on the inner flange of the guardrail posts was ground away using an angle grinder.
After the two initial tests, it was decided that fewer strain gauges could be used in order to
simplify the data acquisition and instrumentation required. This new configuration consisted of a
12.7-cm (S-in.) spacing beginning 2S.4 cm (10 in.) from the bottom of the post using ten weldable
strain gauges. Figure S shows this strain gauge configuration.
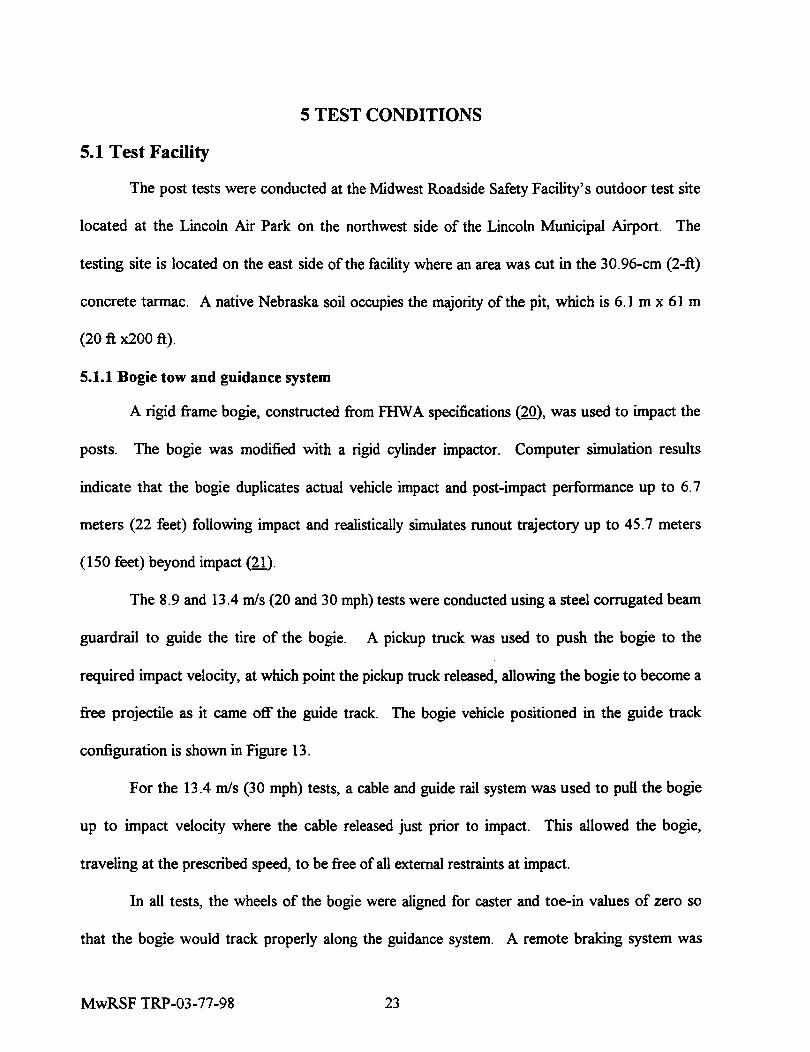
After test nos. 3 and 4 were performed, a slight deformation in the flanges of the posts
were observed; as show in Figure 7. It was believed that further testing ofWI50x13.S (W6x9)
posts would have been futile, since significant deformations would occur at higher speeds and
undermine the load resisting characteristics of the soil, as shown in Figure 8. Therefore, to
eliminate this deformation, the WlSOx13.S (W6x9) steel posts were replaced with WlS0x23.S
(W6xI6) steel posts for the higher speed impacts.
WI50x13.S (W6x9) and WlS0x23.S (W6xI6) posts have the same flange width and thus
sweep out the same soil deformation pattern. The WlS0x23.S (W6xI6) post weighs more and is
stiffer, which prevents deformation during testing. Strain gauge instrumentation for these posts is
shown in Figure 6.
MwRSF TRP-03-77-98 IS
Page 25
-,-- - r-
- r-1"
I •
48"
5" ~3 t
\hiWjlfWiT I
3" I'W, I ,WI 111 ==11 I II F +
40" ::11 I II 1::= '-=11 1- 5" -III=-'
6' I t 35"
5"
I t 30"
5"
I t 25"
5"
I t 20"
5"
I t 15"
5"
I 1 10"
1 0"
- '-- '-- '--~ " o
Figure 5. Strain Gauge Configuration for Test Nos. 3 and 4.
MwRSF TRP-03-77-98 16
Page 26
- ,.--- r--- r--
- f-1"
Ii 55"
12"
~3'
\, I ,WI I ,WiT I 1 42" TImll gill! 3" =:111 IIF 1 39" -::111=111::=
'-=11 1- 3" -III='"'
6' I 36"
1 3"
33"
I 3"
30"
6" 1-+ 24"
6" 1-+ 18"
6" 1-+ 12"
6" 1-+ 6"
6"
-'-- '--'-- t o "
Figure 6. Strain Gauge Configuration for Test Nos. 5, 6, 10, and 11.
~vvItSFT1tP-03-77-98 17
Page 27
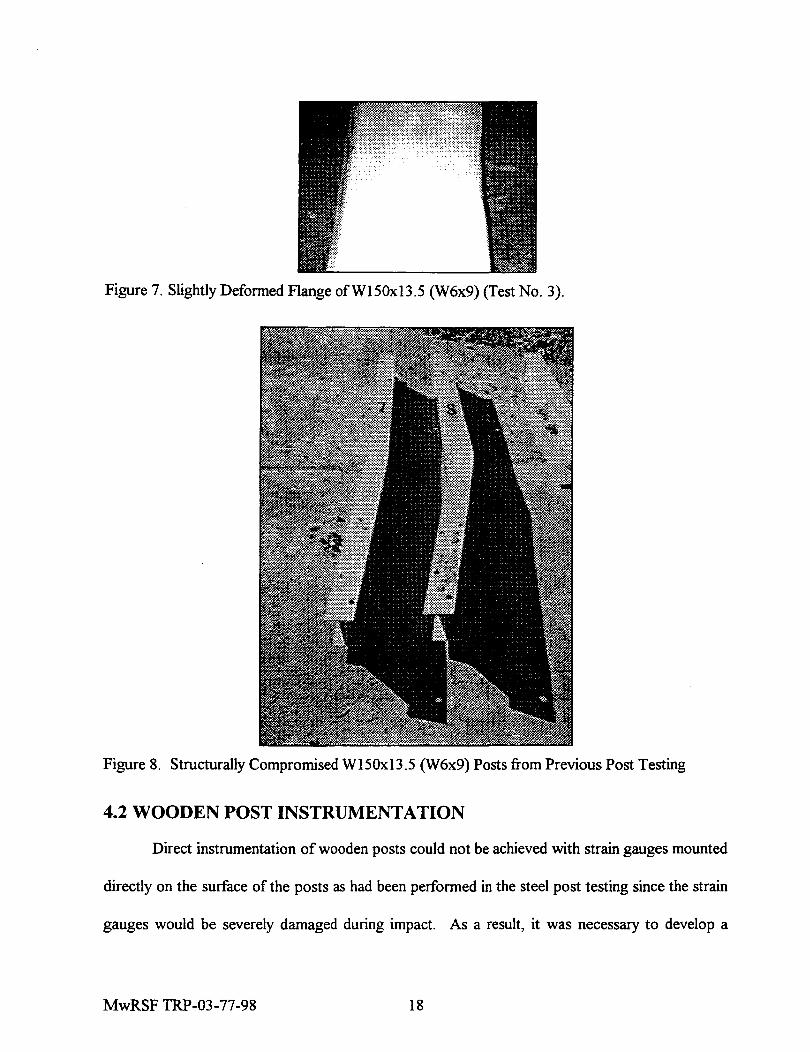
Figure 7. Slightly Deformed Flange ofW150x13.5 (W6x9) (Test No.3).
Figure 8. Structurally Compromised W150x13.5 (W6x9) Posts from Previous Post Testing
4.2 WOODEN POST INSTRUMENTATION
Direct instrumentation of wooden posts could not be achieved with strain gauges mounted
directly on the surface of the posts as had been performed in the steel post testing since the strain
gauges would be severely damaged during impact. As a result, it was necessary to develop a
MwRSF TRP-03-77-98 18
Page 28
method to instrument the wooden posts. Since externally mounted gauges on the wood surface
would be subject to abrasion and damage, the gauges were mounted on the inside of a post, as
shown in Figure 9.
Figure 9. Initial strain gauge instrumentation design
Initially, two 150x200 (6x8 in.) posts were cut in half longitudinally through the 8 in.
depth. A piece of O.1016-mm (O.004-in.) thick steel shim stock was instrumented with strain
gauges and placed between the two halves of each post. The post was then reassembled using
Scotch-Weld epoxy, a structural adhesive specifically designed for load bearing in structures
MwRSF TRP-03-77-98 19
Page 29
subjected to dynamic loading. The post was then bolted back together with carriage bolts and
allowed to dry for one week. The reassembled post is shown in Figure 10.
Figure 10. Longitudinally Cut Instrumented Post
Initial calibrations, static tests, and 4.5 mls (10 mph) impacts caused no detectable damage
to the post. When impacted at 8.9 mls (20 mph), however, the posts fractured due to stress
concentrations induced by the bolt holes used to reassemble the posts.
To minimize the stress concentrations of the post caused by post instrumentation, a small
notch was routered out of the post rather than cutting the post the entire length. Steel shim stock
was again used as the mounting surface for the strain gauges. This method of instrumentation is
shown in Figure 11.
MwRSF TRP-03-77-98 20
Page 30
I: I
Ii i I: : I: ~ I! : I: I: : I: : I: ! Ii:
A
t I
t I I I I I
A
I I I I I I
4 3" I
I: I I I I
7" I I I I I I I I I I
3 6" ;: 72" I I I I 1
6" I I I I I I I I
3 0" ;: Wire I I Troug I I
6" I I I I I I I I
2 4" ;: I I I I
6" I I I I I I I I
8" ;: I I Section A-A I I
6" I I I I I I I I
2" ;: I I I I
6" I I I I I I I I
6" ;: ~ ill 6"
4" 0" -'--
Figure 11. Notched design for strain gauge instrumentation.
Since the notches where the strain gauge wires exit the posts were not along the neutral
axis, the moment of inertia, I, would be lessened due to the removal of the wood. Additionally,
the insertion of the steel shim stock would increase the moment of inertia. Since a change the
rigidity of the posts, EI, due to the instrumentation was not desired, the rigidity change (~I)
MwRSF TRP-03-77-98 21
Page 31
caused by the insertion of the steel shim stock was calculated to balance the rigidity change
caused by the wood removed for the strain gauge wires. A post during the assembly process is
shown in Figure 12.
Figure 12. Slotted Wooden Instrumented Post.
MwRSF TRP-03-77-98 22
Page 32
5 TEST CONDITIONS
5.1 Test Facility
The post tests were conducted at the Midwest Roadside Safety Facility's outdoor test site
located at the Lincoln Air Park on the northwest side of the Lincoln Municipal Airport. The
testing site is located on the east side of the facility where an area was cut in the 30.96-cm (2-ft)
concrete tarmac. A native Nebraska soil occupies the majority of the pit, which is 6.1 m x 61 m
(20 ft x200 ft).
5.1.1 Bogie tow and guidance system
A rigid frame bogie, constructed from FHW A specifications (20), was used to impact the
posts. The bogie was modified with a rigid cylinder impactor. Computer simulation results
indicate that the bogie duplicates actual vehicle impact and post-impact performance up to 6.7
meters (22 feet) following impact and realistically simulates runout trajectory up to 45.7 meters
(150 feet) beyond impact (21).
The 8.9 and 13.4 mls (20 and 30 mph) tests were conducted using a steel corrugated beam
guardrail to guide the tire of the bogie. A pickup truck was used to push the bogie to the
required impact velocity, at which point the pickup truck released, allowing the bogie to become a
free projectile as it came off the guide track. The bogie vehicle positioned in the guide track
configuration is shown in Figure 13.
For the 13.4 mls (30 mph) tests, a cable and guide rail system was used to pull the bogie
up to impact velocity where the cable released just prior to impact. This allowed the bogie,
traveling at the prescribed speed, to be free of all external restraints at impact.
In all tests, the wheels of the bogie were aligned for caster and toe-in values of zero so
that the bogie would track properly along the guidance system. A remote braking system was
MwRSF TRP-03-77-98 23
Page 33
installed on the bogie to allow the bogie to be brought safely to a stop after the test.
Accelerometers, located at the bogie's center of gravity recorded lateral, horizontal, and vertical
accelerations.
Figure 13. Bogie Positioned in Guide Track Configuration
5.1.2 Post Installation Procedure
A plan view of the test setup and post test pit is shown in Figure 14. The test pits were
located at a sufficient distance from the edge of the concrete apron so as not to interfere with the
soil response during impact.
Embedment of the posts consisted of excavating a 91.44-cm by I82.88-cm (3-ft by 6-ft)
area to a depth of approximately 1.5 meters (5 ft). AASHTO M 147-65 specification soil was
then compacted with a pneumatic hand tamper in I5-cm (6-in.) lifts. Soil density measurements
were taken using the sand replacement method (standard sand cone).
MwRSF TRP-03-77-98 24
Page 34
13', 1 3', ii-----i i------; 2' I I' 155 1/2"1 1 I 56"---.--t:- -~ -: :-~ -:-
I ~ I I -----c::tJ I I I I I I I I I I I I I
l4' 1 1 1 1
~--~ ~--T--j ~ Escavated and filled area
11
Direction of Bogie
DEPTH = 43" for 6' Post
SOIL CONCRETE
CONCRETE
Figure 14. Plan View of Excavated Area
5.1.3 Steel Post Material Properties
In the first four tests, standard galvanized W1SOx13.5 (W6x9) posts were used. After
slight deformations were observed in the low speed testing, it was determined to use stronger
W1S0x23.5 (W6xI6) steel posts in order to ensure soil failure rather than post failure. The
WI50x23.5 (W6xI6) posts were not galvanized, The steel posts were manufactured using
ASTM A36 steel. The cross-sections conformed to their respective dimensions as defined in
ASTM A6M, The posts and their material properties are shown in Table 7.
MwRSF TRP-03-77-98 25
Page 35
T bl 7 St I P t M . I P a e . ee os atena ropertles Flange Moment of Section Plastic Section
ASTM Area, A, Width, br, Inertia, Ix Modulus, Sx, Modulus, Zx, Designation mm2 (in2
) mm (in) mm4 (in4) mm3 (in3) mm3 (in3
)
W150x13.5 1700 100.08 6.84x10⁶ 91,112 102,091 (W6x9) (2.68) (3.940) (16.4) (5.56) (6.23)
W150x23.5 3007 102.36 13.0x10⁶ 167,148 191,728 (W6x16) (4.74) (4.030) (32.1) (10.2) (11. 7)
5.1.4 Wooden Post Material Properties
Wooden posts were DS-65 structural grade Southern Yellow Pine @). The posts and
their material properties are shown in Table 7.
Table 8 W d PM' I P 00 en ost atena ropertles
Area, A, Moment of Section
ASTM Wood Inertia, Ix Modulus, Sx, Designation Species mm2 (in2) mm4 (in4) mm3 (in3)
150x200 mm Southern 30000 100.Ox106 1000000 (6x8 in.) Yellow Pine (48) (240) (61.0)
5.1.5 Soil Material Properties
A crusher run coarse aggregate material consisting of gravel and crushed limestone was
used for filling the excavated pit area. The soil conformed to AASHTO standard specifications
for "Materials for Aggregate and Soil Aggregate Subbase, Base, and Surface Courses,"
designation M 147-65 (1990), grading B. The moisture content was relatively dry (3% to 7%),
which was considerably below the optimum moisture content of 17%. Due to the gradation of
the material, additional moisture content would have greatly increased the in situ density.
5.2 Data Acquisition System
5.2.1 Accelerometer
A triaxial piezoresistive accelerometer system with a· range of ±200 G's was used to
measure the acceleration in the longitudinal, lateral, and vertical directions. The environmental
MwRSF TRP-03-77-98 26
Page 36
shock and vibrations sensor/recorder system, Model EDR-3, was developed by Instrumented
Sensor Technology (1ST) of Okemos, Michigan. The EDR-3 was configured with 256 kb of
RAM and was set to sample data at 3,200 Hertz using a 1,120 Hertz low-pass filter (anti-aliasing
with 3-db cutoff). Computer software programs "DynaMax 1.75" and "DADiSP 4.0" were used
to digitize, analyze, and plot the accelerometer data.
5.2.2 High Speed Photography
A Red Lake Locam with a wide-angle lens was placed perpendicular to the side of
guardrail post to record the impact event. High speed photography at 500 frames/second was
obtained for steel post test no. 10 and test nos. 3 -6 of the wooden post tests.
5.2.3 Pressure Tape Switches
Three pressure tape switches spaced at I-m (3.38-ft) intervals were used to determine the
speed of the bogie before impact. As the front tire of the bogie passed over each tape switch, a
strobe light was fired which sent an electronic timing signal to the computerized data acquisition
system. Test speeds were determined by knowing the time between these signals from the data
acquisition system and the distance between switches.
5.2.4 Strain Gauges
Strain gauges were installed to measure bending moment on the tensile side of the posts.
Where epoxyable strain gauges were adhered, strain gauges model CEA-06-125UN-120,
manufactured by the Micro-Measurements Division of the Measurements Group, Incorporated in
Raleigh, North Carolina, were used. The epoxyable gauges had a nominal resistance of 120±1.56
Ohms and a gauge factor of2.065. Where weldable strain gauges were used, strain gauges model
LWK-06-W250B-350 were employed. The nominal resistance of these strain gauges was
350.0±1.4 Ohms and a gauge factor of2.065.
MwRSF TRP-03-77-98 27
Page 37
A Measurements Group Vishay Model 2310 signal conditioning amplifier was used to
power, condition, and amplify the low-level signals to high-level signals for acquisition by a
Keithley Metrabyte DAS-1802HC data acquisition board. The computer program
"Test Point 4.0" was then used to record and permanently store the data. All strain gauge data
was recorded at 3,200 samples per second (3,200 Hz.) for a duration of6 sec.
5.2.5 String Potentiometers
Two UniMeasure PA-20-70120 string potentiometers (linear position transducers) were
installed on the post at 5.08 cm (2 in.) and 30.48 cm (12 in.) above the ground line in order to
measure deflection and rotation of the post. The P A-20 potentiometers have a range of 508 mm
(20 in.) and a sensitivity of 1.909 mVNlmm (48.48 mVN/inch).
A specially designed catcher was used to prevent hyperextension and abrupt retraction of
the string potentiometers. The string potentiometer and string catcher positions are shown in
Figure 15.
MwFlSF11lP-03-77-98 28
Page 38
concre<e SOl
0 r-0 - I\.......J . I
0 0 '-...... I\.- -, Colo .. ,
String Potentiometers
Test Poat ___ -
Breokowoy Wires~ - f /c:cner Nut 10"
..n ~ J >:. :: .. ~ '1-- .. .. .. •• L2"
. .. ~. 21"approx 105"
Figure 15. String Potentiomenter Configuration
During the tests, the output voltage signals from the string potentiometers were sent to the
Keithley Metrabyte DAS-1802HC data acquisition board, acquired by the "Test Point" software,
and then permanently stored on the computer. The sample rate for the string potentiometers was
3,200 Hertz and the duration was 6 seconds.
MwRSF TRP-03-77-98 29
Page 39
6 TEST RESULTS
6.1 Steel Post Impacts
The test matrix perfonned for frontal impact analysis on steel posts consisted of four
impacts at 5.5 mls (12.3 mph), two impacts at 8.9 mls (20 mph), and two impacts at 13.4 mls
(30 mph). The soil densities and velocities, along with post types, can be found in Table 9. The
posts were impacted 550 mm (21.6 in.) above the ground line with the rigid bogie.
Table 9 Steel Post Test Matrix Test Post Type Soil Density Impact Velocity Strain Gauge Spacing
Number ASTM Designation kg/m3 (pel) mls (mph) mm (in)
1 WI5Ox13.5 (W6x9) 1980 (124) 4. 6{1 0.4) 4.41 (2) 2 WI5Ox13.5 (W6x9) 2018 (126) 6.0 (13.4) 4.41 (2) 3 WI5Ox13.5 (W6x9) 2110 (132) 5.4 (12.1) 11.03 (5) 4 WI5Ox13.5 (W6x9) 2240 (140) 5.9 (13.1) 11.03 (5) 5 WI50x23.5 (W6xI6) 2080 (130) 8.9 (19.9) 6.62 and 13.23 (3 and 6) 6 WI50x23.5 (W6xI6) 2110 (132) 8.9 (20.0) 6.62 and 13.23 (3 and 6) 7 Static Test 8· WI50x23.5 (W6xI6) 2110 (132) 8.9 (20.0) None 9 Not Used 10 WI50x23.5 (W6xI6) 2150 (134) 14.1 (31.5) 6.62 and 13.23 (3 and 6) 11 WI50x23.5 (W6xI6) 2130 (133) 12.7 (28.4) 6.62 and 13.23 (3 and 6) .
Offset lmpact
For all of the bogie impacts, soil failure was the primary mode of failure. The posts
successfully rotated in the soil, with slight defonnation of the flanges of test nos. 3 and 4.
However, in the two cases where there was slight defonnation of the posts, the accelerometer
data closely matched the tests where post defonnation had not occurred. A summary of test
results is shown in Table 10.
MwRSF TRP-03-77-98 30
Page 40
T bl 10 D . S IT R I S a e 'ynarruc tee est esu ts ummary
Impact Maximum Energy
Resulting Test Post Type
Velocity m1s Peak Force
Deflection Absorbed
Bogie No. ASlM Designation
(mph) kN (kips)
em (in.) Joules
Condition (kip*in)
1 W150x13.5 (W6x9) 4.6 (10.4) 64.0 (14.4) 23.4 (9.2) 10.2 (89.9) Stopped 2 W150xB.5 (W6x9) 6.0 (13.4) 32.3 (7.3) 59.7 (23.5)"· 14.1 (124.8) Stopped 3 W150xB.5 (W6x9) 5.4 (12.1) 66.9 (15.0) 31.4 (12.4) 14.2 (125.9) Stopped 4 W150xB.5 (W6x9) 5.9 (13.1) 67.0 (15.1) 34.8 (13.7) 15.8 (139.6) Stopped 5 WI50x23.5 (W6xI6) 8.9 (19.9) 104.7 (23.5) 59.7 (23.5)"· 28.9 (256.4) Ride Over 6 WI50x23.5 (W6xI6) 8.9 (20.0) 86.3 (19.4) 59.7 (23.5)·· 23.2 (205.4) Ride Over 7 Static Test 8· WI50x23.5 (W6xI6) 8.9 (20.0) 63.8 (14.3) 59.7 (23.5)"· I 26.2 (231.9) Ride Over 9 Not Used 10 WI50x23.5 (W6xI6) 14.1 (31.5) 122.2 (27.5) 59.7 (23.5)·· I 29.1 (257.1) Ride Over 11 WI50x23.5 (W6xI6) 12.7 (28.4) 89.6 (20.2) 59.7 (23.5)·· I 19.8 (174.8) Ride Over .
Offset l1llpact ··Test terminated at Dmax = 59.7 em (23.5 in.), see section 3.1.1
The relationship between impact velocity and peak force is shown in Figure 16 and the
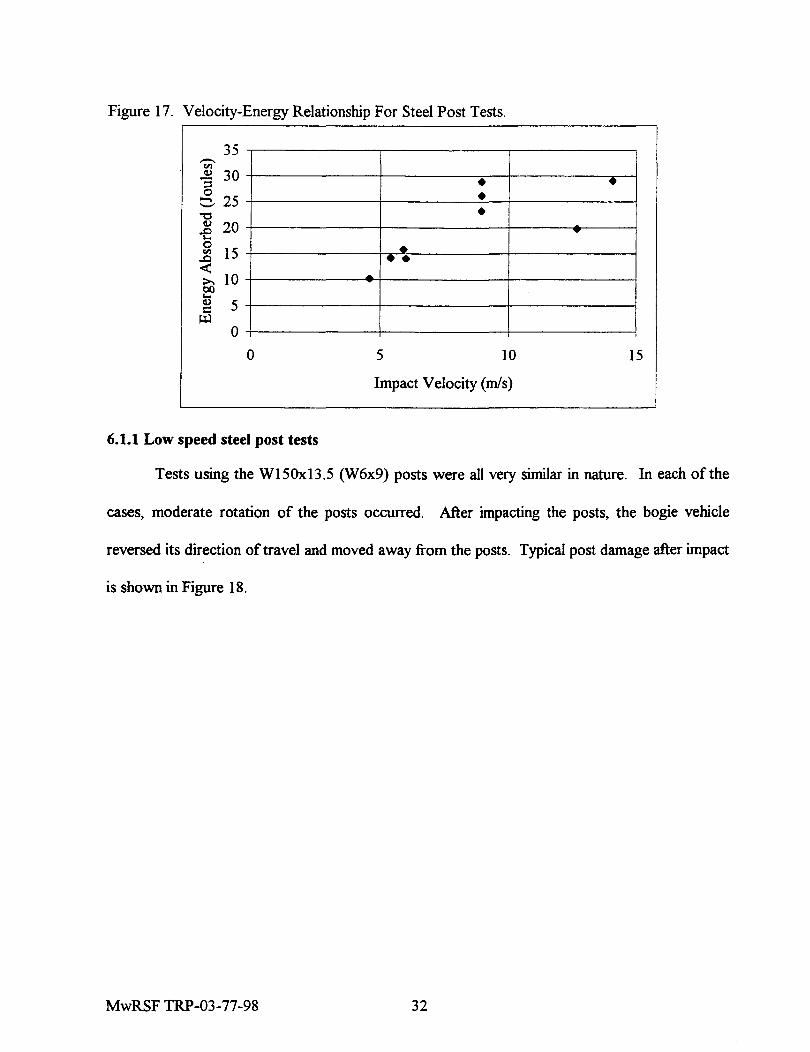
relationship between impact velocity and energy absorbed is shown in Figure 17. In both cases,
the correlation coefficient for a linear relationship is significantly less than 1 (0.588 and 0.569,
respectively) .
Figure 16. Velocity-Force Relationship for Steel Post Tests.
140
120 • ,-..
~ 100 '-'
CI) 80 (,,)
• • •
~ 0
60 ~ • •• • ~ tU 40 CI)
~ • 20
o o 5 10 15
Impact Velocity (mls)
MwRSF TRP-03-77-98 31
Page 41
Figure 17. Velocity-Energy Relationship For Steel Post Tests.
35 --. ell
.!! 30 ::s • • g 25 -0
• • (I) 20 -e ... 0
15 ell .&J • •• < @ 10 .....
(I) 5 s:: ~
0
o 5 10 15
Impact Velocity (mls)
6.1.1 Low speed steel post tests
Tests using the WI5Ox13.5 (W6x9) posts were all very similar in nature. In each of the
cases, moderate rotation of the posts occurred. After impacting the posts, the bogie vehicle
reversed its direction of travel and moved away from the posts. Typical post damage after impact
is shown in Figure 18.
MwRSF TRP-03-77-98 32
Page 42
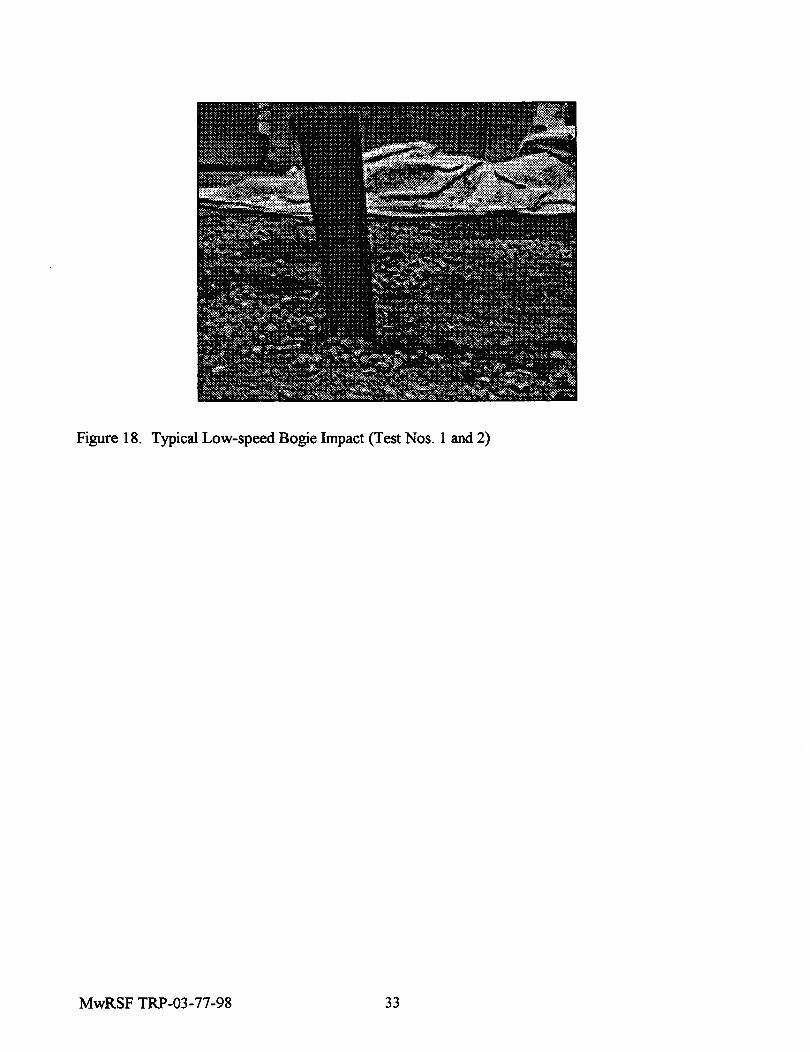
Figure 18. Typical Low-speed Bogie Impact (Test Nos. 1 and 2)
MwRSF TRP-03-77-98 33
Page 43
6.1.2 High speed steel post tests
Tests using the WI50x23.5 (W6xI6) posts all resulted with the posts completely rotating
in the soil. The bogie, in each case, continued to travel forward after post rotation, and after
clearing the post, the bogie continued along its path and was stopped when it impacted a backstop
of wooden posts. Typical post damage after impact is shown in Figure 19.
Figure 19. Typical High-speed Bogie Impact (Test No.5)
6.1.3 Offset Steel Post Impacts
The offset steel post impact performed at 8.9 mls (20 mph) showed significantly lower
peak forces than full frontal impacts, as shown in Table 10, for similar velocity impacts. The
energy absorbed, however, was not significantly different.
MwRSF TRP-03-77-98 34
Page 44
6.2 Wooden Post Impacts
The test matrix perfonned for frontal impact analysis of wooden posts consisted of four
impacts at 4.9 rnIs (10 mph) and two impacts at 8.9 rnIs (20 mph). The soil densities and
velocities, along with post types, can be found in Table 11. The posts were impacted 550 mm
(21.6 in.) above the ground line with the rigid bogie.
Table 11. Wooden Post Test Matrix Test Post Type
Date Soil Density Soil Density Velocity
Name ASTM Designation (pct) (kg/m3) rnIs I fps I mph
Wood-l 150x200mm (6x8 in.) 11113/98 134.0 2146 Static Test Wood-2 150x200mm (6x8 in.) 11113/98 132.4 2121 Static Test Wood-3 150x200mm (6x8 in.) 11118/98 134.4 2152 4.9 16.2 11.0 Wood-4 150x200nun(6x8in.) 11118/98 127.6 2045 4.8 15.9 10.9 Wood-5 150x200nun (6x8 in.) 11120/98 133.7 2141 9.6 31.6 21.5 Wood-6 150x200mm (6x8 in.) 11120/98 128.6 2059 9.0 29.4 20.1 Wood-7 Not Used Wood-8 150x200mm(6x8in.) 11120/98 138.0 2211 6.0 19.6 13.4 Wood-9 150x200mm (6x8 in.) 11120/98 138.0 2211 6.7 22.0 15.0
For the" low-speed wooden post impacts (4.8 rnIs (10 mph)), soil failure was the primary
mode of failure. At higher speeds (8.9 rnIs (20 mph)), the mode of failure was not consistant.
This is due to primarily to three conditions: the stress concentrations induced by the
instrumentation of the posts, as discussed earlier, variations in post quality due to the inherent
nature of wood, and to the variations in gradations that are allowed within AASHTO M 147-65
(1990) grading "B" specifications. A sununary of test results is shown in Table 12.
MwRSF TRP-03-77-98 35
Page 45
T bl 12 D ·W d T R IS a e Iynanuc 00 en est esu ts ummary
Test Post Type
Impact Velocity Peak Force kN Maximum Energy Resulting
Name ASTM
mls (mph) (kips) Deflection Absorbed Bogie
Designation cm (in.) Joules (kip*in) Condition Wood-01 Static Test Wood-02 Static Test
Wood-03 150x200mm
4.9 (11.0) 36.3 (8.15) 44.4 (17.5) 11.2 (98.8) Stopped (6xS in.)
Wood-04 150x200mm
4.8 (10.9) 38.S (7.S2) 45.0 (17.7) 10.3 (90.8) Stopped (6x8 in.)
Wood-05 150x200mm
9.6 (21.5) 77.8 (17.48) 59.7 (23.5)" 27.1 (240.0) Stopped (6xS in.)
Wood-06 150x200mm
9.0 (20.1) 64.2 (14.43) 14.5 (5.7) 5.4 (47.6) Post Fracture (6xS in.)
Wood-07 Not Used
Wood-OS 150x200mm
6.0 (13.4) 51.7 (11.62) 27.6 (10.9) 10.4 (91.6) Post Fracture (6xS in.)
Wood-09 150x200mm
6.7 (15.0) 55.0 (12.36) 18.2 (7.15) 5.3 (47.3) Post Fracture (6xS in.)
" Test terminated at Dmax = 59.7 cm (23.5 in.), see section 3.1.1
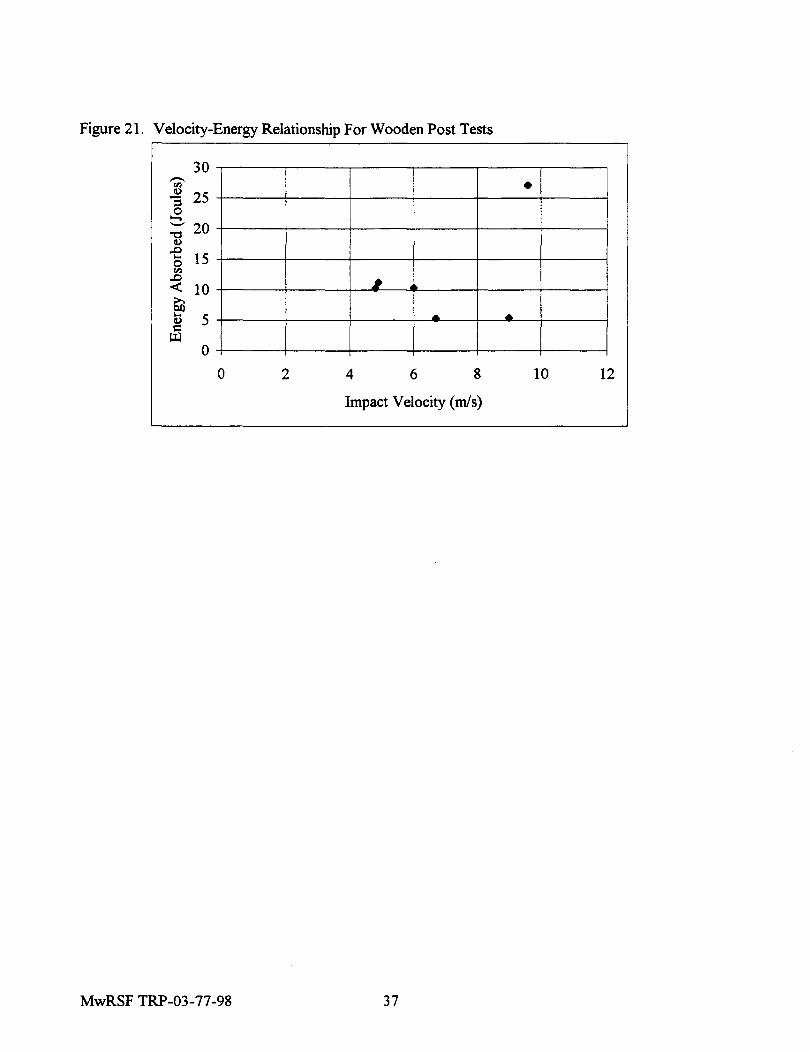
The relationship between impact velocity and peak force is shown in Figure 20 and the
relationship between impact velocity and energy absorbed is shown in Figure 21. There is a
strong linear relationship between the peak force and the impact velocity (R2=0.938), however,
there is no linear relationship between energy and velocity (R2=0.179).
Figure 20. Velocity-Force Relationship for Wooden Post Tests.
90 80 •
-.70 ~ 60 --~ 50 (,)
• •
1-0 0 40 ~ ,
...lIo:: 30 ~ ~
j:l.., 20 10 0
o 2 4 6 8 10 12
Impact Velocity (m1s)
MwRSF TRP-03-77 -98 36
Page 46
Figure 21. Velocity-Energy Relationship For Wooden Post Tests
.<Il
30
.£ 25 =' o -.
'-" 20 "0 II)
~ 15 <Il
~ 10
~ ~ 5 ~
o o
MwRSF TRP-03-77-98
~
....
2 4 6 8
Impact Velocity (mls)
37
•
..
10 12
Page 47
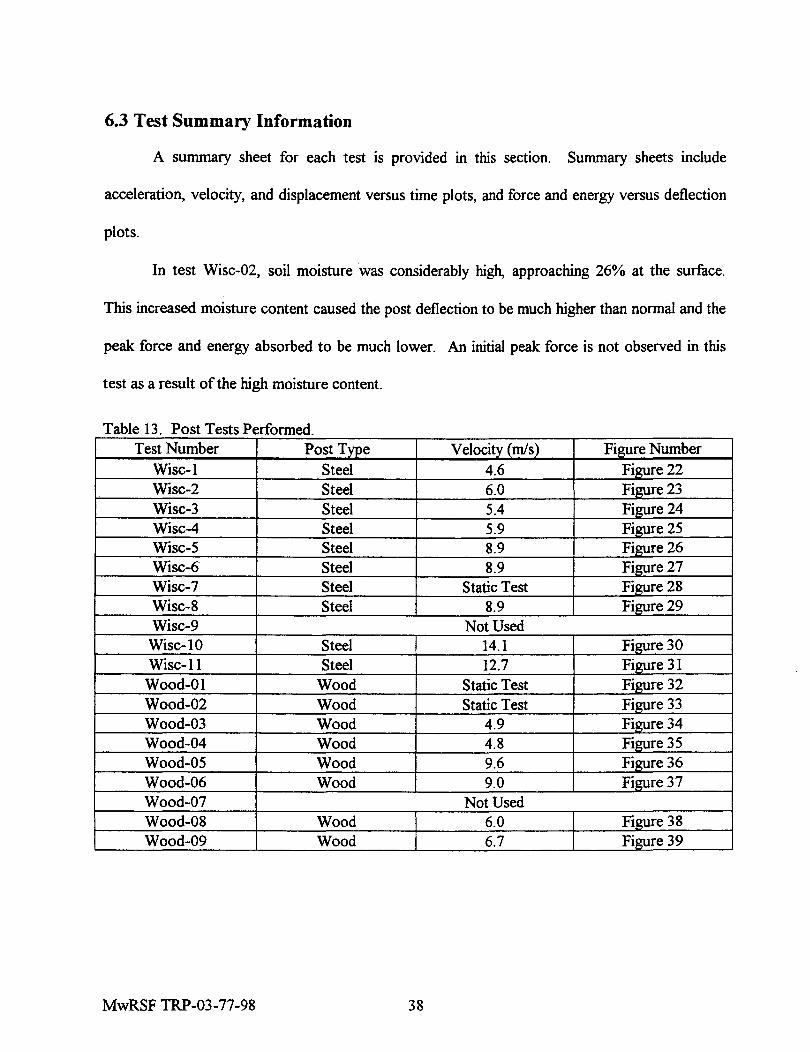
6.3 Test Summary Information
A summary sheet for each test is provided in this section. Summary sheets include
acceleration, velocity, and displacement versus time plots, and force and energy versus deflection
plots.
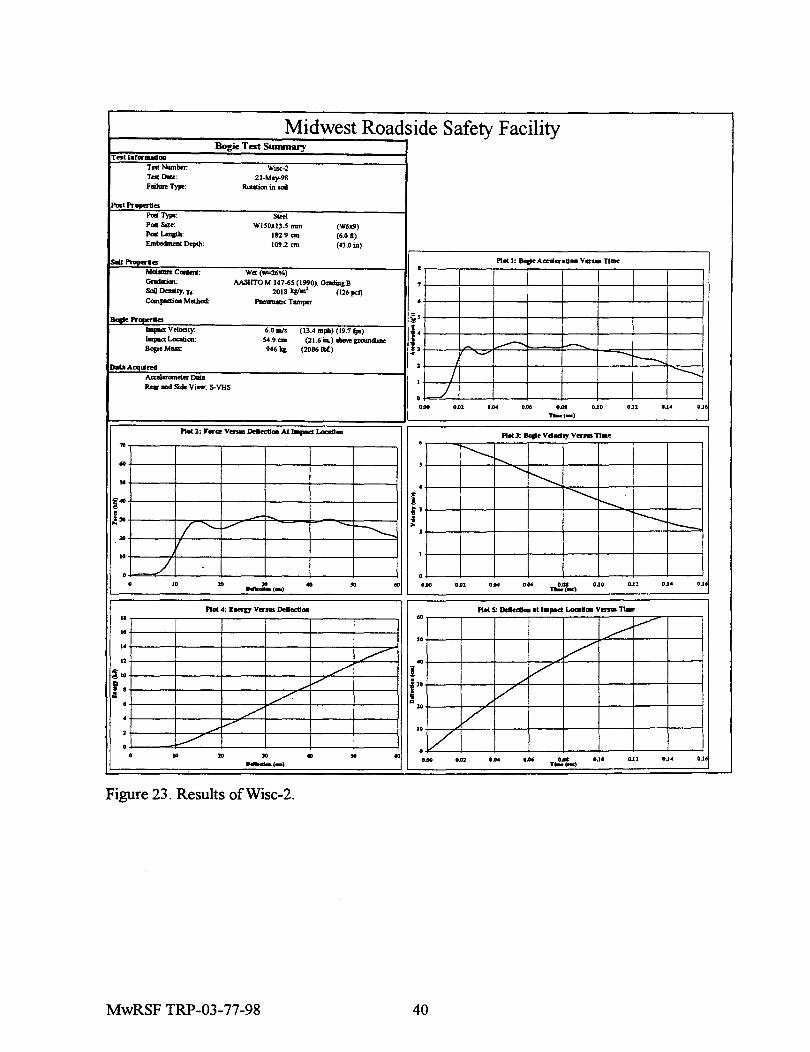
In test Wisc-02, soil moisture 'was considerably high, approaching 26% at the surface.
This increased moisture content caused the post deflection to be much higher than normal and the
peak force and energy absorbed to be much lower. An initial peak force is not observed in this
test as a result of the high moisture content.
Table 13 Post Tests Performed Test Number Post Type Velocity (mls) Figure Number
Wisc-I Steel 4.6 Figure 22 Wisc-2 Steel 6.0 Figure 23 Wisc-3 Steel 5.4 Figure 24 Wisc-4 Steel 5.9 Figure 25 Wisc-5 Steel 8.9 Figure 26 Wisc-6 Steel 8.9 Figtlre 27 Wisc-7 Steel Static Test Figure 28 Wisc-8 Steel 8.9 Figure 29 Wisc-9 Not Used
Wisc-I 0 Steel 14.1 Figure 30 Wise-II Steel 12.7 Figure 31
Wood-Ol Wood Static Test Figure 32 Wood-02 Wood Static Test Figure 33 Wood-03 Wood 4.9 Figure 34 Wood-04 Wood 4.8 Figure 35 Wood-05 Wood 9.6 Figure 36 Wood-06 Wood 9.0 Figure 37 Wood-07 Not Used Wood-08 Wood 6.0 Figure 38 Wood-09 Wood 6.7 Figure 39
MwRSF TRP-03-77-98 38
Page 48
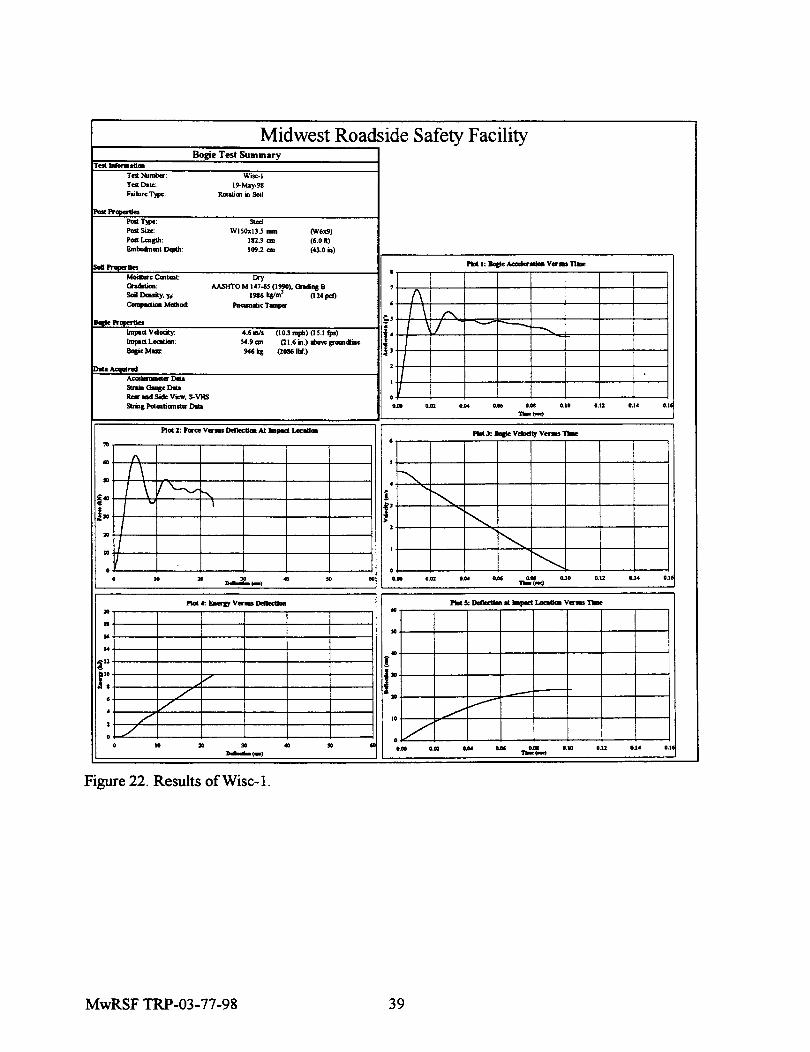
Midwest Roadside Safety Facility Bogie Test Summary
Test laroraulU. TatNumlJcr: Wise-I TatDaI<: I9-May-98 Failure 1)pe: R.olaliaa in Soil
~Pr __
Post'T)pe: Steel Post Size: WISOxI3.S mm (W6x9) Post I.aIgIh: 112.9 an (6.0ft) Em_enl Depth: 109.2 an (.3.0 in)
~Pr_aes PIotl: ..... __ V~ .. n..
a M ....... Contcnt Dry ClrWtiaft: AASliTO M 1.7-65 (1990). Ondi"8 B 7 Soil Dalsity. T.: 1986 qim' (124 pd) f\ ~iaa MdIoad: Pneumatic Tlmpa' •
~Propertles :;, I \ r--
\j - -Impac1 Vdacity. Umis (10.3 mpb) (15.1 fjIs) i· -...... Impac1 LOI3Iian: ~.9an (11.6 in.) .... IlfOUllciin.
Basi' Mus: lM6tg (10861."..) ]3 ~Acqalred 1
A<cckr_ DIIa I
SIrIin aous. DIIa _ .. d Sick: View. 50 VIIS • Slrias PGtenticmctcr DIll .... ../12 .... .... .... 0., • 0.11 0.14 .. ,
-'-(~
l'Iat 2: 'aru V~ .. _ At _poet LocaII .. PIotJ: ..... V_ty V ..... n.. ,. • .. f\ , 50 I \ .~
~ .. I \ If '---..., '"'- i "-I ~ \ .' !lO .; "-
lO I >
1
'0 J , " II ~ • • • , . lO 30 ...... (-> .. 50 .. .... • .IIl 0. .. .... .... -'-(~
0.10 •. U .... .. , 1'Iot.: EIt«cy V_ DdI_ PlotS: __ at _poet Laco_ V~ n..
'" ..
II 50 .. .. ..
~u ! ,I' V flO .lI • 'i
./ .. • .. • V
~ :...---
./ ,. / 1
./ • • • ,. '" 30 .. 50 .. .... 0.02 .... .... n:r.,. 0., • 0.11 .... .., ..... <-)
Figure 22. Results of Wise-I.
MwRSF TRP-03-77-98 39
Page 49
Midwest Roadside Safety Facility Bo:ie Test Summary
Test l.foraaatloa Test Nwnber. Wisc-2 Test Dole: 21-May-98 FIliJureType: RDIation in aoiJ
"""tPr~ .. POOl Type: Steel Pta Size: WJ50,13.5 nun (W6lC9) POOl LeII#h: 182.9 an (6.0 I) Embedmml DepIh: 109.2 em (43.0 in)
SaII ........... _ .. PI ... J: Bacle Acxderadoa Vers. nme M_CCIIIeIIl: Wet (w=26%) • GndaiGn: AASHTOM 147-65 (1990). O_SB 7 SciI Denoity. Y' 2018 q!m' (126pc1) ComJll'bm Method: PDeumalic Tamper 0
l_ePr-.a .. ~,
bnpo.ct Velocity: 6.0mis (13 .• mpll) (19.7 fpo) f4 bnpo.ct Loaaion: 54.9 em (21.6 ia.) ...... grouncIine 1,
-------- -Bop_Mus: 946 kg (20B6Ib£) • ~ -.. t---.... Data Acquired 1
/ ~ AcceII!MIIIeter DoIa I
R_ .. d Side Vi..,. S-VHS J • .... U1 ..... .... .... U, U1 U4 .~
T-.{MC)
fIet 1: r ... "" V ..... DeII_ Alloapec:t~ .. FI.J: BocI- Volodly v ..... n.e .,. • i'---.. f....... .. 5 -.....;:: 50 ~ 4
--........... i" f r----..
i' ---!,. _I-.... ~ t---/"--V ------->
1 2ll
•• • / • • • •• 10 ,.
........(-) .. 50 .. .... U1 ..... ....
T.::tMC) .~. '~l U4 U
fIet 4: IE-r:y V ..... Delleca .. Flo( 5: Ddledlaa all ... ct Local .. Ven .. n. II ..
V '0 ~ 50
/ .. .,,-/
11
./ ..
:/ ~ .. I ",7 fJO .i • ..... V 7- 'i
0 .. ./
1.
V 4 V
1 .....- to[/' • .-/'
0 • '0 10 ,. .. 50 .. 0.00 on ..... 0.00 .... U • OJ1 O~4 .~ ...... (-) T_(_)
Figure 23. Results ofWisc-2.
MwRSF TRP-03-77-98 40
Page 50
Midwest Roadside Safety Facility Bof:ie Test Summary
Test I.fonutlaa T_ Nmnbcr: Wise-3 T_Dale: 21I-Ma)'-98 Failure Type: ROIaIioninlOil
Miner damoso to P'* Puot Properties
-Type: Steel _Sizo: WISOxI3.S mm (W6x!l) -Leur;Ih: 112.9 an (6.0 t) Em~Depth: 109.2 an (43.0 in)
SGII ",-I .. ftat I: .... A_ .. oII .. v .... TI •• I
MoiameCOIIIaI: dry GtadIIion: AASHTO M 147~S (1990~ Gndias B 7
SciI DeaIity. To' 2114 q/m' (132 pcf) 11 Compodi ... Method: _cTamper I
\ / ............... IBaiI.Pr~ .. ~, -Impo<t V doc:ity. S.4m1s (12.1 mph) (17.7 fpI) i· '-...
Impo<t Location: 54.9 an (21.6 in.) ...,.. groan<Iin. - """-Bop.Mus: 9464 (2086Ib£) 1, c
DaCaAc:qalred >
Acx:d ...... ctcr Dora I
SIrain Gaug. Dora _ ond Sido Vi .... 5-VHS • SIriDg _ometer DIIa .... • .0> • .0< • .00 ..oa ••• •• > ••• ••
T-.( ... )
ftat 2: ..... u Ven .. DeII_ .. Al blpoet LacoII_ ftat 3: Bail. VIIOCSty V ...... TI •• ... I
.. I\ ,~
I \ /'... '" I'.... .. 1 v
~ • i" i "'- ........ \, f' !,. " ~ ........
>
" ,.
I .......... 10
I ........ ............... • •
0 I. :to ,. ......(-)
.. 50 .. .... • .0> ..0< • .00 T.:.r, .. ) u. 0.11 ••• 0."
Rat 4: It...." V ... _ DoI __ ftat!: DoI __ alblpoc:t Laml .. V ..... n_ :to .. II
'0 .. .. /" ..
~u /" !
'I: ./ f'· ~-'Ii ......... /' " >0 I
V ~ • / 10/ >
• /" • • 10 :to ,. .. 50 .. .... ......... (., 0.0> • .0< 0.00 o.oa
T~(_) 0.0 0.> u. .. I
Figure 24. Results ofWisc-3.
MwRSF TRP-03-77-98 41
Page 51
Midwest Roadside Safety Facility Bogie Test Summary
Test IDfor ..... _
Tat Number: Wisc-4 T .. DIIe: 28-May..98 Flilure Typo: ROIation in soil
Minor _age to poo: Pust Proportl ..
Pal Typo: s..1 PDI!l Size: W150x13.5 mm (W6x9) PcaLenJ!lh: 182.9 em (6.0 I) Embedment Depch: 109.2 em (43.0 in)
SolI Proper ... Plot): BocIcAccderatiae Ven_ Time
M_ COIIIent: • dry 0_011: AASHTOM 147-65(1990). Ondin,B 7 Soil Density. U 2243 k&'m' (140 pel) /\ Canpoa;OIl Method: Pneumatic Tamper •
J3acIe Pr .... ra .. ~s I \ f'-~ I lmpo<t Veloci.y: 5.9 mls (13.2 mph) (19.4 fps) 14 "'=---
Impo<t LOClIIicn: 54.9 em (21.6 in.) _ growIdiine r-------Bogie Mass: 946~ (2086lb[) 1, .. DaUlAcqalrod 1
Aocd ........... DaIa SIntin Gauge DaIa
, R ..... d Side View. S-VHS • SttiIIg""'_eterDIta • .00 0.01 .... .... .... .J. 0.11 .J • .J
T-.(_)
l'Iot2: ..... "" V ..... DetI_ At 1_.,.aLocall .. 1'10(3: iIGII. Vdadly V ..... TI ••
711 • ~ .. f\ ,
50 I \ I"".. ~ 1 • fJ ~ r\ ! "" i 40
f " t,
A,. .; ~ 1 > 1
~ :to
I , ,. I ~
r-....... • • • ,. :to -£(-.)
40 50 .. .... ..o' .... .... .... n..( .. )
.J. OJ, OJ' OJ
Plot 4: I .. 'CY V ....... DetlocU .. l'Iot ~ Ddodlaa ot I • .,.a Locol .. V ..... n_ :to .. II
If ,.
,. ./ /' ..
t> /" 1: ---r· /' i ,.
/ ,....-
.:I • /"
'i .. ,. • V V • / ,./ 1
• ./ • • ,. :to ,. 40 so .. • .00
~( .. ) GAl .... .... .... T~(_)
U • .Jl .J4 .J
Figure 25. Results ofWisc-4.
MwRSF TRP-03-77-98 42
Page 52
Midwest Roadside Safety Facility Bogie Test Summary
Test I.form ..... T .. Number: WiIc-S T .. DIIe: 1.J1Dl-98 FIihnType: Rotation in soiI
Pool Pr .......... POll Type: SIoe1 POll Size: WISOx23.S DUll (W6xI6in.) POIlLeft3Ih; 182.9 em (6.01) Em_em Depth: 109.2 em (43.0 in)
SolI Pr_I .. PloIl: ~.AcaI...a .. v ..... TI •• I' Moi ..... C......,,: oily
0_: AASHTOM 147~S(I990~ OradingB 12
Soil Denoity. y.: 2082 q,tm' (130 pc!)
f\ c.mpodi ... MdhocI: PDeamoIicTomper 10
IBatI.Pr ........ ~ I I \ ImpI<t V docily: 8.9 mi. (19.9mpll) (29.2,.,.) I· \ /\ ImpI<t LocoIim: 54.9 em (21.6 in.) .-gn>U1IdIjDe lIGpeMoa: 946q (2086Ibt:) .. \ .......
f'\./' • '-' ~ DalaAcq.red ~ Accelerometer DoIa 1
Shin Gauge Data " Side Vi .... SoVHS 0 '---
SlrillgPu_erO .. .... '.11 .... .... .... OJO OJ1 . .. OJ n.e(_)
Plot 2: J'or .. V .... DeII_ At I_pod I.«d .. Pl0I3: BatIe Vojodty V ...... TIm. 140 I.
• 110
"'"" • 100
,.... 7
.............
! :\ i' .............
~ .. -....... I \ f' ! .. ""'""
--... r--1 \.../ '-~
~ . .. / r-" J
» I "\.....,/" ~ 1
!/ I
0 0
• 10 » JO ~(-)
.. 50 .. . ... '.02 0'" 0 ... .... T'-.(_) U' U2 OJ' U'
Plat 4: l.erv V ...... Dd_ PloIS: Dd ...... I_pod ~I .. V ..... n_ .. .. '/ " 50
/' JO
~ - .. ~
25 I ~ -- --r» f" 0\1" ,-- /
----~ .. 2.
10
V 10 L , /' .V • • 10 » JO .. 50 .. .... D.Dl 0.D4 .... .... U' OJ2 OJ' OJ' ..... ( .. ) T_(MC)
Figure 26_ Results ofWisc-5_
MwRSF TRP-03-77-98 43
Page 53
Midwest Roadside Safety Facility Bogie Test Summary
Test larOl"ID.uoa
Teat Number. Wisc.6 TeatDau: 19-.1l1li-98 FoiI""'T)pe: R_inSoil
Posl ProperU ..
POll T)pe: Sl.eel Port Size: WIS0x23.5 mm (W6xI6) POll LeIIB1h: 182.9 an (6.01) Embedmenl Ooplh: 109.2 an (43.0 in)
Sa8Prepera .. 1'1011: BapeAccc/."Uoa V ..... TIIH
•• Moi-.C_: cby 0_: AASHTO M 147';;5 (1990~ Onding B
12 SoiIIlonIiIy. 1< 2114 k&/m' (132pd) C_podi"" Method: Pneumatic TI11IIpOr ••
I_Pr~ .. ... 1\ ~ I Impoct Veloci.y. 8.9m/. (19.9 mph) (29.2 fps) l / \ Impact LocaIion: 54.900 (21.6in.) -sr-dIine i · --8cgic Mus: 946 kg (2086lb£)
'" / \ / "-'--.... • DOIaAcqlllred · / Aa:e1 ........... DaIa Side Vi .... So VHS JI
• .00 .... .... .... .n •. 10 T __ (.w)
1'1011: Par.,. V ..... DeII_ Atl~ LGaoII .. 1'1013: BapeVdodIyV ... _TI ..
'60 ..
• 20 •• •• • 00
/' -;010
p' ! r---/ 1\ t· ! .. .; ---10-
f \ ~ > • .. / i...=-
f • -.. • • • • •• 20 .,..:..(-) .. 50 .. 0 ... .... ....
~( .. ) .... .... .~ . Rot 4: EDerer Vcrs. Ddecao. 1'I0I!!: Delec:II .. III_poet Local ... V ..... n .. .. ..
V " ,. ./"" 30
/" / ..
V .,
I-- ! ~ ---r 20
L,---- J J. V .:I"
~ " •• •• / 7
L----" '.,/ , • /
• • •• 20 JO .. 50 .. • .00 ... , .... .... .... OJ ....... (-) T_( .. )
Figure 27. Results ofWisc-6.
MwRSF TRP-03-77-98 44
Page 54
Midwest Roadside Safety Facility Bogie Test Swnmary
T .. Inf ___
Test Num .... : WISe-7 Test Date: 19-1un-98 Failure Type: Rotation in Scil
.......... I'IIe. Post Type: Steel Post Sizl:: WISOx23.5 IIUIl (W6xI6) Post Leng1h: 182.9 em (6.0 II) Embedment Depth: 109.2 an (43.0 in)
Is.u ...... rttes Moistme Ccntent chy
Gradation: AAStrrO M 147-65 (1990), Grading B Scil Density, Yd: 2114 kgIm' (132 pel) CcmpaetionMethod: Pne1matic T.".,.,.
DalaA~
Side View, S-VHS
Static Test: Force Versus Deflection
12000
10000 ~~
~ ~ --eooo
V--~ ~
;. CD eooo
/ !:! 0 u..
4000
I 2000
0 0 2 4 6 8 10 12
Deflection (in.)
Figure 28. Results of Wisc-7_
MwRSF TRP-03-77-98 45
Page 55
Midwest Roadside Safety Facility Bogie Test s..m.u,.
Test I., ......... Tat_bet: WiIc-8 Test Dole: 8-Dec·98 Fail .... 1)pe: R_inloil
.... 1 Properties POII1)pe:
_ • oIIiIl impact
POll Sizo: WISOx23.S (W6xI6) POll L""IIh: 182.9 an (6.0 I) Embedment Depth: 109.2 an (43.0 in)
s.o~'es Ploc. J: ikII'e Ac:alsatlc. Va-SIIS TI.e
I. M_ C_: Dry 0_011: AASHTOM 147~S(I990~a_gB • SciI Density. 1.: 1986 k&'m' (124 pel) a CcmpoaiOll Method: PlleumalicTompor
7
II41II0 Properties ~ f\ ~6
1 _\ ~Vdocily: 8.9m1a (19.9 mph) (29.2fps) 1 : ~ Impoct LOCIIIion: 54.9 em (21.6in.)_~e L ./ ~ s.peMus: 946 kg (2086Ib£) ... I 3
Data Acq ....... 2 I Accderometer 0-
I ,I Side Vi .... S-VHS
• .... • ~2 .... .... .... • •• 0.2 ... u T __ <_)
P1ut2: )'arCit Venas DeleeU_ At .... ce. Laaaoa l'Iot3: iloilo VelodtyV ...... TI_ .. I •
• .,. -.......... a .. ...... ~ I \ 7 -....... .. ~ .
~ .. / \ / ! --i' I / '-' ! • """'-"3D
/ 3 2D
I. /
2
.V I
• • I. 2D 3D IWItcd-. (_)
.. .. .. .... • m .... .... .... T __ ( .. ) ... 0.2 o. • ... l'Iot 4: ItIlOfJY V ...... Deld .. l'Iet 5: DelecIIaB at laI .. ct LeaI_ .. V ..... n_
3D .. 2S so L
V / V
",... 2D ..
i L'" /" ! /
t" ./"
",... r· / 011 I. 2D
~ ,/
I. / ,
• /~ ./
• I • 2D 3D .. .. .. .... • ~2 .... .... .... ••• • '2 o. • 0. ..... (-) T_(MC)
Figure 29. Results ofWisc-8.
MwRSF TRP-03-77-98 46
Page 56
Midwest Roadside Safety Facility Bogie Test s..m..ry
TesllafonuU_ TeotNumber: Wioc-IO TeotOate: l.JuI-98 FIlilureType: ROIItioninllOil
Pool Properties -Type: SIeeI _Siz.: WIS0X23.S IMl (W6XI6) _L""8Ih: 182.9 em (6.0 a} Embedment Depth: 109.2 em (43.0 in)
SaIl Pr_Ies Plat 1: Ball. Acaler.u .. Ver .. TI •• .. M~C_: dry G_: AASHTOM 147~S(I990}. GndinSB u Sci! Delulity. To' 2146 q,'m' (134 pel)
Compo<ti ... M_ _cTomper •• iBaele Properties
... /\ Impod. Velocily. 14.1 mI, (3I.Smph) (46.3 fpI) i: / \ Impod. LOCIIIicn: 34.9 em (21.6 in.) ...... gIOIIII<IUte Bop.M_ 946q (2086lbf.) .. / ~ •
DIIbt A"".reo! / "- t----.. .\caI ........ erDom 1
SlninGau&.Dom ./ "--V "-to-Side View. S-VHS ... 4 Hip Speed Video • SIrin&-OU • .DO .. 1 .... .... . ... .J
T_(MC)
Plat 2: J'tr.., V ..... Dd_ At la .. ct LcIc*I .. Pltl3: Ball. Vllodty Veri. Tla. ... 16
•• U. ---u t---.00
...,1-.. -:-10
~ .. ! / '" t,
! .. .;
/ > • .. ............ .......... •
1"---20
/ 1
• • • •• 20 ,. -- .. '" .. • .DO .. 1 .... T-.(..e)
.... . ... 'J
Plat 4: It_a v ..... Dd_ PlatS: Dd.dl .... ,Ill.-ctLoQ ... Ven. n_ .. .. ,. V
so ,. L ,.....", co ,.
! / ~ ----I: ~ i JO
L 'Ii
/" ..
10 .. .. / .......V , l-/ ./ • • .. 20 ,. .. 50 ..
--(0.) • .DO • n ....
n..(_) . ... . ... 'J'
Figure 30. Results ofWisc-lO.
MwRSF TRP-03-77-98 47
Page 57
Midwest Roadside Safety Facility Bogie Test s......ry
Tatlllr ........ oa TalNmnber: WiK·ll Tal Dale: 7.Jw-98 FIiIuR Type: Rdalian in lOll
PaoIPr .... ra .. Pat Type: Steel Pat Size: lSOx23.S nun (W6xI6) PeR LOft8Ih: 213.4 em (7.01l) Embedment DepIh: 109.2 em (43.0 ill)
SolI_I .. Plot 1: BocIe Acaler.a_ Versa Tillie
•• M ...... C_: dry G_on: AASHTOM 147-65(1990~ GndingB Il Sci! Density. T~ 2130 t&'m' (133pcf)
Ccmpoaion Method: Pneamalic Tamper •• _.Pt_ .. ... {\ i' I ~Vdocily. 12.7 mI, (28.4 mph) (41.7 fp;)
i · I \ ~LocaIion: 54.9cm (21.6 in.) ....... gruundIine BopeMus: -kg (2086Ib£) .. I \ 6 •
D8b0Ac:q_red ,I \ / .........
"-Accelerometer Dale .,.,.-r-. --_Ga.eDale II \ ......... Side View. SoVHS • SIriDg _er Do 0"" u, 0 ... 0 ... 0 ... OJ
1'IIIIIIa(_)
Plat %: Force Ven_ DdecUoa At l.,.a Loc:adOli 1'10<3: BoD. Vdodty V ...... TIme
'40 .. •• . ,. Il t---
'00 -/~ -:-10
i fO ! / \ "I ! .. .;
/ \ ~ ,. . ..
/ \ / - ~ • ..
I'J 1
• • • '0 .. ,. ....... (-.) .. 50 .. ."" . ~, .... n-(_)
0'" U. 0>1
Plot 4: Itoerv V ....... DeI_ l'Iot S: Ddedl_ all_pact Leal .. V ..... n_ .. .. " 50 / ,.
/ .. 15 ! / ~ ---'''' --~ t'" /V "'IS V " -- 21
•• /' .. / s
./ • / 0 '0 .. ,. .. 50 .. .... u, .... .M .... uo
.,..,....(-) T ... (_)
Figure 31. Results of Wise-II.
MwRSF TRP-03-77-98 48
Page 58
Midwest Roadside Safety Facility Bogie Test Summary
TestJ..r_ TestNumM: Wood-I T .. tDate: 18-Nav-98 FlilureT)'p<: Rotation in soil
PeIt~I'IIe.
POOl Type: Wood POOl Size: 1S0x200 mm (6lC8 in) POOl Length: 182.9 em (6.011) Embedment [)q>tb: 109.2 em (43.0 in)
SeII~rItes Moislure Content Dry Gradation: AAS1-fl'O M 147,(;5 (1990), Grading B Soil Density. Y.: 2146 kglm' (134 pcl)
Cclmpaction Method: Pneumatic Taq>er
0-" .......... Strain Gause Data Side Vi_and S-VHS
Static Test ·Wood-1": Force Versus Deflection
7000
6000
/ ~ 5000 / \
~4000 /
0:- j I~ CD !:! &3000
2000 / ~ I '---1000 I
.....
0 0 2 4 6 8 10 12 14 16 18
Deflection (in.)
Figure 32_ Results of Wood-I.
MwRSF TRP-03-77-98 49
Page 59
Midwest Roadside Safety Facility Bogie Test Summary
Test Iaformatloa Test Numb:<: Wood-2 Test Date: I8-Nov-98 FailureT)pe: Rotation in soil
......... _r1Ie. Poot T)pe: Wood Poot Size: lSOx200 nun (6x8 in.) Poot Length: 182.9 em (6.0 II) Embedment Depth: 109.2 em (43.0 in)
s.u .... _r1Ies Moisture Content Dry Gradation: AASHrO M 147-65 (1990), Grading B Soil Density, Y': 2114 kgIm' (132 pel) Compaction Method: Pneumatic Tamper
Dab Ac_otI
Side View and S-VHS
Static Test "Wood-Z': Force Versus Deflection
4500
4000
3500 ~ '~
/ "-..,
~ 3000
V "-~ ~2500
e / -~ III u .f2000
/ ~ 1500
/ 1000
/ 500
0 0 2 4 6 8 10 12 14 16 18 20
Deflection (in.)
Figure 33. Results ofWood-2.
MwRSF TRP-03-77-98 50
Page 60
Midwest Roadside Safety Facility Bogie Test s..m-y
Tnt lafonuU_ Tal Number. Wood-3 TalDIIe: IS-Nov·98 Flilure 1)pe: Rotatim. in IOil
hstPr..,..u .. 1'.-1)pe: Wood I'.- Size: ISOx200 mm (6xlI in.) I'.- LtIIIIh: 182.9 an (6.0 A) Embedment Depth: 109.2 em (43.0 in)
~""-,, .. ftot 1: Balle AcetlCI'atl. Vers. TI.e I.
M.umeC_: Dry 0_: AASHTOM 147~S (1990~ OIlldin,B • Soil Density. T~ 2146 k&'m' (134 pel) • Compo<tim Method: _cTomper
7 ~
BocI. Pr..,..u .. ~ 6 Impod V _.y: 4.9 mi. (I 1.0 mplt) (16.1 fpo) 1 ' Impod LOCOIim: S4.9an (21.6 in.) -lfOUIICIIine BasieMus: 9461<& (2086Ib£) 'I • L\' ~ ~ ---,
L V - ---.... DoIaAcqtllred 1 Aa:eI ........... o-
I I .............. SInin aa.e 0-
• II Side View. S-VHS ..... Hip Speed Video • .00 • .01 .... .... • .DI U. U1 U' U
T_(MC)
Plot 2: ..... '" V ..... DetI_ At"poet~ .. ftol3: .... V .. odtyV ... _~
., I •
t ,. • .. 7
50 l' f .. A.
t' --/"'... i • ~ .. "" --/ \ / ~ r---.. ,
10 ----I. / "'\ 1
I . / ~ ~ • • I • 10 "" -(-I
.. 50 .. • .00 .n .... .... .... T-.(MC)
. .. OJ1 .,. U
Plot., EIIerIY V ....... DeII __ ftot!: DeII_.t ...... ~._ v .... n_ :JO .. '"
,. --10 .. ~ ! --!---i" flO V-ol .. ../ I. oo ...-- 30 ---- / , ~
I.
---- .~ • • I. 10 "" .. 50 .. • .00 ...... ( .. ) • .01 .... .... • .DO
n.(MC) U • U1 .J' .J
Figure 34. Results ofWood-3.
MwRSF TRP-03-77-98 51
Page 61
Midwest Roadside Safety Facility Docie Test &.m.ry
TosII.,_oII .. Test Number. Wood-4 Test Dale: IS-New.9S FIiI ... 1)'pe: R_inlOiJ
I'IIaIPr~
""" 1)'pe: Wood
""" Size: lSOll200 nun (6x8 in.) PootL02J#h: 182.9 an (6.0 II) Embedment Depth: 109.2 em (43.0 in)
5GIIPr_a .. Plot I: BocIe A_ ... oII .. V ..... n.e 10
MaiMmoC_: Dty GrIdIlion: AA.SHTOM 147~S(I990). Gndin&B • SCi! Denlily.l.: 2OS0 k&'m' (128 pet) • Canpodi ... M_ _cT_ ,
,BGcIePr __ .. ;, ~Velacity. 4.8m1s (10.7 mph) (IS.7 fils) I
~LOCIIIiaa: 54.9 an (21.6 in.) ..... yautUIine 1 : s.peM_ 946q (2086Ib[) • 1\ ...... 3
DmA ......... I I- i'-... , Aa:el ....... _DaIa I '---• Stnin a.ase DaIa oL Side View. S-VHS ..... IIi&h Speed Video .... 0.0, .... .... 0 ... .JO OJ, .J' OJ
~( .. ) Plot %: " .... Ven. Ddleca .. AI l.,...lMoII_ Plotl: BocIeVdoclty Ver_ T_
• •• • .,. • .. ,
50 I' f .. t, --"50 ~ ..--.. ~ . r--/ V ~ 3 20 -----/ "--
, •• l/ I ----- ~~ • • • 10 '" ......L<-) .. 50 60 .... .... .... . ... T':'..o:.) .JO .J, OJ' .J,
Plot 4: 1t .. 'C' V_I. Ddleca .. Plot!: DelectIGa .Ilapoet Loco ... V ..... n_ 50 .. 25 50 ---20 ..
~ 1 ---~ ~u flO ~ oS • L I. ..
20
----I-" /1-"" , ~
to
~ .~ • • •• 20 50 ........ ( .. ) .. 50 .. .... 0.0, .... .... .... n.e(IK)
OJO .J' .J' OJ'
Figure 35. Results ofWood-4.
MwRSF TRP-03-77-98 52
Page 62
Midwest Roadside Safety Facility Socle Test s..m.u,.
Test 1., .. Mloo TootNumbor. Wood·S Toot Dole: 2G-Nov." FlilureType: R_inlOil
""'IPr __ Poll Type: Wood Poll Size: ISOX:ZOO (6x8in.) PoIlL""IIh: 182.' an (6.0 a) Em_Deplh: 109.2 em (43.0 in)
SaII~a .. l'Iot J: JIotje Ac:aI ........ v ...... TI_ ,. Moi-.C_: Dry GndIUon: AASHTOM 147",S(I"0~ GndingB • SCIil 0enIity. 1.: 2146 t&'m' (134 pel) I ..l"J. CcmpecliOll MethcId: -<Tamper , 1\
lBacl<Pr~ .. '" I \ !\ .., ~VelccilY. '.6m1s (21.S mph) (31.S !PO) t 5
I \ I \ Impo<tLoc:oIiOll: SUcm (21.6 in.) ...... p-oundIlne
'I • V '-"'"" BopeM_ 9461'1 (2086JbC) • l I ~
Dab!A .... red 1 I \ Accelerometer DIIIa '---"- .;'" :-.... I SInin Gaug. Dab! '-r---..., Side Vi .... SoVHS _ Hip Speed Vicleo • .... • .01 .... .... .... u • OJ1 OJ' OJ
T __ (_)
I'Iot 2: ........ Ven_ Delec_ At .... et LoaIII .. 1'1013:", Vtladty V ..... ~ I.
ID .r---... ,. I r'\ "" "" / \ I .. /"'0.. ......... ....... I \ /
, -r--.. I' i .. I \ V '----r---... t' J,. I "'--~ ~ . / "'\ 3
30
I. /
1
.V I
• • I • 30 -L(-.)
.. .. .. .... • .82 . ... .... .... T-.(_> OJ • OJ2 0.1" OJ.
l'Iat 4: Eaoov V ... _ DoI_ 1'101 S: DoIJeca .. Oil_poet lAma .. v ..... n_ ,. 60
2j -- ,. /' :10 ~ .. /
~ ~ ! /V tIS
,/ !lO / oJ I. " lO
, L" I. /
• /" .V • I • :10 :to ....... (-) .. .. .. .... • .02 .... .... . ... T __ (_) 0.10 .J2 .J4 .J
Figure 36. Results ofWood-5.
MwRSF TRP-03-77-98 53
Page 63
Midwest Roadside Safety Facility Bogie Test Sunnuy
Test JDformadoa TestNmnbor: Wood-6 TestDau: 20-Nov-98 Flilure Type: POIl_
.... IProperll .. POll Type: Wood POll Size: 150>200 mm (6x8in.) POIlLm#h: 182.9 an (6.01) -Depth: 109.2 em (43.0 in)
SaIl "'-I .. Plot J: Batle AcceleradOll Vers. Time I.
M_COIIIeDl: Dry GncbIi ... : AASHTOM 147"'5(1990~GndingB • Sci! DenDty. l~ 2066 k&lm' (129pd) I Canpoaj ... Method: PDeumalic Tamper
7
IIcIpePrapera .. ~ . " I \ ImpocI Velocity: 8.9m1s (19.9mpll) (2921jJ1) i ' ImpocILoc:otiOll: 54.9 em (21.6 in.) _ groundIine
Bq;ieMus: 946 kg (2086Ib!) 1 • I .. , 0II1a A",alred , I
AcceI..--er !lola I II
Sbain Gauge !lola \ Side View. SoVilS md High Speed Video • .... ... , .... . ... .... ... 0>1 'J. OJ Ta.( __ )
Plot 2: Fer.., V ..... DoII_ AI Impact lMdoa Plotl: .... Vdodty V ...... YIJD • ., .. • .,. I ~
A .. / 7
SO I' i: I 1\ i' I \ :: -
I \ , 20
L \ , 10
I \ I
• • 0 10 ,.
DAL(~ .. SO .. .... u, .... .... .... 1'IIIIIIt( .. )
uo OJ, OJ. OJ
Plot 4: EIICfCY V ..... DoI_ Plot!: DoII_ all_pact Local .. Ven .. n .. 3D .. 1> ,. 20 ..
l ! JU i '0
'Ii 10 eI ,. , /
~ 10
• ./ 0 10 ,. 3D
lWIrCiII-.(ca)
.. so .. .... ... , .... .... . ... T~(_)
UO OJl OJ_ 0.1
Figure 37. Results ofWood-6.
MwRSF TRP-03-77-98 54
Page 64
Midwest Roadside Safety Facility Bogie Test s..m..r,.
Testl.' .... U .. T .. N .... ber: Wood-8 T .. DII<: . I8-Nov-98 FIiI1IreTypo: ..... -.
POItPr~
POCTypo: Wood
POCSize: 150<200 (6x8 in.) ..... LqIh: 182.9 an (6.0 ft) Em_DepIh: 109.2 em (43.0 in)
SaIl ",,-I .. l'Iot1: BapeAa:tI ........ V ...... T1 ••
M_Can/.enI: ,.
DIy GndItion: AASHTOM 147-6S(I"0~GndingB • SaiJ IleIlIity. y,: 2211 k&'m' (138 pd) • Compocti"" M_ _<Tamper
7
IBGcI' Propertl .. ~ 6
Impo<t VeIocUY. 6.0m/. (13.4 mplt) (19.7 tp) i ' "'"' Impo<tLoc:oIiClll: S4.9an (21.6 in.) ...... srwndIine {'\ ./ \ BopeM_ 94Ug (2086Ib£) 1 • / \ ,
DtIIo Acq"rod 1 / \ A«demneler DtIIo I \ Side View. S-YHS
, • \ .... OD' ..... .... .... .J. OJl 0.14 OJ
T-.( .. )
I'Iot 2: JI'ar"" v .... DeI_ At '.,.a LoaII_ l'Iot3: Bap.V"odtyV ..... ~
• '0
t 70
• .. 7 .. ......
i ' I. /""- ~ \ ..............
i / \ i' ........... "3D :: .
1 1 , ,. / \ 1 ,.
.V j , • • , . ,. 3D ........ (-) • so .. .... tAl ..... .... T":'.Df .. ) OJ • 'Jl OJ • OJ
I'Iot 4: I...,. v ...... DelectI .. l'Iot 5: DeI_ at .. ,..s LoaII_ V ..... n_ 3D .. " so
,. .. ~ 1
r f ,. V_ 'i ,. '" ,.
/ V V , ~
.,.....,. ':V • • ,. ,. 3D • ,. .. .... -to.)
... , 0 ... 0 ... .... 1'IIIIIe(_)
OJO OJl OJ' OJ<
Figure 38. Results orWood-S.
MwRSF TRP-03-77-98 55
Page 65
Midwest Roadside Safety Facility Bogie Test Swnnary
Tnt lafOl'lllad_ T_Number: W_-9 T_DoU: 18-Nov-98 FIIi1ureType: Pal Failure
Past Pr .... rU .. Pal Type: W_ Pal Size: 150>200 (6x8in.) Pal LOII8Ih: 182.9 em (6.0 I) Embodmenl Depth: 109.2 an (43.0 in)
SoII ........... _ .. Plot 1: BocIe Acaler ...... Vers. nme I.
MoiItunoC_: DIy G_an: AASHTOM 147'-;5(1990). GtwIin,B • Soil De11IIily. J.: 2211 tg/m' (138 pcl) • C_pod.i ... Method: Pneumatic Tompor ,
1li0ii0 ProperU .. ~6 J\ Impact Velocity. 6.7m1s (15.0 mph) (22.0 fpo) i : Impact Localian: 54.9 an (21.6 in.) .-groundlino I
BapeMus: 946k& (2086Ib£) ~ I ,
I 1\ DoboAoqalrm , Aa:oI .......... DoIa
I I \ Side View. S-VHS
• II \ • .00 U, .... .... .... .,. ." ." u
n .. (_)
Plot %: "orco V ..... DtII_ At 1 ... 11 Locoll .. PI.U: BocJe Vdodty V ..... TI_ .. I •
f ,. • .. ,
50 / i'
r-----... ~ .. / \ i / \ f' .. ,. ~ .
/ \ , ,. I. / \ 1
.11 \ I
• • I. ,. 3D ..... <-) .. 50 .. • .DO .n .... .... .... T-.(_) " . U1 ." u
Plot 4: E...-cY Veri .. DtII_ Plot So DetI_ atl_.-a Loco ... V .... n_ 3D .. " so
,. 40
~ ! jU flO
Ii I. " 10
:/ , V I·
V ./'" • • • I • ,. 3D .. 50 .. • .00 • .o, .... .... .... u • ." U4 U ...... (-) T-.(_)
Figure 39. Results ofWood-9_
MwRSF TRP-03-77-98 56
Page 66
7 SUMMARY AND CONCLUSIONS
Nine wide-flange steel posts and six wooden posts were impacted in order to provide data
about the post-soil interaction of guardrail posts rotating in soil. The posts were impacted in soil
conforming to AASHTO M 147-65 Gradation "B" specifications.
In all nine steel post impacts, soil failure was the primary mode of failure. Differences in
soil behavior were observed between test speeds of5.5 and 8.9 mls (12.3 and 20 mph). At higher
speeds, the peak force and the amount of energy absorbed increased. However, no measurable
differences in behavior were observed between test speeds of8.9 and 13.4 mls (12.3 and 30 mph).
In the wooden post impacts, soil failure only occurred in the 4.8,4.9, and 9.6 mls (10.7,
11.0, and 21.5 mph) impacts while post failure occurred in the 6.0, 6.7, and 8.9 mls (13.4, 15.0,
and 19.9 mph) impacts. Post failure is attributed primarily to stress concentrations induced by the
instrumentation of the posts, inherent variations in wood quality, and gradation variations within
AASHTO M 147-65 (1990) Gradation "B" specifications. It should be noted that the sampling
size is too small to make a statistical analysis in either the wooden or steel post impacts.
MwRSF TRP-03-77-98 57
Page 67
8 RECOMMENDATIONS AND FUTURE WORK The nine wide-flange steel posts and six wooden posts successfully impacted in this study
provided data about the post-soil interaction of guardrail posts rotating in soil. It is suggested
that the research herein be further expanded using the data collection methods utilized in order to
provide further information about the nature of the post-soil interaction.
Identification of the rotation point of the post throughout impact, as well as correlation of
the bogie accelerometer data with string potentiometer and strain gauge data, is required to
further understand post-soil interaction. Further analysis of this data, as well as examining the
effects of varying soil type and gradation, is also recommended.
MwRSF TRP-03-77-98 58
Page 68
9 REFERENCES
l. Bierman et al., Performance Evaluation ofKDOT W-Beam Systems, Report TRP-03-39-96, Midwest Roadside Safety Facility, May 1996.
2. Cichowski, G., Skeels, P. c., and Hawkins, W. R., Appraisal of Guardrail Installations by Car Impact and Laboratory Tests. HRB, Vol. 40,1961, pp. 137-178.
3. Graham, D., Burnett, W. C., Gibson, l L. and Free,r R. H., New Highway Barriers: The Practical Application of Theoretical Design. Highway Research Record 174, HRB, Washington, D.C., 1967.
4. Michie, I.D., Response of Guardrail Posts During Impact. Research Report No. 03-9051, Southwest Research Institute, San Antonio, Texas, October 1970.
5. Michie, I.D., Gatchell, C.I. and Duke, T. I., Dynamic Evaluation of Timber Posts for Highway Guardrails. Highway Research Record 343, HRB, Washington, D.C., 1971, pp. 19-33.
6. Gatchell, C.l, and Michie, 1. D., Pendulum Impact Tests of Wooden and Steel Highway Guardrail Posts. USDA Forest Service Research Paper NE-311, 1974.
7. Calcote, L.R., and Kimball, C.E., Properties of Guardrail Posts for Various Soil Types, Transportation Research Record 679, TRB, National Research Council, Washington, D.C., 1978, pp. 22-25.
8. Calcote, L.R., Development of a Cost-Effectiveness Model for Guardrail Selection. Report No. FHWA-RD-78-74, US. Department of Transportation, Ianuary 1980.
9. Jeyapalan, J.K., Dewey, 1.F., Hirsch, T.I., Ross, H.E., and Crooner, H., Soil-Foundation Interaction Behavior of Highway Guardrail Posts. Transportation Research Record 970, 1983, pp. 37-47.
10. Eggers, W., Hirsch, TJ., and H.E. Ross, Jr., Strength of Guardrail Post in Rock. Report No. FHWAlTX-85/42+343-1(Suppl.), September 1984.
11. Bedewi, N.E., Dynamic Response of Guardrail Posts in Soil. Report No. FHW AIRD-861147, University of Maryland, September 1985.
12. Eggers, W. and T.l Hirsch, The Effects of Embedment Depth, Soil Properties, and Post Type on the Performance of Highway Guardrail Post. Report No. FHWAlTX-86/64+405-1, August 1986.
13. Bronstad, M.E., Calcote, L.R., Ray, M.H., and Mayer, J.B .. Guardrail-Bridge Rail Transition Designs. Report FHWA-RD-86-178, FHWA, US. Department of Transportation, April 1988.
14. Ataullah, S., An Analytical Evaluation of Future Nebraska Bridgerail-Guardrail Transition Designs using Computer Simulation Model BARRIER VII, UNL Thesis, August 1988.
15. Stout, D., Hinch, 1., and Yang, T.L., Force-Deflection Characteristics of Guardrail Posts, Report No. FHWA-RD-88-193, FHWA, US. Department of Transportation, September 1988.
MwRSF TRP-03-77-98 59
Page 69
16. Rohde, lR., Reid, lD., Sicking, D.L., Evaluation of the Effect of Wood Quality on W-beam Guardrail Performance, Project No. AFE Z322, Nebraska Department of Roads, November 1995.
17. DynaMax User's Manual, Revision 1.75, Instumented Sensor Technologies, Inc., Okemos, Michigan, April 1993.
18. The DADiSP Worksheet, Data Analysis and Display Software, User Reference Manuals, Version 4.0, DSP Development Corporation, Cambridge, Massachusetts, December 1991.
19. Halliday, D. and Resnick, R., Fundamentals of Physics, John Wiley and Sons, New York, New York, 1988.
20. Hargrave, M.W., and Hansen, A.G., Federal Outdoor Impact Laboratory - A New Facility For Evaluating Roadside Safety Hardware, Transportation Research Record 1198, TRB, National Research Council, Washington, D.C., 1988, pp. 90-96.
21. The Federal Outdoor Impact Laboratory - A New Facility For Evaluating Roadside Safety Hardware, Transportation Research Board 67th Annual Meeting, January 11-14, 1988, Washington, D.C., 1988.
22. National Design Specification for Wood Construction, American Forest & Paper Association (formerly National Forest Products Association), Washington, D.C., 1991.
MwRSF TRP-03-77-98 60