31
IR-03-04 EFFECT OF SUPERPAVE DEFINED RESTRICTED ZONE ON HOT MIX ASPHALT PERFORMANCE Submitted by Jingna Zhang L. Allen Cooley, Jr. Graham Hurley NOVEMBER 2003

IR-03-04
EFFECT OF SUPERPAVE DEFINED
RESTRICTED ZONE ON HOT MIX
ASPHALT PERFORMANCE
Submitted by
Jingna Zhang
L. Allen Cooley, Jr.
Graham Hurley
NOVEMBER 2003

EFFECT OF SUPERPA VE DEFINED RESTRICTED ZONE
ON HOT MIX ASPHALT PERFORMANCE
by
Jingna Zhang Research Engineer
National Center for Asphalt Technology Auburn University, Alabama
L. Allen Cooley, Jr. Bums Cooley Dennis, Inc.
Formerly, National Center for Asphalt Technology Auburn University, Alabama
Graham Hurley Research Engineer
National Center for Asphalt Technology Auburn University, Alabama
National Center for Asphalt Technology 277 Technology Parkway
Auburn, AL 36830
November 2003

ABSTRACT
The effect of the Superpave defined restricted zone on HMA rutting performance
was evaluated. One gradation that violated the restricted zone (TRZ) and two gradations
that did not violate the restricted zone (BRZ and ARZ) were evaluated. Mixes evaluated
represented a range of maximum aggregate sizes (MAS), design traffic levels, and
aggregate types. Three laboratory tests, Asphalt Pavement Analyzer, Rotary Loaded
Wheel Tester, and Marshall test, were used to evaluate the rutting performance.
From the analysis, it was found that mixes having gradations violating the
restricted zone performed similarly to or better than the mixes with gradations passing
outside the restricted zone with respect to laboratory rutting tests. This conclusion was
drawn from the results of experiments with 12.5 mm, 19.0 mm and 25.0 mm MAS
gradations at Ndesign values of 100, 75, and 50 gyrations. This conclusion is confirmed
and supported by a recently completed National Cooperative Highway Research Program
project - NCHRP 9-14: "The Restricted Zone in the Superpave Aggregate Gradation
Specification." The results also showed that rutting performance of mixes having
gradations below the restricted zone, which was commonly recognized to be rut-resistant,
appears more sensitive to aggregate properties than do mixes having gradations above or
through the restricted zone.

TABLE OF CONTENTS
INTRODUCTION ... .. .... .... ........ .. ...... .............. ........ .......... ... ... .. ............................... ....... .... l
OBJECTIVE .......... .. .... ....... ....... .............. ............. .. .... ................. ... .. ... ......... ...... ... ... ..... ..... . 1
RESEARCH APPROACH .................................... ............. ... ............ ......... .. ..... ........... ....... 2
MATERIALS ............................... ...... ... ............... ... ... .............................. ....... ................. .. . 4
TEST METHODS .............................. ............................................................................... .. 8
TEST RES UL TS AND ANALYSIS ................... .. ...... .. ............ ... .. ..... .... .. .. .. ........ ........... 10
CONCLUSIONS ............................... ........................... ... ........ .. ... ............. ...... .... .. ... ... ... ... 25
REFERENCE ................................. .......... ...... ........... .. ...... ... ... .. .... ........ .... .... .. ............ ...... 26
ii

INTRODUCTION
The Strategic Highway Research Program's (SHRP's) asphalt research was aimed
at the properties of asphalt binders and paving mixes and their effect on asphalt pavement
performance. The study of aggregate properties (including gradations) was intentionally
excluded from the asphalt program. However, SHRP researchers recommend a set of
aggregate gradation specifications without the benefit of experimental data.
SHRP formed an Aggregate Expert Task Group (ETG) to develop
recommendations for aggregate properties and gradations for hot mix asphalt (HMA).
The final recommendations for gradations included a restricted zone that lies along the
maximum density line (MDL) between an intermediate sieve size (2.36 or 4.75 mm
depending on the maximum aggregate size) and the 0.3 mm size. The restricted zone was
recommended to reduce the incidence of tender or rut-prone mixes. A further gradation
recommendation from the Aggregate ETG was that mixes designed for high and very
high traffic levels should have gradations passing below the restricted zone. The ETG
suggested mixes having gradations passing below the restricted zone have higher shear
strength necessary to resist rutting because of high inter-particle contact.
Since the aggregate research during SHRP was not based upon any experimental
data, many asphalt technologists believe that compliance with neither the restricted zone
nor specification of coarse-graded gradations (gradations passing below the restricted
zone) may be necessary to produce HMA mixes with good performance.
When the Alabama DOT (ALDOT) adopted the Superpave mix design system,
recommendations of the ETG were accepted. ALDOT specified that gradations not pass
through the restricted zone and that gradations pass below the restricted zone for high and
very high traffic levels. Because of the lack of experimental data within the SHRP
aggregate research, these requirements needed to be evaluated in a laboratory-controlled
experiment.
OBJECTIVE
The objective of this research was to evaluate the necessity of the restricted zone
requirement and the recommendation for coarse-graded mixes for high traffic roadways
in ALDOT's specifications.
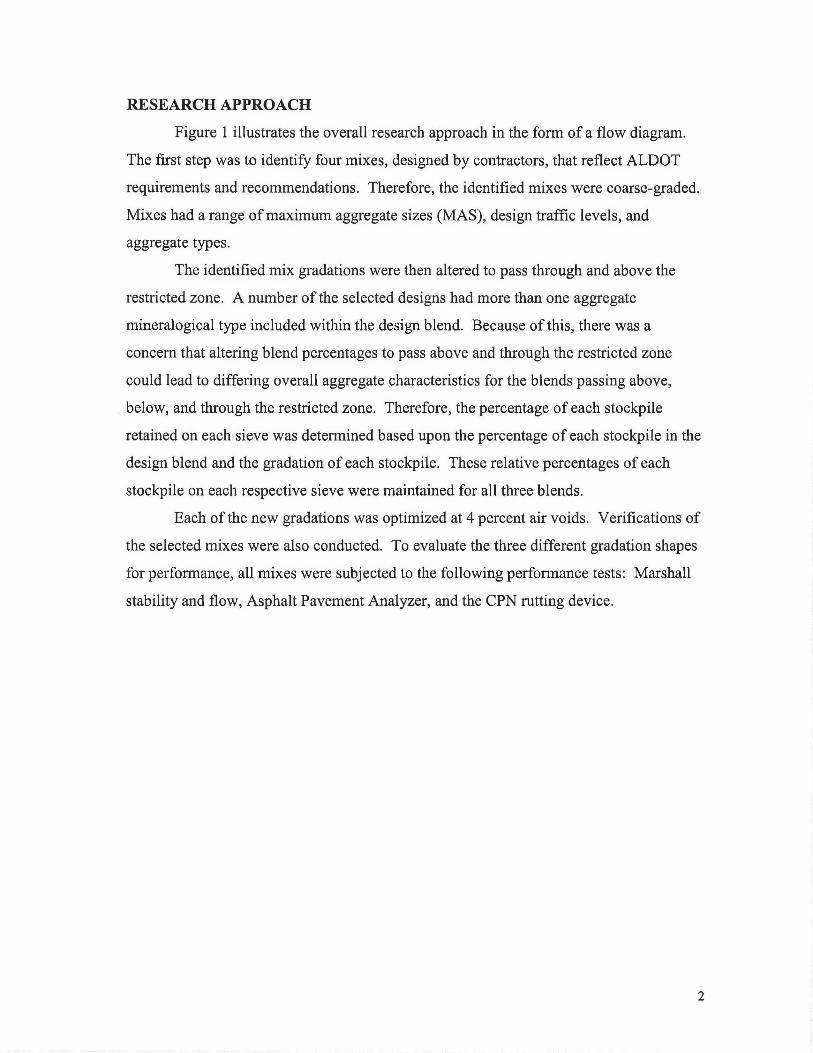
RESEARCH APPROACH
Figure 1 illustrates the overall research approach in the form of a flow diagram.
The first step was to identify four mixes, designed by contractors, that reflect ALDOT
requirements and recommendations. Therefore, the identified mixes were coarse-graded.
Mixes had a range of maximum aggregate sizes (MAS), design traffic levels, and
aggregate types.
The identified mix gradations were then altered to pass through and above the
restricted zone. A number of the selected designs had more than one aggregate
mineralogical type included within the design blend. Because of this, there was a
concern that altering blend percentages to pass above and through the restricted zone
could lead to differing overall aggregate characteristics for the blends passing above,
below, and through the restricted zone. Therefore, the percentage of each stockpile
retained on each sieve was determined based upon the percentage of each stockpile in the
design blend and the gradation of each stockpile. These relative percentages of each
stockpile on each respective sieve were maintained for all three blends.
Each of the new gradations was optimized at 4 percent air voids. Verifications of
the selected mixes were also conducted. To evaluate the three different gradation shapes
for performance, all mixes were subjected to the following performance tests: Marshall
stability and flow, Asphalt Pavement Analyzer, and the CPN rutting device.
2
Selection Criteria: -Different MAS -Different Aggregate Types -Different Design Levels
Marshall Stability and Flow Asphalt Pavement Analyzer CPN Rut Meter
f-- Identify Four Contractor Job Mix Formulas
Obtain Materials Used to Design Mixtures
Verify Designs
Modify Design Gradation to Pass Above and Through
Restricted Zone
Conduct Mix Designs for ''New" Gradations Passing Above and Through
The Restricted Zone
Conduct Performance Testing On All Twelve Mixtures (4 JMF * 3 Gradations)
Compare Gradations Passing Above, Below and Through
Restricted Zone
Figure 1: Overall Research Approach
3

MATERIALS
Four contractor designs were identified: two were wearing/surface course mixes,
one an upper binder mix, and one a base/binder mix. Maximum aggregate sizes (MAS)
included two 19.0 mm, one 12.5 mm, one 25.0 mm. Design ESAL levels were included
B, C, D, and E.
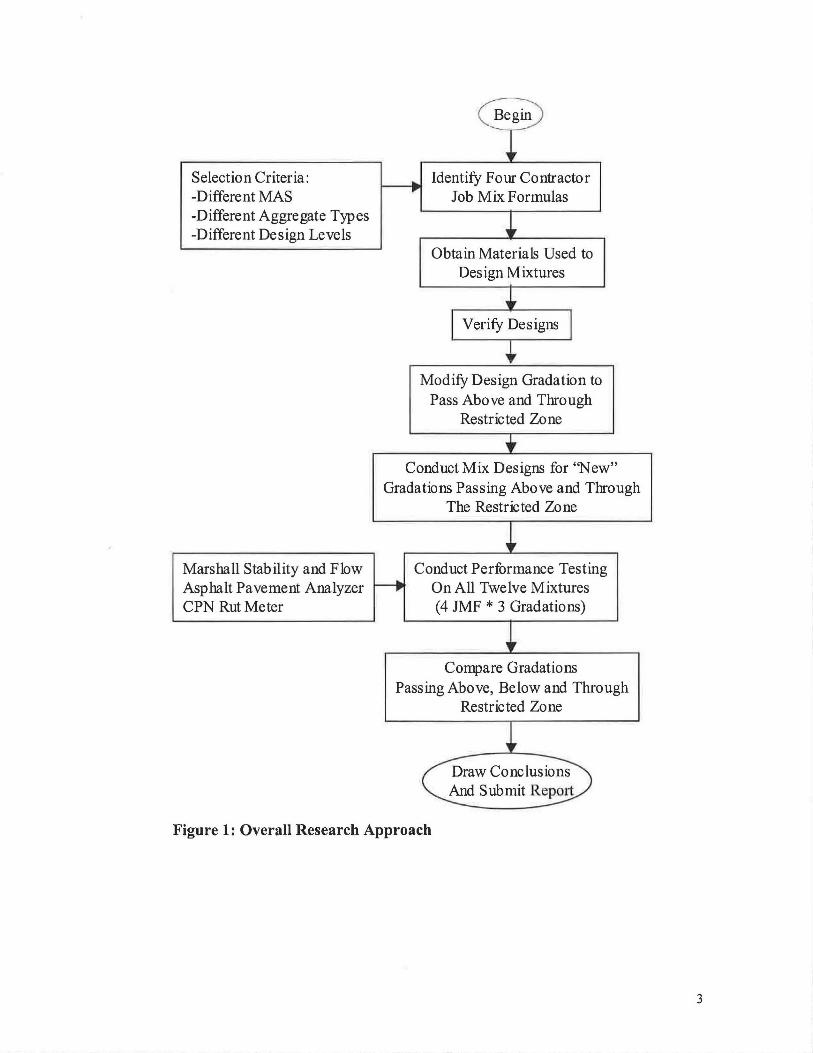
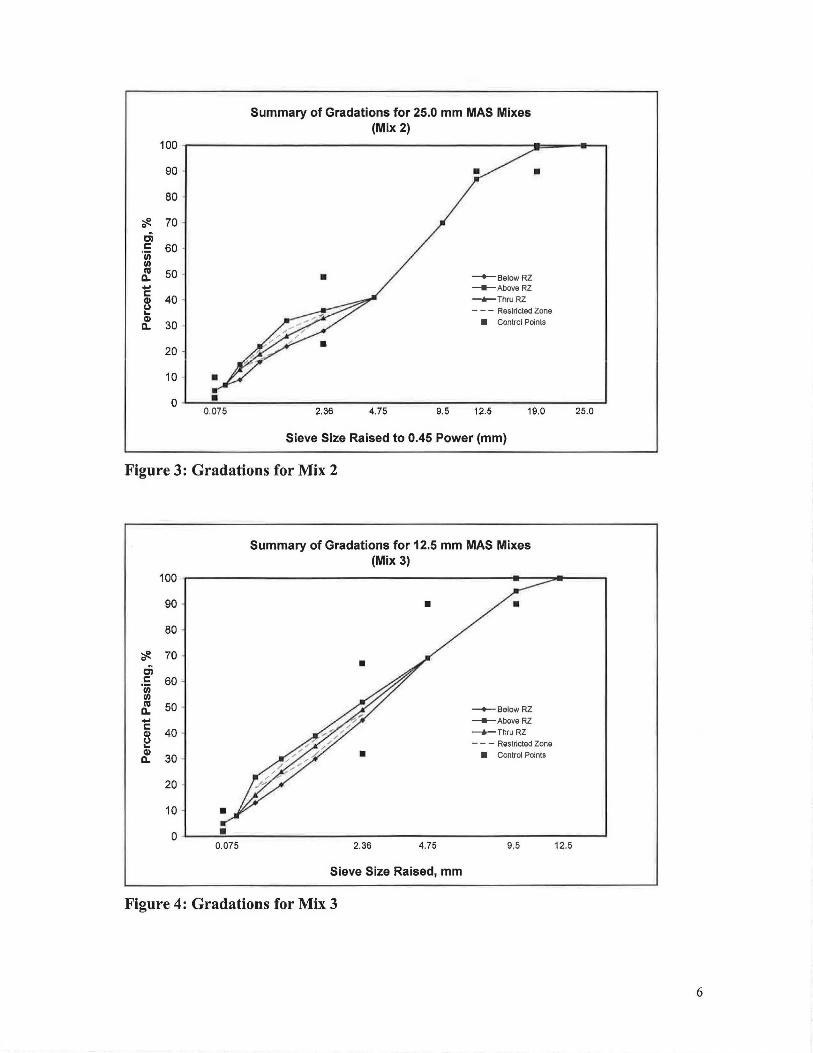
Properties of the four selected mixes are shown in Table 1. Gradations were then
developed for each mix that passed above and through the restricted zone (ARZ and
TRZ). Table 2 presents the designed and developed gradations, and Figures 2 through 5
illustrate these gradations.
Table 1: Design Properties of Selected Mixtures
Properties Mix 1 Mix2 Mix3 Mix4
Mix Type Wearing Base/Binder Upper Binder Wearing
Maximum Agg. Size,mm 19.0 25.0 12.5 19.0
Predominant Agg. Type Granite Limestone Gravel Gravel
Design Gyrations 100 50 100 75
Design Pb,% 4.70 4.50 5.30 5.25
Design VMA, % 15.7 14.0 15.2 16.3
Design Pbe, % 4.67 4.22 4.87 5.13
Po.D?s/Pbe 0.84 1.14 1.03 1.11
Coarse Agg. Angularity 99/98 100/99 95/92 85/81
Fine Agg. Angularity 45 45 46 46
Gsb 2.666 2.742 2.641 2.654
ESALRange E B D c
4
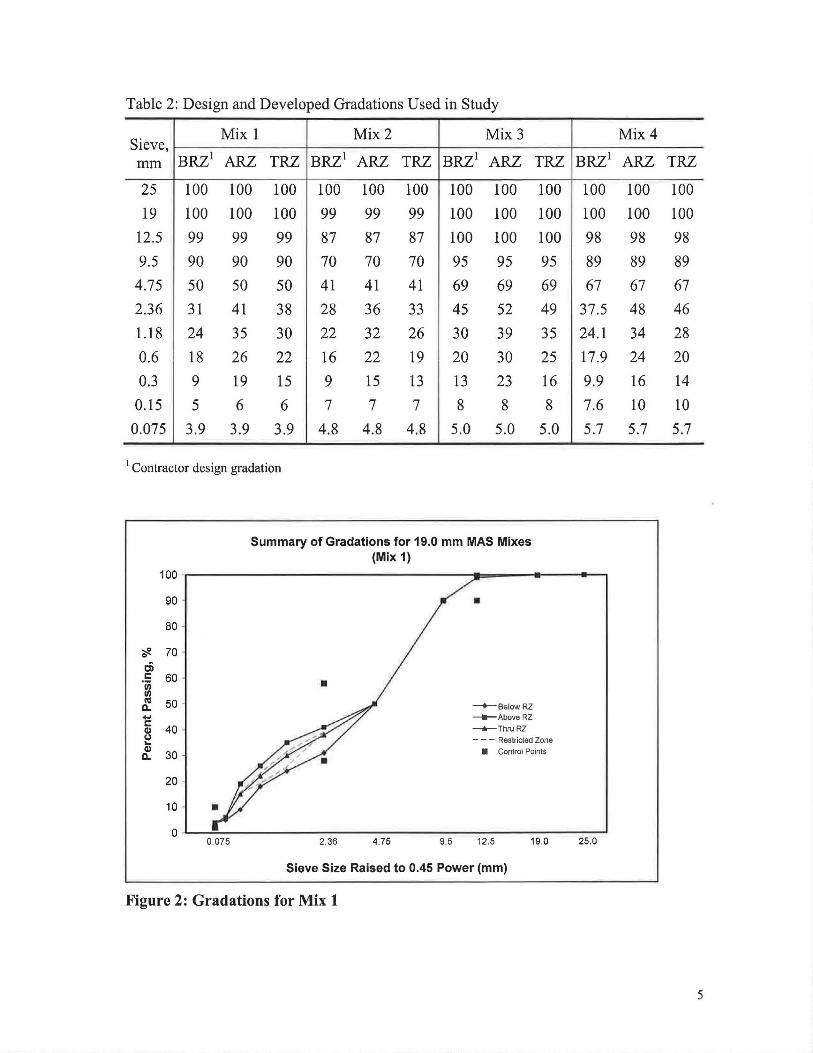
Table 2: Design and Developed Gradations Used in Study
Sieve, Mix 1 Mix2 Mix3
mm BRZ1 ARZ TRZ BRZ1 ARZ TRZ BRZ1 ARZ
25 100 100 100 100 100 100 100 100 19 100 100 100 99 99 99 100 100
12.5 99 99 99 87 87 87 100 100 9.5 90 90 90 70 70 70 95 95
4.75 50 50 50 41 41 41 69 69 2.36 31 41 38 28 36 33 45 52 1.18 24 35 30 22 32 26 30 39 0.6 18 26 22 16 22 19 20 30 0.3 9 19 15 9 15 13 13 23
0.15 5 6 6 7 7 7 8 8 0.075 3.9 3.9 3.9 4.8 4.8 4.8 5.0 5.0
1 Contractor design gradation
'<fl. Cl c: 'iii "' nl a.. .... c: QI
100
90 .
80
70
60 -
50 -
40
Summary of Gradations for 19.0 mm MAS Mixes (Mix 1)
-BelowRZ -AboveRZ _._ThruRZ
TRZ
100 100 100 95 69 49 35 25 16 8
5.0
(,) ... QI a.. 30
- - - Restricted Zone • Control Points
20
10
0 0.075 2.36 4.75 9.5 12.5 19.0
Sieve Size Raised to 0.45 Power (mm)
Figure 2: Gradations for Mix 1
Mix4
BRZ1 ARZ TRZ
100 100 100 100 100 100 98 98 98
89 89 89
67 67 67 37.5 48 46 24.1 34 28 17.9 24 20
9.9 16 14
7.6 10 10 5.7 5.7 5.7
25.0
5
100
90
80
'</!. 70 Ci c 60 'iii Ill CV 50 Q. ..... c
40 Cl) CJ ... Cl)
30 Q.
20
10
0 0.075
Summary of Gradations for 25.0 mm MAS Mixes (Mix 2)
• -BelowRZ -AboveRZ -ThruRZ - - - Restricted Zone
• Control Polnls
2.36 4.75 9.5 12.5 19.0
Sieve Size Raised to 0.45 Power (mm)
Figure 3: Gradations for Mix 2
100 -
90
80 -
~ Cl 70 Ci c 60 'iii Ill CV 50 Q. ..... c 40 -Cl) CJ ... Cl)
30 Q.
20
10 -
0
Summary of Gradations for 12.5 mm MAS Mixes (Mix 3)
•
•
-BelowRZ -AboveRZ -ThruRZ - - - Restricted Zone
• • Control Points
2.36 4.75 9.5
Sieve Size Raised, mm
Figure 4: Gradations for Mix 3
25.0
12.5
6

100
90
80 -
~ 0 70
°' c 60 . 'iii "' ca 50 -Q, .... c 40 -Cl)
!::! Cl)
30 . Q,
20
10
0 -0.075
Summary of Gradations for 19.0 mm MAS Mixes (Mix 4)
-BelowRZ -AboveRZ -ThruRZ - - - Restricted Zone
• Control Points
2.36 4.75 9.5 12.5 19.0
Sieve Size Raised to 0.45 Power (mm)
Figure 5: Gradations for Mix 4
25.0
After developing gradations that passed above and through the restricted zone,
asphalt contents were selected to provide 4 percent air voids using respective design
number of gyrations.
The asphalt binder selected for this study was a Superpave performance-based PG
67-22. This binder is also one of the NCAT labstock asphalt binders and has been used
on numerous research projects with success. Properties of this asphalt binder are provided
in Table 3.
7

Table 3: Properties of Asphalt Binder
Ageing Test Test Result Temperature Requirement Test Method
Flash Point 313°C - 230 °C min AASHTOT48
Original Rotational Viscosity (Pa•s) 0.400 135 °C 3 max AASHTOTP48
Binder
DSR, G*/sin8 (kPa) 1.078 67 °C 1.00 min AASHTOTP5
Mass Loss 0.08% - 1.00 % max AASHTOT240 RTFO
RTFO Aged DSR, G*/sin8 (kPa) 2.279 67 °C 2.20 min AASHTOTP5
PAV Aged DSR, G*/sin8 (kPa) 4752 25 °C 5000 max AASHTOTP5
PAV PAV Aged BBR, Stiffuess (MPa) 226 -12 °C 300 max AASHTOTPl
PAV Aged BBR, m-value 0.325 -12 °C 0.300 min AASHTOTPl
TEST METHODS
All of the mixes were subjected to three different performance tests: Asphalt
Pavement Analyzer, Rotary Loaded Wheel Tester, and Marshall test.
The Asphalt Pavement Analyzer (APA) is a modification of the Georgia Loaded
Wheel Tester (GL WT). The APA, shown in Figure 6, can be used to evaluate rutting,
fatigue, and moisture resistance of HMA mixtures.
Test specimens for the AP A can be either beam or cylindrical. Three pairs of
gyratory-compacted cylindrical specimens were typically tested in this project. Due to
the limitation of some aggregate sources, some mixes were tested using two pairs ( 4
samples) specimens instead of three pairs (6 samples). This issue will be addressed later
in the analysis portion. Test samples for each mix were specimens compacted to their
respective design number of gyrations at optimum asphalt content. Sample was
approximate I y 115 mm in height and has an air void content of 4 percent. The AP A test
was conducted at 64°C to 8000 cycles, and rut depths were measured continuously.
Wheel load and hose pressure were 445 N and 690 kPa (100 lb and 100 psi), respectively.
8
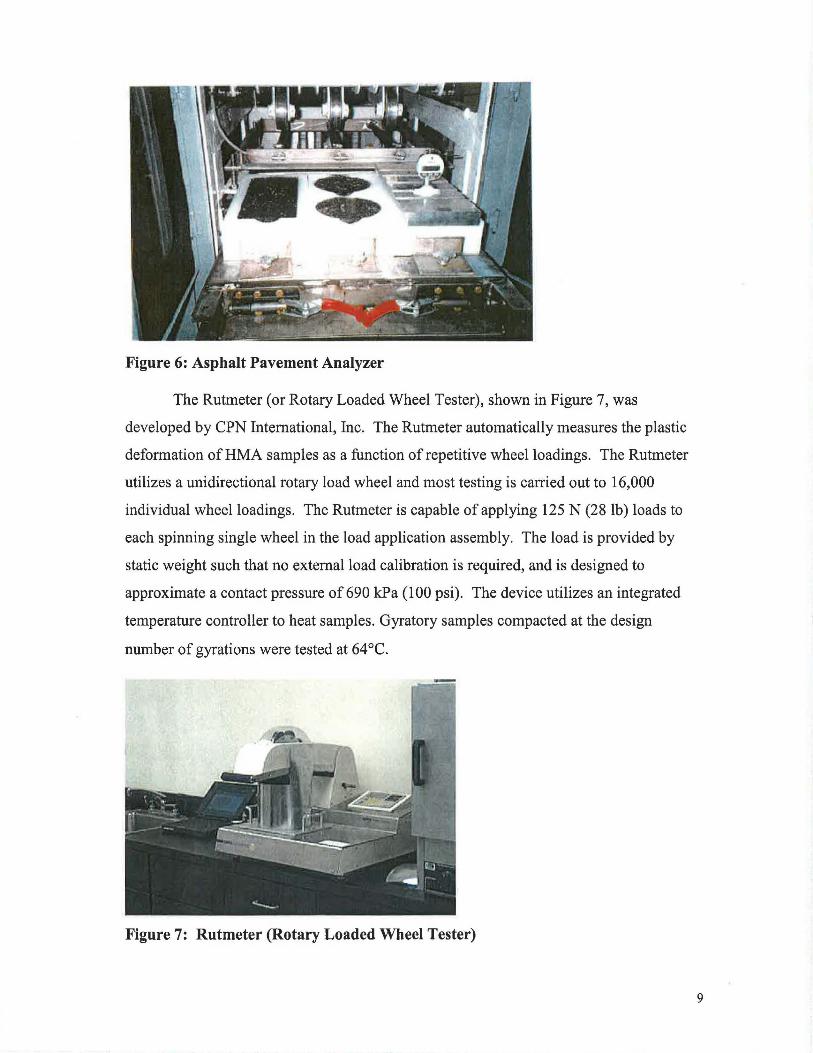
Figure 6: Asphalt Pavement Analyzer
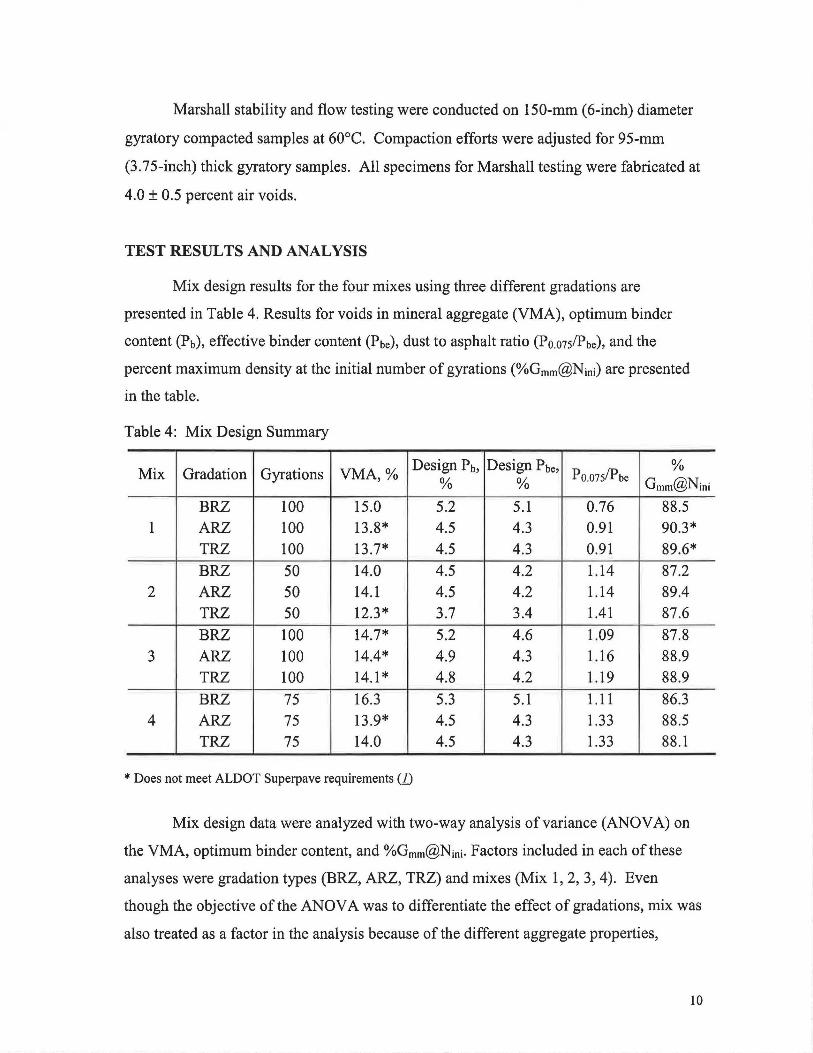
The Rutmeter (or Rotary Loaded Wheel Tester), shown in Figure 7, was
developed by CPN International, Inc. The Rutmeter automatically measures the plastic
deformation of HMA samples as a function of repetitive wheel loadings. The Rutmeter
utilizes a unidirectional rotary load wheel and most testing is carried out to 16,000
individual wheel loadings. The Rutmeter is capable of applying 125 N (28 lb) loads to
each spinning single wheel in the load application assembly. The load is provided by
static weight such that no external load calibration is required, and is designed to
approximate a contact pressure of 690 kPa (100 psi). The device utilizes an integrated
temperature controller to heat samples. Gyratory samples compacted at the design
number of gyrations were tested at 64 °C.
Figure 7: Rutmeter (Rotary Loaded Wheel Tester)
9
Marshall stability and flow testing were conducted on 150-mm (6-inch) diameter
gyratory compacted samples at 60°C. Compaction efforts were adjusted for 95-mm
(3.75-inch) thick gyratory samples. All specimens for Marshall testing were fabricated at
4.0 ± 0.5 percent air voids.
TEST RESULTS AND ANALYSIS
Mix design results for the four mixes using three different gradations are
presented in Table 4. Results for voids in mineral aggregate (VMA), optimum binder
content (Pb), effective binder content (Pbe), dust to asphalt ratio (Poms/Pbe), and the
percent maximum density at the initial number of gyrations (%Gmm@Nini) are presented
in the table.
Table 4: Mix Design Summary
Design Pb, Design Pbe, % Mix Gradation Gyrations VMA,%
% % Poms/Pbe Gmm@Nini
BRZ 100 15.0 5.2 5.1 0.76 88.5 1 ARZ 100 13.8* 4.5 4.3 0.91 90.3*
TRZ 100 13.7* 4.5 4.3 0.91 89.6*
BRZ 50 14.0 4.5 4.2 1.14 87.2
2 ARZ 50 14.1 4.5 4.2 1.14 89.4 TRZ 50 12.3* 3.7 3.4 1.41 87.6
BRZ 100 14.7* 5.2 4.6 1.09 87.8
3 ARZ 100 14.4* 4.9 4.3 1.16 88.9 TRZ 100 14.1 * 4.8 4.2 1.19 88.9
BRZ 75 16.3 5.3 5.1 1.11 86.3
4 ARZ 75 13.9* 4.5 4.3 1.33 88.5 TRZ 75 14.0 4.5 4.3 1.33 88.1
* Does not meet ALDOT Superpave requirements (D
Mix design data were analyzed with two-way analysis of variance (ANOVA) on
the VMA, optimum binder content, and %Gmm@Nini· Factors included in each of these
analyses were gradation types (BRZ, ARZ, TRZ) and mixes (Mix 1, 2, 3, 4) . Even
though the objective of the ANOV A was to differentiate the effect of gradations, mix was
also treated as a factor in the analysis because of the different aggregate properties,
10

maximum aggregate sizes, and different design gyrations levels used in the four types of
mixes. Without the inclusion of mix type as a factor in the ANOV A, the variability
caused by the different mix properties would have likely overshadowed the effect of
gradation type. Because the responses are volumetric properties, there was only one
response per factor-level combination. The interaction between mix and gradation was
sacrificed to yield an ANOV A term. Therefore, no conclusion can be made about the
significance of the two factors, but rather a relative impact of each factor can be
determined.
ANOVAfor Voids in Mineral Aggregate
Table 5 presents the results of the analysis of variance (ANOVA) to determine the
impact of the mixes and gradation types corresponding to the restricted zone on the
VMA. The larger F-statistics for gradation type means it had a greater impact on VMA
than mix type.
Table 5: Results of ANOV A for VMA Analysis
Source of Sum of Degrees of Mean F-statistic Variation Squares Freedom Squares
Mix 2.589 3 0.863 2.081
Gradation 4.472 2 2.236 5.391
Error 2.488 6 0.415
Figure 8 illustrates the effect of gradation type on VMA. Each bar on this Figure
represents the average VMA for four mixes having the same gradation type.
This figure shows that the BRZ gradation provided much higher VMA then did
the TRZ and ARZ. On average, mixes below the restricted zone had approximately 1.5
percent higher VMA than mixes through the restricted zone, and 0.9 percent higher VMA
than mixes above the restricted zone. The TRZ gradation provided the lowest VMA,
because it is closer to the maximum density line. It was not expected that mixes having
gradation above the restricted zone would have lower VMA than the BRZ mixes.
However, in the recently completed National Cooperative Highway Research Program
project - NCHRP 9-14: "The Restricted Zone in the Superpave Aggregate gradation
11

Specification" (J), this phenomenon (VMA for ARZ less than VMA for BRZ) was also
observed for the 25.0 mm MAS mixes.
Effect of Gradation on Voids in Mineral Aggregate
'#. - 15.0 ~ C> e 14.5 C>
~ 1! 14.0 . Cl) c i 13.5 c Ill 'ti 13.0 ~
12.5 +-------'
BRZ ARZ
Gradation
Figure 8: Effect of Gradations on Voids in Mineral Aggregate
ANOVAfor Optimum Binder Content
TRZ
Table 6 presents the results of the ANO VA to evaluate the impact of mix and
gradation type on optimum binder content. This table shows the gradation type had a
larger impact on optimum binder content.
Table 6: Results of ANOV A for Optimum Binder Content Analysis
Source of Sum of Degrees of Mean F-statistic Variation Squares Freedom Squares
Mix 0.876 3 0.292 5.446
Gradation 0.945 2 0.472 8.813
Error 0.322 6 0.054
The effect of gradation on optimum binder content is shown in Figure 9. The
average optimum binder content for the BRZ mixes was approximately 0.7 percent
12

higher than the TRZ mixes and 0.5 higher than the ARZ mixes. The reason that the BRZ
mixes had higher optimum binder contents than the TRZ and ARZ mixes was that the
BRZ mixes produced averages of 1.5 and 0.9 percent more VMA than did the TRZ and
ARZ mixes respectively.
Effect of Gradation on Optimum Binder Content
5.2
'#. 5.0 .,,; c Q) ....
4.8 c 0 0 ... .g 4.6 c iii E 4.4 ::I E a 0 4.2
BRZ ARZ TRZ
Gradation
Figure 9: Effect of Gradations on Optimum Binder Content
ANOVAfor %Gmn@inittat
Table 7 presents the results of the two-factor ANOVA to evaluate the impact of
mix and gradation type on %G0101@Ninitial· This table shows that both the mix and the
gradation impacted %Gmm@Ninitial·
Table 7: Results of ANOVA for %Gmm@Ninitiat Analysis
Source of Sum of Degrees of Mean Variation Squares Freedom Squares F-statistic
Mix 5.556 3 1.852 9.324
Gradation 6.755 2 3.378 17.006
Error 1.192 6 0.199
13

Figure 10 illustrates the effect of gradation on %Gmm@Ninitial· The ARZ
gradations provided the highest %Gmm@Ninitial values. On average, the BRZ gradations
had approximately 1.8 percent lower %Gmm@Ninitial values than the ARZ gradations and
the TRZ gradations had approximately 1.1 percent lower %Gmm@Ninitial (87.5 versus 89.3
and 88.6). The ARZ mixes were finer than the TRZ and BRZ mixes, and finer gradations
tend to yield higher %Gmm@Ninitial values.
89.0
~ 88.5 ·c: z @) 88.0 -E E ~ 87.5 -0
87.0 -
86.5 -t----
Effect of Gradation on %Gmm@Nini
BRZ ARZ
Gradation
Figure 10: Effect of Gradations on %Gmm@N1nwa1
Results of Asphalt Pavement Analyzer Rut Testing
TRZ
Results of AP A rut testing conducted on the mixes are presented in Table 8. A
critical rut depth of 8.2-mm to separate potentially rutting susceptible from non rutting
susceptibility mixes was determined based upon a rutting study by Zhang, et. al. (J).
This value was verified using a temperature-effect model (1..) that converted the Georgia
Department of Transportation critical rut depth of 5-mm at 50°C to the test temperature
of 64°C. The 8.2 mm was used as the critical rut depth in this study for comparison
purposes.
14
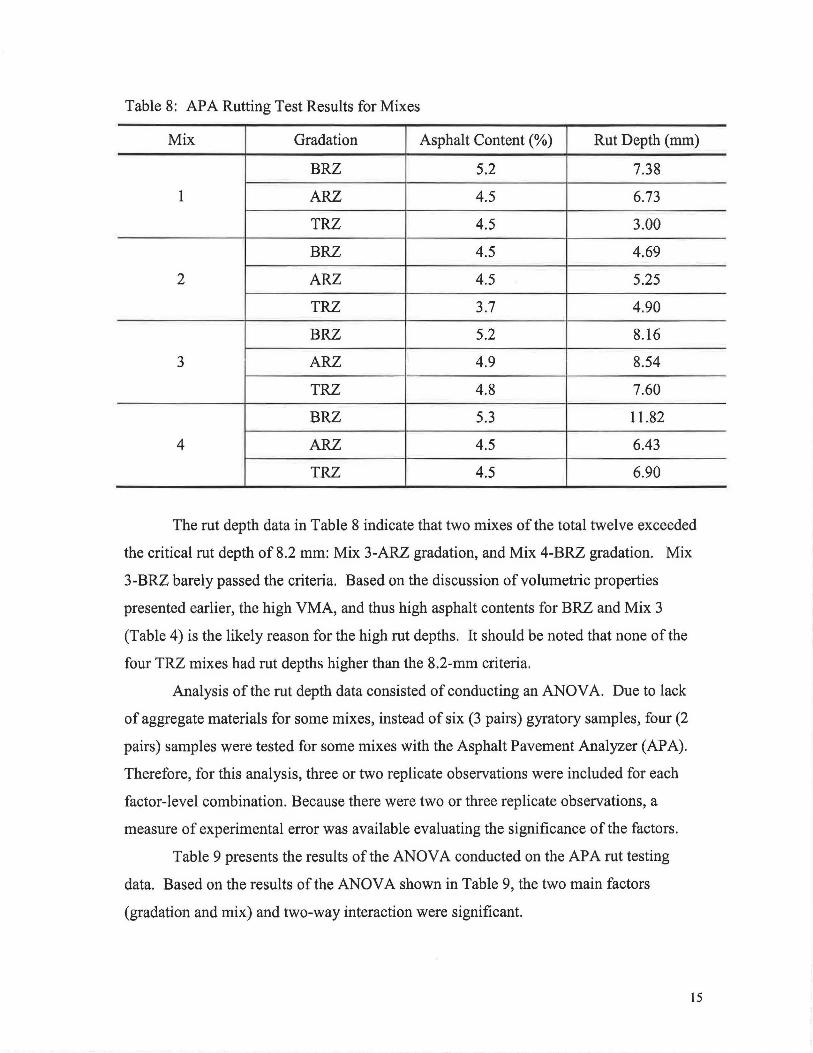
Table 8: APA Rutting Test Results for Mixes
Mix Gradation Asphalt Content(%) Rut Depth (mm)
BRZ 5.2 7.38
1 ARZ 4.5 6.73
TRZ 4.5 3.00
BRZ 4.5 4.69
2 ARZ 4.5 5.25
TRZ 3.7 4.90
BRZ 5.2 8.16
3 ARZ 4.9 8.54
TRZ 4.8 7.60
BRZ 5.3 11.82
4 ARZ 4.5 6.43
TRZ 4.5 6.90
The rut depth data in Table 8 indicate that two mixes of the total twelve exceeded
the critical rut depth of 8.2 mm: Mix 3-ARZ gradation, and Mix 4-BRZ gradation. Mix
3-BRZ barely passed the criteria. Based on the discussion of volumetric properties
presented earlier, the high VMA, and thus high asphalt contents for BRZ and Mix 3
(Table 4) is the likely reason for the high rut depths. It should be noted that none of the
four TRZ mixes had rut depths higher than the 8.2-mm criteria.
Analysis of the rut depth data consisted of conducting an ANOVA. Due to lack
of aggregate materials for some mixes, instead of six (3 pairs) gyratory samples, four (2
pairs) samples were tested for some mixes with the Asphalt Pavement Analyzer (APA).
Therefore, for this analysis, three or two replicate observations were included for each
factor-level combination. Because there were two or three replicate observations, a
measure of experimental error was available evaluating the significance of the factors.
Table 9 presents the results of the ANO VA conducted on the APA rut testing
data. Based on the results of the AN OVA shown in Table 9, the two main factors
(gradation and mix) and two-way interaction were significant.
15

Table 9: Results of ANOV A for AP A Rut Depth Data
Source of Degrees of Sequential Adjusted Adjusted F-statistic P-Value Significant Variation Freedom sums of sums of Mean at 95%
squares squares Squares
Mix 3 58.164 64.288 21.429 13.17 0.000 Yes
Gradation 2 21.721 27.92 13.96 8.58 0.002 Yes
Mix*Grad 6 42.388 42.388 7.065 4.34 0.007 Yes
Error 18 29.299 29.299 1.628
Total 29 151.572
Based upon Table 9, mix had the most significant effect on rut depth. Variable
"mix" combines aggregate sources and properties, design gyration levels, and Maximum
Aggregate Size. Therefore, it is difficult to draw a conclusion from the data for these four
mixes since all factors affected rut performance. The effects of aggregate properties,
design gyration levels, and MAS on rut depths were beyond the scope of this study.
Figure 11 shows the effect of gradation on rut depth. The BRZ gradation had
slightly higher rut depths than the ARZ and TRZ gradations. On average, mixes having
gradations below the restricted zone rutted about 2.4 mm and 1.3 mm more than did
mixes having TRZ gradation and ARZ gradation, respectively. This was also as expected.
Recall that the design mixes (BRZ gradations) had higher VMA and thus higher optimum
binder contents than did the TRZ and ARZ mixes (average difference of 1.5 and 0.9
percent VMA, and 0.7 and 0.5 percent binder). The increased binder contents likely
caused the higher rut depths. This indicates that the mixes having gradations through the
restricted zone performed slightly better than did the mixes having gradations below and
above the restricted zone. However, long-term durability might be a problem for some
the TRZ mixes since all did not meet the minimum VMA requirements (Table 4).
16

Effect of Gradation on APA Rut Depth
9 . 0 ~----------------------~~-~
8.0 -
- 7.0 -E .§. 6.0 ..c Q. 5.0 -~ .. 4.0 -:I
0::: <( 3.0 -0... <( 2.0
1.0
0.0 +-----
BRZ ARZ
Gradation
Figure 11: Effect of Gradation on AP A Rut Depth
TRZ
The interaction between mix and gradation was also shown to be significant. This
interaction on rut depths is shown in Figure 12. Based on this figure, there was a greater
difference in rut depths for the BRZ gradations than for the ARZ and TRZ gradations.
Considering it was a pass-fail situation for the BRZ gradation mixes, this interaction
suggests that aggregate properties are more critical for gradations below the restricted
zone. It also shows that mixes having gradations below the restricted zone do not
guarantee sufficient rut resistant performance.
This figure also shows that the rut depth difference for mixes is greater than it is
for gradations. This strengthens the role an aggregate plays in a mix for rutting
performance. Some aggregate sources can be designed rut-resistant by having gradations
below, above, or through the restricted zone.
17
• Mix 1 oMix2 oMix 3 oMix 4
12.0
10.0
~
E 8.0 g .=. .... 6.0 Q. (I)
c .... :I 4.0 0::
2.0
BRZ ARZ TRZ
Gradation
Figure 12: Asphalt Pavement Analyzer Rutting Results for Mixtures
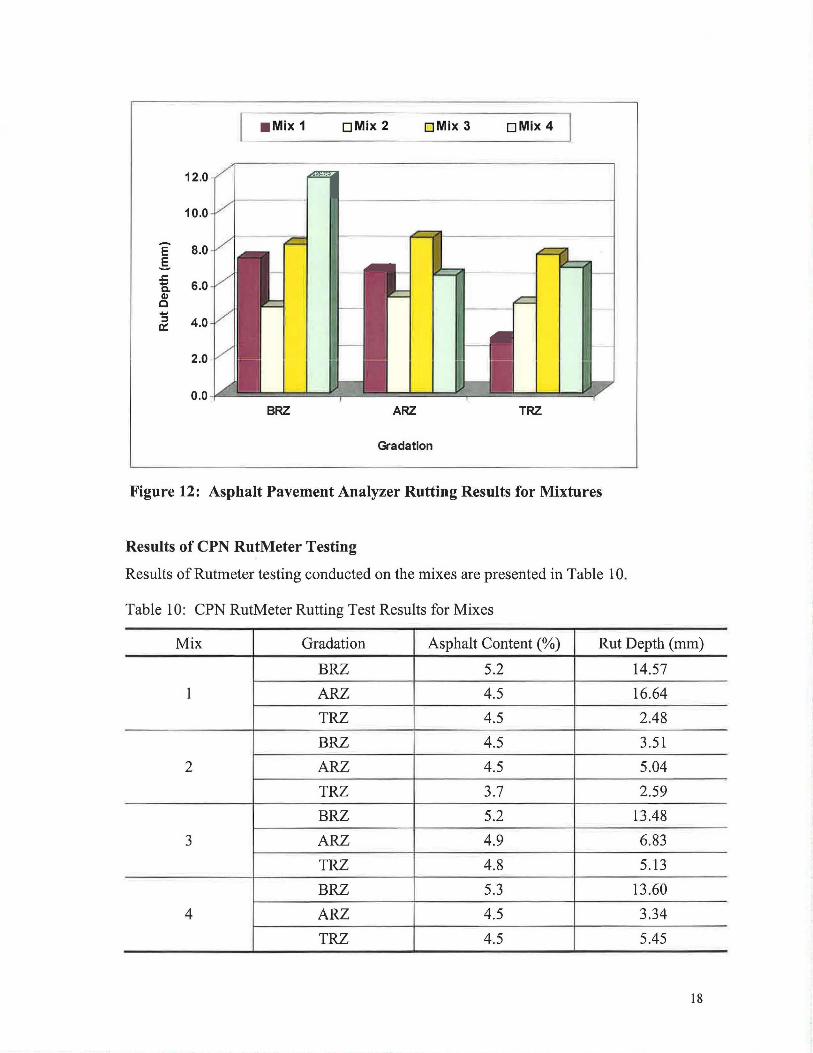
Results of CPN RutMeter Testing
Results ofRutmeter testing conducted on the mixes are presented in Table 10.
Table 10: CPN RutMeter Rutting Test Results for Mixes
Mix Gradation Asphalt Content (%) Rut Depth (mm)
BRZ 5.2 14.57
1 ARZ 4.5 16.64
TRZ 4.5 2.48
BRZ 4.5 3.51
2 ARZ 4.5 5.04
TRZ 3.7 2.59
BRZ 5.2 13.48
3 ARZ 4.9 6.83
TRZ 4.8 5.13
BRZ 5.3 13.60
4 ARZ 4.5 3.34
TRZ 4.5 5.45
18
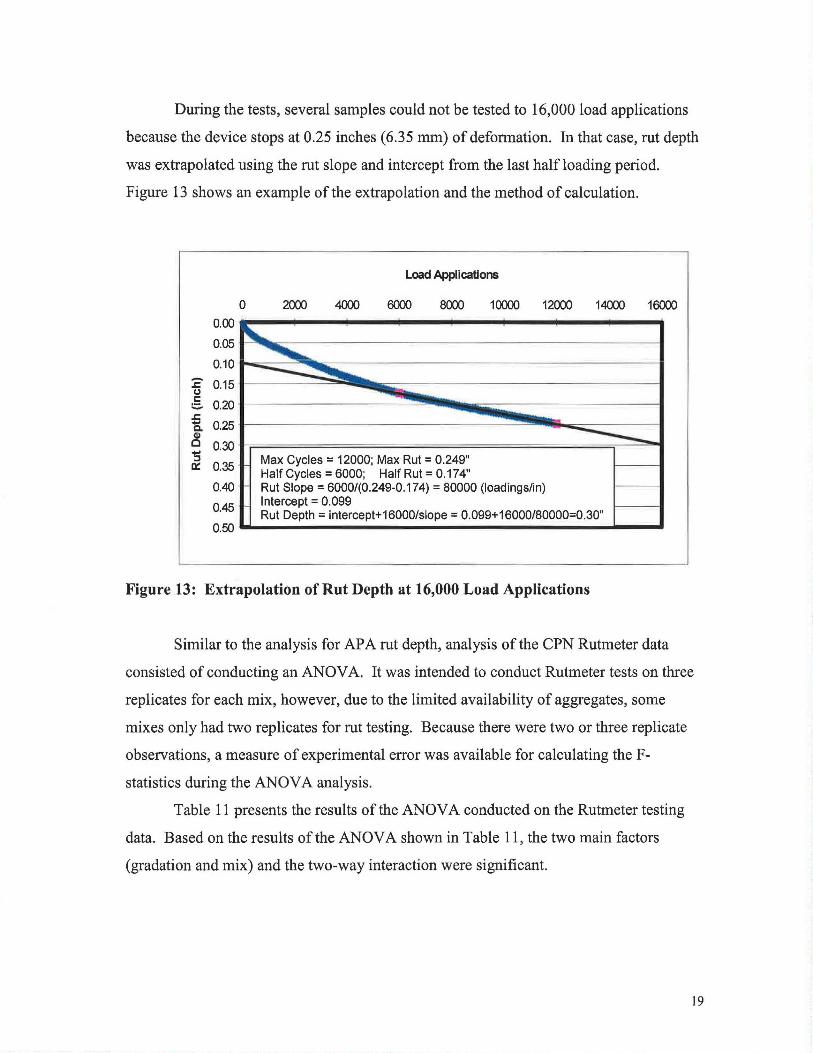
During the tests, several samples could not be tested to 16,000 load applications
because the device stops at 0.25 inches (6.35 mm) of deformation. In that case, rut depth
was extrapolated using the rut slope and intercept from the last half loading period.
Figure 13 shows an example of the extrapolation and the method of calculation.
Load Applications
0 2000 4000 6000 8000 10000 12000 14000 16000
0.00
0.05
0.10
'-.. ,............._ ~
:2' 0.15 (,)
:§_ 0.20 .c - 0.25 0.
~ 0.30 -:I a:: 0.35 -------Max Cycles= 12000; Max Rut= 0.249"
Half Cycles = 6000; Half Rut= 0.174" 0.40 Rut Slope= 6000/(0.249-0.174) = 80000 (loadings/in)
0.45 Intercept= 0.099 Rut Depth= intercept+16000/slope = 0.099+16000/80000=0.30"
0.50
Figure 13: Extrapolation of Rut Depth at 16,000 Load Applications
Similar to the analysis for APA rut depth, analysis of the CPN Rutmeter data
consisted of conducting an ANOV A. It was intended to conduct Rutmeter tests on three
replicates for each mix, however, due to the limited availability of aggregates, some
mixes only had two replicates for rut testing. Because there were two or three replicate
observations, a measure of experimental error was available for calculating the F
statistics during the ANOV A analysis.
Table 11 presents the results of the ANOVA conducted on the Rutmeter testing
data. Based on the results of the ANOVA shown in Table 11, the two main factors
(gradation and mix) and the two-way interaction were significant.
19

Table 11: Results of ANOV A for RutMeter Rut Depth Data
Source of Degrees of Sequential Adjusted Adjusted F-statistic P-Value Significant Variation Freedom sums of sums of Mean at 95%
squares squares Squares
Mix 3 208.192 224.47 74.823 22.49 0.000 Yes
Gradation 2 294.204 291.012 145.506 43.74 0.000 Yes
Mix*Grad 6 265.042 265.042 44.174 13.28 0.000 Yes
Error 19 63.212 63.212 3.327
Total 30 830.65
Gradation had a greater effect on RutMeter rut depths than did mix type. Figure
14 illustrates the effect of gradation on rut depth. Again, the BRZ gradation had the
highest rut depth, followed by mixes having ARZ and TRZ gradations. On average, the
design mixes (BRZ gradations) had approximately 7.4 and 3.3 mm higher rut depth in
RutMeter testing than did mixes having TRZ gradation and ARZ gradation, respectively.
Effect of Gradation on RutMeter Rut Depth
12.0 -
-E 10.0 -E -.c .... c. 8.0 -Q)
c .... :I
a::: 6.0 '-.s Q)
:E 4.0 .... :I
a::: z 2.0 -a.. 0
0.0 BRZ ARZ TRZ
Gradation
Figure 14: Effect of Gradation on CPN RutMeter Rut Depth
20

These results indicate that the mixes having gradations through the restricted zone
performed better than did the mixes having gradations below and above the restricted
zone. This confirms the conclusion from the AP A data that the restricted zone is not
needed to ensure a rut-resistant mixture.
The interaction between mix and gradation was also significant. The effect of this
interaction on RutMeter rut depths is presented in Figure 15.
18.0
16.0
l 14.o
;; 12.0 Q.
~ 10.0 +' ::I
0::: 8.0 ... ~ 6.0 ~
:; 4.0 0:::
• Mix 1
BRZ
OMix 2 OMix 3 oMix 4
ARZ TRZ
Gradation
Figure 15: Interaction Between Gradation and Mix on CPN RutMeter Rut Depths
Based on this figure, there was a greater difference in rut depths for the BRZ
gradations and ARZ gradation than the TRZ gradations. For the BRZ gradation, three of
the four mixes had relatively high rut depths. However, Mix 2 at BRZ gradation
performed very well with a rut depth of 3.51 mm. Again, this suggests that aggregate
sources and properties become important for the mixes having gradation below the
restricted zone. Based upon the RutMeter rut depth in this figure, all four mixes having
gradation through the restricted zone performed very well.
21

Results of Marshall Stability and Flow Testing
Results of Marshall stability and flow testing are presented in Table 12. One
more logical property is the Marshall stiffness index which is the Marshall stability
divided by flow. This is an empirical stiffness value and is used by some engineers,
especially in Europe, to evaluate the strength of asphalt mixture. A higher value of
stiffness index indicates a stiffer mixture and, hence, indicates the mixture is likely more
resistant to permanent deformation. This data is also included in Table 12.
Table 12: Marshall Stability and Flow Test Results
Mix Gradation Asphalt Content Stability Flow Stiffness Index (%) (lbf) (0.01 inch)
BRZ 5.2 4458 20.8
1 ARZ 4.5 2522 17.5
TRZ 4.5 7310 16.0
BRZ 4.5 4088 23.0
2 ARZ 4.5 2263 19.3
TRZ 3.7 3948 22.8
BRZ 5.2 2900 21.3
3 ARZ 4.9 3217 18 .3
TRZ 4.8 3127 20.3
BRZ 5.3 1937 20.6
4 ARZ 4.5 2225 17.8
TRZ 4.5 2015 18.4
The ANOVA results conducted on stability, flow, and stiffness index are
presented in Tables 13 through 15, respectively.
Table 13: Results of ANOVA for Marshall Stability Data
Source of Degrees of Sequential Adjusted Adjusted F-statistic P-Value Variation Freedom sums of sums of Mean
squares squares Squares
Mix 3 20631550 25378881 8459627 128.16 0.000
Gradation 2 10670711 10906981 5453490 82.62 0.000
Mix*Grad 6 21231428 21231428 3538571 53.61 0.000
Error 17 1122167 1122167 66010
Total 28 53655855
(lbf/inch)
21487
14410
49800
17789
11789
17352
13653
17603
15431
9401
12527
10991
Significant at95%
Yes
Yes
Yes
22

Table 14: Results of ANOVA for Marshall Flow Data
Source of Degrees of Sequential Adjusted Adjusted F-statistic P-Value Significant Variation Freedom sums of sums of Mean at95%
squares squares Squares
Mix 3 45.975 45.454 15.151 6.08 0.005 Yes
Gradation 2 48.619 50.786 25.393 10.18 0.001 Yes
Mix*Grad 6 18.346 18.346 3.058 1.23 0.341 No
Error 17 42.385 42.385 2.493
Total 28 155.326
Table 15: Results of ANOV A for Marshall Stiffness Index Data
Source of Degrees of Sequential Adjusted Adjusted F-statistic P-Value Significant Variation Freedom sums of sums of Mean at 95%
squares squares Squares
Mix 3 9.41E+08 l.l 7E+09 3.89E+08 12.10 0.000 Yes
Gradation 2 4.22E+08 4.51E+08 2.25E+08 7.00 0.006 Yes
Mix*Grad 6 1.23E+09 1.23E+09 2.05E+08 6.38 0.001 Yes
Error 17 5.47E+08 5.47E+08 32191401
Total 28 3.14E+09
Table 13 presents the results of the ANO VA conducted on the Marshall stability
data. Based upon the results, mix, gradation, and the interaction between mix and
gradation were significant.
Table 14 presents the results of the ANOVA conducted on the Marshall flow data.
Based upon the results, gradation and mix type were significant, but there was no
interaction between the two factors.
Table 15 presents the results of the ANOV A conducted on the Marshall stiffness
index data. Based upon the results, gradation, mix, and interaction between gradation
and mix were all significant.
The effects of the gradation on Marshall stability, flow, and stiffness index are
illustrated in Figures 16 through 18.
23

Effect of Gradation on Marshall Stability
4500 -..-~~~~~~~~~~~~~~~~~~~~~~~~---.
4000 -
@: 3500
~ 3000 -
:c 2500 -9$
2000 -11:1
~ 1500 -11:1
:E 1000 -
500 -
0 -+--- --
BRZ ARZ
Gradation
Figure 16: Effect of Gradation on Marshall Stability
Q 21 .0 -0 -... 1: 20.0 -E ::I
z 19.0 -~ u:
18.0 -ca .c ~ 11:1 17.0 :E
16.0 -+-----
Effect of Gradation on Marshall Flow Number
BRZ ARZ
Gradation
Figure 17: Effect of Gradation on Marshall Flow
TRZ
TRZ
24
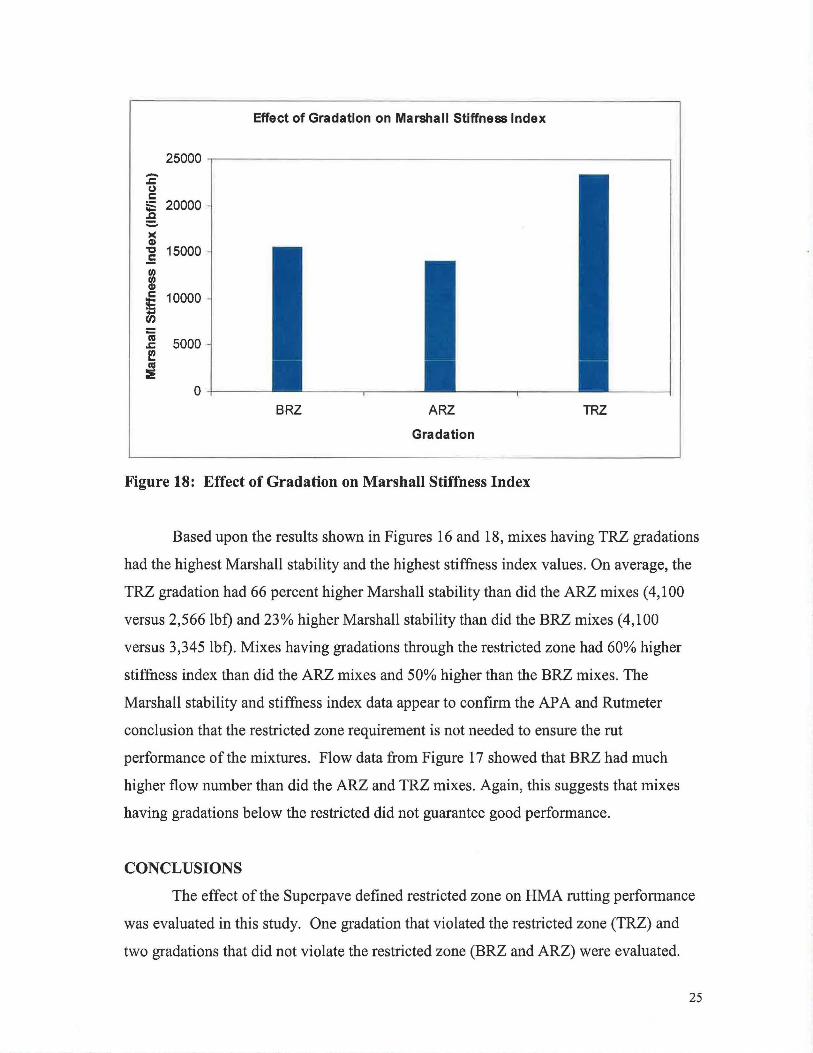
Effect of Gradation on Marshall Stiffness Index
25000 -.c (.) c ;: 20000 .c ::.. >< G>
"C 15000 .E Ill Ill G>
!E 10000 ... en iii 5000 .c (!? cu
::::!: 0
BRZ ARZ TRZ
Gradation
Figure 18: Effect of Gradation on Marshall Stiffness Index
Based upon the results shown in Figures 16 and 18, mixes having TRZ gradations
had the highest Marshall stability and the highest stiffness index values. On average, the
TRZ gradation had 66 percent higher Marshall stability than did the ARZ mixes ( 4, 100
versus 2,566 lbf) and 23% higher Marshall stability than did the BRZ mixes (4,100
versus 3 ,345 lbf). Mixes having gradations through the restricted zone had 60% higher
stiffness index than did the ARZ mixes and 50% higher than the BRZ mixes. The
Marshall stability and stiffness index data appear to confirm the AP A and Rutmeter
conclusion that the restricted zone requirement is not needed to ensure the rut
performance of the mixtures. Flow data from Figure 17 showed that BRZ had much
higher flow number than did the ARZ and TRZ mixes. Again, this suggests that mixes
having gradations below the restricted did not guarantee good performance.
CONCLUSIONS
The effect of the Superpave defined restricted zone on HMA rutting performance
was evaluated in this study. One gradation that violated the restricted zone (TRZ) and
two gradations that did not violate the restricted zone (BRZ and ARZ) were evaluated.
25
Mixes selected for evaluation represented a range of maximum aggregate size of
gradation, design traffic level, and aggregate types. Three laboratory tests, Asphalt
Pavement Analyzer, CPN Rutmeter, and Marshall test, were used to evaluate the rutting
performance.
The following conclusions are drawn from the analysis of the data presented in
this study.
1. Mixes having gradations violating the restricted zone performed similarly to or
better than the mixes with gradations passing outside the restricted zone. This
conclusion is drawn from the results of experiments with 12.5 mm, 19.0 mm and
25.0 mm MAS gradations at Ndesign values of 100, 75, and 50 gyrations. This
conclusion is confirmed and supported by a recently completed National
Cooperative Highway Research Program project - NCHRP 9-14: "The Restricted
Zone in the Superapve Aggregate gradation Specification" (n.
2. Rutting performance of mixes having gradation below the restricted zone, which
was commonly recognized to be rut-resistant, appears more sensitive to aggregate
properties than do mixes having gradations above or through the restricted zone.
REFERENCE
1. Alabama Department of Transportation Standard Specifications for Highway
Construction. Section 424: Superpave Bituminous Concrete Base, Binder, and Wearing
Surface Layers. 2002 Edition.
2. Kandhal, P.S. and L.A. Cooley, Jr. The Restricted Zone in the Superpave
Aggregate Gradation Specification. National Cooperative Highway Research Program
NCHRP Report 464. Transportation Research Board, National Research Council.
Washington, DC 2001.
3. Zhang, J., L.A. Cooley, Jr., and P.S. Kandhal. Comparison of Fundamental
and Simulative Test Methods for Evaluating Permanent Deformation of Hot Mix Asphalt.
Transportation Research Record No. 1789. Transportation Research Board. Washington,
DC 2002.
4. Haroon I. Shami, Jame S. Lai, John A.D'Angelo, and R. Thomas P. Harman.
Development of Temperature-Effect Model for Predicting Rutting of Asphalt Mixtures
26

Using Georgia Loaded Wheel Tester. Transportation Research Record, No.1590,
Washington, DC 1997.
5. Brown, E.R., P.S. Kandhal, and J. Zhang. Performance Testing for Hot-Mix
Asphalt. National Center for Asphalt Technology Report No.01-05. NCAT, Auburn
University. 2002.
27


