124
Electrolux Annual Report 2018

Electrolux Annual Report 2018

Well positioned to create value
–
A strong focus on innovation to improve the consumer experience and a track record of successfully increasing
cost efficiency and flexibility are important competitive assets. In combination with a healthy cash flow and a strong balance sheet, this make Electrolux well positioned
to continue to deliver shareholder value.


124BILLION SEK
IN SALES
150SALES IN MARKETS
60MILLION PRODUCTS
SOLD ANNUALLY
54,000EMPLOYEES
global leaderElectrolux is a global leader in household appliances and
appliances for professional use. We reinvent taste, care and wellbeing experiences for more enjoyable and sustainable
living around the world. We offer thoughtfully designed, innovative and sustainable solutions, under well-established
brands including Electrolux, AEG and Frigidaire.
Focused proFitable growth strategyWe focus on consumer-relevant product innovations to drive profitable growth. Our global presence offers
economies of scale, and we invest in modularized product architectures and further cost efficiency and
flexibility in production. Sustainability is a key business driver, and our profitable growth is supported by a strong
balance sheet and healthy cash flow generation.

CEO STATEMENTGood progress despite strong headwinds in 2018 6Well positioned to benefit from global trends 10 How to achieve profitable growth 10Well positioned to create value 13
Taking the next steps to accelerate profitable growth 14
REPORTINGReport by the Board of Directors 17Notes 44Proposed distribution of earnings 81Auditors’ report 82Eleven-year review 86Operations by business area, yearly 88Quarterly information 89Sustainability reporting 90Corporate governance report 101
Events and reports 119 Annual General Meeting 120100 years of better living 121
The Annual Report for AB Electrolux (publ), 556009-4178, consists of the Report by the Board of Directors and Notes to the financial statements, pages 17—81. The Annual Report is published in Swedish and English.
Table of contents
Please find more information about business development, strategy and business areas in the Electrolux Annual Review 2018, accessible on all your digital platforms. These sections were previously included in the Annual Report.
Please visit the Electrolux Annual Review 2018 at: www.electroluxgroup.com/annualreports/2018
The Electrolux sustainability framework and execution are described in the Sustainability reporting section on pages 90—99. The full Electrolux Sustainability Report is published online in March 2019 at: www.electroluxgroup.com/sustainabilityreport2018
ANNUAL REVIEW ON THE WEB
Electrolux, AEG and Zanussi are the registered trademarks of AB Electrolux. For further information about trademarks, please
contact Electrolux Group Intellectual Property, Trademark.
Concept, text and production by Electrolux Investor Relations and Hallvarsson & Halvarsson.
Larsson Offsettryck
Printed matter
341 298
SUSTAINABILITY

Good progress in a challenging environment
CEO STATEMENT

I am pleased with our performance in 2018 in the face of challenging conditions. Our focus on innovation to improve the consumer experience and our high cost efficiency are key competitive assets. Combined with price increases, these factors had a positive impact on our earnings, but could not fully compensate for the strong headwinds we faced primarily from raw material and currency.
operating margin1)
5.4percent
operating cash flow 2)
3,649SEKm
sales growth
1.7percent
dividend 3)
8.50SEK per share
Core markets Growth markets
sales by region
39%
15%
33%
3%4%
6%
Our performance in 2018 was very encouraging in several key areas. We launched a large number of new innovative products designed to deliver outstanding consumer experiences. We continued to improve our cost efficiency throughout the Group, and we carried out large parts of our re-engineering program that aims to drive profitable growth in the years ahead. We also reinforced our position as a sustainability leader in the industry, which is an ever-more crucial competitive advantage as sustain-ability is playing an increasingly important role for consumers and is a key driver of demand.
Jonas Samuelson, Electrolux President and CEO.
1) Excluding non-recurring items.2) After investments.3) Proposed by the Board.
Major Appliances Europe, Middle East and Africa (EMEA), 34%
Major Appliances North America, 31%
Major Appliances Latin America, 14%
Major Appliances Asia/Pacific, 7%
Home Care & SDA, 6%
Professional Products, 7%
business areas
share of group sales
CEO statement 5

Good progress despite strong headwinds in 2018Underlying operating income and margin contracted due to the negative impact of raw material and currency. In fact, it is very unusual for us to experience such strong headwinds from both these factors in the same year. In addition, the U.S. trade tariffs that were imposed during the year had an adverse effect. Therefore it was important that we managed to implement price increases and improve the mix by providing more relevant, innovative product offer-ings. We continued to perform favorably in terms of cost efficiencies, mainly as a result of continuous improvements. Sales growth was 1.7%, driven mainly by price increases
and mix improvements across most business areas although acquisitions also contributed.
We reported strong organic sales growth in EMEA, mainly due to our consistent focus on innovative products under premium brands, and we continued to gain market shares in the focus areas of laundry and built-in kitchen. Operating income excluding non-recurring items improved as higher volumes, mix
improvements and increased cost efficiency offset higher costs for raw materials and currency headwinds. Strong growth in Eastern Europe continued to drive overall market demand in Europe, while demand in Western Europe declined somewhat.
Our North American operation was signifi-cantly impacted by increased raw material costs and U.S. trade tariffs as well as from lower volumes, partly related to private label. To mitigate the cost inflation, several cost-based price increases were announced and implemented. We also announced a major re-engineering of our Anderson freezer/fridge factory to increase our competitive-ness by providing a sharper product offering and achieving higher efficiency. To simplify operations, lower costs and increase focus
Our focus on innovation to improve the consumer experience and our high cost efficiency are key competitive assets. Combined with price increases these had positive impact on operating income (EBIT), but could not fully compensate for the strong headwind we faced, primarily from raw material and currency.
Operating income excl. non-recurring items in 2018 was SEK 6,653m (7,407), corresponding to a margin of 5.4% (6.1).
0
2
4
6
8
18171615140
2
4
6
8
SEKbn %
EBIT2017
EBIT2018
Organiccontribution
Rawmaterial& tariffs
Costefficiency
Currency Acq/Divest
SEKbn
0
2
4
6
8
10
6.77.4
1.5
-2.0
0.8
-0.9 -0.1
0
2
4
6
8
18171615140
2
4
6
8
SEKbn %
EBIT2017
EBIT2018
Organiccontribution
Rawmaterial& tariffs
Costefficiency
Currency Acq/Divest
SEKbn
0
2
4
6
8
10
6.77.4
1.5
-2.0
0.8
-0.9 -0.1
operating income bridge1)earnings development1)
1) Operating income excluding non-recurring items.
“We reported strong organic sales growth in EMEA and continued to
gain market shares.”
ELECTROLUX ANNUAL REPORT 2018
6 CEO statement

Taste, 69% Care, 21% Wellbeing, 10%
WellbeingBy making it possible to achieve healthy wellbeing in your home. Electrolux vacuum cleaners, air-conditioning equipment, water heaters, heat pumps, small domestic appliances, and accessories are sold to consumers worldwide. We have a strong, global distribution network and an attrac-tive product offering, including service.
In the Wellbeing segment in 2018, we launched the ground-breaking cordless vacuum cleaner Electrolux Pure F9 that uses powerful battery technology and innovative design to combine the performance of a traditional vacuum cleaner with the freedom of a stick vacuum.
Care By making it possible to care for your clothes so they stay new for longer. Washing machines and tumble dryers are the core of our product offering for washing and garment care. Demand is driven by innovations that promote user-friendliness and resource efficiency.
Care innovations in 2018 included the development of a new sensor system that enables tumble dryers to sense when clothes are perfectly dry.
Taste By making it possible to make great-tasting food. We sell cookers, hobs, ovens, hoods, micro-wave ovens, refrigerators, freezers and dish-washers for households and professional kitchens throughout the world. Electrolux is a leader in kitchen appliances and new func-tionalities are continuously being developed.
In 2018, Taste innovations included the new SenseProbe induction hob with sous-vide and a world-first wireless and battery-less probe, that provides precise and automated assis-tance when cooking, and the AEG UltraFresh+ fridge-freezer, with smart cooling technology that automatically regulates the perfect environment for food.
AEG SenseProbe
Pure F9 cordless vacuum cleaner
Three clear areas for innovation
share of group sales
Electrolux PerfectCare 900
CEO statement 7

return on net assetscapital turnover-rateoperating margin
In 2018, operating income included non-recurring items of SEK -1,343m.
Reducing the amount of capital tied up in opera-tions creates opportunities for profitable growth.
Sustained profitability and a small, efficient capital base enable us to achieve a high long-term return on capital.
on the most profitable products, we reduced the number of products by about 50%.
The ongoing cost-efficiency initiatives in Latin America continued to be effective and an important phase of the re-engineering of the freezer/fridge plant in Curitiba was concluded. Investments in manufacturing re-engineering play a key role in driving prof-itable growth. Macroeconomic turbulence impacting currencies had a negative impact,
along with raw material cost. This was offset by price increases, mix improvements and higher cost efficiency.
In Asia/Pacific, organic sales growth was driven largely by two-digit profitable growth in laundry and food preparation in Southeast Asia, offering products tailored to specific consumer needs in these regions. For example, cold water technology in washing machines enables consumers in Indonesia
to get perfectly cleaned clothes despite electricity limitations. However, operating income declined as currency headwinds and increased cost for raw material were not fully offset by higher sales volumes and mix improvements.
In line with its strategy, Home Care & SDA was in a product transition phase with lower volumes as a consequence. The shift in market demand toward cordless vacuums
Targets1)
1817161514
25,166 24,848
20,957
14.211.0
29.9
Average net assets, SEKm Return on net assets, %
36.0
20,57222.7
23,381
Target>20%
1817161514
4.5 5.05.9
5.3
Capital turnover-rate, times
5.8
Target≥4 times
1817161514
3,581
2,741
6,274
3.2
2.2
5.2
Operating income, SEKm Operating margin, %
6.1
4.3
7,407
5,310
Target≥6%
Frigidaire Gallery Black Stainless Suite
1) Financial targets are over a business cycle.
ELECTROLUX ANNUAL REPORT 2018
8 CEO statement

sales growth employee engagement sustainability
In 2017, a mini survey was carried out to monitor the teams with low scores in previous surveys. The survey showed progress.
To reach the growth target, we are continuing to strengthen our positions in core markets, new markets and segments.
The employee engagement survey (EES) is an important tool to assess engagement, leader-ship and commitment to strategy.
Sustainability leadership is a key business driver and important to realizing the Electrolux strategy for profitable growth.
accelerated, and I am therefore very pleased to see that we strengthened our offering with the launch of the ground-breaking premium cordless vacuum cleaner Pure F9. The business area completed its product portfolio review after divesting the North American commer-cial and central vacuum cleaner businesses.
An improved product mix contributed positively to earnings.
Professional Products continued its prof-itable growth journey based on product innovation and increased market coverage. The new laundry line launched in 2018 uses cutting-edge innovations and connectivity
solutions to maximize uptime and best-in-class energy savings. Acquisitions strength-ened the beverage offering and added functional sales expertise through laundry rental services. Earnings remained solid.
1817161514
25,166 24,848
20,957
14.211.0
29.9
Average net assets, SEKm Return on net assets, %
36.0
20,57222.7
23,381
1817161514
112,143123,511 121,093
1.12.2 -1.0
Net sales, SEKm Sales growth, %1)
0.51.7
120,771 124,129
Target≥4%
18–161514
59
6467
72
Engagement index
Target80
181716-05
Product use ManufacturingGreenhouse gas Transport
Target1)
-50%
Electrolux is investing approximately USD 250m in the Anderson facility to drive profitable growth in North America with new lines of innovative Frigidaire refrigerator and freezer products. The investment will increase efficiency through automation and modularized products. The automation level will be significantly higher; from below 10% to around 35%.
Learn more on Electrolux Annual Review 2018 at:www.electroluxgroup.com/annualreports/2018
Increase competitiveness in the U.S. through factory re-engineering
1) Reduce CO₂ impact by 50% in 2020 focusing on product efficiency in the main product categories. Sales volumes and emission factors are normalized to 2005.
1) Total sales growth excluding currency translation effects.
case studies – profitable growth
CEO statement 9
ELECTROLUX ANNUAL REPORT 2018

Well positioned to benefit from global trends Electrolux is operating in a global market that is being transformed by a number of important trends. A key trend is the rise of consumer power. I am therefore convinced that our consumer-focused business model gives us a competitive advantage in today’s market where the consumers are very well informed about their options. Our experience innovation and brand/product focus are therefore specifically tailored to appeal to targeted consumer segments and needs. As a global business with local presence in regions like Africa, Middle East, Eastern Europe, Latin America and Southeast Asia, we have opportunities to leverage the continued rapid growth of the global middle class. Along with digitalization and sustain-ability, these trends necessitate significant investments and drive industry consolidation.
With our leadership in sustainability and our re-engineering investments, Electrolux is well positioned to drive growth.
How to achieve profitable growthElectrolux has a clear strategy to deliver profitable growth and create shareholder value. We define profitable growth as sales growth of at least 4% and an operating margin of at least 6% over a business cycle. At the heart of our strategy is a strong con-sumer focus. I firmly believe that to achieve our targets, we first need to offer outstanding consumer experiences and, with our deep understanding of consumer needs, we are well positioned to do so. We will continue to use our global strength to support invest-ments in consumer-driven product innova-tion, and over the past number of years we have successfully sharpened our brands AEG and Frigidaire to target specific consumer
segments and trends. The Electrolux brand is now being sharpened in a similar way.
A clear consumer focus Innovation is crucial to our continued suc-cess, especially in an industry where the consumers have the power. I am very proud that we launched a large number of new innovative products in 2018. Successful launches of new products under premium brands contributed to an improved product mix, and we continue to invest in R&D to develop new generations of products under well-established brands with a clear proposi-tion. Product development focuses on three main areas to offer outstanding consumer experiences: great-tasting food, care for clothes and healthy wellbeing in the home, see page 7.
trendsThe increasing pace of change in the global market stems from a number of trends that
influence volumes and the types of products that are in demand, but also how these products
are produced, marketed and sold.
Consumer power
Digitalization
Sustainability
Trendsin our
industry
Consolidation
Growing global
middle class
Trends in our industry
ELECTROLUX ANNUAL REPORT 2018
10 CEO statement

Increased competitivenessIt is in our DNA to continuously strive to further improve efficiency and quality across the organization, from production to adminis-tration. Our global product architecture and automation program strengthens competi-tiveness and increases flexibility and product speed to market. In 2018, we implemented some elements of our re-engineering pro-grams, in which we expect to invest a total of SEK 8bn over a 4–5 year period, starting in 2018. These investments will drive growth through the manufacture of innovative prod-ucts as well as strong cost improvements. Teamship is essential to successfully launch new, innovative products, meet operational excellence targets and move toward prof-itable growth. A clear company purpose and culture that promote engagement and attract talents is also key.
Future driversEmerging markets acceleration, digitization and sustainability are key drivers that we focus on to strengthen our competitiveness going forward. We see an opportunity to target the global emerging markets with a clear market positioning, targeted product platforms and innovation road map. During the year, we announced the merger of the two organiza-tions within APAC and MEA, which are regions with similar market dynamics and this will position Electrolux well to drive future growth.
Digital manufacturing helps us minimize product cost while maximizing quality and flexibility. Through connected appliances, digitalization is a key tool to create new con-sumer experiences and innovations at dif-ferent stages - from exploring alternatives to using the product. Importantly, it also enables us to be in closer contact with the consumer throughout the lifespan of the product.
I am very proud that Electrolux remains a sustainability leader in the appliance indus-try. This is crucial as sustainability is increas-ingly important to consumers, and therefore a key driver of demand. Efficient sustainable operations also help reduce cost. For the past 17 years, Electrolux has been a signatory of the UN Global Compact, and we are recog-nized as industry leader in the prestigious Dow Jones Sustainability Index.
Stability &Focus
Sustainable Profitability
Targeted Growth
Profitable Growth
1 2 3
electrolux business modell
To achieve the Group’s purpose – Shape living for the better – and drive profitable growth, Electrolux uses a business model that focuses on creating Outstanding Consumer Experiences.
Electrolux applies a three-step model for all business areas. It starts with ensuring stability and predictability in all key processes in combination with clear focus. In the second step, the business model has resilience to external factors and clear competitive advantages that enable profitability over time. The third step is to accelerate growth in a targeted way.
Emerging Markets Acceleration
Sustainable Development
Branded Star Products
with Preferred Partners
Engaging Ownership& Quality
Experience
Taste, Care & Wellbeing Innovation
Outstanding Consumer
Experiences
Digital Transformation
Talent, Teamship & Continuous Improvement
Operational Excellence
path to profitable growth
Focused strategy for profitable growth
“Sustainability is increasingly important to consumers, and therefore a key driver of demand.”
A clear consumer focus sets us apart
Execution to increase competitiveness
With drivers that prepare us for the future
CEO statement 11
ELECTROLUX ANNUAL REPORT 2018

For several years, the business area Major Appliances EMEA consistently focused on induction hob innovation as an important profitable growth area. Based on consumer insights and in-house developed technology, Electrolux has been able to outpace the high market growth in this built-in kitchen segment and has increased its European market share by more than 5 percentage points over the past ten years. Induction is a true star product with high margins and strong growth prospects.
Learn more on Electrolux Annual Review 2018 at: www.electroluxgroup.com/ annualreports/2018
Electrolux identified a potential to grow profitably in the premium laundry cat-egory in Europe under the AEG brand, with the help of a sharpened brand and product offering. Investment in focused innovation based on consumers’ Care habits led to the launch of a new gener-ation of AEG laundry products. A clear understanding of consumer relevance inherent in the development process resulted in increased market shares and outstanding consumer experience ratings across Europe. One year after the launch for the AEG brand in Europe, operating income (EBIT) in premium laundry increased by >30% and the price index for laundry increased by 7.5 per-centage points. This is a clear example of how we execute our profitable growth strategy.
Learn more on Electrolux Annual Review 2018 at: www.electroluxgroup.com/annualreports/2018
How premium laundry added >30% EBIT improvement
Induction focus accelerates profitable growth in EMEA
case studies – profitable growth
case studies – profitable growth
ELECTROLUX ANNUAL REPORT 2018
12 CEO statement

Acquisitions drive growthAcquisitions are integral to the efforts to strengthen and expand our product offering and drive profitable growth. In 2018, we acquired Schneidereit, a German supplier of laundry rental solutions for professional cus-tomers. This enables us to develop our func-tional sales offering and drive aftermarket sales. We also acquired SPM Drink Systems, an Italian leading manufacturer of primarily professional dispensers of frozen beverages. The acquisition is part of the strategy to strengthen our full-service offering for the professional market.
Well positioned to create valueThe expertise and commitment of our employees remain crucial to our success,
and I would like to thank all our employees for their important contributions throughout the year.
In 2019, Electrolux will turn 100. This means that we have been reinventing what great taste, care and wellbeing experiences mean for our consumers for a century. In doing so, we have enhanced the quality of life for hundreds of millions of people around the world. Our journey toward profitable growth continues in 2019 and beyond. A strong focus on consumer experience innovation and sharpened brands will remain a vital driver in order to improve the mix. Modularized prod-ucts produced in automated production with a digital global supply chain are important to increase cost efficiency and flexibility. Growth is further supported by a healthy cash flow
generation and our strong balance sheet. I am confident that we are well positioned with the right business focus in this challeng-ing cost environment to continue to deliver shareholder value.
Stockholm, February 2019
Jonas SamuelsonPresident and CEO
Key areas to drive profitable growth
Strong focus on consumer experience innovation through focused brands that drive mix Focused and innovative product portfolio with proven consumer benefits Well-established brands with strong innovation heritage Leading position in targeted areas Leading position in sustainability is growing sales and lowering cost Clear strategy to increase aftermarket sales
Modularized products in automated production with digitally integrated global supply chain Strong track record of delivering cost reductions Global product architecture and automation program is instrumental to continue drive cost efficiency
Global presence offers economies of scale
Healthy cash flow generation and a strong balance sheet supporting further growth Strong balance sheet and firepower offer growth opportunities Healthy cash flow generation Increasing earnings stability through product mix and cost efficiency
CEO statement 13
ELECTROLUX ANNUAL REPORT 2018

Taking the next steps to accelerate profitable growth
During the past years, Electrolux have made many improvements in terms of focusing its brands and product offering on consumer experience innovation as well as invested in modularization and automation. This has resulted in a substantial improvement of Electrolux performance in 2017 and 2018. In 2019, Electrolux turns 100 and is now taking the next step to accelerate profitable growth with the announcements in the beginning of 2019 that work has been initiated to prepare a separation of the Professional Products business area and the creation of a sharper and more focused consumer business.
Separating Electrolux Professional aiming to create substantial shareholder value The Electrolux Board of Directors announced on January 31, 2019, they had initiated work intending to propose that a share-holders meeting decides to split the Group into two listed com-panies, “Electrolux” for household appliances and “Electrolux Professional” for professional appliances. The Board of Directors believes that such a split has the potential to create substantial shareholder value over time, given that the two businesses have different end markets, customers and success drivers. A split will enable both companies to focus on their respective oppor-tunities to drive profitable growth, with distinct strategies for innovation and customer focus, as well as a high level of capital efficiency. The separation costs are expected to be relatively low.
If the shareholders decide in favor of such a proposal, AB Electrolux shareholders will receive shares in Electrolux Professional in proportion to their shareholding in AB Electrolux. The intention is to list Electrolux Professional on Nasdaq Stockholm during the first half of 2020. The Board expects to provide an update on the preparations and a more detailed time plan around mid-year 2019.
Electrolux Professional: creating shareholder value as a stand-alone company• The only supplier with a full and integrated hospitality
industry offer under one brand – Pursuing further market leadership through innovation
and organic and M&A driven expansion into new segments• Global footprint in a resilient, steadily growing underlying
end market• Attractive financial profile with good growth and margin
potential – Increased agility to leverage market and M&A opportunities
as a stand-alone company• Unlocking shareholder value through fair stock market
valuation
Sharpened and more focused consumer business to accelerate profitable growthAs Electrolux now becomes even more focused on the consumer business, there are tremendous opportunities to drive profitable growth. This will be done by accelerating innovation in the key experience areas, developing the aftermarket presence through a world-class ownership solutions offering and leveraging the continued digital evolution of the marketplace. An organization with four consumer-focused business areas and strong global capabilities both in the front and back end of the operations will enable Electrolux to deliver in these areas. Electrolux finan-cial targets will remain unchanged following a separation of Professional Products.
Four regional consumer business areas Electrolux is revising its business area structure to create four consumer-focused regional business areas, ensuring a unified approach to each market with common branded platforms and interactions with consumers. This means the Home Care & SDA business area, currently responsible for Electrolux offering of vacuum cleaners and other products for wellbeing in the home, is being combined with the four current major appliances business areas.
• Unified approach with common branded platforms and interactions with consumers
• Leverage new business models, digital transformation and evolving routes to market
• Accelerate emerging markets consumer value proposition to drive growth
Creating a global function for Consumer Experiences To accelerate product and ownership experience innovation, Electrolux is also pulling together central functions focused on consumer experiences into a new organizational structure, headed by a Group Chief Experience Officer. This organization is globally responsible for areas such as marketing, design, prod-uct lines, digital consumer solutions and ownership experience.
• Accelerate product and ownership innovation • Translating experience innovation into brand storytelling
and product design• Drive connected ownership solutions for aftermarket growth
ELECTROLUX ANNUAL REPORT 2018
14 Taking the next steps to accelerate profitable growth

–
Some of the information previously included in the Annual Report can now be found in the Electrolux Annual Review 2018, accessible on all your
digital platforms. The Annual Review includes comprehensive information about business development, strategy for profitable growth, business areas as well
as profitable growth case studies.
Please visit: www.electroluxgroup.com/annualreports/2018
Electrolux Annual Review 2018VISIT OUR ONLINE REPORT

Report by the Board of Directors

• Net sales increased to SEK 124,129m (120,771).
• Organic sales grew by 1.3%, contribution from acquisitions/divestments was 0.4% and currency translation had a positive impact of 1.1%.
• Organic sales growth for Major Appliances EMEA, Major Appliances Latin America, Major Appliances Asia/Pacific and Professional Products.
• Operating income amounted to SEK 5,310m (7,407), corresponding to a margin of 4.3% (6.1).
• Excluding non-recurring items of SEK –1,343m, operating income amounted to SEK 6,653m, corresponding to a margin of 5.4% (6.1).
• Operating cash flow after investments amounted to SEK 3,649m (6,877).
• Income for the period amounted to SEK 3,805m (5,745), corresponding to SEK 13.24 (19.99) per share.
• The Board proposes a dividend for 2018 of SEK 8.50 (8.30) per share, to be paid in two installments.
Report by the Board of Directors
AB Electrolux (publ), 556009–4178Annual Report 2018, page 17–81Sustainability Reporting 2018, page 90–99Corporate Governance Report 2018, page 101–118
Key data seKm 2018 2017 Change, %
Net sales 124,129 120,771 3Sales growth, %1) 1.7 0.5Organic growth, % 1.3 –0.4Acquisitions, % 0.7 1.4Divestments, % –0.3 –0.4Changes in exchange rates, % 1.1 0.2Operating income2) 5,310 7,407 –28Operating margin, % 4.3 6.1Income after financial items 4,887 6,966 –30Income for the period 3,805 5,745 –34Earnings per share, SEK3) 13.24 19.99Dividend per share, SEK 8.504) 8.30Operating cash flow after investments5) 3,649 6,877Return on net assets, % 22.7 36.0Capital turnover-rate, times 5.3 5.9Net debt/equity ratio 0.08 0.01Return on equity, % 18.2 31.9Average number of employees 54,419 55,6921) Change in net sales adjusted for currency translation effects. 2) Operating income for 2018 includes non-recurring items of SEK –1,343m. Excluding these items, operating income amounted to SEK 6,653m corresponding
to a margin of 5.4% (6.1), see Note 7. 3) Basic, based on an average of 287.4 (287.4) million shares for the full year, excluding shares held by Electrolux.4) Proposed by the Board of Directors.5) See page 30.
Board of Directors’ report and financial statements 17
ELECTROLUX ANNUAL REPORT 2018

2018 in summary
• Sales growth was 1.7%, mainly driven by price increases and mix improvements.• Four business areas reported organic sales growth.• Operating income declined to SEK 5,310m (7,407) and includes non-recurring items of SEK –1,343m (0). • Increased prices, mix and cost efficiency partly offset higher input costs, lower volumes and currency
headwinds. • A large number of new innovative products were launched. Schneidereit and SPM Drink Systems
were acquired.
Market overviewMarket demand for core appliances in Europe increased by 1% in 2018. This was driven by strong growth of 7% in Eastern Europe, while demand in Western Europe declined by 1%. In the U.S., market demand for core appliances declined by 1% in 2018, partly related to higher industry prices. Uncertainties in the political and economic environment in Brazil and Argentina impacted market demand negatively why, consumer demand for core appliances is estimated to have decreased in 2018. Consumer demand in Chile is, however, estimated to have increased. Overall market demand for appliances in Australia declined slightly in 2018 due to a weaker economy and slow-ing property market. The market in Southeast Asia remained favorable and is estimated to have increased.
Net sales and operating incomeNet sales for the Electrolux Group increased by 2.8% in 2018. Organic sales increased by 1.3%, the net contribution of acqui-sitions and divestments was 0.4% and currency translation had a positive impact of 1.1%. Organic growth was driven by price increases and mix improvements. Major Appliances EMEA
reported strong organic sales growth as a result of increased sales volumes and product mix improvements. Cost-based price increases and improved mix explain Major Appliances Latin America’s high organic sales growth. Major Appliances Asia/Pacific’s higher sales was a result of strong growth in Southeast Asia while Professional Products grew organically across all three areas food, laundry and beverage.
Lower volumes, primarily under private labels, impacted Major Appliances North America’s sales negatively. Home Care & SDA was in a product transition phase with lower sales volumes as a consequence.
Operating income amounted to SEK 5,310m (7,407), corresponding to a margin of 4.3% (6.1). Operating income include costs of SEK 1,343m, whereof SEK 596m relates to restructuring costs for the consolidation of freezer production in North America, SEK 493m relates to an investigation by the French Competition Authority and SEK 254m to an unfavorable court ruling in France, see Note 7. Excluding these non-recurring items, operating income amounted to SEK 6,653m, correspond-ing to a margin of 5.4% (6.1).
INDUSTRY SHIPMENTS FOR CORE APPLIANCES IN EUROPE
MILLION UNITS
75
80
85
90
95
100
18171615141312111009080706050403
A total of approximately 94 million coreappliances were soldin Europe in 2018,which is about 4%lower than the recordyear of 2007.
INDUSTRY SHIPMENTS FOR CORE APPLIANCES IN THE U.S.
MILLION UNITS
30
34
38
42
46
50
18171615141312111009080706050403
A total of approximately 48 million coreappliances were soldin the U.S. in 2018, which is on par with the top levels in 2005 and 2006.
Sources: Europe: Electrolux estimates, U.S.: AHAM. For other markets there are no comprehensive market statistics.
Financial overview by business areaseKm 2018 2017 Change, %
Net sales 124,129 120,771 3
Operating income Major Appliances Europe, Middle East and Africa 2,220 2,764 –20Major Appliances North America 972 2,757 –65Major Appliances Latin America 464 425 9Major Appliances Asia/Pacific 648 750 –14Home Care & Small Domestic Appliances 398 431 –8Professional Products 1,134 1,054 8Other, Common Group costs, etc. –527 –775 32Total Group 5,310 7,407 –28
Operating margin, % 4.3 6.1
Operating margin excl. non-recurring items, %1) 5.4 6.11) For more information on non-recurring items, see Note 7.
ELECTROLUX ANNUAL REPORT 2018
18 Board of Directors’ report and financial statements

Increased prices, mix and cost efficiency partly offset higher input costs, lower volumes and currency headwinds. The solid earnings trend for Major Appliances EMEA continued and operating income excluding non-recurring items improved as a result of higher volumes, mix improvements and increased cost efficiency. Operating income for Major Appliances Latin America continued to recover and improved mainly due to cost-based price increases. Professional Products reported solid operating income. Home Care & SDA’s operating income was fairly in line with previous year.
Major Appliances North America’s earnings declined due to high cost inflation and lower volumes, which were partly mitigated by price increases and mix improvements. Operating income in Major Appliances Asia/Pacific declined, primarily due to currency headwind.
Strategic initiatives to improve profitabilityElectrolux has a clear strategy to deliver profitable growth and create shareholder value. At the heart of the strategy is a strong consumer focus.
In 2018, Electrolux continued executing on the path to profit-able growth. Mix improved through continued active product portfolio management and a large number of new innovative products designed to deliver outstanding consumer experi-ences were launched. The investments in modularized products in automated production continued. These are important to further increase the competitiveness in order to drive growth through more innovative products as well as lowering costs. Through improved ways of working, a higher resource efficiency and simplification, the cost structure improved. Electrolux also reinforced its position as a sustainability leader in the industry.
Launches of new productsElectrolux aims to drive profitable growth by creating out-standing consumer experiences. Product development focuses on three main areas: great tasting food, care for clothes and healthy wellbeing in the home.
In 2018, Taste innovations included the new SenseProbe induction hob with sous-vide and a world first wireless and battery-less probe, that provides precise and automated
assistance when cooking, and the AEG UltraFresh+ fridge-freezer, with smart cooling technology that automatically regulates the perfect environment for food.
Care innovations in 2018 included the development of a new sensor system that enables tumble dryers to sense when clothes are just enough dry.
In the Wellbeing segment the groundbreaking cordless vacuum cleaner Electrolux Pure F9 was launched in 2018. Pure F9 uses powerful battery technology and innovative design to combine the performance of a traditional vacuum cleaner with the freedom of a stick vacuum.
Acquisitions To broaden the product offering and create a strong platform for growth in new segments and markets, acquisitions are an integrated part of Electrolux strategy. In 2018 Schneidereit, a supplier of laundry rental solutions for professional custom-ers, as well as SPM Drink Systems, which expands Professional Products’ current beverage offering and its role as a fullservice solution provider, were acquired, see page 32 and Note 26.
Changes in Group Management during 2018As of 1 October 2018, the following changes in Group Manage-ment were effective:
Dan Arler, previously Head of Major Appliances Europe, Middle East and Africa (EMEA) and Executive Vice President of AB Electrolux, was appointed Head of Major Appliances APAC & MEA and Executive Vice President of AB Electrolux. Dan Arler suc-ceeded Kenneth L. Ng who decided to retire from the company.
Anna Ohlsson-Leijon, previously Chief Financial Officer (CFO) of AB Electrolux, was appointed Head of Major Appliances Europe and Executive Vice President of AB Electrolux.
Therese Friberg, previously CFO of Major Appliances EMEA, was appointed new CFO of AB Electrolux.
As of 1 January 2019, the major appliances organization in Middle East and Africa (MEA), which has previously been part of Major Appliances Europe, Middle East and Africa (EMEA), is included in Major Appliances Asia/Pacific (APAC). For more information, visit www.electroluxgroup.com
Financial targets over a business cycle
SALES GROWTH
SEKM %
Net salesSales growthTarget: at least 4%
-25,000
0
25,000
50,000
75,000
100,000
125,000
1817161514-2
0
2
4
6
8
10
Total sales growth excluding currency translation effects.
OPERATING MARGIN
SEKM %
Operating incomeOperating marginOperating margin excl. non-recurring itemsTarget: at least 6%
0
1,250
2,500
3,750
5,000
6,250
7,500
18171615140
2
4
6
8
10
12
For non-recurring items included in operating income, see Note 7 and page 88.
CAPITAL TURNOVER-RATE
TIMES
Capital turnover-rateTarget: at least 4 times
0
2
4
6
8
1817161514
RETURN ON NET ASSETS
SEKM %
Average net assetsReturn on net assetsTarget: >20%
0
5,000
10,000
15,000
20,000
25,000
30,000
18171615140
7
14
21
28
35
42
Board of Directors’ report and financial statements 19
ELECTROLUX ANNUAL REPORT 2018

Net sales and income
Net salesNet sales for the Electrolux Group in 2018 amounted to SEK 124,129m (120,771) an increase of 2.8%. Organic sales increased by 1.3%, the net contribution of acquisitions and divestments was 0.4% and currency translation had a positive impact of 1.1%.
Organic growth was driven by price increases and mix improvements. Major Appliances EMEA, Major Appliances Latin America, Major Appliances Asia/Pacific and Professional Products reported organic sales growth, while lower volumes resulted in lower sales for Major Appliances North America and Home Care & SDA.
Operating incomeOperating income for 2018 amounted to SEK 5,310m (7,407), corresponding to a margin of 4.3% (6.1). Operating income include costs of SEK1,343m, whereof SEK 596m relates to restructuring costs for the consolidation of freezer production in North America, SEK 493m relates to an investigation by the French Competition Authority and SEK 254m to an unfavorable court ruling in France. Excluding these non-recurring items, operating income amounted to SEK 6,653m, corresponding to a margin of 5.4% (6.1).
Increased prices, mix and cost efficiency partly offset higher input costs, lower volumes and currency headwinds. Operating income excluding non-recurring items increased for Major Appliances EMEA, Major Appliances Latin America and Professional Products, while Major Appliances North America
and Major Appliances Asia/Pacific reported a decline. Home Care & SDA’s operating income was fairly in line with previous year. For more information on the performance by business area, see page 22–25.
Effects of changes in exchange ratesChanges in exchange rates had a negative impact of SEK 896m on operating income year-over-year. The impact of transaction effects was SEK –1,024m. Translation effects amounted to SEK 128m.
Financial netNet financial items amounted to SEK –423m (–441).
Income after financial itemsIncome after financial items amounted to SEK 4,887m (6,966), corresponding to 3.9% (5.7) of net sales.
TaxesTotal taxes for 2018 amounted to SEK –1,081m (–1,221), corresponding to a tax rate of 22.1% (17.5).
Income for the period and earnings per shareIncome for the period amounted to SEK 3,805m (5,745), corresponding to SEK 13.24 (19.99) in earnings per share before dilution.
• Sales growth was 1.7%, mainly driven by price increases and mix improvements. • Operating income amounted to SEK 5,310m (7,407), corresponding to a margin of 4.3% (6.1).• Excluding non-recurring items of SEK –1,343m, operating income amounted to SEK 6,653m (7,407),
corresponding to a margin of 5.4% (6.1).• Increased prices, mix and cost efficiency partly offset higher input costs, lower volumes and currency
headwinds.• Income for the period amounted to SEK 3,805m (5,745), corresponding to SEK 13.24 (19.99) per share.
NET SALES AND OPERATING MARGIN
SEKM %
Net salesOperating marginOperating margin excl. non-recurring items
0
25,000
50,000
75,000
100,000
125,000
18171615140.0
1.5
3.0
4.5
6.0
7.5
EARNINGS PER SHARE
SEK
0
5
10
15
20
1817161514
ELECTROLUX ANNUAL REPORT 2018
20 Board of Directors’ report and financial statements

Consolidated statement of comprehensive income
seKm note 2018 2017
Net sales 3, 4 124,129 120,771Cost of goods sold 5, 7 –100,908 –95,222Gross operating income 23,221 25,549Selling expenses 5, 7 –12,986 –12,897Administrative expenses 5, 7 –5,101 –5,550Other operating income and expenses 6, 7, 29 177 305Operating income 3, 8 5,310 7,407
Financial items, net 9 –423 –441Income after financial items 4,887 6,966
Taxes 10 –1,081 –1,221Income for the period 3,805 5,745
Items that will not be reclassified to income for the period: Remeasurement of provisions for post–employment benefits 22 –448 1,229Income tax relating to items that will not be reclassified 128 –440
–319 789Items that may be reclassified subsequently to income for the period:Available-for-sale instruments 11, 18 — 1Cash flow hedges 11, 18 –2 95Exchange–rate differences on translation of foreign operations 11 203 –1,224Income tax relating to items that may be reclassified 11 23 –17
224 –1,145Other comprehensive income, net of tax –95 –356Total comprehensive income for the period 3,710 5,389
Income for the period attributable to:Equity holders of the Parent Company 3,805 5,745Non–controlling interests 0 0
Total comprehensive income for the period attributable to:Equity holders of the Parent Company 3,710 5,390Non–controlling interests 0 –1
Earnings per share 20For income attributable to the equity holders of the Parent Company:Basic, SEK 13.24 19.99Diluted, SEK 13.14 19.88
Average number of shares 20Basic, million 287.4 287.4Diluted, million 289.5 289.0
Board of Directors’ report and financial statements 21
ELECTROLUX ANNUAL REPORT 2018

Operations by business area
• Strong organic sales growth and solid underlying earnings in Major Appliances EMEA.• Major Appliances North America negatively impacted by high cost inflation and lower volumes. • High organic sales growth and improved earnings in Major Appliances Latin America. • Major Appliances Asia/Pacific showed strong growth in Southeast Asia but lower
operating income. • Product transition phase for Home Care & SDA with operating income fairly in line with 2017.• Profitable organic growth for Professional Products with solid earnings.
Electrolux operations are organized into six business areas. Within Major Appliances, the business areas are geographically defined, while the business areas Home Care & Small Domestic Appliances and Professional Products are global. The Group’s operations include products for consumers as well as profes-sional users.
Products for consumers comprise major appliances, i.e. refrigerators, freezers, cookers, dryers, washing machines, dishwashers, room air-conditioners and microwave ovens. Floor-care products, water heaters, heat pumps, small domestic appliances as well as consumables, accessories and service are other important areas for Electrolux.
Professional products comprise food-service equipment for hotels, restaurants and institutions, as well as laundry equipment for apartment-house laundry rooms, launderettes, hotels and other professional users and also beverage products.
SHARE OF SALES BY BUSINESS AREA
Major Appliances Europe, Middle Eastand Africa, 34%Major Appliances North America, 31%Major Appliances Latin America, 14%Major Appliances Asia/Pacific, 7%Home Care & Small Domestic Appliances, 6%Professional Products, 7%
ELECTROLUX ANNUAL REPORT 2018
22 Board of Directors’ report and financial statements

Major Appliances Europe, Middle East and AfricaMarket demand in Europe increased by 1% in 2018. This was driven by strong growth of 7% in Eastern Europe, while demand in Western Europe declined by 1%.
Electrolux operations in EMEA reported an organic sales growth of 5.3% in 2018. Product mix improvements and higher sales volumes in the focus areas laundry and built-in kitchen products contributed positively and resulted in market share gains under premium brands. Acquisitions had a positive impact of 1.0% on sales and referred to the 2017 acquisitions Kwikot and Best.
Operating income included non-recurring costs of SEK 747m, whereof SEK 493m related to an investigation by the French Competition Authority and SEK 254m to an unfavorable court ruling in France, see Note 7. Excluding these costs, operating income improved. Higher volumes, mix improvements and increased cost efficiency offset the negative impact of raw material cost increases and currency headwinds.
Major Appliances North America Market demand for core appliances in the U.S. declined by 1% in 2018, partly related to higher industry prices. Market demand for all major appliances, including microwave ovens and home-comfort products, was flat.
Electrolux operations in North America reported an organic sales decline of 6.2%. Lower sales volumes under private labels as well as of air conditioners had a negative impact on sales. Sears, a major private label customer, filed for restructuring
under Chapter 11 in October. Cost-based price increases and mix improvements contributed positively to sales.
Operating income and margin declined due to lower volumes and increased costs related to raw material, logistics and trade tariffs. Cost-based price increases and mix improvements had, however, a positive earnings impact. Restructuring costs of SEK 596m for the consolidation of freezer production in North America were charged to operating income, see Note 7.
KEY FIGURES
seKm 2018 2017
Net sales 38,875 40,656Organic growth, % –6.2 –6.1Operating income 972 2,757Operating margin, % 2.5 6.8Operating margin excl. non-recurring items, %1) 4.0 6.8Net assets 2,395 2,117Return on net assets, % 37.7 123.7Capital expenditure 2,071 1,467
Average number of employees 12,971 14,2551) For information on non-recurring items, see Note 7 and page 88.
SEKM %
Net salesOperating marginOperating marginexcl. non-recurring items
0
10,000
20,000
30,000
40,000
50,000
18171615140
2
4
6
8
10
KEY FIGURES
seKm 2018 2017
Net sales 42,732 38,524Organic growth, % 5.3 0.6Acquisitions, % 1.0 2.1Operating income 2,220 2,764Operating margin, % 5.2 7.2Operating margin excl. non-recurring items, %1) 6.9 7.2Net assets 3,392 3,538Return on net assets, % 55.4 78.9Capital expenditure 1,621 1,420Average number of employees 20,725 20,5731) For information on non-recurring items, see Note 7 and page 88.
NET SALES AND OPERATING MARGIN
SEKM %
Net salesOperating margin
0
10,000
20,000
30,000
40,000
50,000
18171615140.0
1.5
3.0
4.5
6.0
7.5
Operating marginexcl. non-recurring items
NET SALES AND OPERATING MARGIN
Board of Directors’ report and financial statements 23
ELECTROLUX ANNUAL REPORT 2018
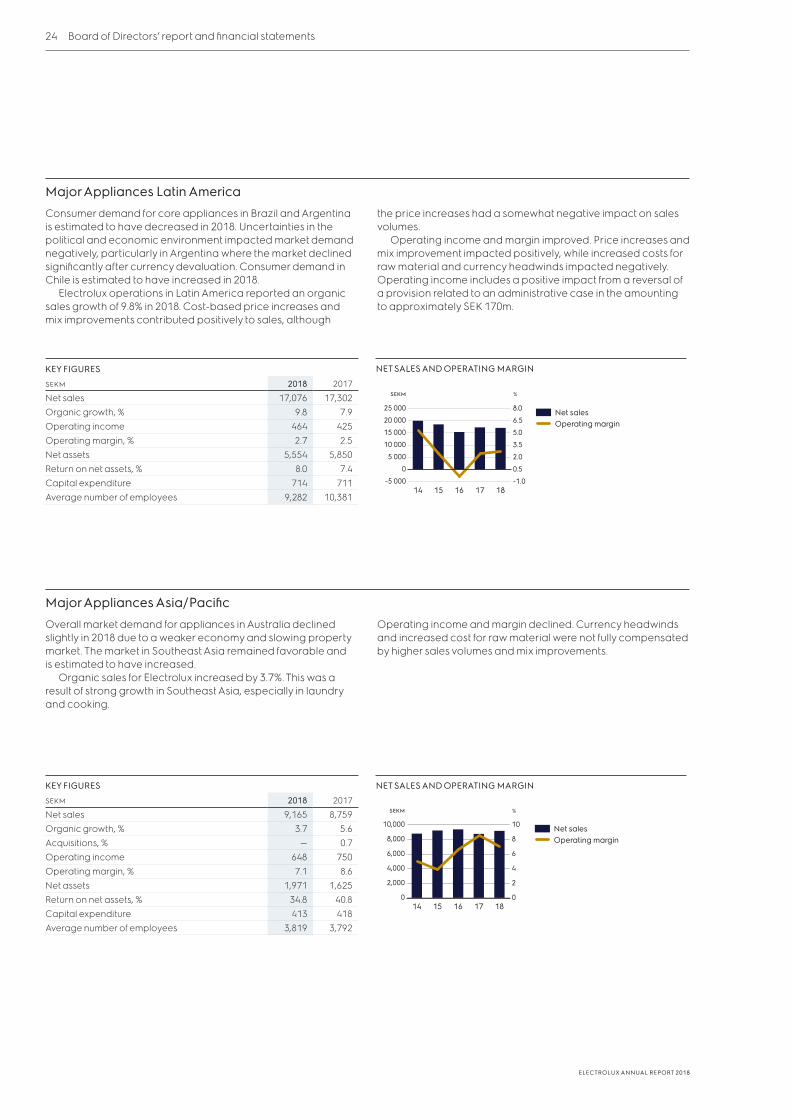
Major Appliances Latin AmericaConsumer demand for core appliances in Brazil and Argentina is estimated to have decreased in 2018. Uncertainties in the political and economic environment impacted market demand negatively, particularly in Argentina where the market declined significantly after currency devaluation. Consumer demand in Chile is estimated to have increased in 2018.
Electrolux operations in Latin America reported an organic sales growth of 9.8% in 2018. Cost-based price increases and mix improvements contributed positively to sales, although
the price increases had a somewhat negative impact on sales volumes.
Operating income and margin improved. Price increases and mix improvement impacted positively, while increased costs for raw material and currency headwinds impacted negatively. Operating income includes a positive impact from a reversal of a provision related to an administrative case in the amounting to approximately SEK 170m.
Major Appliances Asia/PacificOverall market demand for appliances in Australia declined slightly in 2018 due to a weaker economy and slowing property market. The market in Southeast Asia remained favorable and is estimated to have increased.
Organic sales for Electrolux increased by 3.7%. This was a result of strong growth in Southeast Asia, especially in laundry and cooking.
Operating income and margin declined. Currency headwinds and increased cost for raw material were not fully compensated by higher sales volumes and mix improvements.
NET SALES AND OPERATING MARGIN
SEKM %
Net salesOperating margin
-5 000
0
5 000
10 000
15 000
20 000
25 000
1817161514-1.0
0.5
2.0
3.5
5.0
6.5
8.0
KEY FIGURES
seKm 2018 2017
Net sales 17,076 17,302Organic growth, % 9.8 7.9Operating income 464 425Operating margin, % 2.7 2.5Net assets 5,554 5,850Return on net assets, % 8.0 7.4Capital expenditure 714 711Average number of employees 9,282 10,381
NET SALES AND OPERATING MARGIN
SEKM %
Net salesOperating margin
0
2,000
4,000
6,000
8,000
10,000
18171615140
2
4
6
8
10
KEY FIGURES
seKm 2018 2017
Net sales 9,165 8,759Organic growth, % 3.7 5.6Acquisitions, % — 0.7Operating income 648 750Operating margin, % 7.1 8.6Net assets 1,971 1,625Return on net assets, % 34.8 40.8Capital expenditure 413 418Average number of employees 3,819 3,792
ELECTROLUX ANNUAL REPORT 2018
24 Board of Directors’ report and financial statements

Home Care & Small Domestic AppliancesIn 2018, the overall market for vacuum cleaners increased, driven by the cordless category, while demand for the corded category declined. The trend shift in market demand toward cordless products accelerated.
Organic sales for Electrolux declined by 1.1%. The product mix improved as a result of active product portfolio manage-ment while sales volumes declined, mainly related to lower sales volumes of corded vacuum cleaners. The 2017 acquired smart kitchen appliance company Anova had a positive impact of 0.7% on sales while the divestment of the commercial and
central vacuum-cleaner businesses in North America in 2018 had a negative impact of –5.4%.
Operating income and margin were fairly in line with previous year. A strategic decision to focus the business on the strongest categories improved the mix which contributed to earnings. The business area was still in a product transition phase with lower volumes and higher investments in new product launches as a consequence.
In 2018, the commercial and central vacuum-cleaner businesses in North America were divested, see page 32.
Professional ProductsOverall market demand for professional food-service and professional laundry equipment improved across most regions in 2018. Demand increased in Europe and Asia, while it declined in North America.
Electrolux organic growth was 3.5%. Sales increased across all three areas food, laundry and beverage. Sales grew in several markets and were particularly strong in Europe, North America, Middle East and Africa. Acquisitions had a posi-tive impact of 4.7% on sales and refer to the acquisitions of
Schneidereit and SPM Drink Systems in 2018 as well as the 2017 acquisition of Grindmaster-Cecilware.
Operating income remained solid. Price increases and higher sales volumes offset increased cost for raw material and addi-tional investments in customer care and innovation.
In 2018 Schneidereit, a supplier of laundry rental solutions for professional customers, as well as SPM Drink Systems were acquired, which expands Professional Products’ current bever-age offering and its role as a fullservice solution provider, see page 32.
NET SALES AND OPERATING MARGIN
SEKM %
Net salesOperating margin
-2,000
0
2,000
4,000
6,000
8,000
10,000
1817161514-2
0
2
4
6
8
10
Operating marginexcl. non-recurring items1)
KEY FIGURES
seKm 2018 2017
Net sales 7,616 7,808Organic growth, % –1.1 –4.2Acquisitions, % 0.7 4.7Divestments, % –5.4 –6.6Operating income 398 431Operating margin, % 5.2 5.5Net assets 2,410 1,822Return on net assets, % 18.3 30.1Capital expenditure 249 190Average number of employees 3,042 2,360
NET SALES AND OPERATING MARGIN
SEKM %
Net salesOperating margin
0
2,000
4,000
6,000
8,000
18171615140
4
8
12
16
KEY FIGURES
seKm 2018 2017
Net sales 8,666 7,723Organic growth, % 3.5 5.6Acquisitions, % 4.7 6.6Operating income 1,134 1,054Operating margin, % 13.1 13.7Net assets 2,957 1,728Return on net assets, % 45.9 64.3Capital expenditure 169 167Average number of employees 3,166 2,947
1) For information on non-recurring items, see Note 7 and page 88.
Board of Directors’ report and financial statements 25
ELECTROLUX ANNUAL REPORT 2018

Financial position
• Equity/assets ratio was 25.6% (26.4).• Return on equity was 18.2% (31.9).• Return on net assets was 22.7% (36.0).• Financial net cash position amounted to SEK 1,989m (2,437).
Working capital and net assets Working capital as of December 31, 2018 amounted to SEK –16,848m (–15,873), corresponding to –13.5% (–13.4) of annualized net sales. Operating working capital amounted to SEK 3,789m (4,288), corresponding to 3.0% (3.6) of annualized net sales.
Average net assets were SEK 23,381m (20,572), corresponding to 18.8% (17.0) of annualized net sales.
Return on net assets was 22.7% (36.0).
Working capital and net assets
seKmDec. 31,
2018
% of net
sales1)Dec. 31,
2017
% of net
sales1)
Inventories 16,750 13.5 14,655 12.4Trade receivables 21,482 17.3 20,747 17.5Accounts payable –34,443 –27.7 –31,114 –26.3Operating working capital 3,789 3.0 4,288 3.6Provisions –7,565 –7,823Prepaid and accrued income and expenses –11,745 –11,038Taxes and other assets and liabilities –1,327 –1,300Working capital –16,848 –13.5 –15,873 –13.4Property, plant and equipment 21,088 19,192Goodwill 8,239 7,628Other non-current assets 5,516 4,749Deferred tax assets and deferred tax liabilities 5,580 4,981Net assets 23,574 19.0 20,678 17.5Annualized net sales2) 124,399 118,464Average net assets 23,381 18.8 20,572 17.0
Annualized net sales3) 124,129 120,771Return on net assets, % 22.7 36.01) Annualized, see Note 30.2) Calculated at end of period exchange rates.3) Calculated at average exchange rates.
Liquid funds
Liquidity profileseKm Dec. 31, 2018 Dec. 31, 2017
Liquid funds 12,249 11,974% of annualized net sales1) 18.1 17.0Net liquidity 8,187 9,024Fixed interest term, days 12 16
Effective annual yield, % 1.1 1.81) Liquid funds in relation to net sales, see note 30 for definition.For additional information on the liquidity profile, see Note 18.
Liquid funds as of December 31, 2018, amounted to SEK 12,249m (11,974), excluding back-up credit facilities. Electrolux has an unused committed back-up multi- currency revolving credit facility of EUR 1,000m, approximately SEK 10,300m, expiring 2023.
RETURN ON NET ASSETS
SEKM %
Average net assetsReturn on net assets
0
5,000
10,000
15,000
20,000
25,000
30,000
18171615140
7
14
21
28
35
42
Average net assets for 2018 increased to SEK 23,381m (20,572). Return on net assets was 22.7% (36.0).
CAPITAL TURNOVER-RATE, TIMES/YEAR
TIMES
Capital turnover-rate
0
2
4
6
8
1817161514
The capital turnover-rate decreased to 5.3 (5.9) times in 2018.
ELECTROLUX ANNUAL REPORT 2018
26 Board of Directors’ report and financial statements

seKm note December 31, 2018 December 31, 2017
ASSETSNon-current assetsProperty, plant and equipment 12 21,088 19,192Goodwill 13 8,239 7,628Other intangible assets 13 3,919 3,741Investments in associates 29 397 337Deferred tax assets 10 6,448 5,712Financial assets 18 246 212Pension plan assets 22 532 455Other non-current assets 14 952 459Total non-current assets 41,822 37,736
Current assetsInventories 15 16,750 14,655Trade receivables 17, 18 21,482 20,747Tax assets 738 830Derivatives 18 139 87Other current assets 16 4,507 3,839Short-term investments 18 176 358Cash and cash equivalents 18 11,697 11,289Total current assets 55,490 51,806Total assets 97,312 89,542
EQUITY AND LIABILITIESEquity attributable to equity holders of the Parent CompanyShare capital 20 1,545 1,545Other paid-in capital 20 2,905 2,905Other reserves 20 –2,394 –2,615Retained earnings 20 19,683 18,630
21,738 20,465Non-controlling interests 11 14Total equity 21,749 20,480
Non-current liabilitiesLong-term borrowings 18 6,198 6,587Deferred tax liabilities 10 868 730Provisions for post-employment benefits 22 4,346 3,089Other provisions 23 5,281 5,753Total non-current liabilities 16,693 16,159
Current liabilitiesAccounts payable 18 34,443 31,114Tax liabilities 984 924Other liabilities 24 17,105 15,849Short-term borrowings 18 3,952 2,695Derivatives 18 102 251Other provisions 23 2,284 2,070Total current liabilities 58,870 52,903Total liabilities 75,563 69,062Total equity and liabilities 97,312 89,542
Consolidated balance sheet
Board of Directors’ report and financial statements 27
ELECTROLUX ANNUAL REPORT 2018

Cont. Financial position
Net debt
Net debtseKm Dec. 31, 2018 Dec. 31, 2017
Short-term loans 1,429 990Short-term part of long-term loans 2,355 1,501Trade receivables with recourse 168 204Short-term borrowings 3,952 2,695Financial derivative liabilities 81 228Accrued interest expenses and pre-paid interest income 28 27Total short-term borrowings 4,062 2,950Long-term borrowings 6,198 6,587Total borrowings1) 10,260 9,537
Cash and cash equivalents 11,697 11,289Short-term investments 176 358Financial derivative assets 132 84Prepaid interest expenses and accrued interest income 243 242Liquid funds2) 12,249 11,974
Financial net debt –1,989 –2,437Net provisions for post-employment benefits 3,814 2,634Net debt 1,825 197
Net debt/equity ratio 0.08 0.01Total equity 21,749 20,480Equity per share, SEK 75.67 71.26Return on equity, % 18.2 31.9Equity/assets ratio, % 25.6 26.41) Whereof interest-bearing liabilities amounting to SEK 9,982m as of December 31, 2018
and SEK 9,078m as of December 31, 2017.
As of December 31, 2018, Electrolux had a net financial cash position of SEK 1,989m compared to the net financial cash posi-tion of SEK 2,437m as of December 31, 2017. Net provisions for post-employment benefits increased to SEK 3,814m. In total, net debt amounted to SEK 1,825m, an increase by SEK 1,628m compared to SEK 197m as of December 31, 2017.
Long-term borrowings as of December 31, 2018, includ-ing long-term borrowings with maturities within 12 months, amounted to SEK 8,553m with average maturity of 2.6 years, compared to SEK 8,088m and 2.4 years at the end of 2017.
During 2019, long-term borrowings amounting to approxi-mately SEK 2,400m will mature.
The Group’s target for long-term borrowings includes an average time to maturity of at least two years, an even spread of maturities and an average interest-fixing period between 0 and 3 years. A maximum of SEK 5,000m of the long-term borrowings is allowed to mature in a 12-month period. At year-end, the average interest- fixing period for long-term borrowings was 1.0 years (0.6).
At year-end, the average interest rate for the Group’s total interest-bearing borrowings was 2.5% (2.1).
RatingElectrolux has an investment-grade rating from Standard & Poor’s, A- with a stable outlook.
RatingLong-term
debt OutlookShort-
term debtShort-term
debt, Nordic
Standard & Poor’s A- Stable A-2 K-1
Net debt/equity and equity/assets ratioThe net debt/equity ratio was 0.08 (0.01). The equity/assets ratio was 25.6% (26.4).
Equity and return on equityTotal equity as of December 31, 2018, amounted to SEK 21,749m (20,480), which corresponds to SEK 75.67 (71.26) per share. Return on equity was 18.2% (31.9).
In 2019, long-term borrowings in the amount of approximately SEK 2,400m will mature. For information on borrowings, see Note 2 and 18.
LONG-TERM BORROWINGS, BY MATURITY
SEKM
0
500
1,000
1,500
2,000
2,500
3,000
24-2322212019
NET DEBT/EQUITY RATIO1) EQUITY/ASSETS RATIO1)
-0.10.00.10.20.30.40.50.60.70.8
18171615141312111009
%
0
10
20
30
40
50
18171615141312111009
1) Both ratios were significantly affected from 2012 and onwards by the changed pension accounting from the updated IAS 19 Employee Benefits.
ELECTROLUX ANNUAL REPORT 2018
28 Board of Directors’ report and financial statements

Attributable to equity holders of the parent company
seKmShare
capital
Other paid-in capital
Other reserves
Retained earnings Total
Non- controlling
interestsTotal
equity
Opening balance, January 1, 2017 1,545 2,905 –1,471 14,729 17,708 30 17,738
Effect from change in accounting principles — — — –126 –126 — –126Adjusted opening balance 1,545 2,905 –1,471 14,603 17,582 30 17,612Income for the period — — — 5,745 5,745 0 5,745Available for sale instruments — — 1 — 1 — 1Cash flow hedges — — 95 — 95 — 95Exchange differences on translation of foreign operations — — –1,222 — –1,222 –1 –1,223Remeasurement of provisions for post-employment benefits — — — 1,229 1,229 — 1,229Income tax relating to other comprehensive income — — –17 –440 –457 — –457Other comprehensive income, net of tax — — –1,143 789 –354 –1 –355Total comprehensive income for the period — — –1,143 6,534 5,391 –1 5,389Share-based payments — — — –356 –356 — –356Dividend — — — –2,155 –2,155 0 –2,155Acquisition of non-controlling interest — — — 4 4 –15 –11Total transactions with equity holders — — — –2,507 –2,507 –15 –2,522Closing balance, December 31, 2017 1,545 2,905 –2,615 18,630 20,465 14 20,480
Effect from change in accounting principles — — –1 –17 –18 0 –18Adjusted opening balance 1,545 2,905 –2,615 18,614 20,448 14 20,463Income for the period — — — 3,805 3,805 0 3,805Cash flow hedges — — –2 — –2 — –2Exchange differences on translation of foreign operations — — 200 4 204 0 203Remeasurement of provisions for post-employment benefits — — — –448 –448 — –448Income tax relating to other comprehensive income — — 23 128 151 — 151Other comprehensive income, net of tax — — 221 –316 –95 0 –95Total comprehensive income for the period — — 221 3,490 3,710 0 3,710Share-based payments — — — –35 –35 — –35Dividend — — — –2,385 –2,385 0 –2,385Acquisition of non-controlling interest — — — — — –3 –3Total transactions with equity holders — — — –2,421 –2,421 –3 –2,424Closing balance, December 31, 2018 1,545 2,905 –2,394 19,683 21,738 11 21,749
For more information about share capital, number of shares and earnings per share, see Note 20.
Changes in consolidated equity
Board of Directors’ report and financial statements 29
ELECTROLUX ANNUAL REPORT 2018

Cash flow
• Operating cash flow after investments amounted to SEK 3,649m (6,877).• Capital expenditure amounted to SEK 5,629m (4,679).• R&D expenditure amounted to 3.2% (3.0) of net sales.
Operating cash flow after investments in 2018 amounted to SEK 3,649m (6,877).
OPERATING CASH FLOW AFTER INVESTMENTS
SEKM
0
2,000
4,000
6,000
8,000
10,000
1817161514
CAPITAL EXPENDITURE
SEKM
Capital expenditureDepreciation and amortization
0
1,000
2,000
3,000
4,000
5,000
6,000
1817161514
Capital expenditure in 2018 including product development and software amounted to SEK 5,629m (4,679).
Operating cash flow after investmentsOperating cash flow after investments in 2018 amounted to SEK 3,649m (6,877). The decline was due to lower earnings, higher investments and lower cash flow from working capi-tal, mainly due to timing effects. Acquisitions had a negative impact of SEK 902m while divestments had a positive impact of SEK 293m. For more information on acquisitions see page 32 and Note 26.
Cash flowseKm 2018 2017
Operating income adjusted for non-cash items1) 10,547 11,405Change in operating assets and liabilities –1,000 267Operating cash flow 9,547 11,672Investments in tangible and intangible assets –5,629 –4,857Changes in other investments –269 62Operating cash flow after investments 3,649 6,877Acquisitions and divestments of operations –609 –3,405
Operating cash flow after structural changes 3,041 3,472Financial items paid, net2) –361 –227Taxes paid –1,140 –1,421Cash flow from operations and investments 1,540 1,824Dividend –2,385 –2,155Share-based payments –210 –483Total cash flow, excluding change in loans and short-term investments –1,056 –8141) Operating income adjusted for depreciation and amortization and other non-cash items.2) For the period January 1 — December 31, 2018. Interests and similar items received
SEK 192m (199), interests and similar items paid SEK –551m (–357) and other financial items paid SEK –2m (–69).
Capital expenditure Capital expenditure in property, plant and equipment in 2018 amounted to SEK 4,650m (3,892), corresponding to 3.7% (3.2) of net sales. Including investments in product development and software, capital expenditure amounted to SEK 5,629m (4,679). Investments in 2018 were mainly related to new products and architectures, manufacturing efficiency, automation and re-engineering.
Capital expenditure by business areaseKm 2018 2017
Major AppliancesEurope, Middle East and Africa 1,621 1,420% of net sales 3.8 3.7North America 2,071 1,467% of net sales 5.3 3.6Latin America 714 711% of net sales 4.2 4.1Asia/Pacific 413 418% of net sales 4.5 4.8Home Care & Small Domestic Appliances 249 190% of net sales 3.3 2.4Professional Products 169 167% of net sales 1.9 2.2Other 393 306Total 5,629 4,679% of net sales 4.5 3.9
R&D expenditure The expenditure for research and development in 2018, includ-ing capitalization of SEK 436m (355), amounted to SEK 3,960m (3,621) corresponding to 3.2% (3.0) of net sales.
ELECTROLUX ANNUAL REPORT 2018
30 Board of Directors’ report and financial statements
Consolidated cash flow statement
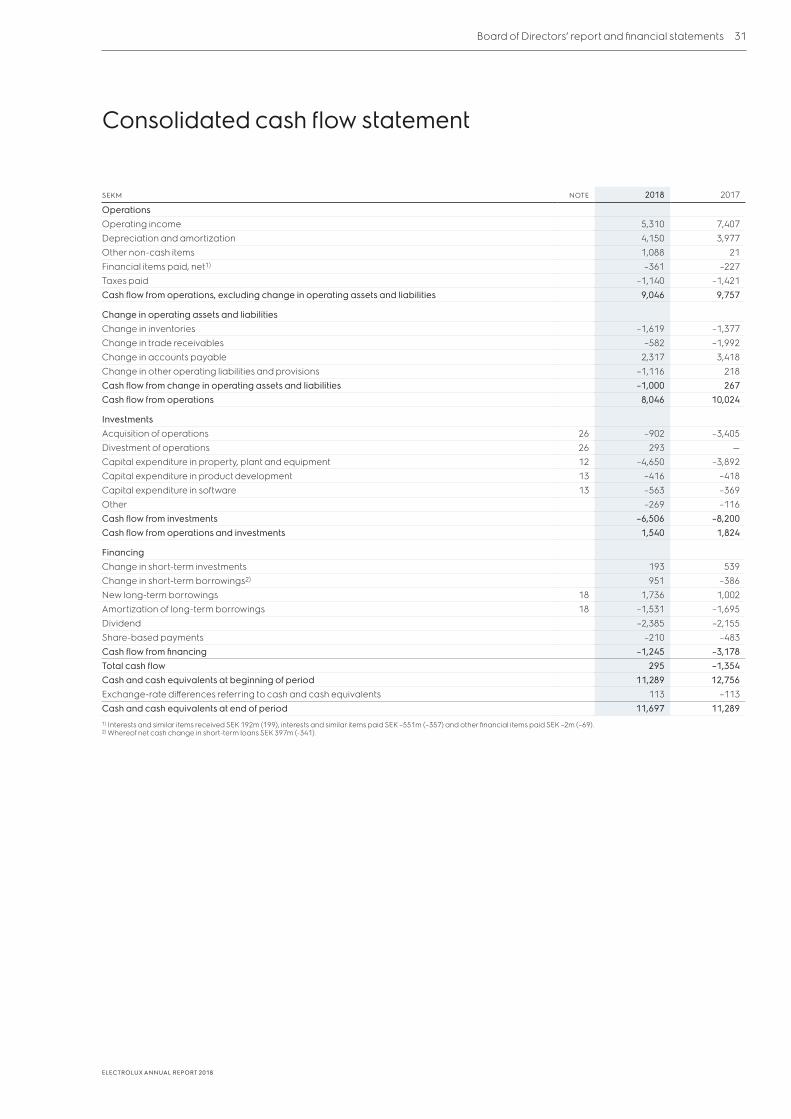
seKm note 2018 2017
OperationsOperating income 5,310 7,407Depreciation and amortization 4,150 3,977Other non-cash items 1,088 21Financial items paid, net1) –361 –227Taxes paid –1,140 –1,421Cash flow from operations, excluding change in operating assets and liabilities 9,046 9,757
Change in operating assets and liabilitiesChange in inventories –1,619 –1,377Change in trade receivables –582 –1,992Change in accounts payable 2,317 3,418Change in other operating liabilities and provisions –1,116 218Cash flow from change in operating assets and liabilities –1,000 267Cash flow from operations 8,046 10,024
InvestmentsAcquisition of operations 26 –902 –3,405Divestment of operations 26 293 —Capital expenditure in property, plant and equipment 12 –4,650 –3,892Capital expenditure in product development 13 –416 –418Capital expenditure in software 13 –563 –369Other –269 –116Cash flow from investments –6,506 –8,200Cash flow from operations and investments 1,540 1,824
FinancingChange in short-term investments 193 539Change in short-term borrowings2) 951 –386New long-term borrowings 18 1,736 1,002Amortization of long-term borrowings 18 –1,531 –1,695Dividend –2,385 –2,155Share-based payments –210 –483Cash flow from financing –1,245 –3,178Total cash flow 295 –1,354Cash and cash equivalents at beginning of period 11,289 12,756Exchange-rate differences referring to cash and cash equivalents 113 –113Cash and cash equivalents at end of period 11,697 11,2891) Interests and similar items received SEK 192m (199), interests and similar items paid SEK –551m (–357) and other financial items paid SEK –2m (–69).2) Whereof net cash change in short-term loans SEK 397m (-341).
Board of Directors’ report and financial statements 31
ELECTROLUX ANNUAL REPORT 2018

Acquisitions, divestments and other facts
AcquisitionsSchneidereit GmbHOn February 22, 2018 Electrolux completed the acquisition of Schneidereit GmbH, a supplier of laundry-rental solutions for professional customers in Germany and Austria. The agreement to acquire the company was announced on January 22, 2018.
The acquisition enables Electrolux to develop its offering within the professional laundry business and supports the long-term profitable growth in Europe.
Net sales for the acquired business Schneidereit GmbH in 2016 amounted to around EUR 18m (around SEK 175m) and the company has approximately 110 employees throughout Germany.
SPM Drink SystemsOn October 2, 2018 Electrolux completed the acquisition of SPM Drink Systems, an Italian leading manufacturer of professional dispensers of frozen and hot beverages and soft ice-cream, as part of the strategy to increase its presence in the hospitality industry.
The acquisition supports Electrolux strategy for profitable growth. Together with the 2017 acquisition of Grindmaster- Cecilware in North America, it strengthens Electrolux presence in the fast-growing beverage segment.
The acquired operations had combined net sales in 2017 of approximately EUR 30m and 110 employees. The company’s headquarters and main manufacturing facilities are based in Spilamberto, Modena, Italy.
DivestmentsBEAM and Sanitaire in North AmericaOn August 8, 2018, Electrolux announced the divestment of its U.S.-based commercial and central vacuum cleaner businesses in North America, including the brands Sanitaire and BEAM. The decision is in line with the strategy of the business area Home Care & SDA to focus on global brands and product categories.
The divested operations had combined revenues in 2017 of around USD 70m.For more information on acquisitions and divestments of operations, see Note 26.
Asbestos litigation in the U.S. Litigation and claims related to asbestos are pending against the Group in the U.S. Almost all of the cases refer to externally supplied components used in industrial products manufac-tured by discontinued operations prior to the early 1970s. The cases involve plaintiffs who have made substantially identical allegations against other defendants who are not part of the Electrolux Group.
As of December 31, 2018, the Group had a total of 3,460 (3,372) cases pending, representing approximately 3,502 (approximately 3,435) plaintiffs. During 2018, 1,355 new cases with approximately 1,355 plaintiffs were filed and 1,267 pending cases with approximately 1,288 plaintiffs were resolved.
The Group continues to operate under a 2007 agreement with certain insurance carriers who have agreed to reimburse the Group for a portion of its costs relating to certain asbestos lawsuits. The agreement is subject to termination upon 60 days notice and if terminated, the parties would be restored to their rights and obligations under the affected insurance policies.
It is expected that additional lawsuits will be filed against Electrolux. It is not possible to predict the number of future lawsuits.
In addition, the outcome of asbestos lawsuits is difficult to predict and Electrolux cannot provide any assurances that the resolution of these types of lawsuits will not have a mate-rial adverse effect on its business or on results of operations in the future.For information on certain additional legal proceedings, see Note 25 Contingent liabilities.
Comments on impact from development in SearsElectrolux commented on October 15, 2018, the announcement by Sears Holdings Corporation, a major U.S. customer, that it has filed voluntary petitions for relief under Chapter 11 of the U.S. Bankruptcy Code.
Following the announcement, Electrolux intends to work with Sears’ restructuring officer to explore the prospects of continu-ing its business with Sears, while continuing to manage the financial and operational exposure.
To ensure business continuity and to mitigate the financial exposure, Electrolux has been actively planning for various Sears’ contingencies while also growing the business with other customers. Therefore, the Group does not currently assess a need for material one-time costs as an immediate consequence of Sears’ restructuring under Chapter 11.
However, while it is difficult to predict the outcome of Sears’ attempt to restructure its business and the various scenarios it may entail, it cannot be ruled out that there may be a material impact on the future sales and earnings of Electrolux business area Major Appliances North America. Major Appliances North America’s exposure to Sears was at the end of the third quarter of 2018 about 10% of the business area’s total revenues.
ELECTROLUX ANNUAL REPORT 2018
32 Board of Directors’ report and financial statements

Active risk management is essential for Electrolux to drive successful operations. The Group’s strategic framework in com-bination with the external environment generate opportunities but also risks which in turn impact how the company manages those risks in the daily operations. Electrolux monitors and mini-mizes key risks in a structured and proactive manner.
The Group has several processes to manage risks through operational activities that are performed by the business area boards. Electrolux organizational structure and system for inter-nal control and risk management are included in the Corporate Governance report.
The Group has also established internal bodies that manage risk exposures. Example of other internal bodies are: Enterprise Risk Management Board, Insider Committee, Ethics & Human Rights Steering Group, Audit Board and the Tax Board.
External risksMacroeconomic trends, political uncertainties and overall changes in industry dynamics are factors that may impact the appliance industry and the markets in which Electrolux oper-ates. To manage external risks, Electrolux puts close attention to understanding the economic and political development in its key markets and pro-actively manage and adapt operations. External risks include:
Variations in demand In times of weak markets and decline in demand for theGroup’s products, decisive actions and cost savings initiatives throughout the Group have proven that Electrolux can make timely adjustments to its production and cost structure. In times of strong market demand, it is essential that Electrolux can ben-efit from its global scale by delivering new innovative products and outstanding consumer experiences with a high speed to market.
Changing industry dynamicsThe fast pace of change in the industry has led to new trends, such as increased consumer power, digitalization, consolida-tion and sustainability. These changes place increasing demand on investments and ability to adapt, but also opens up major opportunities. Electrolux has in recent years invested in R&D and new innovations and transformed its business into a consumer-oriented company with strong focus on consumer benefits. Electrolux has also set ambitious targets to strengthen its sus-tainability footprint. For more information, see Sustaina bility reporting 2018.
Price competitionElectrolux markets are experiencing price competition. This is particularly evident in the low-cost segments and in product categories with significant overcapacity. In markets with high inflation combined with currency-rate fluctuations, Electrolux has a better possibility to carry out price increases to offset potential negative effects.
Regulatory changesRegulatory changes (industry, environmental, social, labor and human rights) can impact reputation and the Group’s ability to successfully conduct business. There are a number of processes in place to control these risks such as internal and supplier audit-ing, environmental management and certification, the Ethics program and the safety management system. The regulatory environment is monitored in order to be prepared for changes that impact the business.
Raw material impactMaterials account for a large share of the Group’s costs. Electrolux purchases raw materials and components for approximately SEK 50bn, of which approximately SEK 20bn refers to the former in 2018. Fluctuations in commodity prices impact the Group’s input costs and, therefore, its profitability. In order to mitigate increased input costs related to higher raw material prices, Electrolux may have to take actions to increase cost efficiency, negotiate purchasing contracts for commodities such as steel and chemicals or increase the prices of its products.
Political and macro riskPolitical uncertainties and weak macro-economic conditions may indirectly impact demand for appliances. This has impli-cations for Electrolux business and strategy in regions which carry a high political and macro risk. Such regions have been Latin America and the Middle East and Africa. Consequently, Electrolux must take proactive steps to assess the risks and manage them accordingly.
Risks, risk management and risk exposure are described in more detail in Note 1 Accounting principles, Note 2 Financial risk management and in Note 18 Financial instruments.
Sensitivity analysis year-end 2018
Risk Change +/-Pre-tax earnings impact -/+, seKm
Raw materials1)
Carbon Steel 10% 700Stainless Steel 10% 200Plastics 10% 750
Currency2) and interest rates
USD to EUR 10% 350USD to CAD 10% 260EUR to GBP 10% 260USD to BRL 10% 240EUR to CHF 10% 180CNY to USD 10% 180THB to AUD 10% 120USD to AUD 10% 100EUR to RUB 10% 100USD to THB 10% 90Translation exposure to SEK3) 10% 520Interest rate 1 percentage point 501) Changes in raw materials refer to Electrolux prices and contracts, which may differ
from market prices.2) Transactional exposure.3) Assuming the Swedish krona appreciates/depreciates against all other currencies.
External risks
RAW MATERIALS EXPOSURE 2018
Carbon steel, 35%Plastics, 37%Copper and aluminum, 7%Stainless steel, 10%Other, 11%
In 2018, Electrolux purchased raw materials forapproximately SEK 20 billion. Purchases of steelaccounted for the largest cost.
Board of Directors’ report and financial statements 33
ELECTROLUX ANNUAL REPORT 2018

Share information and ownership
Share price performanceThe Electrolux share is listed on the exchange Nasdaq Stockholm. The Electrolux B share decreased by 29% in 2018, underperforming the broader Swedish market index, OMX Stockholm, which decreased by 8% during the same period. The opening price for the Electrolux B share in 2018 was SEK 264.30. The highest closing price was SEK 278.20 on January 31 while the lowest closing price was SEK 172.20 on October 26. The closing price for the B share at year-end 2018 was SEK 187.10.
Total shareholder return during the year was –26%. Over the past ten years, the average total return on an investment in Electrolux B shares has been 14% annually. The corresponding performance for the OMX Stockholm Return Index was 13%.
Share capital and ownership structureAs of December 31, 2018, the share capital of AB Electrolux amounted to approximately SEK 1,545m, corresponding to 308,920,308 shares. The share capital of Electrolux consists of Class A shares and Class B shares. An A share entitles the holder to one vote and a B share to one-tenth of a vote. All shares enti-tle the holder to the same proportion of assets and earnings and carry equal rights in terms of dividends. In accordance with the Swedish Companies Act, the Art icles of Association of Electrolux also provide for specific rights of priority for holders of different types of shares, in the event that the company issues new shares or certain other instruments.
According to Electrolux Articles of Association, owners of Class A shares have the right to have such shares converted to Class B shares. The purpose of the conversion clause is to give holders of Class A shares an opportunity to achieve improved liquidity in their shareholdings. Conversion re duces the total number of votes in the company. There were no conversion of shares in 2018.
The total number of registered shares in the company amounts to 308,920,308 shares, of which 8,192,539 are Class A shares and 300,727,769 are Class B shares, total number of votes amounts to 38,265,316.
Major shareholders Share
capital, %Voting
rights, %
Investor AB 16.4 28.4Swedbank Robur Funds 4.8 3.9BlackRock, Inc. 4.7 3.8Alecta Pension Insurance 4.4 4.7AMF Insurance & Funds 2.6 4.5Norges Bank Investment Management 2.1 1.7Fiduciary Management, Inc. of Milwaukee 2.1 1.7Vanguard 2.1 1.7TIAA - Teachers Advisors 1.8 1.5Nordea Funds 1.5 1.2Total, ten largest shareholders 42.5 53.1
Source: Holdings and Euroclear Sweden as of December 31, 2018.
According to Holdings and Euroclear Sweden, there were 49,870 shareholders in AB Electrolux as of December 31, 2018. Investor AB is the largest shareholder, owning 16.4% of the share capital and 28.4% of the voting rights. Informa-tion on the shareholder structure is updated quarterly at www.electroluxgroup.com
Distribution of shareholdings
Shareholding Ownership, %Number of
shareholdersAs % of
shareholders
1–1,000 3.2 44,857 89.91,001–10,000 3.8 4,526 8.210,001–20,000 0.8 173 0.320,001– 92.2 314 0.6Total 100 49,870 100
Source: Holdings and Euroclear Sweden as of December 31, 2018.
Articles of AssociationAB Electrolux Articles of Association stipulate that the Annual General Meeting (AGM) shall always resolve on the appoint-ment of the members of the Board of Directors. Apart from that, the articles do not include any provisions for appointing or dismissing members of the Board of Directors or for changing the articles.
A shareholder participating in the AGM is entitled to vote for the full number of shares which he or she owns or represents. Outstanding shares in the company may be freely transferred, without restrictions under law or the company’s Articles of Association. Electrolux is not aware of any agreements between shareholders, which limit the right to transfer shares.
The full Articles of Association can be downloaded at www.electroluxgroup.com
Effect of significant changes in ownership structure on long-term financingThe Group’s long-term financing is subject to conditions which stipulate that lenders may request advance repayment in the event of significant changes in the ownership of the com-pany. Such significant change could result from a public bid to acquire Electrolux shares.
OWNERSHIP STRUCTURE
Swedish institutions and mutual funds, 56%Foreign investors, 38%Swedish private investors, 6%
At year-end, about 38% of the total share capital was owned by foreign investors.
Source: Holdings and Euroclear Sweden as of December 31, 2018.
ELECTROLUX ANNUAL REPORT 2018
34 Board of Directors’ report and financial statements

Distribution of funds to shareholders
Proposed dividend The Board of Directors proposes a dividend for 2018 of SEK 8.50 (8.30) per share, for a total dividend payment of approximately SEK 2,443m (2,385). The proposed dividend corresponds to approximately 64% (42) of income for the period.
The dividend is proposed to be paid in two equal install-ments, the first with record date April 12, 2019 and the second with record date October 11, 2019. The first installment is esti-mated to be paid on April 17, 2019 and the second installment on October 16, 2019.
The Group’s goal is for the dividend to correspond to at least 30% of income for the period. Historically, the Electrolux divi-dend rate has been considerably higher than 30%. Electrolux has a long tradition of high total distribution to shareholders that includes repurchases and redemptions of shares.
Proposal for a renewed mandate on acquisition of own sharesElectrolux has, for several years, had a mandate from the Annual General Meetings to acquire own shares.
The Board of Directors proposes the Annual General Meet-ing 2019 to authorize the Board of Directors, for the period until the next Annual General Meeting, to resolve on acquisitions of shares in the company and that the company may acquire as a maximum so many B shares that, following each acquisition, the company holds at a maximum 10% of all shares issued by the company.
The purpose of the proposal is to be able to use repurchased shares on account of potential company acquisitions and the company’s share related incentive programs, and to be able to adapt the company’s capital structure.
As of December 31, 2018, Electrolux held 21,522,858 B shares in Electrolux, corresponding to approximately 7.0% of the total number of shares in the company.
Number of shares
A shares
B shares Shares, total
Shares held by Electrolux
Shares held by other
shareholders
Number of shares as of January 1, 2018 8,192,539 300,727,769 308,920,308 21,522,858 287,397,450Total number of shares as of December 31, 2018 8,192,539 300,727,769 308,920,308 21,522,858 287,397,450As % of total number of shares 7.0%
TOTAL DISTRIBUTION TO SHAREHOLDERS
SEKM
0
1,500
3,000
4,500
6,000
7,500
18171615141312111009080706
Dividend Repurchase of shares Redemption of shares
Electrolux has a long tradition of high total distribution to share holders that includes dividends as well as repurchases and redemptions of shares.
Board of Directors’ report and financial statements 35
ELECTROLUX ANNUAL REPORT 2018

Employees
Electrolux corporate culture Teamship is the Electrolux way of working. It’s about setting aligned goals that allow clear choices and continuous improve-ment. It’s about knowing how to collaborate. It’s about transpar-ency and a learning organization. Finally, it’s about engage-ment and passion about outstanding consumer experiences.
Wherever Electrolux operates in the world, the company applies the same high ethical standards and principles of conduct.
Electrolux has a global Ethics Program, encompassing both ethics training and a whistle-blowing system – the Electrolux Ethics Helpline. Through the Ethics Helpline, employees can report suspected misconduct in local languages. Reports may be submitted anonymously if legally permitted.
Code of ConductThe Group has a Code of Conduct that defines high employ-ment standards for all Electrolux employees in all countries and business areas. It incorporates issues such as child and forced labor, health and safety, workers’ rights and environmental compliance. Key policies in this context include the Workplace Policy, the Anti-Corruption Policy and the Environmental Policy.
Number of employeesThe average number of employees decreased in 2018 to 54,419 (55,692), of whom 2,016 (2,039) were in Sweden. At year-end, the total number of employees was 51,798 (56,708).
Salaries and remuneration in 2018 amounted to SEK 17,363m (16,470), of which SEK 1,406m (1,406) refers to Sweden.
Proposal for remuneration guidelines for Group Management The Board of Directors will propose the following guidelines for remuneration and other terms of employment for the Pres-ident and CEO and other members of Group Management of Electrolux to the Annual General Meeting (AGM) 2019. Group Management currently comprises eleven executives. The proposed guidelines for 2019 correspond to the guidelines approved by the AGM in 2018.
The principles shall be applied for employment agreements entered into after the AGM 2019 and for changes made to existing employment agreements thereafter.
Remuneration for the President and CEO is resolved upon by the AB Electrolux Board of Directors, based on the recom-mendation of the Remuneration Committee. Remuneration for other members of Group Management is resolved upon by the Remuneration Committee and reported to the Board of Directors.
For a detailed description on remuneration to Group Management and related costs, see Note 27.
Electrolux shall strive to offer total remuneration that is fair and competitive in relation to the country or region of employment of each Group Management member. The remune ration terms shall emphasize ‘pay for performance’, and vary with the performance of the individual and the Group. The total remuner-ation for Group Management may comprise the components set forth hereafter.
Fixed compensationThe Annual Base Salary (ABS) shall be competitive relative to the relevant country market and reflect the scope of the job responsibilities. Salary levels shall be reviewed periodically (usually annually) to ensure continued competitiveness and to recognize individual performance.
Variable compensationFollowing the ‘pay for performance’ principle, variable compen-sation shall represent a significant portion of the total compen-sation opportunity for Group Management. Variable compen-sation shall always be measured against pre-defined targets and have a maximum above which no payout shall be made.
Variable compensation shall principally relate to financial performance targets.
Non-financial targets may also be used in order to strengthen the focus on delivering on the Group’s strategic plans. The tar-gets shall be specific, clear, measurable and time bound and be determined by the Board of Directors.
Short Term Incentive (STI)Group Management members shall participate in an STI plan under which they may receive variable compensation. The objectives in the STI plan shall mainly be financial. These shall be set based on annual financial performance of the Group and, for the business area heads, of the business area for which the Group Management member is responsible.
EMPLOYEES
EMPLOYEES SEKM
Average number of employeesNet sales per employee
15,000
25,000
35,000
45,000
55,000
65,000
18171615140.0
0.5
1.0
1.5
2.0
2.5
The average number of employees decreased to 54,419 (55,692) in 2018.
ELECTROLUX ANNUAL REPORT 2018
36 Board of Directors’ report and financial statements

The maximum STI entitlements shall be dependent on job position and may amount up to a maximum of 100% of ABS. Reflecting current market conditions, the STI entitlement for Group Management members in the U.S. may amount up to a maximum of 150% of ABS if the maximum performance level is reached.
STI payments for 2019 are estimated1) to range between no payout at minimum level and SEK 58m (excluding social costs) at maximum level.
Long Term Incentive (LTI)Each year, the Board of Directors will evaluate whether or not a LTI-program shall be proposed to the General Meeting. LTI pro-grams shall always be designed with the aim to further enhance the common interest of participating employees and Electrolux shareholders of a good long-term development for Electrolux. For a detailed description of all programs and related costs, see Note 27.
Proposal for performance-based long-term share program 2019The Board of Directors will propose a performance-based long-term share program for 2019 to the AGM 2019. The pro-posed program will be connected to performance targets for the Group established by the Board for (i) earnings per share, (ii) return on net assets and (iii) adjusted organic sales growth, for the 2019 financial year. The proposed program will include up to 350 senior managers and key employees. Allocation of perfor-mance-based shares, if any, will take place in 2022. Details of the program will be included in the notice to the AGM 2019.
The costs for the LTI program proposed for 2019 are esti-mated1) to SEK 463m (including social costs) at maximum level.
Extraordinary arrangementsOther variable compensation may be approved in extraordi-nary circumstances, under the conditions that such extraordi-nary arrangement, in addition to the target requirements set out above, is made for recruitment or retention purposes, is agreed on an individual basis, does not exceed three (3) times the ABS and is earned and/or paid out in installments over a minimum period of two (2) years.
Costs for extraordinary arrangements during 2018 amounted to approximately SEK 3.2m. Currently there are no outstanding extraordinary arrangements.
Pension and benefitsOld age pension, disability benefits and medical benefits shall be designed to reflect home-country practices and require-ments. When possible, pension plans shall be based on defined contribution. In individual cases, depending on tax and/or social security legislation to which the individual is subject, other schemes and mechanisms for pension benefits may be approved.
Other benefits may be provided on individual level or to the entire Group Management. These benefits shall not constitute a material portion of total remuneration.
Notice of termination and severance payThe notice period shall be twelve months if the Group takes the initiative and six months if the Group Management member takes the initiative.
In individual cases, severance pay may be approved in addi-tion to the notice periods. Severance pay may only be payable upon the Group’s termination of the employment arrangement or where a Group Management member gives notice as the result of an important change in the working situation, because of which he or she can no longer perform to standard. This may be the case in e.g. the event of a substantial change in owner-ship of Electrolux in combination with a change in reporting line and/or job scope.
Severance pay may for the individual include the continu-ation of the ABS for a period of up to twelve months following termination of the employment agreement; no other benefits shall be included. These payments shall be reduced with the equivalent value of any income that the individual earns during that period of up to twelve months from other sources, whether from employment or independent activities.
Deviations from the guidelinesThe Board of Directors shall be entitled to deviate from these guide-lines if special reasons for doing so exist in any individual case.
1) Estimation is made on the assumption that Group Management is unchanged.
Board of Directors’ report and financial statements 37
ELECTROLUX ANNUAL REPORT 2018

Sustainability and environmental facts
Events after year-end 2018
Electrolux retains global industry leadership in Dow Jones Sustainability Index 2018In 2018, and for the twelfth consecutive year, Electrolux was recognized as a leader in the household durables industry in the prestigious Dow Jones Sustainability Index (DJSI). Electrolux thereby ranks among the top 10% of the world’s 2,500 largest companies for social and environmental performance. Addition-ally, Electrolux has received recognition from other indexes and organizations, including RobecoSAM, UN Global Compact 100 and OEKOM Prime. Electrolux is also included in the Climate A List by CDP.
Sustainability reporting 2018The Group’s sustainability framework – For the Better – comprises of three areas: Better Solutions, Better Operations and Better Society. For more information on the Group’s sustainability work and progress during 2018, read Electrolux sustainability reporting section on pages 90–99.
Mandatory permits and notification in Sweden and elsewhereElectrolux operates two plants in Sweden, which account for approximately 1.2% of the total value of the Group’s production. Permits are required by authorities for one of these plants and are also required to submit notification. The permits cover such areas as thresholds or maximum permissible values for air and water-borne emissions and noise. No significant non-compliance with Swedish environmental legislation was reported in 2018.
Manufacturing units in other countries adjust their opera-tions, apply for necessary permits and report to the authori-ties in accordance with local legislation. The Group follows a precautionary principle with reference to both acquisitions of new plants and continuous operations. No significant non-compliance with applicable environmental legislation was reported in 2018.
Electrolux products are affected by legislation in various markets, principally involving energy consumption, producer responsibility for recycling, and restriction and management of hazardous substances. Electrolux continuously monitors changes in legislation, and both product development and manufacturing are adjusted to reflect these changes.
January 31. Electrolux reinitiates U.S. manufacturing and product investment, announces manufacturing consolidation projectsThe Electrolux Group is reinitiating an investment, estimated at USD 250m, in Springfield, Tennessee, and consolidating all U.S. cooking manufacturing into that facility. Electrolux will also transfer refrigeration manufacturing from its Santiago, Chile, facility to other locations. The measures will lead to restructuring charges in the first quarter 2019 of approximately SEK 1bn, whereof approximately SEK 300m will have a cash flow impact.
As Electrolux reinitiates the project and consolidates into Springfield, the company will also cease production at its Memphis, Tennessee facility. Production at the facility is expected to continue through 2020. The Springfield, Tennessee expansion will be complete and production will begin during the fourth quarter 2020.
The increased global use of modular product platforms has also contributed to a decision to cease manufacturing of refrigerators at Electrolux factory in Santiago, Chile, to improve efficiency and sharpen the local product offering.
The charges will be reported as non-recurring items in the results for the first quarter of 2019, affecting the business areas Major Appliances North America (approximately SEK 800m) and Major Appliances Latin America (approximately SEK 225m).
Electrolux anticipates annual savings of approximately SEK 1bn with full effect from 2022 as a result of the measures announced.January 31. Electrolux prepares for separation and stock exchange listing of Professional Products business area The Electrolux Board of Directors has initiated work intending to propose that a shareholders meeting decides to split the Group into two listed companies, “Electrolux” for household appliances and “Electrolux Professional” for professional appliances, and to distribute Electrolux Professional to the shareholders of AB Electrolux in 2020.
Electrolux Board of Directors believes that such a split has the potential to create substantial shareholder value over time, given that the two businesses have different end markets, customers and success drivers.
A split will enable both companies to focus on their respective opportunities to drive profitable growth, with distinct strategies for innovation and customer focus, as well as a high level of capi-tal efficiency. The separation costs are expected to be relatively
low. Electrolux financial targets will remain unchanged following a separation of Electrolux Professional.
If the shareholders decide in favor of such a proposal, AB Electrolux shareholders will receive shares in Electrolux Professional in pro-portion to their shareholding in AB Electrolux. The intention is to list Electrolux Professional on Nasdaq Stockholm during the first half of 2020. The Board expects to provide an update on the preparations and a more detailed time plan around mid-year 2019.
A distribution of Electrolux Professional is expected to meet the requirements of Lex Asea, which in brief means that there should not be any immediate tax consequences for Sweden-based shareholders of AB Electrolux since they should only be taxed on the value of the shares received in Electrolux Professional when they sell them.February 1. Electrolux sharpens organization to drive profitable growthElectrolux implements strategic and organizational changes to reinforce its ability to create outstanding consumer experiences and drive profitable growth in its consumer business.
Electrolux is revising its business area structure to create four consumer-focused regional business areas, ensuring a unified approach to each market with common branded platforms and inter-actions with consumers. This means the Home Care & SDA business area, currently responsible for Electrolux offering of vacuum cleaners and other products for wellbeing in the home, is being combined with the four current major appliances business areas.
To accelerate product and ownership experience innovation, Electrolux is also pulling together central functions focused on consumer experiences into a new organizational structure, headed by a Group Chief Experience Officer (CXO). This organization is glob-ally responsible for areas such as marketing, design, product lines, digital consumer solutions and ownership experience. Ola Nilsson, currently head of Home Care & SDA, has been named Group CXO and Executive Vice President. Related to this change of roles and responsibilities within Group Management, Chief Operations Officer Jan Brockmann is also being named Executive Vice President.
The changes announced are effective as from 1 February 2019. Electrolux will publish its first quarterly report based on the updated business area structure on April 26, 2019.
For more information, visit www.electroluxgroup.com
ELECTROLUX ANNUAL REPORT 2018
38 Board of Directors’ report and financial statements

Parent Company income statement
Income statementseKm note 2018 2017
Net sales 38,911 35,168Cost of goods sold –33,560 –30,034Gross operating income 5,351 5,134Selling expenses –3,247 –2,967Administrative expenses –1,410 –1,795Other operating income 6 0 1Other operating expenses 6 –804 –105Operating income –110 268
Financial income 9 7,967 7,142Financial expenses 9 –695 –855Financial items, net 7,272 6,287Income after financial items 7,162 6,555
Appropriations 21 –1,743 182Income before taxes 5,419 6,737
Taxes 10 69 –201Income for the period 5,488 6,536
Total comprehensive income for the periodseKm 2018 2017
Income for the period 5,488 6,536
Other comprehensive incomeAvailable for sale instruments 0 1Exchange rate differences 57 36Cash flow hedges –5 –1Income tax relating to other comprehensive income 0 1Other comprehensive income, net of tax 52 37Total comprehensive income for the period 5,540 6,573
The Parent Company comprises the functions of the Group’s head office, as well as five companies operating on a commis-sion basis for AB Electrolux.
Net sales for the Parent Company, AB Electrolux, during 2018 amounted to SEK 38,911m (35,168) of which SEK 31,806m (28,695) referred to sales to Group companies and
SEK 7,105m (6,473) to external customers. Income after financial items was SEK 7,162m (6,555), including dividends from subsidiaries in the amount of SEK 7,179m (6,496). Income for the period amounted to SEK 5,488m (6,536).
Income tax related to group contributions is reported in the income statement. Income tax related to cash flow hedges is reported in other comprehensive income.
Capital expenditures in tangible and intangible assets amounted to SEK 594m (672). Liquid funds at the end of the period amounted to SEK 7,244m, as against SEK 6,066m at the start of the year.
Undistributed earnings in the Parent Company at the end of the period amounted to SEK 22,078m, as against SEK 19,364m at the start of the year. Dividend to shareholders for 2017 amounted to SEK 2,385m.
For information on the number of employees, salaries and remuneration, see Note 27. For information on shareholdings and participations, see Note 29.
Board of Directors’ report and financial statements 39
ELECTROLUX ANNUAL REPORT 2018

Parent Company balance sheet
seKm note December 31, 2018 December 31, 2017
ASSETSNon–current assetsIntangible assets 13 1,714 1,530Property, plant and equipment 12 144 168Deferred tax assets 453 282Financial assets 14 35,943 33,616Total non–current assets 38,254 35,596
Current assetsInventories 15 2,813 2,640Receivables from subsidiaries 21,110 17,769Trade receivables 1,172 1,079Derivatives with subsidiaries 43 47Derivatives 127 80Other receivables 256 250Prepaid expenses and accrued income 392 336Short-term investments — —Cash and bank 7,244 6,066Total current assets 33,157 28,267Total assets 71,411 63,863
EQUITY AND LIABILITIESEquityRestricted equityShare capital 20 1,545 1,545Statutory reserve 3,017 3,017Development reserve 875 506
5,437 5,068Non–restricted equityRetained earnings 16,590 12,828Income for the period 5,488 6,536
22,078 19,364Total equity 27,515 24,432
Untaxed reserves 21 442 444
ProvisionsProvisions for pensions and similar commitments 22 442 438Other provisions 23 691 791Total provisions 1,133 1,229
Non–current liabilitiesPayable to subsidiaries 68 72Bond loans 3,011 3,332Other non–current loans 2,656 2,777Total non–current liabilities 5,735 6,181
Current liabilitiesPayable to subsidiaries 30,519 25,969Accounts payable 1,720 1,723Other liabilities 416 580Short–term borrowings 2,334 1,501Derivatives with subsidiaries 45 279Derivatives 73 228Accrued expenses and prepaid income 24 1,479 1,297Total current liabilities 36,586 31,577Total liabilities and provisions 43,454 38,987Total liabilities, provisions and equity 71,411 63,863
ELECTROLUX ANNUAL REPORT 2018
40 Board of Directors’ report and financial statements

Parent Company change in equity
Restricted equity Non-restricted equity
seKmShare
capitalStatutory
reserveDevelopment
reserveFair value
reserveRetained earnings
Total equity
Opening balance, January 1, 2017 1,545 3,017 226 8 15,574 20,370
Income for the period — — — — 6,536 6,536Available for sale instruments — — — 1 — 1Exchange rate differences — — — 36 — 36Cash flow hedges — — — –1 — –1Income tax relating to other comprehensive income — — — 1 — 1Other comprehensive income, net of tax — — — 37 — 37Total comprehensive income for the period — — — 37 6,536 6,573Share-based payment — — — — –356 –356Development reserve — — 280 — –280 0Dividend — — — — –2,155 –2,155Total transactions with equity holders — — 280 — –2,791 –2,511Closing balance, December 31, 2017 1,545 3,017 506 45 19,319 24,432
Effect of change in accounting principles — — — –37 — –37Adjusted opening balance 1,545 3,017 506 8 19,319 24,395Income for the period — — — — 5,488 5,488Available for sale instruments — — — 0 — 0Exchange rate differences — — — 57 — 57Cash flow hedges — — — –5 — –5Income tax relating to other comprehensive income — — — 0 — 0Other comprehensive income, net of tax — — — 52 — 52Total comprehensive income for the period — — — 52 5,488 5,540Share-based payment — — — — –35 –35Development reserve — — 369 — –369 0Dividend — — — — –2,385 –2,385Total transactions with equity holders — — 369 — –2,789 –2,420Closing balance, December 31, 2018 1,545 3,017 875 60 22,018 27,515
Board of Directors’ report and financial statements 41
ELECTROLUX ANNUAL REPORT 2018
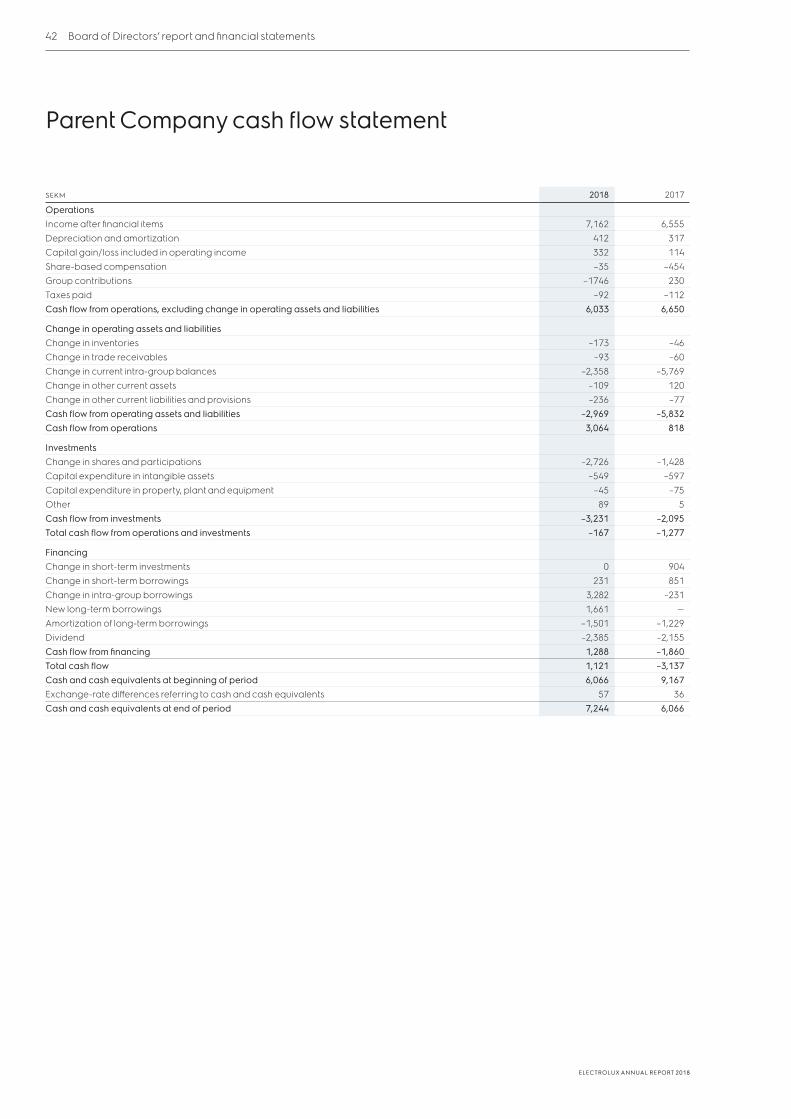
Parent Company cash flow statement
seKm 2018 2017
OperationsIncome after financial items 7,162 6,555Depreciation and amortization 412 317Capital gain/loss included in operating income 332 114Share-based compensation –35 –454Group contributions –1746 230Taxes paid –92 –112Cash flow from operations, excluding change in operating assets and liabilities 6,033 6,650
Change in operating assets and liabilitiesChange in inventories –173 –46Change in trade receivables –93 –60Change in current intra-group balances –2,358 –5,769Change in other current assets –109 120Change in other current liabilities and provisions –236 –77Cash flow from operating assets and liabilities –2,969 –5,832Cash flow from operations 3,064 818
InvestmentsChange in shares and participations –2,726 –1,428Capital expenditure in intangible assets –549 –597Capital expenditure in property, plant and equipment –45 –75Other 89 5Cash flow from investments –3,231 –2,095Total cash flow from operations and investments –167 –1,277
FinancingChange in short-term investments 0 904Change in short-term borrowings 231 851Change in intra-group borrowings 3,282 –231New long-term borrowings 1,661 —Amortization of long-term borrowings –1,501 –1,229Dividend –2,385 –2,155Cash flow from financing 1,288 –1,860Total cash flow 1,121 –3,137Cash and cash equivalents at beginning of period 6,066 9,167Exchange-rate differences referring to cash and cash equivalents 57 36Cash and cash equivalents at end of period 7,244 6,066
ELECTROLUX ANNUAL REPORT 2018
42 Board of Directors’ report and financial statements
Notes

AB Electrolux (publ), 556009-4178
Contents
Note 1 Accounting principles 45
Note 2 Financial risk management 49
Note 3 Segment information 51
Note 4 Revenue recognition 52
Note 5 Operating expenses 54
Note 6 Other operating income and expenses 54
Note 7 Material profit or loss items in operating income 54
Note 8 Leasing 55
Note 9 Financial income and financial expenses 55
Note 10 Taxes 55
Note 11 Other comprehensive income 56
Note 12 Property, plant and equipment 57
Note 13 Goodwill and other intangible assets 58
Note 14 Other non-current assets 60
Note 15 Inventories 60
Note 16 Other current assets 60
Note 17 Trade receivables 60
Note 18 Financial instruments 61
Note 19 Assets pledged for liabilities to credit institutions 65
Note 20 Share capital, number of shares and earnings per share 66
Note 21 Untaxed reserves, Parent Company 66
Note 22 Post-employment benefits 67
Note 23 Other provisions 71
Note 24 Other liabilities 71
Note 25 Contingent assets and liabilities 72
Note 26 Acquired and divested operations 73
Note 27 Employees and remuneration 75
Note 28 Fees to auditors 78
Note 29 Shares and participations 78
Note 30 Definitions 80
Note 31 Proposed distribution of earnings 81
Auditors’ report 82
Notes
ELECTROLUX ANNUAL REPORT 2018
44 Notes
All amounts in SEKm unless otherwise stated

Note 1 Accounting principles
This section describes the comprehensive basis of preparation which has been applied in preparing the financial statements. Accounting principles for specific accounting areas and individual line items are described in the related notes. For additional information on accounting principles, please contact Electrolux Investor Relations.
Basis of preparationThe consolidated financial statements are prepared in accordance with International Financial Reporting Standards (IFRS) as endorsed by the European Union (EU). The consolidated financial statements have been prepared under the historical cost convention, as modified by revaluation of financial assets at fair value through other comprehensive income and financial assets and liabilities (including derivative financial instruments) at fair value through profit or loss. Some additional information is disclosed based on the standard RFR 1 issued by the Swedish Financial Reporting Board and the Swedish Annual Accounts Act. As required by IAS 1, Electrolux companies apply uniform accounting rules, irrespective of national legisla-tion, as defined in the Electrolux Accounting Manual which is fully compliant with IFRS. The policies set out below have been consistently applied to all years presented with the exception of new accounting standards where the application follows the rules in each particular standard. For informa-tion on new standards, see the section on new or amended accounting standards below.
Enumerated amounts presented in tables and statements may not always agree with the calculated sum of the related line items due to round-ing differences. The aim is for each line item to agree with its source and therefore there may be rounding differences affecting the total when add-ing up the presented line items.
The Parent Company applies the same accounting principles as the Group, except in the cases specified in the section entitled ‘Parent Company accounting principles’.
The financial statements were authorized for issue by the Board of Direc-tors on February 14, 2019. The balance sheets and income statements are subject to approval by the Annual General Meeting of shareholders on April 10, 2019.
Principles applied for consolidation The consolidated financial statements have been prepared by use of the acquisition method of accounting, whereby the assets and liabilities and contingent liabilities assumed in a subsidiary on the date of acquisition are recognized and measured to determine the acquisition value to the Group.
The cost of an acquisition is measured as the fair value of the assets given, equity instruments issued and liabilities incurred or assumed at the date of exchange. The consideration transferred includes the fair value of any asset or liability resulting from a contingent consideration arrange-ment. Costs directly attributable to the acquisition effort are expensed as incurred. On an acquisition-by-acquisition basis, the Group recognizes any non- controlling interest in the acquiree either at fair value or at the non-controlling interest’s proportionate share of the acquiree’s net assets.
The excess of the consideration transferred, the amount of any non- controlling interest in the acquiree and the acquisition-date fair value of any previous equity interest in the acquiree over the fair value of the identifiable net assets acquired is recorded as goodwill. If the fair value of the acquired net assets exceeds the cost of the business combination, the identification and measurement of the acquired assets must be reassessed. Any excess remaining after that reassessment represents a ‘bargain purchase’ and is recognized immediately in the statement of comprehensive income.
The consolidated financial statements for the Group include the financial statements of the Parent Company and its directly and indirectly owned subsidiaries after:• elimination of intra-group transactions, balances and unrealized intra-
group profits, and• carrying values, depreciation and amortization of acquired surplus values.
Definition of Group companiesThe consolidated financial statements include AB Electrolux and all compa-nies over which the Parent Company has control, i.e., the power to direct the activities; exposure to variable return and the ability to use its power. When the Group ceases to have control or significant influence, any retained inter-est in the entity is remeasured at its fair value, with the change in carrying amount recognized in profit or loss.
At year-end 2018, the Group consisted of 164 (153) companies with 246 (214) operating units.
The following apply to acquisitions and divestments:• Companies acquired are included in the consolidated income statement
as of the date when Electrolux gains control.• Companies divested are included in the consolidated income statement
up to and including the date when Electrolux loses control.
Associated companiesAssociates are all companies over which the Group has significant influ-ence but not control, generally accompanying a shareholding of between 20 and 50% of the voting rights. Investments in associated companies are accounted for in accordance with the equity method.
Foreign currency translationForeign currency transactions are translated into the functional currency using the exchange rate prevailing at the date of each transaction.
Monetary assets and liabilities denominated in foreign currencies are valued at year-end exchange rates and any exchange-rate differences are included in income for the period, except when deferred in other compre-hensive income for the effective part of qualifying net investment hedges.
The consolidated financial statements are presented in Swedish krona (SEK), which is the Parent Company’s functional currency and the Group’s presentation currency according to IAS 21.
The balance sheets of foreign subsidiaries are translated into SEK at year-end closing rates. The income statements are translated at the aver-age rates for the year. Translation differences thus arising are included in other comprehensive income.
Exchange ratesSEK 2018 2017
Exchange rate AverageEnd of period Average
End of period
ARS 0.3087 0.2373 0.5176 0.4729AUD 6.50 6.34 6.53 6.41BRL 2.39 2.32 2.66 2.48CAD 6.71 6.59 6.57 6.55CHF 8.91 9.15 8.67 8.41CLP 0.0136 0.0129 0.0131 0.0134CNY 1.31 1.30 1.26 1.26EUR 10.26 10.28 9.64 9.84GBP 11.57 11.38 11.03 11.09HUF 0.0321 0.0320 0.0312 0.0317MXN 0.4517 0.4556 0.4499 0.4160RUB 0.1392 0.1292 0.1463 0.1419THB 0.2691 0.2754 0.2517 0.2516USD 8.70 8.97 8.54 8.21
New or amended accounting standards applied in 2018The following new, amended or improved accounting standards were applicable from January 1, 2018: IFRS 2 Share-based Payments; IFRS 4 Insurance Contracts; IFRS 9 Financial Instruments; IFRS 15 Revenue from Contracts with Customers; IAS 40 Investment Property; and Annual Improvements 2014–2016. The effects from the application of IFRS 9 and IFRS 15 are described in section ‘New or amended accounting standards to be applied after 2017’ on pages 96–98 in the Annual Report 2017. The other new, amended or improved standards did not have any material impact on Electrolux financial statements.
New interpretations of accounting standardsInterpretation 22 Foreign Currency Transactions and Advance Consid-erations, issued by the International Financial Reporting Interpretation Committee (IFRIC), was applicable from January 1, 2018 and has had no material impact on the financial statements of Electrolux.
New or amended accounting standards to be applied after 2018The following new, amended or improved accounting standards have been published but are not mandatory for 2018 and have not been early adopted by Electrolux: IFRS 3 Business Combinations; IFRS 9 Financial Instruments; (endorsed by the EU on March 22, 2018); IFRS 16 Leases (endorsed by the EU on October 31, 2017); IFRS 17 Insurance Contracts; IAS 1 Presentation of Financial Statements; IAS 8 Accounting Policies, Changes in Accounting
Notes 45
ELECTROLUX ANNUAL REPORT 2018
All amounts in SEKm unless otherwise stated

Cont. Note 1
Estimates and Errors; IAS 19 Employee Benefits; IAS 28 Investments in Asso-ciates and Joint Ventures; Annual Improvements 2015–2017. The standards have not yet been endorsed by the EU unless stated above. The effects from the application of IFRS 16 are described below. The other new, amended or improved standards mentioned above are not expected to have any material impact on the financial statements of Electrolux.
IFRS 16 LeasesIFRS 16 Leases is a major revision of how to account for leases, provid-ing a comprehensive model for the identification of lease arrangements and their treatment in accounting and reporting. IFRS 16 supersedes IAS 17 Leases and its accompanying interpretations. The standard’s effective date is January 1, 2019, and it was endorsed by the EU on October 31, 2017. Electrolux will apply IFRS 16 from January 1, 2019. Extensive preparatory work has been performed throughout the group in order to implement IFRS 16. Work has comprised assessing the full impact of IFRS 16, identifying and reviewing lease contracts, designing processes, implementing a common system solution for the group in order to fulfill the accounting and report-ing requirements, and collecting and analyzing lease contract data. The general impact of IFRS 16, the outcome of the preparatory work and the preliminary effects from applying the standard are described below.
The application of IFRS 16 affects primarily lessee accounting of operat-ing leases, as it requires almost all leases being recognized on the balance sheet, while lessor accounting remains basically unchanged. Electrolux is a lessee of a large number of assets such as warehouses, office prem-ises, vehicles, and certain office equipment, while the group’s activities as a lessor are limited. Changes in lessee accounting are expected to have a significant impact on the group’s financial statements as a major part of the group’s operating leases will be recognized on the balance sheet upon transition to IFRS 16. Optional exemptions which allow for excluding short-term leases and leases of low-value assets from recognition on the balance sheet will be applied. The group’s finance leases exposure is limited and thus the related effects from applying IFRS 16 are limited, given this and the fact that finance leases are grandfathered upon transition.
Under IFRS 16, a contract is, or contains, a lease if the contract con-veys the right to control the use of an identified asset for a period of time in exchange for consideration. The current distinction between operating and finance leases is removed for lessees and instead the standard requires recognition of a right-of-use asset and a financial liability for all contracts meeting the definition of a lease.
Transition to IFRS 16Electrolux will adopt IFRS 16 under the modified retrospective approach as per the transition date January 1, 2019. In accordance with the standard, comparative information will not be restated. Instead, the cumulative effect of initially applying the standard will be recognized as an opening balance adjustment. All right-of-use assets will be measured at its carrying amount as if the standard had been applied since the commencement date and the lease liabilities will be measured as the present value of the remaining lease payments at transition. The incremental borrowing rate at the date of transi-tion is used for measuring both the right-of-use assets and the lease liability.
In applying IFRS 16 for the first time, the group will use practical expedi-ents permitted by the standard, when applicable. The practical expedients used include the following:• There will be no reassessment of whether a contract is, or contains, a lease
at the date of transition. This means that the standard is applied to all con-tracts that were identified as containing a lease under IAS 17 and IFRIC 4.
• Operating leases with a remaining lease term of less than 12 months as at January 1, 2019, will be accounted for as short-term leases, i.e. not recog-nized on the balance sheet at transition.
• Initial direct costs are excluded from the measurement of right-of-use assets at the date of transition.
• Hindsight is used in determining the lease term for contracts containing an option to extend or terminate the lease.
Under IFRS 16, both net assets and net debt will increase due to the recogni-tion of the right-of-use assets and the lease liabilities. Lease fees, currently reported as an operating expense, will be replaced by a depreciation of the right-of-use assets and an interest expense related to the lease liabilities. The income statement will also be affected from a timing perspective, as lease fees are currently expensed on a straight-line basis. Under IFRS 16, the total lease-related expense is typically higher in the earlier years of a lease and lower in the later years of a lease. This is due to the interest expense reducing over time as the liability is amortized.
Cash flow from operations will increase as today’s lease fees are included in cash flow from operations but under IFRS 16 the major part of the cash payments will relate to the amortization of the lease liability and conse-
quently affect cash flow from financing. Only the part of the payments that reflects interest will affect cash flow from operations. However, lease fees related to leases not recognized on the balance sheet, i.e. short-term and low-value leases, will continue to affect cash flow from operations in full. The effects on the balance sheet, income statement and cash flow will consequently affect related key metrics.
A preliminary assessment indicates an opening balance adjustment as per January 1, 2019, with the following approximate effects on the balance sheet, without taking into consideration any related adjustments of prepaid and/or accrued amounts at transition: • Right-of-use assets: SEK 3,100m• Deferred tax assets: SEK 60m • Lease liabilities: SEK 3,400m• Retained earnings: SEK –240m
Based on the preliminary amounts above, net assets would increase by SEK 3,160m, and net debt by SEK 3,400m. The preliminary net assets effect is expected to affect the segments as follows: Major Appliances Europe: SEK 700m, Major Appliances North America: SEK 900m, Major Appliances Latin America: SEK 200m, Major Appliances Asia/Pacific, Middle East and Africa: SEK 700m, Home Care & SDA: SEK 150m, Professional Products: SEK150m and Common Group SEK 360m.
The Group’s preliminary assessment is that the adoption of the new accounting rules will have a slightly positive impact on operating income and a minor effect on income for the period for the full year 2019. Cash flow from operations will increase and cash flow from financing decrease by approximately SEK 900m as repayment of the principal portion of the lease liabilities will be classified as cash flow from financing.
New interpretations of accounting standardsThe International Financial Reporting Interpretation Committee (IFRIC) has issued Interpretation 23 Uncertainty over Income Tax Treatments. Manda-tory effective date is 1 January, 2019. The interpretation was endorsed by the EU on 23 October, 2018. No material impact is expected on the financial statements of Electrolux.
Critical accounting policies and key sources of estimation uncertaintyUse of estimatesManagement has made a number of estimates and assumptions relating to the reporting of assets and liabilities and the disclosure of contingent assets and liabilities to prepare the financial statements in conformity with IFRS. Actual results may differ from these estimates under different assumptions or conditions. Below, Electrolux has summarized the accounting policies that require more subjective judgement by management in making assumptions or estimates regarding the effects of matters that are inherently uncertain.
Asset impairment and useful livesNon-current assets, including goodwill, are evaluated for impairment yearly or whenever events or changes in circumstances indicate that the carrying amount of an asset may not be recoverable. An impaired asset is written down to its recoverable amount based on the best information available. Different methods have been used for this evaluation, depending on the availability of information. When available, market value has been used and impairment charges have been recorded when the information indicated that the carrying amount of an asset was not recoverable. In the majority of cases, however, market value has not been available, and the fair value has been estimated by using the discounted cash flow method based on expected future results. Differences in the estimation of expected future results and the discount rates used could have resulted in different asset valuations. The yearly impairment testing of goodwill and other intangible assets with indefinite useful lives, including sensitivity analyses performed, has not indicated any impairment. See Note 13 on page 58 for more information.
Property, plant and equipment are depreciated on a straight-line basis over their estimated useful lives. Useful lives for property, plant and equipment are estimated between 10 and 40 years for buildings and land improvements and between 3 and 15 years for machinery, technical instal-lations and other equipment. Management regularly reassesses the useful lives of all significant assets. The carrying amount for property, plant and equipment at year-end 2018 amounted to SEK 21,088m. The carrying amount for goodwill at year-end 2018 amounted to SEK 8,239m.
Deferred taxesIn the preparation of the financial statements, Electrolux estimates the income taxes in each of the tax jurisdictions in which the Group operates as well as any deferred taxes based on temporary differences. Deferred tax assets relating mainly to tax loss carry-forwards, energy-tax credits and
ELECTROLUX ANNUAL REPORT 2018
46 Notes
All amounts in SEKm unless otherwise stated

Cont. Note 1
temporary differences are recognized in those cases when future taxable income is expected to permit the recovery of those tax assets. Changes in assumptions in the projection of future taxable income as well as changes in tax rates could result in significant differences in the valuation of deferred taxes. As of December 31, 2018, Electrolux had a net amount of SEK 5,580m recognized as deferred tax assets in excess of deferred tax liabilities. As of December 31, 2018, the Group had tax loss carry-forwards and other deductible temporary differences of SEK 6,008m, which have not been included in the computation of deferred tax assets.
Current taxesElectrolux provisions for uncertain outcome of tax audits and tax litigations are based on management’s best estimates and recorded in the balance sheet. These estimates might differ from the actual outcome and the timing of the potential effect on Electrolux cash flow is normally not possible to predict.
In recent years, tax authorities have been focusing on transfer pricing. Transfer-pricing matters are normally very complex, include high amounts and it might take several years to reach a conclusion.
Trade receivablesReceivables are reported net of provision for expected credit losses. The net value reflects the amounts that are expected to be collected, based on circumstances known at the balance sheet date. Changes in circumstances such as higher than expected defaults or changes in the financial situa-tion of a significant customer could lead to significantly different valuations. At year-end 2018, trade receivables, net of provisions for expected credit losses, amounted to SEK 21,482m. The total provision for expected credit losses at year-end 2018 was SEK –935m.
Post-employment benefitsElectrolux sponsors defined benefit pension plans for some of its employees in certain countries. The pension calculations are based on actuarial assumptions regarding, e.g., mortality rates, future salary and pension increases. The calculation of the pension obligation also depends on the discount rate. Changes in assumptions directly affect the defined benefit obligation, service cost, interest income and expense. The discount rate used for the calculation of expenses during 2018 was 2.54% in average, which was the same rate used to estimate liabilities at the end of 2017. Sensitivities for the main assumptions are presented in Note 22 on page 67.
RestructuringRestructuring charges include required write-downs of assets and other non-cash items, as well as estimated costs for personnel reductions and other direct costs related to the termination of the activity. The charges are calculated based on detailed plans for activities that are expected to improve the Group’s cost structure and productivity. In general, the out-come of similar historical events in previous plans are used as a guideline to minimize these uncertainties. The total provision for restructuring at year-end 2018 was SEK 1,210m.
WarrantiesAs is customary in the industry in which Electrolux operates, many of the products sold are covered by an original warranty, which is included in the price and which extends for a predetermined period of time. Provisions for this original warranty are estimated based on historical data regarding service rates, cost of repairs, etc. As of December 31, 2018, Electrolux had a provision for warranty commitments amounting to SEK 2,095m.
DisputesElectrolux is involved in disputes in the ordinary course of business. The disputes concern, among other things, product liability, alleged defects in delivery of goods and services, patent rights and other rights and other issues on rights and obligations in connection with Electrolux operations. Such disputes may prove costly and time consuming and may disrupt normal operations. In addition, the outcome of complicated disputes is difficult to foresee. It cannot be ruled out that a disadvantageous outcome of a dispute may prove to have a material adverse effect on the Group’s earnings and financial position.
Calculation of loss allowanceWhen measuring expected credit loss the Group uses reasonable and supportable forward looking information, which is based on assumptions regarding the future movement of different economic drivers and how these drivers will affect each other.
If the expected credit loss rates on trade receivables between 16 and 60 days past due had been 10% higher/lower as of December 2018, the
loss allowance on trade receivables would have increased/decreased SEK 0.7m (0.7).
If the expected credit loss rates on trade receivables between 61 and 180 days past due had been 10% higher/lower as of December 2018, the loss allowance on trade receivables would have increased/decreased SEK 4.6m (2.3).
Accounting principles applicable from January 1, 2019IFRS 16 Leases is applied by Electrolux from January 1, 2019. The effects from the application of the new standard are described in section ‘New or amended accounting standards to be applied after 2018’ on page 45.
LeasesThe major part of the group’s lease arrangements are those under which the group is a lessee. The group’s activities as a lessor are limited. This section therefore focuses on the principles applied for lessee accounting.
A contract is, or contains, a lease if the contract conveys the right to control the use of an identified asset for a period of time in exchange for consideration. Such an assessment is performed at inception of a contract. An identified lease agreement is further categorized by the group as either a short-term lease, a lease of a low-value asset or a standard lease. Short-term leases are defined as leases with a lease term of 12 months or less. The group’s definition of low-value assets comprises all personal computers and laptops, phones, office equipment and furniture and all other assets of a value less than SEK 100k when new. Lease payments related to short-term leases and leases of low value assets are recognized as operating expenses on a straight-line basis over the term of the lease. The group applies the term ‘standard lease’ to all identified leases which are categorized as neither short-term leases nor leases of a low-value asset. Thus, a standard lease is a lease agreement for which a right-of-use asset and a corresponding lease liability are recognized at commencement of the lease, i.e. when the asset is available for use. The group’s right-of-use assets and its long-term and short-term lease liabilities are presented as separate line items in the consolidated statement of financial position.
Assets and liabilities arising from a lease are initially measured on a pres-ent value basis. The lease liability is determined as the present value of all future lease payments at the commencement date, discounted using the Group’s calculated incremental borrowing rate determined by country and contract duration (>12–36 months, >37–72 months and >72 months).
The following lease payments are included in the measurement of a lease liability: • fixed payments, less any lease incentives, • variable lease payments that are based on an index or a rate, initially
measured using the index or rate as at the commencement date,• amounts expected to be payable under residual value guarantees, • the exercise price of a purchase option if reasonably certain to exercise
that option, and • payments of penalties for terminating the lease, if the lease term reflects
the exercise of that option.
Variable lease fees that do not depend on an index or rate (including prop-erty tax related to leased buildings) are not included in the measurement the lease liability. The related variable payments are charged to the statement of comprehensive income as incurred.
The lease liability is subsequently measured by reducing the carrying amount to reflect the lease payments made and by increasing the carrying amount to reflect interest on the lease liability, using the effective interest method.
A right-of-use asset is measured at cost comprising the amount of the initial measurement of the lease liability, any lease payments made at or before the commencement day, less any lease incentives received, and any initial direct costs, and restoration costs (unless incurred to produce inven-tories) with the corresponding obligation recognized and measured as a provision under IAS 37. The right-of-use asset is subsequently measured at cost less accumulated depreciation, any impairment losses as well as any remeasurement of the lease liability.
A remeasurement of the lease liability, and a corresponding applicable adjustment to the related right-of-use asset, is performed when• the lease term has changed or there is a change in the assessment of exer-
cise of a purchase option, in which case the lease liability is remeasured by discounting the revised lease payments using a revised discount rate.
• the lease payments change due to changes in an index or rate or a change in expected payment under a guaranteed residual value, in which cases the lease liability is remeasured by discounting the revised lease payments using the initial discount rate (unless the lease payments change is due to a change in a floating interest rate, in which case a revised discount rate is used).
Notes 47
ELECTROLUX ANNUAL REPORT 2018
All amounts in SEKm unless otherwise stated

Cont. Note 1
• a lease contract is modified and the lease modification is not accounted for as a separate lease, in which case the lease liability is remeasured by discounting the revised lease payments using a revised discount rate.
A right-of-use asset is normally depreciated on a straight-line basis over the shorter of the asset’s useful life and the lease term. However, if ownership of the asset is reasonably certain to be transferred at the end of the lease, the right-of-use asset is depreciated over its useful life. Depreciation of a right-of-use asset starts at the commencement date of the lease.
A lease payment related to a standard lease is accounted for partly as amortization of the lease liability and partly as interest expense in the state-ment of comprehensive income.
Lease components are separated from non-lease components for leases regarding buildings (offices, warehouses etc.). For leases regard-ing other asset classes (machinery, vehicles etc.) the lease components and any associated non-lease components are accounted for as a single arrangement.
In determining the lease term, extension options are only included if it is determined as reasonably certain to extend. Periods after termination options are only included in the lease term if the lease is reasonably certain not to be terminated. A lease term is reviewed if a significant event or a significant change in circumstances occurs which affects the assessment.
Parent Company accounting principlesThe Parent Company has prepared its Annual Report in compliance with Swedish Annual Accounts Act (1995:1554) and recommendation RFR 2, Accounting for Legal Entities of the Swedish Financial Reporting Board. RFR 2 prescribes that the Parent Company in the Annual Report of a legal entity shall apply all International Financial Reporting Standards and interpre-tations approved by the EU as far as this is possible within the framework of the Annual Accounts Act, taking into account the connection between accounting and taxation. The recommendation states which exceptions from IFRS and additions shall be made. Revenue from contracts with customers are reported in accordance with IFRS 15 and financial instru-ments are reported in accordance with IFRS 9 in the Parent Company for the first time in 2018. The effects from applying the standards have been assessed as not material.
Shares in subsidiariesHoldings in subsidiaries are recognized in the Parent Company financial statements according to the cost method of accounting. The value of sub-sidiaries are tested for impairment when there is an indication of a decline in the value.
Foreign currency translationsThe Annual Report is presented in Swedish krona (SEK), which is the Par-ent Company’s accounting currency according to the Swedish Annual Accounts Act. One of the companies operating on a commission basis for AB Electrolux changed its functional currency to euro as from January 1, 2015. Translating differences thus arise as from 2015. The balance sheet of the commissioner company has been translated into SEK at year-end rates. The income statement has been translated at the average rate for the year. Translation differences thus arising have been included in Other comprehensive income.
Anticipated dividendsDividends from subsidiaries are recognized in the income statement after decision by the annual general meeting in the respective subsidiary. Anti-cipated dividends from subsidiaries are recognized in cases where the Parent Company has exclusive rights to decide on the size of the dividend and the Parent Company has made a decision on the size of the dividend before the Parent Company has published its financial reports.
TaxesThe Parent Company’s financial statements recognize untaxed reserves including deferred tax. The consolidated financial statements, however, reclassify untaxed reserves to deferred tax liability and equity. Tax on group contribution is reported in the income statement.
Group contributionsGroup contributions provided or received by the Parent Company are recognized as appropriations in the income statement. Shareholder con-tributions provided by the Parent Company are recognized in shares and participations which are subject to impairment tests as indicated above.
PensionsThe Parent Company reports pensions in the financial statements in accor-dance with RFR 2. According to RFR 2, IAS 19 shall be adopted regarding supplementary disclosures when applicable.
Intangible assetsThe Parent Company amortizes trademarks in accordance with RFR 2. The Electrolux trademark in North America is amortized over 40 years using the straight-line method. All other trademarks are amortized over their useful lives, estimated to 10 years, using the straight-line method.
The central development costs of the Group’s common business system are recorded in the Parent Company. The amortization is based on the usage and go-live dates of the entities and continues over the system’s useful life, estimated to 5 years per unit using the straight-line method. The applied principle gives an estimated amortization period of 10 years for the system.
Development reserveThe Parent Company’s financial statement recognize a development reserve in compliance with Swedish Annual Accounts Act. An amount equal to the period’s total expenditure of own developed intangible assets has been transferred from unrestricted equity to the development reserve within restricted equity.
Appropriations and untaxed reservesThe Parent Company reports additional fiscal depreciation, required by Swedish tax law, as appropriations in the income statement. In the balance sheet, these are included in untaxed reserves.
Financial statements presentationThe Parent Company presents the income statement and the balance sheet in compliance with the Swedish Annual Accounts Act (1995:1554) and recommendation RFR 2.
ELECTROLUX ANNUAL REPORT 2018
48 Notes
All amounts in SEKm unless otherwise stated

Note 2 Financial risk management
Financial risk managementThe Group is exposed to a number of risks from liquid funds, trade receiv-ables, customer-financing receivables, payables, borrowings, commodities and foreign exchange. The risks include:• Interest-rate risk on liquid funds and borrowings• Financing risk in relation to the Group’s capital requirements• Foreign-exchange risk on commercial flows and net investments in
foreign subsidiaries• Commodity-price risk affecting the expenditure on raw materials and
components; and• Credit risk relating to financial and commercial activities
The Board of Directors of Electrolux has established several policies for the Group (hereinafter all policies are referred to as the Financial Policy) to monitor and manage the financial risks relating to the operations of the Group.
Group Treasury in Stockholm, supported by three regional treasury centers located in Asia, North America, and Latin America provide services to the business, co-ordinate access to financial markets, monitor and manage the financial risks through internal risk reports, which analyze exposures by degree and magnitude of the risk.
The Group seeks to minimize the effects of these risks by using derivatives to hedge these risks exposures. The Group’s Financial Policy governs the use of financial derivatives, which provide principles on foreign exchange risk, interest rate risk, credit risk, the use of financial derivatives and non-derivative financial instruments, and the investment of excess liquidity. The internal auditors review on a continuous basis compliance with policies and exposure limits.
Interest-rate risk on liquid funds and borrowingsInterest-rate risk refers to the adverse effects of changes in interest rates on the Group’s income. The main factors determining this risk include the interest-fixing period.
Liquid fundsLiquid funds as defined by the Group consist of cash and cash equiva-lents, short-term investments, financial derivative assets, prepaid interest expenses and accrued interest income. Electrolux target is that the level of liquid funds including unutilized committed credit facilities shall correspond to at least 2.5% of annualized net sales. In addition, net liquid funds defined as liquid funds less short-term borrowings shall exceed zero, taking into account fluctuations arising from acquisitions, divestments, and seasonal variations. The main criteria for the investments are that the instruments are highly liquid and have creditworthy issuers. See Credit risk in financial activities on page 50.
Interest-rate risk in liquid fundsAll liquidity is invested in interest bearing instruments, normally with maturities between 0 and 3 months. A downward shift in the yield curves of one percentage point would reduce the Group’s interest income by approximately SEK 115m (111). For more information, see Note 18.
Borrowings The debt financing of the Group is managed by Group Treasury in order to ensure efficiency and risk control. Debt is primarily raised at parent company level and transferred to subsidiaries through internal loans or capital injections. In this process, swap instruments are used to convert the funds to the required currency. Short-term financing is also undertaken locally in subsidiaries where there are capital restrictions. The Group’s borrowings contain no financial covenants that can trigger premature cancellation of the loans. For more information, see Note 18.
Interest-rate risk in borrowings Group Treasury manages the long-term loan portfolio to keep the average interest-fixing period between 0 and 3 years. Derivatives, such as interest-rate swap agreements, are used to manage the interest-rate risk by chang-ing the interest from fixed to floating or vice versa. For those derivatives Electrolux practice hedge accounting, which have affected Other compre-hensive income by SEK –1.5m during 2018. On the basis of 2018 long-term interest-bearing borrowings with an average interest fixing period of 1.0 years (0.6), a one percentage point shift in interest rates would impact the Group’s interest expenses by approximately SEK +/–61m (52). This calcula-tion is based on a parallel shift of all yield curves simultaneously by one
percentage point, excluding immaterial revaluation effects. Electrolux acknowledges that the calculation is an approximation and does not take into consideration the fact that the interest rates on different maturities and different currencies might change differently.
Capital structure and credit ratingThe Group defines its capital as equity stated in the balance sheet includ-ing non-controlling interests. On December 31, 2018, the Group’s capital amounted to SEK 21,749m (20,480). The Group’s objective is to have a capital structure resulting in an efficient weighted cost of capital and sufficient credit worthiness where operating needs and the needs for potential acquisitions are considered.
To achieve and keep an efficient capital structure, the Financial Policy states that the Group’s long-term ambition is to maintain a long-term rating within a safe margin from a non-investment grade. In December 2018, Standard & Poor’s confirmed Electrolux A-rating with stable outlook. The A-2 short-term corporate credit rating and the short-term Nordic regional scale rating of K-1 were also affirmed.
RatingLong-term
debt OutlookShort-
term debtShort-term
debt, Nordic
Standard & Poor’s A- Stable A-2 K-1
When monitoring the capital structure, the Group uses different figures, which are consistent with methodologies used by rating agencies and banks. The Group manages the capital structure and makes adjustments to it in light of changes in economic conditions. In order to maintain or adjust the capital structure, the Electrolux Board of Directors may propose to adjust the amount of dividends paid to shareholders, return capital to shareholders, buy back own shares or issue new shares, or sell assets to reduce debt.
Financing riskFinancing risk refers to the risk that financing of the Group’s capital require-ments and refinancing of existing borrowings could become more difficult or more costly. This risk can be decreased by ensuring that maturity dates are evenly distributed over time, and that total short-term borrowings do not exceed liquidity levels. The financial net debt, total borrowings less liquid funds, excluding seasonal variances, shall be long-term according to the Financial Policy. The Group’s goals for long-term borrowings include an average time to maturity of at least 2 years, and an even spread of maturi-ties. A maximum of SEK 5,000m of the long-term borrowings is allowed to mature in a 12-month period. For more information, see Note 18.
Foreign exchange riskForeign exchange risk refers to the adverse effects of changes in foreign exchange-rates on the Group’s income and equity. In order to manage such effects, the Group covers these risks within the framework of the Financial Policy. The Group’s overall currency exposure is managed centrally.
Transaction exposure from commercial flows The Financial Policy stipulates to what extent commercial flows are to be hedged. In 2016 the Financial Policy was updated so that hedging with currency derivatives in most cases only are applied on invoiced flows. This means that currency exposures from forecasted flows should normally be managed by natural hedges, price adjustments and cost reductions. However, in cases when both price and volume is committed, Electrolux may hedge also forecasted flows. For those derivatives Electrolux practice hedge accounting, which has affected Other comprehensive income by SEK 2m during 2018.
Group subsidiaries cover their risks in commercial currency flows mainly through the Group’s treasury centers. Group Treasury thus assumes the currency risks and covers such risks externally by the use of currency derivatives.
The Group’s geographically widespread production reduces the effects of changes in exchange-rates. The remaining transaction exposure is either related to internal sales from producing entities to sales companies or external exposures from purchasing of components and input material for the production paid in foreign currency. These external imports are often priced in U.S. dollar (USD). The global presence of the Group, however, leads to a significant netting of the transaction exposures. For additional informa-tion on exposures and hedging, see Note 18.
Notes 49
ELECTROLUX ANNUAL REPORT 2018
All amounts in SEKm unless otherwise stated

Translation exposure from consolidation of entities outside SwedenChanges in exchange-rates also affect the Group’s income in connection with translation of income statements of foreign subsidiaries into SEK. Electrolux does not hedge such exposure. The translation exposures arising from income statements of foreign subsidiaries are included in the sensitivity analysis mentioned below.
Foreign-exchange sensitivity from transaction and translation exposureThe major net export currencies that Electrolux is exposed to are the U.S. dollar, the Chinese renminbi and the euro. The major import currencies that Electrolux is exposed to are the British pound, the Australian dollar, the Canadian dollar and the Brazilian real. These currencies represent the majority of the exposures of the Group, but are largely offsetting each other as different currencies represent net inflows and outflows. A change up or down by 10% in the value of each currency against the Swedish krona would affect the Group’s profit and loss for one year by approximately SEK +/– 730m (1,010), as a static calculation. The model assumes the distribution of earnings and costs effective at year-end 2018 and does not include any dynamic effects, such as changes in competitiveness or consumer behavior arising from such changes in exchange-rates.
Sensitivity analysis of major currencies
Risk ChangeProfit or loss impact 2018
Profit or loss impact 2017
CurrencyBRL/SEK –10% –345 –233AUD/SEK –10% –295 –295GBP/SEK –10% –286 –323CAD/SEK –10% –261 –255CHF/SEK –10% –184 –177RUB/SEK –10% –116 –94THB/SEK –10% 128 67CNY/SEK –10% 129 121EUR/SEK –10% 383 336USD/SEK –10% 984 824
Exposure from net investments (balance sheet exposure)The net of assets and liabilities in foreign subsidiaries constitute a net investment in foreign currency, which generates a translation difference in the consolidation of the Group. This exposure can have an impact on the Group’s total comprehensive income, and on the capital structure. The exposure is normally handled by natural hedges including matching assets with debts in the same currency. In exceptional cases the exposure can be managed by currency derivatives implemented on Group level and carried out by the Parent Company. For those derivatives Electrolux practice hedge accounting, which has affected Other comprehensive income by SEK –65m during 2018.
A change up or down by 10% in the value of each currency against the Swedish krona would affect the net investment of the Group by approxi-mately SEK +/– 3,230m (2,977), as a static calculation at year-end 2018. A similar valuation of outstanding hedges, would have an effect on the Group’s equity of approximately SEK +/–154m (148).
Commodity-price risks Commodity-price risk is the risk that the cost of direct and indirect materials could increase as underlying commodity prices rise in global markets. The Group is exposed to fluctuations in commodity prices through agreements with suppliers, whereby the price is linked to the raw-material price on the world market. This exposure can be divided into direct commodity expo-sure, which refers to pure commodity exposures, and indirect commodity exposure, which is defined as exposure arising from only part of a com-ponent. Commodity-price risk is mainly managed through contracts with the suppliers. A change in price up or down by 10% in steel would affect the Group’s profit or loss with approximately SEK +/– 800m (800) and in plastics with approximately SEK +/– 600m (700), based on volumes in 2018.
Credit riskCredit risk in financial activitiesExposure to credit risks arises from the investment of liquid funds, and derivatives. In order to limit exposure to credit risk, the Group has adopted a policy of only dealing with creditworthy counterparties. A counterpart list has been established, which specifies the maximum permissible exposure in relation to each counterpart. The Group only transacts investments of liquid funds and derivatives with issuers and counterparts holding a long-term rating of at least A- credit rating, as these are considered to have low credit risk for the purpose of impairment assessment. Standard & Poor’s or similar independent rating agencies supply the credit rating information. Group Treasury can allow exceptions from this rule, e.g., to enable money deposits within countries rated below A-, but this represents only a minor part of the total liquidity in the Group.
The Group strives for master netting agreements (ISDA) with all coun-terparts for derivative transactions. Assets and liabilities will only be netted from a credit risk perspective for counterparts with valid ISDA-agreements. As a result of these policies and limitations, the expected credit loss from external financial activities is not material. However, since Group Treasury manage a majority of the subsidiary financing through internal loans from the parent, there is a material credit risk originating from internal loans.
The opening expected credit loss provision in the parent company for 2018 amounted to SEK 46m primarily originate from internal loans to Latin America. The closing expected credit loss reservation in the parent com-pany amounted to SEK 72m, an increase of SEK 26m, mainly due to higher country risk for Argentina.
To reduce the settlement risk in foreign exchange transactions done with banks, Group Treasury uses Continuous Linked Settlement. Continuous Linked Settlement eliminates temporal settlement risk since both legs of a transaction are settled simultaneously.
Credit risk in trade receivablesElectrolux sells to a substantial number of customers in the form of large retailers, buying groups, independent stores, and professional users. Sales are made on the basis of normal delivery and payment terms. The Electrolux Group Credit Policy defines how credit management is to be performed in the Electrolux Group to achieve competitive and professionally performed credit sales, limited bad debts, and improved cash flow and optimized profit. On a more detailed level, it also provides a minimum level for cus-tomer and credit- risk assessment, clarification of responsibilities and the framework for credit decisions. The credit-decision process combines the parameters risk/reward, payment terms and credit protection in order to obtain as much paid sales as possible. In some markets, Electrolux uses credit insurance as a mean of protection. Credit limits that exceed SEK 300m are as from December 2018 approved by the Audit Committee (and by the Board of Directors until December 2018). For many years, Electrolux has used the Electrolux Rating Model (ERM) to have a common and objective approach to credit-risk assessment that enables more standardized and systematic credit evaluations to minimize inconsistencies in decisions. The ERM is based on a risk/reward approach and is the basis for the customer assessment. The Electrolux Rating Model consists of three different parts: Customer and Market Information; Warning Signals; and a Credit Risk Rating (CR2). Through CR2 the customers are classified in risk categories.
Credit approvals and other monitoring procedures are also in place to ensure that follow-up action is taken to recover overdue debts. Further-more, the Group reviews the recoverable amount of each trade debt and debt investment on an individual basis at the end of the reporting period to ensure that adequate loss allowance is made for irrecoverable amounts. In this regard, management considers that the Group’s credit risk is signifi-cantly reduced. Trade receivables relate to a large number of customers, spread across diverse industries and geographical areas. However, there is a concentration of large credit exposures on a number of customers in, primarily, the U.S., Latin America and Europe. Concentration of credit risk related to a single counterparty did not exceed 11.7 % total trade receiv-ables at any time during the year. For more information, see Note 17.
The Group defines default as customers where significant financial dif-ficulties have been identified. A receivable is written off when there is indica-tions of no realistic prospect of recovery or at a 360 days overdue whichever is the earliest. There is a limited use of enforcement activities.
Cont. Note 2
ELECTROLUX ANNUAL REPORT 2018
50 Notes
All amounts in SEKm unless otherwise stated

Note 3 Segment information
Reportable segments – Business areasThe Group’s operations are divided into six reportable segments based on differences in products: Major Appliances Europe, Middle East and Africa; Major Appliances North America; Major Appliances Latin America; Major Appliances Asia/Pacific; Home Care & SDA and Professional Products.
The Major Appliances business areas are geographically defined, while the Home Care & SDA and Professional Products business areas are global. The segments are regularly reviewed by the President and CEO, the Group’s chief operating decision maker.
Major Appliances and Home Care & SDA are producing appliances for the consumer market. Products within Major Appliances comprise mainly of refrigerators, freezers, cookers, dryers, washing machines, dishwashers and microwave ovens. Home Care & SDA include vacuum cleaners and other small appliances. Professional Products produces equipment and appliances for food-service and laundry solutions for professional users.
The segments are responsible for the operating results and the net assets used in their businesses, whereas financial items and taxes, as well as net debt and equity, are not reported per segment. The operating results and net assets of the segments are consolidated using the same principles as for the total Group. The segments consist of separate legal units as well as divi-sions in multi-segment legal units where some allocations of costs and net assets are made. Operating costs not included in the segments are shown under Common Group costs, which mainly are costs related to group man-agement activities typically required to run the Electrolux Group.
Sales between segments are made on market conditions with arm’s-length principles.
Net sales Operating income
2018 2017 2018 2017
Major Appliances Europe, Middle East and Africa 42,732 38,524 2,220 2,764Major Appliances North America 38,875 40,656 972 2,757Major Appliances Latin America 17,076 17,302 464 425Major Appliances Asia/Pacific 9,165 8,759 648 750Home Care & SDA 7,616 7,808 398 431Professional Products 8,666 7,723 1,134 1,054
124,129 120,771 5,836 8,182Common Group costs — — –527 –775Total 124,129 120,771 5,310 7,407Financial items, net — — –423 –441Income after financial items — — 4,887 6,966
Inter-segment sales exist with the following split:
2018 2017
Major Appliances Europe, Middle East and Africa 1,105 995Major Appliances North America 640 705Major Appliances Latin America 1 —Major Appliances Asia/Pacific 318 308Professional Products 4 6Eliminations 2,068 2,014
The segments are responsible for the management of the operational assets and their performance is measured at the same level, while financing is man-aged by Group Treasury at group or country level. Consequently, liquid funds, interest-bearing receivables, interest-bearing liabilities and equity are not allocated to the business segments.
Assets December 31
Equity and liabilities December 31
Net assets December 31
2018 2017 2018 2017 2018 2017
Major Appliances Europe, Middle East and Africa 27,389 25,575 23,997 22,037 3,392 3,538Major Appliances North America 17,405 14,840 15,010 12,723 2,395 2,117Major Appliances Latin America 12,085 12,602 6,531 6,752 5,554 5,850Major Appliances Asia/Pacific 6,123 5,788 4,152 4,163 1,971 1,625Home Care & SDA 6,011 5,341 3,601 3,519 2,410 1,822Professional Products 6,101 4,434 3,144 2,706 2,957 1,728Other1) 9,418 8,533 4,523 4,535 4,895 3,998
84,531 77,113 60,958 56,436 23,574 20,678Liquid funds 12,249 11,974 — — — —Total borrowings — — 10,260 9,537 — —Pension assets and liabilities 532 455 4,346 3,089 — —Equity — — 21,749 20,480 — —Total 97,312 89,542 97,312 89,542 — —1) Includes common functions, tax items.
Depreciation and amortization Capital expenditure Cash flow1)
2018 2017 2018 2017 2018 2017
Major Appliances Europe, Middle East and Africa 1,404 1,365 1,621 1,420 2,122 2,154Major Appliances North America 1,112 1,119 2,071 1,467 885 2,975Major Appliances Latin America 627 633 714 711 –9 2603)
Major Appliances Asia/Pacific 374 300 413 418 376 971Home Care & SDA 215 199 249 190 –487 317Professional Products 168 151 169 167 1,004 1,112Other2) 249 210 393 306 –242 –912Acquisitions/Divestments — — — — –609 –3,405Financial items — — — — –361 –227Taxes paid — — — — –1,140 –1,421Total 4,150 3,977 5,629 4,679 1,540 1,8241) Cash flow from operations and investments. 2) Includes Group functions.3) Includes SEK –178m related to the acquisition of the Continental brand.
Notes 51
ELECTROLUX ANNUAL REPORT 2018
All amounts in SEKm unless otherwise stated
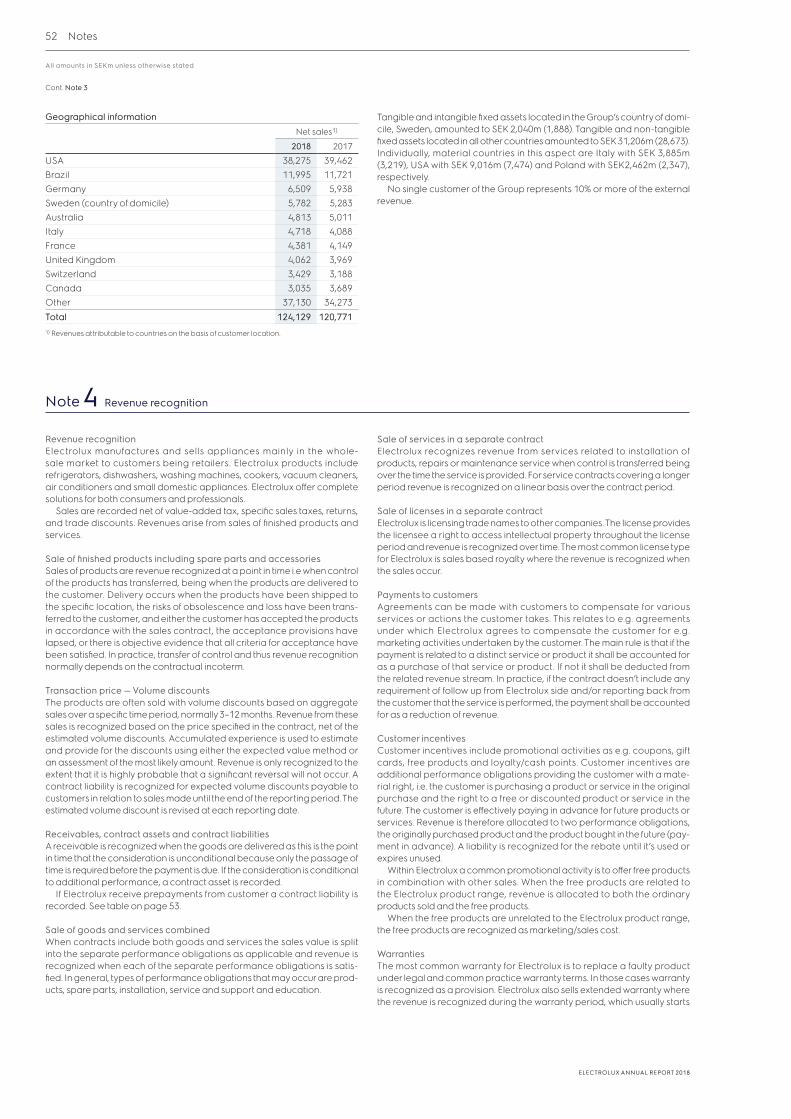
Cont. Note 3
Geographical informationNet sales1)
2018 2017
USA 38,275 39,462Brazil 11,995 11,721Germany 6,509 5,938Sweden (country of domicile) 5,782 5,283Australia 4,813 5,011Italy 4,718 4,088France 4,381 4,149United Kingdom 4,062 3,969Switzerland 3,429 3,188Canada 3,035 3,689Other 37,130 34,273
Total 124,129 120,7711) Revenues attributable to countries on the basis of customer location.
Tangible and intangible fixed assets located in the Group’s country of domi-cile, Sweden, amounted to SEK 2,040m (1,888). Tangible and non-tangible fixed assets located in all other countries amounted to SEK 31,206m (28,673). Individually, material countries in this aspect are Italy with SEK 3,885m (3,219), USA with SEK 9,016m (7,474) and Poland with SEK2,462m (2,347), respectively.
No single customer of the Group represents 10% or more of the external revenue.
Note 4 Revenue recognition
Revenue recognitionElectrolux manufactures and sells appliances mainly in the whole-sale market to customers being retailers. Electrolux products include refrigerators, dishwashers, washing machines, cookers, vacuum cleaners, air conditioners and small domestic appliances. Electrolux offer complete solutions for both consumers and professionals.
Sales are recorded net of value-added tax, specific sales taxes, returns, and trade discounts. Revenues arise from sales of finished products and services.
Sale of finished products including spare parts and accessoriesSales of products are revenue recognized at a point in time i.e when control of the products has transferred, being when the products are delivered to the customer. Delivery occurs when the products have been shipped to the specific location, the risks of obsolescence and loss have been trans-ferred to the customer, and either the customer has accepted the products in accordance with the sales contract, the acceptance provisions have lapsed, or there is objective evidence that all criteria for acceptance have been satisfied. In practice, transfer of control and thus revenue recognition normally depends on the contractual incoterm.
Transaction price — Volume discountsThe products are often sold with volume discounts based on aggregate sales over a specific time period, normally 3–12 months. Revenue from these sales is recognized based on the price specified in the contract, net of the estimated volume discounts. Accumulated experience is used to estimate and provide for the discounts using either the expected value method or an assessment of the most likely amount. Revenue is only recognized to the extent that it is highly probable that a significant reversal will not occur. A contract liability is recognized for expected volume discounts payable to customers in relation to sales made until the end of the reporting period. The estimated volume discount is revised at each reporting date.
Receivables, contract assets and contract liabilitiesA receivable is recognized when the goods are delivered as this is the point in time that the consideration is unconditional because only the passage of time is required before the payment is due. If the consideration is conditional to additional performance, a contract asset is recorded.
If Electrolux receive prepayments from customer a contract liability is recorded. See table on page 53.
Sale of goods and services combined When contracts include both goods and services the sales value is split into the separate performance obligations as applicable and revenue is recognized when each of the separate performance obligations is satis-fied. In general, types of performance obligations that may occur are prod-ucts, spare parts, installation, service and support and education.
Sale of services in a separate contractElectrolux recognizes revenue from services related to installation of products, repairs or maintenance service when control is transferred being over the time the service is provided. For service contracts covering a longer period revenue is recognized on a linear basis over the contract period.
Sale of licenses in a separate contractElectrolux is licensing trade names to other companies. The license provides the licensee a right to access intellectual property throughout the license period and revenue is recognized over time. The most common license type for Electrolux is sales based royalty where the revenue is recognized when the sales occur.
Payments to customersAgreements can be made with customers to compensate for various services or actions the customer takes. This relates to e.g. agreements under which Electrolux agrees to compensate the customer for e.g. marketing activities undertaken by the customer. The main rule is that if the payment is related to a distinct service or product it shall be accounted for as a purchase of that service or product. If not it shall be deducted from the related revenue stream. In practice, if the contract doesn’t include any requirement of follow up from Electrolux side and/or reporting back from the customer that the service is performed, the payment shall be accounted for as a reduction of revenue.
Customer incentivesCustomer incentives include promotional activities as e.g. coupons, gift cards, free products and loyalty/cash points. Customer incentives are additional performance obligations providing the customer with a mate-rial right, i.e. the customer is purchasing a product or service in the original purchase and the right to a free or discounted product or service in the future. The customer is effectively paying in advance for future products or services. Revenue is therefore allocated to two performance obligations, the originally purchased product and the product bought in the future (pay-ment in advance). A liability is recognized for the rebate until it’s used or expires unused.
Within Electrolux a common promotional activity is to offer free products in combination with other sales. When the free products are related to the Electrolux product range, revenue is allocated to both the ordinary products sold and the free products.
When the free products are unrelated to the Electrolux product range, the free products are recognized as marketing/sales cost.
WarrantiesThe most common warranty for Electrolux is to replace a faulty product under legal and common practice warranty terms. In those cases warranty is recognized as a provision. Electrolux also sells extended warranty where the revenue is recognized during the warranty period, which usually starts
ELECTROLUX ANNUAL REPORT 2018
52 Notes
All amounts in SEKm unless otherwise stated

Cont. Note 4
after the legal warranty period. Sometimes warranty offered is including a service part and if it is difficult to separate the warranty from the service the two are bundled together and revenue is recognized over the warranty period.
Sales with a right of returnA right of return is not a separate performance obligation, but it affects the transaction price for the transferred goods. Returns rights are commonly granted in the retail and consumer industry.
Regarding a right of return which follows from legislation, statutory requirements, business practice or is stipulated in the contract with the customer, revenue is not recognized for goods expected to be returned. Instead, a liability is recognized for expected refunds to customers. An asset is also recorded for the expected returned item. The estimated amount of returned goods in each sale with a right of return, is based on a probability-weighted approach or most likely outcome, whichever is most predictive. The estimate is revised on each reporting date.
Principal versus agentI some countries Electrolux acts as an agent, i.e. Electrolux arranges for goods or services to be provided by an external supplier to the customer. Electrolux records as revenue the commission fee earned for facilitating the transfer of goods or service or the net amount of consideration that the company retains after paying the other party the consideration received in exchange for the goods or services to be provided by that party.
Freight chargesIn most cases freight is included in the price of the product sold and revenue is recognized at the same time as for the product.
Consignment stock or sell-through arrangementFor some customers Electrolux keeps the inventory of products in the ware-house of the customer or in the customer’s outlet. Transfer of control of the products are done when the customer lifts the product from the warehouse or when the product is sold to the end consumer. Electrolux recognize revenue when the control has been transferred or when there is a legal right of forcing a sales transaction.
Revenue types and flowsThe vast majority of the Group’s revenues of SEK 124,129m (120,771) during the year consisted of product sales. Revenue from service activities amounted to SEK 1,843m (1,772). The Group’s net sales in Sweden amounted to SEK 5,782m (5,283). Exports from Sweden during the year amounted to SEK 36,190m (31,384), of which SEK 32,619m (28,321) were to Group sub-sidiaries. The major part of the Swedish export comes from one of the Swedish entities acting as a buying/selling hub for the European business meaning that most of the European product flows are routed via this entity.
Disaggregation of revenueElectrolux manufactures and sells appliances mainly in the wholesale market to customers being retailers. Electrolux products include refrig-erators, dishwashers, washing machines, cookers, vacuum cleaners, air conditioners and small domestic appliances. Major Appliances and Home Care & SDA focus on the consumer market and Professional Products on professional users. Sales of services are not material in relation to Electrolux total net sales as described above. Product and geography are considered important attributes when disaggregating Electrolux revenue. Therefore, the table below presents net sales related to Major Appliances, Home Care & SDA and Professional Products per geographical region.
2018 2017
Disaggregation of revenueMajor
AppliancesHome Care
& SDAProfessional
Products TotalMajor
AppliancesHome Care
& SDAProfessional
Products Total
Geographical regionEurope, Middle East and Africa 42,732 3,891 6,951 53,574 38,524 3,628 6,141 48,292North America 38,875 926 849 40,650 40,656 1,427 764 42,847Latin America 17,076 887 — 17,963 17,302 975 — 18,277Asia Pacific 9,165 1,912 866 11,942 8,759 1,778 819 11,356Total 107,847 7,616 8,666 124,129 105,241 7,808 7,723 120,771
The table below presents the opening and closing balances of contract liabilities as well as movements during the year.
Prepaid income – service & warranty
Contract liabilitiesAdvances from Cus-
tomersCustomer bonuses/
incentives Short-term Long-termContract
liabilities, total
Opening balance, January 1, 2018 118 4,222 92 74 4,506Gross increase during the period 1,098 13,305 175 52 14,630Paid to/settled with customer — –12,721 — — –12,721Revenue recognized during the year –1,105 — –193 –11 –1,309Contracts cancelled during the year — –301 –14 –11 –326Other changes to contract balances –14 114 28 128Exchange-rate differences 3 165 10 7 185Closing balance, December 31, 2018 114 4,656 184 139 5,093
Notes 53
ELECTROLUX ANNUAL REPORT 2018
All amounts in SEKm unless otherwise stated

Note 5 Operating expenses
Cost of goods sold and additional information on costs by natureCost of goods sold includes expenses for the following items:• Finished goods i.e. cost for production and sourced products• Warranty• Environmental fees• Warehousing and transportation• Exchange-rate changes on payables and receivables and the effects
from currency hedging
Operating expenses 2018 2017
Direct material and components 49,679 47,956Sourced products 15,176 16,192Depreciation and amortization 4,150 3,977Salaries, other renumeration and employer contribution 22,014 20,364Other operating expenses 27,800 24,875Operating expenses, total 118,819 113,364
Cost of goods sold includes direct material and components amounting to SEK 49,679m (47,956) and sourced products amounting to SEK 15,176m (16,192). The depreciation and amortization charge for the year amounted to SEK 4,150m (3,977). Costs for research and development amounted to SEK 3,836m (3,566).
Government grants relating to expenses have been deducted in the related expenses by SEK 74m (79). Government grants related to assets have been recognized as deferred income in the balance sheet and will be recognized as income over the useful life of the assets. The remaining value of these grants, at the end of 2018, amounted to SEK 882m (879).
The Group’s operating income includes net exchange-rate differences in the amount of SEK –161m (90). The Group’s Swedish factories accounted for 1.2% (1.3) of the total value of production.
Selling and administration expensesSelling expenses include expenses for brand communication, sales driving communication and costs for sales and marketing staff. Selling expenses also include the cost for impairment of trade receivables.
Administration expenses include expenses for general management, controlling, human resources, shared service and IT expenses related to the named functions. Administration costs related to manufacturing are included in cost of goods sold.
Note 6 Other operating income and expenses
Group Parent Company
Other operating income 2018 2017 2018 2017
Gain on sale of property, plant and equipment 19 115 — —Gain on sale of operations and shares 205 6 — 1Pension curtailment — 134 — —Claim for recovery of overpaid tax 130 — — —Reversal of restructuring provision 140 — — —Bargain purchase (neg. goodwill) 150 — — —Earn-out adjustment 194 — — —Other 216 73 0 —Other operating income, total 1,054 328 0 1
Group Parent Company
Other operating expenses 2018 2017 2018 2017
Loss on sale of property, plant and equipment –38 –18 — –1Impairment — — –310 –104Fine to competition authority –493 — –493 —Provision for reorganization procedure –254 — — —Other –92 –5 –1 —Other operating expenses, total –877 –23 –804 –105
Other operating income and expenses, net 177 305 –804 –104
Note 7 Material profit or loss items in operating income
This note summarizes events and transactions with significant effects, which are relevant for understanding the financial performance when comparing income for the current period with previous periods, including items such as:• Capital gains and losses from divestments of product groups or major
units• Close-down or significant down-sizing of major units or activities• Restructuring initiatives with a set of activities aimed at reshaping a major
structure or process• Significant impairment• Other major non-recurring costs or income
Material items in the 2018 operating income are specified in the table below. Restructuring charge refers to the consolidation of freezer production in North America. Fine to competition authority refers to the completed inves-tigation by the French Competition Authority. Provision for reorganization procedures refers to the unfavorable court ruling in France, extending a reorganization procedure of a former subsidiary to include Electrolux Home Products France SAS. In 2017, no material items were identified.
Material profit or loss items 2018 2017
Restructuring charge –596 —Fine to competition authority –493 —Provision for reorganization procedure –254 —Total –1,343 —
Effect from material profit or loss items by function 2018 2017
Cost of goods sold –596 —Other operating income and expenses –747 —Total –1,343 —
ELECTROLUX ANNUAL REPORT 2018
54 Notes
All amounts in SEKm unless otherwise stated
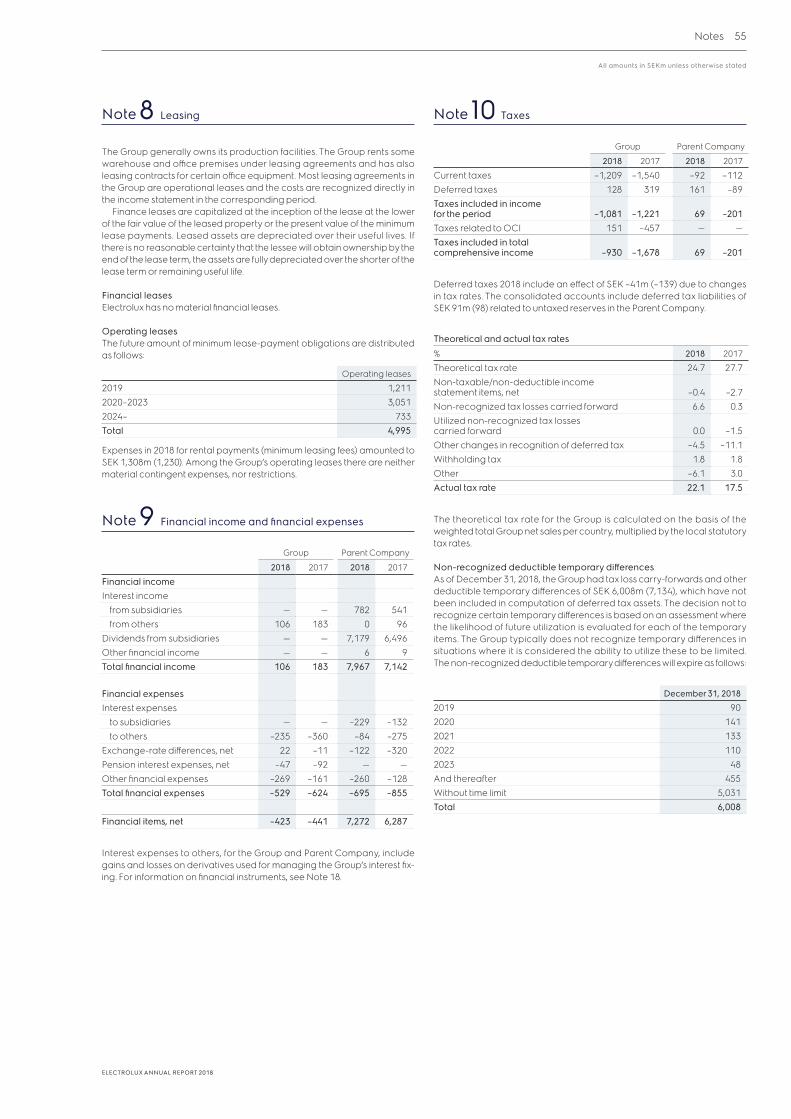
Note 8 Leasing
The Group generally owns its production facilities. The Group rents some warehouse and office premises under leasing agreements and has also leasing contracts for certain office equipment. Most leasing agreements in the Group are operational leases and the costs are recognized directly in the income statement in the corresponding period.
Finance leases are capitalized at the inception of the lease at the lower of the fair value of the leased property or the present value of the minimum lease payments. Leased assets are depreciated over their useful lives. If there is no reasonable certainty that the lessee will obtain ownership by the end of the lease term, the assets are fully depreciated over the shorter of the lease term or remaining useful life.
Financial leasesElectrolux has no material financial leases.
Operating leasesThe future amount of minimum lease-payment obligations are distributed as follows:
Operating leases
2019 1,2112020–2023 3,0512024– 733Total 4,995
Expenses in 2018 for rental payments (minimum leasing fees) amounted to SEK 1,308m (1,230). Among the Group’s operating leases there are neither material contingent expenses, nor restrictions.
Note 9 Financial income and financial expenses
Group Parent Company
2018 2017 2018 2017
Financial incomeInterest income
from subsidiaries — — 782 541from others 106 183 0 96
Dividends from subsidiaries — — 7,179 6,496Other financial income — — 6 9Total financial income 106 183 7,967 7,142
Financial expensesInterest expenses
to subsidiaries — — –229 –132to others –235 –360 –84 –275
Exchange-rate differences, net 22 –11 –122 –320Pension interest expenses, net –47 –92 — —Other financial expenses –269 –161 –260 –128Total financial expenses –529 –624 –695 –855
Financial items, net –423 –441 7,272 6,287
Interest expenses to others, for the Group and Parent Company, include gains and losses on derivatives used for managing the Group’s interest fix-ing. For information on financial instruments, see Note 18.
Note 10 Taxes
Group Parent Company
2018 2017 2018 2017
Current taxes –1,209 –1,540 –92 –112Deferred taxes 128 319 161 –89Taxes included in income for the period –1,081 –1,221 69 –201Taxes related to OCI 151 –457 — —Taxes included in total comprehensive income –930 –1,678 69 –201
Deferred taxes 2018 include an effect of SEK –41m (–139) due to changes in tax rates. The consolidated accounts include deferred tax liabilities of SEK 91m (98) related to untaxed reserves in the Parent Company.
Theoretical and actual tax rates% 2018 2017
Theoretical tax rate 24.7 27.7Non-taxable/non-deductible income statement items, net –0.4 –2.7Non-recognized tax losses carried forward 6.6 0.3Utilized non-recognized tax losses carried forward 0.0 –1.5Other changes in recognition of deferred tax –4.5 –11.1Withholding tax 1.8 1.8Other –6.1 3.0Actual tax rate 22.1 17.5
The theoretical tax rate for the Group is calculated on the basis of the weighted total Group net sales per country, multiplied by the local statutory tax rates.
Non-recognized deductible temporary differencesAs of December 31, 2018, the Group had tax loss carry-forwards and other deductible temporary differences of SEK 6,008m (7,134), which have not been included in computation of deferred tax assets. The decision not to recognize certain temporary differences is based on an assessment where the likelihood of future utilization is evaluated for each of the temporary items. The Group typically does not recognize temporary differences in situations where it is considered the ability to utilize these to be limited. The non-recognized deductible temporary differences will expire as follows:
December 31, 2018
2019 902020 1412021 1332022 1102023 48And thereafter 455Without time limit 5,031Total 6,008
Notes 55
ELECTROLUX ANNUAL REPORT 2018
All amounts in SEKm unless otherwise stated

Note 11 Other comprehensive income
Group
2018 2017
Items that will not be reclassified to income for the period:Remeasurement of provisions for post-employment benefitsOpening balance, January 1 449 –340Gain/loss taken to other comprehensive income –448 1,229Income tax relating to items that will not be reclassified 128 –440Closing balance, December 31 129 449
Items that may be reclassified subsequently to income for the period:Available-for-sale instrumentsOpening balance, January 1 1 0Change in accounting principle1) –1 —Gain/loss taken to other comprehensive income — 4Transferred to profit and loss — –3Closing balance, December 31 — 1
Cash flow hedgesOpening balance, January 1 –6 –101Gain/loss taken to other comprehensive income –4 –6Transferred to profit and loss on sale 2 101Closing balance, December 31 –8 –6
Exchange differences on translation of foreign operationsOpening balance, January 1 –2,495 –1,273Net investment hedge –65 –39Translation differences 269 –1,183Closing balance, December 31 –2,291 –2,495
Income taxOpening balance, January 1 –114 –97Income tax relating to items that may be reclassified 23 –17Closing balance, December 31 –91 –114Non-controlling interests, translation differences 0 –1
Other comprehensive income, net of tax –95 –3551) At transition to IFRS 9 a financial instrument classified as Available for sale was reclassified to
Financial asset at fair value through profit and loss.
Income taxes related to items of other comprehensive income were SEK 128m (–440) for remeasurement of provisions for post-employment benefits and SEK 23m (–17) for financial instruments for hedging.
The tables below show deferred tax assets and liabilities at the end of each reporting period and the change in net deferred tax assets and liabilities.
Deferred tax assets and deferred tax liabilities2018 2017
Deferred tax assets:Property, plant and equipment 322 300Provision for Pension obligations 945 932Provision for restructuring 170 360Other provisions 998 1,196Inventories 145 227Accrued expenses and prepaid income 467 464Unused tax losses carried forward 674 860Other deferred tax assets 3,768 2,312Deferred tax assets before netting of deferred tax assets and liabilities 7,489 6,651Netting of deferred tax assets and liabilities –1,041 –939Deferred tax assets net 6,448 5,712
Deferred tax liabilities:Property, plant and equipment 738 627Other provisions 159 150Inventories 315 286Other taxable temporary differences 697 606Deferred tax liabilities before netting of deferred tax assets and liabilities 1,909 1,669Netting of deferred tax assets and liabilities –1,041 –939Deferred tax liabilities net 868 730
Deferred tax assets and liabilities net 5,580 4,981
2018 2017Deferred tax assets and liabilities, net opening balance before restatement due to change in accounting principles 4,981 5,588Restatement of opening balance due to change in accounting principles 1 42Deferred tax assets and liabilities, net opening balance 4,982 5,630Recognized in income statement 128 319Recognized in other comprehensive income 142 –440Acquisitions of operations 110 –240Exchange rate differences 218 –288Deferred tax assets and liabilities, net closing balance 5,580 4,981
Other deferred tax assets include tax credits related to the production of energy-efficient appliances amounting to SEK 1,665m (1,631).
Cont. Note 10
ELECTROLUX ANNUAL REPORT 2018
56 Notes
All amounts in SEKm unless otherwise stated

Note 12 Property, plant and equipment
GroupLand and land improvements Buildings
Machinery and technical
installationsOther
equipment
Plants under construction
and advances Total
Acquisition costs Opening balance, January 1, 2017 1,418 10,194 40,167 2,640 2,088 56,507Acquired during the year 10 108 916 234 2,623 3,891Acquisition of operations 42 196 200 14 7 459Transfer of work in progress and advances 9 234 1,530 22 –1,795 0Sales, scrapping, etc. –74 –181 –1,629 –85 40 –1,929Exchange–rate differences –37 –198 –1,481 –36 –119 –1,871Closing balance, December 31, 2017 1,368 10,353 39,703 2,789 2,844 57,057Acquired during the year 13 201 1,178 221 3,036 4,649
Acquisition of operations 2 10 20 20 0 52
Transfer of work in progress and advances 91 167 807 180 –1,245 0Sales, scrapping, etc. –8 –78 –2,225 –118 –39 –2,468Exchange-rate differences 66 461 1,673 69 156 2,425Closing balance, December 31, 2018 1,532 11,114 41,156 3,161 4,752 61,715
Accumulated depreciation Opening balance, January 1, 2017 224 4,701 30,309 2,132 416 37,782Depreciation for the year 20 318 2,496 222 1 3,057Transfer of work in progress and advances 0 0 8 –8 0 0Sales, scrapping, etc. –9 –155 –1,572 –78 0 –1,814Impairment 0 0 20 0 0 20Exchange-rate differences –12 –85 –1,029 –23 –31 –1,180Closing balance, December 31, 2017 223 4,779 30,232 2,245 386 37,865Depreciation for the year 19 363 2,530 265 0 3,177Transfer of work in progress and advances 49 –31 –92 74 0 0Sales, scrapping, etc. –4 –54 –2,130 –110 1 –2,297Impairment 2 33 146 0 14 195Exchange-rate differences 14 235 1,346 62 30 1,687Closing balance, December 31, 2018 303 5,325 32,032 2,536 431 40,627Net carrying amount, December 31, 2017 1,145 5,574 9,471 544 2,458 19,192Net carrying amount, December 31, 2018 1,229 5,789 9,124 625 4,321 21,088
Property, plant, and equipment are stated at historical cost less straight-line accumulated depreciation, adjusted for any impairment charges. Land is not depreciated as it is considered to have an unlimited useful life. All other depreciation is calculated using the straight-line method and is based on the following estimated useful lives:• Land and land improvements 0–15 years• Buildings 10–40 years• Machinery and technical installations 3–15 years• Other equipment 3–10 years
Total impairment in 2018 was SEK 35m (0) on buildings and land, and SEK 146m (20) on machinery and other equipment and SEK 14m (0) on plants under construction. The majority of the impairment relates to the business area Major Appliances North America.
Parent CompanyLand and land improvements Buildings
Machinery and technical
installationsOther
equipment
Plants under construction
and advances Total
Acquisition costs Opening balance, January 1, 2017 4 57 729 392 49 1,231Acquired during the year — — — 61 14 75Transfer of work in progress and advances — — — 4 –4 0Sales, scrapping, discontinued operations etc. –3 –56 –671 –7 — –737Exchange-rate differences — — 2 2 1 5Closing balance, December 31, 2017 1 1 60 452 60 574Acquired during the year — — — 16 29 45Transfer of work in progress and advances — — 5 21 –26 0Sales, scrapping, etc. — — 0 –30 –34 –64Exchange-rate differences — — 3 3 2 8Closing balance, December 31, 2018 1 1 68 462 31 563
Accumulated depreciation Opening balance, January 1, 2017 4 57 725 337 — 1,123Depreciation for the year 0 0 16 17 — 33Sales, scrapping, discontinued operations etc. –3 –56 –688 –6 — –753Exchange-rate differences — — 1 2 — 3Closing balance, December 31, 2017 1 1 54 350 — 406Depreciation for the year 0 0 6 28 — 34Sales, scrapping, etc. 0 0 0 –26 — –26Exchange-rate differences — — 3 2 — 5Closing balance, December 31, 2018 1 1 63 354 — 419Net carrying amount, December 31, 2017 0 0 6 102 60 168Net carrying amount, December 31, 2018 0 0 5 108 31 144
Notes 57
ELECTROLUX ANNUAL REPORT 2018
All amounts in SEKm unless otherwise stated

Note 13 Goodwill and other intangible assets
Goodwill Goodwill is reported as an indefinite life intangible asset at cost less accu-mulated impairment losses.
Product developmentElectrolux capitalizes expenses for certain own development of new products provided that the level of certainty of their future economic benefits and useful life is high. The intangible asset is only recognized if the product is sellable on existing markets and that resources exist to complete the development. Only expenditures which are directly attributable to the new product’s development are recognized. Capitalized development costs are amortized over their useful lives, between 3 and 5 years, using the straight-line method.
SoftwareAcquired software licenses and development expenses are capitalized on the basis of the costs incurred to acquire and bring to use the specific soft-ware. These costs are amortized over useful lives, between 3 and 5 years, using the straight-line method.
TrademarksTrademarks are reported at historical cost less amortization and impair-ment. The Electrolux trademark in North America, acquired in 2000, is regarded as an indefinite life intangible asset and is not amortized in the group accounts. One of the Group’s key strategies is to develop Electrolux into the leading global brand within the Group’s product categories. This acquisition gave Electrolux the right to use the Electrolux brand worldwide, whereas it previously could be used only outside of North America. The total carrying amount for the Electrolux brand is SEK 410m, included in the item Other in the table on page 59. All other trademarks are amortized over their useful lives, estimated to 5 to 10 years, using the straight-line method.
Customer relationshipsCustomer relationships are recognized at fair value in connection with acquisitions. The values of these relationships are amortized over the esti-mated useful lives, between 5 and 15 years, using the straight-line method.
Intangible assets with indefinite useful livesGoodwill as at December 31, 2018, had a total carrying value of SEK 8,239m. The allocation, for impairment-testing purposes, on cash-generating units is shown in the table below.
All intangible assets with indefinite useful lives are tested for impairment at least once every year. Single assets are tested more often in case there are indications of impairment. The recoverable amounts of the cash-generating units have been determined based on value in use calculations. The cash-generating units equal the business areas. Costs related to group services and global leverage activities are carried by the cash-generating units and therefore included in the impairment testing of each cash-generating unit. Common group costs, related to group management activities typically required to run the Electrolux Group cannot be allocated on a reasonable and consistent basis to any of the cash-generating units and are therefore included in the impairment test of the total of all cash-generating units.
Value in use is calculated using the discounted cash flow model based on by Group management approved forecasts for the coming four years. The forecasts are built up from the estimate of the units within each business area. The preparation of the forecast requires a number of key assumptions such as volume, price, product mix, prices for raw material and compo-nents, which will create a basis for future growth and gross margin. These figures are set in relation to historic figures and external reports on market growth. The cash flow for the last year of the four-year period is used as the base for the perpetuity calculation. The discount rates are based on the pre-tax Electrolux Group WACC (Weighted Average Cost of Capital) with addition of a country risk premium for each individual country. The individual country discount rates are used to calculate a weighted average discount rate for each cash-generating units
The pre-tax discount rates used in 2018 were for the main part within a range of 9.3% (9.4) to 12.0% (11.9). For the calculation of the in-perpetuity value, Gordon’s growth model is used. According to Gordon’s model, the terminal value of a growing cash flow is calculated as the starting cash flow divided by cost of capital less the growth rate. Cost of capital less growth of 2% (2%) is within the range of 7.3 to 10.0%.
Sensitivity analyses have been carried out based on a reduction of the operating margin by 0.5 percentage points and by an increase in the cost of capital by one percentage point respectively. None of the sensitivity analyses led to a reduction of the recoverable amount below the carrying amount for any of the cash-generating units, i.e. the hypothetical changes in key assumptions would not lead to any impairment. The calculations are based on management’s assessment of reasonably possible adverse changes in operating margin and cost of capital, yet they are hypothetical and should not be viewed as an indication that these factors are likely to change. The sensitivity analyses should therefore be interpreted with caution.
Goodwill, value of trademark and discount rate2018 2017
Goodwill Electrolux
trademark Discount
rate, % Goodwill Electrolux
trademark Discount
rate, %
Major Appliances Europe, Middle East and Africa 2,513 — 9.9 2,506 — 10.0Major Appliances North America 493 410 9.3 451 410 9.4Major Appliances Latin America 940 — 12.0 1,114 — 11.9Major Appliances Asia/Pacific 1,510 — 9.6 1,528 — 9.9Professional Products 1,439 — 10.1 776 — 10.0Home Care & SDA 1,344 — 9.9 1,253 — 10.0Total 8,239 410 7,628 410
ELECTROLUX ANNUAL REPORT 2018
58 Notes
All amounts in SEKm unless otherwise stated

Goodwill and other intangible assetsGroup
Other intangible assetsParent
Company
Goodwill
Product develop-
ment Software Other
Total other intangible
assetsTrademarks,
software, etc.
Acquisition costs Opening balance, January 1, 2017 4,742 3,239 3,520 1,729 8,488 3,180Acquired during the year — — 144 174 318 174Acquisition of operations 3,220 — — 764 764 —Internally developed — 418 225 — 643 423Reclassification — –29 17 12 — —Fully amortized — –112 –129 — –241 —Sales, scrapping etc. — –11 –38 — –49 –40Exchange-rate differences –334 –75 –51 –78 –204 15Closing balance, December 31, 2017 7,628 3,430 3,688 2,601 9,719 3,752Acquired during the year — — 121 1 122 102Acquisition of operations 6171) 1 1 214 216 —Internally developed — 415 441 — 856 447Reclassification — –51 52 –1 — —Fully amortized — –268 –870 –52 –1,190 –512Sales, scrapping etc. –4 –44 –106 –45 –195 –13Exchange-rate differences –2 91 91 –30 152 34Closing balance, December 31, 2018 8,239 3,574 3,418 2,688 9,680 3,810
Accumulated amortization Opening balance, January 1, 2017 — 2,286 2,366 724 5,376 1,934Amortization for the year — 300 391 229 920 284Reclassification — — — — — —Fully amortized — –112 –129 — –241 —Impairment — 3 — — 3 –3Exchange-rate differences — –33 –20 –27 –80 7Closing balance, December 31, 2017 — 2,444 2,608 926 5,978 2,222Amortization for the year — 344 377 251 972 378Reclassification — — — — —Fully amortized — –268 –870 –52 –1,190 –512Impairment — –9 — — –9Sales, scrapping etc. — –25 –60 — –85 –5Exchange-rate differences — 62 63 –30 95 13Closing balance, December 31, 2018 — 2,548 2,118 1,095 5,761 2,096Carrying amount, December 31, 2017 7,628 986 1,080 1,675 3,741 1,530Carrying amount, December 31, 2018 8,239 1,026 1,300 1,593 3,919 1,7141) Including an adjustment of a provisional value of SEK 10m within the measurement period related to an acquisition during 2017.
Included in the item Other are trademarks of SEK 813m (901) and customer relationships etc. amounting to SEK 780m (774). Amortization of intangible assets is included within Cost of goods sold with SEK 409m (472), Administrative expenses with SEK 320m (266) and Selling expenses with SEK 243m (182) in the income statement. Electrolux did not capitalize any borrowing costs during 2018 or 2017.
Cont. Note 13
Notes 59
ELECTROLUX ANNUAL REPORT 2018
All amounts in SEKm unless otherwise stated

Note 14 Other non-current assets
Group December 31,
Parent Company December 31,
2018 2017 2018 2017
Shares in subsidiaries — — 32,245 29,823Participations in other companies — — 219 225Long-term receivables in subsidiaries — — 3,459 3,548Other receivables 952 459 20 20Total 952 459 35,943 33,616
Note 15 Inventories
Group December 31,
Parent Company December 31,
2018 2017 2018 2017
Raw materials 3,590 3,288 — —Products in progress 346 277 — —Finished products 12,790 11,058 2,813 2,640Advances to suppliers 24 32 — —Total 16,750 14,655 2,813 2,640
Inventories and work in progress are valued at the lower of cost, at normal capacity utilization, and net realizable value. Net realizable value is defined as the estimated selling price in the ordinary course of business less the estimated costs of completion and the estimated costs necessary to make the sale at market value. The cost of finished goods and work in progress comprises development costs, raw materials, direct labor, tooling costs, other direct costs and related production overheads. The cost of invento-ries is assigned by using the weighted average cost formula. Provisions for obsolescence are included in the value for inventory.
The cost of inventories recognized as expense and included in Cost of goods sold amounted to SEK 87,658m (85,684) for the Group.
Write-downs due to obsolescence amounted to SEK 272m (257) and reversals of previous write-downs amounted to SEK 364m (300) for the Group. The amounts have been included in the item Cost of goods sold in the income statement.
Note 16 Other current assets
Group December 31,
2018 2017
Miscellaneous short-term receivables 2,935 2,426Provisions for doubtful accounts –138 –35Prepaid expenses and accrued income 1,467 1,207Prepaid interest expenses and accrued interest income 243 241Total 4,507 3,839
Miscellaneous short-term receivables include, for example claims related to VAT, operational taxes, and insurance claims.
Note 17 Trade receivables
2018 2017
Trade receivables 22,417 21,548Provisions for impairment of receivables –935 –801Trade receivables, net 21,482 20,747Provisions in relation to trade receivables, % 4.2 3.7
IFRS 9 introduced a new impairment model for financial assets, moving from an ‘incurred loss model’ to an ‘expected loss model’. This affects the calcu-lation of provisions for bad debts and resulted in an expected loss being provided for on all financial receivables, including those not overdue. The effect from applying the new model on trade receivables led to an increase of the bad debt provision for the Group of SEK 18m, equivalent to 2.3% of the provision as per December 31, 2017. The effect is based on the recalcula-tion of the bad debt reserve as per year-end 2017 and is recognized as an opening balance adjustment in 2018. This adjustment affected Trade receivables, Deferred tax and Equity (Retained earnings).
Trade receivables are recognized initially at fair value and subsequently measured at amortized cost using the effective interest method, less pro-vision for expected losses. The Group applies the simplified approach for trade receivables and uses a matrix to estimate the expected losses. The change in amount of the provision is recognized in the income statement within selling expenses. The expected loss calculation is based on historical data and is adjusted with a forward looking analysis, including macro-economic factors impacting the different customer segments and more specific factors such as signs of bankruptcy, officially known insolvency etc. Electrolux uses credit insurance as a mean of protection. The Group’s internal guidelines to the companies is to at least reserve 0.01% for current trade receivables and for receivables maximum 15 days past due. For trade receivables past due between 16 to 60 days Electrolux reserves 1% and increase to 5% for receivables past due between 61 to 180 days. Trade receivables that are 6 months past due but less than 12 months is reserved at 45% and receivables that are 12 months past due and more are reserved at 100%. Percentages are for year end. At year end, there is no significant impact on provisions from changes in the forward looking factors.
Provisions for impairment of receivables2018 2017
Provisions, January 1 –801 –757Effect of change in accounting principles –18 —Acquisition of operations –4 –18New provisions –212 –212Actual credit losses 135 152Exchange-rate differences and other changes –35 34Provisions, December 31 –935 –801
The fair value of trade receivables equals their carrying amount as the impact of discounting is not significant. Electrolux has a significant credit exposure on a number of major customers, primarily in the U.S., Latin America and Europe. Receivables concentrated to customers with credit limits amounting to SEK 300m or more represent 33% (36) of the total trade receivables. The creation and usage of provisions for impaired receivables have been included in selling expenses in the income state-ment.
Timing analysis of trade receivables past due2018 2017
Trade receivables not overdue 20,571 20,485Past due 1 - 15 days 481 401Past due 16 - 60 days 239 462 – 6 months overdue 191 136 –12 months overdue 0 0More than 1 year overdue 0 0Total trade receivables past due but not impaired 911 460Impaired trade receivables 935 801Total trade receivables 22,417 21,746Past due, including impaired, in relation to trade receivables, % 8.2 5.8
ELECTROLUX ANNUAL REPORT 2018
60 Notes
All amounts in SEKm unless otherwise stated
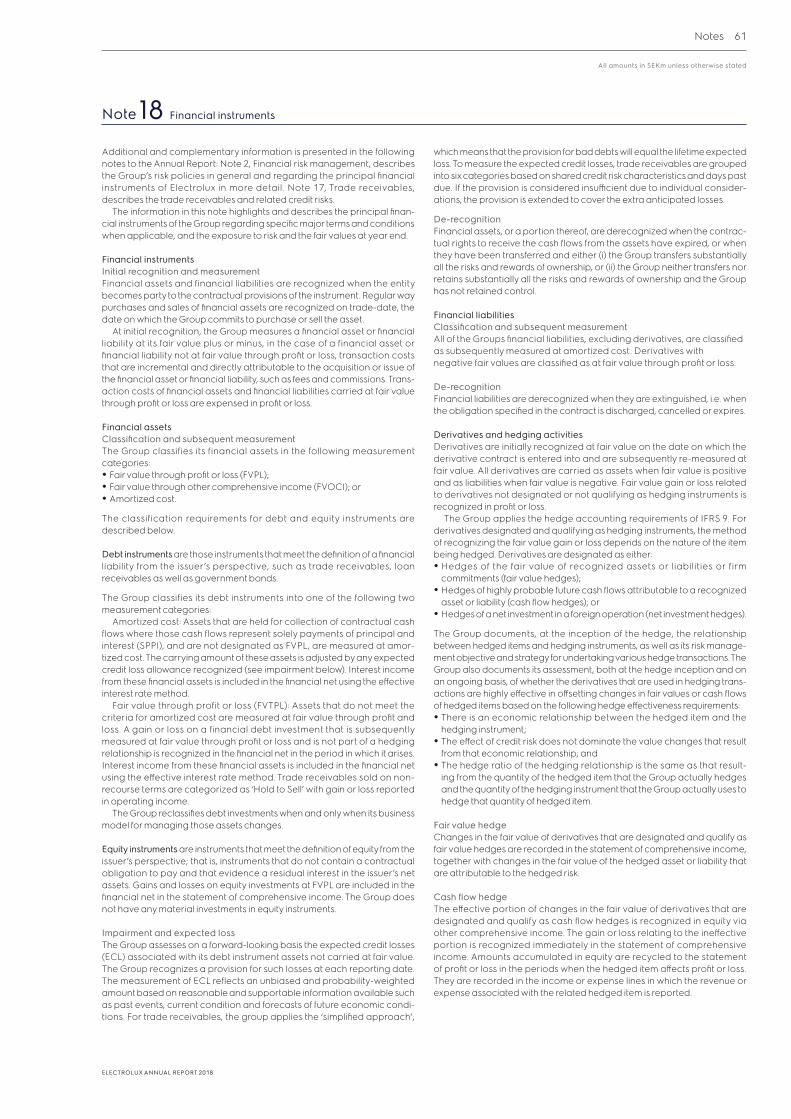
Note 18 Financial instruments
Additional and complementary information is presented in the following notes to the Annual Report: Note 2, Financial risk management, describes the Group’s risk policies in general and regarding the principal financial instruments of Electrolux in more detail. Note 17, Trade receivables, describes the trade receivables and related credit risks.
The information in this note highlights and describes the principal finan-cial instruments of the Group regarding specific major terms and conditions when applicable, and the exposure to risk and the fair values at year end.
Financial instrumentsInitial recognition and measurementFinancial assets and financial liabilities are recognized when the entity becomes party to the contractual provisions of the instrument. Regular way purchases and sales of financial assets are recognized on trade-date, the date on which the Group commits to purchase or sell the asset.
At initial recognition, the Group measures a financial asset or financial liability at its fair value plus or minus, in the case of a financial asset or financial liability not at fair value through profit or loss, transaction costs that are incremental and directly attributable to the acquisition or issue of the financial asset or financial liability, such as fees and commissions. Trans-action costs of financial assets and financial liabilities carried at fair value through profit or loss are expensed in profit or loss.
Financial assetsClassification and subsequent measurementThe Group classifies its financial assets in the following measurement categories: • Fair value through profit or loss (FVPL);• Fair value through other comprehensive income (FVOCI); or • Amortized cost.
The classification requirements for debt and equity instruments are described below.
Debt instruments are those instruments that meet the definition of a financial liability from the issuer’s perspective, such as trade receivables, loan receivables as well as government bonds.
The Group classifies its debt instruments into one of the following two measurement categories:
Amortized cost: Assets that are held for collection of contractual cash flows where those cash flows represent solely payments of principal and interest (SPPI), and are not designated as FVPL, are measured at amor-tized cost. The carrying amount of these assets is adjusted by any expected credit loss allowance recognized (see impairment below). Interest income from these financial assets is included in the financial net using the effective interest rate method.
Fair value through profit or loss (FVTPL): Assets that do not meet the criteria for amortized cost are measured at fair value through profit and loss. A gain or loss on a financial debt investment that is subsequently measured at fair value through profit or loss and is not part of a hedging relationship is recognized in the financial net in the period in which it arises. Interest income from these financial assets is included in the financial net using the effective interest rate method. Trade receivables sold on non-recourse terms are categorized as ‘Hold to Sell’ with gain or loss reported in operating income.
The Group reclassifies debt investments when and only when its business model for managing those assets changes.
Equity instruments are instruments that meet the definition of equity from the issuer’s perspective; that is, instruments that do not contain a contractual obligation to pay and that evidence a residual interest in the issuer’s net assets. Gains and losses on equity investments at FVPL are included in the financial net in the statement of comprehensive income. The Group does not have any material investments in equity instruments.
Impairment and expected loss The Group assesses on a forward-looking basis the expected credit losses (ECL) associated with its debt instrument assets not carried at fair value. The Group recognizes a provision for such losses at each reporting date. The measurement of ECL reflects an unbiased and probability-weighted amount based on reasonable and supportable information available such as past events, current condition and forecasts of future economic condi-tions. For trade receivables, the group applies the ‘simplified approach’,
which means that the provision for bad debts will equal the lifetime expected loss. To measure the expected credit losses, trade receivables are grouped into six categories based on shared credit risk characteristics and days past due. If the provision is considered insufficient due to individual consider-ations, the provision is extended to cover the extra anticipated losses.
De-recognitionFinancial assets, or a portion thereof, are derecognized when the contrac-tual rights to receive the cash flows from the assets have expired, or when they have been transferred and either (i) the Group transfers substantially all the risks and rewards of ownership, or (ii) the Group neither transfers nor retains substantially all the risks and rewards of ownership and the Group has not retained control.
Financial liabilitiesClassification and subsequent measurementAll of the Groups financial liabilities, excluding derivatives, are classified as subsequently measured at amortized cost. Derivatives with negative fair values are classified as at fair value through profit or loss.
De-recognitionFinancial liabilities are derecognized when they are extinguished, i.e. when the obligation specified in the contract is discharged, cancelled or expires.
Derivatives and hedging activitiesDerivatives are initially recognized at fair value on the date on which the derivative contract is entered into and are subsequently re-measured at fair value. All derivatives are carried as assets when fair value is positive and as liabilities when fair value is negative. Fair value gain or loss related to derivatives not designated or not qualifying as hedging instruments is recognized in profit or loss.
The Group applies the hedge accounting requirements of IFRS 9. For derivatives designated and qualifying as hedging instruments, the method of recognizing the fair value gain or loss depends on the nature of the item being hedged. Derivatives are designated as either: • Hedges of the fair value of recognized assets or liabilities or firm
commitments (fair value hedges);• Hedges of highly probable future cash flows attributable to a recognized
asset or liability (cash flow hedges); or• Hedges of a net investment in a foreign operation (net investment hedges).
The Group documents, at the inception of the hedge, the relationship between hedged items and hedging instruments, as well as its risk manage-ment objective and strategy for undertaking various hedge transactions. The Group also documents its assessment, both at the hedge inception and on an ongoing basis, of whether the derivatives that are used in hedging trans-actions are highly effective in offsetting changes in fair values or cash flows of hedged items based on the following hedge effectiveness requirements:• There is an economic relationship between the hedged item and the
hedging instrument;• The effect of credit risk does not dominate the value changes that result
from that economic relationship; and• The hedge ratio of the hedging relationship is the same as that result-
ing from the quantity of the hedged item that the Group actually hedges and the quantity of the hedging instrument that the Group actually uses to hedge that quantity of hedged item.
Fair value hedgeChanges in the fair value of derivatives that are designated and qualify as fair value hedges are recorded in the statement of comprehensive income, together with changes in the fair value of the hedged asset or liability that are attributable to the hedged risk.
Cash flow hedgeThe effective portion of changes in the fair value of derivatives that are designated and qualify as cash flow hedges is recognized in equity via other comprehensive income. The gain or loss relating to the ineffective portion is recognized immediately in the statement of comprehensive income. Amounts accumulated in equity are recycled to the statement of profit or loss in the periods when the hedged item affects profit or loss. They are recorded in the income or expense lines in which the revenue or expense associated with the related hedged item is reported.
Notes 61
ELECTROLUX ANNUAL REPORT 2018
All amounts in SEKm unless otherwise stated

Cont. Note 18
Net investment hedgeHedges of net investments in foreign operations are accounted for similarly to cash flow hedges. Any gain or loss on the hedging instrument relating to the effective portion of the hedge is recognized directly in equity via other comprehensive income; the gain or loss relating to the ineffective portion is recognized immediately in the statement of comprehensive income. Gains and losses accumulated in equity are included in the statement of compre-hensive income when the foreign operation is disposed of as part of the gain or loss on the disposal.
Net debtAt year-end 2018, the Group’s financial net debt amounted to SEK –1,989m (–2,437). The table below presents how the Group calculates net debt and what it consists of.
Net debtDecember 31
2018 2017
Short-term loans 1,429 990Short-term part of long-term loans 2,355 1,501Trade receivables with recourse 168 204Short-term borrowings 3,952 2,695Financial derivative liabilities 81 228Accrued interest expenses and prepaid interest income 28 27Total short-term borrowings 4,062 2,950Long-term borrowings 6,198 6,587Total borrowings 10,260 9,537
Cash and cash equivalents 11,697 11,289Short-term investments 176 358Financial derivative assets 132 85Prepaid interest expenses and accrued interest income 243 242Liquid funds 12,249 11,974Financial net debt –1,989 –2,437
Net provision for post-employment benefits 3,814 2,634Net debt 1,825 197Revolving credit facility (EUR 1,000m)1) 10,277 9,8441) The facilities are not included in net borrowings, but can be used for short-term and long-
term funding.
Liquid fundsLiquid funds as defined by the Group consist of cash and cash equivalents, short-term investments, financial derivative assets and prepaid interest expenses and accrued interest income. Cash and cash equivalents consist of cash on hand, bank deposits and other short-term highly liquid invest-ments with a maturity of 3 months or less.
The table to the right presents the key data of liquid funds. The carrying amount of liquid funds is approximately equal to fair value.
Liquidity profileDecember 31
2018 2017
Cash and cash equivalents 11,697 11,289Short-term investments 176 358Financial derivative assets 132 85Prepaid interest expenses and accrued interest income 243 242Liquid funds 12,249 11,974% of annualized net sales1) 18.1 17.0Net liquidity 8,187 9,024Fixed interest term, days 12 16Effective yield, % (average per annum) 1.1 1.81) Liquid funds in relation to net sales, see Note 30 for definition.
For 2018, liquid funds, including unused revolving credit facilities of EUR 1,000m, amounted to 18.1% (17.0) of annualized net sales. Net liquidity is calculated by deducting short-term borrowings from liquid funds.
Interest-bearing liabilitiesBorrowings are initially recognized at fair value net of transaction costs incurred. After initial recognition, borrowings are valued at amortized cost using the effective interest method.
In 2018, SEK 1,531m of long-term borrowings matured or were amor-tized. These maturities were partly refinanced to the amount of SEK 1,736m.
At year-end 2018, the Group’s total interest-bearing liabilities amounted to SEK 9,982m (9,078), of which SEK 8,553m (8,088) referred to long-term borrowings including maturities within 12 months. Long-term borrowings with maturities within 12 months amounted to SEK 2,355mm (1,501). The outstanding long-term borrowings have mainly been made under the European Medium-Term Note Program and via bilateral loans. The majority of total long-term borrowings, SEK 8,001m (7,609), is raised at parent company level. Electrolux also has an unused committed multicurrency revolving credit facility of EUR 1,000m maturing 2023. However, Electrolux expects to meet any future requirements for short-term borrowings through bilateral bank facilities and capital-market programs such as commercial paper programs.
At year-end 2018, the average interest-fixing period for long-term borrowings was 1.0 years (0.6). The calculation of the average interest- fixing period includes the effect of interest-rate swaps used to manage the interest-rate risk of the debt portfolio. The average interest rate for the total borrowings was 2.5% (2.1) at year end.
The fair value of the interest-bearing borrowings was SEK 7,967m. The fair value including swap transactions used to manage the interest fixing was approximately SEK 7,965m.
Changes in liabilities arising from financingCash Flow Non Cash flow
Opening Balance Amortization New debt
Net cash change Acquisitions
Exchange rate differences
ClosingBalance
Long-term borrowings (including short-term part of long-term) 8,088 –1,531 1,737 — 13 246 8,553Short-term borrowings (excluding short-term part of long-term) 1,194 — — 397 134 –128 1,597Total 9,282 –1,531 1,737 397 147 118 10,150
ELECTROLUX ANNUAL REPORT 2018
62 Notes
All amounts in SEKm unless otherwise stated

Cont. Note 18
The table below sets out the carrying amount of the Group’s borrowings.
BorrowingsCarrying amount,
December 31
Issue/maturity date Description of loan Interest rate, % CurrencyNominal value
(in currency) 2018 2017
Bond loans1)
2013-2020 Euro MTN Program 3.440 SEK 170 170 1702013-2020 Euro MTN Program Floating SEK 830 830 8302014–2019 Euro MTN Program Floating SEK 750 — 7502014–2019 Euro MTN Program 2.340 SEK 250 — 2502014–2019 Euro MTN Program 1.000 EUR 100 — 9822017–2024 Euro MTN Program Floating SEK 350 350 3502018–2023 Euro MTN Program 1.125 SEK 200 200 —2018–2023 Euro MTN Program Floating SEK 800 806 —2018–2025 Euro MTN Program 3.724 USD 73 655 —Total bond loans 3,011 3,332
Other long-term loans1)
1996–2036 Fixed rate loans in Germany 7.870 EUR 39 400 381
2013–2021Amortizing long term bank loan in Sweden, long part Floating SEK 461 461 769
2015–2021 Long-term bank loans in Sweden Floating USD 170 1,522 1,3922017–2026 Amortizing long term bank loan in Sweden Floating USD 75 673 616
Other long-term loans 131 97Total other long-term loans 3,187 3,255Long-term borrowings 6,198 6,587
Short-term part of long-term loans2)
2012-2018 Euro MTN Program 2.910 SEK 270 — 2702013–2018 Euro MTN Program Floating SEK 600 — 6002013–2018 Euro MTN Program 2.875 SEK 400 — 400
2013–2021Amortizing long term bank loan in Sweden, short part Floating SEK 231 — 231
2013–2021Amortizing long term bank loan in Sweden, short part Floating SEK 308 308 —
2014–2019 Euro MTN Program Floating SEK 750 750 —2014–2019 Euro MTN Program 2.340 SEK 250 250 —2014–2019 Euro MTN Program 1.000 EUR 100 1,026 —
Other short-term part of long-term loans 21 —Total short-term part of long-term loans 2,355 1,501
Other short-term loansShort-term bank loans in Egypt Floating EGP 363 182 208Short-term bank loans in Brazil Floating BRR 292 675 61Short-term bank loans in Thailand Floating THB 942 259 212Other bank borrowings and commercial papers 313 509
Total other short-term loans 1,429 990Trade receivables with recourse 168 204Short-term borrowings 3,952 2,695Long-term and short-term borrowings 10,150 9,282Fair value of derivative liabilities 81 228Accrued interest expenses and prepaid interest income 28 27Total borrowings 10,260 9,5371) The interest-rate fixing profile of the borrowings has been adjusted with interest-rate swaps.2) Long-term borrowings with maturities within 12 months are classified as short-term borrowings in the Group’s balance sheet.
Short-term borrowings pertain mainly to countries with capital restrictions. The average maturity of the Group’s long-term borrowings including long-term borrowings with maturities within 12 months was 2.6 years (2.4), at the end of 2018. The table below presents the repayment schedule of long-term borrowings.
Repayment schedule of long-term borrowings, December 312019 2020 2021 2022 2023 2024— Total
Debenture and bond loans — 1,000 — — 1,006 1,005 3,011Bank and other loans — 412 1,779 103 103 790 3,187Short-term part of long-term loans 2,355 — — — — — 2,355Total 2,355 1,412 1,779 103 1,109 1,795 8,553
Notes 63
ELECTROLUX ANNUAL REPORT 2018
All amounts in SEKm unless otherwise stated

Other interest-bearing investments Interest-bearing receivables from customer financing amounting to SEK 0m (0) are included in the item Trade receivables in the consolidated balance sheet. The Group’s customer-financing activities are performed in order to provide sales support and are directed mainly to independent retailers in Scandinavia. The majority of the financing is shorter than 12 months. There is no major concentration of credit risk related to customer financing. Collaterals and the right to repossess the inventory also reduce the credit risk in the financing operations. The income from customer financing is subject to interest-rate risk. This risk is immaterial to the Group.
Commercial flowsThe table below shows the forecasted transaction flows, imports and exports, for the 12-month period of 2019 and hedges at year-end 2018.
The hedged amounts are dependent on the hedging policy for each flow considering the existing risk exposure. The effect of hedging on oper-ating income during 2018 amounted to SEK 25m (–107). At year-end 2018, the unrealized fair value of forward contracts for hedging of forecasted transaction flows amounted to SEK 2m (–12).
Forecasted transaction flows and hedgesAUD BRL CAD CHF CLP CNY EUR GBP THB USD Other Total
Inflow of currency, long position 2,966 3,295 2,547 2,064 1,342 352 3,898 3,443 1,945 2,336 11,637 35,826Outflow of currency, short position –136 –314 0 –238 –386 –1,906 –8,843 –624 –3,690 –12,557 –7,133 –35,826Gross transaction flow 2,830 2,981 2,547 1,827 957 –1,554 –4,945 2,819 –1,745 –10,221 4,504 —Hedges –554 –648 –162 –216 –197 1,295 108 –931 –168 1,559 –86 —Net transaction flow 2,277 2,333 2,385 1,610 760 –258 –4,837 1,887 –1,913 –8,662 4,418 —
Maturity profile of financial liabilities and derivativesThe table below presents the undiscounted cash flows of the Group’s contractual liabilities related to financial instruments based on the remaining period at the balance sheet date to the contractual maturity date. Floating interest cash flows with future fixing dates are estimated using the forward-forward interest rates at year-end. Any cash flow in foreign currency is converted to Swedish krona using the FX spot rates at year-end. The short-term liabilities from account payables are matched by positive cash flow from trade receivables. The loan maturities can be offset by the available liquidity and/or a combination by new issued bonds, commercial papers or bank loans. On top of the other sources, Electrolux has an unused committed credit facility of EUR 1,000m.
Maturity profile of financial liabilities and derivatives – undiscounted cash flows≤ 0.5 year
> 0.5 year < 1 year
> 1 year < 2 years
> 2 years < 5 years > 5 years Total
Loans –2,684 –1,260 –1,659 –3,173 –1,720 –10,496
Net settled derivatives 0 0 –1 –1 0 –3Gross settled derivatives 54 3 — — — 57 whereof outflow –20,740 –875 — — — –21,615 whereof inflow 20,794 877 — — — 21,671Accounts payable –34,443 — — — — –34,443Financial guarantees –992 — — — — –992Total –38,065 –1,257 –1,660 –3,174 –1,720 –45,877
Net gain/loss, fair value and carrying amount on financial instrumentsThe tables below present net gain/loss on financial instruments, the effect in the income statement and equity, and the fair value and carrying amount of financial assets and liabilities. Net gain/loss can include both exchange-rate differences and gain/loss due to changes in interest-rate levels.
Net gain/loss, income and expense on financial instruments 2018 2017
Gain/loss in profit
and lossGain/loss from OCI Income Expense
Gain/loss in profit
and lossGain/loss
in OCI Income Expense
Recognized in operating incomeFinancial assets and liabilities at fair value through profit and loss 86 25 — — –107 — — —Loans and receivables — — — — 197 — — —Financial assets and liabilities at amortized cost –279 — — — — — — —Total net gain/loss, income and expense –193 25 — — 90 — — —
Recognized in financial itemsFinancial assets and liabilities at fair value through profit and loss –56 — — –193 216 58 — –9Loans and receivables — — — — –286 — 190 —Available–for–sale financial assets — — — — –104 1 — —Financial assets at amortized cost –116 — 107 — — — — —Other financial liabilities at amortized cost 146 — — –311 130 — — –638Total net gain/loss, income and expense –26 — 107 –504 –44 59 190 –647
Cont. Note 18
ELECTROLUX ANNUAL REPORT 2018
64 Notes
All amounts in SEKm unless otherwise stated
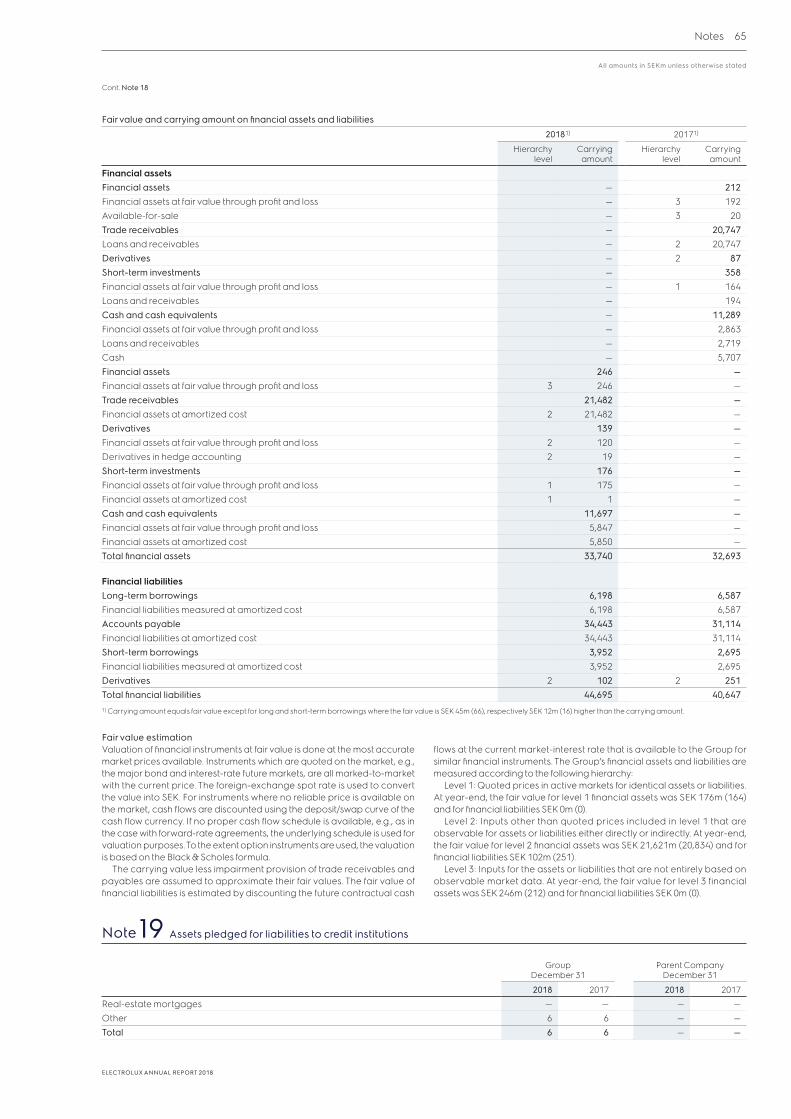
Cont. Note 18
Fair value and carrying amount on financial assets and liabilities20181) 20171)
Hierarchy level
Carrying amount
Hierarchy level
Carrying amount
Financial assetsFinancial assets — 212Financial assets at fair value through profit and loss — 3 192Available-for-sale — 3 20Trade receivables — 20,747Loans and receivables — 2 20,747Derivatives — 2 87Short-term investments — 358Financial assets at fair value through profit and loss — 1 164Loans and receivables — 194Cash and cash equivalents — 11,289Financial assets at fair value through profit and loss — 2,863Loans and receivables — 2,719Cash — 5,707Financial assets 246 —Financial assets at fair value through profit and loss 3 246 —Trade receivables 21,482 —Financial assets at amortized cost 2 21,482 —Derivatives 139 —Financial assets at fair value through profit and loss 2 120 —Derivatives in hedge accounting 2 19 —Short-term investments 176 —Financial assets at fair value through profit and loss 1 175 —Financial assets at amortized cost 1 1 —Cash and cash equivalents 11,697 —Financial assets at fair value through profit and loss 5,847 —Financial assets at amortized cost 5,850 —Total financial assets 33,740 32,693
Financial liabilitiesLong-term borrowings 6,198 6,587Financial liabilities measured at amortized cost 6,198 6,587Accounts payable 34,443 31,114Financial liabilities at amortized cost 34,443 31,114Short-term borrowings 3,952 2,695Financial liabilities measured at amortized cost 3,952 2,695Derivatives 2 102 2 251Total financial liabilities 44,695 40,6471) Carrying amount equals fair value except for long and short-term borrowings where the fair value is SEK 45m (66), respectively SEK 12m (16) higher than the carrying amount.
Fair value estimationValuation of financial instruments at fair value is done at the most accurate market prices available. Instruments which are quoted on the market, e.g., the major bond and interest-rate future markets, are all marked-to-market with the current price. The foreign-exchange spot rate is used to convert the value into SEK. For instruments where no reliable price is available on the market, cash flows are discounted using the deposit/swap curve of the cash flow currency. If no proper cash flow schedule is available, e.g., as in the case with forward-rate agreements, the underlying schedule is used for valuation purposes. To the extent option instruments are used, the valuation is based on the Black & Scholes formula.
The carrying value less impairment provision of trade receivables and payables are assumed to approximate their fair values. The fair value of financial liabilities is estimated by discounting the future contractual cash
flows at the current market-interest rate that is available to the Group for similar financial instruments. The Group’s financial assets and liabilities are measured according to the following hierarchy:
Level 1: Quoted prices in active markets for identical assets or liabilities. At year-end, the fair value for level 1 financial assets was SEK 176m (164) and for financial liabilities SEK 0m (0).
Level 2: Inputs other than quoted prices included in level 1 that are observable for assets or liabilities either directly or indirectly. At year-end, the fair value for level 2 financial assets was SEK 21,621m (20,834) and for financial liabilities SEK 102m (251).
Level 3: Inputs for the assets or liabilities that are not entirely based on observable market data. At year-end, the fair value for level 3 financial assets was SEK 246m (212) and for financial liabilities SEK 0m (0).
Note 19 Assets pledged for liabilities to credit institutions
Group December 31
Parent Company December 31
2018 2017 2018 2017
Real-estate mortgages — — — —Other 6 6 — —Total 6 6 — —
Notes 65
ELECTROLUX ANNUAL REPORT 2018
All amounts in SEKm unless otherwise stated

Note 20 Share capital, number of shares and earnings per share
The equity attributable to equity holders of the Parent Company consists of the following items:
Share capitalAs per December 31, 2018, the share capital of AB Electrolux consisted of 8,192,539 Class A shares and 300,727,769 Class B shares with a quota value of SEK 5 per share. All shares are fully paid. One A share entitles the holder to one vote and one B share to one-tenth of a vote. All shares entitle the holder to the same proportion of assets and earnings, and carry equal rights in terms of dividends.
Share capital
Share capital, December 31, 20178,192,539 Class A shares, quota value SEK 5 41300,727,769 Class B shares, quota value SEK 5 1,504Total 1,545
Share capital, December 31, 20188,192,539 Class A shares, quota value SEK 5 41300,727,769 Class B shares, quota value SEK 5 1,504Total 1,545
Number of shares
Owned by Electrolux
Owned by other share-
holders Total
Shares, December 31, 2017Class A shares — 8,192,539 8,192,539Class B shares 21,522,858 279,204,911 300,727,769Total 21,522,858 287,397,450 308,920,308
Conversion of Class A shares into Class B sharesClass A shares — — —Class B shares — — —
Sold sharesClass A shares — — —Class B shares — — —
Shares, December 31, 2018Class A shares — 8,192,539 8,192,539Class B shares 21,522,858 279,204,911 300,727,769Total 21,522,858 287,397,450 308,920,308
Other paid-in capitalOther paid-in capital relates to payments made by owners and includes share premiums paid.
Other reservesOther reserves include the following items: Cashflow hedges which refer to changes in valuation of currency contracts used for hedging future for-eign currency transactions; and exchange-rate differences on translation of foreign operations which refer to changes in exchange rates when net investments in foreign subsidiaries are translated to SEK. The amount of exchange-rate changes includes the value of hedging contracts for net investments. Finally, other reserves include tax relating to the mentioned items.
Retained earningsRetained earnings, including income for the period, include the income of the Parent Company and its share of income in subsidiaries and associated companies. Retained earnings also include remeasurement of provision for post-employment benefits, reversal of the cost for share-based payments recognized in income, income from sales of own shares and the amount recognized for the common dividend.
Earnings per share2018 2017
Income for the period attributable to equity holders of the Parent Company 3,805 5,745
Earnings per shareBasic, SEK 13.24 19.99Diluted, SEK 13.14 19.88
Average number of shares, millionBasic 287.4 287.4Diluted 289.5 289.0
Basic earnings per share is calculated by dividing the income for the period attributable to the equity holders of the Parent Company with the average number of shares. The average number of shares is the weighted average number of shares outstanding during the year, after repurchase of own shares. Diluted earnings per share is calculated by adjusting the weighted average number of ordinary shares outstanding with the estimated num-ber of shares from the share programs. Share programs are included in the dilutive potential ordinary shares as from the start of each program. The dilution in the Group is a consequence of the Electrolux long-term incentive programs.
The average number of shares during the year has been 287,397,450 (287,397,450) and the average number of diluted shares has been 289,503,125 (289,020,186).
Note 21 Untaxed reserves, Parent Company
December 31, 2018 Appropriations December 31, 2017
Accumulated depreciation in excess of planBrands 382 25 357Licenses 0 –20 20Machinery and equipment 23 –20 43Buildings 0 0 0Other 37 12 24Total 442 –3 444Group contributions 1,746Total appropriations 1,743
ELECTROLUX ANNUAL REPORT 2018
66 Notes
All amounts in SEKm unless otherwise stated

Note 22 Post-employment benefits
Post-employment benefitsThe Group sponsors pension plans in many of the countries in which it has significant activities. Pension plans can be defined contribution or defined benefit plans or a combination of both. Under defined benefit pension plans, the company enters into a commitment to provide post-employment benefits based upon one or several parameters for which the outcome is not known at present. For example, benefits can be based on final salary, on career average salary, or on a fixed amount of money per year of employ-ment. Under defined contribution plans, the company’s commitment is to make periodic payments to independent authorities or investment plans, and the level of benefits depends on the actual return on those investments. Some plans combine the promise to make periodic payments with a prom-ise of a guaranteed minimum return on the investments. These plans are also defined benefit plans.
In some countries, Electrolux makes provisions for compulsory severance payments. These provisions cover the Group’s commitment to pay employees a lump sum upon reaching retirement age, or upon the employees’ dismissal or resignation.
In addition to providing pension benefits and compulsory severance payments, the Group provides healthcare benefits for some of its employees in certain countries, mainly in the U.S.
The cost for pension is disaggregated into three components; service cost, financing cost or income and remeasurement effects. Service cost is reported within Operating income and classified as Cost of goods sold, Selling expenses or Administrative expenses depending on the function of the employee. Financing cost or income is recognized in the Financial items and the remeasurement effects in Other comprehensive income. The Projected Unit Credit Method is used to measure the present value of the obligations and costs.
Net provisions for post-employment benefits in the balance sheet repre-sent the present value of the Group’s obligations less market value of plan assets. The remeasurements of the obligations are made using actuarial assumptions determined at the balance sheet date. Changes in the present value of the obligations due to revised actuarial assumptions and experi-ence adjustments on the obligation are recorded in Other comprehensive income as remeasurements. The actual return less calculated interest income on plan assets is also recorded in other comprehensive income as remeasurements. Past-service costs are recognized immediately in income for the period.
Some features of the defined benefit plans in the main countries are described below.
USAThe number of pension plans in the U.S. has been significantly reduced over the years through plan consolidation. The defined benefit plans are closed for future accruals and employees are offered defined contribution plans. Pensions in payment are not generally subject to indexation. Funding posi-tion is reassessed every year with a target to restore the funding level over seven years. Surplus in the fund can be used to take a contribution holiday and refunds are taxed at 50%. Benefits are mainly paid from the plan assets.
United KingdomThe defined benefit plan is closed for future accruals and employees are offered defined contribution. The funding position is reassessed every three years and a schedule of contributions is agreed between the Trustee and the company. The Trustee decides the investment strategy and consults with the company. Benefits are paid from the plan assets.
SwedenThe main defined benefit plan in Sweden is the collectively agreed pension plan for white collar employees, the ITP 2 plan, and it is based on final salary. Benefits in payment are indexed according to the decisions of the Alecta insurance company, typically those follow inflation. The plan is semi-closed, meaning that only new employees born before 1979 are covered by the ITP 2 solution. A defined contribution solution (ITP 1) is offered to employees born after 1978. Electrolux has chosen to fund the pension obligation (ITP 2) by a pension foundation. The foundation’s Board of Directors consists of an equal number of members from Group staff functions and representatives from the company. There is no funding requirement for an ITP pension foun-dation. Benefits are paid directly by the company and, in case of surplus, the company can reimburse itself for the current and the previous year’s pension cost and/or take a contribution holiday.
GermanyThere are several defined benefit plans based on final salary in Germany. Benefits in payment are indexed every three years according to inflation levels. All plans are closed for new participants. Electrolux has arranged a Contractual Trust Arrangement (CTA) and the funds are held by a local bank who acts as the trustee for the scheme. The assets are managed by a fund management company, Electrolux performs an oversight on the strategy via an investment committee with members both from Group staff functions and the local German company. No minimum funding require-ments or regular funding obligations apply to CTAs. If there is a surplus under both German GAAP and IFRS rules, Electrolux can take a refund up to the German GAAP surplus. Benefits are paid directly by the company and Electrolux can refund itself for pension pay-outs. Over time, Electrolux will have access to any residual funds after the last beneficiary has died.
SwitzerlandIn Switzerland benefits are career average in nature, with indexation of benefits following decisions of the foundation board, subject to legal minima. Contributions are paid to the pension foundation and a recovery plan has to be set up if the plans are underfunded on the local funding basis. Swiss laws do not state any specific way of calculating an employer‘s additional contribution and because of that there is normally no mini-mum funding requirement. The assets in the foundation is to a large extent handled by local banks and they are working with both asset allocation and selection within a framework decided by the Swiss foundation board. Benefits are paid from the plan assets.
Other countriesThere is a variety of smaller plans in other countries and the most impor-tant of those are in France, Italy, Canada and Norway. The pension plans in France and Italy are mainly unfunded. The Norwegian pension plans are funded and in Canada there are both funded and unfunded pension plans. A mix of final salary and career average exists in these countries. Some plans are open for new entrants.
Notes 67
ELECTROLUX ANNUAL REPORT 2018
All amounts in SEKm unless otherwise stated

Explanation of amounts in the financial statements relating to defined benefit obligations.
Information by country December, 31, 2018
USAUSA
Medical UK Sweden GermanySwitzer–
land Other Total
Amounts included in the balance sheetPresent value of funded and unfunded obligations 8,221 1,790 6,257 4,052 3,779 3,396 1,151 28,646Fair value of plan assets (after change in asset ceiling) –7,814 –1,837 –6,354 –2,772 –2,631 –3,100 –324 –24,832Total (surplus)/deficit 407 –47 –97 1,280 1,148 296 827 3,814Whereof reported as:Pension plan assets — — — — — — — 532Provisions for post-employment benefit plans — — — — — — — 4,346Total funding level for all pension plans, % 97 103 102 68 70 91 16 87Average duration of the obligation, years 9.4 9.9 14.7 17.4 14.3 12.6 — 12.7
Amounts included in total comprehensive incomeService cost1) 17 — 60 158 22 54 9 320Net interest cost 8 1 6 18 6 — 9 48Remeasurements (gain)/loss 49 81 –373 279 206 197 9 448Total expense (gain) for defined benefit plans 74 82 –307 455 234 251 27 816Expenses for defined contribution plans 640
Amounts included in the cash flow statementContributions by the employer — –22 –58 — — –40 –11 –131Reimbursement — — — 91 626 — — 717Benefits paid by the employer –21 — — –125 –161 — –55 –362
Major assumptions for the valuation of the liabilityLongevity, years2)
Male 20.8 20.8 20.9 23.0 20.0 22.5 — 21.2Female 22.7 22.7 23.8 24.8 23.6 24.5 — 23.6Inflation, %3) 3 6.5 3.25 1.75 1.7 1.25 — 2.4Discount rate, % 4.2 4.2 2.7 2.3 1.7 0.7 — 2.63
Information by country December, 31, 2017
USAUSA
Medical UK Sweden GermanySwitzer–
land Other Total
Amounts included in the balance sheetPresent value of funded and unfunded obligations 8,203 1,790 6,700 3,690 3,773 3,083 1,139 28,378Fair value of plan assets (after change in asset ceiling) –7,951 –1,826 –6,449 –2,822 –3,345 –3,008 –343 –25,744Total (surplus)/deficit 252 –36 251 868 428 75 796 2,634Whereof reported as:Pension plan assets — — — — — — — 455Provisions for post-employment benefit plans — — — — — — — 3,089Total funding level for all pension plans, % 97 102 96 76 89 98 30 91Average duration of the obligation, years 10.1 9.9 16.7 16.7 14.3 12.8 — 13.4
Amounts included in total comprehensive incomeService cost4) –124 — 8 146 21 –36 8 23Net interest cost 38 9 9 15 11 2 7 91Remeasurements (gain)/loss –764 –207 –42 102 –126 –163 –29 –1,229Total expense (gain) for defined benefit plans –850 –198 –25 263 –94 –197 –14 –1,115Expenses for defined contribution plans 585
Amounts included in the cash flow statementContributions by the employer — –29 –55 — –1 –36 –13 –134Reimbursement — — — 88 — — — 88Benefits paid by the employer –20 — — –120 –154 — –28 –322
Major assumptions for the valuation of the liabilityLongevity, years2)
Male 20.0 20.0 22.1 23.0 19.8 22.4 — 21.8Female 22.3 22.3 24.5 24.8 23.5 24.4 — 24Inflation, %3) 3 6.75 3.25 1.75 1.7 1 — 2.42Discount rate, % 3.6 3.6 2.5 2.5 1.7 0.6 — 2.541) Includes a loss of SEK 51m in UK due to gender equalization of Guaranteed Minimum Pension.2) Expressed as the average life expectancy of a 65 years old person in number of years.3) General inflation impacting salary and pensions increase. For USA Medical, the number refers to the inflation of healthcare benefits.4) Includes a total gain of SEK 237m related to plan amendments in Switzerland and the U.S.
Cont. Note 22
ELECTROLUX ANNUAL REPORT 2018
68 Notes
All amounts in SEKm unless otherwise stated

Cont. Note 22
Reconciliation of change in present value of funded and unfunded obligations
2018 2017
Opening balance, January 1 28,378 29,734Current service cost 237 255Special events 50 –232Interest expense 720 764Remeasurement arising from changes in financial assumptions –717 851Remeasurement from changes in demographic assumptions –132 –275Remeasurement from experience 72 –76Contributions by plan participants 45 43Benefits paid –1,514 –1,526Exchange differences 1,539 –1,138Settlements and other –32 –22Closing balance, December 31 28,646 28,378
Reconciliation of change in the fair value of plan assets2018 2017
Opening balance, January 1 25,744 25,565Interest income1) 672 673Return on plan assets, excluding amounts included in interest1) –1,225 1,832Effect of asset ceiling –52 –79Net contribution by employer –224 368Contribution by plan participants 45 43Benefits paid –1,514 –1,526Exchange differences 1,453 –1,071Settlements and other –67 –61Closing balance, December 31 24,832 25,7441) The actual return on plan assets amounts to SEK –553m (2,505).
RisksThere are mainly three categories of risks related to defined benefit obliga-tions and pension plans. The first category relates to risks affecting the actual pension payments. Increased longevity and inflation of salary and pensions are the principle risks that may increase the future pension payments and, hence, increase the pension obligation. The second category relates to investment return. Pension plan assets are invested in a variety of financial instruments and are exposed to market fluctuations. Poor investment return may reduce the value of investments and render them insufficient to cover future pension payments. The final category relates to measurement and affects the accounting for pensions. The discount rate used for measuring the present value of the obligation may fluctuate which impacts the valua-tion of the Defined Benefit Obligation (DBO). The discount rate also impacts the size of the interest income and expense that is reported in the Financial items and the service cost. When determining the discount rate, the Group uses AA rated corporate bond indexes which match the duration of the pension obligations. In Sweden and Norway, mortgage-backed bonds are used for determining the discount rate. Expected inflation and mortality assumptions are based on local conditions in each country and changes in those assumptions may also affect the measured obligation and, therefore, the accounting entries.
Investment strategy and risk managementThe Group manages the allocation and investment of pension plan assets with the aim of decreasing the total pension cost over time. This means that certain risks are accepted in order to increase the return. The investment horizon is long-term and the allocation ensures that the investment port-folios are well diversified. In some countries, a so called trigger-points scheme is in place, whereby the investment in fixed income assets increases as the funding level improves. The Board of Electrolux annually approves the limits for asset allocation. The final investment decision often resides with the local trustee that consults with Electrolux. The risks related to pension obligations, e.g., mortality exposure and inflation, are monitored on an ongoing basis. Buy-out premiums are also monitored and other potential liability management actions are also considered to limit the exposure to the Group.
Below is the sensitivity analysis for the main financial assumptions and the potential impact on the present value of the defined pension obligation. Note that the sensitivities are not meant to express any view by Electrolux on the probability of a change.
Sensitivity analysis on defined benefit obligation
USAUSA
Medical UK Sweden GermanySwitzer-
land Other Total
Longevity +1 year 268 94 284 147 81 107 14 995Inflation +0.5%1) 32 92 423 375 241 40 38 1,241Discount rate +1% –655 –158 –801 –612 –468 –393 –90 –3,177Discount rate –1% 779 183 1,017 801 589 482 104 3,9551) The inflation change feeds through to other inflation-dependent assumptions, i.e., pension increases and salary growth.
In 2019, the Group expects to pay a total of SEK 389m in contributions to the pension funds and as payments of benefits directly to the employees.
MARKET VALUE OF PLAN ASSETS BY CATEGORY
2018
Fixed income, SEK 12,103mEquity, SEK 7,669mHedge funds, SEK 1,673mReal estate, SEK 2,304mInfrastructure, SEK 307mPrivate equity, SEK 142mCash, SEK 634m
2017
Fixed income, SEK 10,453mEquity, SEK 9,603mHedge funds, SEK 2,633mReal estate, SEK 2,109mInfrastructure, SEK 377mPrivate equity, SEK 79mCash, SEK 490m
Notes 69
ELECTROLUX ANNUAL REPORT 2018
All amounts in SEKm unless otherwise stated

Cont. Note 22
GovernanceDefined benefit pensions and pension plan assets are governed by the Electrolux Pension Board, which resumes 3 to 4 times per year and has the following responsibilities:• Implementation of pension directives of the AB Electrolux Board of
Directors.• Evaluation and approval of new plans, changes to plans or termination
of plans.• Annually, approval of the Group’s and local pension funds’ investment
strategies.• Annually, approval of the Group’s global and local benchmarks for
follow up of pension plan assets.• Approval of the election of company representatives in the Boards of
Trustees.• Approval of the financial and actuarial assumptions to be used in the
measurement of the defined benefit obligations.
Parent CompanyAccording to Swedish accounting principles adopted by the Parent Company, defined benefit liabilities are calculated based upon officially provided assumptions, which differ from the assumptions used in the Group under IFRS. The pension benefits are secured by contributions to a separate fund or recorded as a liability in the balance sheet. The accounting prin-ciples used in the Parent Company’s separate financial statements differ from the IFRS principles, mainly in the following:• The pension liability calculated according to Swedish accounting
principles does not take into account future salary increases.• The discount rate used in the Swedish calculations is set by the Swedish
Pension Foundation (PRI) and was for 2018 4.0% (4.0). The rate is the same for all companies in Sweden.
• Changes in the discount rate and other actuarial assumptions are recognized immediately in the profit or loss and the balance sheet.
• Deficit must be either immediately settled in cash or recognized as a liability in the balance sheet.
• Surplus cannot be recognized as an asset, but may in some cases be refunded to the company to offset pension costs.
Change in the present value of defined benefit pension obligation for funded and unfunded obligations Funded Unfunded Total
Opening balance, January 1, 2017 1,597 440 2,037Current service cost 64 9 73Interest cost 65 18 83Benefits paid –75 –29 –104Closing balance, December 31, 2017 1,651 438 2,089Current service cost 82 16 98Interest cost 67 18 85Benefits paid –78 –30 –108Closing balance, December 31, 2018 1,722 442 2,164
Change in fair value of plan assets Funded
Opening balance, January 1, 2017 2,295Actual return on plan assets 175Contributions and compensation to/from the fund –73Closing balance, December 31, 2017 2,397Actual return on plan assets 29Contributions and compensation to/from the fund –75Closing balance, December 31, 2018 2,351
Amounts recognized in the balance sheet December 31
2018 2017
Present value of pension obligations –2,164 –2,089Fair value of plan assets 2,351 2,397Surplus/deficit 187 308Limitation on assets in accordance with Swedish accounting principles –628 –746Net provisions for pension obligations –442 –438Whereof reported as provisions for pensions –442 –438
Amounts recognized in the income statement2018 2017
Current service cost 98 73Interest cost 85 83Total expenses for defined benefit pension plans 183 156Insurance premiums 107 102Total expenses for defined contribution plans 107 102Special employer’s contribution tax 33 31Cost for credit insurance FPG 2 2Total pension expenses 325 291Compensation from the pension fund –75 –73Total recognized pension expenses 250 218
The Swedish Pension FoundationThe pension liabilities of the Group’s Swedish defined benefit pension plan (PRI pensions) are funded through a pension foundation established in 1998. The market value of the assets of the foundation amounted at December 31, 2018, to SEK 2,772m (2,830m) and the pension commitments to SEK 2,013m (1,934). The Swedish Group companies recorded a liability to the pension fund as per December 31, 2018, in the amount of SEK 0m (0). Contributions to the pension foundation during 2018 amounted to SEK 0m (0). Contributions from the pension foundation during 2018 amounted to SEK 91m (88).
December 31
Market value of plan assets without quoted prices 2018 2017
Fixed income 61 63Real estate 2,302 2,107Infrastructure 307 377Private equity 142 79
The Swedish pension foundation carries plan assets at an amount of SEK 200m related to property used by Electrolux.
ELECTROLUX ANNUAL REPORT 2018
70 Notes
All amounts in SEKm unless otherwise stated

Note 23 Other provisions
Group Parent Company
Provisions for restructuring
Warranty commitments Claims Other Total
Provisions for restructuring
Warranty commitments Other Total
Opening balance, January 1, 2017 1,667 1,812 1,615 2,950 8,044 472 440 54 966Acquisitions of operations 12 128 — 343 483 — — — —Provisions made — 1,404 394 1,319 3,117 4 407 20 431Provisions used –373 –1,360 –519 –848 –3,100 –148 –432 –26 –606Unused amounts reversed –34 –44 — –348 –426 –14 — — –14Exchange-rate differences 18 –25 –128 –160 –295 8 6 — 14Closing balance, December 31, 2017 1,290 1,915 1,362 3,256 7,823 322 421 48 791Of which current provisions 303 932 274 561 2,070 220 82 — 302Of which non-current provisions 987 983 1,088 2,695 5,753 102 339 48 489
Opening balance, January 1, 2018 1,290 1,915 1,362 3,256 7,823 322 421 48 791Acquisitions of operations — 10 — 19 29 — — — —Provisions made 718 1,793 391 871 3,773 3 86 3 92Provisions used –749 –1,679 –464 –867 –3,759 –122 –44 –7 –173Unused amounts reversed –108 –11 — –512 –631 –74 0 0 –74Exchange-rate differences 59 67 108 96 330 45 10 0 55Closing balance, December 31, 2018 1,210 2,095 1,397 2,863 7,565 174 473 44 691Of which current provisions 411 1,071 269 533 2,284 125 92 217Of which non-current provisions 799 1,024 1,128 2,330 5,281 49 381 44 474
Provisions are recognized when the Group has a present obligation as a result of a past event, and it is probable that an outflow of resources will be required to settle the obligation, and a reliable estimate can be made of the amount of the obligation. The amount recognized as a provision is the best estimate of the expenditure required to settle the present obligation at the balance sheet date. Where the effect of time value of money is material, the amount recognized is the present value of the estimated expenditures.
Provisions for warranty are recognized at the date of sale of the products covered by the warranty and are calculated based on historical data for similar products. Provisions for warranty commitments are recognized as a consequence of the Group’s policy to cover the cost of repair of defective products. Warranty is normally granted for one to two years after the sale.
Restructuring provisions are recognized when the Group has both adopted a detailed formal plan for the restructuring and has, either started
the plan implementation, or communicated its main features to those affected by the restructuring. Provisions for restructuring represent the expected costs to be incurred as a consequence of the Group’s decision to close some factories, rationalize production and reduce personnel, both for newly acquired and previously owned companies. The amounts are based on management’s best estimates and are adjusted when changes to these estimates are known. The larger part of the restructuring provisions as per December 31, 2018, will be consumed in 2019 and 2020.
Provisions for claims refer to the Group’s captive insurance companies. Other provisions include mainly provisions for direct and indirect tax, envi-ronmental liabilities, asbestos claims or other liabilities. The timing of any resulting outflows for provisions for claims and other provisions is uncertain.
Note 24 Other liabilities
Group December 31
Parent Company December 31
2018 2017 2018 2017
Accrued holiday pay 1,043 1,057 137 213Other accrued payroll costs 1,297 1,726 64 315Accrued interest expenses 28 27 25 25Prepaid income grants 882 879 — —Other prepaid income 302 43 43 6Other accrued expenses 4,710 4,009 1,210 738Contract liabilities1) 5,093 4,506 — —Other operating liabilities 3,750 3,602 — —Total 17,105 15,849 1,479 1,2971) Movement in contract liabilities is presented in Note 4.
Other accrued expenses include for example accruals for fees, advertising and sales promotion. Other operating liabilities include for example VAT and operational taxes.
Notes 71
ELECTROLUX ANNUAL REPORT 2018
All amounts in SEKm unless otherwise stated

Note 25 Contingent assets and liabilities
Group December 31
Parent Company December 31
2018 2017 2018 2017
Guarantees and other commitments On behalf of subsidiaries — — 1,044 1,009On behalf of external counterparties 992 1,039 490 477Employee benefits in excess of reported liabilities 23 148 — 11Total 1,015 1,187 1,534 1,497
A large part of the guarantees and other commitments on behalf of external counterparties, is related to U.S. sales to dealers financed through external finance companies with a regulated buy-back obligation of the products in case of dealer’s bankruptcy.
In addition to the above contingent liabilities, guarantees for fulfillment of contractual undertakings are given as part of the Group’s normal course of business. There was no indication at year-end that payment will be required in connection with any contractual guarantees.
Legal proceedingsLitigation and claims related to asbestos are pending against the Group in the U.S. Almost all of the cases refer to externally supplied components used in industrial products manufactured by discontinued operations prior to the early 1970s. The cases involve plaintiffs who have made substan-tially identical allegations against other defendants who are not part of the Electrolux Group.
As of December 31, 2018, the Group had a total of 3,460 (3,372) cases pending, representing approximately 3,502 (approximately 3,435) plain-tiffs. During 2018, 1,355 new cases with 1,355 plaintiffs were filed and 1,267 pending cases with approximately 1,288 plaintiffs were resolved.
The Group continues to operate under a 2007 agreement with certain insurance carriers who have agreed to reimburse the Group for a portion of its costs relating to certain asbestos lawsuits. The agreement is subject to termination upon 60 days notice and if terminated, the parties would be restored to their rights and obligations under the affected insurance policies.
It is expected that additional lawsuits will be filed against Electrolux. It is not possible to predict the number of future lawsuits. In addition, the out-come of asbestos lawsuits is difficult to predict and Electrolux cannot provide any assurances that the resolution of these types of lawsuits will not have a material adverse effect on its business or on results of operations in the future.
In July 2004, a gas explosion occurred on Husqvarna’s property in Ghislenghien, Belgium, resulting in the loss of 24 lives and substantial
personal injuries and property damage. In 2012, the Belgium Supreme Court concluded that Husqvarna together with other parties were found liable for the accident and jointly and severally liable for the damages. As a former subsidiary of Electrolux, Husqvarna is covered by Electrolux liability insurance program for 2004. This program is reinsured by external insurance companies. Electrolux believes that losses which Husqvarna is covered for under Electrolux insurance program are correspondingly covered by the external reinsurance program.
The Group is involved in a legal proceeding in Egypt relating to the priva-tization of an Egyptian subsidiary. The proceeding is currently on-going in the court of first instance in Cairo, Egypt. Electrolux believes that the lawsuit is without legal merit. In case of a negative outcome, Electrolux believes that losses will largely be covered by guarantees obtained by Electrolux in connection with the acquisition of the Olympic Group in 2011.
In October 2013, Electrolux became subject of an investigation by the French Competition Authority regarding a possible violation of antitrust rules. The Authority has thereafter decided to conduct two separate investigations whereof one was completed in December 2018. The other investigation is still ongoing, and the Authority has so far not communicated any conclusions. Given the nature of the investigation, it cannot be ruled out that the outcome could have a material impact on Electrolux financial result and cash flow. At this stage it is however not possible to evaluate the extent of such an impact.
In November 2017, the U.S. Department of Commerce (DOC) informed the Group that it had set a preliminary and significantly increased tariff rate of 72.41% on washing machines manufactured in Mexico by Electrolux and imported into the U.S. between February 2016 and January 2017. In March 2018, Electrolux was informed by DOC that this preliminary tariff rate was determined as final. Electrolux has appealed DOC’s decision. If the tariff rate is not significantly reduced as a result of the appeal process, it could lead to a one-time cost of up to USD 70m. However, Electrolux believes that the company has a very strong legal case and has not made any provision related to this potential cost at this stage.
Contingent assetsIn December 2018, Electrolux obtained a judicial court certification attest-ing a final and non-appealable decision in Brazil that Electrolux has the right to recover overpaid tax for 2002-2014. In December 2018, Electrolux filed a claim with the Brazilian tax authorities for the recovery of the over-paid tax. Electrolux believes that there is strong support for the entire claim filed. However, as the Brazilian tax authority has advocated a specific calculation methodology for the recoverable amount, only a minor part, corresponding to the tax authority’s methodology, has been recognized as an asset per December 31, 2018. The claimed amount in excess of the recognized asset is approximately SEK 1,400m.
ELECTROLUX ANNUAL REPORT 2018
72 Notes
All amounts in SEKm unless otherwise stated

Acquisitions in 2018Schneidereit GmbHOn February 22, 2018, Electrolux completed the acquisition of Schneidereit GmbH, a supplier of laundry rental solutions for professional customers in Germany and Austria. The agreement to acquire the company was announced on January 22, 2018. The acquisition enables Electrolux to develop its offering within the professional laundry business and supports the long-term profitable growth in Europe. Schneidereit adds a comple-mentary business model, enabling Electrolux to help provide great expe-riences to an even wider customer base while exploring functional sales which is an interesting growth area in the industry for professional products.
Net sales for the acquired business Schneidereit GmbH in 2016 amounted to around EUR 18m (around SEK 175m) and the company has around 110 employees throughout Germany.
The consideration consists of a cash payment of EUR 32.8m and a deferred part (hold-back) of EUR 3.6m. The cash payment is equivalent to SEK 331m and the deferred part is equivalent to SEK 37m. The cash flow effect was SEK –303m excluding acquired cash and cash equivalents.
The acquired business is included in Electrolux consolidated accounts per December 31 with financial statements for the period January– December 2018, contributing to net sales and operating income ( including amortization of surplus values) by EUR 18.7m and EUR 0k respectively, approximately SEK 192m and SEK 0m respectively.
Goodwill recognized for the acquisition include the value of the added business model with its growth potential and synergies identified. Goodwill is not expected to be deductible for income tax purposes.
The operations are included in business area Professional Products.
SPM Drink SystemsOn October 2, 2018, Electrolux completed the acquisition of SPM Drink Systems, an Italian leading manufacturer of professional dispensers of frozen and hot beverages and soft ice-cream, as part of the strategy to increase its presence in the hospitality industry. The acquisition supports Electrolux strategy for profitable growth and strengthens Electrolux pres-ence in the fast-growing beverage segment.
The acquired operations had combined net sales in 2017 of approxi-mately EUR 30m and 110 employees. The company’s headquarters and main manufacturing facilities are based in Spilamberto, Modena, Italy.
The consideration consists of a cash payment of EUR 45.6m, equivalent to SEK 470m. The cash flow effect was SEK –449m excluding acquired cash and cash equivalents.
The acquired business is included in Electrolux consolidated accounts from October 1, 2018, contributing to net sales and operating income (including amortization of surplus values) by EUR 3.7m and EUR –0.7m respectively, approximately SEK 38m and SEK –7m respectively.
For the full year 2018, the acquired business accounted for net sales and operating income of EUR 31m and EUR 0.6m respectively, approximately SEK 314m and SEK 6m respectively.
Goodwill from the transaction mainly relates to the value of the additional presence in the fast-growing beverage segment both from a product range and geographical perspective. The goodwill is not expected to be deduct-ible for income tax purposes.
The purchase price allocation is not finalized. The expectation is that the final version will not materially differ from the preliminary allocation made.
The operations are included in business area Professional Products.
OtherOther acquisitions of operations refers to the acquisition of a nationwide provider of repair service and distribution of spare parts in Germany.
The operations are included in business area Major Appliances EMEA.
Transaction costsTransaction costs related to the acquisitions in 2018 amount to SEK 12m and have been expensed as incurred during the acquisition process in 2017 (SEK 4m) and 2018 (SEK 8m). The costs have been reported in the business area’s operating income.
Acquisitions in 2017 Grindmaster-CecilwareIn February, 2017, Electrolux completed the acquisition of the U.S. based Grindmaster-Cecilware business by acquiring 100% of the business via a purchase of all shares in the parent company of the Grindmaster-Cecilware Group in a cash transaction. The acquisition broadens Electrolux offering in its food service business and will accelerate the growth of the Professional Products business area by increasing access to the U.S. market.
Grindmaster-Cecilware is a leading U.S. based manufacturer of hot, cold and frozen beverage dispensing equipment, including coffee machines. The company is based in Louisville, Kentucky and has manufacturing facili-ties in Louisville and in Rayong, Thailand.
Goodwill primarily relates to the increase in market presence in North America, one of the largest global markets for professional appliances. Goodwill is not expected to be deductible for income tax purposes.
Net sales and operating income in the acquired business in 2017 amounted to USD 64.9m (SEK 560m) and USD 2.6m (SEK 23m) respectively. The Grindmaster-Cecilware business is included in Electrolux consolidated accounts from March 1, 2017. For the period from the acquisition date until the end of the reporting period the acquired business has contributed to net sales and operating income (including amortization of surplus values) by USD 53.1m and USD 1.3m respectively, approximately SEK 454m and SEK 11m respectively.
Note 26 Acquired and divested operations
2018 2017
Acquired operations Schneidereit SPM Other Total Anova
Grind-master-
Cecilware Kwikot Best Total
Consideration:Cash paid for acquisitions made during the year 331 470 3 804 870 838 1,632 109 3,449Deferred consideration 37 — 20 57 263 — 139 — 402Total consideration 368 470 23 861 1,133 838 1,771 109 3,851
Recognized amounts of assets acquired and liabilities assumed:Total net assets acquired 168 189 11 368 92 308 531 129 1,060Assumed net debt –93 –10 –10 –113 –57 –149 –207 –20 –433Goodwill 293 291 22 606 1,098 679 1,447 — 3,224Total 368 470 23 861 1,133 838 1,771 109 3,851
Payments for acquisitions: 2018 2017
Cash paid for acquisitions made during the year 804 3,449Cash and cash equivalents in acquired operations –49 –61Cash paid related to deferred consideration from acquisitions made in earlier years 144 6Payments for acquisition of non-controlling interest in CTI SA and Somela SA, Chile 3 11Total paid 902 3,405
Notes 73
ELECTROLUX ANNUAL REPORT 2018
All amounts in SEKm unless otherwise stated

Cont. Note 26
In the first quarter of 2018, within the measurement period, additional net liabilities of USD 1.1m (SEK 10m) were added to the acquisition balance sheet resulting in an increase of goodwill with the same amount.
The business is included in business area Professional Products.
Kwikot GroupOn March 1, 2017 Electrolux acquired all shares in Kwikot Pty Ltd, the par-ent company in the Kwikot Group, via a cash transfer. The Kwikot Group is South Africa’s leading water heater producer. The acquisition broadens Electrolux home comfort product range and offers a strong platform for growth opportunities in Africa. The acquisition significantly strengthens Electrolux presence in South Africa. Kwikot is based in Johannesburg where it also has production and its main warehouse. The company has about 800 employees.
Goodwill represents the value of increasing Electrolux presence in Southern Africa. Goodwill is not expected to be deductible for income tax purposes.
The acquired business reported a Net Sales and Operating Income of ZAR 1,101m (SEK 712m) and ZAR 146m (SEK 95m) respectively in 2017. The Kwikot business is included in Electrolux consolidated accounts from March 1, 2017. For the period from the acquisition date until the end of the report-ing period the acquired business has contributed to net sales and operating income by ZAR 933m and ZAR 116m respectively, approximately SEK 600m and SEK 75m respectively.
The operations are included in business area Major Appliances EMEA.
AnovaOn April 4, 2017 Electrolux completed the acquisition of the U.S. based smart kitchen appliance company, Anova. Anova is a U.S. based provider of the Anova Precision Cooker, an innovative connected device for sous vide cooking that enables restaurant-quality results in the home.
The agreed up-front cash payment in the transaction amounts to USD 115m, with a potential additional amount of up to USD 135m to be paid depending on future financial performance. Part of the mentioned cash payment and contingent pay-out is in the form of remuneration to key employees connected to post-closing service. Anova’s direct-to-con-sumer business model and digital focus are of strong strategic interest to Electrolux.
The company has approximately 70 employees and contractors globally and is headquartered in San Francisco, California. Sales are primarily car-ried out online – directly to consumer and through major retailers.
Goodwill primarily relates to the expectations of profitable growth in the emerging product categories of connected appliances and to be able to utilize Anova’s direct-to-consumer business model with a digital focus. Goodwill is not expected to be deductible for income tax purposes. Opera-tions are included in the business area Home Care &SDA.
Net sales and operating income in the acquired business in 2017 amounted to USD 50.3m and USD –6.4m respectively, approximately SEK 432m and SEK –57m respectively.
The Anova business is included in Electrolux consolidated accounts from April 4, 2017. For the period from the acquisition date until the end of the reporting period the acquired business has contributed to net sales and operating income (including amortization of surplus values) by USD 45.5m and USD –2.4m respectively, approximately SEK 389m and
SEK –21m respectively. In 2018 the estimated outcome of the earn-out has been reduced by USD 22.3m (SEK 194m). The adjustment of the earn-out has impacted the operating income in 2018.
Best GroupOn August 10, 2017 Electrolux completed the acquisition of the kitchen hoods company Best. Best is a European manufacturer of innovative and well-designed kitchen hoods. The acquisition will reinforce Electrolux capa-bilities for design, R&D and manufacturing of kitchen hoods. The Best Group has approximately 450 employees, primarily at manufacturing sites in Cer-reto d’Esi (central Italy) and Zabrze (southern Poland).
Net sales and operating income in the acquired business in 2017 amounted to EUR 36.7m and EUR –4.8m respectively, approximately SEK 356m and SEK –46m respectively.
The Best business is included in Electrolux consolidated accounts from August 11, 2017. For the period from the acquisition date until the end of the reporting period the acquired business has contributed to net sales and operating income by EUR 17.7m and EUR –2.1m respectively, approxi-mately SEK 171m and SEK –20m respectively.
In 2018 within the measurement period the purchase price allocation was adjusted due to the approval by the tax authorities to utilize tax losses generated by the acquired business in the joint operation post acquisition. The adjustment resulted in a negative goodwill of EUR 14.6m (SEK 150m) which was released to the operating income.
The operations are included in business area Major Appliances EMEA.
Transaction costsTransaction costs for acquisitions completed in 2017 amounted to SEK 70m of which SEK 54m was incurred in 2017 and SEK 16m in 2016. Transaction costs are reported in operating income by business area.
Divested operations2018 2017
Divested operationsNorth American commercial and central vacuum cleaner business, USA 293 —Total cash received for divestments 293 —
Divested operations in 2018In August 2018 the US-based North American commercial and central vacuum cleaner business, including the brands Beam and Sanitaire was divested. The total gross consideration was USD 37m (SEK 320m) resulting in a capital gain of USD 24m (SEK 205m) and a cash flow effect in 2018 of USD 34m (SEK 293m) after reducing the gross consideration with an agreed hold-back and the transaction cost. Transaction costs incurred amount to SEK 17m. The divestment has triggered rationalization activities and addi-tional asset write-downs giving a negative impact in the Operating Income of USD 14m (SEK 115m). The divested operations had combined revenues in 2017 of around USD 70m.
The divestment and related effects are included in the business area Home Care & Small Domestic Appliances.
No divestments were made in 2017.
ELECTROLUX ANNUAL REPORT 2018
74 Notes
All amounts in SEKm unless otherwise stated

Salaries and remuneration for Board members, senior managers and other employees2018 2017
Board mem-bers and senior
managers1) Other
employees Total
Board mem-bers and senior
managers1)Other
employees Total
Parent Company 64 1,091 1,155 66 1,108 1,174Other 320 15,888 16,208 281 15,015 15,296Total Group 384 16,979 17,363 347 16,123 16,4701) According to the definition of Senior managers in the Swedish Annual Accounts Act.
Note 27 Employees and remuneration
Employees and employee benefitsIn 2018, the average number of employees was 54,419 (55,692), of which 34,371 (35,774) were men and 20,048 (19,948) were women.
A detailed specification of the average number of employees by coun-try has been submitted to the Swedish Companies Registration Office and is available upon request from AB Electrolux, Investor Relations. See also Electrolux website www.electroluxgroup.com.
Average number of employees, by geographical area
Group
2018 2017
Europe 21,669 21,258North America 8,361 9,755Latin America 15,631 15,975Asia/Pacific 5,307 5,223Rest of world 3,450 3,481Total 54,419 55,692
Salaries, other remuneration and employer contributions 2018 2017
Salaries and remuneration
Employer contributions Total
Salaries and remuneration
Employer contributions Total
Parent Company 1,155 587 1,742 1,174 583 1,757whereof pension costs1) 224 224 209 209Subsidiaries 16,208 4,064 20,272 15,296 3,311 18,607whereof pension costs 736 736 399 399Total Group 17,363 4,651 22,014 16,470 3,894 20,364whereof pension costs 960 960 608 6081) Includes SEK 8m (6), referring to the President’s predecessors according to local GAAP.
Of the Board members in the Group, 113 were men and 12 women, of whom 9 men and 4 women in the Parent Company. According to the definition of Senior managers in the Swedish Annual Accounts Act, the number of Senior managers in the Group consisted of 207 men and 67 women, of whom 7 men and 2 women in the Parent Company. The total pension cost for Board members and senior managers in the Group amounted to SEK 36m (34).
Compensation to the Board of DirectorsThe Annual General Meeting (AGM) determines the compensation to the Board of Directors for a period of one year until the next AGM. The com-pensation is distributed between the Chairman, other Board Members and remuneration for committee work. The Board decides the distribution of the committee fee between the committee members. Compensation is paid out in advance each quarter. Compensation paid in 2018 refers to one fourth of the compensation authorized by the AGM in 2017, and three fourths of the compensation authorized by the AGM in 2018. Total compensation paid in cash in 2018 amounted to SEK 8.3m, of which SEK 6.9m referred to ordinary compensation and SEK 1.4m to committee work1).
Compensation to Board members 2018
´000 SEK
Ordinary compen-
sation
Compen sation for committee
work
Total compen-
sation
Staffan Bohman, Chairman (from AGM 2018) 1,612 215 1,827Ronnie Leten (Chairman up to AGM 2018) 519 25 544Petra Hedengran 595 347 942Hasse Johansson 595 1801) 775Ulla Litzén 595 343 938Bert Nordberg 595 — 595Fredrik Persson 595 180 775David Porter 595 — 595Jonas Samuelson, President — — —Ulrika Saxon 595 100 695Kai Wärn 595 — 595Bo Rothzén (up to AGM 2018) — — —Gunilla Brandt (up to AGM 2018) — — —Ulf Carlsson — — —Viveca Brinkenfeldt-Lever — — —Peter Ferm — — —Total compensation 2018 6,891 1,390 8,2811) Includes compensation for work relating to investments, modularization and quality.
Notes 75
ELECTROLUX ANNUAL REPORT 2018
All amounts in SEKm unless otherwise stated

Cont. Note 27
Remuneration CommitteeFor information on the Remuneration Committee, see the Corporate Governance Report on page 107.
Remuneration guidelines for Group ManagementThe AGM in 2018 approved the proposed remuneration guidelines. These guidelines are described below.
The overall principles for compensation within Electrolux are tied strongly to the position held, individual as well as team performance, and competi-tive compensation in the country or region of employment.
The overall compensation package for higher-level management com-prises fixed salary, variable salary based on short-term and long-term performance targets, and benefits such as pensions and insurance.
Electrolux strives to offer fair and competitive total compensation with an emphasis on “pay for performance”. Variable compensation represents a significant proportion of total compensation for higher-level management. Total compensation is lower if targets are not achieved.
The Group has a uniform program for variable salary for management and other key positions. Variable salary is based on financial targets and may in certain circumstances include non-financial targets. Each job level is linked to a minimum and a maximum level for variable salary, and the program is capped.
Since 2004, Electrolux has long-term performance-share programs for senior managers of the Group. The alignment of Electrolux top management incentives with the interest of shareholders is a longstanding priority of the Board of Directors. Ownership of Electrolux shares by the Group’s CEO and other Group Management members is an important measure to strengthen this alignment.
Thus the Board recommends that the CEO shall build up a personal hold-ing of B-shares in Electrolux representing a value of one gross annual base salary and for Group Management members to build up a personal holding of B-shares in Electrolux representing a value of 50% of one gross annual base salary.
Remuneration and terms of employment for the President in 2018 The remuneration package for the President comprises fixed salary, variable salary based on annual targets, a long-term performance-share program and other benefits such as pension and insurance.
For the President, the annualized base salary for 2018 has been set at SEK 11.1m.
The variable salary is based on annual financial targets for the Group. Each year, a performance range is determined with a minimum and a maximum. If the performance outcome for the year is below or equal to the minimum level, no pay-out will be made. If the performance outcome is at or above the maximum, pay-out is capped at 100% of the annualized base salary. If the performance outcome is between minimum and maximum, the pay-out shall be determined on a linear basis.The President participates in the Group’s long-term performance based share programs. For further information on these programs, see below.
The notice period for the company is 12 months, and for the President 6 months. The President is entitled to 12 months severance pay based on base salary with deduction for other income during the 12 months sever-ance period. Severance pay is applicable if the employment is terminated by the company. It is also applicable if the employment is terminated by the President provided serious breach of contract on the company’s behalf or if there has been a major change in ownership structure in combination with changes in management and changed individual accountability.
Pensions for the President The President is covered by the collectively agreed ITP plan, the alternative rule of the plan, and Electrolux Pension Plan for CEO. The Electrolux Pension Plan for CEO is a defined contribution plan. The employer contribution to the plan for the President is equivalent to 35% of annual base salary, which also includes the contributions for the benefits of the ITP-plan, alternative ITP and any insurable supplementary disability and survivor’s pension. In addition the Company provides a disability pension of maximum SEK 1.2m per year if long term disability occurs. The retirement age for the President is 65.
The capital value of pension commitments for the President in 2018, prior Presidents, and survivors is SEK 222m (236), whereof SEK 24m (22) relates to the current President.
Remuneration and terms of employment for other members of Group Management in 2018Like the President, other members of Group Management receive a remu-neration package that comprises fixed salary, variable salary based on annual targets, long-term performance-share programs and other benefits such as pensions and insurance.
Base salary is revised annually per January 1. The average base-salary increase for members of Group Management in 2018 was 3.18% (4.27).
Variable salary in 2018 is based on financial targets on business area and Group level. Variable salary for business area heads varies between a mini-mum (no pay-out) and a maximum of 100% of annual base salary, which is also the cap. Group Management members in the USA have a maximum of up to 150% of annual base salary.
Group Management members that are Group staff heads receive variable salary that varies between a minimum (no pay out) and a maximum of 80%, which is also the cap.
The members of Group Management participate in the Group’s long-term performance based share programs. For further information on these programs, see below.
The notice period for Group Management members employed in Sweden is 12 months’ for the company and 6 months for the employee. Certain members of Group Management are entitled to 12 months’ sever-ance pay based on base salary with deduction for other income during the 12 months severance period. Severance pay is applicable if the employ-ment is terminated by the company. It is also applicable if the employment is terminated by the Group Management member provided serious breach of contract on the company’s behalf or if there has been a major change in ownership structure in combination with changes in management and changed individual accountability.
For members of Group Management employed outside of Sweden, varying terms of employment and benefits, such as company car, may apply depending upon the country of employment.
Pensions for other members of Group ManagementGroup Management members employed in Sweden as from 2012 receive a pension entitlement where the aggregated contribution is 35% of annual base salary. The retirement age is 65 years.
Group Management members employed in Sweden before 2012 are covered by the Alternative ITP plan, as well as a supplementary plan.
The Alternative ITP plan is a defined contribution plan where the contribution increases with age. The contribution is between 20 and 35% of pensionable salary, between 7.5 and 30 income base amounts. Provided that the member remains in the position until age 60, the company will finalize outstanding premiums in the alternative ITP plan. The contribution to the supplementary plan is 35% of pensionable salary above 20 income base amounts.
Electrolux provides disability benefits equal to 70% of pensionable salary less disability benefits from other sources. Electrolux also provides survivor benefits equal to the highest of the accumulated capital for retirement or 250 income base amounts.
The pensionable salary is calculated as the current fixed salary including vacation pay plus the average variable salary for the last three years. Accrued capital is subject to a real rate of return of 3.5% per year. For other members of Group Management, employed in Sweden before 2012, the retirement age is 60. The retirement age for one member employed prior to 2012 has been amended. The member’s employment and pension entitle-ment is continued post age 60.
For members of Group Management employed outside of Sweden, varying pension terms and conditions apply, depending upon the country of employment.
Share-based compensationOver the years, Electrolux has implemented several long-term incentive programs (LTI) for senior managers. These programs are intended to attract, motivate, and retain the participating managers by providing long-term incentives through benefits linked to the company’s share price. They have been designed to align management incentives with shareholder interests.
For Electrolux, the share-based compensation programs are classified as equity-settled transactions, and the cost of the granted instrument’s fair value at grant date is recognized over the vesting period which is 2.7 years. At each balance sheet date, the Group revises the estimates to the number of shares that are expected to vest. Electrolux recognizes the impact of the revision to original estimates, if any, in the income statement, with a corresponding adjustment to equity.
In addition, the Group provides for employer contributions expected to be paid in connection with the share-based compensation programs. The costs are charged to the income statement over the vesting period. The provision is periodically revalued based on the fair value of the instruments at each closing date.
Performance-share programs 2016, 2017 and 2018The Annual General Meeting in 2018 approved a long-term incentive program. The program is in line with the Group’s principles for remuneration based on performance, and is an integral part of the total compensation for
ELECTROLUX ANNUAL REPORT 2018
76 Notes
All amounts in SEKm unless otherwise stated

Group Management and other senior managers. Electrolux shareholders benefit from this program since it facilitates recruitment and retention of competent executives and aligns management interest with shareholder interest as the program drives executive shareholding and the participants are more aligned with the long-term strategy of the company.
The allocation of shares in the 2016, 2017 and 2018 programs is deter-mined by the position level and the outcome of three financial objectives; (1) annual growth in earnings per share, (2) return on net assets and (3) organic sales growth (adjusted sales growth as from 2018). Performance outcome of the three financial objectives will be determined by the Board after the expiry of the one-year performance period.
For the 2016, 2017 and 2018 programs allocation is linear from minimum to maximum. There is no allocation if the minimum level is not reached. If the maximum is reached, 100% of shares will be allocated. Should the achieve-ment of the objectives be below the maximum but above the minimum, a proportionate allocation will be made. The shares will be allocated after the three-year period free of charge.
If a participant’s employment is terminated during the three-year program period, the participant will be excluded from the program and will not receive any shares or other benefits under the program. However, in certain circumstances, including for example a participant’s death, disability, retirement or the divestiture of the participant’s employing company, a participant could be entitled to reduced benefits under the program.
Each of the 2016, 2017 and 2018 program covers 210 to 282 senior managers and key employees in almost 30 countries. Participants in the
2018 program comprise six groups, i.e., the President, other members of Group Management, and four groups of other senior managers. All programs comprise Class B shares.
The performance outcome of the performance target for the share program for 2018 program was 1.5%, and 1.5% of maximum number of shares will be allocated to the participants in 2021, which corresponds to 19,834 shares. The dilutive effect on earnings per share is not significant. Maximum cost for 2018 program is estimated excluding employer con-tributions to SEK 5m for the full period 2018 - 2020. The cost for employer contributions will depend on the development of the share price.
For 2018, LTI programs resulted in a cost of SEK 125m (including a cost of SEK 14m in employer contribution) compared to a cost of SEK 115m in 2017 (including a cost of SEK 27m in employer contribution). The total provision for employer contribution in the balance sheet amounted to SEK 61m (55).
Repurchased shares for LTI programsThe Annual General Meeting in 2017 resolved that the company shall be entitled to sell B shares in the company for the purpose of covering costs, including social security charges, that may arise as a result of the 2015 program, but this mandate has not been used by the company.
Allocation of shares for the 2015 programThe 2015 performance-share program met 21% of the maximum perfor-mance and performance shares were allocated during 2018 to the partic-ipants according to the terms and conditions of the 2015 share program.
Performance-share program 2018Financial objectives Allocation of shares
Minimum Maximum Actual Outcome, % Weight, %Alloca-tion, %
Adjusted organic sales growth, %1) 1.0 4.0 1.4 14.9 10 1.5Earnings per share, SEK 18.4 20.4 17.52) 0 50 0Return on net assets, % 29.8 34.8 29.22) 0 40 0Total allocation 1.51) Calculated as organic sales growth including total sales impact from prior year acquisitions and divestments.2) Including adjustments for acquisitions and divestments.
Number of potential shares per category and yearMaximum number of B shares1) Maximum value, SEK3)
2018 2017 2016 2018 2017 2016
Group 1, President and CEO 47,605 45,809 51,515 11,130,000 10,600,000 10,000,000Group 2, other members of Group Management 17,032 17,239 21,547 3,982,000 3,989,000 4,183,000Group 3 10,032 10,212 10,795 2,345,000 2,363,000 2,095,000Group 4 5,126 5,301 5,816 1,198,000 1,227,000 1,129,000Group 52) 3,728 3,797 — 871,000 879,000 —Group 6 2,444 2,562 3,021 571,000 593,000 586,0001) The maximum performance value for the participant in Group 1 will be 100 per cent, for participants in Group 2, 90 per cent, for participants in Group 3, 80 per cent, for participants in Group 4,
60 per cent, for participants in Group 5, 50 per cent and for participants in Group 6, 40 per cent of the participants annual base salary for 2018. At maximum performance the aggregated value is converted to the average number of shares per participant in respective category. The calculation is based on a share price of SEK 194.12 for 2016, SEK 231.40 for 2017, and SEK 233.80 for 2018 which is the average closing price of the Electrolux Class B share on the Nasdaq Stockholm during a period of ten trading days before the day participants were invited to participate in the program, adjusted for net present value of dividends for the period until shares are allocated.
2) New category introduced 2017.3) The share allocation for the 2016 program will be at 75% of maximum. For the 2017 program, share allocation will be at 90% of maximum. For the 2018 program 1.5% of maximum will be allocated.
Remuneration to Group Management2018 2017
’000 SEK unless otherwise stated
Annual fixed
salary1)Variable salary2)
Long- term PSP
(cost)3)
Other remuner-
ation4)
Total pension
contri-bution
Social contri-bution
Annual fixed
salary1)Variable salary2)
Long- term PSP
(cost)3)
Other remuner-
ation4)
Total pension
contri-bution
Social contri-bution
President and CEO 11,326 2,226 7,939 5 3,896 6,224 10,849 8,480 7,508 3 3,710 7,331Other members of Group Management5) 49,594 11,180 28,482 4,514 14,538 19,284 49,572 43,512 24,101 25,443 13,792 21,608Total 60,920 13,406 36,421 4,519 18,434 25,508 60,421 51,992 31,609 25,446 17,502 28,9391) The annual fixed salary includes vacation salary, paid vacation days and salary deductions for company car.2) For 2018: variable salary earned 2018 and to be paid in 2019, and for 2017: variable salary earned 2017 and paid in 2018.3) Cost for share-based incentive programs are accounted for according to IFRS 2, Share-based payments. If the expected cost of the program is reduced, the previous recorded cost is
reversed and an income is recorded in the income statement. The cost includes social contribution cost for the program. 4) Includes allowances and other benefits such as gross-up of tax, housing and company car, severance pay, pay for non-compete undertaking and costs for extraordinary arrangements.5) Other members of Group management comprised of 11 people end of 2018 and 2017
Notes 77
ELECTROLUX ANNUAL REPORT 2018
All amounts in SEKm unless otherwise stated

Note 28 Fees to auditors
At the 2018 Annual General Meeting Deloitte was appointed auditor for the period until the 2019 Annual General Meeting. PricewaterhouseCoopers (PwC) was appointed auditor for the period until the 2018 Annual General Meeting.
Group Parent Company
2018 2017 2018 2017
DeloitteAudit fees1) 42 — 8 —Audit-related fees2) 1 — — —Tax fees3) 1 — — —All other fees4) 1 — 1 —Total fees to Deloitte5) 45 — 9 —PwCAudit fees1) 4 41 — 8Audit-related fees2) 1 2 1 2Tax fees3) — 1 — —All other fees4) 1 10 1 9Total fees to PwC6) 6 54 2 19Audit fees to other audit firms — 2 — —Total fees to auditors 51 56 11 191) Audit fees consist of fees for the annual audit-services engagement and other audit services, which are those services that only the external auditors reasonably can provide, and include
the Group audit; statutory audits; comfort letters and consents; and attest services.2) Audit-related fees consist of fees for assurance and related services that are reasonably related to the performance of the audit of the accounts and annual reports of the Group and group
companies traditionally performed by the external auditors, and include consultations concerning financial accounting and reporting standards; internal control reviews; employee benefit plan audits as well as review of interim reports.
3) Tax fees include fees for tax-compliance services, including the preparation of original and amended tax returns and claims for refund; tax consultations; tax advice related to mergers and acquisitions; transfer pricing; requests for rulings or technical advice from tax authorities; tax-planning services; and expatriate-tax planning and services.
4) All other fees include fees for transaction support services, financial advisory and other services.5) Of audit-related fees, SEK 0m pertains to Deloitte Sweden, of tax fees, SEK 0m pertains to Deloitte Sweden and of all other fees, SEK 1m pertains to Deloitte Sweden.6) The fees for PwC, excluding audit fees, refer to the period January 1 - April 30, 2018.
Note 29 Shares and participations
Investments in associated companiesElectrolux participation in Gångaren 13 Holding AB, Sweden, remained unchanged during the year. Gångaren 13 Holding AB is a real estate com-pany owning the corporate head office in Sweden.
The holdings in the South African associated companies SYR Africa and Llitha Solar (name changed from Shalamuka Kwikot) remained unchanged during the year. SYR Africa supplies Kwikot with valves and has Kwikot as its sole customer. Llitah Solar carry out marginal business activities. The invest-ment in Kwikot Solar has been liquidated during the year.
The holdings in Next-Tech BVBA/SPRL, Belgium, remained unchanged during the year. Next-Tech designs and sells software and hardware solu-tions for domestic kitchen retailers.
In January 2018 Electrolux acquired 40% of the Chinese company Guangdong De Yi Jie Appliances Co., LTD. The company sells AEG house-hold appliances.
All associated companies are unlisted.
Investments in associated companies2018 2017
Company Holding, %Carrying amount
Net income1) Holding, %
Carrying amount
Net income1)
Gångaren 13 Holding AB, Sweden 50 199 14 50 190 5SYR Africa (Pty), South Africa 50 36 7 50 37 0Llitha Solar (Pty) LTD, South Africa 49 11 2 49 –1 0Kwikot Solar, South Africa 0 1 1 50 0 0Next-Tech BVBA/SPRL, Belgium 49 109 –7 49 111 0Guangdong De Yi Jie Appliances Co., LTD, China 40 41 –41 — — —Total 397 –25 337 51) Represents the Group’s share of net income and is reported in the line Other operating income and expenses in the consolidated statement of comprehensive income.
ELECTROLUX ANNUAL REPORT 2018
78 Notes
All amounts in SEKm unless otherwise stated

Subsidiaries Holding, %
Major Group companiesArgentina Frimetal S.A 100Australia Electrolux Home Products Pty. Ltd 100Austria Electrolux Austria GmbH 100Belgium Electrolux Home Products Corporation N.V. 100Brazil Electrolux do Brasil S.A. 100
Canada Electrolux Canada Corp. 100
Chile CTI S.A. 99.82China Electrolux (Hangzhou) Domestic Appliances Co. Ltd 100
Electrolux (China) Home Appliance Co. Ltd 100Denmark Electrolux Home Products Denmark A/S 100Egypt Electrolux Egypt for Home Appliances S.A.E. 99.96Finland Oy Electrolux Ab 100France Electrolux France SAS 100
Electrolux Home Products France SAS 100Electrolux Professionnel SAS 100
Germany Electrolux Deutschland GmbH 100Electrolux Rothenburg GmbH Factory and Development 100Electrolux Professional GmbH 100
Hungary Electrolux Lehel Kft 100Italy Electrolux Appliances S.p.A. 100
Electrolux Professional S.p.A. 100Electrolux Italia S.p.A. 100
Mexico Electrolux de Mexico, S.A. de C.V. 100The Netherlands Electrolux Associated Company B.V. 100
Electrolux Home Products (Nederland) B.V. 100Norway Electrolux Home Products Norway AS 100Poland Electrolux Poland Spolka z.o.o. 100Russia LLC Electrolux Rus 100Singapore Electrolux SEA Pte Ltd 100South Africa Kwikot (Pty) Ltd. 100Spain Electrolux España, S.A.U. 100Sweden Electrolux Laundry Systems Sweden AB 100
Electrolux HemProdukter AB 100Electrolux Appliances AB 100
Switzerland Electrolux AG 100Electrolux Professional AG 100
Thailand Electrolux Thailand Co. Ltd. 100Ukraine DC Electrolux LLC 100United Kingdom Electrolux Plc 100
Electrolux Professional Ltd. 100USA Electrolux Home Products, Inc. 100
Electrolux North America, Inc. 100Electrolux Professional Inc. 100
Group companiesThe following table lists the major companies included in the Electrolux Group. A detailed specification of Group companies has been submitted to the Swedish Companies Registration Office and is available upon request from AB Electrolux Investor Relations.
Cont. Note 29
Notes 79
ELECTROLUX ANNUAL REPORT 2018
All amounts in SEKm unless otherwise stated

Note 30 Definitions
This report includes financial measures as required by the financial report-ing framework applicable to Electrolux, which is based on IFRS. In addition, there are other measures and indicators that are used to follow up, analyze and manage the business and to provide Electrolux stakeholders with use-ful financial information on the Group’s financial position, performance and development in a consistent way. These other measures and indicators are considered essential in supporting the Group’s financial goals to achieve a combination of continuous growth, high profitability, a stable cash flow, and an optimal capital base to generate a high total return for Electrolux shareholders. Thus, there are measures related to growth, profitability and capital, share-based measures and capital indicators which are considered relevant to present on a continuous basis. Below is a list of definitions of all measures and indicators used, referred to and presented in this report.
Computation of average amounts and annualized income statement measuresIn computation of key ratios where averages of capital balances are related to income statement measures, the average capital balances are based on the opening balance and all quarter-end closing balances included in the reporting period, and the income statement measures are annualized, translated at average rates for the period. In computation of key ratios where end-of-period capital balances are related to income statement measures, the latter are annualized, translated at end-of-period exchange rates. Adjustments are made for acquired and divested operations.
Growth measuresChange in net salesCurrent year net sales for the period less previous year net sales for the period as a percentage of previous year net sales for the period.
Sales growthChange in net sales adjusted for currency translation effects.
Organic growthChange in net sales, adjusted for changes in exchange rates, acquisitions and divestments.
AcquisitionsChange in net sales, adjusted for organic growth, changes in exchange rates and divestments. The impact from acquisitions relates to net sales reported by acquired operations within 12 months after the acquisition date.
DivestmentsChange in net sales, adjusted for organic growth, changes in exchange rates and acquisitions. The impact from divestments relates to net sales reported by the divested operations within 12 months before the divest-ment date.
Profitability measuresEBITAOperating income excluding amortization of intangible assets.
EBITA marginEBITA expressed as a percentage of net sales.
Operating margin (EBIT margin)Operating income (EBIT) expressed as a percentage of net sales.
Operating margin (EBIT margin) excluding non-recurring itemsOperating income (EBIT) excluding non-recurring items, expressed as a percentage of net sales.
Return on net assetsOperating income (annualized) expressed as a percentage of average net assets.
Return on equityIncome for the period (annualized) expressed as a percentage of average total equity.
Capital measuresNet debt/equity ratioNet debt in relation to total equity.
Equity/assets ratioTotal equity as a percentage of total assets less liquid funds.
Capital turnover-rateNet sales (annualized) divided by average net assets.
Share-based measuresEarnings per share, BasicIncome for the period attributable to equity holders of the Parent Company divided by the average number of shares excluding shares held by Electrolux.
Earnings per share, DilutedIncome for the period attributable to equity holders of the Parent Company divided by the average number of shares after dilution, excluding shares held by Electrolux.
Equity per shareTotal equity divided by total number of shares excluding shares held by Electrolux.
Capital indicatorsLiquid fundsCash and cash equivalents, short-term investments, financial derivative assets1) and prepaid interest expenses and accrued interest income1).
Liquid funds in relation to net salesThe sum of liquid funds and non-utilized credit facilites divided by annualized net sales.
Operating working capitalInventories and trade receivables less accounts payable.
Working capitalTotal current assets exclusive of liquid funds, less non-current other provisions and total current liabilities exclusive of total short-term borrowings.
Net assetsTotal assets exclusive of liquid funds and pension plan assets, less deferred tax liabilities, non-current other provisions and total current liabilities exclusive of total short-term borrowings.
Total borrowingsLong-term borrowings and short-term borrowings, financial derivative liabilities1), accrued interest expenses and prepaid interest income1).
Total short-term borrowingsShort-term borrowings, financial derivative liabilities1), accrued interest expenses and prepaid interest income1).
Interest-bearing liabilitiesLong-term borrowings and short-term borrowings exclusive of liabilities related to trade receivables with recourse1).
Financial net debtTotal borrowings less liquid funds.
Net provision for post-employment benefitsProvisions for post-employment benefits less pension plan assets.
Net debtFinancial net debt and net provision for post-employment benefits.
Other measuresOperating cash flow after investmentsCash flow from operations and investments adjusted for financial items paid, taxes paid and acquisitions/divestments of operations.
Interest coverage ratioOperating income plus interest income in relation to total interest expenses.
Non-recurring itemsMaterial profit or loss items in operating income2) which are relevant for understanding the financial performance when comparing income for the current period with previous periods.
1) See table Net debt on page 62.2) See Note 7 on page 54 for more information.
ELECTROLUX ANNUAL REPORT 2018
80 Notes
All amounts in SEKm unless otherwise stated

Note 31 Proposed distribution of earnings
‘000 SEK
The Board of Directors proposes that income for the period and retained earnings be distributed as follows: 22,078,885A dividend to the shareholders of SEK 8.50 per share1), totaling 2,442,878To be carried forward 19,636,007Total 22,078,8851) Calculated on the number of outstanding shares as per February 14 2019.
The Board of Directors has proposed that the Annual General Meeting 2019 resolves on a dividend to the shareholders of SEK 8.50 per share to be paid in two installments. The record date for the first installment of SEK 4.25 per share is proposed to be Friday April 12, 2019 and the record date for the second installment of SEK 4.25 per share is proposed to be Friday Octo-ber 11, 2019. On account hereof, the Board of Directors hereby makes the following statement according to Chapter 18 Section 4 of the Swedish Companies Act.
The Board of Directors finds that there will be full coverage for the restricted equity of the Company, after distribution of the proposed dividend.
It is the Board of Directors’ assessment that after distribution of the pro-posed dividend, the equity of the Company and the Group will be sufficient with respect to the kind, extent, and risks of the operations. The Board of Directors has hereby considered, among other things, the Company’s and the Group’s historical development, the budgeted development and the state of the market. If financial instruments currently valued at fair value in accordance with Chapter 4 Section 14a of the Swedish Annual Accounts Act instead had been valued according to the lower of cost or net realizable value, including cumulative revaluation of external shares, the equity of the company would decrease by SEK 121,395 thousand.
After the proposed dividend, the financial strength of the Company and the Group is assessed to continue to be good in relation to the industry in
which the Group is operating. The dividend will not affect the ability of the Company and the Group to comply with its payment obligations. The Board of Directors finds that the Company and the Group are well prepared to handle any changes in respect of liquidity, as well as unexpected events.
The Board of Directors is of the opinion that the Company and the Group have the ability to take future business risks and also cope with potential losses. The proposed dividend will not negatively affect the Company’s and the Group’s ability to make further commercially motivated investments in accordance with the strategy of the Board of Directors.
The Board of Directors declare that the consolidated financial state-ments have been prepared in accordance with IFRS as adopted by the EU and give a true and fair view of the Group’s financial position and results of operations. The financial statements of the Parent Company have been prepared in accordance with generally accepted accounting principles in Sweden and give a true and fair view of the Parent Company’s financial position and results of operations.
The statutory Administration Report of the Group and the Parent Company provides a fair review of the development of the Group’s and the Parent Company’s operations, financial position and results of operations and describes material risks and uncertainties facing the Parent Company and the companies included in the Group.
Stockholm, February 14, 2019AB ELECTROLUX (PUBL)
556009–4178
Staffan BohmanChairman of the Board of Directors
Jonas Samuelson Petra Hedengran Hasse Johansson Ulla Litzén Board member and President Board member Board member Board member and Chief Executive Officer
Bert Nordberg Fredrik Persson David Porter Ulrika Saxon Kai Wärn Board member Board member Board member Board member Board member
Viveca Brinkenfeldt-Lever Ulf Carlsson Peter Ferm Board member, Board member, Board member, employee representative employee representative employee representative
Our audit report was submitted on February 15, 2019Deloitte AB
Jan Berntsson Authorized Public Accountant
Notes 81
ELECTROLUX ANNUAL REPORT 2018
All amounts in SEKm unless otherwise stated

Auditors’ report
Report on the annual accounts and consolidated accounts
OpinionsWe have audited the annual accounts and consolidated accounts of AB Electrolux (publ) for the financial year 2018-01-01–2018-12-31. The annual accounts and consoli-dated accounts of the company are included on pages 17–81 in this document.
In our opinion, the annual accounts have been prepared in accordance with the Annual Accounts Act and present fairly, in all material respects, the financial position of the parent com-pany as of 31 December 2018 and its financial performance and cash flow for the year then ended in accordance with the Annual Accounts Act. The consolidated accounts have been prepared in accordance with the Annual Accounts Act and present fairly, in all material respects, the financial position of the group as of 31 December 2018 and their financial performance and cash flow for the year then ended in accordance with International Financial Reporting Standards (IFRS), as adopted by the EU, and the Annual Accounts Act. The statutory admin-istration report is consistent with the other parts of the annual accounts and consolidated accounts.
We therefore recommend that the general meeting of share-holders adopts the income statement and balance sheet for the parent company and the group.
Our opinions in this report on the annual accounts and consolidated accounts are consistent with the content of the additional report that has been submitted to the parent com-pany’s audit committee in accordance with the Audit Regulation (537/2014) Article 11.
Basis for OpinionsWe conducted our audit in accordance with International Standards on Auditing (ISA) and generally accepted auditing standards in Sweden. Our responsibilities under those standards are further described in the Auditor’s Responsibilities section. We are independent of the parent company and the group in accordance with professional ethics for accountants in Sweden and have otherwise fulfilled our ethical responsibilities in accor-dance with these requirements. This includes that, based on the best of our knowledge and belief, no prohibited services referred to in the Audit Regulation (537/2014) Article 5.1 have been provided to the audited company or, where applicable, its parent company or its controlled companies within the EU.
We believe that the audit evidence we have obtained is suf-ficient and appropriate to provide a basis for our opinions.
Other DisclosuresThe audit of the report for the financial year 2017-01-01– 2017-12-31 has been performed by another auditor, who has issued an auditor’s report dated 16 February 2018, with unquali-fied opinions in the Report of annual accounts and consolidated accounts.
Key Audit MattersKey audit matters of the audit are those matters that, in our professional judgment, were of most significance in our audit of
the annual accounts and consolidated accounts of the current period. These matters were addressed in the context of our audit of, and in forming our opinion thereon, the annual accounts and consolidated accounts as a whole, but we do not provide a separate opinion on these matters.
Revenue RecognitionRevenues in the group consists primarily of sales of appliances to retailers recognized at a certain point in time for example, when the products have been delivered to the customer. Net sales in the group for 2018 amounts to SEK 124,129m and is built up of a significant number of transactions. Due to the large transaction volume, we have identified revenue recognition, with specific focus on completeness and cut off, as a key audit matter.
Accounting principles and disclosures related to revenue recognition can be found in note 4.
Our audit proceduresOur audit procedures included, but were not limited to:• assessing the group’s accounting principles for revenue
recognition and its compliance with IFRS,• understanding the internal control environment regarding
revenue recognition and test of identified key controls including IT-systems,
• analytical procedures, and• detailed testing of sales transactions on a sample basis to
confirm proper cut off of revenue.
Valuation of trade receivablesThe group has significant amounts of trade receivables from its sales to customers in around 150 markets. There is a certain concentration of credit risk exposure towards a few customers in certain markets and there is a risk that some of the receivables will not be paid. The risk might be higher in some geographies due to weaker economic conditions or geopolitical uncertain-ties. Procedures for collecting payments and assessing custom-ers’ ability to pay together with appropriate accounting princi-ples to recognize provisions for bad debt are important factors to ensure a fair valuation of trade receivables.
Accounting principles and disclosures related to trade receivables can be found in note 1 and 17.
Our audit proceduresOur audit procedures included, but were not limited to:• assessing the group’s accounting principles for recognizing
bad debt for compliance with IFRS,• evaluating processes and controls for credit assessments and
approval of credit limits,• detailed testing on a sample basis against customer state-
ments alternatively cash receipts to confirm trade receivables, and
• evaluation of management’s estimates of the provision for bad debt.
To the general meeting of the shareholders of AB Electrolux (publ) corporate identity number 556009-4178
ELECTROLUX ANNUAL REPORT 2018
82 Auditors’ report

Valuation of inventoryThe group carries significant inventories of goods and spare parts produced and held by several production and sales units in many countries. Valuation of inventory requires clear policies and is subject to management’s estimates regarding acquisi-tion costs, excess inventory and net realizable value as well as procedures for safeguarding and keeping track of inventory.Accounting principles and disclosures related to inventories can be found in note 15.
Our audit proceduresOur audit procedures included, but were not limited to:• assessing the group’s accounting principles and the individual
entities’ accounting for inventory in compliance with IFRS,• observations of physical inventory counts,• on a sample basis testing of the valuation of inventory, and• evaluating management’s estimates of the provision for
obsolescence.
Accounting for litigationElectrolux is involved in litigations in the normal course of busi-ness that could have a significant impact on the group results and financial position.
For further information on the group’s litigations and legal proceedings, refer to note 1, note 25 and the statutory adminis-tration report.
Our audit proceduresOur audit procedures included, but were not limited to:• quarterly meetings with the group head of legal regarding
ongoing litigation,• obtaining legal statements from a selection of the groups
external lawyers, and• evaluating managements judgments and estimates related to
litigations and the accounting treatment of these.
Other information than the annual accounts and consolidated accountsThis document also contains other information than the annual accounts and consolidated accounts and is found on pages 1-16 and 86-121. In connection to the publication of the annual accounts and consolidated accounts additional other informa-tion will be made public in two reports, the Electrolux Annual Review 2018 (www.electroluxgroup.com/annualreports/2018) and the Market overview 2018 (www.electroluxgroup.com/ir). The Board of Directors and the Managing Director are respon-sible for this other information.
Our opinion on the annual accounts and consolidated accounts does not cover this other information and we do not express any form of assurance conclusion regarding this other information.
In connection with our audit of the annual accounts and consolidated accounts, our responsibility is to read the informa-tion identified above and consider whether the information is materially inconsistent with the annual accounts and consoli-
dated accounts. In this procedure we also take into account our knowledge otherwise obtained in the audit and assess whether the information is otherwise appears to be materially misstated.
If we, based on the work performed concerning this infor-mation, conclude that there is a material misstatement of this information, we are required to report that fact. We have noth-ing to report in this regard.
Responsibilities of the Board of Directors and the Managing DirectorThe Board of Directors and the Managing Director are respon-sible for the preparation of the annual accounts and con-solidated accounts and that they give a fair presentation in accordance with the Annual Accounts Act, and concerning the consolidated accounts, in accordance with IFRS as adopted by the EU. The Board of Directors and the Managing Director are also responsible for such internal control as they determine is necessary to enable the preparation of annual accounts and consolidated accounts that are free from material misstate-ment, whether due to fraud or error.
In preparing the annual accounts and consolidated accounts, The Board of Directors and the Managing Director are responsible for the assessment of the company’s and the group’s ability to continue as a going concern. They disclose, as applicable, matters related to going concern and using the going concern basis of accounting. The going concern basis of accounting is however not applied if the Board of Directors and the Managing Director intends to liquidate the company, to cease operations, or has no realistic alternative but to do so.
The Audit Committee shall, without prejudice to the Board of Director’s responsibilities and tasks in general, among other things oversee the company’s financial reporting process.
Auditor’s responsibilityOur objectives are to obtain reasonable assurance about whether the annual accounts and consolidated accounts as a whole are free from material misstatement, whether due to fraud or error, and to issue an auditor’s report that includes our opinions. Reasonable assurance is a high level of assurance, but is not a guarantee that an audit conducted in accordance with ISAs and generally accepted auditing standards in Sweden will always detect a material misstatement when it exists. Misstate-ments can arise from fraud or error and are considered material if, individually or in the aggregate, they could reasonably be expected to influence the economic decisions of users taken on the basis of these annual accounts and consolidated accounts.
An additional description of our responsibility for the audit of the annual accounts and the consolidated accounts is on the Swedish Inspectorate of Auditors web page: www.revisorsinspektionen.se/revisornsansvar. This description is a part of the auditor’s report.
Auditors’ report 83
ELECTROLUX ANNUAL REPORT 2018

Stockholm, February 15, 2019
Deloitte ABSignature on Swedish original
Jan Berntsson Authorized Public Accountant
Report on other legal and regulatory requirements
OpinionsIn addition to our audit of the annual accounts and consoli-dated accounts, we have also audited the administration of the Board of Directors and the Managing Director of AB Electrolux (publ) for the financial year 2018-01-01 – 2018-12-31 and the proposed appropriations of the company’s profit or loss.
We recommend to the general meeting of shareholders that the profit to be appropriated in accordance with the proposal in the statutory administration report and that the members of the Board of Directors and the Managing Director be discharged from liability for the financial year.
Basis for OpinionsWe conducted the audit in accordance with generally accepted auditing standards in Sweden. Our responsibilities under those standards are further described in the Auditor’s Responsibilities section. We are independent of the parent company and the group in accordance with professional ethics for accountants in Sweden and have otherwise fulfilled our ethical responsibilities in accordance with these requirements.
We believe that the audit evidence we have obtained is suf-ficient and appropriate to provide a basis for our opinions.
Responsibilities of the Board of Directors and the Managing DirectorThe Board of Directors is responsible for the proposal for appro-priations of the company’s profit or loss. At the proposal of a dividend, this includes an assessment of whether the dividend is justifiable considering the requirements which the company’s and the group’s type of operations, size and risks place on the size of the parent company’s and the group’s equity, consolida-tion requirements, liquidity and position in general.
The Board of Directors is responsible for the company’s organization and the administration of the company’s affairs. This includes among other things continuous assessment of the company’s financial situation and ensuring that the company’s organization is designed so that the accounting, management
of assets and the company’s financial affairs otherwise are controlled in a reassuring manner. The Managing Director shall manage the ongoing administration according to the Board of Directors’ guidelines and instructions and among other mat-ters take measures that are necessary to fulfill the company’s accounting in accordance with law and handle the manage-ment of assets in a reassuring manner.
Auditor’s responsibilityOur objective concerning the audit of the administration, and thereby our opinion about discharge from liability, is to obtain audit evidence to assess with a reasonable degree of assurance whether any member of the Board of Directors or the Managing Director in any material respect:• has undertaken any action or been guilty of any omission
which can give rise to liability to the company, or• in any other way has acted in contravention of the Companies
Act, the Annual Accounts Act or the Articles of Association.
Our objective concerning the audit of the proposed appropria-tions of the company’s profit or loss, and thereby our opinion about this, is to assess with reasonable degree of assurance whether the proposal is in accordance with the Companies Act.
Reasonable assurance is a high level of assurance, but is not a guarantee that an audit conducted in accordance with gen-erally accepted auditing standards in Sweden will always detect actions or omissions that can give rise to liability to the com-pany, or that the proposed appropriations of the company’s profit or loss are not in accordance with the Companies Act.
An additional description of our responsibility for the audit of the annual accounts and the consolidated accounts is on the Swedish Inspectorate of Auditors web page: www.revisorsinspektionen.se/revisornsansvar. This description is a part of the auditor’s report.
Deloitte AB, was appointed auditors of AB Electrolux (publ) by the general meeting of the shareholders on the 2018-04-05 and has been the company’s auditor since 2018-04-05.
ELECTROLUX ANNUAL REPORT 2018
84 Auditors’ report

85
ELECTROLUX ANNUAL REPORT 2018

Eleven-year reviewCompound annual growth rate, %
seKm 2008 2009 2010 2011 2012 1) 2013 2014 2015 2016 20171) 2018 5 years 10 years
Net sales and incomeNet sales 104,792 109,132 106,326 101,598 109,994 109,151 112,143 123,511 121,093 120,771 124,129 2.6 1.7Organic growth, % –0.9 –4.8 1.5 0.2 5.5 4.5 1.1 2.2 –1.1 –0.4 1.3Depreciation and amortization 3,010 3,442 3,328 3,173 3,251 3,356 3,671 3,936 3,934 3,977 4,150Items affecting comparability 2)/ Non-recurring items 6) –355 –1,561 –1,064 –138 –1,032 –2,475 –1,199 — — — –1,343Operating income 1,188 3,761 5,430 3,017 4,000 1,580 3,581 2,741 6,274 7,407 5,310 27.4 16.2Income after financial items 653 3,484 5,306 2,780 3,154 904 2,997 2,101 5,581 6,966 4,887 40.1 22.3Income for the period 366 2,607 3,997 2,064 2,365 672 2,242 1,568 4,493 5,745 3,805 41.4 26.4
Cash flowCash flow from operations 4,949 8,297 7,680 5,399 7,080 4,455 7,822 8,267 10,165 10,024 8,046 12.6 5.0Cash flow from investments –3,755 –2,967 –4,474 –10,049 –4,702 –4,734 –3,759 –3,403 –2,557 –8,200 –6,506
of which capital expenditure in property, plant and equipment –3,158 –2,223 –3,221 –3,163 –4,090 –3,535 –3,006 –3,027 –2,830 –3,892 –4,650 5.6 3.9
Cash flow from operations and investments 1,194 5,330 3,206 –4,650 2,378 –279 4,063 4,864 7,608 1,824 1,540Cash flow from operations and investments excluding acquisitions and divestments of operations 1,228 5,326 3,199 906 2,542 –74 4,132 4,955 7,432 5,229 2,149Dividend, redemption and repurchase of shares –1,187 69 –1,120 –1,850 –1,868 –1,860 –1,861 –1,870 –1,868 –2,155 –2,385Capital expenditure in property, plant and equipment as % of net sales 3.0 2.0 3.0 3.1 3.7 3.2 2.7 2.5 2.3 3.2 3.7
Margins 3)
Operating margin, % 1.5 4.9 6.1 3.1 4.6 3.7 3.2 2.2 5.2 6.1 4.3Income after financial items as % of net sales 1.0 4.6 6.0 2.9 3.8 3.1 2.7 1.7 4.6 5.8 3.9
Financial positionTotal assets 73,323 72,696 73,521 76,384 75,194 76,001 85,688 83,471 85,848 89,542 97,312 5.1 2.9Net assets 20,941 19,506 19,904 27,011 25,890 24,961 26,099 21,412 18,098 20,678 23,574 –1.1 1.2Working capital –5,131 –5,154 –5,902 –5,180 –6,505 –5,800 –8,377 –12,234 –14,966 –15,873 –16,848Trade receivables 20,734 20,173 19,346 19,226 18,288 19,441 20,663 17,745 19,408 20,747 21,482 2.0 0.4Inventories 12,680 10,050 11,130 11,957 12,963 12,154 14,324 14,179 13,418 14,655 16,750 6.6 2.8Accounts payable 15,681 16,031 17,283 18,490 20,590 20,607 25,705 26,467 28,283 31,114 34,443 10.8 8.2Total equity 16,385 18,841 20,613 20,644 15,726 14,308 16,468 15,005 17,738 20,480 21,749 8.7 2.9Interest-bearing liabilities 13,946 14,022 12,096 14,206 13,088 14,905 14,703 13,097 10,202 9,537 9,982 –7.7 –3.3Provisions for post-employment benefits, net 4,479 2,980 4,763 4,509 4,169 2,634 3,814 5.1Net debt 4,556 665 –709 6,367 10,164 10,653 9,631 6,407 360 197 1,825 –29.7 –8.7
Data per share Income for the period, SEK 1.29 9.18 14.04 7.25 8.26 2.35 7.83 5.45 15.64 19.99 13.24 41.3 26.2Equity, SEK 58 66 72 73 55 50 57.52 52.21 61.72 71.26 75.67 8.6 2.7Dividend, SEK4) — 4.00 6.50 6.50 6.50 6.50 6.50 6.50 7.50 8.30 8.50 5.5Trading price of B-shares at year-end, SEK 66.75 167.50 191.00 109.70 170.50 168.50 228.80 205.20 226.30 264.30 187.10 2.1 10.9
Key ratiosReturn on equity, % 2.4 14.9 20.6 10.4 14.4 4.4 15.7 9.9 29.4 31.9 18.2Return on net assets, % 5.8 19.4 27.8 13.7 14.8 5.8 14.2 11.0 29.9 36.0 22.7Net assets as % of net sales 5) 18.1 17.1 18.2 23.8 22.5 21.8 20.4 17.3 14.2 17.5 19.0Trade receivables as % of net sales 5) 17.9 17.7 17.7 17.0 15.9 17.0 16.2 14.3 15.2 17.5 17.3Inventories as % of net sales 5) 11.0 8.8 10.2 10.5 11.3 10.6 11.2 11.5 10.5 12.4 13.5Net debt/equity ratio 0.28 0.04 –0.03 0.31 0.65 0.74 0.58 0.43 0.02 0.01 0.08Interest coverage ratio 1.86 7.54 12.64 5.84 2.72 2.11 5.16 3.75 3.75 12.16 9.05Dividend as % of total equity — 6.0 9.0 9.0 11.8 13.0 11.3 12.4 10.5 11.6 11.2
Other dataAverage number of employees 55,177 50,633 51,544 52,916 59,478 60,754 60,038 58,265 55,400 55,692 54,419 –2.2 –0.1Salaries and remuneration 12,662 13,162 12,678 13,137 13,785 13,521 14,278 15,858 15,886 16,470 17,363 5.1 3.2Number of shareholders 52,600 52,000 57,200 58,800 51,800 51,500 46,500 45,485 48,939 45,295 49,870 –0.6 –0.5Average number of shares after buy-backs, million 283.1 284.0 284.6 284.7 285.9 286.2 286.3 287.1 287.4 287.4 287.4Shares at year end after buy-backs, million 283.6 284.4 284.7 284.7 286.1 286.2 286.3 287.4 287.4 287.4 287.41) Amounts for 2012 have been restated where applicable as a consequence of the amended standard for pension accounting, IAS 19 Employee Benefits and 2017
as a consequence of the introduction of IFRS 15 Revenue from Contracts with Customers.2) As of 2015 the accounting concept of Items affecting comparability is no longer in use. As from 2018, non-recurring items are presented, see definition in Note 30.3) Items affecting comparability are excluded for the years 2005 to 2013. 2014 has been restated.4) 2018: Proposed by the Board. 5) Annualized net sales, calculated at end of period exchange rates, 2018: 124,399 (2017: 118,464).6) For more information, see Note 7.
ELECTROLUX ANNUAL REPORT 2018
86 Eleven-year review
All amounts in SEKm unless otherwise stated

Compound annual growth rate, %
seKm 2008 2009 2010 2011 2012 1) 2013 2014 2015 2016 20171) 2018 5 years 10 years
Net sales and incomeNet sales 104,792 109,132 106,326 101,598 109,994 109,151 112,143 123,511 121,093 120,771 124,129 2.6 1.7Organic growth, % –0.9 –4.8 1.5 0.2 5.5 4.5 1.1 2.2 –1.1 –0.4 1.3Depreciation and amortization 3,010 3,442 3,328 3,173 3,251 3,356 3,671 3,936 3,934 3,977 4,150Items affecting comparability 2)/ Non-recurring items 6) –355 –1,561 –1,064 –138 –1,032 –2,475 –1,199 — — — –1,343Operating income 1,188 3,761 5,430 3,017 4,000 1,580 3,581 2,741 6,274 7,407 5,310 27.4 16.2Income after financial items 653 3,484 5,306 2,780 3,154 904 2,997 2,101 5,581 6,966 4,887 40.1 22.3Income for the period 366 2,607 3,997 2,064 2,365 672 2,242 1,568 4,493 5,745 3,805 41.4 26.4
Cash flowCash flow from operations 4,949 8,297 7,680 5,399 7,080 4,455 7,822 8,267 10,165 10,024 8,046 12.6 5.0Cash flow from investments –3,755 –2,967 –4,474 –10,049 –4,702 –4,734 –3,759 –3,403 –2,557 –8,200 –6,506
of which capital expenditure in property, plant and equipment –3,158 –2,223 –3,221 –3,163 –4,090 –3,535 –3,006 –3,027 –2,830 –3,892 –4,650 5.6 3.9
Cash flow from operations and investments 1,194 5,330 3,206 –4,650 2,378 –279 4,063 4,864 7,608 1,824 1,540Cash flow from operations and investments excluding acquisitions and divestments of operations 1,228 5,326 3,199 906 2,542 –74 4,132 4,955 7,432 5,229 2,149Dividend, redemption and repurchase of shares –1,187 69 –1,120 –1,850 –1,868 –1,860 –1,861 –1,870 –1,868 –2,155 –2,385Capital expenditure in property, plant and equipment as % of net sales 3.0 2.0 3.0 3.1 3.7 3.2 2.7 2.5 2.3 3.2 3.7
Margins 3)
Operating margin, % 1.5 4.9 6.1 3.1 4.6 3.7 3.2 2.2 5.2 6.1 4.3Income after financial items as % of net sales 1.0 4.6 6.0 2.9 3.8 3.1 2.7 1.7 4.6 5.8 3.9
Financial positionTotal assets 73,323 72,696 73,521 76,384 75,194 76,001 85,688 83,471 85,848 89,542 97,312 5.1 2.9Net assets 20,941 19,506 19,904 27,011 25,890 24,961 26,099 21,412 18,098 20,678 23,574 –1.1 1.2Working capital –5,131 –5,154 –5,902 –5,180 –6,505 –5,800 –8,377 –12,234 –14,966 –15,873 –16,848Trade receivables 20,734 20,173 19,346 19,226 18,288 19,441 20,663 17,745 19,408 20,747 21,482 2.0 0.4Inventories 12,680 10,050 11,130 11,957 12,963 12,154 14,324 14,179 13,418 14,655 16,750 6.6 2.8Accounts payable 15,681 16,031 17,283 18,490 20,590 20,607 25,705 26,467 28,283 31,114 34,443 10.8 8.2Total equity 16,385 18,841 20,613 20,644 15,726 14,308 16,468 15,005 17,738 20,480 21,749 8.7 2.9Interest-bearing liabilities 13,946 14,022 12,096 14,206 13,088 14,905 14,703 13,097 10,202 9,537 9,982 –7.7 –3.3Provisions for post-employment benefits, net 4,479 2,980 4,763 4,509 4,169 2,634 3,814 5.1Net debt 4,556 665 –709 6,367 10,164 10,653 9,631 6,407 360 197 1,825 –29.7 –8.7
Data per share Income for the period, SEK 1.29 9.18 14.04 7.25 8.26 2.35 7.83 5.45 15.64 19.99 13.24 41.3 26.2Equity, SEK 58 66 72 73 55 50 57.52 52.21 61.72 71.26 75.67 8.6 2.7Dividend, SEK4) — 4.00 6.50 6.50 6.50 6.50 6.50 6.50 7.50 8.30 8.50 5.5Trading price of B-shares at year-end, SEK 66.75 167.50 191.00 109.70 170.50 168.50 228.80 205.20 226.30 264.30 187.10 2.1 10.9
Key ratiosReturn on equity, % 2.4 14.9 20.6 10.4 14.4 4.4 15.7 9.9 29.4 31.9 18.2Return on net assets, % 5.8 19.4 27.8 13.7 14.8 5.8 14.2 11.0 29.9 36.0 22.7Net assets as % of net sales 5) 18.1 17.1 18.2 23.8 22.5 21.8 20.4 17.3 14.2 17.5 19.0Trade receivables as % of net sales 5) 17.9 17.7 17.7 17.0 15.9 17.0 16.2 14.3 15.2 17.5 17.3Inventories as % of net sales 5) 11.0 8.8 10.2 10.5 11.3 10.6 11.2 11.5 10.5 12.4 13.5Net debt/equity ratio 0.28 0.04 –0.03 0.31 0.65 0.74 0.58 0.43 0.02 0.01 0.08Interest coverage ratio 1.86 7.54 12.64 5.84 2.72 2.11 5.16 3.75 3.75 12.16 9.05Dividend as % of total equity — 6.0 9.0 9.0 11.8 13.0 11.3 12.4 10.5 11.6 11.2
Other dataAverage number of employees 55,177 50,633 51,544 52,916 59,478 60,754 60,038 58,265 55,400 55,692 54,419 –2.2 –0.1Salaries and remuneration 12,662 13,162 12,678 13,137 13,785 13,521 14,278 15,858 15,886 16,470 17,363 5.1 3.2Number of shareholders 52,600 52,000 57,200 58,800 51,800 51,500 46,500 45,485 48,939 45,295 49,870 –0.6 –0.5Average number of shares after buy-backs, million 283.1 284.0 284.6 284.7 285.9 286.2 286.3 287.1 287.4 287.4 287.4Shares at year end after buy-backs, million 283.6 284.4 284.7 284.7 286.1 286.2 286.3 287.4 287.4 287.4 287.41) Amounts for 2012 have been restated where applicable as a consequence of the amended standard for pension accounting, IAS 19 Employee Benefits and 2017
as a consequence of the introduction of IFRS 15 Revenue from Contracts with Customers.2) As of 2015 the accounting concept of Items affecting comparability is no longer in use. As from 2018, non-recurring items are presented, see definition in Note 30.3) Items affecting comparability are excluded for the years 2005 to 2013. 2014 has been restated.4) 2018: Proposed by the Board. 5) Annualized net sales, calculated at end of period exchange rates, 2018: 124,399 (2017: 118,464).6) For more information, see Note 7.
Eleven-year review 87
ELECTROLUX ANNUAL REPORT 2018
All amounts in SEKm unless otherwise stated

Operations by business area yearlyseKm 2014 2015 2016 20171) 2018
Major Appliances Europe, Middle East and AfricaNet sales 34,438 37,179 37,844 38,524 42,732Operating income 232 2,167 2,546 2,764 2,220Margin, % 0.7 5.8 6.7 7.2 5.2
Major Appliances North AmericaNet sales 34,141 43,053 43,402 40,656 38,875Operating income 1,714 1,580 2,671 2,757 972Margin, % 5.0 3.7 6.2 6.8 2.5
Major Appliances Latin AmericaNet sales 20,041 18,546 15,419 17,302 17,076Operating income 1,069 463 –68 425 464Margin, % 5.3 2.5 –0.4 2.5 2.7
Major Appliances Asia/PacificNet sales 8,803 9,229 9,380 8,759 9,165Operating income 438 364 626 750 648Margin, % 5.0 3.9 6.7 8.6 7.1
Home Care & SDANet sales 8,678 8,958 8,183 7,808 7,616Operating income 200 –63 238 431 398Margin, % 2.3 –0.7 2.9 5.5 5.2
Professional ProductsNet sales 6,041 6,546 6,865 7,723 8,666Operating income 671 862 954 1,054 1,134Margin, % 11.1 13.2 13.9 13.7 13.1
OtherNet sales 1 — — — —Operating income, common Group costs, etc. –743 –2,632 –693 –775 –527
Total GroupNet sales 112,143 123,511 121,093 120,771 124,129Operating income 3,581 2,741 6,274 7,407 5,310Margin, % 3.2 2.2 5.2 6.1 4.31) Electrolux applies the new standard for revenue recognition, IFRS 15 Revenue from Contracts with Customer, as of January 1, 2018. Reported figures for 2017 have been restated to enable
comparison.
Non-recurring items1) 2014 2015 2016 2017 2018
Major Appliances Europe, Middle East and Africa –1,212 — — — –747Major Appliances North America –392) –1582) — — –596Major Appliances Latin America –10 — — — —Major Appliances Asia/Pacific –10 — — — —Home Care & SDA — –190 — — —Professional Products — — — — —Common Group cost –772) –1,9012) — — —Total Group –1,348 –2,249 — — –1,3431) For more information, see Note 7.2) Refers to costs related to the not completed acquisition of GE Appliances. Costs for preparatory integration work of SEK 39m for 2014 and SEK 158m for 2015 have been charged to operating
income for Major Appliances North America. Common Group cost includes transaction costs of SEK 110m for 2014 and SEK 408m for 2015 and a termination fee paid to General Electric in December 2015 of USD 175m, corresponding to SEK 1,493m. In total, costs of SEK 2,059m related to GE Appliances were charged to operating income in 2015 of which SEK 63m in the first quarter, SEK 195m in the second quarter, SEK 142m in the third quarter and SEK 1,659m in the fourth quarter.
ELECTROLUX ANNUAL REPORT 2018
88 Operations by business area yearly
All amounts in SEKm unless otherwise stated
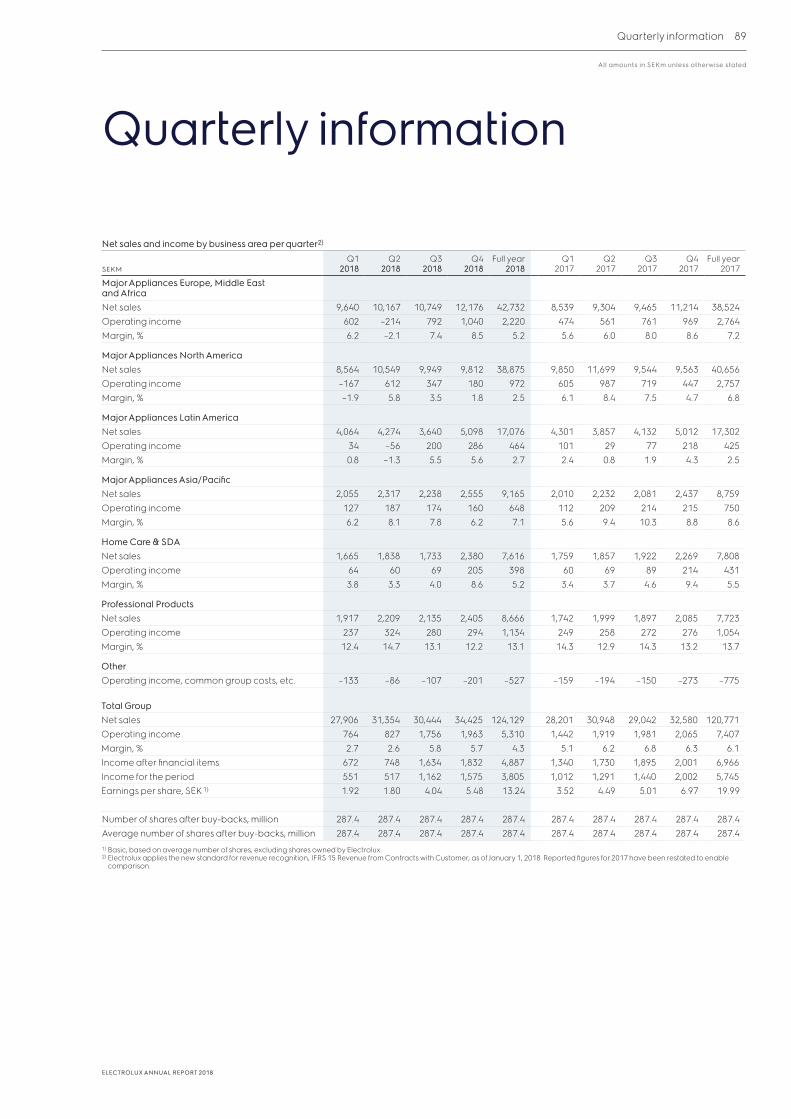
Quarterly information
Net sales and income by business area per quarter2)
seKmQ1
2018Q2
2018Q3
2018Q4
2018Full year
2018Q1
2017Q2
2017Q3
2017Q4
2017Full year
2017
Major Appliances Europe, Middle East and AfricaNet sales 9,640 10,167 10,749 12,176 42,732 8,539 9,304 9,465 11,214 38,524Operating income 602 –214 792 1,040 2,220 474 561 761 969 2,764Margin, % 6.2 –2.1 7.4 8.5 5.2 5.6 6.0 8.0 8.6 7.2
Major Appliances North AmericaNet sales 8,564 10,549 9,949 9,812 38,875 9,850 11,699 9,544 9,563 40,656Operating income –167 612 347 180 972 605 987 719 447 2,757Margin, % –1.9 5.8 3.5 1.8 2.5 6.1 8.4 7.5 4.7 6.8
Major Appliances Latin AmericaNet sales 4,064 4,274 3,640 5,098 17,076 4,301 3,857 4,132 5,012 17,302Operating income 34 –56 200 286 464 101 29 77 218 425Margin, % 0.8 –1.3 5.5 5.6 2.7 2.4 0.8 1.9 4.3 2.5
Major Appliances Asia/PacificNet sales 2,055 2,317 2,238 2,555 9,165 2,010 2,232 2,081 2,437 8,759Operating income 127 187 174 160 648 112 209 214 215 750Margin, % 6.2 8.1 7.8 6.2 7.1 5.6 9.4 10.3 8.8 8.6
Home Care & SDANet sales 1,665 1,838 1,733 2,380 7,616 1,759 1,857 1,922 2,269 7,808Operating income 64 60 69 205 398 60 69 89 214 431Margin, % 3.8 3.3 4.0 8.6 5.2 3.4 3.7 4.6 9.4 5.5
Professional ProductsNet sales 1,917 2,209 2,135 2,405 8,666 1,742 1,999 1,897 2,085 7,723Operating income 237 324 280 294 1,134 249 258 272 276 1,054Margin, % 12.4 14.7 13.1 12.2 13.1 14.3 12.9 14.3 13.2 13.7
OtherOperating income, common group costs, etc. –133 –86 –107 –201 –527 –159 –194 –150 –273 –775
Total GroupNet sales 27,906 31,354 30,444 34,425 124,129 28,201 30,948 29,042 32,580 120,771Operating income 764 827 1,756 1,963 5,310 1,442 1,919 1,981 2,065 7,407Margin, % 2.7 2.6 5.8 5.7 4.3 5.1 6.2 6.8 6.3 6.1Income after financial items 672 748 1,634 1,832 4,887 1,340 1,730 1,895 2,001 6,966Income for the period 551 517 1,162 1,575 3,805 1,012 1,291 1,440 2,002 5,745Earnings per share, SEK1) 1.92 1.80 4.04 5.48 13.24 3.52 4.49 5.01 6.97 19.99
Number of shares after buy-backs, million 287.4 287.4 287.4 287.4 287.4 287.4 287.4 287.4 287.4 287.4Average number of shares after buy-backs, million 287.4 287.4 287.4 287.4 287.4 287.4 287.4 287.4 287.4 287.41) Basic, based on average number of shares, excluding shares owned by Electrolux.2) Electrolux applies the new standard for revenue recognition, IFRS 15 Revenue from Contracts with Customer, as of January 1, 2018. Reported figures for 2017 have been restated to enable
comparison.
Quarterly information 89
ELECTROLUX ANNUAL REPORT 2018
All amounts in SEKm unless otherwise stated

Sustainability reporting 2018Electrolux is a global leader in household and professional appliances for kitchen and laundry. Sustainability is part of the business model as a transformational driver. In this section, the Group’s sustainability work and the results for 2018 are presented.
The Group’s sustainability performance strengthens relations with investors. In 2018, and for the 12th consecutive year, Electrolux was recognized as a leader in the household durables industry in the prestigious Dow Jones Sustainability Index (DJSI). Electrolux thereby ranks among the top 10% of the world’s 2,500 largest companies for social and environmental performance. Additionally, Electrolux has received recognition from other indexes and organizations, including RobecoSAM, CDP and UN Global Compact Top 100. Electrolux is included in the Climate A List by CDP for the third year in a row.
ELECTROLUX — A LEADER IN THE HOUSEHOLD DURABLES INDUSTRY
Electrolux shapes living for the better by reinventing taste, care and wellbeing experiences, making life more enjoyable and sustainable for millions of people. As a leading global appli-ance company, we place the consumer at the heart of every-thing we do. Through our brands, including Electrolux, AEG and
Frigidaire, we sell more than 60 million household and profes-sional products in more than 150 markets every year. In 2018, Electrolux had sales of SEK 124 billion and employed 54,000 people around the world. For more information, go to www.electroluxgroup.com.
KEY RESULTS 2018
The global Green Range accounted for 21% of total units sold and 29% of gross profit for
consumer products in 2018
metric tonsrecycled plastic
used in 2018
CO2 per manufactured product in 2018 compared
to 2017
Thirteen local and three global Electrolux Food Foundation projects
up and running.
Business model and sustainable developmentTo achieve the Electrolux purpose – shape living for the better – and drive profitable growth, Electrolux uses a business model that focuses on delivering outstanding consumer experiences in taste, care and wellbeing. The objective is to create a steady stream of consumer-relevant innovations under well-estab-lished brands in key experience areas.
With over 60 million home appliances sold annually, Electrolux has long recognized the impact the company has on the environment and in society. Sustainable development
is defined as a transformational driver in the business model as the company recognizes the growing importance of sustain-ability performance and reputation. This includes the impact of Electrolux business operations and products on the planet and society.
Electrolux is continuously making progress on sustainability and is acknowledged as a sustainability leader in the household durables industry.
21/29%
>7,000
-17%
16
ELECTROLUX ANNUAL REPORT 2018
90 Sustainability reporting

AVERAGE CO2 IMPACT DURING THE LIFETIME OF APPLIANCES1)
The product life-cycle perspective gives guidance for how to best reduce environmental impact by indicating the degree of impact in raw-material extraction, manufacturing, transportation, use and end-of-life treatment. The most significant environmental impact for Electrolux is carbon emissions as a result of energy consumption when products are used. Electrolux is aiming to halve the life-cycle climate impact of its products by 2020 relative to 2005 levels. If successful, this will avoid approximately 25 million metric tons of CO2- equivalents in emissions.1) The graph is based on the Group’s total CO2 impact used for setting Science Based
Targets.
Electrolux in a changing worldThe world in which Electrolux operates is constantly changing. Demographic trends are increasing pressure on resources, rapid technological development requires new business approaches, and climate and resource concerns are influenc-ing decision making at all levels. Such global megatrends create challenges for the business – but also bring about business opportunities.
DemographicsGlobal demographic trends – such as population growth, the growing middle class, an aging population and urbaniza-tion – are increasing the demand for home appliances, which puts more pressure on natural resources. In the next 15 years, another billion people are expected to buy their first refrigerator.
Implications for Electrolux:• Significant growth potential in emerging markets. • Continued need to improve the environmental performance
of products. • Growing importance of the elderly consumer group and the
increasing number of smaller households. • Potential for new business models, such as shared ownership.
Climate and resourcesThe need to reduce greenhouse gas emissions, and adapt to a changing climate and resource limitations, will drive manufac-turers toward circular business models that promote resource efficiency, cleaner chemistry and waste reduction.
Implications for Electrolux:• Continued need to improve the environmental performance
of products. • Pressure to reduce water consumption in areas with water
scarcity. • Competition for some metals and minerals. • Growing importance of the circular economy. • Expectations to go beyond chemical legislation.
TechnologyNew technologies are scaled rapidly and globally, with purchas-ing decisions increasingly influenced by online information and social media. The Internet of Things (IoT) promises to connect billions of products in the near future.
Implications for Electrolux:• Greater consumer empowerment and awareness requires
transparency and sustainable business practices. • Digitalization will drive the next wave of operational efficiency,
including closer integration with suppliers. • Connectivity offers opportunities for new business models that
result in better resource efficiency. • IoT enables a lifelong relationship between producers and
consumers, but requires high standards of data security and privacy.
MaterialityMaterial issues are topics that reflect the most significant eco-nomic, environmental and social impacts.
The materiality process aims to identify and understand the topics that are important to stakeholders, as well as to the Group’s business strategy. It is an important way of evaluating the ability to create and sustain value.
Electrolux draws on insights from global trends and drivers, market intelligence, product research, internal and external dia-logue, expert opinion and consumer surveys, and other sources
of information to develop an up-to-date understanding of the prevailing business context.
The material issues have been formulated in the Group’s sustainability framework – For the Better – as nine promises with defined 2020 sustainability goals, and supported by key perfor-mance indicators (KPIs) (more details in For the Better, page 92).
The correlation between the UN Sustainable Development Goals and Electrolux sustainability framework shows that the Group’s materiality analysis reflects societal priorities.
Recycling 1%Materials, 7%Manufacturing, 1%Transportation, 1%Product usage, 85%Greenhouse gas, 5%
Sustainability reporting 91
ELECTROLUX ANNUAL REPORT 2018

The Group’s sustainability framework – For the Better – comprises three areas: Better solutions, Better operations and Better society. It includes a target to halve the Group’s direct carbon emissions before the end of 2020 and nine promises to make a positive difference for the better.
OPERATIONAL RESOURCE EFFICIENCY
INDEX
50
60
70
80
90
100
1817161514
Energy per standard unitEnergy consumption
CO2 emissions Water consumption
ELECTROLUX -50% CLIMATE TARGET FOR 2020
181716-05
Product use Green House Gas
2020 Target-50%
ManufacturingTransport
Better solutionsMeeting the growing global market for household appliances without increasing environmental impact requires Electrolux to improve product efficiency even further and to use resources more efficiently.
Constantly improve product performance and efficiency Tackling climate change and the increasing demand for water are among the most urgent challenges facing society. Electrolux contributes by offering resource-efficient products that help consumers and customers to live better lives, save money and reduce their environmental footprint. In 2018, products with leading environmental performances represented 21% of products sold and 29% of gross profit. One example launched recently is the professional laundry range Line 6000 with strong environmental performance.
Make better use of resourcesMaterials used in household appliances are primarily steel, plastic and electronical components. One of the ways of con-tributing to greater resource efficiency is to increase the use of recycled materials and support initiatives for product recycling. Electrolux has increased activities in all business areas to reach the target of 20,000 metric tons of recycled plastics by 2020.
Eliminate harmful materialsElectrolux has a robust approach to choosing materials for its products and protecting human health and the environ-ment. The Group continues to implement a common process for chemical management. New scientific findings and stake-holder requirements are used to regularly update the Group’s Restricted Materials List.
Better solutions
Climate targets
Improve product performance and efficiency
Make better use of resources
Eliminate harmful materials
Better operations
Ensure the best health and safety
Achieve more with less
Respect human rights and ethical principles
Better society
Solutions for healthy and sustainable living for more people
Be a force for good
Improve supply chain sustainability
For the Better
The target is to reduce climate impact by 50% focusing on product efficiency, and it encompasses the main product categories. Sales volumes and emission factors are normalized to 2005
ELECTROLUX ANNUAL REPORT 2018
92 Sustainability reporting

INCIDENT RATE1)
1) Per 200,000 working hours.
0.00.20.40.60.81.01.21.4
1817161514
RESPONSIBLE SOURCING AUDIT FINDINGS
0 200 400 600 800 1,000
Zero tolerance
Critical findings
Major findings
Minor findingsInitial auditFollow-up audit
Better operationsWith 54,000 employees worldwide and operations in more than 58 countries, Electrolux influences people’s daily life around the world. The Group works continuously to be more resource efficient and ensure safe and ethical operations.
Achieve more with lessEfficient use of resources reduces environmental impact and reduces costs. The Green Spirit program, a part of the Electrolux Manufacturing System, has the objective to continuously reduce energy use and to shift to renewables in the Group’s operations around the world. In 2018, Electrolux reduced its energy con-sumption by 2,7% (2.4%) and CO2 emissions by 14,9% (17.5%) compared to 2017. In 2018, 30% of the total energy used came from renewable sources.
Ensure the best health and safetyThe Group’s safety mind-set involves preventing accidents and keeping employees safe and sound, no matter where they are in
the world. Since 2014, the injury rate has declined by 37% across the Group. The global incident rate (TCIR) was 0.59 (0.6) in 2018.
The approach to safety led to an estimated annual saving of over SEK 39 million in 2018 compared with 2014, based on the average financial costs associated with injuries and the num-ber of injuries that incur lost days.
Always act ethically and respect human rightsElectrolux continues to build an ethical, trusted company, where everyone impacted by the Group’s operations can feel confident that their rights are respected. Electrolux has a global ethics program encompassing both training and a whistle-blowing system – the Electrolux Ethics Helpline – and in 2018, 247 (186) Helpline reports were made. Also, as part of the Group’s approach to human rights, a local human rights assessment was conducted in Ukraine in 2018.
Better societyAs a global company, Electrolux affects millions of people — customers, suppliers and local communities. Electrolux strives to make a difference in society by helping all stakeholders throughout the value chain to become more sustainable and by promoting a positive impact in the communities in which the Group operates.
Solutions for healthy and sustainable living for more peopleElectrolux makes efficient appliances accessible to more peo-ple, creating opportunities for a better life. As a global company, Electrolux can contribute to a faster transfer of technology to new growing markets. The Group participates in the United 4 Efficiency, a global program supporting developing countries to move their markets to energy-efficient appliances. Resource-efficient solutions improve the lives of people and minimize environmental impacts.
Be a force for goodAs a world-leader in kitchen appliances, the Group’s com-munity investment activities focus on food — in cooperation
with employees and local stakeholders. Actions are facilitated through the Electrolux Food Foundation, and the Feed the Planet partnership together with the World Association of Chefs’ Societies (Worldchefs) and the world’s largest youth organiza-tion AIESEC. In 2018, a strategy to replicate successful project models and scale up the positive impact was established. The objectives are to spread knowledge regarding sustainable food habits and to help people in need. Several local and three global projects were active in 2018. Some 15,000 people were educated and 445,000 food donations were made.
Improve sustainability in the supply chain Regardless of where the Group’s products and components are manufactured, it must be done with respect for people and care for the environment. As part of its responsible sourcing efforts, Electrolux carried out 399 (387) supplier audits in 2018, and over 6,400 supplier employees were trained in the Electrolux Supplier Workplace Standard and other relevant sustainability issues. Electrolux has cooperated with shippers to reduce the climate impact of container sea transport.
Remediation of non compliances, comparing follow-up audits conducted in 2018 with preceding audits.
Sustainability reporting 93
ELECTROLUX ANNUAL REPORT 2018

Managing sustainability – Risks and Opportunities
Aspect Environment Social, labor and human rights Anti-corruption
Policies Environmental PolicyWorkplace Policy
Workplace Policy Supplier Workplace Standard Workplace Directive
Anti-Corruption PolicyConflict of Interest Policy
Key areas • Product design • Child and forced labor • Conflict of interest
• Efficiency in operations • Health and safety, working hours, compensation
• Bribes or other improper benefits
• Influencing legislation • Discrimination and harassment • Business partners and customers
• Environmental management systems
• Freedom of association, collective bargaining
• Political contributions
The full text of Electrolux policies is available at www.electroluxgroup.com/en/category/sustainability/codes-and-policies
EnvironmentFrom an entire product life-cycle perspective, Electrolux has a relatively large environmental impact – including energy con-sumption, use of materials and chemicals. Generally, the most significant impacts occur during a product’s use phase, and the Group’s strategy is to improve product performance.
The Electrolux Environmental Policy outlines how Electrolux aims to improve environmental performance in production and product use, as well as how to design products for disposal. Requirements in the Group’s operations and in supply chain are described in the Workplace Directive. All Electrolux factories with more than 50 employees are required to be ISO 14001 and ISO 50001 certified.
Group requirements on suppliers are described in the Sup-plier Workplace Standard and the Workplace Directive. Com-pliance is mandatory when evaluating potential and existing suppliers. The Group’s major suppliers of finished products must measure and monitor their energy use and report it through the
energy reporting standard. They have also been included in the WWF Water Risk Filter assessment.
Electrolux responds to the annual CDP Climate Change and Water questionnaires, and was included in the Climate Change A-list, and scored as B in CDP Water in 2018.
The Group’s proactive approach aims to develop and promote sales of products with lower environmental impact. Readiness for more stringent product legislation, for example, can lead to increased sales. For many years, products with superior environmental performance have delivered higher profit margins.
Electrolux products are affected by legislation including energy consumption, producer responsibility, and management of hazardous substances. Some customers have requirements that go beyond legislation.
The main environmental risks are related to regulatory and customer requirements (see pages 96–97). Not meeting require-
GovernanceThe Group’s sustainability framework – For the Better – is directly overseen by the Group Management and the Business Areas’ Management teams that have been engaged in the develop-ment of the priorities and objectives for the nine promises.
During 2018, a new Electrolux Code of Conduct was intro-duced, which was approved by the Group Management and the Board. The Code of Conduct is an overarching document of the most important Group policies and directives, and is a guide to the Electrolux way of doing business. In connection with the introduction of the Code of Conduct, the structure of other main steering documents (Group policies) has also been simplified and clarified. From a sustainability reporting perspective, the most relevant Group policies are presented below.
Each business area is responsible for contributing to the fulfill-ment of the Group’s sustainability targets under the nine prom-ises, and several of the KPIs are broken down and monitored at business area level. Reference groups and steering groups with Group Management and senior management participation are in place for various programs; for example, the Ethics & Human Rights Steering Group; Industrial Operations; External Affairs; and Chemicals.
A number of Group functions are accountable for identifying and managing nonfinancial risks in their area of responsibility. Risks are reported to Group Management, and they feed the materiality process.
Key sustainability governance responsibilities:• Internal Audit evaluates and improves governance, internal
control and risk management processes. • Group Risk Management benchmarks and monitors key risks
in operations and critical suppliers. • Group Legal Affairs is responsible for implementing an anti-
corruption program. • Each Business Area’s Sourcing Board is responsible for moni-
toring supplier compliance, with the support of the Respon-sible Sourcing Team.
• Group Sustainability Affairs assesses materiality, develops policies, targets, monitors the implementation of programs, and manages the Responsible Sourcing program.
• The Ethics Helpline (whistle-blower function) and programs for ethics and human rights are overseen by the Ethics & Human Rights Steering Group.
ELECTROLUX ANNUAL REPORT 2018
94 Sustainability reporting

ments could result in fines or limitations in production permits, reduced sales or product withdrawal. Electrolux has processes in place to mitigate these risks, including ISO management systems, internal audits, a Responsible Sourcing program, and targets in the product development plans.
The Group’s programs to reduce operational resource con-sumption and to introduce more recycled materials in products are saving costs.
In 2018, the Group’s Science Based Targets in line with the Paris Agreement (COP 21) were approved.
Social, labor and human rightsElectrolux is built on trust, which means that all actions and deci-sions must be governed by principles of ethics, integrity, and respect for people and care for the environment – no matter where the Group operates in the world.
Consumers are increasingly making purchasing decisions based on the trust in companies and how they contribute to society. Additionally, employees prefer to work for a company with values that match their own. Respecting human rights and being an ethical company goes beyond simply meeting legal requirements. It is about guiding employees to know what is right and wrong, and how to make decisions accordingly. The goals in For the Better reflect the Group’s commitment to build a strong culture for ethics and human rights.
The key human rights risks include freedom of association, discrimination and working conditions. Other risks are privacy of information, and corruption.
The Electrolux Code of Conduct was launched in 2018, and it contains the Group’s Human Rights Statement, firmly establish-ing that human rights shall be respected. This is further detailed through a new Human Rights Directive. The Workplace Policy, the Supplier Workplace Standard and the Workplace Directive contain mandatory requirements relating to labor rights, health, safety and environment within Electrolux and suppliers.
Electrolux monitors performance and manages risks through internal and external audits, an annual self-assessment process for manufacturing units, local human rights assessments, edu-cation, the Ethics Helpline, management-labor dialogue, as well as health and safety committees. Risks in the supply chain are addressed through audits and training efforts as part of the Responsible Sourcing program.
Human rights procedures engage many functions through-out the organization, from Human Resources to Purchasing and Global Industrial Operations. Accountability for the ethics pro-gram and oversight of human rights lies with the Ethics & Human Rights Steering Group, which comprises senior management representatives from Group functions.
Electrolux conducts human rights impact assessments at both Group and local level. Six issues and three business pro-cesses constitute the Group’s salient human rights issues. The methodology is in line with the UN Guiding Principles on Business and Human Rights, and good practices for human rights impact assessments. The assessments span the Group’s entire activi-ties in the country, including risks at suppliers and customers. In 2018, a local human rights impact assessment was conducted in Ukraine.
Anti-corruption Corruption poses a threat to sustainable economic and social development around the world and in particular in poor com-munities. Corruption could also have severe negative impacts for the Group by obstructing business growth, increasing costs and imposing serious legal and reputational risks. Operating in more than 58 countries all over the world, including countries in emerging markets, means that Electrolux is exposed to risks related to corruption and bribery. These risks may arise in sev-eral phases of the value chain, such as in purchasing and sales.
Electrolux has zero tolerance for corruption and works continuously to raise awareness among employees in order to minimize the risk for corruption. Measures against corruption are included in the Anti-Corruption Policy, which all employees are required to follow. This policy provides guidance to employ-ees on how to do the right thing and explains what actions constitute unlawful and inappropriate behavior.
Employees can report ethical misconduct through a whistle-blower system. In 2018, 247 (186) reports were received, out of which 24 (19) reports in the area of business integrity were investigated. “Business integrity” includes allegations related to corruption, fraud, theft, internal control and anti-trust.
Electrolux conducts Group-wide e-learning courses on anti-corruption. These initiatives complement the tailored training
that certain functions such as sales, procurement and senior management receive (more exposed to corruption risks). Such face-to-face training sessions have been conducted locally throughout the organization by either in-house legal counsel or by external experts. Training requirements are continuously monitored and evaluated based on business needs, and the legal and risk context. The local human rights assessments include review and assessment of corruption risks.
76% of employees trusted that the concerns reported
through the Ethics Helpline (Alertline in North America) are handled confidentially and fairly in 2018.
Sustainability reporting 95
ELECTROLUX ANNUAL REPORT 2018

Impacts throughout the value chain
Suppliers
Electrolux relies on several thousand first-tier suppliers, many in emerging markets. The focus is on safeguard-ing Electrolux standards and developing supplier capac-ity to improve sustainability performance. Electrolux also requires all its suppliers to comply with Electrolux Sup-plier Workplace Standard and the Workplace Directive.
Risks• Connections to social,
ethical and human rights violations.
• Severe weather conditions caused by climate change could negatively affect supply.
• Business interruptions due to unethical business practices in the supply chain.
How impacts are managed • Apply a risk-based
approach to identify suppli-ers in scope.
• Assess the climate impact of key suppliers.
• Conduct auditing to safe-guard standards.
• Hold training and drive improvement programs.
Ability to influence - Medium
Generating valueEnforcing Electrolux stan-dards supports human rights and raises environmental, labor and economic stan-dards, particularly in emerg-ing markets. This also builds trust and a resilient supply chain, while reducing busi-ness and reputational risks.
Electrolux operationsElectrolux has 53 factories and sales in 150 markets, with approximately 54,000 employees. The main focus areas are to reduce the envi-ronmental footprint, maintain high ethical standards and working conditions, as well as to have a positive impact in local communities.
Risks• Disruptions due to emissions
and discharges as a result of incidents.
• Disruptions caused by severe weather as a result of climate change.
• Impact due to social, ethical and human rights violations.
• Corruption related to weak governance.
How impacts are managed • Apply the environmental
management systems and efficiency programs.
• Ensure the best conditions for health and safety. Gover-nance systems and training to enforce sustainability policies.
• Assess the climate impact of operations.
• Support local community programs.
Ability to influence - High
Generating value Electrolux creates com-munity benefit by providing jobs, knowledge transfer and economic opportunities. Posi-tive employee relationships promote competence devel-opment, employee wellbeing and job satisfaction. Local community engagement creates good stakeholder relations, improves employee pride and enhances brand reputation.
Product developmentClose collaboration between Design, Marketing and R&D enables new products to offer best-in-class consumer experiences. The ambition is to develop solutions with leading environmental per-formance. Timely innovation is key to meeting forthcoming legal requirements and mar-ket demands. The focus is on energy, water and material efficiency, as well as chemical use in appliances.
Risks• Not meeting regulatory or
market requirements. • Not meeting consumer
expectations.
How impacts are managed • Continuously improve prod-
uct efficiency. • Increase use of recycled
materials. • Eliminate harmful materials. • Integrate future require-
ments into product develop-ment plans.
Ability to influence - High
Generating valueProducts with leading envi-ronmental performance deliver customer value in line with the business strategy, while reducing negative impact on the environment.
A value chain perspective helps Electrolux identify how it can best manage its impacts and create maximal value.
This approach makes it easier to identify opportuni-ties, minimize or enhance impacts, and understand boundaries. It also helps the company to understand how its actions and impacts are interrelated.
The following section identifies the Group’s key sustainability risks and impacts, and how they are managed. It also identifies the degree of influence along the value chain, and the value created for the company and the society.
ELECTROLUX ANNUAL REPORT 2018
96 Sustainability reporting

End-of-life
Legislation on appliance recycling is being introduced in more markets. On aver-age, materials account for approximately 7% of a prod-uct’s life-cycle impact, and Electrolux market research indicates that it is a top priority for consumers.
In Europe, the region with the most comprehen-sive producer responsibility legislation, 80% of the materi-als from collected end-of-life large appliances must be recovered.
Risks• Expectations on produc-
ers to take responsibility beyond legislation.
• Waste of resources due to a lack of recycling.
• Illegal trade of discarded products and recycled materials.
How impacts are managed • Establish more circular
business by using recycled materials.
• Eliminate harmful materi-als to enable higher quality recycled materials and decrease environmental impact.
• Promote proper recycling as part of producer’s respon-sibility.
Ability to influence - Low
Generating valueBuilding resource-efficient and closed-loop systems help reduce environmental impact and overall resource con-sumption. Innovative designs that allow material reuse saves money and energy, and increases consumer trust in the Electrolux brand.
Transport
Addressing transportation is part of a life-cycle approach to the Group’s overall impacts. Electrolux emits more CO2 transporting its goods than it emits through the total energy used in the Group operations.
Approximately 300,000 metric tons are emitted annu-ally through the distribution of goods via sea, land and air in Europe, North America and Brazil.
Risks• Emissions from transporta-
tion.• Labor conditions in logistics
companies.
How impacts are managed • Implement collaborative
solutions to mitigate logis-tics-related impacts.
• Promote efficient modes of transport.
Ability to influence - Medium
Generating valueHelping to create a more sustainable transport indus-try strengthens the Group’s brand reputation. Transport is included in the Electrolux carbon target. It also sup-ports suppliers in their work to improve their environmental and labor standards.
Sales
Electrolux sells more than 60 million products in over 150 markets every year, primarily through retailers. Energy and performance labeling, and sustainability communication allow us to raise efficiency awareness among consumers.
Risks• Failure to effectively inform
consumers on product use.• Not meeting consumer
expectations on product efficiency.
• Limited opportunity to influ-ence decision-making at the point-of-purchase.
• Corruption.
How impacts are managed • Continuously improve
product performance and efficiency.
• Improve pre- and point of purchase communication.
• Secure third party endorse-ment of products (such as best-in-test recognitions).
• Communicate on themes such as food storage, reduc-ing food waste, caring for clothes and textiles.
• Conduct Group-wide train-ings on anti-corruption.
Ability to influence - Medium
Generating valuePromoting transparency and the Group’s sustainable product offering contrib-utes to retailer sustainability goals, strengthens brands and builds customer loyalty. As sales of the Group’s Green Range demonstrate, an efficient product offering is a profitable strategy.
Consumer use
As the main environmen-tal impacts of Electrolux products occur when they are used, product energy and water efficiency is a top priority.
Greater use of connected products in the future will help improve optimal product use.
Risks• Not meeting expectations
on product performance. • Consumers not using prod-
ucts in an optimal way. • Product safety. • Data privacy for users of
connected products.
How impacts are managed • Continuously improve
product performance and efficiency.
• Prepare for increased data privacy regulation.
• Follow the product safety governance and proce-dures.
• Increase development and sales of connected products.
Ability to influence - Medium
Generating valueAppliances deliver social benefits that many take for granted – such as food pres-ervation, hygiene standards, freeing up time from house-hold chores, and facilitating equal opportunities – factors that are particularly sig-nificant in emerging markets. Providing efficient products, raising consumer awareness and increasing appliance connectivity can help counter rising global CO2 emissions, while reducing food waste and the wear of clothes.
Sustainability reporting 97
ELECTROLUX ANNUAL REPORT 2018

Sustainability reporting and informationThe Electrolux sustainability routines and systems for informa-tion and communication aim at providing key stakeholders with accurate, relevant and timely information concerning the targets and results of the Group’s sustainability framework, called For the Better.
The sustainability reporting section in the administration report has been developed to fulfill the requirements in the Swedish Annual Accounts Act. This report also highlights how the Group’s priorities reflect its commitment to the 10 principles of the UN Global Compact. Unless otherwise indicated, sustain-ability disclosures include all operations that can potentially affect Group performance for the calendar year 2018.
Sustainability information is shared regularly in the form of:• Electrolux Sustainability Report, including
-United Nations Global Compact Communication on Progress -United Nations Guiding Principles Reporting Framework
• Sustainability in Brief• Mandatory reporting regarding transparency in the
supply chain• Press releases• Meetings with key stakeholders worldwide• Questionnaires from investors and analysts• Annual submission to CDP for climate and water
Reports, policies and press releases are available at: www.electroluxgroup.com
Stockholm, February 14, 2019
AB Electrolux (publ)Board of Directors
The sustainability reporting section in the administration report has been developed to fulfill the requirements in the Swedish Annual Accounts Act. For more detailed information on Electrolux and sustainability, please read the Sustainability Report prepared based on the GRI Standards at: www.electroluxgroup.com/sustainability
Auditor’s report on the statutory sustainability reportTo the general meeting of the shareholders in AB Electrolux (publ), corporate identity number 556009-4178.Engagement and responsibilityIt is the board of directors who is responsible for the statutory sustainability report for the financial year 2018-01-01 – 2018-12-31 on pages 90-98 and that it has been prepared in accordance with the Annual Accounts Act. The scope of the auditOur examination has been conducted in accordance with FAR’s auditing standard RevR 12 The auditor’s opinion regarding the statutory sustainability report. This means that our examination of the statutory sustainability report is substantially different and less in scope than an audit conducted in accordance with International Standards on Auditing and generally accepted auditing standards in Sweden. We believe that the examination has provided us with sufficient basis for our opinion. OpinionA statutory sustainability report has been prepared.
Stockholm, February 15, 2019
Deloitte
Jan Berntsson Authorized Public Accountant
Electrolux Sustainability Report 2018
ELECTROLUX ANNUAL REPORT 2018
98 Sustainability reporting

–
www.electroluxgroup.com/sustainability
Electrolux Sustainability Report 2018
VISIT OUR REPORT

Corporate governance report 2018

Corporate governance report
The global landscape in which Electrolux operates is chang-ing. Demographic trends are increasing pressure on resources, rapid technological development requires new business approaches, and climate and resource concerns are influenc-ing decision making at all levels. Such global trends create challenges for the business but also business opportunities for driving profitable growth.
Board's focus areas during the yearThe Board sets the Group’s strategy and provides the gover-nance framework within which the CEO and the Group Manage-ment are mandated to drive the business. To be able to steer the Group and support the Group Management, the Board needs to have a firm grasp of the operational business drivers while also monitoring macro trends. In June, the Board combined visits to Electrolux sites in Italy with a two day board meeting focused on discussing the strategy and drivers for value creation. By visiting the Group’s sites the Board gets a firsthand understanding of the business which is essential when setting the strategy and evalu-ating investments and acquisitions.
An important driver for executing on our profitable growth strategy is increasing the level of modularized products in auto-mated production. Investments in this area strengthen Electrolux competitiveness through innovative offerings focusing on con-sumer experiences and at the same time increase our efficiency. During the year, investments have been a focus area for the Board as well as initiating the work to evaluate and prepare for the intended separation of our Professional Products business area from the Group, which was announced on January 31, 2019. The Board believes that Electrolux Professional has significant potential for long-term value creation as an agile stand-alone company, which can pursue growth through market consolida-tion and innovation, and that Electrolux core consumer business also stands to benefit both in terms of growth and margins from a sharpened focus on consumer experience innovation, the after-market and emerging markets. The Board expects to provide an update on the preparations and a more detailed time plan around mid-year 2019.
To support the profitable growth ambitions the Board approved several important acquisitions, such as strengthening the bever-age offering for Professional Products through the SPM Drink Systems acquisition as well as adding functional sales expertise through the Schneidereit acquisition.
A new Code of ConductDuring 2018, the Board endorsed a new Code of Conduct, which together with the Group policies, are key pillars in our global, decentralized organization. With the Code of Conduct and our other Group policies, we strengthen our corporate culture to ensure that we act consistently and with high ethical standards globally even in countries where local legislation may be weaker. Electrolux has an agile organization, with a strong corporate culture, able to swiftly take advantage of opportuni-ties while acting responsibly and sustainably.
The Corporate governance reportThis Corporate Governance Report provides more details of the overall governance structure of Electrolux, the interactions between the formal corporate bodies, internal policies and procedures as well as relevant control functions and reporting, which all combined ensure a robust global governance frame-work and strong corporate culture.
As newly elected Chairman of Electrolux, I have this first year focused on getting a deeper knowledge about the company and its markets. This has included a close and frequent dialogue with the CEO and his team during the year but also several visits to our operations in Sweden, Germany, Italy, the U.S., Brazil and Thailand. This has given me a chance to get a firsthand impres-sion and to liaise with many engaged, committed and devoted members of our organization. I am confident in our ability to create consumer and shareholder value in the years to come. To continue to stay competitive in a changing market, we are sharpening our offering, organization and business model. All together this will serve us well.
Staffan BohmanChairman of the Board
Chairman's introductionAs a leading global appliance company, Electrolux shapes living for the better by reinventing taste, care and wellbeing experiences to make life more enjoyable and sustainable for millions of people. Through the Group’s different brands, we sell more than 60 million household and professional products in more than 150 markets every year. Our large installed base of 400 million products globally gives us high aftermarket sales potential.
Corporate governance report 101
ELECTROLUX ANNUAL REPORT 2018

Governance in ElectroluxElectrolux aims at implementing strict norms and efficient gover-nance processes to ensure that all operations create long-term value for shareholders and other stakeholders. This involves the maintenance of an efficient organizational structure, systems for internal control and risk management and transparent internal and external reporting.
The Electrolux Group comprises approximately 160 compa-nies with sales in more than 150 markets. The parent company of the Group is AB Electrolux, a public Swedish limited liability com-pany. The company’s shares are listed on Nasdaq Stockholm.
The governance of Electrolux is based on the Swedish Companies Act, Nasdaq Stockholm’s rule book for issuers and the Swedish Code of Corporate Governance (the “Code”), as well as other relevant Swedish and foreign laws and regu-lations. The Code is published on the website of the Swedish Corporate Governance Board, which admini strates the Code: www.corporategovernanceboard.se
This corporate governance report has been drawn up as a part of Electrolux application of the Code. Electrolux does not report any deviations from the Code in 2018. There has been no infringement by Electrolux of applicable stock exchange rules and no breach of good practice on the securities market reported by the disciplinary committee of Nasdaq Stockholm or the Swedish Securities Council in 2018.
Below is Electrolux formal governance structure.
Major external regulations• Swedish Companies Act.• Nasdaq Stockholm’s rule book for issuers.• Swedish Code of Corporate Governance.
Major internal regulations• Articles of Association.• Board of Directors’ working procedures.• Policies for information, finance, credit, accounting manual, etc.• Processes for internal control and risk management.• Code of Conduct, Anti-Corruption Policy and Workplace Policy.
Electrolux shapes living for the better by reinventing taste, care and wellbeing experiences, making life more enjoyable and sustainable for millions of people. As a leading global appliance company, we place the consumer at the heart of everything we do. Through our brands, including Electrolux, AEG and Frigidaire, we sell more than 60 million household and professional products in more than 150 markets every year. In 2018, Electrolux had sales of SEK 124bn and employed 54,000 people around the world. For more information, go to: www.electroluxgroup.com
AB Electrolux (publ) is registered under number 556009-4178 with the Swedish Companies Registration Office. The registered office of the Board of Directors is in Stockholm, Sweden. The address of the Group headquarters is S:t Göransgatan 143, SE-105 45 Stockholm, Sweden.
GOVERNANCE STRUCTURE
Shareholders by the AGM
Nomination Committee
Board of Directors
Group Internal Audit
External Audit
Remuneration Committee
Audit Committee
Business area Boards Internal Bodies
President and GroupManagement
ELECTROLUX ANNUAL REPORT 2018
102 Corporate governance report

Highlights 2018• Election of Staffan Bohman as a new Board member and Chairman of the Board.• Election of Deloitte AB as new auditors.• Performance-based, long-term incentive program for senior management.• Continued focus on global ethics program and the implementation of a new Code of Conduct.
Shares and shareholdersThe Electrolux share is listed on Nasdaq Stockholm. At year-end 2018, Electrolux had 49,870 shareholders according to Euroclear Sweden AB and Holdings. Of the total share capital, 56% was owned by Swedish institutions and mutual funds, 38% by foreign investors and 6% by Swedish private investors, see below. Investor AB is the largest shareholder, holding 16.4% of the share capital and 28.4% of the voting rights. The ten larg-est shareholders accounted for 42.5% of the share capital and 53.1% of the voting rights in the company.
Voting rightsThe share capital of Electrolux consists of Class A shares and Class B shares. One A share entitles the holder to one vote and one B share to one-tenth of a vote. Both A shares and B shares entitle the holders to the same proportion of assets and earn-ings and carry equal rights in terms of dividends. Owners of A shares can request to convert their A shares into B shares. Con-version reduces the total number of votes in the company. As of December 31, 2018, the total number of registered shares in the company amounted to 308,920,308 shares, of which 8,192,539 were Class A shares and 300,727,769 were Class B shares. The total number of votes in the company was 38,265,316. Class B shares represented 78.6% of the voting rights and 97.3% of the share capital.
Dividend policyElectrolux target is for the dividend to correspond to at least 30% of the income for the period. For a number of years, the dividend level has been considerably higher than 30%.
The Annual General Meeting (AGM) in April 2018 decided to adopt the Board’s proposed dividend of SEK 8.30 per share for the fiscal year 2017 which, in accordance with the Board’s proposal, was paid out in two equal installments. The Board of Directors proposes a dividend for the fiscal year 2018 of SEK 8.50 per share to be paid in two equal installments, for a total divi-dend payment of approximately SEK 2,443m.
Shareholders meeting
General Meetings of shareholdersThe decision-making rights of share-holders in Electrolux are exercised at
shareholders’ meetings. The AGM of AB Electrolux is held in Stockholm, Sweden, during the first half of the year.
Extraordinary General Meetings may be held at the discretion of the Board or, if requested, by the auditors or by shareholders owning at least 10% of all shares in the company.
Participation in decision-making requires the share holder’s presence at the meeting, either personally or by proxy. In addi-tion, the shareholder must be registered in the share register by a stipulated date prior to the meeting and must provide notice of participation in the manner prescribed. Additional require-ments for participation apply to share holders with holdings in the form of American Depositary Receipts (ADR) or similar certificates. Holders of such certificates are advised to contact the ADR depositary bank, the fund manager or the issuer of the certificates in good time before the meeting in order to obtain additional information.
Individual shareholders requesting that a specific issue be included in the agenda of a shareholders’ meeting can normally request the Electrolux Board to do so. The last date for making such a request for the respective meeting will be published on the Group’s website.
Decisions at the meeting are usually taken on the basis of a simple majority. However, as regards certain issues, the Swed-ish Companies Act stipulates that proposals must be approved by shareholders representing a larger number of the votes cast and the shares represented at the meeting.
Annual General Meeting 2018The 2018 AGM was held at the Stockholm Waterfront Congress Centre in Stockholm, Sweden, on April 5, 2018. 1,129 shareholders representing a total of 47.1% of the share capital and 60.3% of the votes were represented at the AGM. The President’s speech was broadcasted live via the Group’s website and is also available on www.electroluxgroup.com/corporate-governance, together with the minutes. The meeting was held in Swedish, with simultane-ous interpretation into English. All Board members, as well as the Group’s auditor in charge, were present at the meeting.
OWNERSHIP STRUCTURE
Swedish institutions and mutual funds, 56%Foreign investors, 38%Swedish private investors, 6%
ATTENDANCE AT AGMS 2014–2018
%
0
15
30
45
60
75
1817161514
% of votes% of share capital
Shareholders
200
400
600
800
1,000
1,200
ATTENDANCE
The foreign ownership has decreased to 38% at year-end 2018 from 51% at year-end 2017. Foreign investors are not always recorded in the share register. Foreign banks and other custodians may be registered for one or several customers’ shares, and the actual owners are then usually not displayed in the register. For additional information regarding the ownership structure, see above. The information on ownership structure is updated quarterly on the Group’s website: www.electroluxgroup.com/corporate-governance
1,129 shareholders representing a total of 47.1% of the share capital and 60.3% of the votes were present at the 2018 AGM.
Source: Euroclear Sweden and Holdings as per December 31, 2018.
Corporate governance report 103
ELECTROLUX ANNUAL REPORT 2018

Decisions at the Annual General Meeting 2018 included: • Dividend payment of SEK 8.30 per share for fiscal year
2017 to be paid out in two equal installments of SEK 4.15 per share.
• Election of Staffan Bohman as new Board member and re-election of the Board members Petra Heden-gran, Hasse Johansson, Ulla Litzén, Bert Nordberg, Fredrik Persson, David Porter, Jonas Samuelson, Ulrika Saxon and Kai Wärn.
• Election of Staffan Bohman as Chairman of the Board, replacing Ronnie Leten who had declined re-election.
• Change of the company's Articles of Association.• Election of Deloitte AB as new auditors.• Remuneration to the Board members. • Approval of remuneration guidelines for Electrolux
Group Management. • Performance-based, long-term incentive program for
2018 covering up to 350 managers and key employees. • Authorization to acquire own shares and to transfer
own shares on account of company acquisitions and to cover costs that may arise as a result of the share pro-gram for 2016.
Annual General Meeting 2019The next AGM of AB Electrolux will be held on Wednesday, April 10, 2019, at Stockholm Waterfront Congress Centre in Stockholm, Sweden. For additional information on the next AGM and how to register attendance, see page 120.
Nomination Committee
Nomination CommitteeThe AGM resolves upon the nomination process for the Board of Directors and the
auditors. The AGM 2011 adopted an instruction for the Nomina-tion Committee which applies until further notice. The instruc-tion involves a process for the appointment of a Nomination Committee comprised of six members. The members should be one representative of each of the four largest shareholders, in terms of voting rights that wish to participate in the Committee, together with the Chairman of the Electrolux Board and one additional Board member.
The composition of the Nomination Committee shall be based on shareholder statistics from Euroclear Sweden AB as of the last banking day in August in the year prior to the AGM and on other reliable shareholder information which is provided to the company at such time. The names of the representatives and the names of the shareholders they represent shall be announced as soon as they have been appointed. If the shareholder structure changes during the nomination process, the composition of the Nomination Committee may be adjusted accordingly.
The Nomination Committee is assisted in preparing proposals for auditors by the company’s Audit Committee and
the Nomination Committee’s proposal is to include the Audit Committee’s recommendation on the election of auditors.
The Nomination Committee’s proposals are publicly announced no later than on the date of notification of the AGM. Shareholders may submit proposals for nominees to the Nomination Committee.
Nomination Committee for the AGM 2018The Nomination Committee for the AGM 2018 was comprised of six members. Johan Forssell of Investor AB led the Nomination Committee’s work.
For the proposal for the AGM 2018, the Nomination Committee made an assessment of the composition and size of the current Board as well as the Electrolux Group’s operations. Areas of particular interest were Electrolux strategies and goals and the demands on the Board that are expected from the Group’s positioning for the future. The Nomination Committee applied rule 4.1 of the Code as diversity policy in its nomination work. The Nomination Committee considered that a breadth and variety as regards age, nationality, educational back-ground, gender, experience, competence and term of office is represented among the Board members.
The Chairman of the Board, Ronnie Leten, had declined re-election and the Nomination Committee proposed Staffan Bohman as new Board member and as Chairman of the Board. After the election at the AGM 2018, three out of nine Board members elected at the shareholders’ meeting are women (in this calculation, the President has not been included in the total number of Board members).
The Nomination Committee also proposed, in accordance with the recommendation by the Audit Committee, election of Deloitte AB as the company’s new auditors for the period until the end of the AGM 2019.
A report regarding the work of the Nomination Committee was included in the Nomination Committee’s explanatory state-ment that was published before the AGM 2018. Further informa-tion regarding the Nomination Committee and its work can be found on the Group’s website: www.electroluxgroup.com/corporate-governance
Nomination Committee for the AGM 2019The Nomination Committee for the AGM 2019 is based on the owner ship structure as of August 31, 2018, and was announced in a press release on September 26, 2018.
The Nomination Committee’s members are:• Johan Forssell, Investor AB, Chairman• Kaj Thorén, Alecta• Marianne Nilsson, Swedbank Robur Funds • Carine Smith Ihenacho, Norges Bank Investment Management• Staffan Bohman, Chairman of Electrolux• Fredrik Persson, Board member of Electrolux
The AGM resolves upon:• The adoption of the Annual Report.• Dividend.• Election of Board members and, if applicable, auditors.• Remuneration to Board members and auditors.• Guidelines for remuneration to Group Management.• Other important matters.
The Nomination Committee’s tasks include preparing a proposal for the next AGM regarding:• Chairman of the AGM.• Board members.• Chairman of the Board.• Remuneration to Board members.• Remuneration for committee work.• Amendments of instructions for the Nomination Committee,
if deemed necessary.• Auditors and auditors’ fees, when these matters are to be decided
by the following AGM.
ELECTROLUX ANNUAL REPORT 2018
104 Corporate governance report

Board of Directors
The Board of DirectorsThe Board of Directors has the overall responsibility for Electrolux organization and administration.
Composition of the BoardThe Electrolux Board is comprised of ten members without deputies, who are elected by the AGM, and three members with deputies, who are appointed by the Swedish employee organi-zations in accordance with Swedish labor law.
The AGM elects the Chairman of the Board. Directly after the AGM, the Board holds a meeting for formal constitution at which the members of the committees of the Board are elected, among other things. The Chairman of the Board of Electrolux is Staffan Bohman.
All current members of the Board, except for the President, are non-executive members. One of the ten Board members, who are elected by the AGM, is not a Swedish citizen.For additional information regarding the Board of Directors, see pages 112–113. The information is updated regularly at the Group’s website: www.electroluxgroup.com
IndependenceThe Board is considered to be in compliance with relevant requirements for independence. The assessment of each Board member’s independence is presented in the table on page 113.
All Directors except for Petra Hedengran and Jonas Samuelson have been considered independent. Petra Heden-gran has been considered independent in relation to the com-pany and the administration of the company, but not in relation to major shareholders of Electrolux. Jonas Samuelson has been considered independent in relation to major shareholders of Electrolux but not, in his capacity as President and CEO, in rela-tion to the company and the administration of the company.
Jonas Samuelson has no major shareholdings, nor is he a part-owner in companies having significant business relations with Electrolux. Jonas Samuelson is the only member of Group Management with a seat on the Board.
The Board’s tasksOne of the main tasks of the Board is to manage the Group’s operations in such a manner as to assure the owners that their interests in terms of a long-term profitable growth and value creation are being met in the best possible manner. The Board’s work is governed by rules and regulations including the Swedish Companies Act, the Articles of Association, the Code and the working procedures established by the Board. The Articles of Association of Electrolux are available on the Group’s website: www.electroluxgroup.com/corporate-governance
Working procedures and Board meetingsThe Board determines its working procedures each year and reviews these procedures as required. The working procedures describe the Chairman’s specific role and tasks, as well as the responsibilities delegated to the committees appointed by the Board.
In accordance with the procedures and the Code, the Chairman shall among other things:• Organize and distribute the Board’s work.• Ensure that the Board discharges its duties and has relevant
knowledge of the company.• Secure the efficient functioning of the Board.• Ensure that the Board’s decisions are implemented efficiently.• Ensure that the Board evaluates its work annually.
The working procedures for the Board also include detailed instructions to the President and other corporate functions regarding issues requiring the Board’s approval. Among other things, these instructions specify the maximum amounts that various decision-making functions within the Group are author-ized to approve as regards credit limits, capital expenditure and other expenditure.
The working procedures stipulate that the meeting for the formal constitution of the Board shall be held directly after the AGM. Decisions at this statutory meeting include the election of members of the committees of the Board and authorization to sign on behalf of the company. In addition to the statutory Board meeting, the Board normally holds seven other ordinary meetings during the year. Four of these meetings are held in conjunction with the publication of the Group’s full-year report and interim reports. One or two meetings are held in connection with visits to Group operations. Additional meetings, including telephone conferences, are held when necessary.
The Board’s work in 2018During the year, the Board held eight meetings. All meetings except one were held in Stockholm, Sweden. The attendance of each Board member at these meetings is shown in the table on page 113.
All Board meetings during the year followed an agenda, which, together with the documentation for each item on the agenda, was sent to Board members in advance of the meet-ings. Meetings usually last for half a day or one entire day in order to allow time for presentations and discussions. Electrolux General Counsel serves as secretary at the Board meetings.
Each scheduled Board meeting includes a review of the Group’s results and financial position, as well as the outlook for the forthcoming quarters, as presented by the President. The meetings also deal with investments and the establishment of new operations, as well as acquisitions and divestments. The Board decides on all investments exceeding SEK 100m and receives reports on all investments exceeding SEK 25m.
Normally, the head of a business area also reviews a current strategic issue at the meeting. For an overview of how the Board’s work is spread over the year, see the table on pages 106–107.
The Board deals with and decides on Group-related issues such as:• Main goals.• Strategic orientation.• Essential issues related to financing, investments, acquisitions and
divestments.• Follow-up and control of operations, communication and organiza tion,
including evaluation of the Group’s operational management.• Appointment of and, if necessary, dismissal of the President.• Overall responsibility for establishing an effective system of internal
control and risk management as well as a satisfactory process for monitoring the company’s compliance with relevant laws and other regulations as well as internal policies.
Remuneration to the Board of Directors 2016–2018(applicable as from the respective AGM)SEK 2018 2017 2016
Chairman of the Board 2,150,000 2,075,000 2,030,000Board member 600,000 580,000 560,000Chairman of the Audit Committee 260,000 250,000 250,000Member of the Audit Committee 140,000 120,000 95,000
Chairman of the Remuneration Committee 125,000 125,000 120,000Member of the Remuneration Committee 75,000 75,000 60,000
Corporate governance report 105
ELECTROLUX ANNUAL REPORT 2018

Ensuring quality in financial reportingThe working procedures determined annually by the Board include detailed instructions on the type of financial reports and similar information which are to be submitted to the Board. In addition to the full-year report, interim reports and the annual report, the Board reviews and evaluates comprehensive finan-cial information regarding the Group as a whole and the entities within the Group.
The Board also reviews, primarily through the Board’s Audit Committee, the most important accounting principles applied by the Group in financial reporting, as well as major changes in these principles. The tasks of the Audit Committee also include reviewing reports regarding internal control and financial reporting processes, as well as internal audit reports submitted by the Group’s internal audit function, Group Internal Audit.
The Group’s external auditors report to the Board as necessary, but at least once a year. A minimum of one such meeting is held without the presence of the President or any
other member of Group Management. The external auditors also attend the meetings of the Audit Committee.
The Audit Committee reports to the Board after each of its meetings. Minutes are taken at all meetings and are made available to all Board members and to the auditors.
Board work evaluationThe Board evaluates its work annually with regard to working procedures and the working climate, as well as regards the focus of the Board work. This evaluation also focuses on access to and requirements of special competence in the Board. The evaluation is a tool for the development of the Board work and also serves as input for the Nomination Committee’s work. The evaluation of the Board is each year initiated and lead by the Chairman of the Board. The evaluation of the Chairman is led by one of the other members of the Board. Evaluation tools include questionnaires and discussions.
In 2018, Board members responded to written question-naires. As part of the evaluation process, the Chairman also had individual discussions with Board members. The evaluations were discussed at a Board meeting.
The result of the evaluations was presented for the Nomination Committee.
Fees to Board members Fees to Board members is determined by the AGM and dis-tributed to the Board members who are not employed by Electrolux. The fees to the Chairman and the Board members was revised during 2018, see page 105.
The Nomination Committee has recommended that Board members appointed by the AGM acquire Electrolux shares and that these are maintained as long as they are part of the Board. A shareholding of a Board member should after five years correspond to the value of one gross annual fee.
Board members who are not employed by Electrolux are not invited to participate in the Group’s long-term incentive programs for senior managers and key employees. For additional information on remuneration to Board members, see Note 27.
OVERVIEW OF VARIOUS ITEMS ON THE BOARD’S AGENDA AND COMMITTEE MEETINGS 2018
Each scheduled Board meeting included a review of the Group’s results and financial position, as well as the outlook for the forthcoming quarters.
Ordinary Board meetings • • • • • • • •Audit Committee • • • • • • •Remuneration Committee • • • •
Jan Feb March Apr May June July Aug Sep Oct Nov Dec
• Q4, Consolidated results.• Report by external auditors.• Dividend.• Proposals for the AGM.
Statutory Board meeting:• Appointment of committee members.• Signatory powers.
• Q1 Quarterly financial statements.
Key focus areas for the Board during 2018• Dividend payment for the fiscal year 2017.• Adapting Electrolux strategy and business model to
global industry drivers such as digitalization, consolida-tion, increased consumer power, sustainability and a growing middle class.
• Initiating the work to evaluate and prepare for a poten-tial separation of Professional Products business area from the Group.
• Investments in manufacturing for increased cost effi-ciency, through automation and digitalization, mainly in North America and Latin America.
• Acquisitions to broaden Electrolux offering: — Schneidereit GmbH, a supplier of professional
laundry rental solutions in Germany and Austria. — SPM Drink Systems, an Italian based manufac-
turer of professional dispensers for beverages and ice-cream.
• Divestment of the U.S. commercial and central vacuum cleaner businesses in North America.
ELECTROLUX ANNUAL REPORT 2018
106 Corporate governance report

Ordinary Board meetings • • • • • • • •Audit Committee • • • • • • •Remuneration Committee • • • •
Jan Feb March Apr May June July Aug Sep Oct Nov Dec
Remuneration Committee
Audit Committee
Committees of the BoardThe Board has established a Remunera-tion Committee and an Audit Committee. The major tasks of these committees are
preparatory and advisory, but the Board may delegate deci-sion-making powers on specific issues to the committees. The issues considered at committee meetings shall be recorded in minutes of the meetings and reported at the following Board meeting. The members and Chairmen of the committees are appointed at the statutory Board meeting following election of Board members.
The Board has also determined that issues may be referred to ad hoc committees dealing with specific matters.
Remuneration Committee One of the Remuneration Committee’s primary tasks is to propose guidelines for the remuneration to the members of Group Management. The Committee also proposes changes in remuneration to the President, for resolution by the Board, and reviews and resolves on changes in remuneration to other mem-bers of Group Management on proposal by the President.
The Committee has as from the AGM 2018 consisted of the following three Board members: Petra Hedengran (Chairman), Staffan Bohman and Ulrika Saxon. At least two meetings are convened annually. Additional meetings are held as needed.
In 2018, the Remuneration Committee held four meetings. The attendance of each Board member at these meetings is shown in the table on page 113. Significant issues addressed include resolution on remuneration to new members of
Group Management, review and resolution on changes in the remuneration to members of Group Management, follow-up and evaluation of previously approved long-term incentive programs and remuneration guidelines for Group Management and general review and preparation of long-term incentive program and remuneration guidelines for Group Management for 2019. The Head of Human Resources and Organizational Development participated in the meetings and was responsible for meeting preparations.
Audit CommitteeThe main task of the Audit Committee is to oversee the processes of Electrolux financial reporting and internal control in order to secure the quality of the Group’s external reporting. The Audit Committee is also tasked with supporting the Nomination Committee with proposals when electing external auditors.
The Audit Committee has as from the AGM 2018 consisted of the following four Board members: Ulla Litzén (Chairman), Staffan Bohman, Petra Hedengran and Fredrik Persson. The external auditors report to the Committee at each ordinary meeting. At least three meetings are held annually. Additional meetings are held as needed.
In 2018, the Audit Committee held seven meetings. The attendance of each Board member at these meetings is shown in the table on page 113. Electrolux managers have also had regular contacts with the Committee Chairman between meet-ings regarding specific issues. The Group’s Chief Financial Officer and the Head of Group Internal Audit have participated in the Audit Committee meetings.
• Visit to one of the Group’s operations.
• Rules of procedure of the Board.
• Q2 Quarterly financial statements.
• Q3 Quarterly financial statements.
• Board work evaluation.
The Remuneration Committee’s tasks include for example:• To prepare and evaluate remuneration guidelines for Group
Management.• To prepare and evaluate targets and principles for variable
compensation.• To prepare terms for pensions, notices of termination and severance
pay as well as other benefits for Group Management. • To prepare and evaluate Electrolux long-term incentive programs.
The Audit Committee’s tasks include for example:• To review the financial reporting.• To monitor the effectiveness of the internal control, including risk
management, concerning the financial reporting.• To follow up the activities of the Group Internal Audit as regards to
organization, recruiting, budgets, plans, results and audit reports.• To review (and from December, 2018 approve) certain credit limits.• To keep informed of the external audit and the quality control
performed by the Supervisory Board of Public Accountants and to evaluate the work of the external auditors.
• To inform the Board of the outcome of the external audit and explain how the audit contributed to the reliability of the financial reporting as well as the role of the Committee in this process.
• To review, and when appropriate, preapprove the external auditors’ engagements in other tasks than audit services.
• To evaluate the objectivity and independence of the external auditors.• To support the Nomination Committee with proposals when electing
external auditors.
Corporate governance report 107
ELECTROLUX ANNUAL REPORT 2018

External AuditExternal auditorsThe AGM in 2018 elected Deloitte AB (Deloitte) as the Group’s new external
auditors for one year, until the AGM in 2019. The election of Deloitte was preceded by a thorough procurement process and recommendation by the Audit Committee. Authorized Public Accountant Jan Berntsson is the auditor in charge of Electrolux.
Deloitte provides an audit opinion regarding AB Electrolux, the financial statements of its subsidiaries, the consolidated financial statements for the Electrolux Group and the adminis-tration of AB Electrolux. The auditors also conduct a review of the report for the second quarter.
The audit is conducted in accordance with the Swedish Companies Act, International Standards on Auditing (ISA) and generally accepted auditing standards in Sweden.
Audits of local statutory financial statements for legal entities outside of Sweden are performed as required by law or applica-ble regulations in the respective countries, including issuance of audit opinions for the various legal entities.
At the 2018 Annual General Meeting Deloitte was appointed auditors for the period until the 2019 Annual General Meeting. PricewaterhouseCoopers (PwC) was appointed auditors for the period until the 2018 Annual General Meeting.
2018 2017 2016
DeloitteAudit fees 42 — —Audit-related fees 1 — —Tax fees 1 — —All other fees 1 — —Total fees to Deloitte 45 — —PwCAudit fees 4 41 40Audit-related fees 1 2 1Tax fees — 1 4All other fees 1 10 4Total fees to PwC 6 54 49Audit fees to other audit firms — 2 —Total fees to auditors 51 56 49
For details regarding fees paid to the auditors and their non-audit assignments in the Group, see Note 28.
Internal AuditGroup Internal AuditThe internal audit function is responsible for independent, objective assurance, in
order to systematically evaluate and propose improvements for more effective governance, internal control and risk manage-ment processes.
The process of internal control and risk management has been developed to provide reasonable assurance that the Group’s goals are met in terms of efficient operations, compli-ance with relevant laws and regulations and reliable financial reporting.
Internal audit assignments are conducted according to a risk based plan developed annually and approved by the Audit Committee. The audit plan is derived from an independent risk assessment conducted by Group Internal Audit to identify and evaluate risks associated with the execution of the company strategy, operations, and processes. The plan is designed to address the most significant risks identified within the Group and its business areas. The audits are executed using a methodology for evaluating the design and effectiveness of internal controls to ensure that risks are adequately addressed and processes are operated efficiently.
Opportunities for improving the efficiency in the governance and internal control and risk management processes identified in the internal audits are reported to responsible business area management for action. A summary of audit results is provided to the Audit Board and the Audit Committee, as is the status of management’s implementation of agreed actions to address findings identified in the audits. For additional information on internal control, see pages 116–117. For additional information on risk management, see Note 1, Note 2 and Note 18.
ELECTROLUX ANNUAL REPORT 2018
108 Corporate governance report

Company Management of
Electrolux
Electrolux – a global leader with a purpose to shape living for the better Electrolux has a strategic framework that connects a consumer experience focused
business model with a clear company purpose – Shape living for the better. To achieve the purpose and drive profitable growth, Electrolux uses a business model which focuses on creating outstanding consumer experiences. By creating desirable solu-tions and great experiences that enrich peoples’ daily lives and the health of the planet, Electrolux wants to be a driving force in defining enjoyable and sustainable living. Focus is to invest in innovations that are most relevant for creating the outstanding consumer experience to make great tasting food, the best care for clothes and to increase wellbeing in the home.
Targeted growth and optimization of the product portfo-lio to the most profitable product categories and products with distinct consumer benefits, will strengthen the presence of Electrolux in the product categories and channels where the Group is most competitive. In addition to organic growth, Electrolux sees a potential to grow through acquisitions. This is supported by a strong foundation of Operational Excellence and Talent, Teamship and Continuous Improvement, as well as three important transformational drivers; Emerging markets acceleration, Digital transformation and Sustainable develop-ment. Electrolux objective is to grow with consistent profitability, see the financial targets below.
A sustainable businessSustainability leadership is crucial to realizing the Electrolux strategy for long-term profitable growth. In 2018, Electrolux most resource-efficient products represented 21% of products sold and 29% of gross profit.
The company takes a consistent approach to sustain ability in the countries where Electrolux operates. Understanding and engaging in challenges such as climate change, creating ethi-cal and safe workplaces, and adopting a responsible approach to sourcing and restructuring are important for realizing the business strategy.
In 2018, Electrolux further developed its Ethics Program and established a new Code of Conduct, setting out the framework of how Electrolux shall conduct its operations in ethical and sustain-able ways. The Code of Conduct, which has been endorsed by the Board, serves as an introduction to the Group Policies, and its purpose is to increase the clarity on what the company's principles mean for the employees. An educational campaign for employ-ees has been prepared with a planned rollout during 2019.
The Ethics Program also encompasses a global whistleblow-ing system – the Ethics Helpline – through which employees can report suspected misconduct in local languages. Reports may be submitted anonymously if legally permitted. The highest num-ber of reports in 2018 related to discrimination and harassment, such as the use of abusive language or disrespectful behavior.
In line with the UN Guiding Principles on Business and Human Rights, Electrolux conducts human rights risk assessments at
both global and local levels since 2016. The methodology for the assessments focuses on identifying the risk of harming people, as a direct or indirect result of Electrolux operations, and includes corruption risks as well as opportunities to increase local positive impacts. In 2018, a local assessment was con-ducted of the company's operations in Ukraine
In 2018, Electrolux maintained the position as industry leader in the Household Durables category in the Dow Jones Sustain-ability World Index. RobecoSAM publishes the Dow Jones Sustainability Indices (DJSI), which evaluate the performance of the world’s leading companies in sustainability – from each industry on a global and regional level, respectively. The evalu-ation is based on criteria such as corporate governance, risk management, branding, climate change mitigation, supply chain standards and labor practices.
Read more about Electrolux sustainability work: www.electroluxgroup.com/sustainability
Electrolux as a tax payer One important aspect of Electrolux company purpose – Shape living for the better – is to act as a good corporate citizen and taxpayer wherever Electrolux operates.
Electrolux plays an important role in contributing to public finances in all jurisdictions where the Group operates. The Group has approximately 54,000 employees operating in more than 58 countries and has about 50 manufacturing facilities across five continents.
Of Electrolux total tax contribution, as defined in the below chart, corporate tax represented approximately13% in 2018. Corporate income taxes are only a portion of the Group’s total contribution to public finances in Electrolux markets. In addition to corporate income taxes, Electrolux pays indirect taxes, customs duties, property taxes, employee related taxes, environmental charges and a number of other direct or indi-rect contributions to governments. The total contribution to public finances for 2018 amounted to approximately SEK 8.0bn whereof approximately half related to emerging markets.
Electrolux most transparent contribution to public finances around the world is corporate income taxes, see Note 10. Corporate income taxes amounted to SEK 1,081m in 2018, representing a global effective tax rate of the Group of 22.1%. Approximately 40% of the total corporate income taxes in 2018 related to the Group’s activities in emerging markets.
For more information on Electrolux tax policy, see: www.electroluxgroup.com
Financial targets over a business cycleThe financial goals set by Electrolux aim to strengthen the Group’s leading, global position in the industry and assist in generating a healthy total yield for Electrolux shareholders. The objective is growth with improved profitability.
• Sales growth of at least 4% annually. • Operating margin of at least 6%. • Capital turnover-rate of at least 4.• Return on net assets >20%.
Employer tax & fees, 39 %Corporate tax, 13%Property tax, 2 %Customs, 18%Indirect tax, 24 %Environmental tax & fees, 4%
ELECTROLUX TOTAL TAXES 2018
Emerging Markets Acceleration
Sustainable Development
Branded Star Products
with Preferred Partners
Engaging Ownership& Quality
Experience
Taste, Care & Wellbeing Innovation
Outstanding Consumer
Experiences
Digital Transformation
Talent, Teamship & Continuous Improvement
Operational Excellence
Corporate governance report 109
ELECTROLUX ANNUAL REPORT 2018

Risk assessmentElectrolux monitors and minimizes key risks in a structured and proactive manner. In general, there are two types of risks: Strate-gic risks and manageable business risks. The strategic risks are related to the Group’s strategy and are impacted by the external environment. The business risks comprise of operational and financial risks which are managed by the Group’s operational units and Group Treasury, respectively.
Electrolux ability to increase profitability and shareholder value is largely dependent on its success in developing innova-tive products and create outstanding consumer experiences under strong brands while maintaining cost- efficient operations. Realizing this potential requires effective and controlled enter-prise risk management.
Macroeconomic trends, changes in industry dynamics and political risks are factors that impact the appliance industry and the markets in which Electrolux operates. To manage exter-nal risks and opportunities, Electrolux puts close attention to understanding the economic and political development in its key markets and pro-actively manage and adapt operations. External risks include, variations in demand, price competition and changes in prices for raw materials. Changing industry dynamics such as digitalization, consolidation and sustainability are other examples. In addition, the Group is exposed to risks related to financial operations, e.g., interest risks, financing risks, currency risks and credit risks.
Risk exposures are managed by internal bodies, see chart below, and business area boards.
The purpose of the internal audit function, Group Internal Audit, is to provide reasonable assurance that the Group’s goals are met in terms of efficient operations, compliance with rele-vant laws and regulations and reliable financial reporting, see pages 116–117.
Management and company structureElectrolux aims at implementing strict norms and efficient pro-cesses to ensure that all operations create long-term value for shareholders and other stakeholders. This involves the mainten-ance of an efficient organizational structure, systems for inter-nal control and enterprise risk management and transparent internal and external reporting.
The Group has a decentralized corporate structure in which the overall management of operational activities is largely per-formed by the business area boards.
Electrolux operations have during 2018 been organized into six business areas. Within Major Appliances, the business areas are geographically defined, while the business areas Home Care & SDA and Professional Products are global. On August 16, 2018 it was announced that with effect from January 1, 2019, the Major Appliances organization in Middle East and Africa (MEA), which then was part of Major Appliances Europe, Middle East and Africa (EMEA), will be included in Major Appliances Asia Pacific (APAC). On February 1, 2019, it was announced that the Home
Care & SDA business area will be combined with the four current major appliances business areas with immediate effect.During 2018 six group staff units have supported the business areas: Finance, Legal Affairs, Human Resources and Orga-nizational Development, Marketing and Branding, Global Operations and Communications. As from February 1, 2019, the following group staff functions are being implemented: Finance, Legal Affairs, HR & Communications, Global Operations and Global Consumer Experience organization. The Global Consumer Experience organization is globally responsible for areas such as marketing, design, product lines, digital con-sumer solutions and ownership experience.
There are also a number of internal bodies which are forums that are preparatory and decision-making in their respective areas, see chart below. Each body includes representatives from concerned functions.
In order to fully take advantage of the Group’s global pres-ence and economies of scale, the Group has established Global Operations with the responsibility for product development, purchasing, manufacturing, design and quality.
President and Group
Management
President and Group ManagementGroup Management currently includes the President, the five business area heads and five group staff heads. The President
is appointed by and receives instructions from the Board. The President, in turn, appoints other members of Group Management and is respon sible for the ongoing management of the Group in accordance with the Board’s guidelines and instructions. Group Management holds monthly meetings to review the previous month’s results, to update forecasts and plans and to discuss strategic issues.
A diversified management teamThe Electrolux management team, with its extensive expertise, diverse cultural backgrounds and experiences from various markets in the world, forms an excellent platform for pursuing profitable growth in accordance with the Group’s strategy. Electrolux Group Management represents seven different nationalities. Most of them have previous experience of predominantly multinational consumer goods companies.
In recent years, a number of major initiatives have been launched aimed at better leveraging the unique, global position of Electrolux. In several areas, global and cross-border orga-nizations have been established to, for example, increase the pace of innovation in product development, reduce complexity in manufacturing and optimize purchasing.
Changes in Group ManagementThe following changes in the Group management were made with effect from October 1, 2018.
Dan Arler, previous Head of Major Appliances Europe, Middle East and Africa (EMEA) and Executive Vice President of AB Electrolux, was appointed Head of Major Appliances APAC
INTERNAL BODIES
Internal bodies
President and GroupManagement
Tax Board Sourcing BoardPension Board Audit Board
Disclosure Committee
Ethics & Human Rights Steering Group
Enterprise Risk Management Board
Insider Committee
ELECTROLUX ANNUAL REPORT 2018
110 Corporate governance report

& MEA and Executive Vice President of AB Electrolux; replacing Kenneth L. Ng, who had decided to retire from the company.
Anna Ohlsson-Leijon, previous Chief Financial Officer (CFO) of AB Electrolux, was appointed Head of Major Appliances Europe and Executive Vice President of AB Electrolux.
Therese Friberg, previous CFO of Major Appliances EMEA, was appointed new CFO of AB Electrolux.
The following changes in the Group management have been announced with effect from February 1, 2019.
Ola Nilsson, previous Head of Home Care & SDA, was appointed Group Chief Experience Officer (CXO) and Executive Vice President of AB Electrolux, and as a consequence of the new organizational structure, the Chief Marketing Officer Lars Hygrell is no longer member of Group Management. Jan Brockmann, Chief Operations Officer was also appointed as Executive Vice President of AB Electrolux.
For details regarding members of Group Management, see pages 114–115 The information is updated regularly at the Group’s website: www.electroluxgroup.com
Key focus areas for the President and Group Management in 2018• Appointment of new Group Management members.• Focus on taste, care and wellbeing innovation areas
to provide outstanding consumer experiences.• Program to improve quality and the ownership
experience for consumers. • Product portfolio management to focus on star products
for profitable growth.• Continues improvement to achieve a competitive cost
structure. • Modularization, automation and digitalization within
manufacturing. • Actions to mitigate increased costs for raw material,
trade tariffs in North America and currency headwinds, particularly in Latin America.
• Increased investments in manufacturing for further growth and cost efficiency mainly in North America and Latin America.
• Digitalization such as connected appliances and digital commerce.
• Acquisitions to broaden Electrolux offering: — Schneidereit GmbH, a supplier of professional
laundry rental solutions in Germany and Austria.— SPS Drink Systems, an Italian based manufacturer
of professional dispensers for beverages and ice-cream.
• Divestment of the U.S. commercial and central vacuum cleaner businesses in North America.
Business Area Boards
Business areasThe business area heads are also mem-bers of Group Management and have
responsibility for the operating income and net assets of their respective business area.
The overall management of the business areas is the respon-sibility of business area boards, which meet quarterly. The Presi-dent is the chairman of all such boards. The business area board meetings are attended by the President, the management of the respective business area and the group staff heads. The business area boards are responsible for monitoring on-going operations, establishing strategies, determining business area budgets and making decisions on major investments.
RemunerationRemuneration to Group Management Remuneration guidelines for Group
Management are resolved upon by the AGM, based on the proposal from the Board. Remuneration to the President is then resolved upon by the Board, based on proposals from the Remuneration Committee. Changes in the remuneration to other members of Group Management is resolved upon by the Remuneration Committee, based on proposals from the President, and reported to the Board.
Electrolux shall strive to offer total remuneration that is fair and competitive in relation to the country of employment or region of each Group Management member. The remuneration terms shall emphasize “pay for performance”, and vary with the performance of the individual and the Group.
Remuneration may comprise of:• Fixed compensation. • Variable compensation.• Other benefits such as pension and insurance.
Following the “pay for performance” principle, variable compen-sation shall represent a significant portion of the total compen-sation opportunity for Group Management. Variable compensa-tion shall always be measured against pre-defined targets and have a maximum above which no pay-out shall be made. The targets shall principally relate to financial performance.
Each year, the Board of Directors will evaluate whether or not a long-term incentive program shall be proposed to the AGM. The AGM 2018 decided on a long-term share program for up to 350 senior managers and key employees.For additional information on remuneration, remuneration guidelines, long-term incentive programs and pension benefits, see Note 27.
Start
Performance period
1 2 3
Invitations to participants in the program.
Performance shares allotted.
Year
TIME-LINE FOR THE LONG-TERM INCENTIVE PROGRAM FOR SENIOR MANAGEMENT 2018
The calculation of the number of per-formance shares, if any, is connected to three performance targets for the Group established by the Board; (i) earnings per share (ii) return on net assets, and (iii) adjusted organic sales growth, for the 2018 financial year. Allotment of perfor-mance shares, if any, to the participants will be made in 2021.
2018 2019 2020 2021
Corporate governance report 111
ELECTROLUX ANNUAL REPORT 2018

Board of Directors and Auditors
STAFFAN BOHMANChairman
Born 1949. Sweden. B.Sc. Econ. Elected 2018. Member of the Electrolux Audit Committee and the Electrolux Remuneration Committee.
Other assignments: Chairman of the Board of Ipco AB, Upplands Motor Holding AB and the German-Swedish Chamber of Commerce. Board member of Atlas Copco AB and the Royal Swedish Academy of Engineering Sciences (IVA).
Previous positions: President and CEO of Sapa and DeLaval as well as Board Member of, inter alia., Scania AB, Inter-IKEA Holding NV and Rezidor Hotel Group AB.
Holdings in AB Electrolux: 50,000 B-shares.
JONAS SAMUELSON President and CEO
Born 1968. Sweden. M.Sc. Econ. Elected 2016.
Other assignments: Board Member of Polygon AB and Axel Johnson AB.
Previous positions: Various senior positions within Electrolux including CFO of AB Electrolux, COO Global Operations Major Appliances and Head of Major Appliances EMEA. Chief Financial Officer and Executive Vice President of Munters AB. Various posi-tions within General Motors, mainly in the U.S., and Saab Automobile AB.
Holdings in AB Electrolux: 32,070 B-shares.
PETRA HEDENGRANBorn 1964. Sweden. M. of Laws. Elected 2014. Chairman of the Electrolux Remuneration Committee and member of the Electrolux Audit Committee.
Other assignments: General Counsel and member of Group Management of Investor AB. Board Member of Alecta and the Association for Generally Accepted Principles in the Securities Market (Sw. Föreningen för god sed på värdepappersmarknaden).
Previous positions: Attorney and partner at Advokatfirman Lindahl. Various positions within the ABB Financial Services including General Counsel of ABB Financial Services, Nordic Region. Law Clerk with the Stockholm District Court. Associate at Gunnar Lindhs Advokatbyrå.
Holdings in AB Electrolux: 9,000 B-shares.
ULLA LITZÉN Born 1956. Sweden. B.Sc. Econ. and M.B.A. Elected 2016. Chairman of the Electrolux Audit Committee.
Other assignments: Board Member of Epiroc AB, Husqvarna AB, NCC AB and Ratos AB.
Previous positions: President of W Capital Management AB, wholly-owned by the Wallenberg Foundations. Various leading positions within the Investor Group including Managing Director and member of Group Management of Investor AB.
Holdings in AB Electrolux: 4,000 B-shares.
HASSE JOHANSSONBorn 1949. Sweden. M.Sc. in Electrical Engineering. Elected 2008.
Other assignments: Chairman of the Board of Dynamate Industrial Services AB and Uniter AB. Board Member of Autoliv Inc., PowerCell Sweden AB, Skyllbergs Bruk AB, CalixKlippan Group AB, DevPort AB and SEM Electromagnet Holding AB.
Previous positions: Executive Vice President and Head of R&D of Scania CV AB. Founder of Mecel AB (part of Delphi Corporation). Various senior management positions within Delphi Corporation.
Holdings in AB Electrolux: 4,000 B-shares.
BERT NORDBERGBorn 1956. Sweden. Engineer. Elected 2013.
Other assignments: Chairman of the Board of Vestas Wind Systems A/S. Board Member of Svenska Cellulosa Aktiebolaget SCA, Axis Communications AB, Essity AB and Saab Group.
Previous positions: Chairman, President and CEO of Sony Mobile Communications AB. Various leading positions within the Ericsson Group. Various positions within Data General Corporation and Digital Equipment Corporation.
Holdings in AB Electrolux: 3,000 B-shares.
KAI WÄRNBorn 1959. Sweden. M.Sc. in Mechanical Engineering. Elected 2017.
Other assignments: President and CEO of Husqvarna AB. Board Member of Husqvarna AB.
Previous positions: Operations Partner at IK Investment Partners Norden AB. President and CEO of Seco Tools AB. Various positions within ABB.
Holdings in AB Electrolux: 4,000 B-shares.
DAVID PORTERBorn 1965. USA. Bachelor’s degree, Finance. Elected 2016.
Other assignments: Head of Microsoft Stores, Corporate Vice President, Microsoft Corp.
Previous positions: Head of Worldwide Product Distribution at DreamWorks Animation SKG. Various positions within WalMart Stores, Inc.
Holdings in AB Electrolux: 1,250 B-shares.
FREDRIK PERSSONBorn 1968. Sweden. M.Sc. Econ. Elected 2012. Member of the Electrolux Audit Committee.
Other assignments: Chairman of the Board of JM AB, the Confederation of Swedish Enterprise (Sw. Svenskt Näringsliv) and ICC Sweden. Board Member of Hufvudstaden AB, ICA Gruppen AB and Ahlström Capital Oy.
Previous positions: Various leading positions within Axel Johnson AB including President and CEO. Head of Research of Aros Securities AB. Various positions within ABB Financial Services AB.
Holdings in AB Electrolux: 3,000 B-shares.
ULRIKA SAXONBorn 1966. Sweden. Studies in Economics. Elected 2011. Member of the Electrolux Remuneration Committee.
Other assignments: President and CEO of Bonnier Ventures. Board Member of SF Studios, Adlibris, KIT Story Engine, FLX, Refunder and partner in AI Sustainability Center.
Previous positions: Senior positions within the Bonnier Group including CEO of Bonnier Magazines. Board engagements in TocaBoca, United Screens. Senior posi-tions within marketing and consultancy.
Holdings in AB Electrolux: 2,000 B-shares.
ELECTROLUX ANNUAL REPORT 2018
112 Corporate governance report

SECRETARY OF THE BOARD
MIKAEL ÖSTMANBorn 1967. M. of Laws and B.Sc. Econ. General Counsel of AB Electrolux.
Secretary of the Electrolux Board since 2017.
Holdings in AB Electrolux: 8,369 B-shares.
COMMITTEES OF THE BOARD OF DIRECTORS
Remuneration Committee Petra Hedengran (Chairman), Staffan Bohman and Ulrika Saxon.
Audit Committee Ulla Litzén (Chairman), Staffan Bohman, Petra Hedengran and Fredrik Persson.
AUDITORS
Deloitte AB
JAN BERNTSSONBorn 1964. Authorized Public Accountant.
Other audit assignments: Kinnevik AB and Boliden AB.
Holdings in AB Electrolux: 0 shares.
At the Annual General Meeting in 2018, Deloitte AB was elected as new auditors for a period of one year until the Annual General Meeting in 2019.
THE BOARD’S REMUNERATION DURING 2018, MEETING ATTENDANCE AND INDEPENDENCE
Total remuneration 20 18, '000 SEK
Board meeting attendance
Remuneration Committee attendance
Audit Committee attendance Indepen dence2)
Staffan Bohman1) 1,827 6/8 3/4 5/7 Yes
Ronnie Leten1) 544 2/8 1/4 Yes
Petra Hedengran 942 8/8 4/4 7/7 No
Hasse Johansson3) 775 7/8 Yes
Ulla Litzén 938 8/8 7/7 Yes
Bert Nordberg 595 8/8 Yes
Fredrik Persson 775 8/8 6/7 Yes
David Porter 595 8/8 Yes
Jonas Samuelson — 8/8 No
Ulrika Saxon 695 8/8 4/4 Yes
Kai Wärn 595 8/8 Yes
1) Ronnie Leten resigned as Board member and Chairman of the Board, and Staffan Bohman replaced him, at the AGM in April 2018. 2) For further information about the independence assessment, see page 105.3) The total remuneration 2018 for Hasse Johansson includes compensation for work relating to investments, modularization and quality.
Holdings in AB Electrolux are stated as of December 31, 2018 and includes holdings of related natural and legal persons, when applicable.
EMPLOYEE REPRESENTATIVES
VIVECA BRINKENFELDT-LEVER
Born 1960. Representative of the Federation of the Salaried Employees in Industry and Service. Elected 2018.
Board meeting attendance:1) 4/8
Holdings in AB Electrolux: 0 shares.
1) Elected December 1, 2018. Previously deputy member.
ULF CARLSSONBorn 1958. Representative of the Swedish Confederation of Trade Unions. Elected 2001.
Board meeting attendance: 8/8
Holdings in AB Electrolux: 0 shares.
PETER FERMBorn 1965. Representative of the Federation of Salaried Employees in Industry and Services. Elected 2018.
Board meeting attendance:2) 6/8
Holdings in AB Electrolux: 0 shares.
2) Elected April 5, 2018. Previously deputy member.
EMPLOYEE REPRESENTATIVES, DEPUTY MEMBERS
MONICA ANNALABorn 1966. Representative of the Confederation of Trade Unions. Elected 2018.
Holdings in AB Electrolux: 0 shares.
RICHARD DELLNERBorn 1953. Representative of the Federation of Salaried Employees in Industry and Services. Elected 2013.
Holdings in AB Electrolux: 500 B-shares.
JOACHIM NORDBorn 1966. Representative of the Federation of Salaried Employees in Industry and Services. Elected 2018.
Holdings in AB Electrolux: 0 shares.
Corporate governance report 113
ELECTROLUX ANNUAL REPORT 2018

Holdings in AB Electrolux are stated as of December 31, 2018 and includes holdings of related natural and legal persons, when applicable.
Group ManagementJONAS SAMUELSON
President and CEO
—
Born 1968. Sweden. M.Sc. in Business Administration and Economics. In Group Management and employed since 2008.
Other assignments: Board Member of Polygon AB and Axel Johnson AB.
Previous positions: Various senior positions within Electrolux including CFO of AB Electrolux, COO Global Operations Major Appliances and Head of Major Appliances EMEA. Chief Financial Officer and Executive Vice President of Munters AB. Various senior positions within General Motors, mainly in the U.S., and Saab Automobile AB.
Holdings in AB Electrolux: 32,070 B-shares.
DANIEL (DAN) ARLERHead of Major Appliances Asia Pacific, Middle East and Africa,
Executive Vice President
—
Born 1969. The Netherlands. B.Sc. in Marketing. In Group Management since 2016 and employed since 2002.
Previous positions: Head of Electrolux Major Appliances EMEA. Other senior positions within Electrolux including General Manager of Electrolux Japan and Senior Vice President Product Line Kitchen in Major Appliances EMEA. Management positions in Stanley Works Europe and the Whirlpool Corporation in Europe.
Holdings in AB Electrolux: 9,702 B-shares.
JAN BROCKMANNChief Operations Officer, Executive Vice President
—
Born 1966. Germany. M.Sc. in Mechanical Engineering, M.B.A. In Group Management since 2011 and employed since 2010.
Previous positions: Various senior positions within Electrolux including Group Chief Technology Officer and Head of R&D, Electrolux Major Appliances. Various senior product management positions within Volkswagen Group. Project Manager Automotive/Restructuring in Roland Berger Strategy Consultants GmbH. Key Account and General Management posi-tions within Valeo Group.
Holdings in AB Electrolux: 10,514 B-shares.
RICARDO CONSHead of Major Appliances Latin
America, Executive Vice President
—
Born 1967. Brazil. Bachelor in Business Administration, Finance and Marketing, MBA in Team Management. In Group Management since 2016 and employed since 1997–2011 and 2016.
Previous positions: Management positions at Franke in Brazil. Various senior positions at Electrolux Brazil, including President Small Appliances Latin America, Sales and Marketing Director Major Appliances. Positions in Volvo Brazil.
Holdings in AB Electrolux: 0 shares.
THERESE FRIBERGChief Financial Officer
—
Born 1975. Sweden. B.Sc. in Business Administration. In Group Management since 2018 and employed since 1999.
Previous positions: CFO of Electrolux Major Appliances EMEA. Other senior positions within Electrolux including Head of Group Business Control and Sector Controller Home Care & SDA.
Holdings in AB Electrolux: 6,259 B-shares
OLA NILSSONChief Experience Officer, Executive Vice President
—
Born 1969. Sweden. M.Sc. in International Business Administration. In Group Management since 2016 and employed since 1994.
Previous positions: Head of Home Care & Small Domestic Appliances. Various senior positions within Electrolux including Senior Vice President, Product Line Laundry Major Appliances EMEA and President Small Appliances Asia Pacific.
Holdings in AB Electrolux: 5,235 B-shares
ELECTROLUX ANNUAL REPORT 2018
114 Corporate governance report

CHANGES IN GROUP MANAGEMENT ANNOUNCED ON FEBRUARY 1, 2019
The following changes in the Group Management have been announced with effect from February 1, 2019.
Ola Nilsson, previous Head of Home Care & SDA, was appointed Group Chief Experience Officer (CXO) and Executive Vice President of AB Electrolux, and as a consequence of the new organizational structure, the Chief Marketing Officer Lars Hygrell is no longer member of Group Management. Jan Brockmann, Chief Operations Officer was also appointed as Executive Vice President of AB Electrolux.
ALAN SHAWHead of Major Appliances North
America, Executive Vice President
—
Born 1963. USA. B.S. in Economics and Political science, M.B.A. in Marketing. In Group Management and employed since 2016.
Previous positions: Executive Vice President at Husqvarna AB. President and Chief Executive Officer at Char-Broil LLC. President and Chief Executive Officer at Murray Group. Various senior management positions in Asia-Pacific and North America at Whirlpool. Marketing Director at a Whirlpool JV, Consul, in Brazil. Product management positions at Whirlpool Corporation.
Holdings in AB Electrolux: 0 shares.
ANNA OHLSSON-LEIJONHead of Major Appliances Europe,
Executive Vice President
—
Born 1968. Sweden. B.Sc. in Business Administration and Economics. In Group Management since 2016 and employed since 2001.
Other assignments: Board member of Alfa Laval AB.
Previous positions: Chief Financial Officer of AB Electrolux. Other senior positions within Electrolux including CFO of Electrolux Major Appliances EMEA and Head of Electrolux Corporate Control & Services. Chief Financial Officer of Kimoda. Various positions within PricewaterhouseCoopers.
Holdings in AB Electrolux: 8,798 B-shares.
ALBERTO ZANATAHead of Professional Products,
Executive Vice President
—
Born 1960. Italy. University degree in Electronic Engineering with Business Administration. In Group Management since 2009 and employed since 1989.
Previous positions: Senior management positions within Electrolux including Head of Professional Products in North America and senior management positions in Electrolux Professional Products.
Holdings in AB Electrolux: 27,468 B-shares.
MIKAEL ÖSTMANGeneral Counsel,
Senior Vice President
—
Born 1967. Sweden. M. of Laws and B.Sc. Econ. In Group Management since 2017 and employed since 2002.
Previous positions: Various senior positions within Electrolux including Head of Electrolux Corporate Legal Department and Head of Electrolux Legal Affairs Europe. Corporate Counsel at Telia Mobile AB. Lawyer at Advokatfirman Vinge. Law Clerk with the Stockholm District Court.
Holdings in AB Electrolux: 8,369 B-shares.
LARS WORSØE PETERSENHead of HR & Communications,
Senior Vice President
—
Born 1958. Denmark. M.Sc. in Economics and Business Administration. In Group Management since 2011 and employed since 1994–2005 and 2011.
Previous positions: Head of Group Staff Human Resources at Husqvarna AB, 2005–2011. Various senior positions within Electrolux including Head of Human Resources for Electrolux Major Appliances North America and Head of Electrolux Holding A/S in Denmark.
Holdings in AB Electrolux: 18,102 B-shares.
Corporate governance report 115
ELECTROLUX ANNUAL REPORT 2018

Internal control over financial reporting
The Electrolux Control System (ECS) has been developed to ensure accurate and reliable financial reporting and preparation of financial statements in accordance with applicable laws and regulations, generally accepted accounting principles and other requirements for listed companies. The ECS adds value through clarified roles and responsibilities, improved process efficiency, increased risk awareness and improved decision support. The ECS is based on the Internal Control — Integrated Framework (2013) issued by the Committee of Sponsoring Organizations of the Treadway Commission (COSO). The five components of this framework are control environment, risk assessment, control activities, monitor and improve and inform and communicate.
CONTROL ENVIRONMENT — EXAMPLE
Code of ConductMinimum standards in the area of environment, health and safety, labor standards and human rights. The Code of Conduct is mandatory for Electrolux units.
Group Finance PolicyDetails the general framework for how financial operations shall be organized and managed within the Group. The policy contains directives and other mandatory standards issued by the Group Finance organization.
Credit DirectiveRules for customer assessment and credit risk that clarify responsibilities and are the frame-work for credit decisions.
Delegation of Authority DirectiveDetails the approval rights, with monetary, volume or other appropriate limits, e.g., approval of credit limits and credit notes.
Internal Control DirectiveDetails responsibility for internal controls. Controls should address the Minimum Internal Control Requirements (MICR) within every appli-cable process, for example “Order to Cash”.
Accounting ManualAccounting principles and reporting instruc-tions for the Group‘s reporting entities are contained in the Electrolux Accounting Manual. The Accounting Manual is mandatory for all reporting units.
Control environmentThe foundation for the ECS is the control environment, which determines the individual and collective behavior within the Group. It is defined by policies and directives, man-uals, and codes, and enforced by the organ-izational structure of Electrolux with clear responsibility and authority based on collective values.
The Electrolux Board has overall responsibility for establishing an effective system of internal con-trol. Responsibility for maintain-ing effective internal controls is delegated to the President. The governance structure of the Group is described on page 102. Specifically for financial reporting, the Board has estab-lished an Audit Committee, which assists in overseeing relevant policies and important accounting principles applied by the Group.
The limits of responsibilities and authorities are given in directives for delegation of authority, manuals, policies and procedures, and codes, including the Code of Conduct, the Workplace Policy, and the Anti-
Corruption Policy, as well as in policies for information, finance, and in the accounting manual. Together with laws and external
regulations, these internal guidelines form the control environment and all Electrolux employees are
held accountable for compliance.All entities within the Electrolux Group must maintain adequate internal
controls. As a minimum requirement, control activities should address key risks identified within the Group. Group Management have the ultimate responsibility for internal controls within their areas of responsibility. Group Manage-ment is described on pages 114–115.
The ECS Program Office, a department within the Group
Internal Audit function, has devel-oped the methodology and is
responsible for maintaining the ECS. To ensure timely completion of these
activities, specific roles aligned with the company structure, with clear responsibilities
regarding internal control, have been assigned within the Group.
Four
th Q
uarte
r
First Quarter
Third Quarter Second Quarte
rControl environment
Electrolux Control System
Inform and communicate
Risk assessment
Control activities
Monitor
Improve
ELECTROLUX ANNUAL REPORT 2018
116 Corporate governance report

Riskassessment
Risk assessmentRisk assessment includes identifying risks of not fulfilling the fundamental criteria, i.e.,
completeness, accuracy, valuation and reporting for significant accounts in the financial reporting for the Group as well as risk of loss or misappropriation of assets.
At the beginning of each calendar year, the ECS Program Office performs a global risk assessment to determine the reporting units, data centers and processes in scope for the ECS activities. Within the Electrolux Group, a number of different processes generating transactions that end up in significant accounts in the financial reporting have been identified. All larger reporting units perform the ECS activities.
The ECS has been rolled out to almost all of the smaller units within the Group. The scope for smaller units is limited in terms of monitoring as management is not formally required to test the controls.
Controlactivities
Control activitiesControl activities mitigate the risks iden-tified and ensure accurate and reliable
financial reporting as well as process efficiency.Control activities include both general and detailed controls
aimed at preventing, detecting and correcting errors and irreg-ularities. In the ECS, the following types of controls are imple-mented, documented and tested:• Manual and application controls — to secure that key risks
related to financial reporting within processes are controlled. • IT general controls — to secure the IT environment for
key applications.• Entity-wide controls — to secure and enhance the
control environment.
Monitor
Improve
Monitor and ImproveMonitor and test of control activities is performed periodically to ensure that risks are properly mitigated.
The effectiveness of control activities is monitored continuously at four levels:
Group, business area, reporting unit, and process. Monitor-ing involves both formal and informal procedures applied by management, process owners and control operators, including reviews of results in comparison with budgets and plans, analyti-cal procedures, and key-performance indicators.
Within the ECS, management is responsible for testing key controls. Management testers who are independent of the control operator perform these activities. Group Internal Audit maintains test plans and performs independent testing of selected controls. Controls that have failed must be remediated, which means establishing and implementing actions to correct weaknesses.
The Audit Committee reviews reports regarding internal con-trol and processes for financial reporting. Group Internal Audit proactively proposes improvements to the control environment. The head of Group Internal Audit has dual reporting lines: To the President and the Audit Committee for assurance activities, and to the CFO for other activities.
Inform andcommunicate
Inform and communicateInform and communicate within the Electrolux Group regarding risks and
controls contributes to ensuring that the right business decisions are made.
Guidelines for financial reporting are communicated to employees, e.g., by ensuring that all manuals, policies and codes are published and accessible through the Group-wide intranet as well as information related to the ECS.
To inform and communicate is a central element of the ECS and is performed continuously during the year. Management, process owners and control operators in general are respon-sible for informing and communicating the results within the ECS.
The status of the ECS activities is followed up continuously through status meetings between the ECS Program Office and coordinators in the business areas. Information about the status of the ECS is provided periodically to business area and Group Management, the Audit Board and the Audit Committee.
ENTERPRISE RISK ASSESSMENT — EXAMPLE CONTROL ACTIVITIES — EXAMPLE
Process Risk assessed Control activity
Closing Routine
Risk of incorrect financial reporting.
Reconciliation between general ledger and accounts receivable sub-ledger is performed, documented and approved.
Manage IT Risk of unauthorized/incorrect changes in the IT environment.
All changes in the IT environment are authorized, tested, verified and finally approved.
Order to Cash Risk of not receiving payment from customers in due time.
Customers’ payments are monitored and outstanding payments are followed up.
Order to Cash Risk of incurring bad debt. Application automatically blocks sales orders/deliveries when the credit limit is exceeded.
Order to Cash — Risks assessed
Manage IT — Risks assessed
Closing Routine — Risks assessed
Corporate governance report 117
ELECTROLUX ANNUAL REPORT 2018

Financial reporting and informationElectrolux routines and systems for information and commu-nication aim at providing the market with relevant, reliable, correct and vital information concerning the development of the Group and its financial position. Specifically for purposes of considering the materiality of information, including financial reporting, relating to Electrolux and ensuring timely communi-cation to the market, a Disclosure Committee has been formed.
Electrolux has an information policy meeting the require-ments for a listed company.
Financial information is issued regularly in the form of:• Full-year reports and interim reports, published as
press releases.• The Annual Report.• Press releases on all matters which could have a significant
effect on the share price.• Presentations and telephone conferences for financial
analysts, investors and media representatives on the day of publication of full-year and quarterly results.
• Meetings with financial analysts and investors in Sweden and worldwide.
All reports, presentations and press releases are published at: www.electroluxgroup.com/ir
Stockholm, February 14, 2019
AB Electrolux (publ) The Board of Directors
Auditor’s report on the Corporate Governance StatementTo the general meeting of the shareholders in AB Electrolux (publ), corporate identity number 556009-4178Engagement and responsibilityIt is the board of directors who is responsible for the corporate governance statement for the year 2018 on pages 100–118 and that it has been prepared in accordance with the Annual Accounts Act. The scope of the auditOur examination has been conducted in accordance with FAR’s auditing standard RevU 16 The auditor’s examination of the cor-porate governance statement. This means that our examination of the corporate governance statement is different and substan-tially less in scope than an audit conducted in accordance with International Standards on Auditing and generally accepted auditing standards in Sweden. We believe that the examination has provided us with sufficient basis for our opinions.OpinionsA corporate governance statement has been prepared. Disclosures in accordance with chapter 6 section 6 the second paragraph points 2–6 the Annual Accounts Act and chapter 7 section 31 the second paragraph the same law are consistent with the annual accounts and the consolidated accounts and are in accordance with the Annual Accounts Act.
Stockholm, February 15, 2019
Deloitte AB
Jan Berntsson Authorized Public Accountant
Factors affecting forward-looking statementsThis annual report contains “forward-looking” statements within the meaning of the U.S. Private Securities Litigation Reform Act of 1995. Such statements include, among others, the financial goals and targets of Electrolux for future periods and future business and financial plans. These statements are based on current expectations and are subject to risks and uncertainties that could cause actual results to differ mate-rially due to a variety of factors. These factors include, but may not be limited to the following; consumer demand and market conditions in the geographical areas and industries in which Electrolux operates, effects of
currency fluctuations, competitive pressures to reduce prices, significant loss of business from major retailers, the success in developing new prod-ucts and marketing initiatives, developments in product liability litigation, progress in achieving operational and capital efficiency goals, the suc-cess in identifying growth opportunities and acquisition candidates and the integration of these opportunities with existing businesses, progress in achieving structural and supply-chain reorganization goals.
ELECTROLUX ANNUAL REPORT 2018
118 Corporate governance report

Events and reports
The Electrolux website www.electroluxgroup.com/ir contains additional and updated information about such items as the Electrolux share and
corporate governance as well as a platform for financial statistics.
Investor Relations www.electroluxgroup.com/ir
Electrolux subscription service can be accessed at www.electroluxgroup.com/subscribe
Financial reports and major events in 2019
Consolidated report
1Feb
Interim report January–September
25Oct
Interim report January–March
26Apr
Interim report January–June
18Jul
Annual General Meeting
10Apr
Capital Markets Day
27Mar
Electrolux Annual Report 2018www.electroluxgroup.com/annualreport2018
Electrolux Annual Report 2018
Electrolux Interim Report January – December 2018Stockholm, February 1, 2019
Q42018
Good progress in a challenging environment
• Net sales amounted to SEK 34,425m (32,580). Sales growth was 2.5%, driven by price increases and mix improvements across most business areas.
• Operating income amounted to SEK 1,963m (2,065), corresponding to a margin of 5.7% (6.3). Four business areas achieved above 6% margin.
• Excluding a non-recurring item of SEK +71m relating to the completion of the French antitrust proceeding, operating income amounted to SEK 1,892m, corresponding to a margin of 5.5% (6.3).
• Positive earnings contribution from volume/price/mix across all business areas partly offset higher input costs and currency headwinds.
• Major Appliances North America faced higher cost inflation from tariffs and a decline in sales to private label.
• Operating cash flow after investments amounted to SEK 3,163m (2,078).
• Income for the period decreased to SEK 1,575m (2,002), and earnings per share was SEK 5.48 (6.97).
• The Board proposes a dividend for 2018 of SEK 8.50 (8.30) per share, to be paid in two installments.
• The Board has announced the intention to prepare a separation and listing of the Professional Products business area.
Financial overviewSEKm Q4 2018 Q4 2017 Change, % 2018 2017 Change, %
Net sales 34,425 32,580 6 124,129 120,771 3Sales growth, %1) 2.5 5.4 1.7 0.5Organic growth, % 2.7 4.0 1.3 -0.4Acquisitions, % 0.5 1.9 0.7 1.4Divestments, % -0.7 -0.5 -0.3 -0.4Changes in exchange rates, % 3.1 -4.7 1.1 0.2Operating income2) 1,963 2,065 -5 5,310 7,407 -28Operating margin, % 5.7 6.3 4.3 6.1Income after financial items 1,832 2,001 -8 4,887 6,966 -30Income for the period 1,575 2,002 -21 3,805 5,745 -34Earnings per share, SEK3) 5.48 6.97 13.24 19.99Operating cash flow after investments 3,163 2,078 3,649 6,877Return on net assets, % — — 22.7 36.0
1) Change in net sales adjusted for currency translation effects.2) Operating income in the fourth quarter of 2018 includes a non-recurring item of SEK 71m relating the French Competition Authority investigation that was concluded in the
quarter and impacts Major Appliances EMEA. Excluding this item, operating income amounted to SEK 1,892m corresponding to a margin of 5.5% (6.3). Operating income in the full year of 2018 includes non-recurring items of SEK -1,343m. Excluding these items, operating income amounted to SEK 6,653m corresponding to a margin of 5.4% (6.1) see pages 12 and 21.
3) Basic.
For definitions, see pages 29-30.
Electrolux Annual Review 2018 www.electroluxgroup.com/annualreports/2018
Electrolux Sustainability Report (GRI) 2018 www.electroluxgroup.com/sustainabilityreport2018
Electrolux Interim Reports www.electroluxgroup.com/ir
Events and reports 119
ELECTROLUX ANNUAL REPORT 2018

Annual General MeetingThe Annual General Meeting will be held at 5 pm on Wednesday, April 10, 2019, at Stockholm Waterfront Congress Centre, Nils Ericsons plan 4, Stockholm, Sweden.
ParticipationShareholders who intend to participate in the Annual General Meeting must• be registered in the share register kept by the Swedish central
securities depository Euroclear Sweden AB on Thursday, April 4, 2019, and
• give notice of intent to participate, to Electrolux on Thursday, April 4, 2019, at the latest.
Notice of participationNotice of intent to participate can be given• on the Group’s website;
www.electroluxgroup.com/agm2019• by telephone +46 8 402 92 79,
on weekdays between 9 am and 4 pm• by mail to
AB Electrolux c/o Euroclear Sweden AB Box 191 SE-101 23 Stockholm Sweden
Notice should include the shareholder’s name, personal identity or registration number, address, telephone number and the number of assistants attending, if any. Shareholders may vote by proxy, in which case a power of attorney should be submitted to Electrolux well in advance of the Annual General Meeting.
Proxy forms in English and Swedish are available on the Group’s website: www.electroluxgroup.com/agm2019
Shares registered by trusteeShareholders that have their shares registered in the name of a nominee must, in addition to giving notice of participation in the meeting, temporarily be recorded in the share register in their own names (so called voting-rights registration) to be able to participate in the General Meeting. In order for such registra-tion to be effectuated on Thursday, April 4, 2019, shareholders should contact their bank or trustee well in advance of that date.
DividendThe Board of Directors proposes a dividend for the fiscal year 2018 of SEK 8.50 per share, for a total dividend payment of approximately SEK 2,443m (2,385). The proposed dividend corre-sponds to approximately 64% (42) of income for the period. The dividend is proposed to be paid in two equal installments, the first with the record date Friday, April 12, 2019, and the second with the record date Friday October 11, 2019. The first install-ment is estimated to be paid on Wednesday, April 17, 2019 and the second installment on Wednesday, October 16, 2019.
Proposal for election of board members to Annual General Meeting In preparation for the Annual General Meeting, the Nomination Committee has in January 2019 proposed the re-election of all board members except Bert Nordberg, who has declined re-election. Staffan Bohman was proposed to be re-elected as Chairman of the Board of Directors, and Petra Hedengran, Hasse Johansson, Ulla Litzén, Fredrik Persson, David Porter, Jonas Samuelson, Ulrika Saxon and Kai Wärn as Board members.
September MarchJanuary April October
2018 2019
26 Nomination Committee appointed for AGM 2019
28 Proposals from Nomination Committee presented
6 Notice to AGM estimated to be published
4 Deadline for notice of intent to participate in AGM and regis-tration in share register
10 AGM 2019
12 Proposed record date for the first installment of the dividend payment
17 Estimated date for payment of first installment of dividend
11 Proposed record date for the second install-ment of the dividend payment
16 Estimated date for payment of second installment of dividend
DATES REGARDING THE AGM 2019
ELECTROLUX ANNUAL REPORT 2018
120 Annual General Meeting

In 2019, Electrolux turns 100 years. Founded in Sweden in 1919 by entrepreneur Axel Wenner-Gren, Electrolux has shaped liv-ing for the better for 100 years by reinventing what great taste, care and wellbeing experiences mean for our consumers.
The Electrolux story is rich with groundbreaking innovations and bold entrepreneurship, as well as with cutting edge sales and marketing methods. It’s a history of rapid expansion and acquisitions, as well as of consumer insight and world-class design. All in the midst of major trends like globalization and digitalization.
By creating more enjoyable and sustainable living for hun-dreds of millions of people around the world, we have not only
impacted the lives of our consumers, but also the societies in which they live.
During 2019, we will highlight and celebrate all these achievements, but more importantly we will look forward by putting our purpose into action and positively impact the world’s greatest challenge: the way we all live our lives. 2019 will therefore be the starting point for our most important initiative: a global, long-term action plan to create a more enjoyable and sustainable future.
More information about this and our history will be displayed at the Annual General Meeting.
100 years of better living
Founded in Sweden in 1919 by entrepreneur Axel Wenner-Gren
1920s The Electrolux salesmen sold vacuum cleaners all over the world, supported by
innovative marketing methods like the vacuum cleaner car.
1930s The innovative and completely silent absorption fridge could run on either
electricity or gas, and became a global success.
1940s The launch of the groundbreaking Assistent food processor was Electrolux first
venture into cooking products.
1950s Electrolux legendary ”floating wing” W20 washing machine helped to shorten the time consuming and cumbersome laundry
process considerably.
2000s The innovative battery-driven vacuum cleaner Ergorapido was launched in 2004 following systematic product development
and consumer tests.
2010s Electrolux expanded its offering of connected appliances, here with
Google Assistant.
1960s The “Luxomatic” vacuum cleaner was launched in 1964 and had innovations like an
adjustable nozzle and a cord winder.
1970s The Datalux cooker launched in 1978 had an electronic rear control panel featuring
a digital clock and a timer.
1980s The legendary Electrolux "Troika" with Anders Scharp, Hans Werthén and Gösta
Bystedt made Electrolux into a global appliance company through hundreds of acquisitions.
1990s The prototype of the world's first robotic vacuum cleaner, the Trilobite,
was presented in 1997.

annual review on the web www.electroluxgroup.com/annualreports/2018
AB ELECTROLUX (PUBL), 556009-4178
Mailing address: SE-105 45 Stockholm, Sweden | Visiting address: S:t Göransgatan 143, StockholmTelephone: +46 8 738 60 00 | Website: www.electroluxgroup.com


