23
Leeds, 18 March 2008 EMPLOYMENT STATUS AND HEALTH TRAJECTORIES Gopalakrishnan Netuveli Imperial College London 1 Jan 2007 – 31 March 2008

Leeds, 18 March 2008
EMPLOYMENT STATUS AND HEALTH TRAJECTORIES
Gopalakrishnan NetuveliImperial College London1 Jan 2007 – 31 March 2008

Leeds, 18 March 2008
Employment and health
“… there is a strong theoretical case, supported by a great deal of background evidence, that work and paid employment are generally beneficial for physical and mental health and well-being.” Waddel and Burton, 2006.
Debate: selection vs. causation “…there is a strong case for all health
strategies to consider employment as an outcome, where appropriate. There is also a strong case for employment policy to evaluate the health impact of all its relevant interventions.” McLean et al. 2005

Leeds, 18 March 2008
Problem with the direction of causation
Employment and health may mutually influence each other and the direction of causation might depend on context and contingency.
This makes the relationship between employment and health complex.
Data form that might capture context and contingency is longitudinal trajectories.
Study of trajectories might help to understand part of this complexity
Leeds, 18 March 2008
Objective
To explore trajectories of health and employment in a sample of BHPS
Data: 2852 subjects between 16 and 50 years in 1991 who were employed and reported no health problems and self-rated health as good or better
Employment trajectory: 1 =(self) employed; 0=ElseHealth trajectory: 1 = Good or better SRH; 0=ElseW9 & 14 excluded > SRH question different

Leeds, 18 March 2008
Methods
1. Summarising trajectories: are there classes of trajectories?
Latent Class Growth Analysis
W1
IS
C
W14
Age
Sex
11
0
13

Leeds, 18 March 2008
Methods
2. Comparing employment and health trajectories within individuals: are trajectories of health and employment similar?

Leeds, 18 March 2008
Measuring similarity: requirements
Both trajectories coded similarly Same number of states in each point of each
trajectory The states coded similarly have the same
relative position in the vector of states for each trajectory
Present study:
Trajectory 0 1Health Health problems present No health problemsEmployment Out of employment In employment
Codes

Leeds, 18 March 2008
Methods contd…
Common distance measures of similarity:Euclidean, Hamming, Levenshtein
Present study: a new approach using Kolmogorov-Smirnov D – statisticD-statistics is the maximum distance between the cumulative
fractile/percentile distribution of the two trajectories. A significant test for the H0:D=0 can be done (if necessary
exact test accounting for small number of points)The individual P-values can be combined using meta-analysis,
even adjusting for co-variates using meta-regression It is also possible to identify which distribution ‘dominates’
Applications used: Mplus, STATA

Leeds, 18 March 2008
Results
Distribution of the sample according to W1 age and sex
Age group Men Women All16-30 564 456 102031-40 425 320 74541-50 587 500 1087All 1567 1276 2852

Leeds, 18 March 2008
Results
Distribution according to W1 social class

Leeds, 18 March 2008
Employment trajectories
Latent Class Growth Analysis of employment trajectory identified 7 classes. Classification forced to stop at 7 when number of people in any class fell below 5%
Employment trajectories Freq. Percent AUC* Immediate drop 446 15.48 0.06 Early rectangle 353 12.25 0.21Early drop - slow decline 137 4.76 0.37 Middle rectangle 237 8.23 0.46 Early drop- recovery 264 9.16 0.68 Late rectangle 247 8.57 0.72
Persisting 1,197 41.55 0.91
*AUC Average proportion of person-time in employment

Leeds, 18 March 2008
Employment trajectories

Leeds, 18 March 2008
Age and sex distribution of employment trajectories

Leeds, 18 March 2008
Social class distribution of employment trajectories by sex

Leeds, 18 March 2008
Propensity to different types of employment trajectories
Narrative description of a multinomial logistic regression:
Employment trajectories Characeristics Immediate drop >30years, manual class Early rectangle not 31-40 (might be manual class)Early drop - slow decline Women <31or >40 years manual class Middle rectangle >40 years Early drop- recovery Women <31 years manual class Late rectangle <30 or >40 years
Persisting Reference category

Leeds, 18 March 2008
Health trajectories
LCGA identified 6 classes. Classification stopped when there was no significant statistical difference between six and seven class solutions
*AUC Average proportion of person-time in employment
Health trajectories N % AUC* CharacteristicsImmediate drop 376 15.06 0.06 <31 years manual classEarly rectangle 247 9.89 0.24 <31 yearsEarly drop - slow decline 173 6.93 0.30 Women >40 years manual classLate rectangle 248 9.93 0.53 (<31 or >40 years manual class)Early drop- recovery 402 16.1 0.54 Women <31 or >40 years manual classPersisting 1,051 42.09 0.75 Reference

Leeds, 18 March 2008
Cross-tabulation of health and employment trajectories
EmploymentImmediate drop
Early rectangle
Early drop - slow dec
Early drop- recovery
Late rectangle Persisting All
Immediate drop 307 12 4 3 8 3 337Early rectangle 50 191 9 10 4 8 272Early drop - slow dec 2 1 37 24 28 19 111Middle rectangle 6 30 23 81 12 22 174Early drop- recovery 1 1 24 12 90 121 249Late rectangle 3 3 23 70 32 73 204Persisting 7 9 53 48 228 805 1150All 376 247 173 248 402 1051 2497
Health
Chi-square= 3994; df=30 p-value: <0.0001
Pivotal cells contributing to greatest to chi-square
Correlation between trajectories: 0.8
Leeds, 18 March 2008
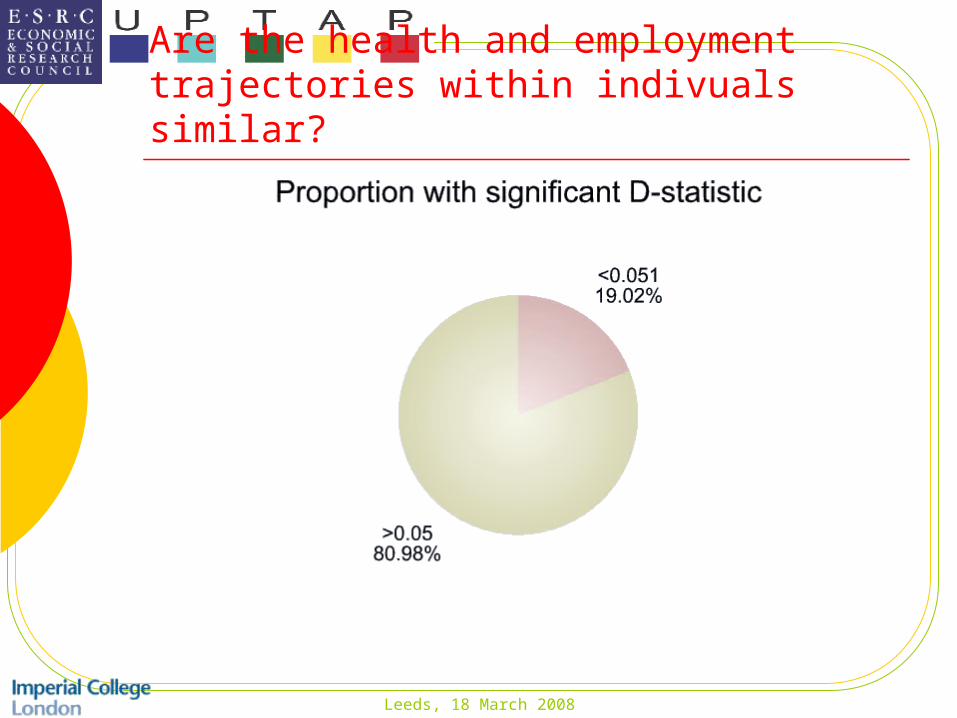
Are the health and employment trajectories within indivuals similar?

Leeds, 18 March 2008
Meta-analysis of p-values: full and subgroups
Groups D-statistics (95%CI) z-value pAll 0.28 (0.27 to 0.30) -9.040 1.000Men, non-manual, 16-30 years 0.19 (0.15 to 0.23) -7.083 1.000Men, non-manual, 31-40 years 0.26 (0.22 to 0.30) -4.307 1.000Men, non-manual, 41-50 years 0.31 (0.27 to 0.34) -0.698 0.757Men, manual, 16-30 years 0.21 (0.17 to 0.25) -7.327 1.000Men, manual, 31-40 years 0.30 (0.24 to 0.35) -0.870 0.808Men, manual, 41-50 years 0.36 (0.31 to 0.40) 1.823 0.034Women, non-manual, 16-30 years 0.26 (0.22 to 0.29) -5.364 1.000Women, non-manual, 31-40 years 0.26 (0.21 to 0.31) -4.912 1.000Women, non-manual, 41-50 years 0.33 (0.29 to 0.36) 0.358 0.360Women, manual, 16-30 years 0.31 (0.24 to 0.37) -0.403 0.657Women, manual, 31-40 years 0.31 (0.25 to 0.38) -0.669 0.748Women, manual, 41-50 years 0.33 (0.28 to 0.39) 0.215 0.415

Leeds, 18 March 2008
Distribution of Employment and health trajectories in men, non-manual, 41-50 years
Early rectangle
Early drop slow decline
Late rectangle
Early drop recovery
Persisting Total
Middle rectangle 0 0 1 1 2 4Early drop- recovery 0 1 0 1 7 9Late rectangle 0 3 1 0 0 4Persisting 1 3 5 19 41 69Total 1 7 7 21 50 86
Health
Employment
Pearson chi2(12) = 32.3433 Pr = 0.001

Leeds, 18 March 2008
Average D according to employment and health latent classes
EmploymentImmediate drop
Early rectangle
Early drop - slow dec
Early drop- recovery
Late rectangle Persisting All
Immediate drop 0.02 . 0.07 . 0.65 0.36 0.31Early rectangle 0.14 0.14 0.11 0.11 0.07 0.48 0.32Early drop - slow dec . . 0.11 . 0.34 0.38 0.30Middle rectangle 0.21 0.29 0.26 0.23 0.25 0.36 0.28Early drop- recovery . 0.79 0.31 0.38 0.30 0.20 0.25Late rectangle 0.64 0.64 0.39 0.26 0.32 0.18 0.26Persisting 0.64 0.63 0.56 0.47 0.39 0.22 0.29All 0.41 0.57 0.44 0.40 0.37 0.23 0.28
Health
Emboldened: significant p-value after synthesis

Leeds, 18 March 2008
Conclusions
Are there classes of trajectories? YES
Are trajectories of health and employment similar? YES for the majority (80%)
Selection or causation? Weak evidence (if any) for causation

Leeds, 18 March 2008
Acknowledgements
ESRC and UPTAP programme
Professor David Blane, ICLProfessor Mel Bartley, UCLProfessor Richard Wiggins, IOE
Members of Q3 seminar group, Imperial College London


