Enantiospecific Desorption of R- and S‑Propylene Oxide from D- orL‑Lysine Modified Cu(100) SurfacesWai Yeng Cheong and Andrew J. Gellman*
Department of Chemical Engineering, Carnegie Mellon University, Pittsburgh, Pennsylvania 15213, United States
*S Supporting Information
ABSTRACT: The enantiospecific desorption kinetics of R- and S-propylene oxide (PO) from a Cu(100) surface modified by enantiomeri-cally pure D- or L-lysine have been studied using temperatureprogrammed desorption. These experiments have used R- or S-PO asthe chiral probe for study of enantiospecific adsorption on Cu(100)surfaces modified with D- or L-lysine. This chiral probe/modifier/Cusystem manifests a significant diastereomeric effect in the R- and S-POpeak desorption temperatures and, hence, true enantiospecific behavior.The enantiospecificity in the PO desorption kinetics is observed onlyover a narrow range of lysine modifier coverage with a maximum at alysine coverage leaving an empty site density of θO ≈ 0.25. The observation of enantiospecific behavior in the PO/lysine/Cu(100) system is in contrast with the failed results of prior attempts to observe enantiospecific desorption from chirallymodified Cu surfaces. The potential for hydrogen-bonding interactions between the chiral probe and chiral modifier, which candepend on the coverage and configuration of the adsorbed modifier, may play a crucial role in enantiospecific adsorption onlysine modified Cu surfaces.
1. INTRODUCTION
The production of enantiomerically pure chiral compounds foruse in the pharmaceuticals industry or for other bioactivepurposes involves complex and expensive enantiospecificchemical processes. Any chemical reaction that produces achiral compound from achiral reactants in an achiral environ-ment will yield a racemic mixture of the two productenantiomers. In these cases, the desired enantiomer mustthen be separated from the undesired enantiomer. Becauseconventional separation processes exploit differences in bulkphysical properties, for example, solubility, boiling point,melting point, density, vapor pressure, and so forth, to separatemixtures, it is impossible to separate enantiomers using theseclassical separation techniques in an achiral environment. Theseproperties will be identical for both enantiomers in achiralenvironments. In order to induce enantioselective separation, achiral medium such as a chiral surface or a chiral solvent mustbe employed to differentiate the properties of the twoenantiomers.Chiral surfaces can be prepared by a number of methods.
Naturally chiral surfaces can be prepared by cleaving crystalsalong low symmetry directions with no mirror planes normal tothe exposed surface. In metals, which have high symmetryachiral bulk structures, the low symmetry, high Miller indexplanes have structures formed of low Miller index terracesseparated by kinked step edges and are chiral.1−2 The three lowMiller index microfacets that form the kinks can be arrangedwith a clockwise or counterclockwise sense of rotation thatdetermines the chirality (R- or S-) of the surface. Anotherapproach to fabricating chiral surfaces is through modification
of achiral surfaces by adsorption of chiral molecules. Thesechiral modifiers can impart chirality to the achiral surface by anumber of means. First, the adsorbed modifiers can self-assemble into an ordered layer to form a “templated chiralsurface”. For example, adsorption of R,R-tartaric acid or L-alanine on the Cu(110) surface results in well-orderedoverlayers with structures that break the symmetry of thesubstrate and impart long-range chirality.4 It has beenhypothesized that these supramolecular adlayer structurescontain nanosized chiral pockets which expose the Cu substrateand can serve as chiral sites for enantiospecific adsorption andreaction. Reactant molecules could adsorb with an asymmetricorientation, forcing subsequent reactions to occur enantiose-lectively. Even without the long-range chirality imparted by theformation of an ordered modifier overlayer, local chirality canbe conferred to a surface by the intrinsic chirality of an isolated,adsorbed chiral modifier and the asymmetry of adsorption sitesin its immediate vicinity. In this case, enantioselectivity arisesfrom the chiral-directing interaction between the isolatedadsorbed modifier and an adsorbed reactant molecule. Thistype of one-to-one interaction between methyl pyruvate(reactant) and cinchonidine (modifier) is one of the proposedmechanisms for chiral induction in the enantioselectivehydrogenation of methyl pyruvate over cinchonidine modifiedPt catalysts.5 The adsorption of chiral organic species can alsoimprint chirality onto an achiral surface by inducing
Received: July 9, 2012Revised: September 27, 2012Published: September 28, 2012
reconstruction of the achiral surface into a naturally chiralstructure such as a high Miller index plane which exposeskinked step edges.6 Such chiral imprinting of achiral surfaceshas been observed during adsorption of L-lysine, HO2CCH-(NH2)(CH2)4NH2, on Cu(100).2,7−9 Under certain conditions,L-lysine adsorbed on Cu(100) can induce the formation ofhomochiral (3,1,17)R facets through step bunching andfaceting. Although there are many examples of the formationof chiral structures on surfaces by adsorption of variousmodifiers,4−15 the observation of enantiospecific adsorption ofchiral probes onto these chiral surfaces is much morechallenging.16,17
Study of enantiospecific surface chemistry requires theadsorption of a chiral probe molecule onto a chiral surfaceand the use of a measurement that will detect the differences inthe interactions of the two probe enantiomers with the twoenantiomers of the surface. There are several types ofenantioselectivity that have been observed by studies of thesurface chemistry of chiral probe molecules on chirally modifiedsurfaces. Tysoe and co-workers have used propylene oxide(PO) as a chiral probe molecule to investigate theenantioselectivity of Pd(111) surfaces modified by a varietyof chiral adsorbates including R- and S-2-butanol.17−20 For agiven exposure of R- or S-PO to the chirally modified Pd(111)surface, the resulting coverages of adsorbed R- or S-PO areenantiospecific. Complementing the work on chirally modifiedsurfaces is a body of work studying the enantiospecificadsorption of chiral probe molecules on naturally chiralsurfaces.1 The first experimental observation of enantiospecificchemistry on naturally chiral surfaces was made by Attard et al.while studying the electro-oxidation of D- and L-glucose on thePt(643)R&S surfaces.21 They found that the Pt(643)S surfaceexhibited a greater reactivity with L-glucose than with D-glucose.Enantioselective behavior of chiral adsorbates on naturallychiral surfaces was also demonstrated by Gellman and co-workers with their temperature programmed desorption (TPD)studies of R- and S-propylene oxide and R-3-methylcyclohex-anone on the Cu(643)R&S surfaces.22−24 These studies revealeddifferences in adsorption energies on the Cu(643)R&S surfaces,providing a direct illustration of the enantiospecific propertiesof naturally chiral metal surfaces. More recently, the adsorptionof D- and L-cysteine on a chiral Au(17,11,9)S surface wasstudied using X-ray photoelectron spectroscopy (XPS) andrevealed enantiospecific core level binding energies in theamino and in the thiol group.25 Held et al. also reportedenantiospecific adsorption of alanine on chiral Cu(531)R&S
surfaces using XPS, low-energy electron diffraction (LEED),and near edge X-ray absorption fine structure spectroscopy(NEXAFS).26
Amino acids have long been identified as potentially usefulchiral modifiers for catalytic surfaces. They possess two mainfunctional groups (a carboxylic acid group (COOH) and anamine group (NH2)), either one or both of which couldcontribute to the bonding to metal surfaces. Some amino acidshave reactive side chains (e.g., the thiol group (−SH) incysteine and the additional amine group in lysine) which couldalso be involved in their bonding to surfaces. Several researchgroups conducted infrared reflection absorption spectroscopy(IRAS) and XPS experiments under ultrahigh vacuumconditions to study the adsorbed state of glycine, alanine,proline, and other amino acids on single crystal Cu surfaces.27,28
These amino acids were always found to be in their anionic,deprotonated form when adsorbed on the Cu surface.
Moreover, under certain conditions, these amino acids werefound to self-assemble into ordered superstructures heldtogether by networks of intermolecular hydrogen bonds.Some of these ordered phases possess chirality which can besustained wide domains on the surface.11,27,28 In some cases,amino acids can induce reconstruction of achiral Cu surfaces bypromoting step bunching and formation of high Miller indexfacets with kink structures that are naturally chiral.7−9
One of the most interesting chirally modified surfaces is theL-lysine modified Cu(100) surface used in this work. Theadsorption of L-lysine on the Cu(100) surface was studied withscanning tunneling microscopy (STM).7−9 After annealing at430 K, a high coverage of L-lysine formed a (4 1, −2 4)overlayer structure. During annealing, monatomic steps on thesurface bunch together to form chiral (3,1,17) facets. On theCu(100) surfaces, there are eight possible (3,1,17) chiral facetswith structures related by reflection and rotation symmetry:four of R-chirality and four of S-chirality. Zhao et al.7−9 foundonly the four (3,1,17) facets with R-chirality, indicating that theL-lysine had imprinted its chirality onto the achiral Cu(100)surface. Recently, we have studied the adsorption energetics ofD- and L-lysine on Cu(100) and Cu(3,1,17)R&S and shown thatthey are consistent with the observations of enantiospecificchiral imprinting by Zhao et al.2,7−9 The D- and L-lysineadsorption energies on Cu(3,1,17)R&S exhibit diastereomerism,with L-lysine having a higher adsorption energy on theCu(3,1,17)R surface than on the Cu(3,1,17)S surface. Theseobservations suggest that chiral imprinting by chiral adsorbatescould serve as a route to the production of naturally chiralmetal surfaces.In this work, we have used TPD to probe the
enantiospecificity of R- and S-PO adsorption on lysine modifiedCu(100). Enantiomerically pure R- or S-PO was adsorbed ontothe D- or L-lysine modified Cu(100) surface using a range ofboth probe and modifier coverages. Titration using 13CO wasused to quantify the coverage of empty sites, θO, on the surfaceafter lysine adsorption. R- and S-PO TPD measurements revealenantiospecific peak desorption temperatures when the emptysite density is in the range θO = 0−0.5 monolayer (where 1 MLis defined as the density of Cu atoms in the Cu(100) surface).These exhibit true diastereomersim on the D- and L-lysinemodified Cu(100) surfaces. The enantiospecific difference inthe PO peak desorption temperatures is 5.5 K at θO ≈ 0.25 andcorresponds to an enantiospecific desorption energy differenceof ∼2 kJ/mol. This result is in stark contrast to our previousfailure to observe enantiospecific adsorption of either PO or R-3-methylcyclohexanone on Cu(100) and Cu(111) surfacesmodified with a variety of chiral species including 2-butanol, 2-butanoxy, alanine, and alaninol.16 We suggest that the potentialfor hydrogen bonding between the lysine modifier and the POprobe is a key difference that might account for theenantiospecific adsorption observed in this work.
2. EXPERIMENTAL SECTIONThe experiments were performed in a stainless steel ultrahigh vacuum(UHV) chamber with a base pressure of 2 × 10⁻¹⁰ Torr. The chamberis equipped with a quadrupole mass spectrometer used for TPDmeasurements, an ion sputter gun to clean the sample by Ar+
bombardment, leak valves to admit gases into the chamber, anevaporative source to sublime amino acids in vacuo, and low energyelectron diffraction (LEED) optics to study the structure of cleansurfaces and adsorbate overlayers.
The Cu(100) single crystal disk of approximately 1 cm diameter wasused as a substrate for adsorption of the lysine modifier followed by
coadsorption of enantiomerically pure PO or 13CO. Only one side ofthe Cu(100) sample was used in the adsorption studies. The Cu(100)sample was spot-welded between two Ta wires mounted to a sampleholder at the bottom of a manipulator. The sample could be resistivelyheated to >1000 K and cooled to <100 K using liquid-nitrogen. Thesample temperature was measured with a chromel-alumel thermo-couple spot-welded to the edge of the Cu(100) sample via a thin stripof Ni foil. During heating and cooling, the sample temperature wascontrolled by a computer.
L- and D-Lysine (Sigma-Aldrich, NH2(CH2)4−CH(NH2)−COOH,≥98% purity) were deposited onto the Cu(100) surface bysublimation from an evaporative source consisting of lysine in aglass vial which was heated resistively by nichrome wire. The dosing isperformed with a direct line of sight between the source and theCu(100) surface. Prior to the dosing the glass vial was heated forroughly 1 h to reach a steady state temperature. The deposition ratewas controlled by the sublimation temperature which was measuredand controlled using a chromel-alumel thermocouple connected to adigital PID-temperature controller (Micromega). The real exposure ofthe Cu(100) sample to lysine vapor could not be determined based onmeasurements of changes in the background pressure in the UHVchamber. Instead exposures are reported in terms of exposure time, i.e.the period of time that the Cu(100) sample was exposed to the lysinevapor emerged from the evaporative source held at 373 K. Thisexposure time is controlled by opening and closing of a shutter placedin front of the evaporative source.PO vapors were introduced into the UHV chamber through a leak
valve. Enantiomerically pure and racemic PO (Alfa Aesar, C3H6O,99%) were first transferred to clean glass vials and subjected tomultiple freeze−pump−thaw cycles to remove air, water vapor, andother high vapor pressure impurities. The purity of the chemical wasverified by mass spectrometry before use. Exposures are reported inunits of Langmuirs (L) where 1 L = 10−6 Torr·s.Isotopically labeled 13CO gas (Isotec, 99 atom % 13C, <5 atom %
18O) and Ar gas (Matheson, 99.995% purity) were taken from highpressure lecture bottles and were also introduced into the vacuumchamber via leak valves. The purity of each gas was verified by massspectrometry before use. The 13CO was used to estimate the coverageof bare surface sites on Cu(100) surfaces modified by submonolayercoverages of adsorbed lysine. This 13CO titration method waspreviously employed elsewhere to estimate the coverage of adsorbedamino acids, for example, glycine, alanine, and proline, on the Pd(111)surface.29−31
The Cu(100) surface was cleaned by repeated cycles of 1 keV Ar+
ion sputtering while annealing at 750 K for 500 s. The sample was then
cooled at a controlled rate of −1 K/s, until the clean surface yielded asharp LEED pattern. Following the adsorption of lysine and annealingto the desired temperature, the overlayer structure was determinedusing LEED. TPD was used to study the adsorption and desorption oflysine on Cu(100) and to study the coadsorption of 13CO, racemicPO, R-PO, or S-PO with D- or L-lysine on the Cu(100) surfaces.Following adsorption of the desired compound(s) at an appropriateadsorption temperature, the sample was positioned in front of theaperture to a quadrupole mass spectrometer used for TPDmeasurements. TPD spectra were obtained by heating the Cu(100)surface at a constant rate while using the quadrupole massspectrometer to monitor the rate of desorption of various speciesfrom the surface. The heating rate was 1 K/s unless otherwisespecified.
3. RESULTS3.1. Adsorption of Lysine on Cu(100). 3.1.1. TPD
Spectra of Lysine from Cu(100). Prior to studyingenantiospecific adsorption on Cu(100) modified with lysine,it was necessary to characterize the adsorption and surfacechemistry of the lysine modifier alone on the clean achiralCu(100) surface. The desorption and decomposition of L-lysineon the Cu(100) surface were studied by TPD and LEED. Theclean Cu(100) surface was initially held at 300 K and thenexposed to L-lysine vapor sublimed at 373 K. The signals atvarious mass-to-charge ratios (m/q = 2, 28, 30, 44, 52, 56, 67,84) were monitored with the mass spectrometer while thesample was heated at 1 K/s. Figure 1a displays the TPD spectrarecorded by monitoring the signal at m/q = 30 (the mostintense signal in the L-lysine fragmentation pattern) followingincreasing exposures of the Cu(100) surface to L-lysine. For L-lysine exposures of <150 s, there is no evidence of moleculardesorption from the surface. Starting at an exposure of ∼200 s,an L-lysine desorption feature appears at 430 K. The peaksaturates at an exposure of about 400 s having shifted to a peaktemperature of approximately 445 K. This desorption featurehas the fragmentation pattern of molecular L-lysine and isattributed to molecular desorption from the first-layer.Desorption peaks at temperatures of 345 and 360 K were
also observed in the signal at m/q = 30 following L-lysineexposures > 200 s. Both of these peaks have fragmentationpatterns matching that of L-lysine and are attributed to
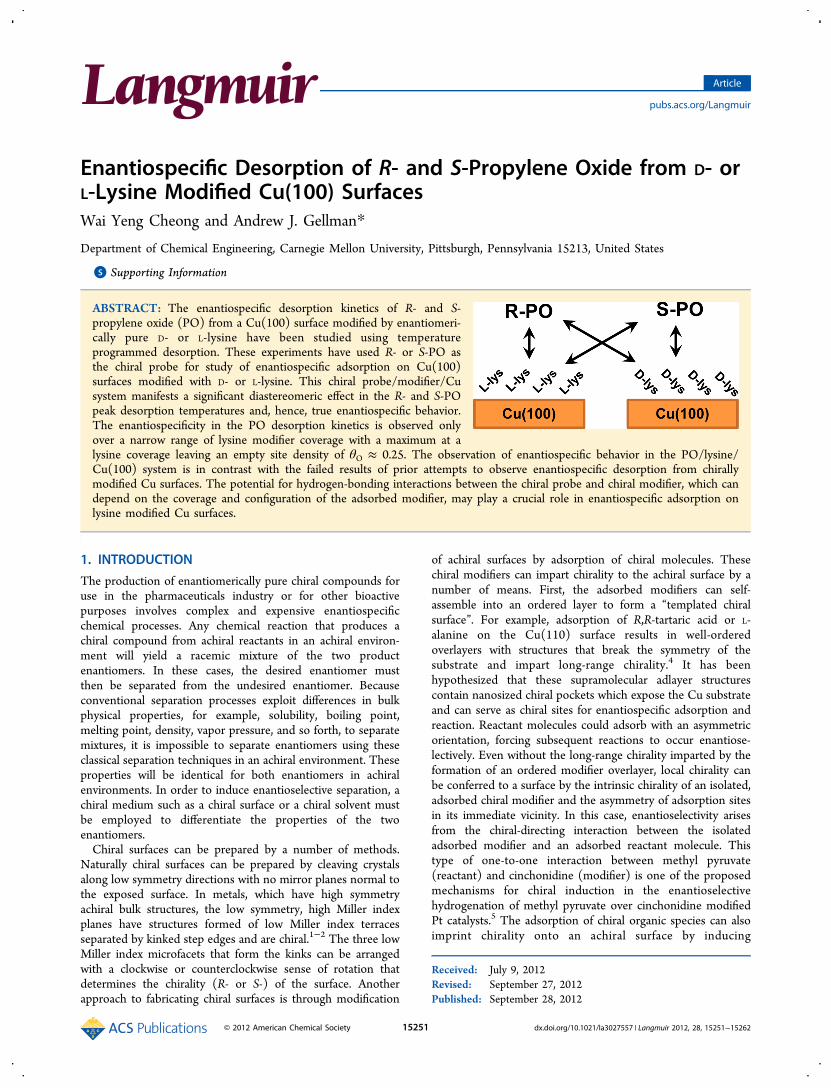
Figure 1. TPD spectra for L-lysine on Cu(100). (a) Temperature programmed desorption (TPD) spectra of L-lysine from the Cu(100) surfacefollowing increasing L-lysine exposure times of 50, 200, 300, 400, 500, 600, and 800 s. The signals at were monitored at m/q = 30, and the heatingrate was 1 K/s. Four peaks are present in the TPD spectra obtained following exposures > 500 s: desorption of L-lysine from step defects (∼470 K),first-layer desorption (∼445 K), and multilayer desorption (345, 360 K) from the Cu(100) terrace. (b) TPD spectra following exposure of Cu(100)to L-lysine for 50 s obtained by monitoring the signals at m/q = 2, 28, 44, 52. No desorption of intact lysine at m/q = 30 was detected in the TPDexperiment. Curves are offset for clarity.
desorption of molecular L-lysine from adsorbed multilayers.The interesting characteristic of the desorption peak at 345 K isthat it grows and saturates concurrently with the first-layerdesorption peak at 445 K. This suggests that L-lysine adsorbs onthe Cu(100) surface in a bilayer structure even at submonolayercoverages. The peak at 360 K appears at exposures ≥500 s anddoes not saturate with increasing exposure. This peak at 360 Kis attributed to sublimation of bulk-like multilayer L-lysine. Theappearance of a 345 K L-lysine desorption feature attemperatures below that of the bulk-like L-lysine multilayer isquite unusual.There is a small, high temperature peak at ∼470 K in the
TPD spectra of L-lysine from Cu(100) shown in Figure 1a.Recently published work has shown that this feature occurs atthe same temperature as the desorption of L-lysine from theCu(3,1,17)R surface.2 Hence, this feature on the Cu(100)surface is attributed to the desorption of L-lysine from stepdefects on the Cu(100) surface.No molecular L-lysine desorption was observed at exposures
<200 s (Figure 1a), suggesting that at low coverages most L-lysine must adsorb irreversibly on the Cu(100) surface andundergo decomposition during heating. Figure 1b shows theTPD spectra recorded using signals at m/q = 2, 28, 44, 52following exposure of Cu(100) to L-lysine for 50 s. These TPDprofiles show complex behavior at temperatures above the first-layer desorption temperature of 445 K, indicating that at lowcoverage adsorbed L-lysine undergoes a series of thermaldecomposition reactions during heating to generate decom-position products including H2 and CO2. Even at the highestexposure when bulk multilayers of lysine have formed, afraction of the adsorbed lysine undergoes decomposition whilethe remainder desorbs molecularly during heating. A number ofdecomposition products have been identified on the basis of aTPD experiment in which all m/q ratios from 1 to 150 weremonitored during L-lysine decomposition on Cu(100)following an exposure of 500 s. That experiment resulted inthe detection of a number of species desorbing from the surfacein the temperature range 450 − 600 K. These included: NH3(m/q = 17), H2 (m/q = 2), C4H4 and/or C2N2 (m/q = 52),C2H4, CO and/or N2 (m/q = 28), CO2 (m/q = 44), HCN (m/q = 27) and H2O (m/q = 18). These decomposition productsare generally consistent with the observations of thermal
decomposition of other amino acids, for example, glycine,alanine, and proline, on other metal surfaces.29−32
TPD experiments were also performed for a range of D-lysinecoverages on the Cu(100) surface. Desorption of L- and D-lysine from Cu(100) should not be enantiospecific because anachiral surface should not distinguish the two enantiomers.Indeed, TPD spectra for D-lysine on Cu(100) were notsignificantly different from those acquired under the sameconditions for L-lysine on the Cu(100) surface.
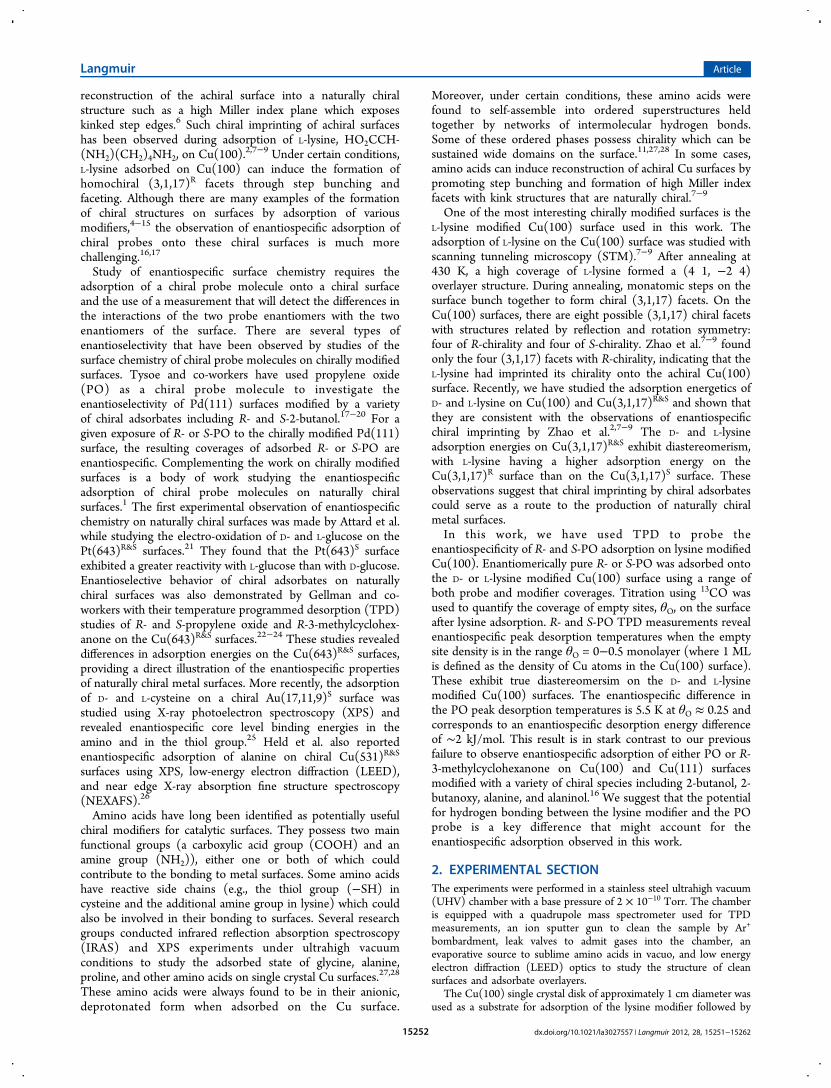
3.1.2. LEED from L-Lysine on Cu(100). The ordering of theL-lysine overlayer on Cu(100) was studied using LEED. L-lysinewas sublimed from the evaporative doser at 373 K while theCu(100) surface was held at 300 K. Following exposure to L-lysine for 400−600 s to saturate the adsorbed monolayer, thesurface was annealed at 430 K for 20 min. The LEEDexperiments used a low beam energy of 33 eV because aminoacid overlayers are very sensitive to electron beam damage.Figure 2a shows the LEED pattern obtained from the L-lysineoverlayer. The diffraction spots in this LEED pattern matchthose shown in Figure 2b which displays the reciprocal lattice ofa c(2 × 4) overlayer with two domains. The corresponding c(2× 4) real space lattice is illustrated in Figure 2c. The formationof a c(2 × 4) overlayer has also been reported for theadsorption of other amino acids, e.g. glycine, alanine,phenylalanine, on the Cu(100) surface.9
Now the question is, what adsorption geometry of lysinewould be allowed in this c(2 × 4) unit cell? The c(2 × 4) unitcell has dimensions of 5.11 Å × 10.22 Å and the length of lysineis ∼13 Å.7,33 The rhombohedral primitive unit cell also has longand short dimensions of 5.11 Å × 10.22 Å but half the area ofthe c(2 × 4) unit cell. Hence, contrary to the adsorption modelproposed by Zhao et al.,7 it is unlikely that the primitive unitcell would allow bonding via both carboxylate O atoms and theamino N atoms at either end of the adsorbed lysine molecules.In order to allow an amino acid such as lysine with a bulky sidegroup to adopt a c(2 × 4) overlayer structure, it is likely thatthe side chain is tilted away from the surface and that the aminoN atom in the side group is not involved in bonding to theCu(100) surface. This is consistent with the adsorptiongeometry proposed in a previous study of lysine on Cu(110).34
3.2. Estimation of Empty Site Density on LysineModified Cu(100). 13CO adsorption has been used to quantify
Figure 2. c(2 × 4) phase of the L-lysine on Cu(100). (a) LEED pattern at 3 eV of the c(2 × 4) L-lysine overlayer on the Cu(100) surface obtainedafter annealing the saturated monolayer at 430 K for 20 min. (b) Schemtic representation of the LEED pattern in (a). “●” denotes the (0,0) spotwhile “◆” and “•” are the overlayer diffractions spots for two domains. (c) The real space lattice corresponding one domain of the LEED pattern in(a) and the reciprocal lattice in (b).
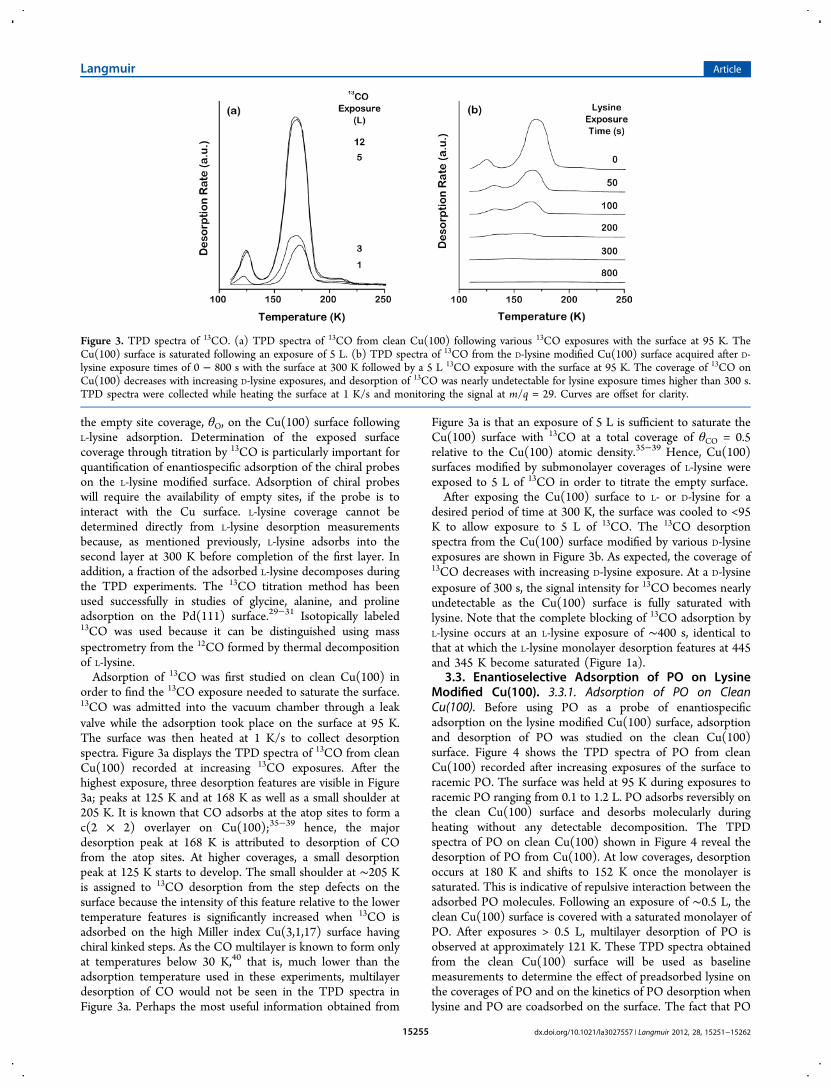
the empty site coverage, θO, on the Cu(100) surface followingL-lysine adsorption. Determination of the exposed surfacecoverage through titration by 13CO is particularly important forquantification of enantiospecific adsorption of the chiral probeson the L-lysine modified surface. Adsorption of chiral probeswill require the availability of empty sites, if the probe is tointeract with the Cu surface. L-lysine coverage cannot bedetermined directly from L-lysine desorption measurementsbecause, as mentioned previously, L-lysine adsorbs into thesecond layer at 300 K before completion of the first layer. Inaddition, a fraction of the adsorbed L-lysine decomposes duringthe TPD experiments. The 13CO titration method has beenused successfully in studies of glycine, alanine, and prolineadsorption on the Pd(111) surface.29−31 Isotopically labeled13CO was used because it can be distinguished using massspectrometry from the 12CO formed by thermal decompositionof L-lysine.Adsorption of 13CO was first studied on clean Cu(100) in
order to find the 13CO exposure needed to saturate the surface.13CO was admitted into the vacuum chamber through a leakvalve while the adsorption took place on the surface at 95 K.The surface was then heated at 1 K/s to collect desorptionspectra. Figure 3a displays the TPD spectra of 13CO from cleanCu(100) recorded at increasing 13CO exposures. After thehighest exposure, three desorption features are visible in Figure3a; peaks at 125 K and at 168 K as well as a small shoulder at205 K. It is known that CO adsorbs at the atop sites to form ac(2 × 2) overlayer on Cu(100);35−39 hence, the majordesorption peak at 168 K is attributed to desorption of COfrom the atop sites. At higher coverages, a small desorptionpeak at 125 K starts to develop. The small shoulder at ∼205 Kis assigned to 13CO desorption from the step defects on thesurface because the intensity of this feature relative to the lowertemperature features is significantly increased when 13CO isadsorbed on the high Miller index Cu(3,1,17) surface havingchiral kinked steps. As the CO multilayer is known to form onlyat temperatures below 30 K,40 that is, much lower than theadsorption temperature used in these experiments, multilayerdesorption of CO would not be seen in the TPD spectra inFigure 3a. Perhaps the most useful information obtained from
Figure 3a is that an exposure of 5 L is sufficient to saturate theCu(100) surface with 13CO at a total coverage of θCO = 0.5relative to the Cu(100) atomic density.35−39 Hence, Cu(100)surfaces modified by submonolayer coverages of L-lysine wereexposed to 5 L of 13CO in order to titrate the empty surface.After exposing the Cu(100) surface to L- or D-lysine for a
desired period of time at 300 K, the surface was cooled to <95K to allow exposure to 5 L of 13CO. The 13CO desorptionspectra from the Cu(100) surface modified by various D-lysineexposures are shown in Figure 3b. As expected, the coverage of13CO decreases with increasing D-lysine exposure. At a D-lysineexposure of 300 s, the signal intensity for 13CO becomes nearlyundetectable as the Cu(100) surface is fully saturated withlysine. Note that the complete blocking of 13CO adsorption byL-lysine occurs at an L-lysine exposure of ∼400 s, identical tothat at which the L-lysine monolayer desorption features at 445and 345 K become saturated (Figure 1a).
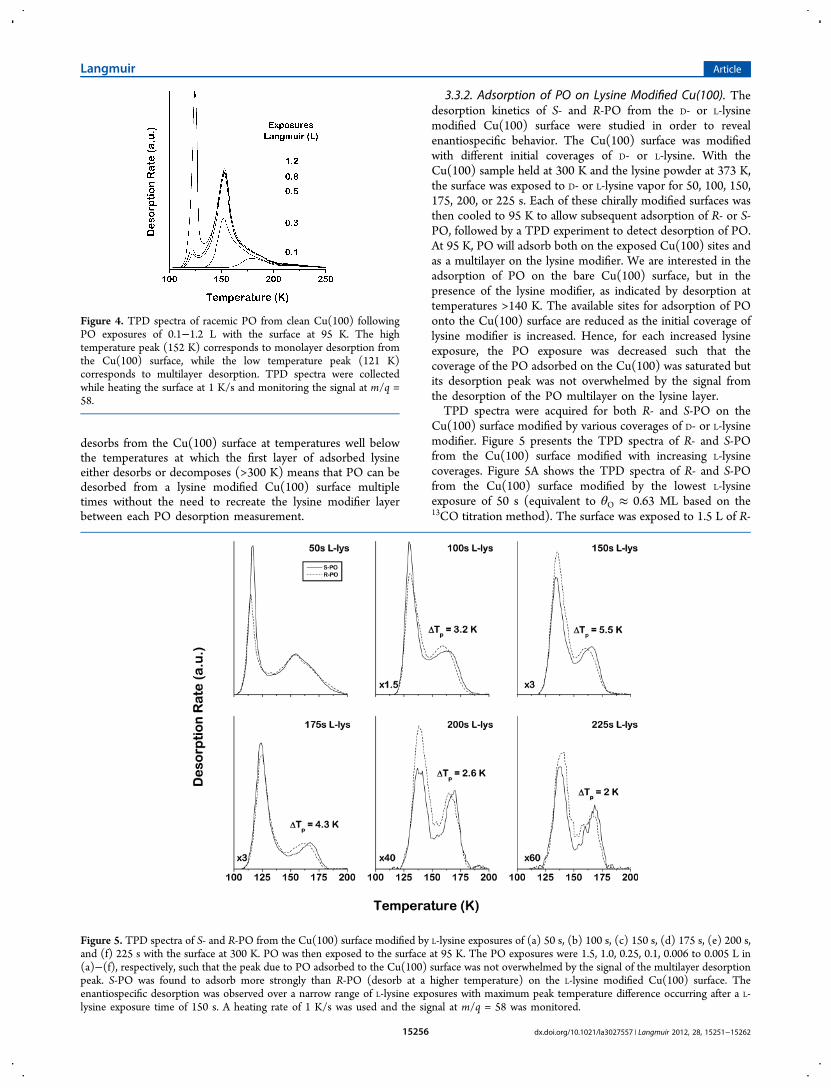
3.3. Enantioselective Adsorption of PO on LysineModified Cu(100). 3.3.1. Adsorption of PO on CleanCu(100). Before using PO as a probe of enantiospecificadsorption on the lysine modified Cu(100) surface, adsorptionand desorption of PO was studied on the clean Cu(100)surface. Figure 4 shows the TPD spectra of PO from cleanCu(100) recorded after increasing exposures of the surface toracemic PO. The surface was held at 95 K during exposures toracemic PO ranging from 0.1 to 1.2 L. PO adsorbs reversibly onthe clean Cu(100) surface and desorbs molecularly duringheating without any detectable decomposition. The TPDspectra of PO on clean Cu(100) shown in Figure 4 reveal thedesorption of PO from Cu(100). At low coverages, desorptionoccurs at 180 K and shifts to 152 K once the monolayer issaturated. This is indicative of repulsive interaction between theadsorbed PO molecules. Following an exposure of ∼0.5 L, theclean Cu(100) surface is covered with a saturated monolayer ofPO. After exposures > 0.5 L, multilayer desorption of PO isobserved at approximately 121 K. These TPD spectra obtainedfrom the clean Cu(100) surface will be used as baselinemeasurements to determine the effect of preadsorbed lysine onthe coverages of PO and on the kinetics of PO desorption whenlysine and PO are coadsorbed on the surface. The fact that PO
Figure 3. TPD spectra of 13CO. (a) TPD spectra of 13CO from clean Cu(100) following various 13CO exposures with the surface at 95 K. TheCu(100) surface is saturated following an exposure of 5 L. (b) TPD spectra of 13CO from the D-lysine modified Cu(100) surface acquired after D-lysine exposure times of 0 − 800 s with the surface at 300 K followed by a 5 L 13CO exposure with the surface at 95 K. The coverage of 13CO onCu(100) decreases with increasing D-lysine exposures, and desorption of 13CO was nearly undetectable for lysine exposure times higher than 300 s.TPD spectra were collected while heating the surface at 1 K/s and monitoring the signal at m/q = 29. Curves are offset for clarity.
desorbs from the Cu(100) surface at temperatures well belowthe temperatures at which the first layer of adsorbed lysineeither desorbs or decomposes (>300 K) means that PO can bedesorbed from a lysine modified Cu(100) surface multipletimes without the need to recreate the lysine modifier layerbetween each PO desorption measurement.
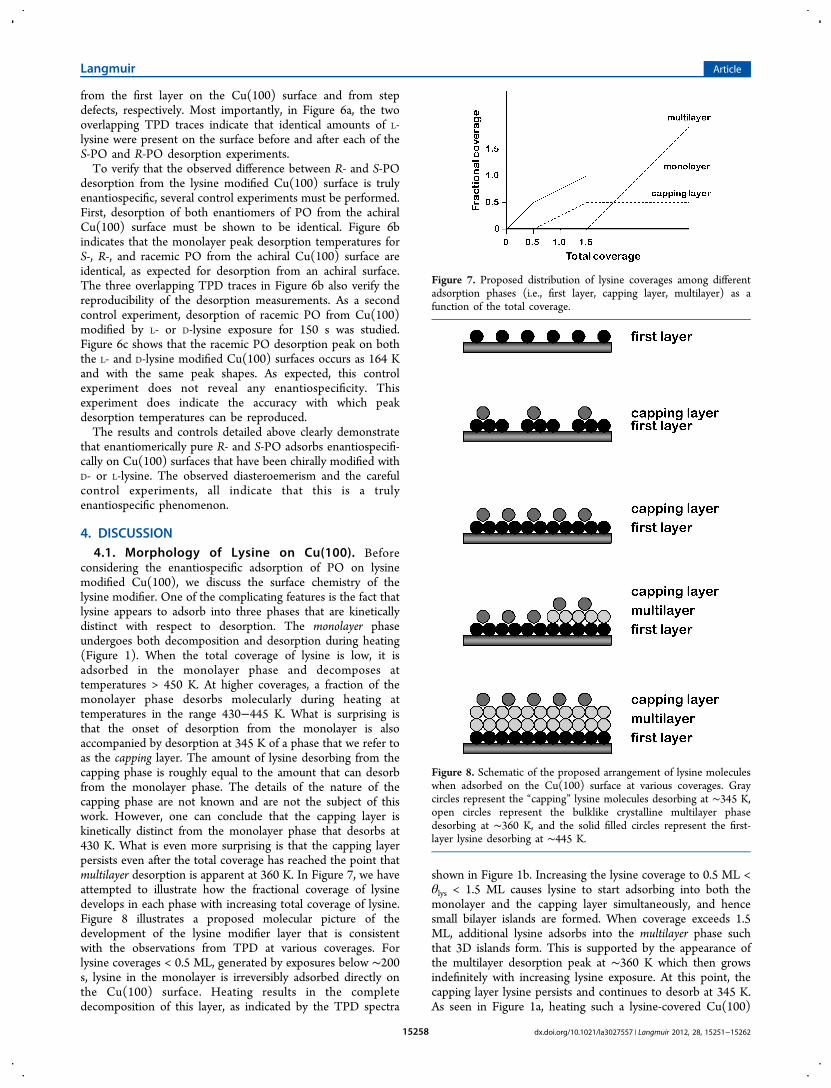
3.3.2. Adsorption of PO on Lysine Modified Cu(100). Thedesorption kinetics of S- and R-PO from the D- or L-lysinemodified Cu(100) surface were studied in order to revealenantiospecific behavior. The Cu(100) surface was modifiedwith different initial coverages of D- or L-lysine. With theCu(100) sample held at 300 K and the lysine powder at 373 K,the surface was exposed to D- or L-lysine vapor for 50, 100, 150,175, 200, or 225 s. Each of these chirally modified surfaces wasthen cooled to 95 K to allow subsequent adsorption of R- or S-PO, followed by a TPD experiment to detect desorption of PO.At 95 K, PO will adsorb both on the exposed Cu(100) sites andas a multilayer on the lysine modifier. We are interested in theadsorption of PO on the bare Cu(100) surface, but in thepresence of the lysine modifier, as indicated by desorption attemperatures >140 K. The available sites for adsorption of POonto the Cu(100) surface are reduced as the initial coverage oflysine modifier is increased. Hence, for each increased lysineexposure, the PO exposure was decreased such that thecoverage of the PO adsorbed on the Cu(100) was saturated butits desorption peak was not overwhelmed by the signal fromthe desorption of the PO multilayer on the lysine layer.TPD spectra were acquired for both R- and S-PO on the
Cu(100) surface modified by various coverages of D- or L-lysinemodifier. Figure 5 presents the TPD spectra of R- and S-POfrom the Cu(100) surface modified with increasing L-lysinecoverages. Figure 5A shows the TPD spectra of R- and S-POfrom the Cu(100) surface modified by the lowest L-lysineexposure of 50 s (equivalent to θO ≈ 0.63 ML based on the13CO titration method). The surface was exposed to 1.5 L of R-
Figure 4. TPD spectra of racemic PO from clean Cu(100) followingPO exposures of 0.1−1.2 L with the surface at 95 K. The hightemperature peak (152 K) corresponds to monolayer desorption fromthe Cu(100) surface, while the low temperature peak (121 K)corresponds to multilayer desorption. TPD spectra were collectedwhile heating the surface at 1 K/s and monitoring the signal at m/q =58.
Figure 5. TPD spectra of S- and R-PO from the Cu(100) surface modified by L-lysine exposures of (a) 50 s, (b) 100 s, (c) 150 s, (d) 175 s, (e) 200 s,and (f) 225 s with the surface at 300 K. PO was then exposed to the surface at 95 K. The PO exposures were 1.5, 1.0, 0.25, 0.1, 0.006 to 0.005 L in(a)−(f), respectively, such that the peak due to PO adsorbed to the Cu(100) surface was not overwhelmed by the signal of the multilayer desorptionpeak. S-PO was found to adsorb more strongly than R-PO (desorb at a higher temperature) on the L-lysine modified Cu(100) surface. Theenantiospecific desorption was observed over a narrow range of L-lysine exposures with maximum peak temperature difference occurring after a L-lysine exposure time of 150 s. A heating rate of 1 K/s was used and the signal at m/q = 58 was monitored.
or S-PO and then heated at 1 K/s to obtain the TPD spectra.The TPD spectra of R- and S-PO were found to be qualitativelysimilar to those obtained from the clean Cu(100) surface, asshown in Figure 4. The multilayer peak desorbs at 121 K andthe monolayer desorbs over the range 140−190 K. There areno observable differences between the desorption features ofthe R- and the S-PO. The differences in the amplitudes of themultilayer peaks are attributed to differences in multilayercoverage arising from small differences in the PO exposure. Weare concerned only with the monolayer desorption featureswhich are highly reproducible because the PO exposure issufficient to saturate the available empty sites on the Cu(100)surface. Investigations of the enantiospecific desorption of R-and S-PO were performed with an L-lysine exposure time of100 s, resulting in an empty site coverage of θO ≈ 0.40 ML.Figure 5b shows the PO TPD spectra obtained after exposingthis L-lysine modified surface to 1 L of R- or S-PO. The S-POmonolayer was observed to desorb at a temperature that wasΔTp = 3.2 K higher than the R-PO monolayer. Increasing the L-lysine exposure time to 150 s (θO ≈ 0.25 ML) further enhancesthe difference in the desorption kinetics of R- and S-PO. TheTPD spectra shown in Figure 5c collected after a PO exposureof 0.25 L revealed a peak desorption temperature difference ofΔTp = 5.5 K. This was the largest peak desorption temperaturedifference obtained for R- and S-PO desorption from the L-lysine modified Cu(100) surface. Further increasing the L-lysineexposure times to 175, 200, and 225 s resulted in the values ofΔTp decreasing to 4.3 K, 2.6, and 2 K, respectively (Figure 5d−f). Note that, as the coverage of L-lysine on the Cu(100) surfaceincreases, the coverage of empty sites at which the POmonolayer can adsorb decreases until the monolayerdesorption peak becomes so small that it is impossible tomeasure ΔTp accurately.While coadsorption of lysine and PO on the Cu(100) surface
did not qualitatively affect the desorption features of PO, themonolayer peak desorption temperature of PO appeared to behigher with the lysine modifier on the surface than without. Asseen in Figure 5, the monolayer desorption peaks of both S-and R-PO shift to higher temperature (from 154 to 168 K) withincreasing lysine exposure. This indicates that interaction
between coadsorbed PO and the lysine modifier in the firstlayer must be attractive, resulting in a higher desorption energyof PO than from the clean Cu(100) surface. In fact, thisinteraction between PO and lysine modifier is not limited tothe first layer. The desorption peaks at 135 K in Figure 5b, c, e,f were attributed to desorption of PO molecules on top of thelysine modifiers. These PO molecules desorb at temperatureshigher than the PO multilayer desorption temperature (121 K)but lower than the monolayer desorption temperature (154 to168 K). More importantly, the multilayer peak desorptiontemperature shift from 130 to 138 K with increasing lysineexposure indicating that there are attractive interactionsbetween PO in the second layer and the lysine modifier layer.In order to demonstrate that the R- and S-PO desorption
peak shifts shown in Figure 5 arise from enantiospecificity, it isnecessary to demonstrate the same, but opposite peak shifts onthe Cu(100) surface modified by D-lysine. PO TPD experi-ments were performed on the D-lysine modified Cu(100)surface under the same conditions as used for the experimentson L-lysine modified Cu(100) shown in Figure 5. When usingD-lysine modified Cu(100), R-PO has a higher desorptiontemperature than S-PO, opposite to the observations on the L-lysine modified Cu(100) surface. Thus, R- and S-PO desorptionfrom Cu(100) surface modified by D- and L-lysine exhibits truediastereomerism and must arise from enantiospecific adsorbate-modifier interactions.As sputtering was performed between the experiments with
different lysine coverages (Figure 5) and a new layer of D- or L-lysine was adsorbed on the surface, it is important to verify thatthe same amount of D- or L-lysine modifier was present on thesurface during adsorption of S-PO and R-PO for a particularlysine exposure. A TPD spectrum of the adsorbed lysine wasobtained after each experiment adsorbing and desorbing S- orR-PO. To demonstrate the reproducibility of the lysinecoverage, Figure 6a shows the TPD spectra of L-lysine obtainedfollowing exposure to L-lysine for 150 s and an R- or S-POexposure of 0.25 L. Figure 6a is identical (but greatlymagnified) to the desorption peaks of lysine at low exposure(<200 s) in Figure 1. As explained earlier, the two peaks at∼430 and 470 K in Figure 6a are attributed to lysine desorption
Figure 6. Reproducibility and control experiments. (a) TPD of L-lysine recorded following exposure to L-lysine for 150 s at 300 K and an S- or R-POexposure of 0.25 L at 95 K. The two overlapping TPD traces reveal identical amounts of L-lysine adsorbed on the surface before adsorption of S-POand R-PO in separate experiments. TPD measurements were performed at a heating rate of 1 K/s while monitoring the signal at m/q = 30. (b) TPDof S- PO, R-PO and racemic PO from the clean Cu(100) surface following PO exposures of 2 L. As expected for desorption from an achiral surface,the three overlapping TPD traces have identical monolayer peak desorption temperatures at ∼152 K. (c) TPD of racemic PO from the Cu(100)surface modified by exposure to L- or D-lysine for 150 s at 300 K following a rac-PO exposure of 0.25 L at 95 K. As expected for desorption of aracemic mixture with no net chirality, these two TPD traces reveal almost identical monolayer peak desorption temperatures of 164 K. TPD spectrawere collected at a heating rate of 1 K/s while monitoring the signal at m/q = 58.
from the first layer on the Cu(100) surface and from stepdefects, respectively. Most importantly, in Figure 6a, the twooverlapping TPD traces indicate that identical amounts of L-lysine were present on the surface before and after each of theS-PO and R-PO desorption experiments.To verify that the observed difference between R- and S-PO
desorption from the lysine modified Cu(100) surface is trulyenantiospecific, several control experiments must be performed.First, desorption of both enantiomers of PO from the achiralCu(100) surface must be shown to be identical. Figure 6bindicates that the monolayer peak desorption temperatures forS-, R-, and racemic PO from the achiral Cu(100) surface areidentical, as expected for desorption from an achiral surface.The three overlapping TPD traces in Figure 6b also verify thereproducibility of the desorption measurements. As a secondcontrol experiment, desorption of racemic PO from Cu(100)modified by L- or D-lysine exposure for 150 s was studied.Figure 6c shows that the racemic PO desorption peak on boththe L- and D-lysine modified Cu(100) surfaces occurs as 164 Kand with the same peak shapes. As expected, this controlexperiment does not reveal any enantiospecificity. Thisexperiment does indicate the accuracy with which peakdesorption temperatures can be reproduced.The results and controls detailed above clearly demonstrate
that enantiomerically pure R- and S-PO adsorbs enantiospecifi-cally on Cu(100) surfaces that have been chirally modified withD- or L-lysine. The observed diasteroemerism and the carefulcontrol experiments, all indicate that this is a trulyenantiospecific phenomenon.
4. DISCUSSION4.1. Morphology of Lysine on Cu(100). Before
considering the enantiospecific adsorption of PO on lysinemodified Cu(100), we discuss the surface chemistry of thelysine modifier. One of the complicating features is the fact thatlysine appears to adsorb into three phases that are kineticallydistinct with respect to desorption. The monolayer phaseundergoes both decomposition and desorption during heating(Figure 1). When the total coverage of lysine is low, it isadsorbed in the monolayer phase and decomposes attemperatures > 450 K. At higher coverages, a fraction of themonolayer phase desorbs molecularly during heating attemperatures in the range 430−445 K. What is surprising isthat the onset of desorption from the monolayer is alsoaccompanied by desorption at 345 K of a phase that we refer toas the capping layer. The amount of lysine desorbing from thecapping phase is roughly equal to the amount that can desorbfrom the monolayer phase. The details of the nature of thecapping phase are not known and are not the subject of thiswork. However, one can conclude that the capping layer iskinetically distinct from the monolayer phase that desorbs at430 K. What is even more surprising is that the capping layerpersists even after the total coverage has reached the point thatmultilayer desorption is apparent at 360 K. In Figure 7, we haveattempted to illustrate how the fractional coverage of lysinedevelops in each phase with increasing total coverage of lysine.Figure 8 illustrates a proposed molecular picture of thedevelopment of the lysine modifier layer that is consistentwith the observations from TPD at various coverages. Forlysine coverages < 0.5 ML, generated by exposures below ∼200s, lysine in the monolayer is irreversibly adsorbed directly onthe Cu(100) surface. Heating results in the completedecomposition of this layer, as indicated by the TPD spectra
shown in Figure 1b. Increasing the lysine coverage to 0.5 ML <θlys < 1.5 ML causes lysine to start adsorbing into both themonolayer and the capping layer simultaneously, and hencesmall bilayer islands are formed. When coverage exceeds 1.5ML, additional lysine adsorbs into the multilayer phase suchthat 3D islands form. This is supported by the appearance ofthe multilayer desorption peak at ∼360 K which then growsindefinitely with increasing lysine exposure. At this point, thecapping layer lysine persists and continues to desorb at 345 K.As seen in Figure 1a, heating such a lysine-covered Cu(100)
Figure 7. Proposed distribution of lysine coverages among differentadsorption phases (i.e., first layer, capping layer, multilayer) as afunction of the total coverage.
Figure 8. Schematic of the proposed arrangement of lysine moleculeswhen adsorbed on the Cu(100) surface at various coverages. Graycircles represent the “capping” lysine molecules desorbing at ∼345 K,open circles represent the bulklike crystalline multilayer phasedesorbing at ∼360 K, and the solid filled circles represent the first-layer lysine desorbing at ∼445 K.
surface results in three desorption peaks at 345, 360, and 445 K.What remains a mystery is why the capping layer, whichapparently has a lower desorption energy than either themonolayer or the multilayer, would be stable against conversioninto either monolayer or multilayer.A previous study of the multilayer growth of benzene on
Ru(001) has reported similar structural arrangement of thetopmost layer, and has provided spectroscopic evidence thatthe crystalline multilayer of benzene is always covered by anamorphous capping layer.41 For such multilayer growth, thiscould mean that a direct transition from the crystallinemultilayer phase to the vacuum is thermodynamically lessfavored than going through a crystalline−amorphous−vacuuminterlayer arrangement.One interesting finding from our LEED study was that the
observed c(2 × 4) overlayer structure induced by high coverageof lysine on Cu(100) after annealing at 430 K did not matchthe previously reported STM results7 which showed a (4 1, −24) overlayer structure on Cu(100) following high L-lysineexposure and annealing at 430 K. Despite our attempts, wewere unable to find conditions for deposition or treatment ofthe L-lysine on Cu(100) that produced the (4 1, −2 4)structure. On the other hand, the c(2 × 4) unit cell has beenobserved for a number of other amino acids on Cu(100).9
From the STM results, it was suggested that the (4 1, −2 4)unit cell allows the bonding of L-lysine to Cu(100) throughboth carboxylate O atoms and both amino N atoms (one in theside chain and the other attached to the chiral carbon).7 Incontrast, our LEED results reveal a c(2 × 4) unit cell that couldnot accommodate the L-lysine molecule with its long side chainlying flat on the surface. If there is one lysine molecule per unitcell, then our reported c(2 × 4) unit cell gives an absolutecoverage of 0.25 lysine molecules per Cu atom. Our proposalfor L-lysine orientation in the first layer, based on the c(2 × 4)unit cell observed after annealing at 430 K, corresponds toadsorption with a closely packed upright stance rather than theflat-lying orientation suggested by Zhao et al.7−9
It is important to note that the conditions for forming thec(2 × 4) structure require annealing a high coverage of lysine at430 K for an extended period of time. At the very least, this willresult in the desorption of the capping layer described above.Given that the onset of the reversible desorption of the lysinemonolayer occurs at ∼430 K, the annealing may induceadditional transformations in the lysine adlayer. Our studies ofenantiospecific lysine adsorption were conducted by coadsorb-ing PO onto adlayers of lysine adsorbed at 300 K. Hence, therelationship between the c(2 × 4) structure and the lysineadlayers on which we have observed enantiospecific adsorptionof PO is not known.4.2. Coverage Dependence of PO Adsorption on
Lysine Modified Cu(100). Given the complexity of lysineadsorption on the Cu(100) surface and the apparentcoexistence of monolayer and capping layer lysine species,defining a coverage of lysine based on the use of TPDexperiments is probably not valuable. Even if this wereattempted, the relationship between lysine coverage and theconcentration of empty sites for PO adsorption would not beobvious. Instead we have titrated the lysine modified Cu(100)surface with 13CO as a means of measuring the loss of emptyadsorption sites as a function of lysine exposure to the surface.CO is known to form a c(2 × 2) layer with a coverage of θCO =0.5 when adsorbed on Cu(100) at 300 K.35−39 Figure 9 plotsthe saturation 13CO yield (■) following adsorption at 95 K on
the Cu(100) surface modified by lysine adsorption at 300 K.These data are taken from the areas under the 13CO TPDspectra in Figure 3b. The dashed line is a fit of the data to afirst-order exponential decay and yields a time constant of 109± 2 s. Figure 9 also shows the yields of R-PO (○) and S-PO(◇) adsorbed to the Cu(100) surface as a function of L-lysineexposure. These data are taken from the TPD spectra in Figure5 using only the area under the high temperature featurescorresponding to PO interacting with the Cu(100) surface. Thecurve fit is also a first-order exponential decay and yields a timeconstant of 65 ± 3 s. The fact that the disappearance of POadsorption sites occurs roughly twice as rapidly as the loss ofCO adsorption sites is simply a reflection of the fact that PO islarger and occupies greater area (more empty sites) in itsadsorbed state than CO.The absolute coverage of CO on the clean Cu(100) surface
and the decay of CO adsorption sites with increasing exposureof the Cu(100) surface to lysine can be used to estimate thefraction of empty sites left as a function of lysine exposure. Thefact that the coverages of both CO and PO have the samefunctional dependence on lysine exposure suggests that this is arelevant way to quantify the coverage of available POadsorption sites. Figure 10 uses this titration of empty sitesas the basis of plotting the enantiospecific PO peak desorptiontemperature differences on the D- and L-lysine modifiedCu(100) surfaces. At empty site coverages of θO < 0.1, thePO desorption signal is too weak to allow accurate measure-ments of enantiospecific desorption temperatures. At emptysite coverages of θO > 0.5, the majority of the adsorbed PO isnot interacting with the coadsorbed lysine and thus theenantiospecificity is low. The maximum in the enantiospeci-ficity of R- and S-PO desorption occurs at a lysine exposure of150 s and corresponds to a coverage of empty sites (as measureby CO titration) of θO ≈ 0.25.
Figure 9. Desorption yields of 13CO (m/q = 29, data from Figure 3)and R- and S-PO (m/q = 58, data from Figure 5) as a function of lysineexposure to the Cu(100) surface. Desorption yields were measured for13CO, R- and S-PO adsorbed in the monolayer to the Cu(100) surfaceand normalized for the clean Cu(100) surface with no lysine exposure.The smooth curves are exponential decay functions characterizing theloss of 13CO and PO adsorption sites as functions of lysine exposure tothe Cu(100) surface.
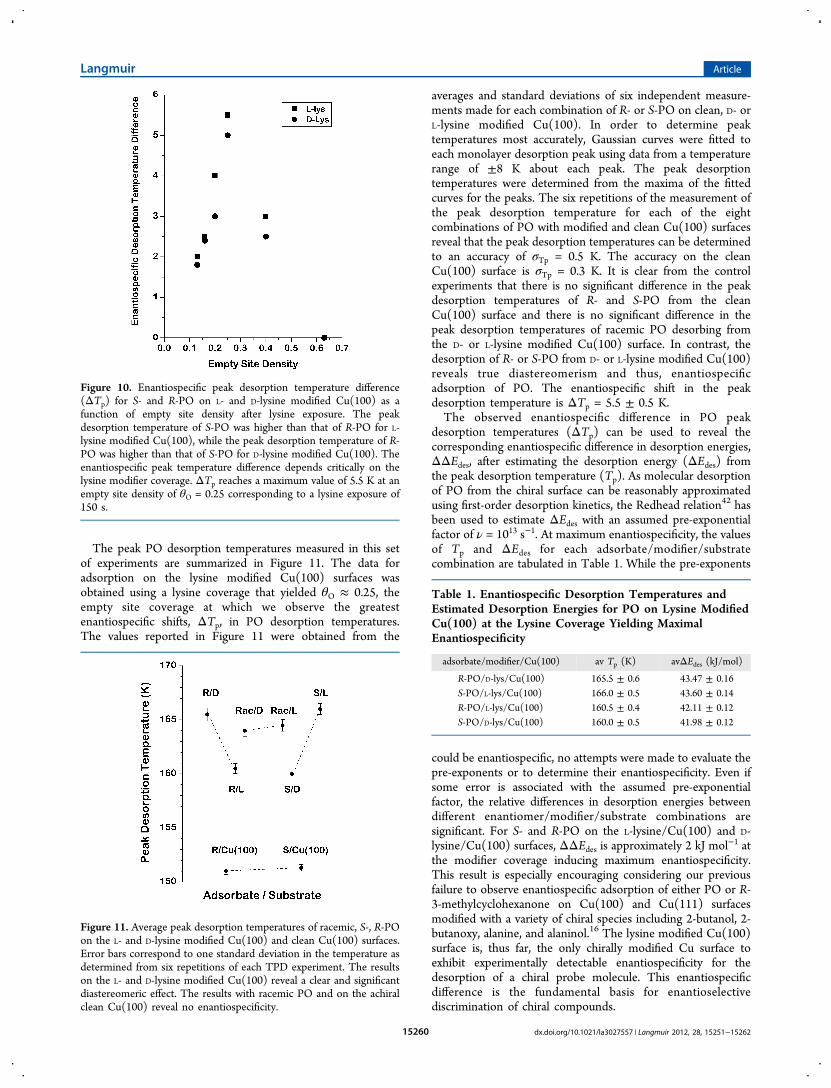
The peak PO desorption temperatures measured in this setof experiments are summarized in Figure 11. The data foradsorption on the lysine modified Cu(100) surfaces wasobtained using a lysine coverage that yielded θO ≈ 0.25, theempty site coverage at which we observe the greatestenantiospecific shifts, ΔTp, in PO desorption temperatures.The values reported in Figure 11 were obtained from the
averages and standard deviations of six independent measure-ments made for each combination of R- or S-PO on clean, D- orL-lysine modified Cu(100). In order to determine peaktemperatures most accurately, Gaussian curves were fitted toeach monolayer desorption peak using data from a temperaturerange of ±8 K about each peak. The peak desorptiontemperatures were determined from the maxima of the fittedcurves for the peaks. The six repetitions of the measurement ofthe peak desorption temperature for each of the eightcombinations of PO with modified and clean Cu(100) surfacesreveal that the peak desorption temperatures can be determinedto an accuracy of σTp = 0.5 K. The accuracy on the cleanCu(100) surface is σTp = 0.3 K. It is clear from the controlexperiments that there is no significant difference in the peakdesorption temperatures of R- and S-PO from the cleanCu(100) surface and there is no significant difference in thepeak desorption temperatures of racemic PO desorbing fromthe D- or L-lysine modified Cu(100) surface. In contrast, thedesorption of R- or S-PO from D- or L-lysine modified Cu(100)reveals true diastereomerism and thus, enantiospecificadsorption of PO. The enantiospecific shift in the peakdesorption temperature is ΔTp = 5.5 ± 0.5 K.The observed enantiospecific difference in PO peak
desorption temperatures (ΔTp) can be used to reveal thecorresponding enantiospecific difference in desorption energies,ΔΔEdes, after estimating the desorption energy (ΔEdes) fromthe peak desorption temperature (Tp). As molecular desorptionof PO from the chiral surface can be reasonably approximatedusing first-order desorption kinetics, the Redhead relation42 hasbeen used to estimate ΔEdes with an assumed pre-exponentialfactor of ν = 1013 s−1. At maximum enantiospecificity, the valuesof Tp and ΔEdes for each adsorbate/modifier/substratecombination are tabulated in Table 1. While the pre-exponents
could be enantiospecific, no attempts were made to evaluate thepre-exponents or to determine their enantiospecificity. Even ifsome error is associated with the assumed pre-exponentialfactor, the relative differences in desorption energies betweendifferent enantiomer/modifier/substrate combinations aresignificant. For S- and R-PO on the L-lysine/Cu(100) and D-lysine/Cu(100) surfaces, ΔΔEdes is approximately 2 kJ mol−1 atthe modifier coverage inducing maximum enantiospecificity.This result is especially encouraging considering our previousfailure to observe enantiospecific adsorption of either PO or R-3-methylcyclohexanone on Cu(100) and Cu(111) surfacesmodified with a variety of chiral species including 2-butanol, 2-butanoxy, alanine, and alaninol.16 The lysine modified Cu(100)surface is, thus far, the only chirally modified Cu surface toexhibit experimentally detectable enantiospecificity for thedesorption of a chiral probe molecule. This enantiospecificdifference is the fundamental basis for enantioselectivediscrimination of chiral compounds.
Figure 10. Enantiospecific peak desorption temperature difference(ΔTp) for S- and R-PO on L- and D-lysine modified Cu(100) as afunction of empty site density after lysine exposure. The peakdesorption temperature of S-PO was higher than that of R-PO for L-lysine modified Cu(100), while the peak desorption temperature of R-PO was higher than that of S-PO for D-lysine modified Cu(100). Theenantiospecific peak temperature difference depends critically on thelysine modifier coverage. ΔTp reaches a maximum value of 5.5 K at anempty site density of θO = 0.25 corresponding to a lysine exposure of150 s.
Figure 11. Average peak desorption temperatures of racemic, S-, R-POon the L- and D-lysine modified Cu(100) and clean Cu(100) surfaces.Error bars correspond to one standard deviation in the temperature asdetermined from six repetitions of each TPD experiment. The resultson the L- and D-lysine modified Cu(100) reveal a clear and significantdiastereomeric effect. The results with racemic PO and on the achiralclean Cu(100) reveal no enantiospecificity.
Table 1. Enantiospecific Desorption Temperatures andEstimated Desorption Energies for PO on Lysine ModifiedCu(100) at the Lysine Coverage Yielding MaximalEnantiospecificity
adsorbate/modifier/Cu(100) av Tp (K) avΔEdes (kJ/mol)
4.3. Origin of Enantiospecific Adsorption of PO onLysine Modified Cu(100). The enantiospecific behavior onthe lysine modified surface can occur through several possiblechiral induction mechanisms. Because adsorption of PO onachiral Cu surfaces modified by many other modifiers includingL-alanine, L-alaninol, 2-butanol, and 2-butoxide species was notenantiospecific,16 comparison of these chirally modified Cusurfaces with the lysine modified Cu(100) surface should beuseful in understanding the probable origin of the observedenantiospecificity. Clearly the central difference between lysineand the other modifiers used is the presence of an additionalhydrogen bonding site provided by the amino group in thelysine side chain, −(CH2)4NH2. In the case of the L-alanine/Cu(100) system,16 hydrogen bonding interactions have beensuggested to occur between adjacent L-alaninate species to form2D islands with an ordered structure that cannot accommodatePO. It is possible that the additional amino group in the sidechain of lysine offers an extra hydrogen bonding site for theenantiospecific interactions with the epoxide group in PO. Inorder for this to happen, the amino group has to be adjacent tothe epoxide. As the epoxide in PO is involved in the bonding toCu, the side-chain amino group in lysine is expected to be closeenough to the surface. This is consistent with our speculationthat lysine adsorbs with its side chain lying flat on the surfacewhen enantiospecificity occurs. Nevertheless, we can not ruleout the possibility that this critical hydrogen donor originatesfrom the amino group attached to the chiral carbon. In fact,previous studies of lysine on Cu(110) suggest that lysineadsorbs in its zwitterionic form as a result of proton transferfrom the carboxyl group to the α-amino group34,43 whilealanine adsorbs on Cu surfaces as an anion.11,44 A recent studyof the chemical state of lysine on Cu(110) using X-rayphotoelectron spectroscopy (XPS) and near-edge X-rayabsorption fine structure (NEXAFS) spectroscopy revealedthat lysine formed a zwitterion when adsorbed at lowtemperature but deprotonated after annealing to 420 K.33 Ifthis is the case, within our investigated low-temperature range,the protonated α-amino group could indeed provide the criticalhydrogen bonding site for enantiospecific interactions. Thisrationale, however, has yet to explain why enantiospecificdesorption of PO was highly sensitive to the lysine modifiercoverage.Another interesting finding about the lysine/Cu(100) system
not found on many other chirally modified Cu surfaces was therestructuring of the underlying Cu surface to form homochiral(3,1,17) facets through step bunching and faceting.7 Thesefacets are known to appear at high lysine coverage afterannealing at 430 K for 20 min when the lysine molecules aremost likely deprotonated. The question now is whether someof these homochiral facets could already be formed at roomtemperature within the range of lysine coverages whereenantiospecificity was observed. While adsorption of glycine,L-alanine, and L-phenylalanine on Cu(100) had caused stepfaceting and bunching into (3,1,17) facets even at roomtemperature,9 these molecules were in the deprotonated formswhereas lysine was believed to be in its zwitterionic form atroom temperature. Based on our TPD results, PO desorbsdirectly from Cu when enantiospecificity occurs. Subsequentlyarriving PO may not interact directly with underlying Cu on therestructured facets if the facets are covered by a (4 × 1) lysineoverlayer structure.7 Nevertheless, at intermediate or lowercoverages the (3,1,17) facets may have a reduced local coverageof lysine with sufficient void space to accommodate PO. This
could explain the enantiospecific desorption of PO directlyfrom Cu. Unfortunately, TPD and LEED experiments cannotprovide information about the existence of homochiral (3,1,17)facets on the surface and hence this rationale remainsspeculative. Future experimental effort can therefore beinvested in understanding the coadsorption of lysine and POon these (3,1,17) facets by investigating the desorption of POfrom the naturally chiral Cu(3,1,17) surface similarly modifiedby single enantiomers of lysine.
5. CONCLUSIONSUsing R- and S-PO as the probe molecule, enantiospecificadsorption was probed on the D- and L-lysine modifiedCu(100) surface. This probe/modifier/metal system wasfound to exhibit a diastereomeric effect and hence trueenantiospecific behavior over a narrow range of lysinecoverages. S-PO adsorbs more strongly onto the L-lysine/Cu(100) surface than R-PO, while R-PO adsorbs more stronglyonto the D-lysine/Cu(100) surface than S-PO. This observedenantiospecificity, however, was found to be critically depend-ent on the lysine modifier coverage. The enantiospecifictemperature difference between S- and R-PO from the lysine/Cu(100) surface increases with lysine coverage before reachinga maximum of ΔTp ≈ 5.5 K at an empty site coverage of θO ≈0.25. The enantiospecificity then decreases with increasinglysine coverage. Available sites on the surface that can beoccupied by PO also diminish at higher lysine coverage. Thelysine modified Cu(100) surface is, thus far, the only chirallymodified Cu surface which exhibits experimentally detectableenantiospecific effects.
■ ASSOCIATED CONTENT*S Supporting InformationAdditional figure showing TPD of 13CO on the cleanCu(3,1,17)S surface at various exposures. This material isavailable free of charge via the Internet at http://pubs.acs.org.
■ ACKNOWLEDGMENTSThis work has been supported by Department of Energy underGrant No. DE-FG02-12ER16330.
■ REFERENCES(1) McFadden, C. F.; Cremer, P. S.; Gellman, A. J. Adsorption ofchiral alcohols on ″chiral″ metal surfaces. Langmuir 1996, 12, 2483−2487.(2) Cheong, W. Y.; Gellman, A. J. Energetics of Chiral Imprinting ofCu(100) by Lysine. J. Phys. Chem. C 2011, 115, 1031−1035.(3) Sholl, D. S.; Asthagiri, A.; Power, T. D. Naturally Chiral MetalSurfaces as Enantiospecific Adsorbents. J. Phys. Chem. B 2001, 105(21), 4771−4782.(4) Raval, R. Assembling molecular guidance systems forheterogeneous enantioselective catalysts. CATTECH 2001, 5 (1),12−28.(5) Baddeley, C. J. Fundamental investigations of enantioselectiveheterogeneous catalysis. Top. Catal. 2003, 25, 17−28.(6) Chen, Q.; Richardson, N. V. Surface facetting induced byadsorbates. Prog. Surf. Sci. 2003, 73, 59−77.
(7) Zhao, X.; Zhao, R. G.; Yang, W. S. Scanning tunnelingmicroscopy investigation of L-lysine adsorbed on Cu(001). Langmuir2000, 16, 9812−9818.(8) Zhao, X. Fabricating homochiral facets on Cu(001) with L-lysine.J. Am. Chem. Soc. 2000, 122, 12584−12585.(9) Zhao, X.; Wang., H; Zhao, R. G.; Yang, W. S. Self-assembly ofamino acids on the Cu(001) surface. Mater. Sci. Eng., C 2001, 16, 41−50.(10) Barlow, S. M.; Raval, R. Complex organic molecules at metalsurfaces: bonding, organization and chirality. Surf. Sci. Rep. 2003, 50,201−341.(11) Barlow, S. M.; Louafi., S.; Le Roux, D.; Williams, J.; Muryn, C.;Haq, S.; Raval, R. Polymorphism in supramolecular chiral structures ofR- and S-alanine on Cu(110). Surf. Sci. 2005, 590, 243−263.(12) Chen, Q.; Frankel, D. J.; Richardson, N. V. Organic adsorbateinduced surface reconstruction: p-aminobenzoic acid on Cu{110}.Langmuir 2001, 17, 8276−8280.(13) Lee, I.; Zaera, F. Chiral templating of surfaces: Adsorption of(S)-2-methylbutanoic acid on Pt(111) single-crystal surfaces. J. Am.Chem. Soc. 2006, 128, 8890−8898.(14) Raval, R. Creating chiral architectures at metal surfaces. J. Phys.:Condens. Matter 2002, 14, 4119−4132.(15) Raval, R. Chiral expression at metal surfaces. Curr. Opin. SolidState Mater. Sci. 2003, 7, 67−74.(16) Cheong, W. Y.; Huang, Y.; Dangaria, N.; Gellman, A. J. Probingenantioselectivity on chirally modified Cu(110), Cu(100) andCu(111) surfaces using temperature programmed desorption.Langmuir 2010, 26 (21), 16412−16423.(17) Stacchiola, D.; Burkholder, L.; Zheng, T.; Weinert, M.; Tysoe,W. T. Requirements for the formation of a chiral template. J. Phys.Chem. B 2005, 109, 851−856.(18) Gao, F.; Wang, Y.; Burkholder, L.; Tysoe, W. T.Enantioselective Chemisorption of Propylene Oxide on a 2-ButanolModified Pd(111) Surface: The Role of Hydrogen-BondingInteractions. J. Am. Chem. Soc. 2007, 129, 15240−15249.(19) Stacchiola, D.; Burkholder, L.; Tysoe, W. T. Enantioselectivechemisorption on a chirally modified surface in ultrahigh vacuum:adsorption of propylene oxide on 2-butoxide-covered palladium(111).J. Am. Chem. Soc. 2002, 124, 8984−8989.(20) Stacchiola, D.; Burkholder, L.; Tysoe, W. T. Probingenantioselective chemisorption in ultrahigh vacuum. J. Mol. Catal. A:Chem. 2004, 216, 215−221.(21) Ahmadi, A.; Attard, G.; Feliu, J.; Rhodes, A. Surface reactivity at″chiral″ platinum surfaces. Langmuir 1999, 15, 2420−2424.(22) Horvath, J. D.; Gellman, A. J. Enantiospecific desorption of R-and S-propylene oxide from a chiral Cu(643) surface. J. Am. Chem. Soc.2001, 123, 7953−7954.(23) Horvath, J. D.; Gellman, A. J. Enantiospecific desorption ofchiral compounds from chiral Cu(643) and achiral Cu(111) surfaces. J.Am. Chem. Soc. 2002, 124, 2384−2392.(24) Horvath, J. D.; Koritnik, A.; Kamakoti, P.; Sholl, D.; Gellman, A.J. Enantioselective separation on a naturally chiral surface. J. Am. Chem.Soc. 2004, 126, 14988−14994.(25) Schillinger, R.; Sljivancanin, Z.; Hammer, B.; Greber, T. Probingenantioselectivity with x-ray photoelectron spectroscopy and densityfunctional theory. Phys. Rev. Lett. 2007, 98, 136102(1)−136102(4).(26) Gladys, M. J.; Stevens, A. V.; Scott, N. R.; Jones, G.; Batchelor,D.; Held, G. Enantiospecific adsorption of alanine on the chiralCu{531} surface. J. Phys. Chem. C 2007, 111 (23), 8331−8336.(27) Barlow, S. M.; Louafi, S.; Le Roux, D.; Williams, J.; Muryn, C.;Haq, S.; Raval, R. Supramolecular assembly of strongly chemisorbedsize- and shape-defined chiral clusters: S- and R-alanine on Cu(110).Langmuir 2004, 20, 7171−7176.(28) Chen, Q.; Frankel, D. J.; Richardson, N. V. Chemisorptioninduced chirality: glycine on Cu{110}. Surf. Sci. 2002, 497, 37−46.(29) Gao, F.; Li, Z.; Wang, Y.; Burkholder, L.; Tysoe, W. T.Chemistry of Glycine on Pd(111): Temperature-ProgrammedDesorption and X-ray Photoelectron Spectroscopic Study. J. Phys.Chem. C 2007, 111, 9981−9991.
(30) Gao, F.; Li, Z.; Wang, Y.; Burkholder, L.; Tysoe, W. T.Chemistry of Alanine on Pd(111): Temperature-programmeddesorption and X-ray photoelectron spectroscopic study. Surf. Sci.2007, 601, 3276−3288.(31) Gao, F.; Wang, Y.; Burkholder, L.; Tysoe, W. T. Chemistry of L-proline on Pd(111): Temperature-programmed desorption and X-rayphotoelectron spectroscopic study. Surf. Sci. 2007, 601, 3579−3588.(32) Lofgren, P.; Krozer, A.; Lausmaa, J.; Kasemo, B. Glycine on Pt(111): a TDS and XPS study. Surf. Sci. 1997, 370, 277−292.(33) Eralp, T.; Shavorskiy, A.; Held, G. The Adsorption Geometryand Chemical State of Lysine on Cu{110}. Surf. Sci. 2011, 605, 468−472.(34) Humblot, V.; Methivier, C.; Pradier, C. M. Adsorption of L-lysine on Cu(110): A RAIRS study from UHV to the liquid phase.Langmuir 2006, 22, 3089−3096.(35) Andersson, S.; Pendry, J. B. Structure of CO adsorbed onCu(100) and Ni(100). Phys. Rev. Lett. 1979, 43, 363−366.(36) Heskett, D.; Strathy, I.; Plummer, E. W.; de Paola, R. A.Photoemission and electron energy loss spectroscopy investigation ofCO+K/Cu(100). Phys. Rev. B 1985, 32, 6222−6237.(37) McConville, C. F.; Woodruff, D. P.; Prince, K. C.; Paolucci, G.;Chab, V.; Surman, M.; Bradshaw, A. M. An x-ray absorption andphotoelectron diffraction study of the Cu(100) c(2x2) CO structure.Surf. Sci. 1986, 166, 221−233.(38) Tracy, J. C. Structural Influences on adsorption energy. 3. COon Cu(100). J. Phys. Chem. 1972, 56, 2748.(39) Vollmer, S.; Wittle, G.; Woll, C. Determination of site specificadsorption energies of CO on copper. Catal. Lett. 2001, 77 (1−3),97−101.(40) Wichtendahl, R.; Rodriguez-Rodrigo, M.; Hartel, U.;Kuhlenbeck, H.; Freund, H. J. Thermodesorption of CO and NOfrom Vacuum-Cleaved NiO(100) and MgO(100). Phys. Status Solidi A1999, 173, 93−100.(41) Jakob, P.; Menzel, D. Initial stages of multilayer growth andstructural phase transitions of physisorbed benzene on Ru(001). J.Chem. Phys. 1996, 105 (9), 3838−3848.(42) Redhead, P. A. Thermal desorption of gases. Vacuum 1962, 12,203−211.(43) Tielens, F.; Humblot, V.; Pradier, C. M. Elucidation of the lowcoverage chiral adsorption assembly of L-lysine on Cu(110) surface: Atheoretical study. Surf. Sci. 2008, 602 (5), 1032−1039.(44) Jones, G.; Jones, L. B.; Thibault-Starzyk, F.; Seddon, E. A.;Raval, R.; Jenkins, S. J.; Held, G. The local adsorption geometry andelectronic structure of alanine on Cu{110}. Surf. Sci. 2006, 600, 1924−1935.


![Simulation and Performance Analysis of Propylene · PDF fileon-purpose propylene technology; propane dehydrogenation, olefin metathesis, and methanol to propylene [2]-[4]. However,](https://static.documents.pub/doc/80x56/5a9fa6de7f8b9a89178d0123/simulation-and-performance-analysis-of-propylene-propylene-technology-propane.jpg)


