28
European Telecommunications Network Operators’ Association DRIVING THE DIGITAL FUTURE PUBLICATION NOVEMBER 2013 Annual Economic Report 2013

European Te lecommunicat ions Network Operators ’ Assoc ia t ion
DriviNg ThE DigiTAl FuTurE
publicATiON NOvEmbEr 2013
Annual Economic Report 2013

2

3
Annual Economic Report ETNO
introductions 6
market trends 10
revenue and service trends 12
investment trends 18
broadband 20
Next generation access networks (NgA) 23
New broadband services 24
ranking in European and World Top companies 26
ContEnts
4
Annual Economic ReportETNO
EuropEan TElEcommunicaTions nETwork opEraTors’ associaTion
introducing ETNO ETNO has been the voice of Europe’s telecommunications network operators since 1992. With their investment and innovation in new e-communications services and networks, ETNO member companies create economic growth & jobs and improve the daily lives of citizens.
ETNO’s 37 member companies and 12 observers* from Europe and beyond represent a significant part of total icT activity in Europe. They account for an aggregate annual turnover of more than 600 bn Eur and employ over 1.6 million people. ETNO companies are the main drivers of broadband and are committed to its continual growth in Europe.
ETNO members also hold new entrant positions outside their national markets. ETNO brings together the main investors in innovative and high-quality e-communications platforms and services, represent-ing 70% of total sector investment , 71% of total revenues of telecom services and 77% of European jobs in the sector.
ETNO strongly contributes to shaping a favourable regulatory and commercial environment for its members to continue to deploy innovative and high quality services and platforms for the benefit of European consumers and businesses.
* December 2012

5
Annual Economic Report ETNO
FRANCE
BELGIUM
LUXEMBOURG
NETHERLANDS
GERMANY
UNITED KINGDOM
IRELAND
DENMARK
SWEDEN
FINLAND
AUSTRIA
ITALY
SPAIN GREECEPORTUGAL
SWITZERLAND
SLOVENIA
CROATIA
BOSNIA-HERZEGOVINA
CZECH REP.
SLOVAKIA
HUNGARYROMANIA
BULGARIA
ALBANIA
CYPRUS
F.Y.R.O.M(Former Yugoslav
Republic of Macedonia)
TURKEY
POLAND
LITHUANIA
LATVIA
ESTONIA
NORWAY
ICELAND
MALTA
LIECHTENSTEIN
1 member
2 members
3 members
4 members & more
ETNO members’ presence in Eu and neighbouringmarkets
* Albtelecom (Albania), belgacom, bh Telecom (bosnia and herzegovina), Telefónica O2 czech republic, croatian Telecom, cyprus Telecommunications Authority (cYTA), Deutsche Telekom, Entreprise des postes et Télécommunications luxembourg, eircom, Elisa communications corporation (Finland), Elion (Estonia), Finnet group (Finland), France Telecom, go (malta), invitel (hungary), Koninklijke KpN, lattelecom (latvia), makedonski Telekom (F.Y.r of macedonia), magyar Telekom (hungary), OTE (greece), portugal Telecom, romtelecom (romania), Síminn (iceland Telecom ltd.), Slovak Telekom, Societatea Nationala de radiocomunicatii (SNr-romania), Swisscom, TDc, TDF (France), Telecom italia, Telecom liechtenstein, Telefónica, Telekom Austria, Telekom Slovenije, Telekomunikacja polska, Telenor (Norway), TeliaSonera (Sweden-Finland), TEO (lithuania), Türk Telekomünikasyon (Turkey), vivacom (bulgaria).
ETNO represents 38 operators in 35 countries*, far beyond the boundaries of the European union.
ETNO members’ total revenue from European operations amounted in 2012 to approxi-mately 202 bn Eur.
55 % of the turnover originates from fixed line operations, and 45 % from mobile services.
First estimates for 2013 would lead to revenues of 189 bn Eur with close to 56% from fixed operations.

6
Annual Economic ReportETNO
back in 2012 ETNO released the AT Kearney report entitled “A Future Policy Framework for Growth” which pointed out areas for growth upon which ETNO association members
have based their positions over the last year. These areas are: pricing of core services and networks and new NgA/lTE infra-structure; content distribution; adjacent businesses; and effi-ciency and scale measures, including consolidation.
Shortly thereafter, in July 2012 vice-president Kroes announced a new policy and regulatory environment for broadband invest-ment. This was a major step forward for building investor trust and as such, ETNO welcomed the development. in 2013, the debate around the challenges faced by the telecoms sector and the need for regulatory reform intensified. in order to con-tribute constructively to this discussion, ETNO along with the boston consulting group, embarked on a study to assess the underlying reasons for these sector challenges and proposed a comprehensive program to get the Digital Agenda back on track.
The comprehensive study, entitled “Reforming Europe’s Tel-ecoms Regulation to Enable the Digital Single Market”, quan-tifies the impact of the required measures. change needs to happen otherwise the sector will keep course with its annual
2% drop in revenues. The report estimates that the shortfall in investment needed to meet Eu Digital Agenda targets for broadband coverage and penetration will aggregate between 110 bn Eur and 170 bn Eur, leading to an enormous missed opportunity for the broader Eu economy: up to 750 bn Eur in gDp growth and as many as 5.5 million jobs. A pro-investment policy environment and a consolidated regulatory framework are needed in order to allow the European telecoms industry to contribute to growth and jobs in the Eu.
The European commission announced its Connected Conti-nent proposals in September of this year, combining a regula-tion, communication and recommendation. This is proof that the telecoms industry holds centre-court and policy makers recognise that it is time to push Europe to the front of the com-petitive edge and regain its status as a global digital leader. As the main icT sector association in Europe and represent-ing those companies that invest the most in Eu telecoms/icT infrastructure, ETNO drives those initiatives that provide a sus-tainable internet ecosystem and the most efficient use of the networks, to the benefit of all. As such, ETNO will be heavily engaged in the legislative process throughout 2014 and i look forward to working in close co-operation with our members on this important new chapter for our sector.
Daniel pataki, ETNO Director
introduction by Daniel pataki, ETNO Director
IntRoduCtIon

7
Annual Economic Report ETNO
Do you remember the days when Europe led the way for technol-ogy that served as the backbone of the digital economy? Today the Asian and North American markets enjoy that position with fibre access penetration that is up to 20 times higher than that of Europe. Obviously, their markets are larger and there are different dynamics at play, but there is still real reason for concern and we cannot afford to continue to lag behind.
cloud computing, smart grids, the internet of Things, big data, e-government, e-Education and e-health all rely on fast con-nection speeds. however, in order to achieve such velocity, innovation is needed and, more importantly, a strong economy to provide such resources. At the moment, Europe is not deliver-ing on these fronts.
up to 750 bn Eur in gDp growth and as many as 5.5 million jobs in the economy of the Eu are at risk by 2020 because of the lack of next generation network investment. Over the last five years, investment in the telecoms sector has been falling by 2% each year for almost 5 years now. by 2020, we estimate that that the shortfall in investment needed to meet Eu Digital Agenda targets for broadband coverage and penetration will be between 110 and 170 bn Eur, leading to an enormous missed opportunity for the broader Eu economy. meanwhile, investment in international telecoms markets is increasing. Europe must fight to keep a seat at the global competition table!
president barroso has recognised that the telecoms sector is far from being fully integrated. Even if we have an internal market for physical goods, we still have 28 national digital markets. We need a winning industrial strategy which recognises that the furious pace of technological change means that only substan-tial and rapid deregulation of basic telecoms markets promises a real solution. We also need to take a full view of the icT value chain, including content provision, in a technology agnostic manner and with a differentiated geographic lens, based on the service provided. i often talk about level playing fields and this is because right now we are trying to play the game on a slope littered with regulatory mines and moving goal posts
Therefore, we see an urgent need to update the overall European regulatory regime, to ensure a predictable and consistent ap-proach across communications services to the extent that they are comparable and substitutable. in this way, consumers will be able to make informed choices between providers competing on a level playing field. We have to think ahead.
luigi gambardella, ETNO Executive board chair
introduction by luigi gambardella, ETNO Executive board chair

8
Annual Economic ReportETNO
As in the previous years, this edition of ETNO's Annual Eco-nomic report will present the main figures on the evolution of European telecom markets and shed a light on the role played by ETNO members in these markets.
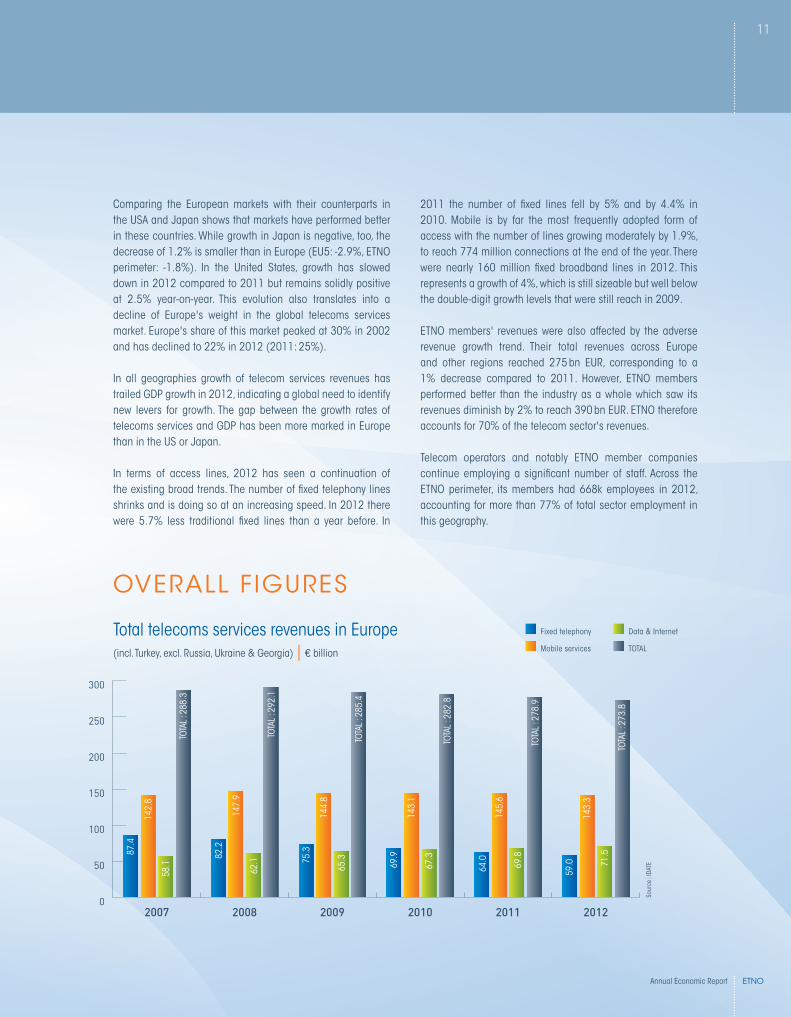
The growing number of accesses and the diversification of usages show that telecommunication services continue to be high in demand and mobile and data services are indeed more popular than ever before. however, despite the positive evolu-tion of demand, 2012 has seen a continuation of the negative growth trend that has affected the region's telecom revenues since 2009. Overall revenues of telecom services were 1.8% lower in 2012 than the year before and reached 273.8 bn Eur.
Driven by rising demand for data, mobile services accounted for the biggest share of this figure with 143.3 bn Eur. Yet, de-spite the success of wireless broadband this figure is 1.7bn Eur lower than the year before. like mobile, fixed Data and internet services have surpassed fixed telephony in terms of revenue. This segment turns out to be the only one that con-tinues to show positive growth with revenues attaining 71.5 bn Eur in 2012; up from 69.8bn Eur the year before. As expected, fixed telephony continued on its long-term downward evolu-tion. under pressure from voip and mobile communications, fixed telephony revenues have declined by 5bn Eur during the year 2012, falling to 59bn Eur.
ETNO represents an important part of the European telecoms industry, with its members accounting for 71% of all service revenues of telecom services. ETNO weighs even more heavily in terms of employment. more than 77% of the jobs in the sec-tor in Europe are created by ETNO member companies.
Despite a difficult environment with shrinking revenues, tele-com operators throughout Europe are upholding their invest-ment efforts to roll out ultra-fast fibre-based fixed broadband infrastructures and fourth generation mobile networks. After significantly stepping up their investment in 2011, operators in Europe have maintained their commitment to upgrading the continent's communications networks and even spent slightly more in 2012, with total capex reaching 46bn Eur. Of this amount, 26 bn Eur were channelled to fixed networks and 20bn Eur went into mobile infrastructures. Again, ETNO mem-bers play a leading role in this context. They account for almost 2/3 of capital expenditure in fixed (65%) and for more than half (56%) of the investments made in mobile networks. At the end of 2012, ultra-fast broadband infrastructures cumulatively passed 54% of European homes according to the European commission. This figure includes cable networks, which enjoy a cost advantage over their telco rivals for upgrading to their networks NgA standards and which are largely unregulated. in ultra-fast broadband, cable-cos have therefore emerged as main rivals of ETNO members in many markets. Still the share ETNO members amounts to 37% of all homes passed.
The above figures illustrate that ETNO members are a key pil-lar of Europe's telecom markets. however, if communication services are "economic oxygen" (commissioner Kroes), the conditions must be in place for the sector to thrive. regulatory certainty and incentives to invest in infrastructure are important elements of making telecoms the engine and facilitator of over-all economic recovery in Europe.
Didier pouillot, iDATE
christoph pennings, head of regulation practice
introduction by iDATE
IntRoduCtIon

9
Annual Economic Report ETNO
9
Annual Economic report ETNO

10
Annual Economic ReportETNO
Across Europe, revenues of telecoms services have reached 273.8 bn Eur in 2012. This level is 1.8% lower than in 2011 and the fourth consecutive decline of aggregated revenues of telecom services in the region. The decline of fixed telephony revenues due to price com-petition as well as substitution of mobile and OTT voip services is a long-term trend, which has continued in 2012. The growth of mobile revenues has turned negative for the first time in 2011. This trend has accelerated in 2012 with revenues shrinking by 1.2%, compared to 0.4% in the previous year. Data and internet services thus again been the sole growth drivers for the industry in Europe. Data and internet revenues grew by 2.3% on a yearly ba-sis, which is still healthy but well below 3.8% growth in the preceding year and the lowest growth rate in the 2007-2012 period.
The European telecom industry going through dire straits
10
MARkEt tREnds
Annual Economic reportETNO
11
Annual Economic Report ETNO
comparing the European markets with their counterparts in the uSA and Japan shows that markets have performed better in these countries. While growth in Japan is negative, too, the decrease of 1.2% is smaller than in Europe (Eu5: -2.9%, ETNO perimeter: -1.8%). in the united States, growth has slowed down in 2012 compared to 2011 but remains solidly positive at 2.5% year-on-year. This evolution also translates into a decline of Europe's weight in the global telecoms services market. Europe's share of this market peaked at 30% in 2002 and has declined to 22% in 2012 (2011: 25%).
in all geographies growth of telecom services revenues has trailed gDp growth in 2012, indicating a global need to identify new levers for growth. The gap between the growth rates of telecoms services and gDp has been more marked in Europe than in the uS or Japan.
in terms of access lines, 2012 has seen a continuation of the existing broad trends. The number of fixed telephony lines shrinks and is doing so at an increasing speed. in 2012 there were 5.7% less traditional fixed lines than a year before. in
2011 the number of fixed lines fell by 5% and by 4.4% in 2010. mobile is by far the most frequently adopted form of access with the number of lines growing moderately by 1.9%, to reach 774 million connections at the end of the year. There were nearly 160 million fixed broadband lines in 2012. This represents a growth of 4%, which is still sizeable but well below the double-digit growth levels that were still reach in 2009.
ETNO members' revenues were also affected by the adverse revenue growth trend. Their total revenues across Europe and other regions reached 275 bn Eur, corresponding to a 1% decrease compared to 2011. however, ETNO members performed better than the industry as a whole which saw its revenues diminish by 2% to reach 390 bn Eur. ETNO therefore accounts for 70% of the telecom sector's revenues.
Telecom operators and notably ETNO member companies continue employing a significant number of staff. Across the ETNO perimeter, its members had 668k employees in 2012, accounting for more than 77% of total sector employment in this geography.
OvErall figurEs
0
50
100
150
200
250
300
201220112010200920082007
87.4
82.2
75.3
69.9
64.0
59.0
142.
8
147.
9
144.
8
143.
1
145.
6
143.
3
58.1
62.1
65.3
67.3
69.8
71.5
TOTA
l : 2
88.3
TOTA
l : 2
92.1
TOTA
l : 2
85.4
TOTA
l : 2
82.8
TOTA
l : 2
78.9
TOTA
l : 2
73.8
Sour
ce : i
DATE
Total telecoms services revenues in Europe(incl. Turkey, excl. russia, ukraine & georgia) | € billion
Fixed telephony
mobile services
Data & internet
TOTAl

12
Annual Economic ReportETNO
-5
-4
-3
-2
-1
0
1
2
3
2011-20122010-20112009-20102008-20092007-2008
Telecoms market revenue growth in Eu compared to uS/Japan & overall economic growth | %
current gDp growth | %
Sour
ce : i
DATE
Sour
ce : i
DATE
0.5
-2.3
-1.0
-2.0
-1.8
1.3
-2.3
-0.9
-1.4 -.5
0.4
-2.3
-1.2
-1.7
-1.7
1.8
-0.7
1.0
3.0
2.5
0.8
-2.5
-1.5
-1.9
-1.8
-4.4
-2.3
-1.4
-0.8
-1.2
-6
-5
-4
-3
-2
-1
0
1
2
3
4
2011-20122010-20112009-20102008-20092007-2008
-2.3
2.1
2.2
2.7
3.3
1.9
-3.3
-3.3
-3.2
-3.2
-2.2
-6.0
3.3
3.3
3.3
3.8
3.8
2.4
-2.4
2.9
2.8
3.0
3.7
4.0
1.0
0.9
1.1
1.5
4.0
1.1
Eu-5 Eu-15 Eu-27 Eu (ETNO perimeter) uSA Japan
MARkEt tREnds

13
Annual Economic Report ETNO
-5
-4
-3
-2
-1
0
1
2
3
2011-20122010-20112009-20102008-20092007-2008
-2.0
-1.5
-1.0
-0.5
0.0
0.5
1.0
1.5
TV servicesIT services
Telecom services
Eu telecoms market growth 2011-2012 compared to iT services & Tv services ETNO perimeter | %
t-1.8 %
0 %u
+1.2 %
Sour
ce : i
DATE
investment in Eu telecoms sector compared to uS/Japan
cApEX growth of the Eu telecoms sector vs. cApEX in the uSA and in Japan | %
Sour
ce : i
DATE
-10
-8
-6
-4
-2
0
2
4
6
8
2011-20122010-20112009-20102008-20092007-2008
-3.0
-2.0
-2.6
-1.2
-4.1
-1.0
-8.0
-7.9
-8.6
-6.3
-8.2
3.3
-2.6
4.6
3.1
1.9
0.3
5.1
-4.7
4.5
4.0
3.7
4.8
3.6
-0.1
-0.2
0.1
0.3
6.7
7.5
Eu-5 Eu-15 Eu-27 Eu (ETNO perimeter) uSA Japan

14
Fixed access lines
mobile subscribers
internet subscribers
of which broadband
subscribers
Annual Economic ReportETNO
0
100
200
300
400
500
600
700
800
201220112010200920082007
2012201120102009200820070
30
60
90
120
150
20
50
80
110
140
10
40
70
100
130So
urce
: iDA
TESo
urce
: iDA
TE
Access to telecoms services in Europe(incl. Turkey, excl. russia, ukraine & georgia) | million lines/subscribers
Teledensities in Europe(incl. Turkey, excl. russia, ukraine & georgia) | lines/subscribers per population
137.4
23.3
249.
942
.4
109.
518
.6
239.
840
.5
124.
121
.0
227.
738
.3
136.
422
.9
217.
836
.5
145.
724
.4
206.
834
.5
153.
725
.7
195.
132
.5
158.
726
.4
664.
411
2.8
709.
111
9.7
725.
012
1.9
737.
312
3.6
760.
012
6.9
774.
112
8.8
144.6
24.4
151.3
25.4
155.7
26.1
160.6
26.8
164.3
27.3
fixed teledensity mobile density internet density of which broadband density
MARkEt tREnds

15
Annual Economic Report ETNO
0
50
100
150
200
250
outside EU-27ETNO perimeterEU-2712 NMSEU-15
Sour
ce : i
DATE
Sour
ce : i
DATE
ETNO mEmbErs
Split of ETNO members’ turnover |€ billion
Eu-15 12 NmS* Eu-27ETNO
perimeteroutside Eu-27
2011 European turnover 165.1 15.3 180.4 202.0 21.6
of which fixed 93.2 5.2 98.4 111.5 13.1
of which mobile 71.9 10.1 82.0 90.4 8.5
Aggregated revenue of ETNO members Europe + non Europe | € billion
Share of total sector revenue = 70.5 %
ETNO members’ employees ETNO perimeter | thousand
Share of total sector employment = 77.3 %
Source : iDATE
0 50 100 150 200 250 300 350 400
Total sector revenue : 390.3
ETNO members : 275.2EEE OO
a
m
c
s
e
55
9
0 200 400 600 800 1000
Total sector employees: 863.8
ETNO members : 667.9OO
r
e
e
.
.
t – 1 % t -2.3 %
t -2 % t -1.4 %
Source : iDATE
165.
1
71.9
93.2
180.
4
82.0
98.4
202.
0
90.4
111.
5
21.6
8.5
13.115.310.1
5.2

16
Annual Economic ReportETNO
0
100
200
300
400
500
600
700
800
201220112010200920082007
195.1249.9 239.8 217.8227.7 206.8
774.1
664.4709.1
737.3725.0760
66.124.4 34.6 52.144.8 59.4
REvEnuE & sERvICE tREnds
Whereas the decline in fixed-line revenues should be expected, given the negative trend for take-up of services, the 3.8% fall in mobile retail revenues despite the growing number of subscribers and the huge popularity of smartphones seems more unusual. intense price competition between operators (mNOs and mvNOs), the substitution of OTT offers for SmS and other services as well regulatory intervention as in the case of international roaming play into this equation. Attractive broadband offers continue boosting demand with related revenues up by 3.5% in 2012.
Although traditional fixed line telephony is on a lasting downward trend, analogue telephony lines continue to be the dominant form of managed fixed access. in 2012 there were 195 million circuit-switched telephony access lines compared to merely 66 million managed voip lines. however, the trend clearly speaks in favour of packet-switched telephony lines. Since 2007, the latter grew by 171%, whereas the number of legacy lines shrank by 22%. This trend will accelerate as an increasing number of operators will fully switch over to All-ip networks in the years to come. The number of mobile telephony subscribers has risen by 16% over the same period, from 664 million to 774 million.
broadband the industry's remaining growth driver
Facing intense competition and regulatory pressure telecom service revenues continued to shrink in 2012. Still growing uptake make fixed broadband the only remaining source of growth. The in-vestment needed in order to meet Eu DA targets for bb coverage has been estimated between 110 and 170 bn Eur, contributing to the overall Eu economy with an additional growth of 750bn Eur in gDp and as many as 5.5 million jobs (Source: The boston consulting group 'reforming Europe's Telecoms regulation to Enable the Digital Single market' July 2013).
OvErall figurEs
Fixed telephony vs mobile telephony take up growth + take up of voip services in Europe(incl. Turkey, excl. russia, ukraine & georgia) | million
Sour
ce : i
DATE
mobile subscribers
pOTS lines
voip lines

17
Annual Economic Report ETNO
0
100
200
300
20122011201020092008
Sour
ce : i
DATE
retail services revenues in Europe | € billion
Total retail revenues
o/w Fixed services
o/w mobile services
100.
6
94.7
90.8
87.6
84.320
0.4
190.
7
184.
6
176.
9
169.
7
99.7
95.8
93.8
89.2
85.3
ETNO mEmbErs

18
Annual Economic ReportETNO
InvEstMEnt tREnds
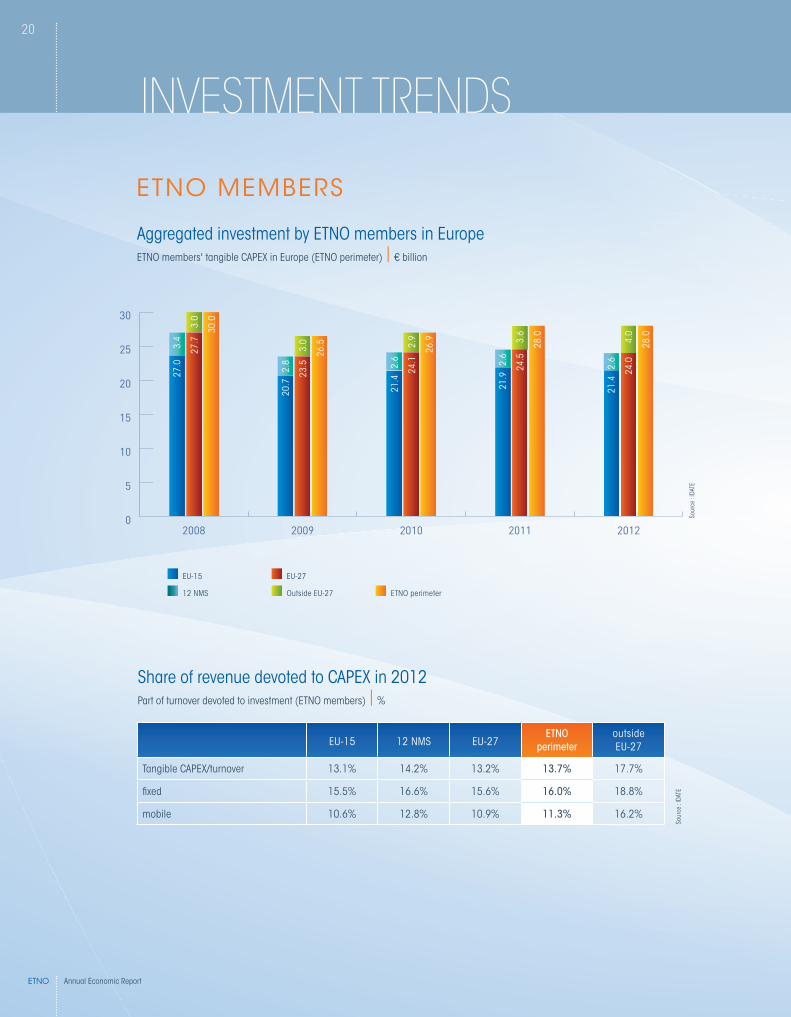
growing at a rate of 0.3% investment levels have remained fairly stable in 2012 after a strong acceleration in 2011. Against the background of a shrinking market, this means that operators are devoting a higher share of their revenues to investing in new networks than before.
Operators' investments in the ETNO perimeter reached 46 bn Eur in 2012. The lion's share of this sum (28 bn Eur or 61%) came from the members of ETNO.
At 25.6 bn Eur, capex in fixed networks continues to be higher than in mobile networks in 2012 (+0.2% y-o-y). ETNO members account for almost two thirds (64.6%) of the total amount. While ETNO members increased their spending on fixed infrastructure upgrades by 0.7% in 2012, the investments of other operators fell by 0.8%.
in the mobile sector, too, ETNO member firms show a high degree of activity. They invested 11.4 bn Eur in their networks, representing 56% of the mobile sector's total investment of 20.3 bn Eur.
ETNO members driving force behind network upgrades
As the demand for data traffic in fixed and mobile networks is ever-growing, operators keep upgrading their infrastructures to NgA and lTE-standards. more than 150 million European homes are already passed by FTTx-networks and more than 22 million mobile users had an lTE-subscription in 2013.

19
Annual Economic Report ETNO
0
10
20
30
40
50
Total sector CAPEX ETNO members' CAPEX
Total sector investment for 2012 ETNO members' cApEX (ETNO perimeter) and share of total sector cApEX | € billion
Sour
ce : i
DATE
Share of ETNO members = 60.8 %
+ 0.3 %
- 0.3 %
28
46
investment in fixed vs mobile segments Telcos' tangible cApEX (ETNO perimeter) | € billion
0
5
10
15
20
25
30
35
201220112010200920082007
12.6
12.0
10.5
10.9 11
.6
11.4
8.9
8.6
8.68.4
8.1
8.117
.8
17.9
16.0
16.0
16.4
16.6
9.1
9.2
8.6
8.4
8.18.5
30.3 30.0
26.5 26.928.0 28.0
18.017.816.817.116.416.6
Sour
ce : i
DATE
ETNO members operators other operators fixed mobile
OvErall figurEs
20
Annual Economic ReportETNO
ETNO mEmbErs
Aggregated investment by ETNO members in Europe ETNO members' tangible cApEX in Europe (ETNO perimeter) | € billion
Share of revenue devoted to cApEX in 2012part of turnover devoted to investment (ETNO members) | %
Sour
ce : i
DATE
outside EU-27 ETNO perimeterEU-2712 NMSEU-15
0
5
10
15
20
25
30
20122011201020092008
Sour
ce : i
DATE
Eu-15 12 NmS Eu-27ETno
perimeteroutside Eu-27
Tangible cApEX/turnover 13.1% 14.2% 13.2% 13.7% 17.7%
fixed 15.5% 16.6% 15.6% 16.0% 18.8%
mobile 10.6% 12.8% 10.9% 11.3% 16.2%
Eu-15
12 NmS
Eu-27
Outside Eu-27 ETNO perimeter
InvEstMEnt tREnds27
.0
20.7
21.4
21.9
21.4
3.4
2.8 2.6 2.6
2.6
27.7
23.5
24.1
24.5
24.0
3.0
3.0 2.9 3.
6
4.030
.0
26.5
26.9 28
.0
28.0

21
Annual Economic Report ETNO
increasing adoption of NgA and mobile broadband
broadband continues to be on the rise in Europe with 6 Eu homes out of 10 subscribing to a fixed broadband service in 2012. The Digital Agenda's goal of universal availability of basic broadband has virtually been achieved with coverage standing at 100% in 17 coun-tries and reaching 99% in the Eu27 and ETNO perimeters.
OvErall figurEs
broadband penetration per technology
Structure of the European fixed broadband market (ETNO perimeter) | % of total broadband connections
DSl continues to be the dominant form of fixed access, holding a 74% share of access lines in the ETNO perimeter. There has nevertheless been a gradual shift towards other technologies. cable accounted for 17.2% of the lines at the end of 2012 compared to 16.1% a year earlier. The share of FTTh/b has grown from 3.5% of the fixed broadband market to 5.3%. more largely, superfast broadband connections now account for 16% of total (11% in 2011).
3g subscriptions have outnumbered fixed line accesses since 2009 and the gap is widening as an increasing number of users adopts not only smartphones but also other connected devices, notably tablets. While lTE adoption is still limited, increasing availability of services will drive demand and reinforce the mobile's popularity in the broadband segment.
73.9 %
End 2012 Total fixed broadband
connections in 2012 = 158.7 millions of which :
DSl: 117.3
cable modem: 27.3
FTTx: 8.4
Other technologies: 5.7 (lAN, FbWA, satellite…)
Source : iDATE
Fixed vs mobile broadband
Fixed and mobile broadband subscribers (ETNO perimeter) | thousand subscribers
Sour
ce : i
DATE
50
100
150
200
250
300
350
201220112010200920082007
109.5
77.7
158.7
117.5
124.1
173.1136.4
145.5
285.1
230.0
153.9
335.6
BRoAdBAnd
17.2 %
5.3 %3.6 %
Fixed broadband subscribers
3g subscribers

22
Annual Economic ReportETNO
coverage of superfast broadband services has grown by 13% compared to 2011. more than 150 million homes are now passed. Out of these, 23.7 million have actually taken a subscription at the end of 2012. Even more important is the significant growth in actual take-up of services. in 2011, 11% of the homes passed had signed up to the services, compared to 16% one year later. While this certainly still leaves significant upward potential, the trend is encouraging.
in terms of FTTh/b, coverage rose to 34.9 million homes in the Eu, compared to 29 million in the previous year. FTTh/b subscriptions reached 6.4 million. in the European union, ETNO members account for 36.7% of homes passed, across all FTTx technologies. When considering FTTh/b only, this share rises to 48.5%.
vDSl is also an important piece in the high-speed broadband puzzle and particularly so for ETNO members, with some of having achieved coverage of 50% of homes in their respective domestic markets. With the use of vectoring technology, vDSl becomes even more relevant. Deutsche Telekom, for instance, recently announced covering 24 million homes with vectoring by 2016.
ETNO members at the forefront of NgA deployments
NgA networks continue gaining traction in the European market. more than 50% of European homes can effectively sign up to ultra-fast broadband services today.
OvErall figurEsSo
urce
: iDA
TE
main technologies/network architecture models NgA deployment (homes passed at end 2012 ) | million
homes passed at end 2010 Total Eu ETNO members % ETNO members
FTTh/b 34.9 16.9 48.5%
FTTx* (incl. vDSl, FTTlA, lAN…) 150.5 54.9 36.5%
*All cable/DOcSiS 3.0 deployments are taken into account in the FTTx category
nGA

23
Annual Economic Report ETNO
NgA deployment in Europe FTTx deployments and share of ETNO members per country (end 2012) broadband coverage at end 2012(1)
Sour
ce :
iDAT
E fo
r oun
cil E
urop
e
(1) aggregated data
(2) as a % of population(3) homes passed as a % of households(4) capable of speeds over 30 mbps
sou
rce
: iD
aTE
for
fTTH
Co
unc
il Eu
rop
e
FTTx homes passed (000s)(1) share ETNO
Austria 3.847 63%
belgium 6.952 58%
bulgaria 1.720 16%
croatia 670 47%
cyprus 0 100%
czech republic 2.715 17%
Denmark 3.596 71%
Estonia 685 46%
Finland 869 94%
France 9.660 17%
germany 36.184 34%
greece 130 96%
hungary 3.290 36%
iceland 179 40%
ireland 963 22%
italy 3.073 97%
latvia 883 49%
lithuania 1.320 58%
luxembourg 285 100%
malta 0 0%
Netherlands 9.558 66%
Norway 705 49%
poland 3.896 28%
portugal 6.069 26%
romania 5.147 na
Slovakia 1.144 60%
Slovenia 675 26%
Spain 10.300 21%
Sweden 2.150 44%
Switzerland 6.399 76%
Turkey 7.250 81%
uK 20.199 0%
D.A. 2013 DigiTAl AgENDA 2020
Standard (2) vDSl (3) (4) FTTlA (3) (4) FTTh/b (3)
Austria 100% 63% 36% 6%
belgium 100% 82% 60% 0%
bulgaria 100% 0% 0% 61%
croatia 97% 14% 18% 3%
cyprus 100% na na na
czech republic 98% 29% 0% 5%
Denmark 100% 50% 54% 35%
Estonia 96% 15% 64% 38%
Finland 100% na 11% 22%
France 100% 0% 13% 21%
germany 100% 32% 55% 3%
greece 100% 3% 0% na
hungary 98% 7% 57% 21%
iceland 98% na na na
ireland 98% 12% 44% 2%
italy 99% 8% 0% 11%
latvia 99% 25% 0% 80%
lithuania 98% 0% 0% 97%
luxembourg 100% 100% 0% 35%
malta 100% na na na
Netherlands 100% 67% 37% 23%
Norway 98% na 0% 31%
poland 98% 12% 12% 3%
portugal 100% 0% 96% 53%
romania 98% 0% 17% 34%
Slovakia 93% 0% 20% 40%
Slovenia 98% 3% 35% 41%
Spain 99% na 41% 19%
Sweden 100% na 0% 47%
Switzerland 100% 100% 42% 17%
Turkey 100% 21% 0% 17%
uK 100% 26% 47% 1%
Total Eu-15 100% 19% 34% 12%
Total Eu-27 99% 17% 31% 14%
ETno 99% 19% 29% 15%
24
Annual Economic ReportETNO
nEw BRoAdBAnd sERvICEs
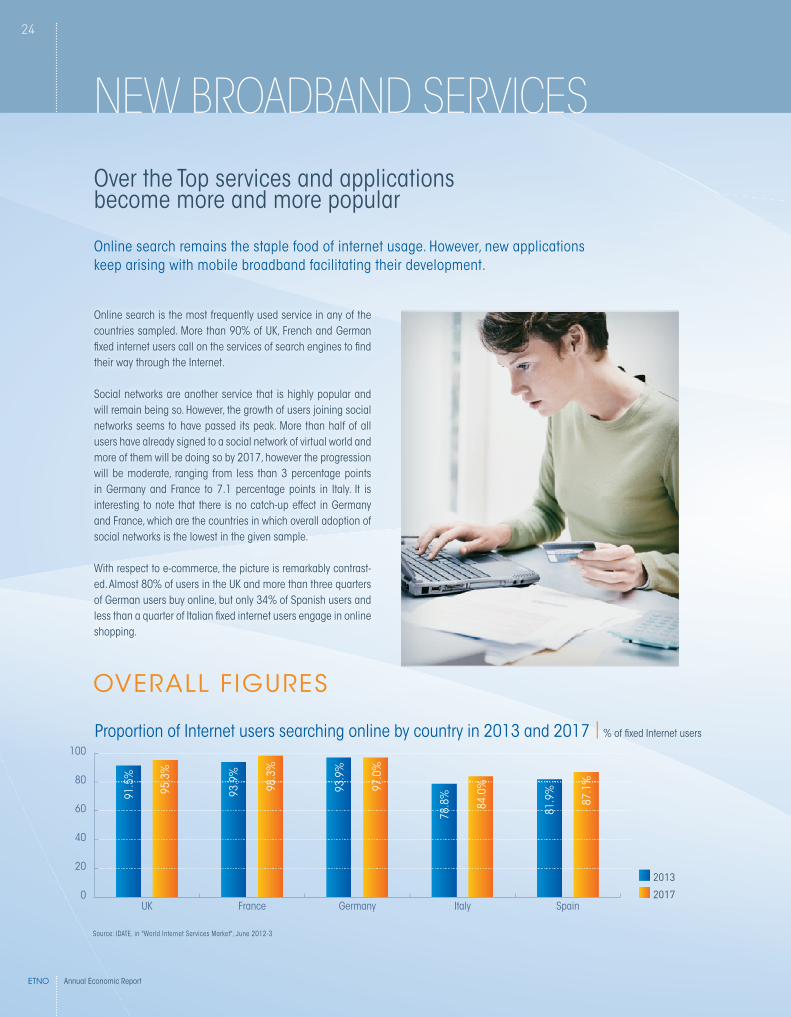
Online search is the most frequently used service in any of the countries sampled. more than 90% of uK, French and german fixed internet users call on the services of search engines to find their way through the internet.
Social networks are another service that is highly popular and will remain being so. however, the growth of users joining social networks seems to have passed its peak. more than half of all users have already signed to a social network of virtual world and more of them will be doing so by 2017, however the progression will be moderate, ranging from less than 3 percentage points in germany and France to 7.1 percentage points in italy. it is interesting to note that there is no catch-up effect in germany and France, which are the countries in which overall adoption of social networks is the lowest in the given sample.
With respect to e-commerce, the picture is remarkably contrast-ed. Almost 80% of users in the uK and more than three quarters of german users buy online, but only 34% of Spanish users and less than a quarter of italian fixed internet users engage in online shopping.
proportion of internet users searching online by country in 2013 and 2017 | % of fixed internet users
2013
2017
Source: iDATE, in "World internet Services market", June 2012-3
0
20
40
60
80
100
SpainItalyGermanyFranceUK
91.5
%
93.9
%
93.9
%
78.8
%
81.9
%95.3
%
98.3
%
97.0
%
84.0
%
87.1
%
OvErall figurEs
Over the Top services and applications become more and more popular
Online search remains the staple food of internet usage. however, new applications keep arising with mobile broadband facilitating their development.

25
Annual Economic Report ETNO
use of social networks by country in 2013 and 2017 | % of internet users
2013
2017010
2030
4050
6070
80
SpainItalyGermanyFranceUK
Source: iDATE, in "World internet Services market", June 2012-3
66.7
%
57.7
%
55.7
% 64.9
%
62.0
%71.0
%
60.6
%
58.5
% 72.0
%
62.0
%
proportion of internet users shopping online by country in 2013 and 2017 | % of internet users
2013
2017
Source: iDATE, in "World internet Services market", June 2012-3
0
20
40
60
80
100
SpainItalyGermanyFranceUK
79.2
%
59.2
% 73.6
%
22.5
% 34.1
%
82.0
%
64.0
% 79.6
%
32.9
% 43.1
%
use of location based Services by country in 2013 and 2017 | % of mobile subscribers
2013
2017
Source: iDATE, in "World internet Services market", June 2012-3
0
10
20
30
40
50
SpainItalyGermanyFranceUK
42.0
%
30.0
%
25.0
%
27.0
%
29.1
%
48.5
%
40.6
%
35.0
%
35.0
%
38.0
%

26
Annual Economic ReportETNO
rank company country 2012 sales (€ million)1 NTT Japan 1043772 AT&T uSA 991813 verizon uSA 901624 china mobile china 690975 Telefónica Spain 623566 Deutsche Telekom germany 581697 vodafone uK 546438 comcast uSA 486989 América movil mexico 45805
10 Orange France 4351511 KDDi Japan 3572312 china Telecom china 3490213 Softbank Japan 3295314 china unicom china 3069215 Telecom italia italy 2950316 Sprint Nextel uSA 2752517 vimpelcom russia 2306118 bT uK 2244119 Telstra Australia 2044320 Time Warner cable uSA 1664521 KT South Korea 1643722 bcE canada 1555923 century link uSA 1430224 Telenor Norway 1360825 mTN South Africa 1280826 KpN Netherlands 1240927 TeliaSonera Sweden 1205028 SingTel Singapore 1172429 bharti Airtel india 1169730 STc Saudi Arabia 1166831 SFr France 1128832 Oi brazil 1120733 SK Telecom South Korea 1104734 rogers canada 972635 mTS russia 967936 Swisscom Switzerland 944937 hutchison Whampoa hK 903338 Telus canada 850739 Everything Everywhere uK 818440 rostelecom russia 810741 liberty global uSA 802542 lg u+ South Korea 753443 Ooredoo Qatar 720944 megaFon russia 688045 Etisalat uAE 683446 portugal Telecom portugal 659947 belgacom belgium 646248 pT Telkom indonesia 639649 Turk Telekom Turkey 550650 bouygues Telecom France 5226
RAnkInG In woRld & EuRopEAn CoMpAnIEsTop 50 telecom operators in the world
Sour
ce : i
DATE

27
Annual Economic Report ETNO
rank company country 2012 sales (€ million)
1 Telefónica Spain 62356
2 Deutsche Telekom germany 58169
3 vodafone uK 54643
4 Orange France 43515
5 Telecom italia italy 29503
6 bT uK 22441
7 Telenor Norway 13608
8 KpN Netherlands 12409
9 TeliaSonera Sweden 12050
10 SFr France 11288
11 Swisscom Switzerland 9449
12 Everything Everywhere uK 8184
13 portugal Telecom portugal 6599
14 belgacom belgium 6462
15 Turk Telekom Turkey 5506
16 bouygues Telecom France 5226
17 virgin media uK 5041
18 Tele2 Sweden 5023
19 Telekom Austria Austria 4330
20 TDc Denmark 3509
Top 20 European telecoms operators
RAnkInG In woRld & EuRopEAn CoMpAnIEs
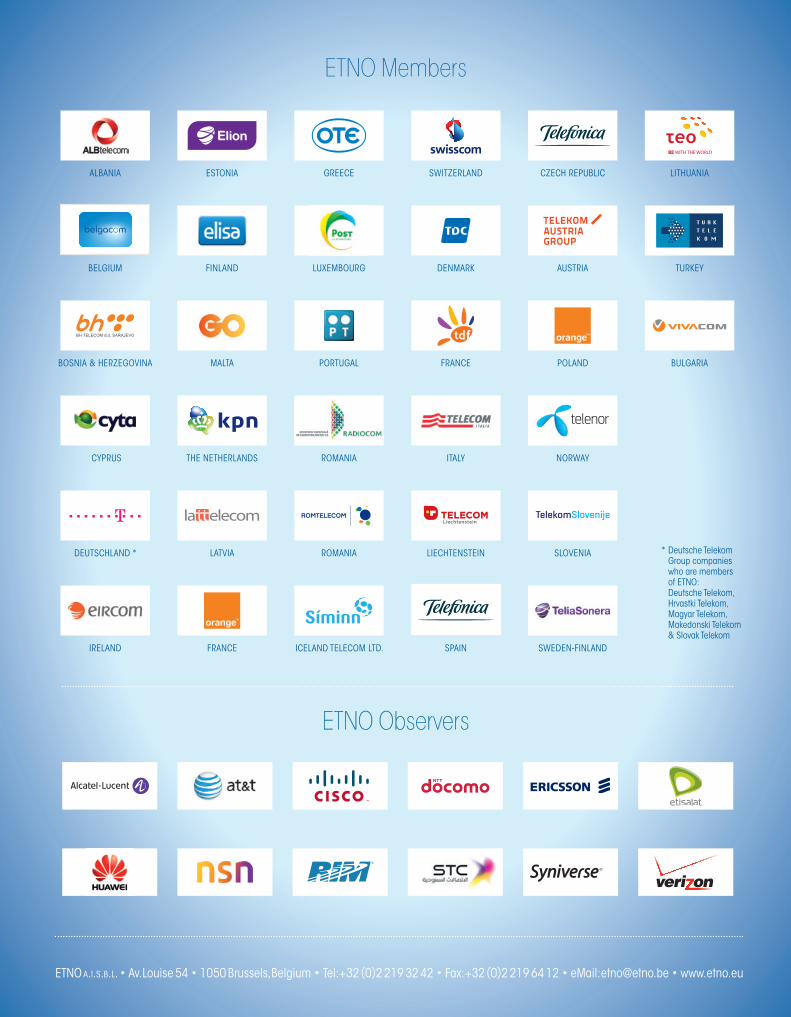
• Albtelecom (Albania) www.albtelecom.al
• belgacom (belgium) www.belgacom.com
• bh Telecom (bosnia and herzegovina) www.bhtelecom.ba
• croatian Telecom (croatia) www.t.ht.hr
• cyprus Telecommunications Authority (cyprus) www.cyta.com.cy
• Deutsche Telekom (germany) www.telekom.com
• Eircom (ireland) www.eircom.ie
• Elion (Estonia) www.elion.ee
• Elisa communications corporation (Finland) www.elisa.com
• pOST group luxembourg www.postgroup.lu
• Finnet group (Finland) www.finnet.fi
• gO (malta) www.go.com
• Koninklijke KpN (The Netherlands) www.kpn.com
• lattelecom (latvia) www.lattelecom.lv
• magyar Telekom (hungary) www.magyartelekom.hu
• makedonski Telekom (F.Y.r. of macedonia) www.telekom.mk
• Orange (France) www.orange.com
• OTE (greece) www.ote.gr
• portugal Telecom (portugal) www.telecom.pt
• romTelecom (romania) www.romtelecom.ro
• Síminn (iceland) www.simi.is
• Slovak Telekom (Slovakia) www.slovaktelekom.sk
• Societatea Nationala de radiocomunicatii (romania) www.radiocom.ro
• Swisscom (Switzerland) www.swisscom.com
• TDc (Denmark) www.tdc.com
• TDF (France) www.tdf.fr
• Telecom italia (italy) www.telecomitalia.it
• Telecom liechtenstein www.telecom.li
• Telefónica (Spain) www.telefónica.com
• Telefónica O2 (czech republic) www.cz.o2.com
• Telekom Austria (Austria) www.telekom.at
• Telekom Slovenije (Slovenia) www.telekom.si
• Telekomunikacja polska (poland) www.telekomunikacja.pl
• Telenor (Norway) www.telenor.com
• TeliaSonera (Sweden – Finland) www.teliasonera.com
• Teo lt (lithuania) www.teo.lt
• Türk Telekom (Turkey) www.turktelekom.com.tr
• vivAcOm (bulgaria) www.vivacom.bg
Further information:
Sour
ce : i
DATE
Etno Members
Etno observers
AlbANiA
bElgium
bOSNiA & hErzEgOviNA
cYpruS
DEuTSchlAND *
irElAND
ESTONiA
FiNlAND
mAlTA
ThE NEThErlANDS
lATviA
FrANcE
grEEcE
luXEmbOurg
pOrTugAl
rOmANiA
rOmANiA
icElAND TElEcOm lTD.
SWiTzErlAND
DENmArK
FrANcE
iTAlY
liEchTENSTEiN
SpAiN
czEch rEpublic
AuSTriA
pOlAND
NOrWAY
SlOvENiA
SWEDEN-FiNlAND
liThuANiA
TurKEY
NET
crOATiA
bulgAriA
* Deutsche Telekom group companies who are members of ETNO: Deutsche Telekom, hrvastki Telekom, magyar Telekom, makedonski Telekom & Slovak Telekom
ETNO a.i.s.b.l. • Av. louise 54 • 1050 brussels, belgium • Tel: +32 (0)2 219 32 42 • Fax: +32 (0)2 219 64 12 • email: [email protected] • www.etno.eu


