SHR -C-376 Field Manual for Maturity and Pullout Testing on Highway Structures John A. Bickley John A. Bickley Associates Ltd. Toronto, Ontario Strategic Highway Research Program National Research Council Washington, DC 1993
Transcript
SHR -C-376
Field Manual for
Maturity and Pullout Testingon Highway Structures
John A. Bickley
John A. Bickley Associates Ltd.Toronto, Ontario
Strategic Highway Research ProgramNational Research Council
Strategic Highway Research ProgramNational Academy of Sciences2101 Constitution Avenue N.W.
Washington, DC 20418
(202) 334-3774
The publication of this report does not necessarily indicate approval or endorsement of the findings, opinions,conclusions, or recommendations either inferred or specifically expressed herein by the National Academy ofSciences, the United States Government, or the American Association of State Highway and TransportationOfficials or its member states.
The research described herein was supported by the Strategic Highway Research Program(SHRP). SHRP is a unit of the National Research Council that was authorized by section128 of the Surface Transportation and Uniform Relocation Assistance Act of 1987.
°°°111
Contents
Acknowledgments ................................................. iii
List of Figures .................................................... vii
List of Tables ..................................................... ix
7.2.1 Using Preplaced Inserts .............................. 367.2.2 Inserts Inserted in Drilled Holes in Hardened Concrete ........ 37
Appendix A. ASTM C 1074
Appendix B. ASTM C 900
Appendix C. ACI 228.1R
vi
List of Figures
2. I Principle of in-place tests ................................... 9
3.1 Maturity testing options of usage ............................. 12
4.1 Testing pullout in slab soffit ................................ 174.2 Schematic of pullout test .................................. 174.3 Mold for pullout tests ..................................... 194.4 Typical relationship between pullout force and
the compressive strength of standard cured cylinders .............. 204.5 Installation of pullout insert in wooden formwork
with removable access plug ............................... 224.6 Installation on vertical surfaces with steel forms ....... , .......... 234.7 Use of a circular saw bit to cut an access hole in a soffit form ........ 244.8 Circular plug obtained by use of a circular saw ................... 244.9 Circular plug affixed to plywood square with bolt, pullout insert,
and circular metal plate .................................. 244.10 Reverse side of timber form ................................ 25
4.11 Attachments of pullout assembly to reverse side of form ............ 254.12 Pullout assembly screwed into place .......................... 254.13 Application of grease to fill the gap between the pullout assembly
and the timber form ..................................... 26
4.14 Excess grease has been removed from the gap ................... 264.15 Concrete is poured over the installed pullout assembly .............. 274.16 A pullout assembly installation where forms are to be removed
before pullout evaluations are to be performed .................. 27
5.1 Non-structural members ................................... 305.2 Structural members ...................................... 305.3 Structural members ...................................... 30
vii
List of Tables
3.1 Suggested measurement points for pullout tests ........................ 154.1 Sample Pullout Conversions ..................................... 214.2 Minimum number of pullout tests for various structural components ......... 26
ix
Abstract
This report provides guidance on the use of maturity testing and pullout testing on highwayconstruction projects. The background on the use of these procedures is described, togetherwith advice on the selection, and the correct and safe use of testing equipment. Site Testingand correlation with standard cured cylinders are described, as is the evaluation of the dataobtained. Guidance is given on the use of ACI and ASTM documents, and a list ofrecommended publications is provided for further reading.
Executive Summary
In-place testing of concrete has been used mainly on private sector contracts for buildings andother structures. Maturity testing ensured the safety of the CN Tower as it was slipformedduring the winter of 1973. A combination of maturity and pullout testing on that 68-storybuilding made it safe to remove forms from vertical components as early as 11 hours after theconcrete was placed, even in cold weather. A critical fast-track program was maintained withthese procedures.
On many multistory building projects the use of flying-form systems has been optimized byusing in-place testing to complete two to three floors per week, with slabs stripped as early as24 hours after casting. On three such projects the savings attributed to fast-track programswere $143,000, $1,000,000, and $1,665,000. On one project the need for an extra floor offorms was eliminated with consequent savings of $200,000.
In-place testing has come into more widespread use on transportation projects. It was used todetermine compliance with end-result specifications on the Storebaelt bridges in Denmark andon the Channel Tunnel precast concrete tunnel segments.
Demonstration fast-track highway projects by the Federal Highway Administration have usedin-place testing in Virginia (1989), Michigan (1989), Iowa (1989), and Oregon (1991).
In the context of highway pavements and structures, in-place testing can be used to make fast-track construction safe and economical. Cost factors, that are pertinent to the contract can beidentified. Prompt reopening of pavements after repair, overlay, or replacement, results inreduced overhead and financing costs for all parties to a contract. Earlier reuse or release of
formwork, which is a major portion of the total cost of a bridge (50 percent to 60 percent), canproduce significant savings, as can the earlier application of post-tensioning in prestressedstructures. In cold areas, shorter protection and curing periods can result in lower heatingcosts.
Because achieving acceptable test results at an early age is critical to the success of the fast-track concept, all parties have an interest in ensuring that the test results will meet thespecification. Better compliance with curing and protection requirements is in everyone'sinterest.
The concrete formulations used in fast-track construction typically contain state-of-the-artcementitious and admixture systems. Some of these were developed and proven on otherStrategic Highway Research Program projects. In most cases, the result is a concrete superiorto that used traditionally.
Given the trend to end-result specifications, in-place testing provides the agency or thecontractor a reliable way to prove compliance at the ages critical to the contract's progress.
This approach to testing is a powerful tool to win bonuses when incentives are offered tocontractors. In one case where contractors were given the opportunity to fast-track with in-
place testing, the successful contractor offered the owner a discount if allowed to fast-track.
Since there is some innovation involved, and in the interest of fostering a team approach, a pre-
bid meeting is a good way to address the use of in-place testing. Questions about the proposedtest procedures can be discussed prior to their implementation in the field.
The amount of later-age conventional testing can be reduced with confirmation of thecompliance of a concrete mix at early ages.
The maturity and pullout test procedures described in this manual are economical and do notinterrupt the contractor's operations in any way. The required equipment is portable, and theresults are available on site as soon as the tests are complete.
1. Introduction
Historically hardened concrete has been tested primarily to determine whether the potentialstrength of the concrete delivered to a site will meet or exceed a value used in the design ofthe pavement or structure.
The test procedures use beams or cylinders that are made, cured and tested according tostandardized procedures. These specimens, while representative of the concrete delivered tothe site, are not necessarily representative of the concrete strength in-place because ofdifferences in compaction and curing. Standard-cured test specimens are usually tested at anage of 28 days, while in-place tests can be done at any desired age and are usually carried outat early ages.
In recent years, fast-track construction has created a need for early-age estimates of the strengthof concrete in place. Fast-track construction can have considerable economic benefits.
Accelerated construction schedules that put a new, repaired, or overlaid pavement into servicerequire adequate concrete strength to withstand traffic loads. Typical applications includelocalized repairs, replacement of busy intersections, and major slipform paving. Similarly, instructural components, the early removal of forms or the application of post-tensioning, theremoval of shores, and, during cold weather, the termination of curing, can have safetyimplications as well as result in major cost savings.
Test procedures used to determine the in-place strength of the concrete must be reliable. Thetests must also be simple, practical, economical, and capable of implementation withoutdisrupting the construction process.
SHRP Contract C-204, Non-Destructive Testing for Quality Control/Condition Analysis ofConcrete, evaluated all the available in-place test procedures covered at the time by NorthAmerican standards, plus several innovative tests. The evaluation included simulated field
trials on highway structures and pavement. It was concluded that the maturity method andpullout testing are the two preferred test procedures for estimating the in-place strength ofconcrete in a highway structure. The factors used to compare test procedures included theaccuracy of strength estimation, the within-test variability, the cost of testing, and the practicalaspects of use on construction sites.
Maturity testing has been used on North American construction sites since 1970 and pullouttesting since 1978. Both test procedures have been standardized by ASTM and are includedin the ACI report on in-place testing. Both procedures are simple to use and can be
implemented without any interference with construction operations. In addition to savingmoney and increasing safety, these procedures can lead to a reduction in the numbers of moretraditional tests required.
In-place testing may be required by the specifier and carried out by either the owner's forcesor agents, or by the contractor as part of quality control to facilitate operations. Who performsthese tests depends on the type of specification used -- prescription or end -- result. Wherea prescription-type specification is used, the testing will usually be performed by, or on behalfof, the highway agency. Where an end-result specification is used, it will be in the contractor'sinterest to make whatever in-place tests are required to confirm the achievement of earlystrength, avoid penalties, and allow the earliest opening of a pavement or structure. The testsdescribed in this manual can estimate the in-place strength of the concrete beginning a fewhours after casting in any form of highway construction.
These procedures are used primarily to determine strength at early ages, usually up to sevendays. The tests can provide reliable data to determine whether there is sufficient strength sothat formwork and shores can be removed, post-tensioning can be applied, cold weatherprotection can be removed, or a pavement or structure can be put into service.
This manual is intended for field personnel use and provides practical guidance on using thetest procedures. It is based on current practice. Improvements and refinements are constantlybeing reviewed by the appropriate ACI and ASTM committees. For those who want moreinformation on the background of these tests or the latest published improvements, referencesare provided in Chapter 6.
Generally, the faster a structure or pavement is completed, the lower the cost. Formwork isa major construction cost. The sooner it can be removed and reused, the sooner post-tensioning can be applied and shoring removed. The structure or pavement can then be put intoservice, and the overall construction costs are lower.
The safety of the public and the workforce is paramount. The quality of the construction hasto be checked to be sure that the owner receives what is paid for. In-place testing, rationally
applied and properly carried out, can help achieve these objectives of safety, economy, andquality.
Since in-place tests for construction purposes are usually made at early ages, the factors thataffect strength at early ages must be considered. These factors include the mix composition,such as the effects of cement type and pozzolan addition, and the use of retarding oraccelerating admixtures. At high temperatures, strength is gained more rapidly, and at lowtemperatures, more slowly. If the temperature is too low, strength gain will cease.
The use of maturity and pullout testing equipment is explained in detail in the manufacturers'literature. Where the recommendations of this manual differ from those provided by the
6
manufacturers, follow those in this manual. The available equipment at the time of this writingis listed.
Maturity and pullout testing equipment is portable, simple, and can be used at sites remote
from testing laboratories. Construction operations that depend on the attainment of adequatestrength can be implemented as soon as the test measurements have been made.
2. The Principle of In-Place Testing
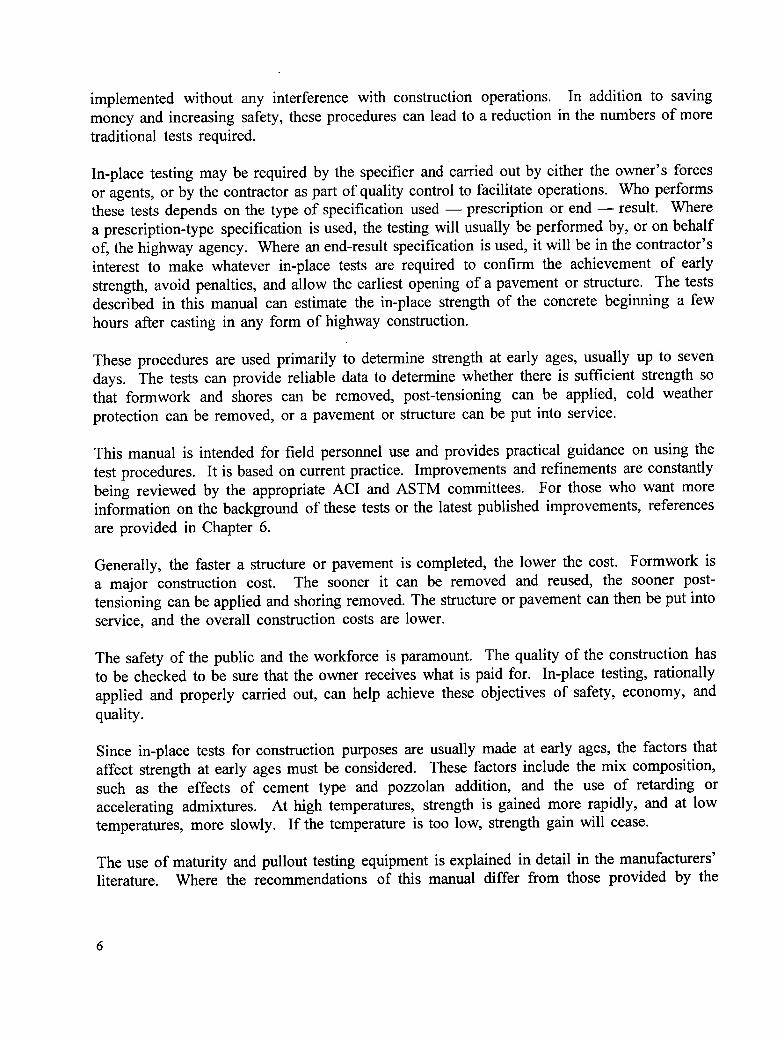
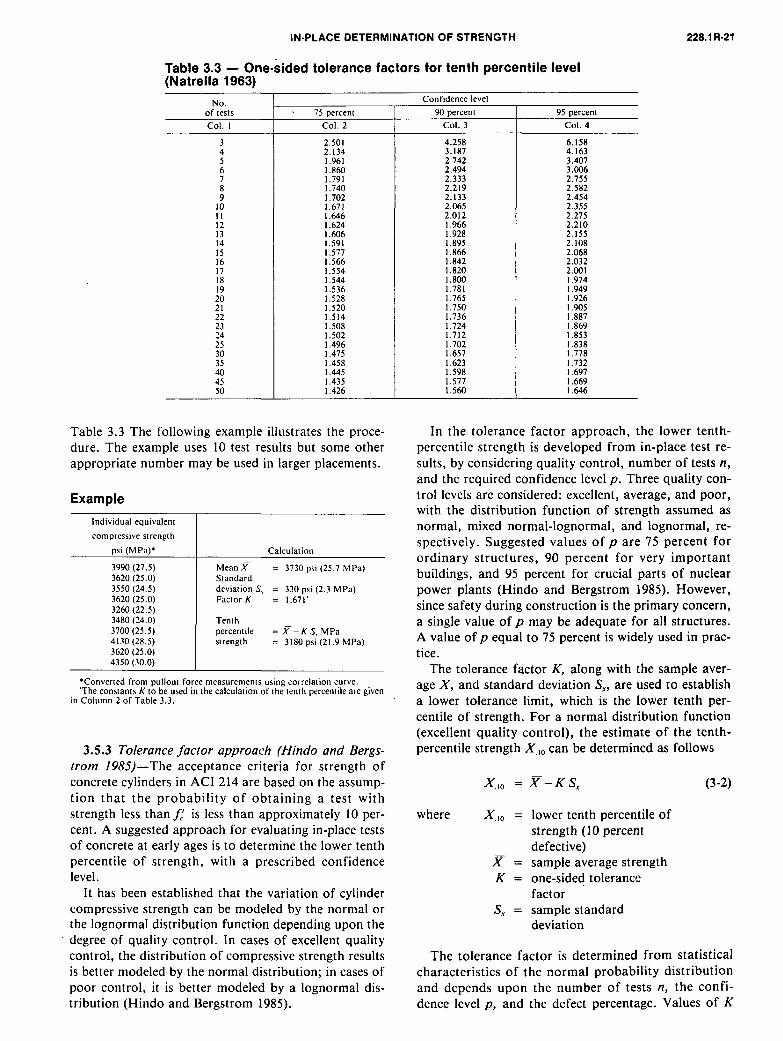
The design of reinforced concrete structures is based on the strength of standard-curedcylinders. Thus it is essential that the result of any in-place test is correlated to the strengthof standard-cured cylinders.
The principle of in-place testing is shown in Figure 2.1. The correlation between valuesobtained by the in-place test and the strength of standard-cured cylinders has to be determined
before the in-place test is used to estimate strength in the field. Correlations provided by themanufacturers of the testing equipment should not be used unless valid data are available toconfirm their validity for the concrete mix being used.
i | i II | i
strength
' I I _ I I I
Test value
Figure 2.1 Principle of in-place tests
3. Maturity Testing
3.1 General
After initial setting, concrete gains strength over time. The higher the temperature during theearly life of the concrete, the faster it gains strength; the lower the temperature, the slower itgains strength. At a very low temperature, generally thought to be in the range of 10°F to14°F (-12°C to -10°C), hydration, and thus strength gain, ceases. The exact temperature atwhich strength gain ceases for each concrete mix depends on its composition and the propertiesof the cementitious materials and chemical admixtures used.
The maturity method is a technique to account for the combined effects of time andtemperature on the strength development of concrete. By measuring the temperature ofconcrete during the curing period, it is possible to estimate the strength at any particular age.The temperature history is used to calculate a maturity index which can be related tocompressive strength by a curve such as that shown in Figure 2.1.
The maturity index is calculated from the temperature history by a maturity function. Onefunction, for example, simply computes the product of time and temperature, and is thusexpressed in degree-hours. Another function computes the equivalent age, which is the ageat a standard temperature that results in the same strength as under the nonstandard condition.The maturity indices can be computed by hand from a recorded temperature history, or theycan be computed automatically by a maturity meter. The second method is recommended asa matter of practicality.
3.2 Options for Use
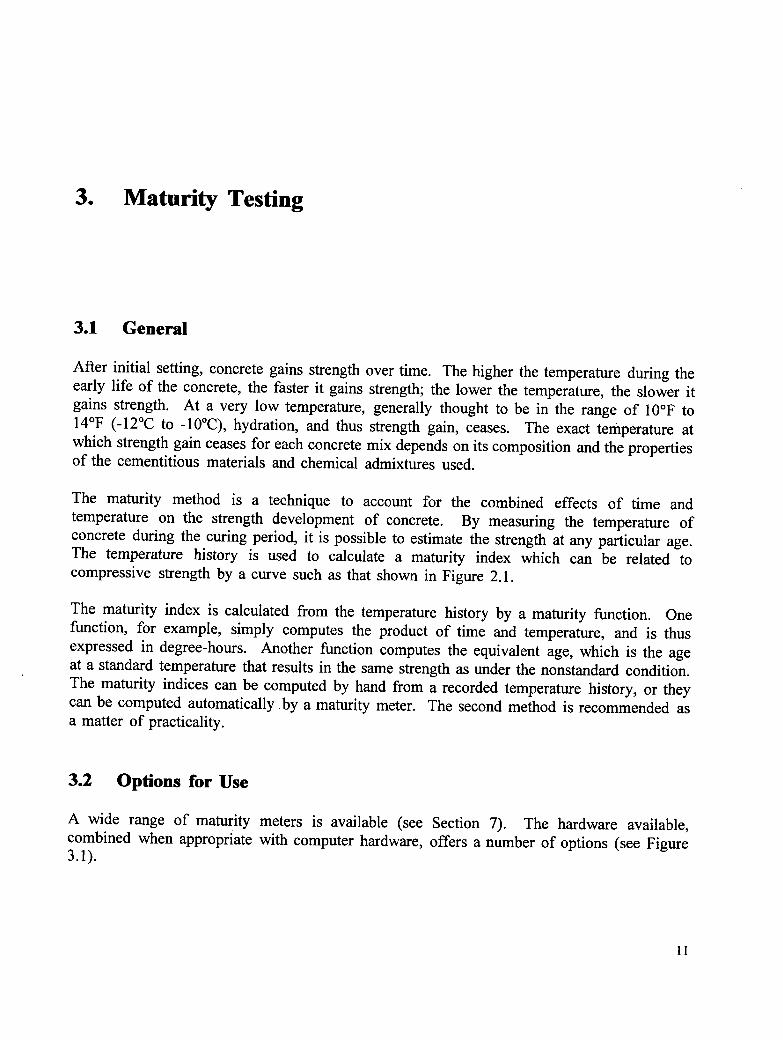
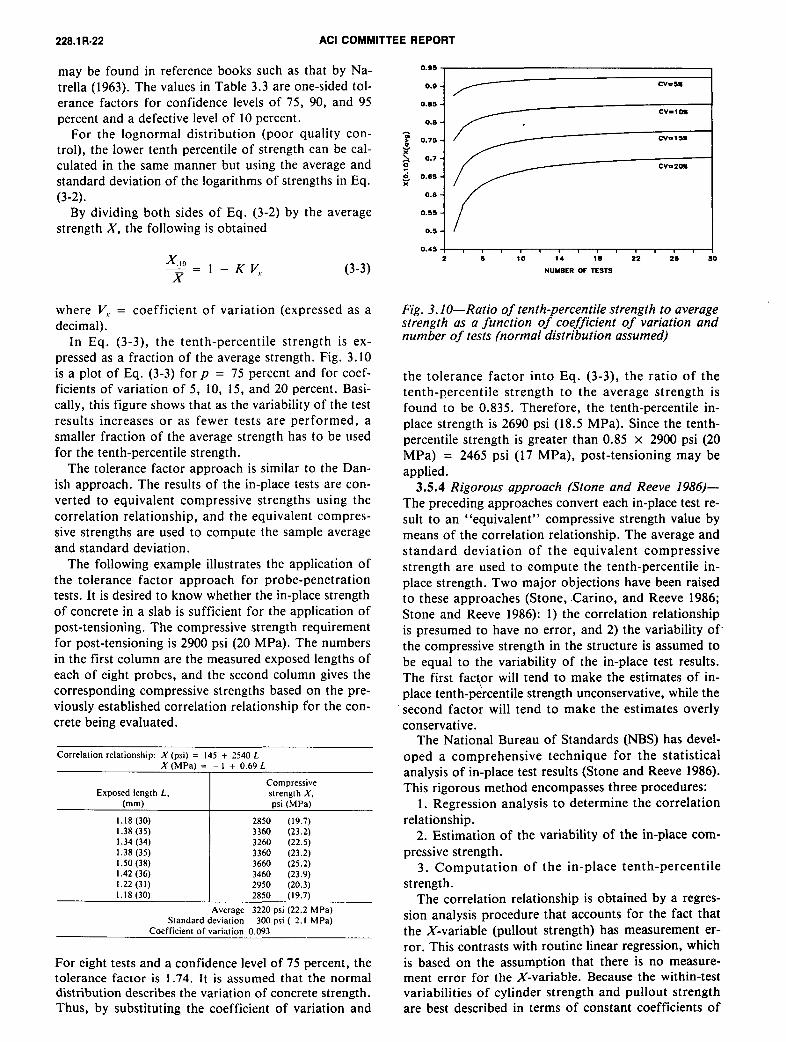
A wide range of maturity meters is available (see Section 7). The hardware available,combined when appropriate with computer hardware, offers a number of options (see Figure3.1).
11
Remotefromsite.Level 4 _ Readingand logging
throughmodem.
Automated computingLevel 3 _ and logging of the
maturity index.
Automated computationLevel 2 _ of the maturity index.
Digital readout.
Level 1 __ Manualtemperaturerecording.
!
Coocre,eI lllB
Single MultipleProbes Probes
Figure 3.1 Maturity testing options of usage
At the lowest level of sophistication, the maturity index can be determined using a
thermocouple wire, recording temperature manually at regular intervals and calculating the
maturity index from the recorded data. At the highest level, meters with multiple channels
have been remotely connected to off-site locations where the strength gain can be monitored.
General practice is to use one of the meters listed in Section 7.
3.3 Limitations
Maturity testing does not measure the strength of the concrete. When structurally critical
operations are involved, such as formwork removal or post-tensioning, maturity testing shouldbe used only as a guide to the probable in-place strength. There must be assurance that the
in-place concrete is of the correct composition. The actual in-place strength should be
estimated by physical tests on pullout inserts cast into the structure. The mixture compositioncan be determined by early-age testing of standard-cured cylinders cast from the same concrete
as the placement being tested (see also Section 5.2).
When pullout tests are intended to confirm the strength estimated from maturity readings, the
tests can be performed as soon as the maturity readings indicate adequate strength.
12
Strength estimates based on maturity readings are valid only if the concrete structure beingtested has received adequate hydration throughout the test period. The concrete must not havefrozen during the test period.
Commercially available maturity meters use one of two functions to compute the maturityindex (Equations 1 and 2 in ASTM C 1074). One of these is the Nurse-Saul function, whichcomputes the product of time and temperature and produces a result expressed in degree-hours(or degree-days). The Nurse-Saul function is based on the assumption that the rate of strengthdevelopment is a linear function of the curing temperature. The other function is based on theso-called Arrhenuis equation, which means that the rate of strength development is assumedto be a nonlinear function of the curing temperature. Meters based on the Arrhenius functionreport the number of equivalent hours or days at the standard temperature. In most instrumentsthe standard temperature is assumed to be 20°C.
It is strongly recommended that only meters using the Arrhenius function be used. This isbecause the Arrhenius function is better able to represent the effects of temperature on strengthdevelopment than the Nurse-Saul function. Meters using the Nurse-Saul function willincreasingly produce less accurate estimates of strength gain as the temperature deviates fromthe standard temperature used to establish the strength-maturity relationship (see Section 3.8).
3.4 Testing Standards
The use of the maturity method to estimate the in-place strength of concrete is covered byASTM C 1074. A copy of the latest edition is in Section 8 of this manual. Further guidanceis given in ACI 228.1R, a copy of which is in Section 10 of this manual.
3.5 Selection of Hardware
Equipment sources are listed in Section 7. The equipment varies from a disposable one-usemeter, to reusable meters with one recording channel, to one meter with 12 recording channels.Selection will be based on site needs. All manufacturers provide after-sales service.
3.6 Calibration
All maturity meters are precalibrated. Checking their calibration on a regular basis does notappear to be necessary. A partial calibration check can be made using the data obtained duringa correlation test by comparing the strength and calculated maturity of standard-cured cylinderswith meter readings. The operation of the electronics can be checked by putting a sensor ina temperature-controlled water bath for a period of time and checking whether the outputagrees with the known result.
13
The accuracy of the maturity index in representing the true effects of temperature and time onstrength development depends on the in-place temperature variation and the constants used inthe maturity function. Some maturity meters allow the user to choose the desired constants,while in others the constants are "hard-wired" in the electronic circuits. If the meter allows
a choice, use the following values, which are now thought to be generally appropriate.
datum temperature for Nurse-Saul equation = 0°C (32°F)activation energy for Arrhenius function = 40,000 J/mol
When the utmost accuracy is desired, the most precise values for the datum temperature oractivation energy can be determined from tests following the procedure in ASTM C i074.
3.7 Maintenance
See manufacturers' manuals for guidance.
3.8 Correlation with Standard-Cured Cylinders
Before the maturity method can be used, a correlation must be established between strengthand maturity index. Follow the procedure detailed in ASTM C 1074 (Section 8). Only thetype and make of meter used in the correlation tests should be used on the project for whichthe correlation is made. After correlation, the datum temperature or activation energy settingson the meters must not be changed.
3.9 Installation on Site
With the exception of the disposable one-use meter, all the maturity meters listed in Section7 use thermocouple--or thermistor--type sensors. The active end of each sensor can be insertedin the fresh concrete at any location, in an open surface or through very small holes in theforms. The meter can be remote from the test location(s). A sensor should be placed at eachlocation where a strength estimation is required. In cold weather, place sensors at locationsexpected to experience the lowest temperatures. Generally it is recommended that the sensorbe within 2 to 4 inches of the exposed or formed surface of a placement. The SHRP C 204research project found that if the concrete surface is protected from a high rate of heat loss,the difference in maturity index between the center and surface of a pavement or bridge deck,or the center and surface of a 1-ft (300 mm) thick wall, was negligible. In an overlay, placesensors at mid-depth.
14
Tie the sensor wire to reinforcement to avoid displacement during concrete placing. In runningthe wire back to the meter location, consider the possibilities for breakage by constructionpersonnel during concrete placing and subsequent construction operations. In criticalplacements, use duplicate sensors in different locations with similar curing conditions.
3.10 Number of Measurement Points
Measurement points in Table 3.1 are suggested for guidance. Judgment must be applied ona site-specific basis. Much will depend on such factors as the number of columns concretedin one day, the perceived effectiveness of protection in cold weather, and the sequence ofconcrete placement. In a group of columns, those exposed to the most adverse curingconditions should be instrumented. In a large pavement or overlay placement, sensors shouldbe located in concrete placed late in the placement, since it will be the weakest.
Table 3.1 Suggested measurement points for pullout tests
IIII
Structure Size of Concrete Number of
Component Placement Sensors
Slabs, beams and 100 yd3 5abutment walls
Columns 2 - 10 yd3 1 per column>10 yd3 2 per column
Pavement, pavement 1000 yd2 1overlays per repair 1 -2Pavement repairs
I
Note: 1 yd_= 0.7645 me, 1 ydL= 0.8361 m L
3.11 Operation on Site
Read each meter channel at intervals near the time that the concrete is expected to reach thestrength required.
3.12 Evaluation of Data
Use the in-place maturity readings and the strength-maturity relationship to estimate the in-place strength at the location of each sensor.
15
3.13 Application of Data and Safety
The in-place maturity readings will determine whether enough strength has developed to permitthe start of significant operations or to open pavements to traffic. Because the in-placemeasurement is only of temperature, there is no assurance that the concrete has attained thepredicted strength. This is because the maturity method cannot detect errors in batching orcuring. In the case of operations such as form removal and the application of post-tensioning,public and workforce safety is involved. It must be re-emphasized that decisions to proceedwith these operations should not be made on the basis of maturity tests alone. Supportingphysical tests of pullouts or standard-cured cylinders are required on the concrete in or fromthe placement being tested. See Section 5.
16
4. Pullout Testing
4.1 General :*t
Pullout testing can be performed usingmetal discs (called inserts) installed withinthe formwork prior to concreting, or byinserting an expandable metal disc into anunder-reamed hole drilled into hardened
concrete. The former is by far the morecommonly used pullout test procedure. Inearly-age testing, the latter procedure wouldbe used only when the preplaced inserts hadnot been installed prior to concreting.
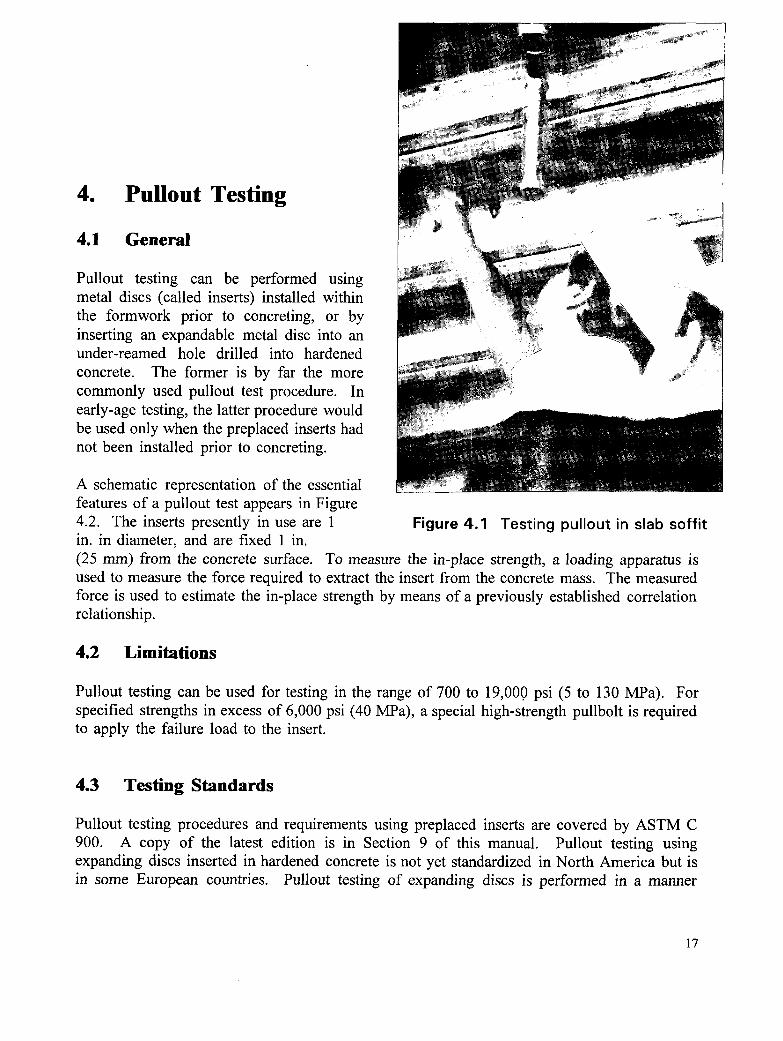
A schematic representation of the essentialfeatures of a pullout test appears in Figure4.2. The inserts presently in use are 1 Figure 4.1 Testing pullout in slab soffitin. in diameter, and are fixed 1 in.(25 ram) from the concrete surface. To measure the in-place strength, a loading apparatus isused to measure the force required to extract the insert from the concrete mass. The measuredforce is used to estimate the in-place strength by means of a previously established correlationrelationship.
4.2 Limitations
Pullout testing can be used for testing in the range of 700 to 19,00.0 psi (5 to 130 MPa). Forspecified strengths in excess of 6,000 psi (40 MPa), a special high-strength pullbolt is requiredto apply the failure load to the insert.
4.3 Testing Standards
Pullout testing procedures and requirements using preplaced inserts are covered by ASTM C900. A copy of the latest edition is in Section 9 of this manual. Pullout testing usingexpanding discs inserted in hardened concrete is not yet standardized in North America but isin some European countries. Pullout testing of expanding discs is performed in a manner
17
similar to the C 900 procedure and produces similar results. Further guidance on the standardpullout test is given in ACI 228.1R, a copy of which is in Section 10 of this manual.
To date, only one manufacturer produces equipment for drilling into hardened concrete andinserting an expandable pullout insert. This manufacturer provides detailed instructions on thecorrect procedure, which takes significantly longer to carry out than a test on a preplacedinserts. In early age testing this procedure would be used only if preplaced inserts had beeninadvertently omitted prior to concreting.
4.4 Selection of Hardware
Sources of pullout testing equipment are listed in Section 7. The equipment produced by allthe suppliers listed complies with the requirements of ASTM C 900. Selection can be madeon the basis of price, delivery, and personal experience. Both manufacturers provide after-salerecalibration and repair services.
4.5 Calibration
ASTM C 900 requires that all instruments be recalibrated at least once a year and after anyrepairs or adjustments to assure that the pullout force is measured accurately. Recalibrationis also appropriate any time there is reason to doubt the accuracy of an instrument.
A procedure for recalibrating is given in an appendix to C 900. This procedure does not applyto the pullout testing equipment listed in Section 7. When possible, the owner of theequipment should recalibrate, but if suitable equipment is not available, the suppliers listed inSection 7 provide calibration services.
4.6 Maintenance
Routine maintenance includes keeping the testing machines clean and periodically oilingmoving parts. The testing machines should not be subjected to shock. The equipment shouldbe kept in its carrying case when not in use. Manufacturers' manuals supplied with theequipment provide advice on field maintenance. Major maintenance and repairs should becarried out by the manufacturer.
4.7 Correlation with Standard-Cured Cylinders
For each concrete mix to be tested in-place, a correlation must be established before testingstarts between the force required to load the pullout insert to failure and the compressivestrength (ASTM C 39) of standard-cured cylinders.
18
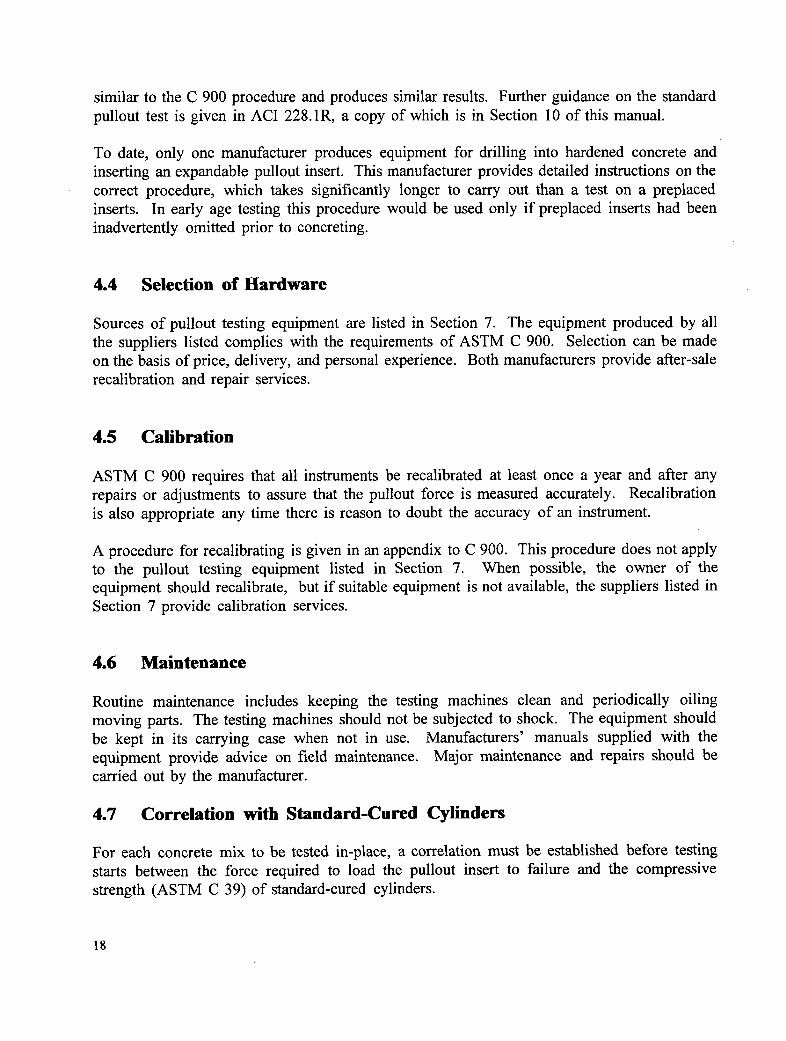
A correlation should include tests using at least six strength levels with a strength range inexcess of 3,000 psi (20 MPa). This can be achieved by casting twelve standard-cured cylindersand testing pairs at ages of 1, 2, 3, 7, 14, and 28 days. At the same ages, sets of eight replicatepullout tests are made. The pullout inserts are cast in 8-in.(200 mm) cube molds with the sameconcrete used to cast the standard-cured cylinders. Four pullout inserts are cast in each of twocubes for each test age.
The test cubes must be cured under conditions identical to the standard cured cylinders so thatboth types of test specimens have the same maturity.
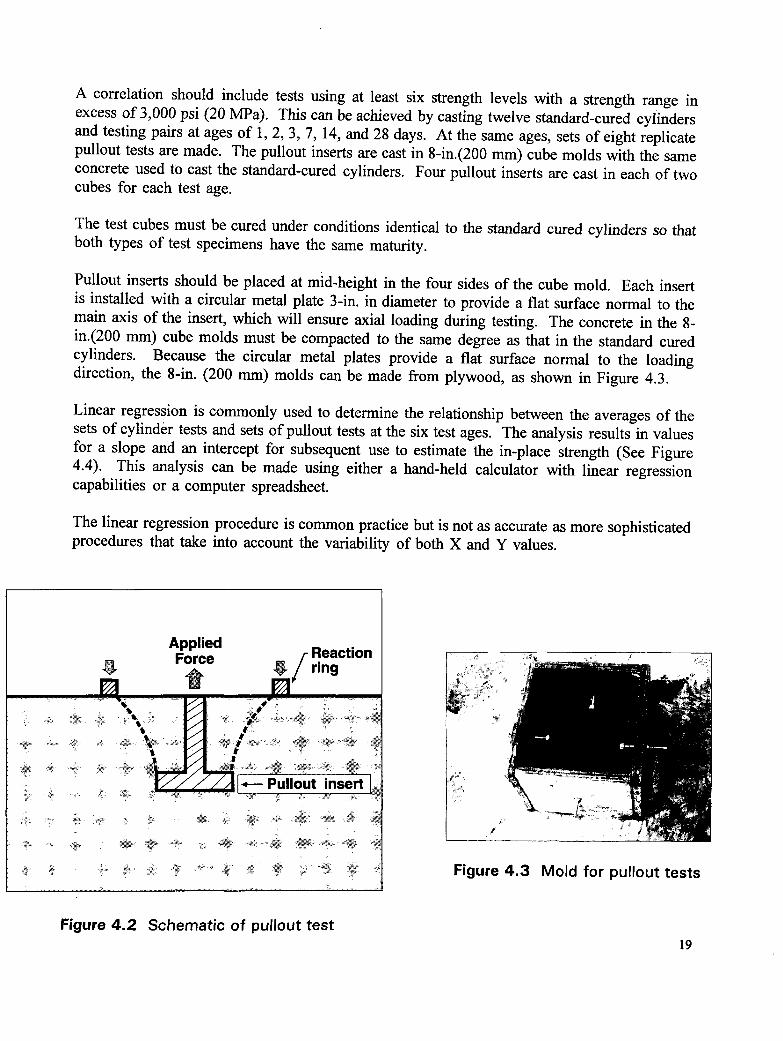
Pullout inserts should be placed at mid-height in the four sides of the cube mold. Each insertis installed with a circular metal plate 3-in. in diameter to provide a flat surface normal to themain axis of the insert, which will ensure axial loading during testing. The concrete in the 8-in.(200 mm) cube molds must be compacted to the same degree as that in the standard curedcylinders. Because the circular metal plates provide a flat surface normal to the loadingdirection, the 8-in. (200 mm) molds can be made from plywood, as shown in Figure 4.3.
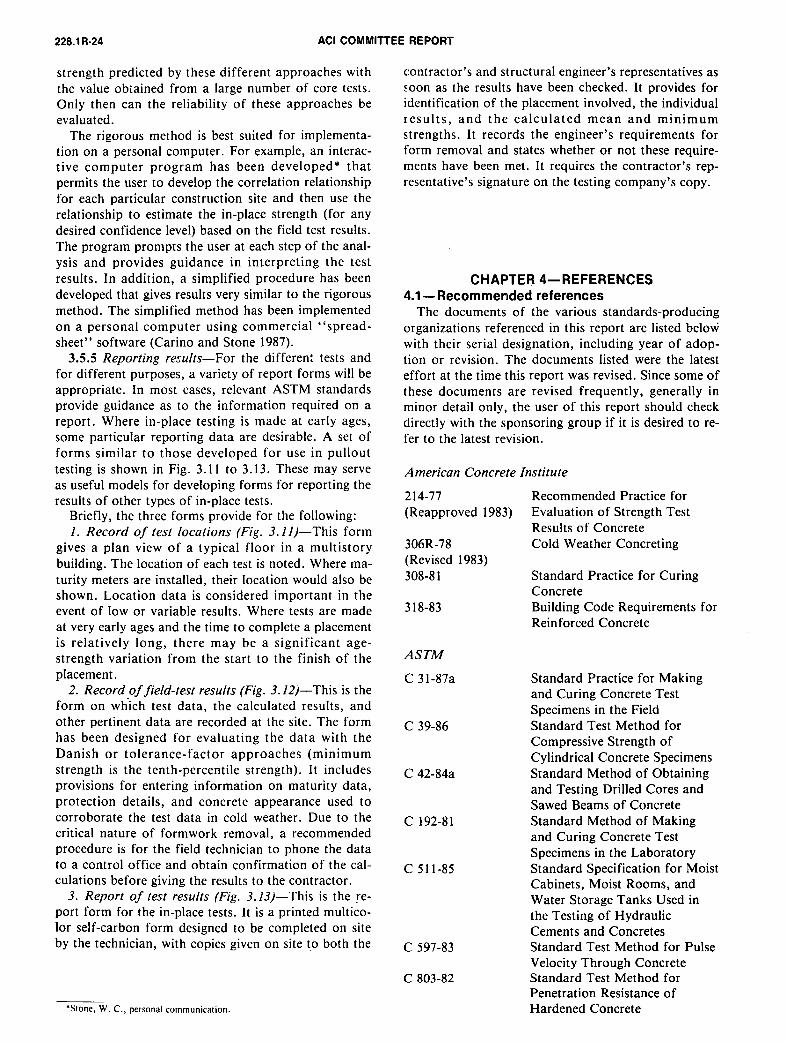
Linear regression is commonly used to determine the relationship between the averages of thesets of cylinder tests and sets of pullout tests at the six test ages. The analysis results in valuesfor a slope and an intercept for subsequent use to estimate the in-place strength (See Figure4.4)i This analysis can be made using either a hand-held calculator with linear regressioncapabilities or a computer spreadsheet.
The linear regression procedure is common practice but is not as accurate as more sophisticatedprocedures that take into account the variability of both X and Y values.
Applied
Force / Reaction __ ._ __ ring 1....
• Pullout insert _i
,_, z _, _ _, _ _"o _ _ :_ Figure 4.3 Mold for pullout tests
Figure 4.2 Schematic of pullout test19
On the basis of a regression analysis, estimated strengths can be calculated for a range ofpullout loads and a table prepared similar to Table 4.1. Note that Table 4.1 is given only asan example of how to set up a table. A similar table has to be produced for each pullout testerused and for each concrete mix.
Each correlation is valid only for the mix tested and the pullout machine used in the correlationtests. If more than one machine is to be used, the correlation data must be converted using thelatest calibration data for each machine to be used.
8000
7000
60000 ,
5000 • "_ 4000
°_ 3000
2000
1000
I I I I I I I
10 15 20 25 30 35 40
Pullout Force-kN
Figure 4.4 Typical relationship between pullout force and thecompressive strength of standard cured cylinders
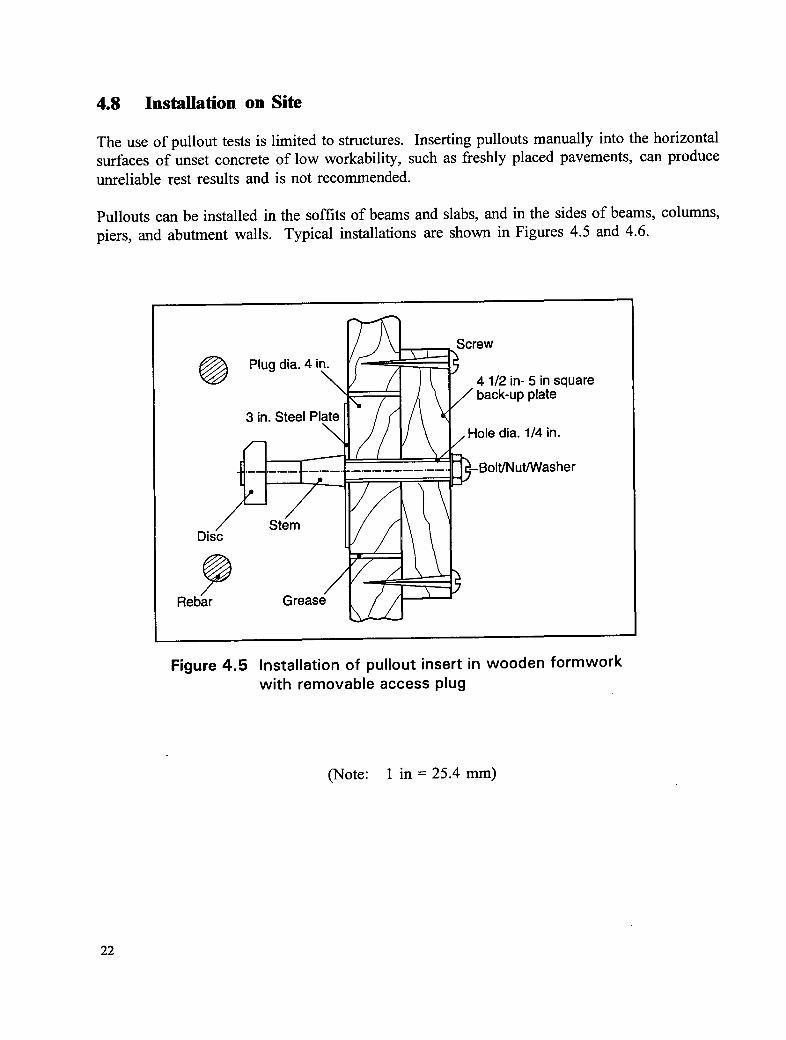
Figure 4.5 Installation of pullout insert in wooden formwork
with removable access plug
(Note: 1 in = 25.4 mm)
22
-- GravelSteel form
SteelPlate
Machinescrew
Butterflybolt
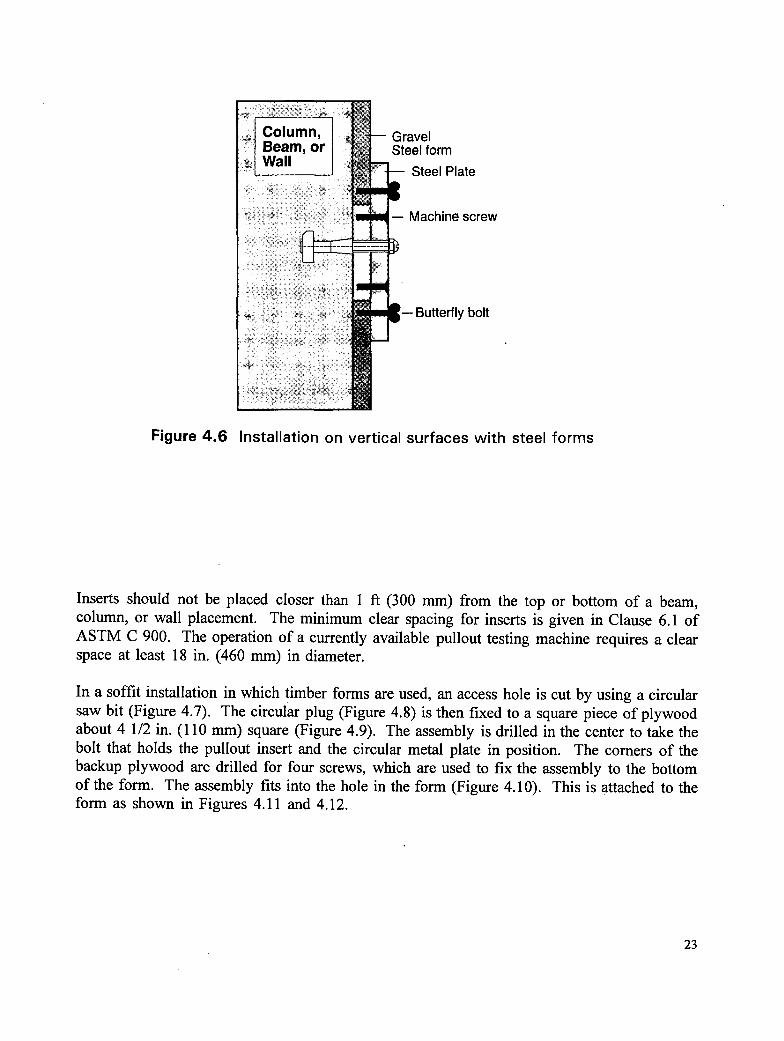
Figure 4.6 Installation on vertical surfaces with steel forms
Inserts should not be placed closer than 1 ft (300 mm) from the top or bottom of a beam,column, or wall placement. The minimum clear spacing for inserts is given in Clause 6.1 ofASTM C 900. The operation of a currently available pullout testing machine requires a clearspace at least 18 in. (460 mm) in diameter.
In a soffit installation in which timber forms are used, an access hole is cut by using a circularsaw bit (Figure 4.7). The circular plug (Figure 4.8) is then fixed to a square piece of plywoodabout 4 1/2 in. (110 mm) square (Figure 4.9). The assembly is drilled in the center to take thebolt that holds the pullout insert and the circular metal plate in position. The corners of thebackup plywood are drilled for four screws, which are used to fix the assembly to the bottomof the form. The assembly fits into the hole in the form (Figure 4.10). This is attached to theform as shown in Figures 4.11 and 4.12.
23
Figure 4.7 Use of a circular bit saw to cut an access hole in a soffit form
Figure 4.8 Circular plug obtained by use of a circular saw
|
Figure 4.9 Circular plug affixed to plywood square with bolt, pullout insert,and circular metal plate
Figures 4.7 - 4.12 Installation sequence for pullout insert in the soffitof a slab
24
Figure 4.10 Reverse side of timber form
i ',? 'I
i'
, , ,, jI
, ; ..... , 7
j i• 2
Figure 4.11 Attachments of pullout assembly Figure 4.12 Pullout asembly screwedto reverse side of form into place
25
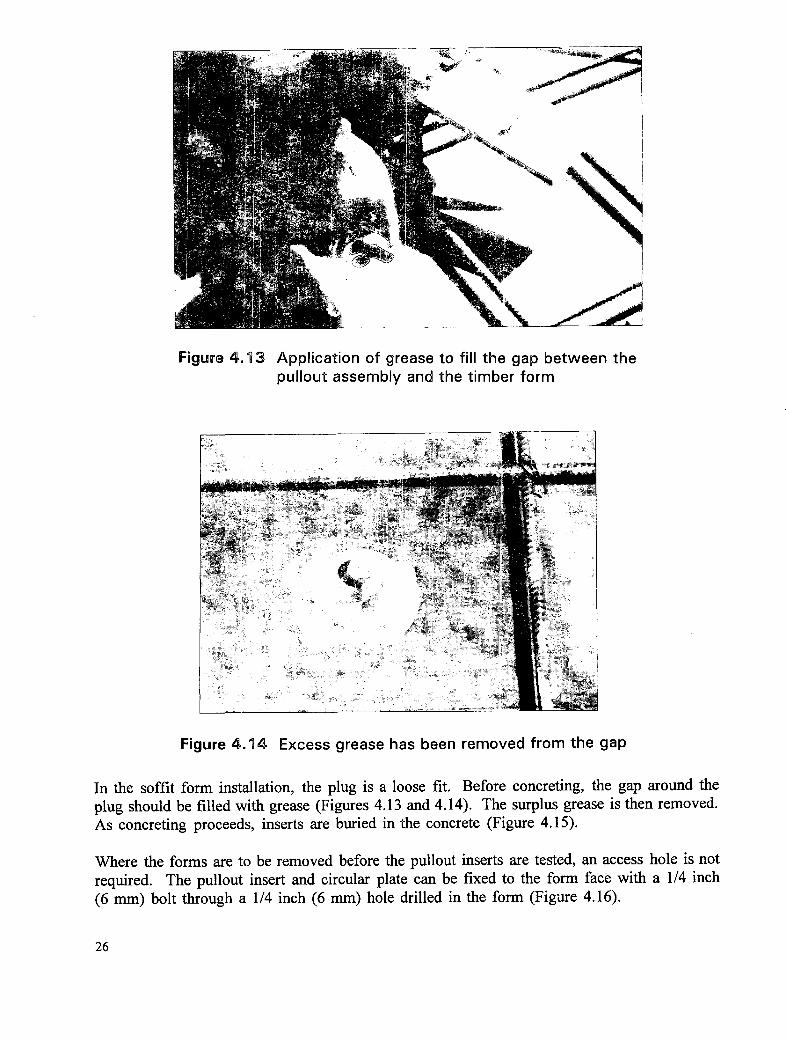
Figure 4.33 Application of grease to fill the gap between thepullout assembly and the timber form
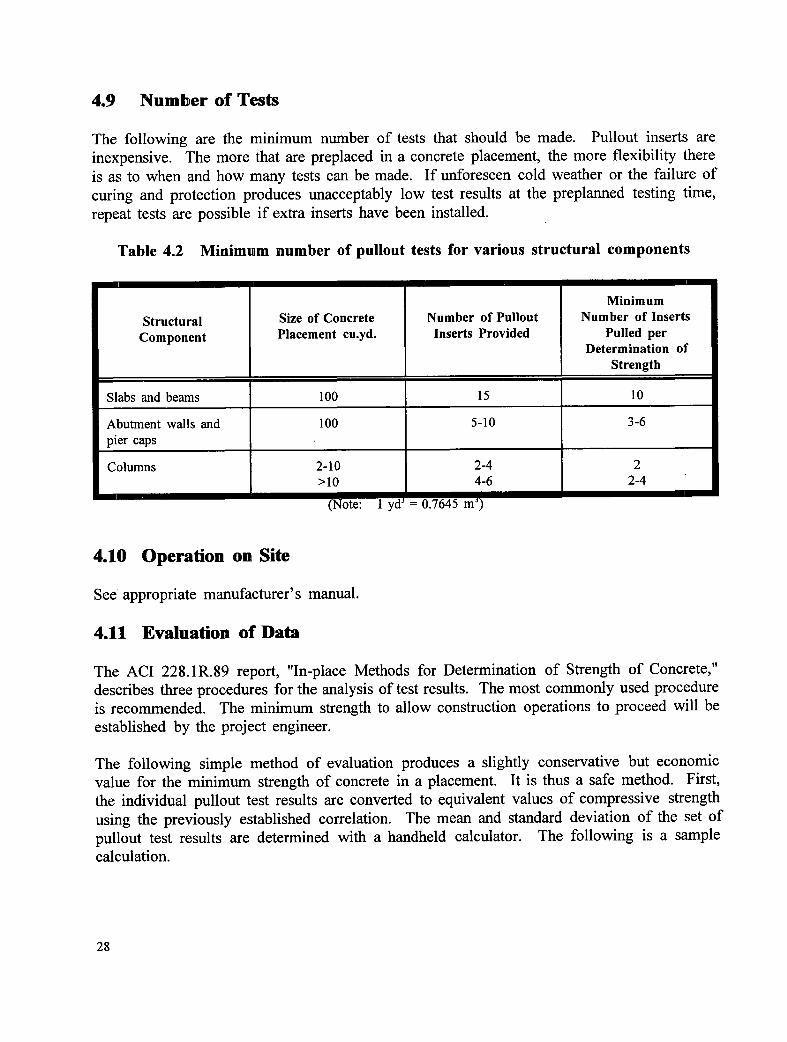
Figure 4.14 Excess grease has been removed from the gap
In the soffit form installation, the plug is a loose fit. Before concreting, the gap around theplug should be filled with grease (Figures 4.13 and 4.14). The surplus grease is then removed.As concreting proceeds, inserts are buried in the concrete (Figure 4.15).
Where the forms are to be removed before the pullout inserts are tested, an access hole is notrequired. The pullout insert and circular plate can be fixed to the form face with a 1/4 inch(6 mm) bolt through a 1/4 inch (6 mm) hole drilled in the form (Figure 4.16).
26
Figure 4.1 5 Concrete is poured over the installed pullout assembly
Figure 4.16 A pullout asssembly installation 27where forms are to be removed
before pullout evaluationsare to be performed
4.9 Number of Tests
The following are the minimum number of tests that should be made. Pullout inserts areinexpensive. The more that are preplaced in a concrete placement, the more flexibility thereis as to when and how many tests can be made. If unforeseen cold weather or the failure ofcuring and protection produces unacceptably low test results at the preplanned testing time,repeat tests are possible if extra inserts have been installed.
Table 4.2 Minimum number of pullout tests for various structural components
Minimum
Structural Size of Concrete Number of Pullout Number of Inserts
Component Placement eu.yd. Inserts Provided Pulled perDetermination of
Strength
Slabs and beams 100 15 10
Abutment walls and 100 5-10 3-6
pier caps
Columns 2-10 2-4 2>10 4-6 2-4
(Note: 1 yd- = 0.7645 m')
4.10 Operation on Site
See appropriate manufacturer's manual.
4.11 Evaluation of Data
The ACI 228.1R.89 report, "In-place Methods for Determination of Strength of Concrete,"describes three procedures for the analysis of test results. The most commonly used procedureis recommended. The minimum strength to allow construction operations to proceed will beestablished by the project engineer.
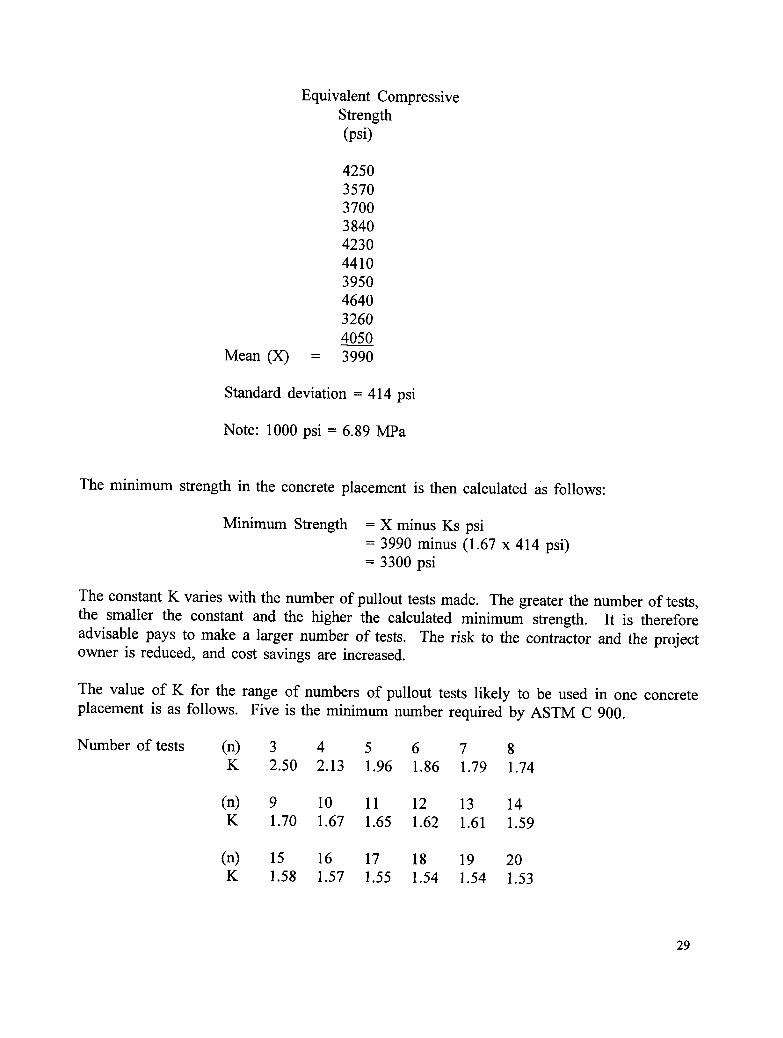
The following simple method of evaluation produces a slightly conservative but economicvalue for the minimum strength of concrete in a placement. It is thus a safe method. First,the individual pullout test results are converted to equivalent values of compressive strengthusing the previously established correlation. The mean and standard deviation of the set ofpullout test results are determined with a handheld calculator. The following is a samplecalculation.
28
Equivalent CompressiveStrength(psi)
4250357037003840423044103950464032604050
Mean (X) = 3990
Standard deviation -- 414 psi
Note: 1000 psi -- 6.89 MPa
The minimum strength in the concrete placement is then calculated as follows:
Minimum Strength = X minus Ks psi= 3990 minus (1.67 x 414 psi)= 3300 psi
The constant K varies with the number of pullout tests made. The greater the number of tests,the smaller the constant and the higher the calculated minimum strength. It is thereforeadvisable pays to make a larger number of tests. The risk to the contractor and the projectowner is reduced, and cost savings are increased.
The value of K for the range of numbers of pullout tests likely to be used in one concreteplacement is as follows. Five is the minimum number required by ASTM C 900.
Number of tests (n) 3 4 5 6 7 8K 2.50 2.13 1.96 1.86 1.79 1.74
For pavement contracts the project engineer may elect to use the average of the test resultsinstead of the minimum strength calculated as above.
4.12 Appfication of Data and Safety
If the value of minimum strength determined by the procedure in 4.11 equals or exceeds thevalue specified by the project engineer then it is safe to proceed with the construction operationcontrolled by this testing. However, some precautions must be taken to ensure the validity ofthe test results.
First, it is important to be sure that the concrete has not been frozen at any time prior to thetest and is not frozen at the time of the test.
Second, the minimum value calculated must be checked independently. This can be done byphoning an authorized engineer or technician at the head office, repeating the individual testresults, and having the calculation of minimum strength checked. The construction operationcan then proceed using documentation described in Section 4.13.
4.13 Sample Forms
Model forms are given in Section 3.5.5 of ACI 228.1R (Section 10 of this manual).
30
5. Combined Maturity-Pullout Testing
5.1 For non-structural application s such as pavement overlays or repairs, the use of maturitymeasurements alone is adequate to give an estimate of in-place strength, provided aninitial correlation has been made with the concrete mix in use.
5.2 Where structural safety considerations apply, as when forms are removed or post-tensioning is applied, maturity tests should not be used alone. It is necessary to verifythat the in-place concrete has the required strength potential. Separate standard-curedcylinders made from the same concrete placement can be tested before an in-placestrength determination is required. The results can then be used to interpret thematurity data.
The standard-cured cylinders are used to ensure that the concrete in the placement hasthe correct composition. When the correlation tests are done, the early-age strength ofthe target mixture is established. Early-age compressive strengths of standard-curedcyl!nders made from the same concrete placed in the structure will indicate whether thein-place concrete is similar to the target mixture. The ratio of the early-age strengthsof the field and laboratory concretes can be used to adjust the strength estimated by thematurity method.
A recommended technique is to combine maturity tests with pullout tests. Maturityreadings can be taken a number of times without any loss of testing locations. Whenmaturity readings indicate that the required strength has been reached, pullout tests canbe made on the same placement to confirm that the required strength has been reached.This is a safe and efficient procedure and can reduce the number of pullout insertsrequired. Because pullout tests are not made until maturity tests have establishedthatthe required strength has been achieved, there is no wastage of pullout inserts resultingfrom premature testing.
The recommended interrelationship of maturity and pullout tests is shown in Figures5.1 - 5.3.
If the combined method is used, both test procedures can be correlated with standard-cured cylinders in one correlation test program.
31
I MaturityReading
Strength-Maturity
Relationship
I EstimatedStrength
Figure 5.1 Non-structural members
Maturity
Maturity ReadingReading
Strength-Maturity
Early-ageTests " Relationship
on
StandardCylinders ' r
Strength-Maturity I "13metoPerformRelationship "= I Pullout Test
I
I Pullout TestEstimated
Strength I
EstimatedStrength
Figure 5.2 Structural members
Figure 5.3 Structural members
32
6. Recommended Further Reading and Bibliography
This manual includes copies of ASTM C 1074, ASTM C 900, and ACI 228.1R, and providesall the information necessary to perform and interpret maturity and pullout tests. For thosewho wish a better understanding of these procedures, the following documents arerecommended.
Handbook on Nondestructive Testing of Concrete. V.M. Malhotra and N.J. Carino, eds.CRC Press, Boca Raton, 1991
This is the most up-to-date text book on the subject.
In Situ/Nondestructive Testing of Concrete. V.M. Malhotra, ed. ACI SP82, Detroit,1984
These are the proceedings of an intemational conference in Ottawa, and contain someimportant papers on maturity and pullout testing.
Four annotated bibliographies of papers on the nondestructive testing of concrete have beenprepared by the Canada Centre for Mineral and Energy Technology (CANMET) and can beobtained from
CANMET
Energy Mines and Resources Canada405 Rochester StreetOttawa, Ontario K1A 0G1 Canada
The four documents cover papers from 1934 to 1991 as follows:
Part I: 1975-1984 CANMET Special PublicationSP 85-5E, 1985
Part II: 1934-1974 CANMET Mineral Sciences
Division Report MSL 89-127(R)
Part III: 1984-1989 CANMET Division ReportMSL 91-25(R)
33
Part IV: 1989-1991 CANMET Minerals Sciences LaboratoriesJune 1992
These documents include a brief summary of many of the papers published on maturity andpullout testing during the period 1934-1991.
The following important paper has been published since the compilations by CANMET.
Carino, N.J., and Tank R.C. "Maturity Functions for Concretes Made withVarious Cement and Admixtures," ACI Materials Journal, Vol 89, No. 2, March-April 1992, pp 188-196.
34
•7. Sources of Hardware, Product Sheets andManufacturers' Manuals
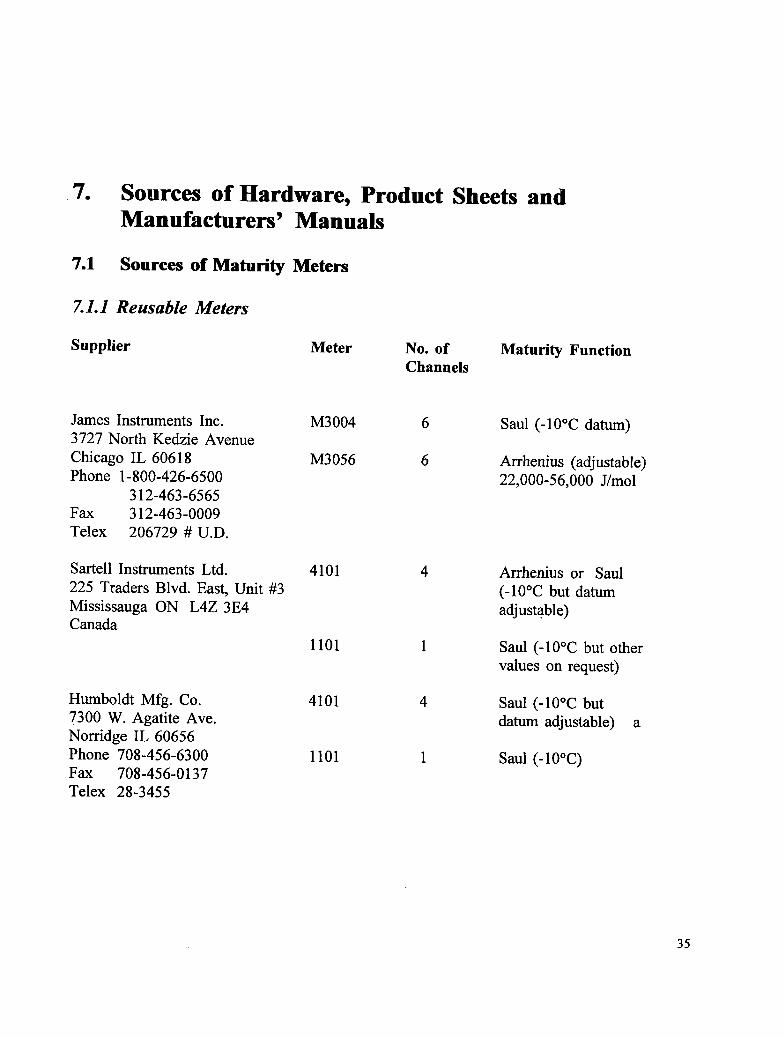
7.1 Sources of Maturity Meters
7.1.1 Reusable Meters
Supplier Meter No. of Maturity FunctionChannels
James Instruments Inc. M3004 6 Saul (-10°C datum)3727 North Kedzie Avenue
Chicago IL 60618 M3056 6 Arrhenius (adjustable)Phone 1-800-426-6500 22,000-56,000 J/mol
312-463-6565Fax 312-463-0009Telex 206729 # U.D.
Sartell Instruments Ltd. 4101 4 Arrhenius or Saul
225 Traders Blvd. East, Unit #3 (-10°C but datumMississauga ON L4Z 3E4 adjusta.ble)Canada
1101 1 Saul (-10°C but othervalues on request)
Humboldt Mfg. Co. 4101 4 Saul (-10°C but7300 W. Agatite Ave. datum adjustable) aNorridge IL 60656Phone 708-456-6300 1101 1 Saul (-10°C)Fax 708-456-0137Telex 28-3455
35
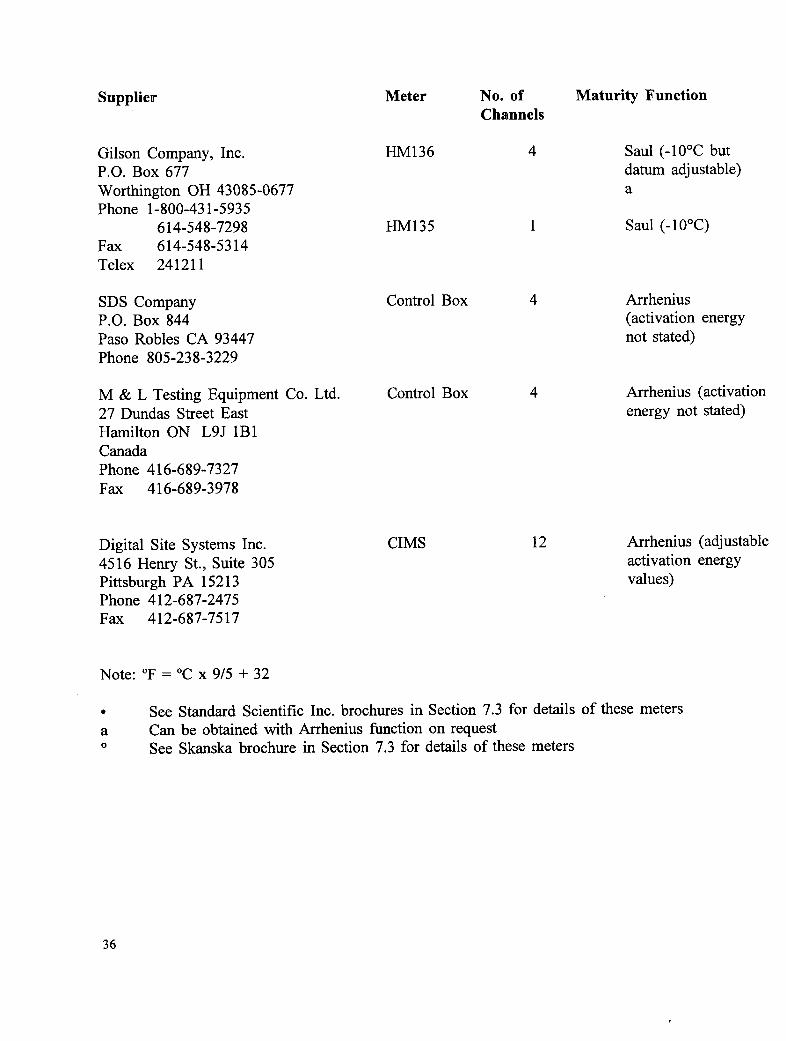
Supplier Meter No. of Maturity FunctionChannels
Gilson Company, Inc. HM136 4 Saul (-10°C butP.O. Box 677 datum adjustable)
SDS Company Control Box 4 ArrheniusP.O. Box 844 (activation energyPaso Robles CA 93447 not stated)Phone 805-238-3229
M & L Testing Equipment Co. Ltd. Control Box 4 Arrhenius (activation27 Dundas Street East energy not stated)Hamilton ON L9J 1B1CanadaPhone 416-689-7327Fax 416-689-3978
Digital Site Systems Inc. CIMS 12 Arrhenius (adjustable4516 Henry St., Suite 305 activation energyPittsburgh PA 15213 values)Phone 412-687-2475Fax 412-687-7517
Note: °F = °C x 9/5 + 32
• See Standard Scientific Inc. brochures in Section 7.3 for details of these metersa Can be obtained with Arrhenius function on requesto See Skanska brochure in Section 7.3 for details of these meters
36
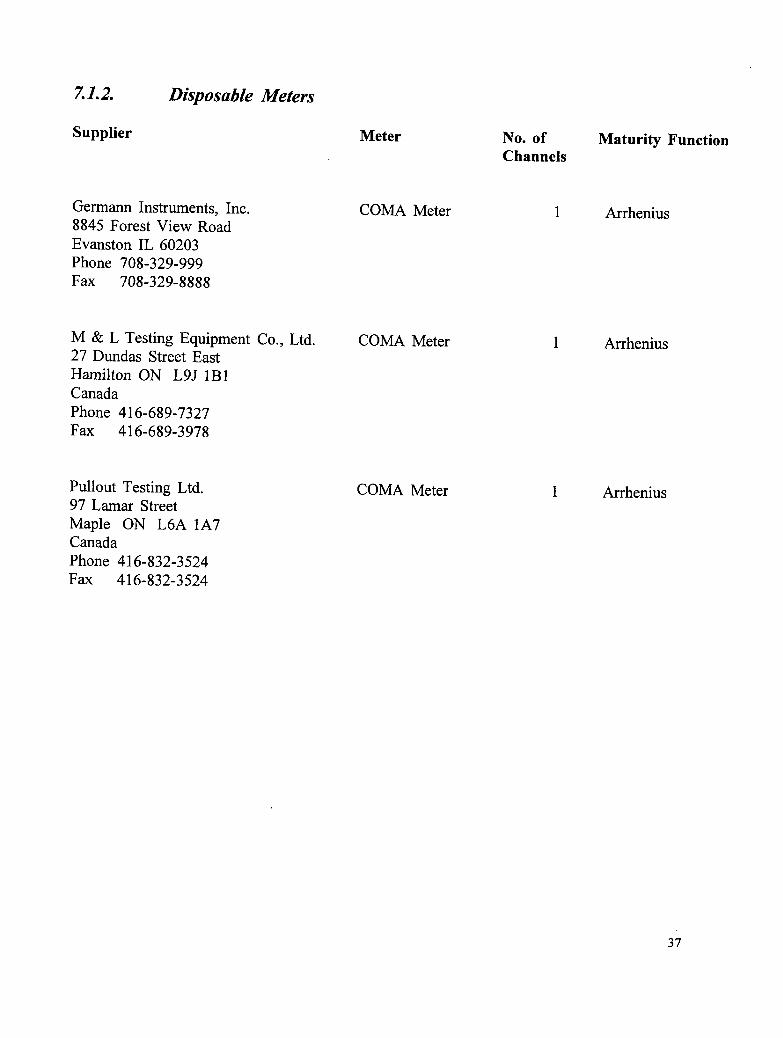
7.1.2. Disposable Meters
Supplier Meter No. of Maturity FunctionChannels
Germann Instruments, Inc. COMA Meter 1 Arrhenius8845 Forest View RoadEvanston IL 60203Phone 708-329-999Fax 708-329-8888
M & L Testing Equipment Co., Ltd. COMA Meter 1 Arrhenius27 Dundas Street EastHamilton ON L9J 1B1CanadaPhone 416-689-7327Fax 416-689-3978
Pullout Testing Ltd. COMA Meter 1 Arrhenius97 Lamar Street
Maple ON L6A 1A7CanadaPhone 416-832-3524Fax 416-832-3524
37
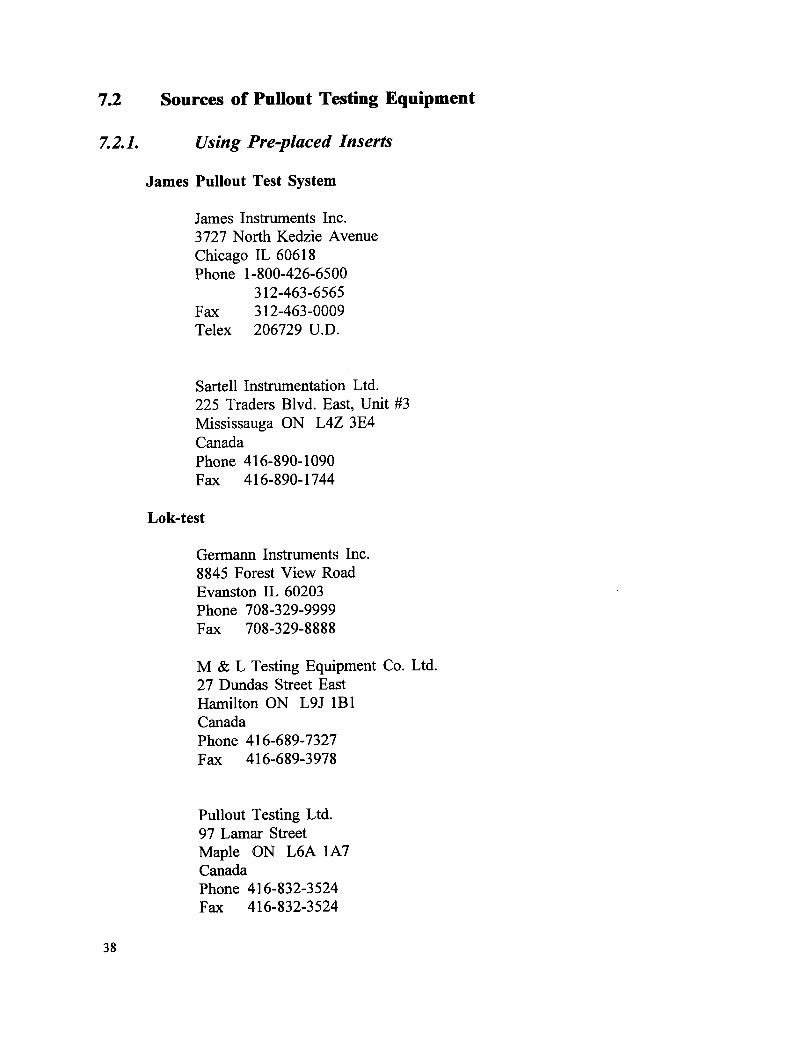
7.2 Sources of Pullout Testing Equipment
7.2.1. Using Pre-placed Inserts
James Pullout Test System
James Instruments Inc.3727 North Kedzie Avenue
Chicago IL 60618Phone 1-800-426-6500
312-463-6565Fax 312-463-0009Telex 206729 U.D.
Sartell Instrumentation Ltd.225 Traders Blvd. East, Unit #3Mississauga ON L4Z 3E4CanadaPhone 416-890-1090Fax 416-890-1744
Lok-test
Germann Instruments Inc.8845 Forest View RoadEvanston IL 60203Phone 708-329-9999Fax 708-329-8888
M & L Testing Equipment Co. Ltd.27 Dundas Street EastHamilton ON L9J 1B1CanadaPhone 416-689-7327Fax 416-689-3978
Pullout Testing Ltd.97 Lamar Street
Maple ON L6A 1A7CanadaPhone 416-832-3524Fax 416-832-3524
38
7.2.2. Inserts Inserted in Drilled Holes in Hardened Concrete
Capo-Test
Germann Instruments Inc.8845 Forest View RoadEvanston IL 60203Phone 708-329-9999Fax 708-329-8888
M & L Testing Equipmem Co. Ltd.27 Dundas Street EastHamilton ON L9J 1B1CanadaPhone 416-689-7327Fax 416-689-3978
Pullout Testing Ltd.97 Lamar Street
Maple ON L6A 1A7CanadaPhone 416-832-3524Fax 416-832-3524
39
Appendix A
ASTM C 1074
Reprinted, with permission, from the Annual Book of ASTM Standards, copyrightAmerican Society for Testing and Materials, 1916 Race Street, Philadelphia, PA 19103.
If notlistedinthecurrentcombinedindex,will appearin thenexteclilion.
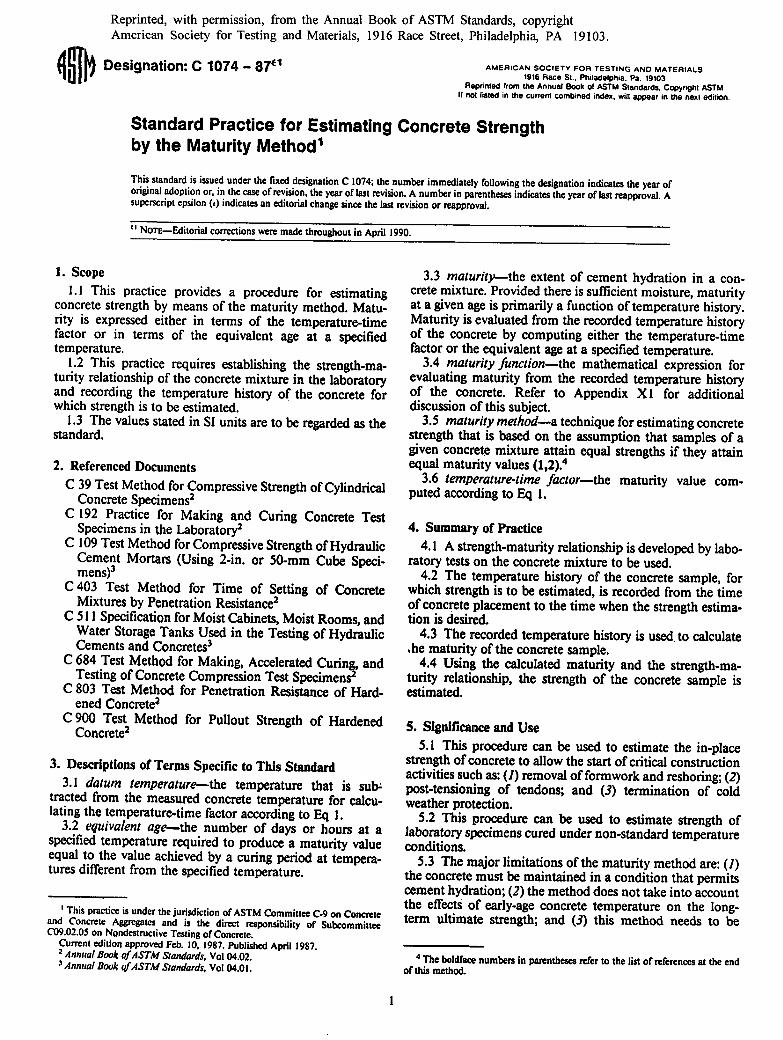
Standard Practice for Estimating Concrete Strengthby the Maturity Method 1
This standard is issued under the fixed designation C 1074; the number immediately following the designation indicates the year oforiginal adoption or, in the case of revision, the year of last revision. A number in parentheses indicates the year of last re.approval. Asuperscript epsilon (0 indicates an editorial change since the last revision or re.approval.
eJ NOTEmEditofial corrections were made throughout in April 1990.
1. Scope 3.3 maturity--the extent of cement hydration in a con-
1.1 This practice provides a procedure for estimating cretemixture. Providedthere is sufficient moisture, maturityconcrete strength by means of the maturity method. Matu- at a given age is primarilya function of temperaturehistory.rity is expressed either in terms of the temperature-time Maturityis evaluatedfrom the recorded temperaturehistoryfactor or in terms of the equivalent age at a specified of the concrete by computing either the temperature-timetemperature, factor or the equivalent age at a specified temperature.
1.2 This practice requires establishing the strength-ma- 3.4 maturity functionmthe mathematical expression forturity relationship of the concrete mixture in the laboratory evaluating maturity from the recorded temperature historyand recording the temperature history of the concrete for of the concrete. Refer to Appendix XI for additionalwhich strength is to be estimated, discussion of this subject.1.3The values stated in SIunits are to be regardedas the 3.5 maturity methodwa technique forestimating concrete
standard, strength that is based on the assumption that samples of agiven concrete mixture attain equal strengths if they attain
2. ReferencedDocuments equal maturityvalues (1,2).43.6 temperature-time factor--the maturity value com-
C 39 Test Method forCompressiveStrengthof Cylindrical puted accordingto Eq I.ConcreteSpecimens2
C 192 Practice for Making and Curing Concrete TestSpecimens in the Laboratory2 4. Summary of Practice
C 109 Test Method forCompressiveStrengthof Hydraulic 4. l A strength-maturityrelationshipis developed by labo-Cement Mortars (Using 2-in. or 50-mm Cube Speci- ratory tests on the concrete mixture to be used.mens)3 4.2 The temperature history of the concrete sample, for
C 403 Test Method for Time of Setting of Concrete which strength is to be estimated, is recordedfrom the timeMixturesby Penetration Resistance2 of concrete placement to the time when the strength estima-
C 511 Specificationfor Moist Cabinets,Moist Rooms, and tion is desired.Water StorageTanks Used in the Testing of Hydraulic 4.3 The recordedtemperature history is used to calculateCements and Concretes3 ,he maturityof the concrete sample.
C 684 Test Method for Making, Accelerated Curing, and 4.4 Using the calculated maturity and the strength-ma-Testing of Concrete Compression Test Specimens= turity relationship, the strength of the concrete sample is
C 803 Test Method for Penetration Resistance of Hard- estimated.ened Concrete2
C 900 Test Method for Pullout Strength of Hardened 5. Significance and UseC°ncrete2 5.1 Thisprocedurecanbe usedto estimatethein-place
strengthofconcretetoallowthestartofcriticalconstruction3. Descriptions of Terms Specific to This Standard activities such as: (1) removal of formworkand reshoring;(2)
3.1 datum temperature--the temperature that is sub: post-tensioning of tendons; and (3) termination of coldtracted from the measured concrete temperature for calcu- weather protection.lating the temperature.time factor accordingto Eq 1. 5.2 This procedure can be used to estimate strength of
3.2 equivalent age--the number of days or hours at a laboratoryspecimens cured under non-standard temperaturespecified temperature requiredto produce a maturity value conditions.equal to the value achieved by a curing period at tempera- 5.3 The major limitations of the maturitymethod are:(1)tures differentfrom the specified temperature, the concrete must be maintained in a condition that permits
cement hydration; (2) the method does not take into accountthe effects of early-age concrete temperature on the Iong-
This practice is under the jurisdiction of ASTM Committee C-9 on Concrete term ultimate strength; and (3) this method needs to beand Concrete Aggregates and is the direct responsibility of SubcommitteeC09.02.05 on Nondestructive Testing of Concrete.
Current editton approved Feb. 10, 1987. Published April 1987.2 Annual Book ofASTM Slandards, Vol 04.02. 4 The boldface numbers in parentheses refer to the list of references at the enda Annual Book #fASTM Standards, Vol 04.01. of this method.
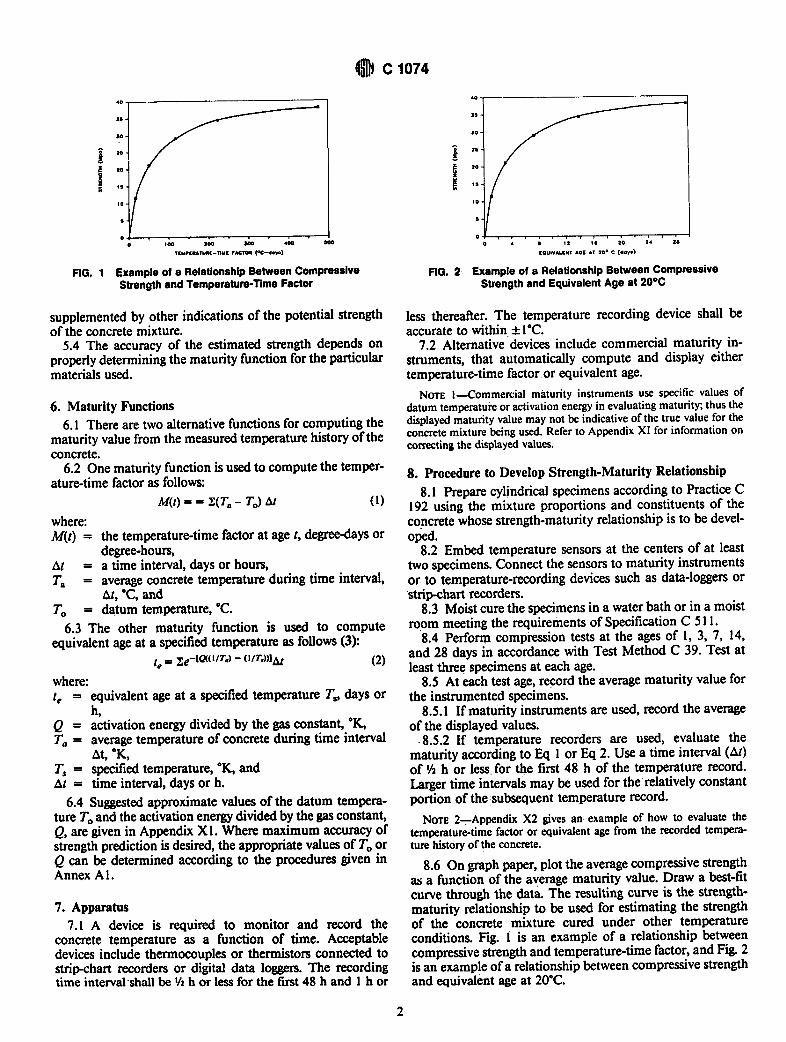
FIG. 1 Example of a RelaUonship BetweenCompressive FIG. 2. Example of a RelaUonshipBetween CompressiveStrengthand Temperature-Time Factor Strengthand EquivalentAge at 20°C
supplemented by other indications of the potential strength less thereafter. The temperature recording device shall beof the concrete mixture, accurate to within + I°C.
5.4 The accuracy of the estimated strength depends on 7.2 Alternative devices include commercial maturity in-properlydeterminingthe maturity function for the particular struments, that automatically compute and display eithermaterialsused. temperature-time factor or equivalent age.
NOTE l-Commercial maturity instruments use specific values of6. Maturity Functions datum temperature or activation energy in evaluating maturity; thus the
6.1 There are two alternative functions forcomputing the displayed maturity value may not be indicative of the true value for thematurity value from the measured temperature history ofthe concrete mixture being used. Refer to Appendix XI for information onconcrete, correcting the displayed values.
6.2 One maturity function is used to compute the temper-ature-time factoras follows: 8. Procedureto Develop Strength-Maturity Relationship
8.1 Prepare cylindrical specimens accordingto Practice CM(t) = = Z(T= - To) At (1) 192 using the mixture proportions and constituents of the
where: concrete whose strength-maturityrelationship is to be devel-M(t) = the temperature-time factorat age t, degree-daysor o_d.
degree-hours, 8.2 Embed temperature sensors at the centers of at leastAt ffi a time interval,days or hours, two specimens. Connect the sensors to maturity instruments7"= = averageconcrete temperature duringtime interval, or to temperature-recordingdevices such as data-loggersor
at, °C, and strip-chart recorders.To = datum temperature, °C. 8.3 Moist cure the specimens in a waterbath or in a moist
6.3 The other maturity function is used to compute room meeting the requirements of Specification C 511.equivalent age at a specified temperatureas follows (3): 8.4 Perform compression tests at the ages of 1, 3, 7, 14,
and 28 days in accordance with Test Method C 39. Test atte= Ze-l_('/r°) - a/r"lAt (2) least three specimens at each age.
where: 8.5 At each test age, record the average maturity value forte ffi equivalent age at a specified temperature T,, days or the instrumented specimens.
h, 8.5.1 If maturity instruments are used, recordthe averageQ ffi activationenergy divided by the gas constant, °K, of the displayed values.7"=ffi average temperature of concrete during time interval .8.5,2 If temperature recorders are used, evaluate the
At, *K, maturity according to Eq I or Eq 2. Use a time interval (_)T, = specifiedtemperature, °K, and of :/2h or less for the first 48 h of the temperature record.At ffi time interval, days or h. Largertime intervalsmay be used for therelatively constant
6.4 Suggestedapproximatevalues of the datum tempera- portion of thesubsequent temperature record.ture Toand the activation energydivided by the gas constant, NOTE2.Appendix X2 givesan example of howto evaluatetheQ, aregiven in Appendix X 1. Where maximum accuracy of temperature-time factoror equivalent agefromthe recordedtempera-strengthprediction is desired, the appropriatevalues of To or lurehistory of the concrete.Q can be determined according to the proceduresgiven inAnnex A I. 8.6 On graphpaper, plot the average compressive strength
as a function of the average maturity value. Draw a best-fitcurve through the data. The resultingcurve is the strength-
7. Apparatus maturity relationship to be used for estimating the strength7.1 A device is required to monitor and record the of the concrete mixture cured under other temperature
concrete temperature as a function of time. Acceptable conditions. Fig. i is an example of a relationship betweendevices include thermocouples or thermistors connected to compressive strengthand temperature-time factor, and Fig. 2strip-chart recorders or digital data loggers. The recording is an example of a relationshipbetween compressive strengthtime interval'shallbe 1/2h or less for the first48 h and 1h or and equivalent age at 20°C.
2
q_ C 1074
NOTE3--1f regressionanalysisof thedatais desired,see Refs(4 and location of the sensors, read the maturity value from the5) for possible regression models 1o use for 1he strength-maturity maturity instrument or evaluate the maturity from therclationship, temperature record_
9.4 Using thestrength-maturityrelationship developedin9. ProceduretoEstimateIn-PlaceStrength Section8,readoffthevalueofcompressivestrengthcorre-9.1 As-soon.asispracticableafterconcreteplacement, spendingtothemeasuredmaturity.
usingthispracticetoallowcriticalconstructionoperationsto work removalorpost-tensioning,supplementdeterminationbegin,installsensorsat locationsin thestructurethatare oftheconcretematuritywithotherteststoensurethatthecriticalin terms of exposureconditionsand structural concretein the structurehas a potentialstrengththatis
Now 4--1nbuildingconstruction,exposedportionsofslabsandthe maturityrelationship,Appropriatetechniquesinclude:slab-columnconnectionsaretypicallycriticallocations.Theadviceof 9.5.I In-placeteststhatgiveindicationsofstrength,suchthe engineershouldbe soughtfor thecriticallocations in the particular as Test Method C 803 or Test Method C 900,structureunderconstruction. 9.5.2Early-agecompressivestrengthtestsofcontrolspec-9.2Connectthesensorstomaturityinstrumentsortern- linensmolded fromsamplesoftheconcreteas-delivered,or
perature-recordingdevicesand activatetherecordingdevices 9.5.3Compressivestrengthtestson specimensmoldedassoonasispracticable, from samplesoftheconcreteas-deliveredand subjectedto
9.3 When it is desirable to estimate the strength at the accelerated curing in accordance with Test Method C 684.
ANNEX
(Mandatory Information)
AI. DETERMINATION OF DATUM TEMPERATURE OR ACTIVATION ENERGY
AI.1 Procedure final setting. Perform subsequent tests on three cubes from
A 1.1.1 The testing required to experimentally determine each set at ages that are. approximately twice the age of thedatum temperature can be performed with mortar speci- previous tests. For example, if the time of final setting weremens, and the results are applicable to concrete made with 12 h, then compressive tests would be performed at 1, 2, 4, 8,
16 and 32 days.the same mortar (6). The activation energy is most accu-rately determined from calorimetric measurements of heat of A 1.1.7 For each curing temperature, plot the reciprocal ofhydration of cement paste under different curing tempera- the average cube Strength along the y-axis and the reciprocaltures. However, it has been reported that the activation of the age beyond the time of final setting along the x-axis.energy can also be determined from strength tests of mortar An example of such a plot is shown in Fig. A 1.1.
AI.I.8 Determine the slope and intercept of the best-specimens (7), and this is the approach adopted here.A 1.1.2 Proportion a mortar mixture similar to the mortar fitting straight line through the data for each curing temper-
in the concrete that is to be used. The mortar shall include ature.the appropriate quantities of admixtures that will be used in A I. 1.9 For each straight line, divide the value of the inter-the concrete, cept by the value of the slope. These quotients, or K-values,
are used to calculate the datum temperature or activationAI.I.3 Prepare three mortar specimens using the con-tainers specified in Test Method C 403. Carefully submerge energy.each specimen into temperature-controlled water baths. Two AI.2 Determination of Datum Temperature
baths shall be at the maximum and minimum concrete AI.2.1 Plot the quotients (/t'-values) from Al.l.9 as a func-temperatures expected for the in-place Concrete during the tion of the waterbath temperatures (Fig. A 1.2). Determinetime the strength predictions will be made. The third bath the best.fitting straight line through the three points and deter-temperature shall be midway between the two extremes, mine the intercept ofthe line with the temperature axis. This
AI.I.4 Using Test Method C 403, determine the time of intercept is the datum temperature, To, that is to be used infinal setting for each temperature. The specimens are re- computing the temperature-time factor according to Eq 1.moved from the water baths and the excess water is removedprior to making penetration measurements. AI.3 Determination of Activation Energy
AI.I.5 Prepare three sets of 50-mm mortar cubes, with 18 AI.3.1 Calculate thenatural logarithm of the quotientscubes per set. Mold the cubes in accordance with Test (K.values) in AI.I.9, and determine the absolute tempera-Method C 109 and carefully submerge each set into the tures (in Kelvin)of the water baths.temperature-controlled baths used in Al.l.3. For each set, AI.3.2 Plot the natural logarithm of the quotientsremove the molds and return the specimens to their respec- (K-values) as a function of the reciprocal absolute tempera-five baths l h before the first series of compression tests, ture (Fig. AI.3). Determine the best-fitting straight line
A 1.1.6 For each set of cubes, determine the compressive through the three points. The slope of the line is the value ofstrength of three cubes in accordance with Test Method C the activation energy divided by the gas constant, Q, that is109 at an age that is approximately h_ice the age to reach to be used in computingequivalentage according to Eq 2.
3
q_) C 1074
0.08• 23 ° C 32 ° C
0.07
0.06
0.05
0.04
_n 0.03\
0.02
0.01
o ....... , .......... ,. ,0 Q.2 0.4 0.6 0 8 I 1.2 1.4 1.0 I 8 2
1/AG[ (1/days)
FIG. A1.1 Reciprecal of StrengthVersus Reciprocalof Age BeyondTime of FInal SetlJng
o-o.0 -o,i -
-0.2 -
-o.s - Q_
--O.4"o.0 -o.o -
os-o,?.
0.4 _ --0.0 "
_ -0.0.G ;-i.I -at -i.$.
--t.4 -o.| -,i.s -
_t.e - 1-i.7.
o.! -t.J -
-t.o -T.- ,._"• •, j_, . ,'., s;, s.,
• , •SO 2'0 ;llO 4a I.'TZUP (t/K) • l_Xm
c,,,_ ,_,,,,,_u (,c) FIG. AI._ Example of Plot of the Natural LogMithm of K_VeluesFIG. A1.2 Example o! Plot of K-Valu_ Versus Curing Vemus the Inveme Absolute Tem_retum forOete_ining the 'Temperature for Determiningthe Datum Temperature Value of O used in CalculatingEquivalent Age
q_ C 1074
APPENDIXES
(NonmandatoryInformation)
XI. MATURITY FUNCTIONS
XI.1 General degree-hours,XI.I.I A maturity function is a mathematical expression Md = the temperature-time factor displayed by the instru-
to account for the combined effectsof time and temperature ment, degree-days or degree-hours,on the hydration of cement. The strengthof concrete is, m To = the appropriate datum temperature for the concrete,turn, directly related to the extent of hydration. The key *C,featureof a maturity function is the represen_tion of how Td --- 'the datum temperattrreincorporated into the instru-temperature affects the rate of hydration. There are two ment, *C,andwidely-usedapproaches;one assumes that the hydration rate t = the elapsed time from when the instrument wasis a linear function of temperature, and the other assumes ttir_ed on to when areadingwas taken, days or h.
that the hydration rate obeys the exponential Arrhenius Xl.3 EquivalentAgeequation. Furtherinformation on how these two approaches XI.3.i The assumption that hydration rate obeys theare related may be found in Ref (6).
Arrhenius equa_on leads to the maturity function given inEq 2, that is used to compute equivalent age at a specified
XI.2 Temperature-TimeFactor temperature, Note that in using Eq 2, the temperature mustXI.2.1 The assumption that hydration rate is a linear be in Kelvin (Kelvin'-- Celsius + 273). To compute
function of temperature leads to the maturity function given equivalent age it is necessary to know the activation energyin Eq 1, that is used to compute the temperature-time factor, for the specific materials and conditions. It has been sug-To compute the temperature-time factor, it is necessaryto gested that the activation energy depends on the type ofknow the appropriatevalue ofthe datum temperaturefor the cement and on the type and the dosage of admixtures thatspecific materials and conditions. The datum temperature affecthydration rate(6). For Type I cement without admix-may depend on the type of cement, on the type and the tures or.additions_values 0f activation energyin the range ofdosageof admixtures or other additives that affect hydration 40 000 to 45 000 J/tool have been reported. Thus anrate, and on the temperature range that the concrete will approximatevalue of Q, the activation energydivided by theexperience while hardening(6). For Type I cement without gasconstant for use in Eq 2, is 5000°K. (The value ofthe gasadmixturesand a curing temperature rangefrom 0 to 40°C, constant is 8.31 J/(K-mol)). For other conditions and whenthe recommended datum temperature is 0°(3(6). For other maximum accuracy of strength prediction is desired, theconditions and when maximum accuracy of strengthpredic- appropriate value for Q can be determined experimentallytion is desired, the appropriatedatum temperature can be according to the procedures in Annex AI.determined experimentally according to the procedures in XI.3.2 The calculation of equivalent age also requires aAnnex AI. specified temperature,Ts. Traditionally, a value of 20°C has
X 1.2.2 Currentmodelsof maturity instrumentsthat corn- been used (3), but any other convenient temperature, such as23°C (73.4°F), is permissible provided that it is reportedpute temperature-time factors may not employ the appro-
priate datum temperature, and therefore may not indicate along with the value of the equivalent age.the true factor. The value of the temperature-time factor XI.3.3 Maturity instruments that compute equivalent agedisplayed by the instrument can be corrected for the datum according to Eq 2, arebased on specific values of activationtemperature as follows: energy. The displayed readings cannot be corrected for the
appropriate activation energy value of the concrete beingMc = Me -(T O-T_t (XI.I) used. The user should recognize this limitation when the
where: in-place concrete has an activation energy that is widelyMc ffi the corrected temperature-time factor, dagree-daysor different from that incorporated into the instrument.
X2.1.1 Fig. X2.1 shows a hypothetical temperature his- X2.2.1 The value of the datum temperature, To, is re-tory for concrete that will be used to illustrate the calcula- quired to compute the temperature-time factor according totions of temperature-time factor and equivalent age. The Eq I. For this example, a value of 2.5°C is assumed astemperature values at half-hour intervals are tabulated in indicated in Fig. AI.2.column 2 of Table X2.1. X2.2.2 The average temperature during each half-hour
q_ C 1074
-. time factorsgives the cumulative temperature-time factor at_:__ each age. For example, at an age of 12 h the temperature-
::: _ time factor is !75° C-hours.
_" =0-_" Ira-
''" X2.3 Calculation of EquivalentAge:o': X2.3.1 The value of Q and the value of the specified: temperature, 7",,arerequiredto compute the equivalent age: according to Eq 2. For this example, the value of Q iso ; _ _ _ ,.. ,. assumed to be 4700°K, and the specified temperature is
-, ,-, assumed to be 20"C.
FIG. X2.1 Hypothetical Temperature History used to Illustrate X2.3.2 Using the average temperature during each ageComputations of Temperature-Time Factor and Equivalent Age interval, the values of the exponential function:in Eq 2 are
calculated. These values aregiven in column 7 of Table X2:1
intervalis computed and the resultsaregiven in column 4 of underthe heading Age Factor.The product ofeach ofthe ageTable X2.1. The datum temperature is subtracted from the factors and theage interval (0.5 h) gives the incrementalaverage temperatures, and the difference is multiplied by the equivalent ages at 20°C; the incremental equivalent ages areage interval, which in this example is 0.5 h. The products shown in column 8 of Table X2.1.give the incremental values of the temperature-time factor X2.3.3 The summation of the incremental equivalentfor the age intervals. The incremental values are shown in ages gives the cumulative equivalent age at 20°C (column 9column 5 of Table X2.1. ofTable X2.1). For example, at an age of 12 h the equivalent
X2.2.3 The summation of the incremental temperature- age at 20°C is 11.3 h.
TABLE X2.1 Example Matudty Calculations.
(5) (e) (6) (9)(1) (2) (3) (4) .Temp.Tlme Temp-Tlme (7) F,.q.Ageat Eq. Age at
Age. Temperature, Age Average Fact_, Faotor, Age Faotof 20°C, 20°0,h °C Incfflmef_ h Te_rature, °C Increment°C41 CumulativeeC-h Inclementh Cumulative h
(l) Saul, A. G. A., "Principles Underlying the Steam Curing of March/April 1983, pp. 93-101.Concrete at Atmospheric Pressure," Magazine of Concrete Re- (5) Carino, N. J., and Lew, H. S., "Temperature Effects on the
search, Vol 2, No. 6, March 195 I, pp. 127-140. Strength-Maturity Relations of Mortar," Journal of the American(2) Maihotra, V. M., _Maturity Concept and the Estimation of Concretelnstitute, Vol 80, No. 3, May/June 1983, pp. 177-182.
Concrete Strength," Information Circular IC 277, Dept. of Energy (6) Carino, N. J., "The Maturity Method: Theory and Application,"Mines Resources (Canada), Mines Branch, No. 1971, 43 pp. ASTM Journal of Cement, Concrete, and Aggregates, Vol 6, No. 2,
(3) Freiesleben Hansen, P. and Pederson, J., "Maturity Computer for Winter 1984, pp. 61-73.Controlled Curing and Hardening of Concrete," Nordisk Betong, (7) Gauthier, E. and Regourd, M., "The Hardening of Cement asI, 1977, pp. 19-34. Function of Temperature," Proceedings of the RILEM Interna-
(4) Carino, N. J., Lew, H. S., and Voiz, C. K., "Early Age Temperature tional Conference on Concrete at Early Ages, Vol 1, Paris, 1982,Effects on Concrete Strength Prediction by the Maturity Method," pp. 145-150.Journal of the American Concrete Institute, Vol 80, No. 2,
TheAmerican Society for Testingand Materials takes no position respectingthe validity of any patent rights asserted in connectionwith any item mentioned in this standard. Users of this standard are expressly advised that determination of the validity of any suchpatent rights, and the risk of infringement of such rights, ere entirety their own responsibility.
Thisstandard issubject to revision at any time by the responsible technical committee and must be reviewed every five years andff not revised, either reapprovedor withdrawn. Yourcomments ere invited either for revisionof this standard or for additional standardsand should be addressed to ASTM Headquarters. Your comments will receive careful consideration at a meeting of the responsibletechnical committee, which you may attend, ff you feel that your comments have not received a fair hearing you should make yourviews known to the ASTM Committeeon Standards, 1916 Race St., Philadelphia,PA 19103.
Appendix B
ASTM C 900
Reprinted, with permission, from the Annual Book of ASTM Standards, copyright
_l_ Designation:AmericanSocietYc900forTesting_87 _1 and Materials, 1916 Race Street, Philadelphia, PA 19103.AMERICAN SOCIETY FOR TESTING AND MATERIALS "
1916 Race St., Philadelphia, Pa. 19103Reprinted from the Annua_ Book of ASTM Standards, Copyright ASTM
If not listed in the current combined index, will appear in the next edition.
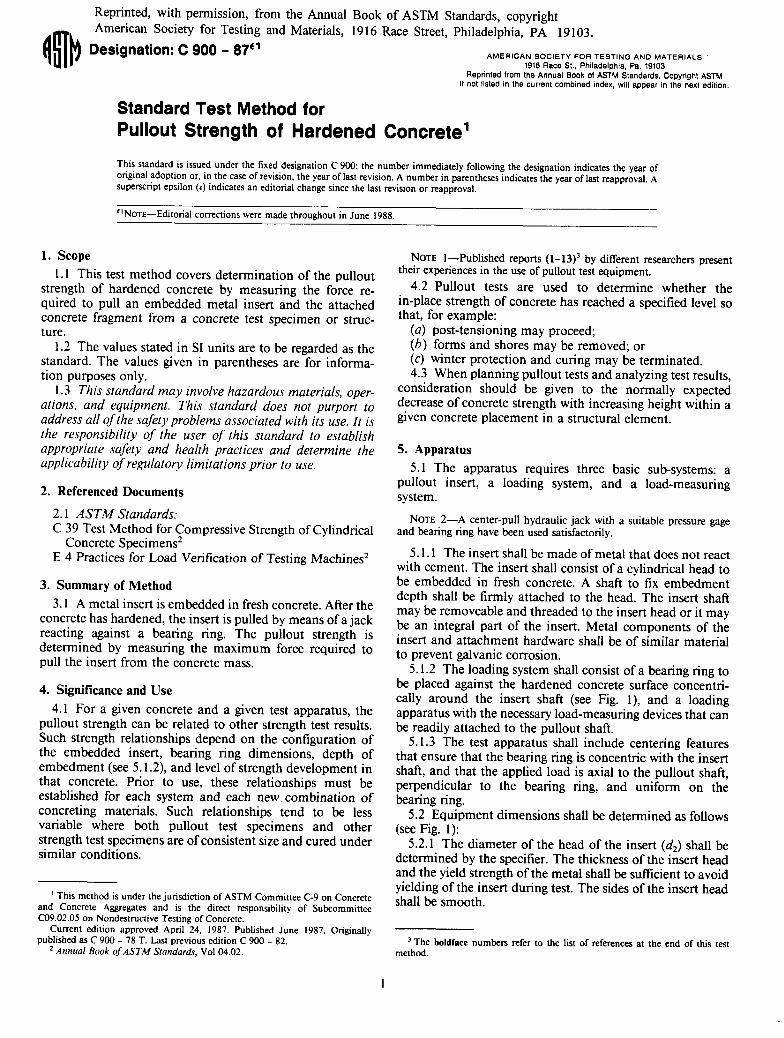
Standard Test Method for
Pullout Strength of Hardened Concrete 1
This standard is issued under the fixed designation C 900; the number immediately following the designation indicates the year oforiginal adoption or, in the case of revision, the year of last revision. A number in parentheses indicates the year of last reapproval. Asuperscript epsilon (_) indicates an editorial change since the last revision or reapproval.
_aNOTE--Editorial corrections were made throughout in June 1988.
1. Scope NOTEl--Published reports(1-13) 3 by differentresearcherspresentI. 1 This test method covers determination of the pullout theirexperiencesin the use of pullouttest equipment.
strength of hardened concrete by measuring the force re- 4.2 Pullout tests are used to determine whether thequired to pull an embedded metal insert and the attached in-place strength of concrete has reached a specified level soconcrete fragment from a concrete test specimen or struc- that, for example:ture. (a) post-tensioning may proceed;
1.2 The values stated in SI units are to be regarded as the (b) forms and shores may be removed; orstandard. The values given in parentheses are for informa- (c) winter protection and curing may be terminated.tion purposes only. 4.3 When planning pullout tests and analyzing test results,
1.3 This standard may involve hazardous materials, oper- consideration should be given to the normally expectedations, and equipment. This standard does not purport to decrease of concrete strength with increasing height within aaddress all of the safety problems associated with its use. It is given concrete placement in a structural element.the responsibility of the user of this standard to establishappropriate safety and health practices and determine the 5. Apparatus
applicability of regulatory limitations prior to use. 5.1 The apparatus requires three basic sub-systems: apullout insert, a loading system, and a load-measuring
2. Referenced Documents system,
2.1 ASTM Standards; NOTE 2--A center-pull hydraulic jack with a suitable pressure gageC 39 Test Method for Compressive Strength of Cylindrical and bearingring have beenused satisfactorily.
Concrete Specimens zE 4 Practices for Load Verification of Testing Machines z 5.1.1 The insert shall be made of metal that does not react
with cement. The insert shall consist of a cylindrical head to3. Summary of Method be embedded in fresh concrete. A shaft to fix embedment
depth shall be firmly attached to the head. The insert shaft3.1 A metal insert is embedded in fresh concrete. After the may be removeable and threaded to the insert head or it may
concrete has hardened, the insert is pulled by means of a jack be an integral part of the insert. Metal components of thereacting against a bearing ring. The pullout strength is insert and attachment hardware shall be of similar materialdetermined by measuring the maximum force required to to prevent galvanic corrosion.pull the insert from the concrete mass. 5.1.2 The loading system shall consist of a bearing ring to
4. Significance and Use be placed against the hardened concrete surface concentri-cally around the insert shaft (see Fig. 1), and a loading
4.1 For a given concrete and a given test apparatus, the apparatus with the necessary load-measuring devices that canpullout strength can be related to other strength test results, be readily attached to the pullout shaft.Such strength relationships depend on the configuration of 5.1.3 The test apparatus shall include centering featuresthe embedded insert, bearing ring dimensions, depth of that ensure that the bearing ring is concentric with the insertembedment (see 5.1.2), and level of strength development in shaft, and that the applied load is axial to the pullout shaft,that concrete. Prior to use, these relationships must be perpendicular to the bearing ring, and uniform on theestablished for each system and each new combination of beating ring.concreting materials. Such relationships tend to be less 5.2 Equipment dimensions shall be determined as followsvariable where both pullout test specimens and other (see Fig. 1):strength test specimens are of consistent size and cured under 5.2.1 The diameter of the head of the insert (d2) shall besimilar conditions, determined by the specifier. The thickness of the insert head
and the yield strength of the metal shall be sufficient to avoidyielding of the insert during test. The sides of the insert head
This method is under the jurisdiction of ASTM Committee C-9 on Concrete shall be smooth.and Concrete Aggregates and is the direct responsibility of SubcommitteeC09.02.05 on Nondestructive Testing of Concrete.
Current edition approved April 24, 1987. Published June 1987. Originallypublished as C 900 - 78 T. Last previous edition C 900 - 82. 3 The boldface numbers refer to the list of references at the end of this test
2 Annual Book of ASTM Standards, Vol 04.02. method.
1
_ C 900
d 4 > 1.25d 3
2.0d 2 < d 3 < 2.4d 2
Pullout
I _ Q Bearing/_
force _.t >0.4d 2 ring
',..,."".:.-..'.,. ', .:.:,". ' i. _ N\.. _:..? i _1_//////_ _" shaft -_;) ". ,L,_,.,_=,_.
NOTE3--Typical sizesare 25and 30 mm (1 and 1.2in.) in diameter, NOTE7--For the most accurate results, gages should have a max-but smaller and largersizeshave been used. imum value indicator that preservesthe value of the ultimate load when
NOTE4--The pullout insert may be coated with a release agent to ultimate failureand subsequent stress releaseoccur.minimizebonding with the concrete, it may be tapered to minimizeside 5.2.7 Pullout apparatus shall be calibrated at least once africtionduring testing•The insert headshallbe providedwith the means, year and after all repairs or adjustments. Calibration shall besuch as a notch, to prevent rotation in the concrete if the insert shaft hasto be removed prior to performing the test. As a further precaution by one of the methods in Practices E 4, or with a compres-against rotation of the insert head, all threaded hardware shall be sion testing machine conforming to the requirements of Testchecked prior to installation to ensure that it is free-turningand can be Method C 39 using the calibration procedures described ineasily removed, the Annex to this test method.
5.2.2 The length of the pullout insert shaft shall be such 6. Samplingthat the distance from the insert head to the concrete surface 6.1 Pullout test locations shall be separated so that the
(h) equals the diameter of the insert head (de). The diameter clear spacing between inserts is at least ten times the pulloutof the insert shaft at the head (d_) shall be no more than 0.60 insert head diameter. Clear spacing between the inserts andtimes the head diameter, the edges of the concrete shall be at least four times the head
5.2.3 The bearing ring shall have an inside diameter (d3) diameter. Inserts shall be placed so that reinforcement isof 2.0 to 2.4 times the insert head diameter, and shall have outside the expected conical failure surface by more than onean outside diameter (d4) of at least 1.25 times the inside bar diameter, or the maximum size of aggregate, whichever isdiameter. The thickness of the ring (t) shall be at least 0.4 greater.times the pullout insert head diameter. 6.2 When pullout test results are used to assess the
5.2.4 Tolerances for dimensions of the pullout test inserts in-place strength in order to allow the start of criticalshall be ___2% within a given system, operations, such as formwork removal or application of post
tensioning, at least five individual pullout tests shall beNOTE5--The limits for dimensions and configurations for pullout performed for a given placement for every 115 m3 (150 yd3),
test inserts and apparatus are intended to accommodatevarious systems, or a fraction thereof, or for every 470 m2 (5000 ft2), or a
5.2.5 The loading apparatus shall have sufficient capacity fraction thereof, of the surface area of one face in the case ofto provide the loading rate prescribed in 7.4 and exceed the slabs or walls.
NOTE8--Inserts shall be located in those portions of the structuremaximum load expected, that are criticalin terms of exposureconditions and structural require-
NOTE6--Hydraulic pumps that provide a uniform loadingrate may ments.give more uniform test results than pumps that apply the load 7. Procedure
intermittently. 7.1 Attach the pullout inserts to the forms using bolts or
5.2.6 Gages shall have a least division not larger than 5 % by other acceptable methods that firmly secure the insert inof the minimum value in the intended range of use. its proper location prior to concrete placement. All inserts
2
(_) C 900
for the same tests shall be embedded to the same depth and f. = (P/A)sine a (1)each shaft shall be perpendicular to the formed surface, sine a = (d_- d2)/2S (2)
.4 = zcS(d_+ d2)/2 .(3)NOTE9--1nserts may be manually placed into unformed horizontal
concrete surfaces.The insertsshall be embeddedinto the freshconcrete S = _/h 2 + ((d 3 - d2)/2)2 (4)by means that ensure a uniform embedment depth and a plane surface where:perpendicularto the axis of the insert shaft. Installation of insertsshall fn = nominal normal stress, MPa (psi),be performed or supervised by experienced personnel. Experience P = pullout force, N (lbf),indicatesthat pullout strengths are of lower value and more variable for a = 1/2the frustum apex angle or: tan- _ (d3 - d2)/2hmanually-placed surface inserts than for inserts attached to the A = fracture surface area, mm 2 (in.2),formwork, d2 = diameter of pullout insert head, mm (in.),
7.2 When the concrete is to be tested, remove all hard- d3 = inside diameer of bearing ring or large base diameter ofware used for securing the pullout inserts in position. Before assumed conic frustum, mm (in.),mounting the loading system, remove any debris or surface h = height of conic frustum, from insert head to large-baseabnormalities to ensure a smooth bearing surface that is surface, mm (in.), andperpendicular to the axis of the insert. S = slant height of the frustum, mm (in.)
7.3 Use a bearing ring for all surface pullout-test configu- 9. Reportrations. Place the bearing ring around the pullout insert 9.1 The report shall include the following:shaft, connect the pullout shaft to the hydraulic ram, and 9.1.1 Dimension of the pullout insert and bearing ringtighten the pullout assembly snugly against the bearing (sketch or define dimensions),surface, checking to see that the bearing ring is centered 9.1.2 Identification by which the specific location of thearound the shaft and flush against the concrete, pullout test can later be determined,
7.4 If the insert is to be tested to rupture of the concrete, 9.1.3 Date and time when the pullout test was performed.load at a uniform rate, that will cause pullout rupture to 9.1.4 Maximum load, N (lbf),occur in 120 +_ 30 s. Record the maximum gage reading to 9.1.5 Description of any surface abnormalities beneaththe nearest half of the least division on the dial. If the insert the reaction ring at the test location,is to be tested only to a specified level for acceptance, load at 9.1.6 Abnormalities in the ruptured specimen and in thea uniform rate that will reach the specified level in 120 ___30 loading cycle,s. 9.1.7 Concrete curing methods used and moisture condi-
tion of the concrete at time of test, and9.1.8 Other information regarding unusual job conditions
8. Calculation that may affect the pullout strength.
8.1 Convert test readings to force on the basis of calibra- 10. Precision and Biastion data. 10.1 Precision--The precision of this test method has not
8.2 When a stress calculation is desired, compute a been evaluated. A precision statement will be included afternominal normal stress on the assumed conical fracture sufficient available data are analyzed.surface by dividing the pullout force by the area of the 10.2 Bias--The bias of this test method cannot be evalu-frustum and multiplying by the sine of one-half the apex ated since, pullout strength can only be determined in termsangle. The following equations may be used: of this test method.
ANNEX
(Mandatory Information)
A1. CALIBRATION OF PULLOUT-HYDRAULIC LOADING SYSTEM
A I. 1 Calibrate the pullout-hydraulic loading system calibration load level. With available center-pull jacks, fric-(pump, gage, and hydraulic jack) with a testing machine tion in the system produces different calibration curves on anmeeting the applicable requirements of Method C 39. increasing series of loads than on decreasing loads and
A1.2 Place the hydraulic jack between the two testing therefore only increasing loads should be used. In general,machine bearing blocks. Position the jack and bearing blocks readings should be taken at approximately 20 load levelsto ensure concentric and axial loading, and extend the piston distributed within the range of loads anticipated in use.to the level anticipated for actual pullout testing. Carefully A 1.4 Using readings obtained during calibration loading,position the testing machine head against the pullout jack. calculate a linear regression equation using the least-squares
NOTE--Protectionof the bearingblocks will be required to prevent curve-fitting method. Pullout testing may occur within adamage to the test machine. Cold-rolled steel plate at least 13 mm ('/2 narrow range of the capacity of the pullout jack. If the testin.) thick is recommended, results fall within a narrow range, calculate the regression
AI.3 Using the hydraulic pump, apply loads progressively equation based on calibration readings in that range, ex-over the range of anticipated use, and record the hydraulic eluding those outside the test range.pressure gage reading and the testing machine load at each
3
_) C 900
REFERENCES
(1) Richards, O., "Pullout Strength of Concrete," Reproducibility and tional, American Concrete Institute Vol. 7, No. 2, Feb. 1985, pp.Accuracy of Mechanical Tests, ASTM STP 626, ASTM 1977, pp. 44-48.32-40. (8) Yener, M. and Chen, W. F., "On In-Place Strength of Concrete
(2) K.iekegaard-Hansen, P., Lok-Strength, Saertryk af Nordisk Betong and Pullout Tests," Cement, Concrete, and Aggregates, CCAGDP,3: 1975. Vol. 6, No. 2, Winter 1984, pp. 90-99.
(3) Malhotra, V. M. and Carrette, G., "Comparison of Pullout (9) Bickley, J. A., "The Evaluation and Acceptance of ConcreteStrength of Concrete with Compressive Strength of Cylinders and Quality by In-Place Testing," In Situ/Nondestructive Testing ofCores, Pulse Velocity and Rebound Number," Journal, American Concrete, American Concrete Institute, 1984, pp. 95-109.
Concrete Institute, Vol. 77, No. 3, May-June 1980, pp. 161-170. (10) Carrette, G. G. and Malhotra, V. M., "In Situ Tests: Variabilityand Strength Prediction of Concrete at Early Ages," In Situ/
(4) Bickley, J. A., "The Variability of Pullout Tests and In-PlaceNondestructive Testing of Concrete, American Concrete Institute,
Concrete Strength," Concrete International, American Concrete 1984, pp. 111-141.Institute, Vol 4, No. 4, April 1982, pp. 44-51.
(11) Khoo, L. M., "Pullout Technique--An Additional Tool for In Situ
(5) Dilly, R. L. and Ledbetter, W. B., "Concrete Strength Based on Concrete Strength Determination," In Situ/Nondestructive TestingMaturity and Pullout," ASCE Journal of Structural Engineering, of Concrete, American Concrete Institute, 1984, pp. 143-159.American Society of Civil Engineers, Vol. 110, No. 2, Feb. 1984, (12) Vogt, W. L., Beizai, V. and Dilly, R. L., "In Situ Strength of
pp. 354-369. Concrete with Inserts Embedded by 'Finger Placing'," In Situ/(6) Stone, W. C. and Giza, B. J., "The Effect of Geometry and Nondestructive Testing of Concrete, American Concrete Institute,
Aggregate on the Reliability of the Pullout Test," Concrete lnterna- 1984, pp. 161-175.tional, American Concrete Institute, Vol 7, No. 2, Feb. 1985, pp. (13) Parsons, T. J. and Naik, T. R., "Early Age Concrete Strength27-36. Determination Pullout Testing and Maturity," In Situ/Nondestruc-
(7) Hindo, K. R. and Bergstrom, W. R., "Statistical Evaluation of the tive Testing of Concrete, American Concrete Institute, 1984, pp.
In-Place Compressive Strength of Concrete," Concrete Interna- 177-199.
TheAmerican Society for Testing and Materials takes no position respecting the validity of any patent rights asserted in connectionwith any item mentioned in this standard. Users of this standard are expressly advised that determination of the validity of any suchpatent rights, and the risk of infringement of such rights, are entirely their own responsibility.
Thisstandard is subject to revision at any time by the responsible technical committee and must be reviewed every five years andif not revised, either reapproved or withdrawn. Yourcomments are invited either for revision of this standard or for additional standardsand should be addressed to ASTM Headquarters. Your comments will receive careful consideration at a meeting of the responsibletechnical committee, which you may attend. If you feel that your comments have not received a fair hearing you should make yourviews known to the ASTM Committee on Standards, 1916 Race St., Philadelphia, PA 19103.
Appendix C
ACI 228.1R
Reprinted by permission of the American Concrete Institute,
R. M. Barnoff* R.D. Gaynor K.R. Lauer* R.L. Sprouse
J. A. Bickley' D.L. Green* V.M. Malhotra M.A. TaylorH. Caratin C.P. Hedges T.R. Naik H. Thornton, Jr.K. Choi R. Huyke O. Richards* M. Yener
B. Dragunsky R.S. Jenkins* P.T. Seabrook A. Zoob
The state of the art in the use of methods for determining the in-place 2.8--Combined methods
compressive strength of concrete is reported. The methods covered 2.9--Summaryinclude the rebound hammer, probe penetration, pullout, ultrasonic
pulse velocity, maturity, and cast-in-place cylinder. The underlying Chapter 3--Statistical analysis of test results,principles and inherent limitations of each method are discussed. Re-
peatability of test results is reviewed, and recommendations are given p. 228.1 R-9for developing the correlation relationship for each test method. 3.l--lntroduction
Recommendations are given for the number of tests, and statistical 3.2--Repeatability of resultstechniques for interpretation of test results are described. 3.3--Correlation
3.4--Sampling3.5-=Interpretation
Keywords:coefficient of variation; compressive strength; concretes; construc- Chapter 4--References, p. 228.1 R-24tion; nondestructive tests; reviews; safety; sampling; statistical analysis.
CHAPTER 1--1NTRODUCTION
1.1 --Scope
In-place tests, which have also been called "nondes-
CONTENTS tructive" tests, are used to obtain information about
Chapter I--Introduction, p. 228.1R.1 the properties of concrete as it exists in a structure. In
l.I--Scope this report, the property of interest is the compressive1.2--Need for in-place tests during construction1.3--1mpact of ACI 318-83 strength of concrete. Determination of concrete
1.4--Objective of report strength is usually performed for two reasons: 1) the
evaluation of an existing structure, or 2) monitoring
Chapter 2--Review of methods, p. 228.1R.2 strength development during new construction. This
2. l--Introduction report places emphasis on the latter application since it
2.2--Rebound hammer represents the major use of in-place methods in North2.3--Probe penetration2.4--Pullout test American practice. Over the years, dozens of tech-
2.5--Ultrasonic pulse velocity niques have been proposed for estimating the in-place
2.6--Maturity method strength of concrete. No attempt is made to review all
2.7--Cast-in-place cylinders these methods; only those methods that have been
standardized by ASTM are discussed.
ACI Committee Reports, Guides, Standard Practices, and
Commentaries are intended for guidance in designing, plan-ning, executing, or inspecting construction and in preparingspecifications. Reference to these documents shall not be made *Task Force Member.
electronic or mechanical device, printed, written, or oral, or recording for soundProject Documents. or visual reproduction or for use in any knowleage or retrieval system or de-
vice, unless permission in writing is obtained from the copyright proprietors.
228.1R-1
228.1R-2 ACI COMMITTEE REPORT
1.2--Need for in.place tests during construction construction costs by permitting accelerated construc-
For over 70 years in North American practice, the tion schedules.most widely used test for concrete has been thecompression test of the standard cylinder. The test pro- 1.3--Impact of ACI 318-83
Previous versions of ACI 318 have required testing ofcedure is relatively easy to perform in terms of sam-
pling, preparation of specimens, and the determination field-cured cylinders to demonstrate the adequacy ofof strength. When properly performed, this test has low concrete strength prior to removal of formwork or re-in-test variation and low interlaboratory variation, and shoring. However, Section 6.2.1.1 of ACI 318-83 al-therefore lends itself readily to use as a standard. The lows the use of alternative procedures to testing field-strength value obtained is used in design calculations cured cylinders. The alternative procedures must be ap-suitably modified by constants that relate design proved by the building official prior to use.stresses to the compressive strength value. This strength Most of the design provisions in the ACI Buildingvalue is therefore an essential parameter in all design Code are based on the compressive strength of stan-codes, dard cylinders. Thus, to evaluate structural capacity
under construction loading, it is necessary to have aAs carried out in accordance with standard proce-
dures, however, the test only represents the potential measure of the cylinder strength of the concrete as itstrength of the concrete as delivered to a site. The test exists in the structure. If in-place tests are used, it isis used mainly as a basis for quality control. It is not necessary to have a correlation relationship between theintended for determining the strength of the concrete results of in-place tests and the compressive strength ofin-place since it makes no allowance for the effects of cylinders. At present, however, there are no standardplacing, compaction, or curing. It is unusual for the practices for developing the required relationship.concrete in a structure to have the same maturity as a There are also no generally accepted guidelines forstandard-cured cylinder. In addition, since standard- interpretation of in-place test results. These deficienciescured cylinders are normally tested at an age of 28 have been additional impediments to more widespreaddays, they cannot be used to determine whether ade- adoption of in-place tests.quate strength exists for safe removal of formwork orthe application of post-tensioning. Although portions 1.4--Objective o| reportof a structure, such as columns, may develop maturity This report reviews the state of the art of the widelyequal to that of standard 28-day cylinders, most flex- used methods for determining the in-place strength ofural and prestressed members do not develop equiva- concrete. Chapter 2 discusses the underlying principleslent maturity before they are required to accept large and inherent limitations of these methods. Statisticalpercentages of their design loads. For these reasons in- analysis of in-place test data is discussed in Chapter 3.place tests are needed to determine the strength of the The overall objective of this report is to provide theconcrete in the structure in the locations and at the potential user with a guide to assist in implementing
times required for these various construction opera- and in interpreting the results of in-place testing.tions.
Traditionally, some measure of the strength of the CHAPTER 2--REVIEW OF METHODSconcrete in the structure has been obtained by using 2.I--Introduction
The objective of an in-place test is to obtain an esti-field-cured cylinders. These are supposedly cured on orin the structure under the same conditions as the con- mate of the properties of concrete in the structurecrete in the structure. The results of tests on field-cured without having to drill and test core samples. Very
cylinders are often significantly different from the often the desired property is the cylinder compressivestrength of the concrete in place because it is difficult strength. To make a strength estimation it is necessary
to have a known relationship between the result of theand often impossible to assure identical bleeding, com-paction, and curing conditions in the cylinders and in in-place test and the strength of the concrete. Usuallythe structure. The test also lends itself to abuse. Im- such a relationship is empirically established in the lab-
proper handling or inappropriate storage of these cyl- oratory. Fig. 2.1 is an illustration of such a relation-inders may result in misleading data for critical opera-
.tions. , , , i , ,
To meet rapid construction schedules, form removal,
application of post-tensioning, termination of curing, Cylinderand the removal of reshores must be carried out as strengthearly as is possible and safe. The determination of in-place strength to enable these operations to proceedsafely at the earliest possible time requires the use ofreliable in-place tests. Conversely, it is clear that some , , m , , , ,major recent construction failures would not have oc- Testvaluecuffed had such measures been adopted (Lew 1980;
Carino et al. 1983). The use of in-place tests not only Fig. 2.l--Example of correlation relationship for pre-increases safety but can result in substantial savings in diction of in-place strength
IN-PLACEDETERMINATIONOF STRENGTH 228.1R-3
ship, in which the cylinder compressive strength is plot- shoulder area of the plunger and rebounds [Fig. 2.2(d)].ted as a function of an in-place test result. This rela- The rebounding hammer moves the slide indicator,tionship would be used to estimate the strength of which records the rebound distance. The rebound dis-concrete in a structure based on the value of the in- tance is measured on a scale numbered from 10 to 100place test result obtained from testing the structure. The and is recorded as the "rebound number" indicated onaccuracy of the strength prediction depends directly on the scale.the degree of correlation between the strength of con- The key to understanding the inherent limitations of
crete and the quantity measured by the in-place test. this test for strength prediction is understanding theThus, the user of in-place tests should have an under- factors influencing the rebound distance. From a fun-standing of what quantity is measured by the test and damental point of view, the test is a complex problemhow this quantity is related to the strength of concrete, of impact loading and stress-wave propagation. Basi-The purpose of this chapter is to explain the underlying cally, the rebound distance depends on the value of ki-principles of the widely used in-place test methods, and netic energy in the hammer prior to impact with theto point out those factors other than concrete strength shoulder of the plunger and how much of that energythat can influence the test results. Additional back- is absorbed during the impact. Part of the energy is ab-ground information on these methods is available in the sorbed as mechanical friction in the instrument, andreferences by Malhotra (1976) and Bungey (1982). part of the energy is absorbed in the interaction of the
The methods to be discussed include the following: plunger with the concrete. It is the latter factor that en-• rebound hammer ables one to use the rebound number as an indicator of
• probe penetration the concrete properties. The energy absorbed by the• pullout concrete depends on the stress-strain relationship of the• ultrasonic pulse velocity concrete. Therefore, absorbed energy is related to the• maturity strength and the stiffness of the concrete. A low-• cast-in-place cylinder strength, low-stiffness concrete will absorb more en-
ergy than a high-strength, high-stiffness concrete. Thus2.2--Rebound hammer the low-strength concrete will result in a lower rebound
The operation of the rebound hammer (also called number. Since it is possible for two concrete mixturesthe Schmidt Hammer or Swiss Hammer) is illustrated to have the same strength but different stiffnesses, thereschematically in Fig. 2.2. The hammer consists of the could be different rebound numbers even though thefollowing main components: l) outer body, 2) plunger, strengths are equal. Conversely, it is possible for two3) hammer, and 4) spring. To perform the test, the concretes with different strengths to result in the sameplunger is extended from the body of the instrument rebound numbers if the stiffness of the low-strengthand brought into contact with the concrete surface, concrete is greater than the stiffness of the high-
When the plunger is extended, a latching mechanism strength concrete. The aggregate type has an effect onengages the hammer to the upper end of the plunger, the stiffness of the concrete, which is why it is neces-The body of the instrument is then pushed toward the sary to develop the correlation relationship on concreteconcrete member. This action causes an extension of made with the same materials that will be used for the
the spring connecting the hammer to the body [Fig. concrete in the structure.2.2(b)]. When the body is pushed to its limit, the latch In rebound-hammer testing, only the concrete in thereleases and the spring pulls the hammer toward the immediate vicinity of the plunger influences the re-conc_ete member [Fig. 2.2(c)]. The hammer impacts the bound value. Hence, the test is sensitive to the local
conditions where the test is performed. If the plunger is(el located over a hard aggregate particle, an unusually
-IT- (bl high rebound number will result. On the other hand, if_--,oay __ the plunger is located over a large air void or over a
---W (c) (a) soft aggregate particle, a lower rebound number will,1- Latch
occur. To account for these possibilities, ASTM C 805Indicator- i requires that 10 rebound numbers be taken for a test.
,.,.-Hammer If one of the readings differs by more than seven unitsfrom the average, that reading should be discarded and
_Sprlng a new average should be computed based on the re-maining readings. If more than two readings differfrom the average by seven units, the entire set of read-
- Plunger ings is to be discarded.Because the rebound hammer test probes only the
_: iii._()17_i ,:.i._- :_! ;'.":_.!::_'i::' near-surface layer of concrete, the rebound number• _ ; :_. _:""" ":': "'_ may not be representative of the interior concrete. Thepresence of a layer of carbonation can result in higher
Fig. 2.2--Schematic illustration of the operation of the readings than are indicative of the interior concrete.rebound hammer Likewise, a dry surface will result in higher rebound
228.1R-4 ACI COMMITTEEREPORT
numbers than for the moist-interior concrete. Slightly __/
absorptive oiled plywood will absorb moisture from theconcrete and produce a harder surface layer than con- Damagezone
crete, local crushing occurs under the plunger and the 'i(.::i.i""-"_(l+"".!iii..i.:il.":":_i_i._indicated concrete strength will be lower than the truevalue. Rough surfaces should be ground before testing.If the formed surfaces are reasonably smooth, grinding
is unnecessary. A hard surface, such as produced bytrowel finishing, can result in higher rebound numbers.
Finally, the rebound distance is affected by the orien- Fig. 2.3--Approximate shape of failure zone in con-ration of the instrument, and the correlation relation- crete during probe penetration test
ship must be developed for the same instrument orien-tation as will be used for in-place testing.
In summary, while the rebound number test is a very The probe tip travels through mortar and aggregate;simple test to perform, there are many factors other in general, cracks in the fracture zone will be throughthan concrete strength that will influence the test re- the mortar matrix and the coarse-aggregate particles.suit. The user needs to be aware of these effects when Hence, the strength properties of both the mortar andevaluating the test results, the aggregates influence the penetration distance. This
contrasts with the behavior of concrete in a compres-sion test, where the mortar strength has a predominant
2.3--Probe penetration influence on the measured compressive strength. Thus,The probe-penetration technique involves the use of an important characteristic of the probe penetration test
a specially designed gun to drive a hardened steel rod is that the type of coarse aggregate has a strong effect(or probe) into the concrete. (The common commercial on the correlation relationship between concretesystem for this type of test is known as the Windsor strength and probe penetration. For example, Fig. 2.4Probe.) The amount of penetration of the probe is used is a schematic illustration of empirical correlation rela-as an indicator of the concrete strength. From a fun- tionships between compressive strength and probe pen-
damental point of view, this method is similar to the etration for concretes made with a soft aggregate (suchrebound hammer test, except that the probe impacts the as limestone) and with a hard aggregate (such as chert).concrete with much higher energy than the plunger of For equal compressive strengths, the concrete with thethe rebound hammer. A theoretical analysis of this test soft aggregate results in greater probe penetration thanis even more complicated than the rebound test, but the concrete with the hard aggregate. More detailed in-again the essence of the test involves the initial kinetic formation on the influence of aggregate type on corre-energy of the probe and energy absorption by the con- lation relationships can be found in Malhotra (1976)crete. The probe penetrates into the concrete to the dis- and Bungey (1982).tance required for the absorption of its initial kineticenergy. The initial kinetic energy is governed by the sizeof the powder charge to fire the probe, the location ofthe probe in the gun barrel prior to firing, and fric-tional losses as the probe travels through the barrel. An 5.
essential requirement of this test is that the probe havea consistent value of initial kinetic energy. ASTM _ +- _,r,a_w.,-_C 803 requires that the exit velocities of probes shouldnot have a coefficient of variation greater than 3 per- _ _-
cent based on 10 tests by approved ballistic methods. __The probe penetrates into the concrete until its initial
2 m
kinetic energy is completely absorbed by the concrete.Some energy is absorbed by friction between the probeand the concrete, and some is absorbed by crushing and
fracturing of the concrete. There are no rigorous stud- o 0.5 ' 017 ' 0'.9 ' 111 ' 113 ' 115 = 117 I'.g
ies of the factors affecting the geometry of the fracture m¢_o. =_.zone, but its general shape is probably as illustrated inFig. 2.3. There is an approximately cone-shaped region
in which the concrete is heavily fractured, and this is Fig. 2.4--Effect of aggregate type on relationship be-the zone where most of the probe energy is absorbed, tween concrete strength and depth of probe penetration
IN-PLACEDETERMINATIONOF STRENGTH 228.1R-5
d= _ roughly cone-shaped fragment of the concrete is also
Insidediameterreactionring/ extracted. The diameter d2 of the reaction ring deter-mines the large diameter of the conic fragment, and theI[ _ F e lI Co,-,ter small diameter d_ is determined by the insert-head di-_I I . ore It pres_e force
I_ _ from ram I_ ameter. The requirements for the testing configuration
Reaction ring V/IyA Concretesurface[//iT/ i//1 Reactlonring are given in ASTM C 900. The embedment depth and
...........v..:' ...: _ _,-_....• ...."" ":[_te/m[::.____:::. :./::"__,/.i _" ".",;!/. :. i_''/ :. ...... : head diameter must be equal, but thereanyiSno require-
" .:..:..:.:..:_: ! .:.":.:::i • ". ' "
• ...... ..... .x :..: '.- \/ h.'--ii_: ment onthemagnitudeofthesedimensions. Theinner"' -"' '',. " ":.: . " : • /' . h=embedment depth_ diameter of the reaction ring can be size in the
Idealized / ". _ " . .
tel_a _ace t///_ ' _:: : :ii range of 2.0 to 2.4 times the insert-head diameter. This• " • " Head ' ' ::..: ....... r///_ _. . "/'/'J..... means that the apex angle of the conic frustum defined
• :.. _ 2_//'Ap : ' ! : by the insert-head diameter and the inside diameter of'""":":" V ex angle " the reaction ring can vary between 54 to 70 deg. The
I same test geometry must be used in developing the cur--_ d, = i relation relationship as will be used for the in-place
Head diameter testing.
Fig. 2.5--Schematic of pullout test Unlike the rebound hammer and probe penetrationtests, the pullout test subjects the concrete to a static
Because the probe penetrates into the concrete, test loading that is amenable to stress analysis. Using theresults are not affected by local surface conditions such finite element method, the stresses induced in the con-as texture and moisture content. However, a harder crete have been calculated for the case before any
surface layer, as would occur in trowel finishing, can cracking has developed (Stone and Carino 1984) andresult in low penetration values and excessive scatter of for the case where the concrete has cracked (Ottosendata. In addition, the direction of penetration into the 1981). There is agreement that the test subjects theconcrete is unimportant provided that the probe is concrete to a highly nonuniform three-dimensional
driven perpendicular to the surface. In practice it is state of stress. Fig. 2.6 shows the approximate direc-customary to measure the exposed length of the probes, tions (trajectories) of the principal stresses acting in ra-However, the fundamental relationship is between con- dial planes (those passing through the center of the in-crete strength and depth of penetration. Therefore, sert) prior to any cracking and for apex angles of 54when assessing the variability of test results (see Chap- and 70 deg. Because of symmetry, only one-half of theter 3), it is preferable to express the coefficient of vari- specimen is shown in the figures. These trajectoriesation in terms of penetration depth rather than exposed would be expected to change after cracking develops. Itlength, is seen that prior to cracking there are tensile stresses
that are approximately perpendicular to the eventual2.4--Pullout test failure surface, and that compressive stresses are di-
The pullout test measures the ultimate load required rected from the insert head towards the ring. The mag-to pull an embedded metal insert with an enlarged head nitude of these principal stresses are nonuniform andfrom a concrete specimen or structure. The pulling load are greatest near the top edge of the insert head.is applied by a tension jack, which reacts against the A series of analytical and experimental studies haveconcrete surface through a reaction ring concentric with been carried out to determine the failure mechanism ofthe insert (Fig. 2.5). As the insert is pulled out, a the pullout test, some of which are critically reviewed
Fig. 2.6--Directions of principal stresses in concrete prior to cracking for pullouttest: (a) apex angle = 70 deg; (b) apex angle = 54 deg (Stone and Carino 1984)
228.1R-6 ACI COMMITTEEREPORT
by Yener and Chen (1984). While the conclusions have I- _ Timer anddiffered, it is generally agreed that circumferential Pulser [ [ Displaycracking (producing the failure cone) begins in the ---highly stressed region adjacent to the insert head at apullout load that is a fraction of the ultimate value.With increasing load, the circumferential crackingpropagates toward the reaction ring. However, there is ....... < .no agreement on the nature of the final failure mecha- ...,. i_. _._...nism governing the magnitude of the ultimate pullout ."..."..:....,_"...."..:'
load. C j'.":)))) i".-.."':i ]In one analytical study (Ottosen 1981), it was con- Transmitter , : ...... Receiver
cluded that ultimate failure is due to "crushing" of.--... ...... ..-s
concrete in a narrow band between the insert head and * .L:. _ :the reaction ring. Thus, the pullout load is said to de- " " "
pend directly upon the compressive strength of theconcrete. In another analytical study (Yener and Vaja- Fig. 2.7--Principle of operation of apparatus for mea-rasathira 1985), ultimate failure is said to occur by out- suring ultrasonic pulse velocityward crushing of concrete around the perimeter of thefailure cone near the reaction ring. Using linear-elastic configuration and concrete materials employed in thefracture mechanics and a two-dimensional model, oth- correlation testing.
ers (Ballarini, Shah, and Keer 1986) have concluded The pullout strength is governed primarily by thatthat ultimate load is governed by the fracture tough- portion of the concrete located adjacent to the conicness of the matrix. In an experimental study (Stone and frustum defined by the insert head and reaction ring.Carino 1983), it was concluded that prior to ultimate Commercial inserts have embedment depths on the or-load, circumferential cracking extends from the insert der of 25 to 30 mm. Thus, only a small volume of thehead to the reaction ring; additional load is resisted by concrete is tested, and because of the inherent hetero-
aggregate interlock across the circumferential crack. In geneity of concrete, the average within-batch coeffi-this case, ultimate failure is said to occur when suffi- cient of variation of these pullout tests has been foundcient aggregate particles have been pulled out of the to be in the range of 7 to 10 percent, which is about twomortar matrix. According to the aggregate interlock to three times that of standard cylinder compressionargument, ultimate load is not directly related to the tests.compressive strength. However, there is good correla-tion between ultimate pullout load and compressive 2.S--Ultrasonic pulse velocitystrength of concrete, because both values are influ- The ultrasonic pulse velocity test, as prescribedenced by the mortar strength (Stone and Carino 1984). in ASTM C 597, determines the propagation velocityAnother finite element study, using nonlinear fracture of a pulse of vibrational energy through a concretemechanics and a discrete cracking model, showed ex- member. The operational principle of modern testing
cellent agreement between the predicted and observed equipment is illustrated.in Fig. 2.7. A pulser sends ainternal cracking in the pullout test (Hellier et al. 1987). short-duration, high-voltage signal to a transducer,This study also concluded that ultimate failure does not causing the transducer to vibrate at its resonant fre-occur because of a compressive failure of the concrete, quency. At the start of the electrical pulse an electronic
Unlike other in-place tests, the standard pullout test timer is switched on. The transducer vibrations arerequires preplannning the locations of the inserts on the transferred to the concrete through a viscous couplingformwork. In addition, the test cannot be performed fluid. The vibrational pulse travels through the mem-
on structures lacking embedded inserts. However, other bet and is detected by a receiving transducer coupled totypes of pullout tests are available, which can be car- the opposite concrete surface. When the pulse is re-tied out on existing construction. These involve drilling ceived, the electronic timer is turned off and the elapseda hole and inserting some type of expanding device that travel time is displayed. The direct path length betweenwill engage in the concrete and produce a failure in the the transducers is divided by the travel time to obtainconcrete when the device is extracted. These methods the pulse velocity through the concrete.
are still in their developmental stages and have not been The pulse velocity is proportional to the square rootstandardized as ASTM test methods, of the elastic modulus and inversely proportional to the
A positive feature of the pullout test is that it pro- square root of the mass den'sity of the concrete. If it isduces a rather well-defined failure in the concrete and assumed that the elastic modulus of concrete is propor-
measures a static strength property of the concrete, tional to the square root of the compressive strength, asHowever, since there is not a consensus on what this suggested by ACI 318, then the pulse velocity is pro-strength property is, it is necessary to develop an em- portional to the square root of the square root of the
pirical correlation relationship between the pullout compressive strength. This means that, for a given con-strength and the compressive strength of the concrete, crete mixture, as the compressive strength increasesThe relationship is applicable to only the particular test with age there is a proportionately smaller increase in
IN-PLACEDETERMINATIONOF STRENGTH 228.1R-7
the pulse velocity. For example, reported data (RILEM The measured pulse velocity may also be affected by1981) indicate that an increase in early-age compressive the presence of cracks or voids along the propagationstrength from 500 to 1500 psi (3.4 to 10.3 MPa) may path from transmitter to receiver. The pulse may beincrease the velocity from about 13,100 to about 15,000 diffracted around the discontinuities, thereby increas-ft/s (4000 to 4600 m/s). On the other hand, at later ing the travel path and travel time. Without additionalages a gain in compressive strength from 4000 to 5000 knowledge about the interior condition of the concretepsi (27.6 to 34.5 MPa) may increase the velocity from member, the apparent decrease in pulse velocity couldabout 16,700 to only about 17,100 ft/s (5090 to 5220 be incorrectly interpreted as a low compressive strength.m/s). Thus at later ages the pulse velocity of concrete In this test method, the concrete between the trans-is not sensitive to gain in strength, mitting and receiving transducers affects the travel
Factors other than concrete strength can affect pulse time. Test results are, therefore, relatively insensitive to
velocity, and changes in pulse velocity due to these fac- the normal heterogeneity of concrete. For this reason,tors may overshadow changes due to strength (Sturrup, the test method has been found to have an extremelyVecchio, and Caratin 1984). One of the most impor- low within-batch coefficient of variation. However,tant factors is moisture content. As the moisture con- these favorable results should not be interpreted totent of concrete increases from the air-dry to saturated mean that highly reliable in-place strength predictions
condition, it is reported that pulse velocity may in- can be routinely obtained.crease up to 5 percent (Bungey 1982). Thus, if the ef-fects of moisture are not taken into account, erroneous
conclusions may be drawn about in-place strength, 2.6--Maturity methodespecially in mature concrete. Empirical correlation re- Freshly placed concrete gains strength as a result oflationships between compressive strength and pulse ve- the exothermic chemical reactions between the waterlocity should be determined at moisture conditions and cementitious materials in the mixture. Providedsimilar to those expected for the concrete in place, sufficient moisture is present, the rates of the hydra-
Another influencing factor is the presence of steel re- tion reactions are influenced by the concrete tempera-inforcement. Since the pulse velocity through steel is ture; an increase in temperature causes an increase inabout 40 percent greater than through concrete, the the reaction rates. The extent of hydration and, there-
pulse velocity through a heavily reinforced concrete fore, strength at any age is a function of the thermalmember may be greater than through one with little history of the concrete.reinforcement. This is especially troublesome when The maturity method is a technique for accountingreinforcing bars are oriented parallel to the pulse-prop- for the combined effects of temperature and time on
agation direction. The pulse may be refracted into the strength development. The thermal history of the con-bars and transmitted to the receiver at the pulse veloc- crete and a so-called "maturity function" are used toity in steel. The resulting apparent velocity through the compute a "maturity" value that quantifies the com-member will be greater than the actual velocity through bined effects of time and temperature. The strength ofthe concrete. Failure to account for the presence and a particular concrete mixture is expressed as a function
orientation of reinforcement may lead to incorrect con- of its maturity by means of a "strength-maturityclusions about concrete strength. Correction factors, relationship." If samples of the same concrete are sub-such as those discussed in Malhotra (1976) and Bungey jected to different curing conditions, the strength-ma-(1982), have been proposed, but their reliability is turity relationship for that concrete and the thermalquestionable, histories of the samples can be used to predict their
strengths.The maturity function is a mathematical expression
t that converts the thermal history of the concrete to aM = (T - To) dt maturity value. Several such functions have been pro-
posed and are reviewed in Malhotra (1971) and RILEMo (1981). The key feature of a maturity function is the
I-- _ expression used to represent the influence of tempera-
f__ ture on the rate of strength development. Two expres-
sions have found widespread usage. In one case it isassumed that the rate of strength development is a lin-ear function of temperature, and this leads to the sim-
__;:_ pie maturity function shown in Fig. 2.8. In this case the"',:'.;', ,.". ".'.?',',;"_.;',,".'-'.".'.'.",'".'_''._'?¢.".'"'.'_-","_:_'_',"_,'<'_"- "": "/h'." _._'_"
I-- To ;._'.'__/_:-_.._._:._,-.._.'.,_-_:_.._.'a_. maturity at any age is quantified by the area between adatum temperature To and the temperature curve of the
Time, T concrete. The term "temperature-time factor" is usedfor this area and is calculated as follows
Fig. 2.8--Maturity function based on assumption thatrate of strength gain varies linearly with temperature M(t) = r. (T, - To) A t (2-1)
228.1R-8 ACl COMMITTEEREPORT
where M(t) = the temperature-time factor available that automatically compute maturity, but careat age t, degree-days or should be exercised in their use because the maturitydegree-hours function used by the instrument may not be applicable
At = a time interval, days or to the concrete in the structure. ASTM C 1074 gives thehours procedure for using the maturity method and provides
7"0= average concrete temperature examples of how to compute the temperature-time fac-during time interval_t tot or equivalent age from the recorded temperature
To = datum temperature history of the concrete. ACI 306R also illustrates theuse of the temperature-time factor (referred to as the
Traditionally, the datum temperature has been the "maturity factor" in ACI 306R).temperature below which strength gain ceases, which The maturity method is intended for estimatinghas been assumed to be about 14 F (- 10 C). However, strength development of concrete. Strength estimatesit has been suggested that a single value for the datum are based on two important assumptions: 1) there is al-
temperature is not the most appropriate approach and ways sufficient water for continued hydration, and 2)that the datum temperature should be evaluated for the the concrete in the structure is the same as that used tospecific materials in the concrete mixture (Carino 1984). develop the strength-maturity relationship. Proper cur-ASTM C 1074 recommends a datum temperature of 32 ing procedures (as provided in ACI 308) will assure thatF (0 C) for concrete made with Type I cement when the the first condition is satisfied. To satisfy the secondconcrete temperature is expected to be between 32 and condition requires additional confirmation that the104 F (0 and 40 C). A procedure is also provided for concrete in the structure has the correct strength poten-experimentally determining the datum temperature for tial. This can be achieved by performing acceleratedother types of cement and for different ranges of cur- strength tests on concrete sampled from the structure oring temperature, by performing other in-place tests that give positive in-
The other expression used in a maturity function as- dications of the strength level. This verification is es-sumes that the rate of strength gain varies exponen- sential when estimates of in-place strength are used fortially with concrete temperature. This exponential timing critical operations such as formwork removal orfunction is used to compute an "equivalent age" of the application of post-tensioning.concrete at some specified temperature as follows
2.7--Cast-in-place cylindersThis is a technique for obtaining cylindrical concrete
t,, = "2,e- Q (I/7'' - I/T,) /',t (2-2) specimens from newly cast slabs without drilling cores.The method is described in ASTM C 873 and involves
where t, = equivalent age at a specified using a mold, as illustrated in Fig. 2.9. The outer sleevetemperature T,, days or is nailed to the formwork and is used to support a cy-hours lindrical mold. The sleeve can be adjusted for different
Q = activation energy divided by slab thicknesses. The mold is filled when the slab is castthe gas constant, deg K and the concrete in the mold is allowed to cure along
T = average temperature of with the slab. The objective of the technique is to ob-concrete during time interval tain a test sample that has been subjected to the samei_t, deg K
T, = specified temperature, deg K
h,t = time interval, days or hours Top of slab--/l(__
To use the exponential function one needs the value ofa characteristic known as the "activation energy," Supportingwhich depends on the nature of the cementitious mate- sleeve --rials. The relationships between activation energy and Removeabledatum temperature are described by Carino (1984). moldASTM C 1074 recommends a Q-value of 5000 deg K,for use in Eq. (2-2), for concrete made with Type I ce-ment.
To utilize the maturity method requires establishing Forrn_ nthe strength-maturity relationship for the concrete that / / J |will be used in the structure. The temperature history of _ _ \ _ _ , _ _ _ _ _ _ _ _ _ , _ _the in-place concrete is continuously monitored andfrom this data the in-place maturity (temperature-timefactor or equivalent age) is computed. Knowing the in-
place maturity and strength-maturity relationship, the Fig. 2.9--Special mold used to obtain cast-in-place cy-in-place strength can be estimated. Instruments are lindrical concrete sample
IN-PLACEDETERMINATIONOF STRENGTH 228.1R-9
Table 2.1 -- Summary of survey on usage of mercial testing laboratories in Canada and the Unitedin-place tests States to determine the relative usage of these tests. A
No.of labs total of 25 laboratories from Canada and 27 laborato-
performingtest ries from the U.S. responded to the survey, the resultsType of test Canada U.S. Total
of which are summarized in Table 2.1. The survey in-Rebound hammer 19 27 46
dicates that the rebound hammer is the most widelyProbepenetration 2 22 24 used in-place test method, and the probe penetrationPullout 6 6 _2 method is the second most common test. The labora-Pulsevelocity 3 _0 13 tories were also asked to rate each of the methods in
Maturity 3 1 4 terms of their reliability, simplicity of use, accuracy,Cast-in-place cylinder 5 3 8 and economy. The results of this rating are summa-
rized in Table 2.2. Because of the small number of lab-
oratories using techniques other than the reboundhammer and probe penetration methods, it is difficult
to reach definite conclusions about the performance
Table 2.2 -- Comparison of experience rating rating of all the methods. However, it is clear that whileCanada U.S. the rebound hammer is widely used because of its sim-
Type of test R S A E R S A E plicity and economy, it is not the method of choice inRebound hammer F-G VG-E F-G VG-E F G-VG F-G G-VG terms of reliability and accuracy. The probe-penetra-
Probepenetration F-G VG G VG G G G F-G tion and pullout test appear to have good to very good
Pullout G-VG:G-VG VG G-VG G G G F-G ratings in the four categories. There seems to be a dif-ference of opinion between U.S. and Canadian users ofPulse velocity G-VG VG G-VG G-VG F-G F F-G F-G
pulse velocity, but this may be due to the small sampleMaturity F F-P G F-P G P G P
size rather than a difference in practices.Cast-in-place VG VG-E VG VG G G-VG G F-G
cylinder In-place tests provide alternatives to core tests for es-timating the strength of concrete in a structure, or can
Legend P = poor
R = reliability F = fair supplement the data obtained from a limited number ofS = simplicity G = good cores. These methods are based on measuring a con-A = accuracy VG = verygood crete property that bears some relationship to strength.E = economy E = excellent The accuracy of these methods is, in part, determined
by the degree of correlation between strength and thephysical quantity measured by the in-place test. For
thermal history as the concrete in the structure. When proper evaluation of test results, the user must be awareit is desired to know the in-place strength, the mold is of those factors other than concrete strength that canremoved from the sleeve and stripped from the con- affect the test results. Additional fundamental researchcrete cylinder. The cylinder is capped and tested in is needed to improve our understanding of how thesecompression. For cases in which the length-to-diameter methods are related to concrete strength and how theratio of the cylinders is less than 2, the measured com- test results are affected by factors other than strength.pressive strengths need to be corrected by the factors in An essential step for using these methods to estimateASTM C 42. the in-place strength is the development of a correla-
tion relationship between strength and'the quantity2.8--Combined methods measured by the in-place test. The data acquired for
Data from two methods can be combined in a single developing the correlation relationship provide valu-correlation relationship to improve accuracy (e.g., re- able information on the reliability of the predictions.bound hammer plus ultrasonic pulse velocity, or probe Chapter 3 of this report gives recommendations for thepenetration plus ultrasonic pulse velocity). Combina- development and use of correlation relationships.tions such as pulse velocity and rebound hammer have
been reported to improve accuracy, but in most appli-cations the improvement has only been marginal (Tan- CHAPTER 3--STATISTICAL ANALYSIS OF TESTigawa, Babe, and Mori 1984; Samarin and Dhir 1984; RESULTSSamarin and Meynink 1984). Hence, the use of corn- 3.I--Introductionbined methods may not be economically justified. In designing a structure to safely resist the expected
loads, the engineer uses the specified compressive2.9--Summary strength f,_ of the concrete. The strength of the con-
A review has been presented of methods that can be crete in a structure is variable and, as indicated in ACI
used for estimating the in-place strength of concrete. 214, the specified compressive strength is generally as-While other procedures have been proposed (see Mal- sumed to represent the strength which is expected to behotra 1976 and Bungey 1982), the methods that have exceeded with about 90-percent probability. To insurebeen discussed are the ones Commonly used in North that this condition is satisfied, the concrete supplied forAmerican practice. A survey was conducted of com- the structure must have an average standard-cured cyl-
228.1R-10 ACI COMMITTEEREPORT
inder strength in excess of f,_ as specified in Chapter 4 2. The uncertainty of the correlation relationship de-of ACI 318. When the strength of concrete in a struc- rived from a limited number of correlation tests.
ture is under scrutiny because of low standard-cured 3. The variability of the in-place compressivecylinder strengths or because of suspected curing deft- strength.ciencies, ACI 318 states that the concrete is structurally The following sections deal with these items.adequate if the in-place strength, as represented by theaverage core strength, is not less than 0.85 f_. 3.2--Repeatability of results
In assessing the ability of a partially completed The uncertainty of the average value of the in-placestructure to safely resist construction loads, it is there- test results is indicated by the standard deviation of thefore reasonable that the tenth-percentile in-place com- results and by the number of tests. The standard devia-pressive strength (strength exceeded with 90-percent tion is in turn a function of the repeatability of the testprobability) should be equal to at least 0.85 of the re- and the variability of the concrete in the structure.quired compressive strength at the time of application In this report, repeatability is defined as the standardof the construction loads. The required strength means deviation or coefficient of variation of repeated tests bythe compressive strength used in computing the nomi- the same operator on the same material. This is oftennal load resistance of structural elements. In-place tests called the "within-test" variation and is indicative of
can be used to estimate the tenth-percentile strength the inherent scatter associated with a particular test.with a high degree of confidence only if test data are Data on the repeatability of some in-place tests aresubjected to statistical analysis, provided in the precision statements of the ASTM
The use of the tenth-percentile strength as the level of standards governing the tests. Some information on thethe in-place strength that should be relied upon to re- repeatability of other tests may be found in publishedsist applied construction loads is perceived as a reason- reports. Unfortunately, the majority of published dataable procedure by users of in-place tests. The critical deal with correlations with standard strength tests,nature of construction operations in partially corn- rather than with repeatability. As will be seen, conclu-pleted structures, the sensitivity of early age strength on sions about repeatability are often in conflict because ofthe previous thermal history of the concrete, and the differences in test designs or in data analysis.general lack of careful consideration of construction 3.2.1 Rebound hammer--In the precision statementloading during the design of a structure, dictate the use of ASTM C 805, the within-test standard deviation isof a conservative procedure for evaluating in-place test reported to be 2.5 rebound numbers. The results of tworesults. Inadequate strength at the time of a proposed recent studies (Keiller 1982; Carrette and Malhotraconstruction operation can usually be remedied by sim- 1984), which were performed to evaluate the perfor-
ply providing for additional curing before proceeding mance, of various in-place tests, provide additional in-with the operation, sight into the repeatability of the rebound test. In one
Some in-place tests may also be used to evaluate the study (Keiller 1982), eight different mixtures were usedstrength of an existing structure. Often they are used to and twelve replicate rebound readings were taken atanswer questions that arise because of low strengths of ages of 7 and 28 days. In the other study (Carrette andstandard cylinders. Failure to meet specified accep- Malhotra 1984), four mixtures were used along withtance criteria can result in severe penalties for the twenty replications at ages of 1, 2, and 3 days. Fig. 3.1builder. In such cases, the use of the tenth-percentile shows the standard deviations of the rebound numbersstrength as the reliable strength level to resist design as a function of the average rebound number. The dataloads is not the appropriate technique for analyzing in- from the two laboratories appear to be consistent. Theplace test data. The existing criteria for the acceptance average standard deviation for the CANMET studyof concrete strength in an existing structure are based (Carrette and Malhotra 1984) is 2.4 rebound numbers,on testing cores. If the average compressive strength of which is remarkably close to that quoted in ASTMthree cores exceeds 85 percent of the specified corn- C 805. However, the average standard deviation in thepressive strength and no single core strength is less than Cement and Concrete Association (C & CA) study75 percent of the specified strength, the concrete (Keiller 1982) is 3.4 rebound numbers. In Fig. 3.1, therestrength is deemed to be acceptable. However, there are appears to be a trend of increasing standard deviationno analogous acceptance criteria for equivalent in-place with increasing rebound number. If such is the case, thecompressive strength based on in-place tests. Addi- coefficient of variation may be a better measure of re-tional study is required to develop acceptance criteria peatability. Fig. 3.2 shows the coefficients of variationfor the results of in-place tests that are consistent with plotted as a function of average rebound number. Inthe existing Criteria for core strengths, this case there does not appear to be any clear trend
In arriving at the value of the tenth-percentile in- with increasing rebound number. The average values ofplace compressive strength by means of in-place tests, coefficient of variation for the two laboratories are ex-one must account for various sources of variability or actly the same, l 1.9 percent.uncertainty: In Fig. 3.2, the coefficients of variation are not con-
1. The uncertainty of the average value of the in- stant. However, it must be realized that the values areplace test results based on a limited number of in-place based on sample estimates of the true averages andtests, standard deviations. With finite sample sizes there will
1N-PLACE DETERMINATION OF STRENGTH 228.1R-11
6
13
5 o
oId
oI o
z �D_o 3 o o
* _ * ° % .
2 + _+
1 D Kegler
+ Carrette & Malhotra
0 I I I I l I I I I ! I I I I
I 0 14 18 22 26 30 34 38
AVI_GF" REBOUNDNUMBER
Fig. 3.1_ Within-test standard deviation as a function of average rebound number
24
22
20 (3
18
4- rl16K 0" 14- +
u. 12 + []o + o o
,., 10 +o _ 0 ou [] 0
8 + 00
6
4 rt K_ller
+ Carrette & Malholro2
0 I i I ! i' I I ! I ! I I I . !
10 14 18 22 26 30 34 38
AVE:RAGEREBOUNDNUMBER
Fig. 3.2--Within-test coefficient of variation as a function of average reboundnumber
be errors in these estimates, and a random variation in dard deviations of exposed probe length for three rep-
the computed coefficient of variation is expected even licate tests are 0.08, 0.10, and 0.14 in. (2.0, 2.5, and 3.6
though the true coefficient of variation is constant, ram) for tests in mortar, in concrete with 1 in. (25 mm)
Thus it appears that the repeatability of the rebound maximum aggregate size, and in concrete with 2 in. (50
number technique may be described by a constant mm) maximum aggregate size, respectively.
coefficient of variation, which has an average value of The data provided in the CANMET (Carrette and
about 10 percent. Malhotra 1984) and C & CA (Keiller 1982) studies,
3.2.2 Probe penetration--In the precision statement which cover concrete strengths in the range of 1500 to
of ASTM C 803, it is reported that the within-test stan- 7000 psi (10 to 50 MPa), give additional insight into the
228.1R-12 ACI COMMITTEE REPORT
0.2
0.19
0.18
0.17 0
0.18
0.15+
0.14 +0.13 +
__, 0.12 D
,_, 0.11 + Oa 0.1 + D+
i 0.09 + +0.08 + + O El=0.07 +
+0.06 - O
0.05 - D
0.04 - D OD Kelller
0.03
0.02 & M,',lhotro []
0.01 []
0 I I I I I I I I I I 1 I I I I I I I I
0.5 0.7 0.9 1.1 1.3 1.5 1.7 1.9 2.1 2.3 2.5
AVERAGE EXPOSED LE]tGI'H (In.)
Fig. 3.3--Within-test standord deviation as a function of average exposed length ofprobes
16
15
14
13 +
12 +11 +
_> 9 + [],. 8O + 4-,. 7 +h, +O 8 4-U
5 + DO[]
4 4- D
3 [] Kelller [] O2
�Carratte& Molholxl [] []I []
[]
0 i i i i i i I i | i i | i i | i i i i
0.5 0.7 0.9 1.1 1.3 1.5 1.7 1.9 2.1 2.3 2-5
AVERAGE EXPOSED LIE_I_ (in.)
Fig. 3.4-- Within-test coefficient of variation as a function of average exposedlength of probe
underlying measure of repeatability for this test. Fig. age exposed length. The decreasing trend with increas-3.3 shows the standard deviations of the exposed length ing concrete strength is more pronounced than in Fig.of the probes as a function of the average exposed 3.3. Thus the repeatability of the exposed length is nei-
length. The CANMET values are based on the average ther described by a constant standard deviation nor aof six probes, while C & CA results are based on three constant coefficient of variation.
probes. Except for one outlying point, there is a trend The customary practice is to measure the exposedfor decreasing within-test variability with increasing ex- length of the probes, but concrete strength has a directposed length. In Fig. 3.4, the coefficients of variation effect on the depth of penetration. A more logical ap-of exposed length are shown as a function of the aver- proach is to express the coefficient of variation in terms
IN-PLACE DETERMINATION OF STRENGTH 228.1R-13
16
15- r-i
14-13
D Kegler12 D 1311 `4- Can'wtte& Malhob'a
R 10 ov 0
b. 8o `4-,. 7 D `4- `4-Id O 4-O 6O `4-
5 u :_ '4- +4 D rt �`4-
+3
2 QQ
1
0 I I I I I I I I I I ! I
0.4 0.8 1.2 1.6 2 2.4 2.8
PENE'n_TIONDEPTHOn.)
Fig. 3.5-- Within-test coefficient of variation as a function of average penetrationdepth of probes
of depth of penetration. Fig. 3.5 shows the coefficient and the average coefficient of variation is 5.4 percent,
of variation of the penetration depth as a function of while in the C & CA study (Keiiler 1982) it was 7.8 per-
average penetration. In this case there is no clear trend cent for the same maximum aggregate size. Other work
with increasing penetration. The higher scatter of the (Swamy and AI-Hamad 1984) used 3A in. (10 mm)
values from the C & CA tests may be due to their maximum aggregate size, and the coefficients of varia-
smaller sample size compared with the CANMET tests, tion ranged between 2.7 and 7 percent. For commonly
Note that the standard deviation has the same value used ¾ in. (19 mm) aggregate, it is concluded that awhether exposed length or penetration depth is used. coefficient of variation of 5 percent is reasonable.However, the value of the coefficient of variation de- 3.2.3 Pullout test--The current ASTM test method
pends on whether the standard deviation is divided by for the pullout test (ASTM C 900) does not have a pre-average exposed length or average penetration depth, cision statement. However, there are published data on
Hence, it appears that a constant coefficient of vari- the within-test variability of this test. Recent work at
ation of the penetration depth can be used to describe the National Bureau of Standards (NBS) (Stone, Car-
the within-test variability of the probe penetration test. ino, and Reeve 1986) examined whether standard de-The CANMET work (Carette and Malhotra 1984) is the viation or coefficient of variation is the best measure of
first known study that uses this method for defining the repeatability. Four test series were performed. Three of
repeatability of the penetration test. However, other them used a 70-deg apex angle but different aggregate
test data using the probe penetration system can be types: river gravel, crushed limestone, and expanded
manipulated to yield the coefficient of variation of lightweight shale. The fourth series was for a 54-degpenetration depth provided two of these three quan- angle with river-gravel aggregate. The embedment
tities are given: average exposed length; standard de- depth was about 1 in. (25 mm), and compressive
viation; and/or coefficient of variation of exposed strength of concrete ranged from about 1500 to 6000
length. Using the data given in Table 6 of Malhotra's psi (10 to 40 MPa). Fig. 3.6 shows the standard devia-
1976 review, the following values for average coeffi- tion, using 11 replications, as a function of the average
cients of variation for depth of penetration have been pullout load. It can be seen that there is a tendency for
calculated: the standard deviation to increase with increasing pull-
out load. Fig. 3.7 shows the coefficient of variation asCoefficient ofMaximum variation of a function of the average pullout load. In this caseaggregate penetration there is no trend between the two quantities. Thus, it
size depthmay be concluded that the coefficient of variation
2 in. (50 mm) 14.0O/o1 in. (25 mm) 8.6070 should be used as a measure of the repeatability of the
3,,ain. 09 mm) 3.5, 4.7, and 5.6% pullout test.
Table 3.1 gives the reported coefficients of variation
In the CANMET study (Carrette and Malhotra from different laboratory studies of the pullout test. In
1984), the maximum aggregate size was 3A in. (19 mm) addition to these data, the work of Krenchel and Peter-
228.1R-14 ACI COMMITTEE REPORT
1.5
1.4 vrl G701.3v G54
1.20 LW i-1
1.1 + LS
1 r_
_. o._[]
Q"_ 0.6 V +
0.5 + V
+_r+
D .t- o V0.4 v
o V ¢0.3
D0.2 0 ¢ ¢ ¢
[]0.1 o
0 I I l I I I I i I I l
0 2 4 6 8 10 12('rhousondn)
PULLOUTLOAD(ibs)
Fig. 3.6-- Within-test standard deviation as a function of average pullout load(Stone, Carino, and Reeve 1986)
2o ;19 _
I"1 G7018-
17 - V G54.16 - ¢ LW V
15- + LS + 0 0
14- v13- vzo 12-
11 - O V 0
>_ 10- I:3 + +[]h 9 + "_"0 8 0 V
"_ 7 O ¢ V+V O O +o 6 ¢ +
¢ ¢5 i-1 v4
3
2 ¢1
0 I ! I ! I I I I I ! I
0 2 4 6 8 10 12O'houeand,,)
PULLOUTLOADObe)
Fig. 3.7--Coefficient of variation as a function of average pullout load (Stone,
Carino, and Reeve 1986)
son* summarizes the repeatability obtained in 24 cor- have involved different test geometries and differentrelation testing programs involving an insert with a 1 types and sizes of coarse aggregate. In addition, the ge-in. (25 mm) embedment and a 62-deg apex angle. The ometry of the specimens containing the embedded in-reported coefficients of variation ranged from 4.1 to serts were varied, with cylinders, cubes, beams, and
15.2 percent, with an average of 8 percent. The tests slabs being common shapes. Because of these testingreported in Table 3.1 and by Krenchel and Peterson' differences, it is difficult to draw firm conclusions
about the repeatability of the pullout test.
*Krenchel, H. and Peterson, C. G., "In Situ Pullout Testing with Lok-Test-- Table 3.2 summarizes the coefficients of variationTen Years Experience," manuscript submitted for publication to Nordisk Be- obtained in a study by NBS (Stone and Giza 1985) de-tong.
'Ibid. signed to examine the effects of different variables on
IN-PLACE DETERMINATION OF STRENGTH 228.'1R-15
Table 3.1 -- Summary of within-test coefficient of variation o! pullout testMaximum Range of Average
Apex Embedment ag.greg.ate Type of Sample C.V.,* C.V.,Reference angle depth, in. s*ze, m. aggregate size percent percent
70 0.98 _A Crush 4 x I 1 8.0-10.1 8.870 0.98 JA Gneiss 2 x I 1 7.2-16.8 12.0
Porous70 0.98 JA Limes 2 x 11 7.7-10.9 9.3
*C.V. = coefficient of variation.
'R.Gravel = river gravel.
test repeatability. The column labeled "sample size" lightweight aggregate, the variability was lower than forindicates the number of groups of tests, with each tests with normal weight aggregates. In this study,group containing 11 replications. For the conditions companion mortar specimens were also tested and thestudied it was found that depth of embedment and apex coefficients of variation varied between 2.8 and 10.6angle did not have a pronounced effect on repeatabil- percent, with an average value of 6.2 percent. Thus, theity. On the other hand, the maximum nominal aggre- repeatability with lightweight aggregate is similar togate size appeared to have some effect, with the 3A-in. that obtained with mortar.
(19-mm) aggregate resulting in slightly greater variabil- Experimental evidence suggests that the variability ofity than for smaller aggregates. In addition, the aggre- the pullout test is affected by the ratio of the mortargate type also appears to be important. For tests with strength to coarse aggregate strength and by the maxi-
228.1R-16 ACI COMMITTEEREPORT
mum aggregate size. As aggregate strength and mortar 3.2,6 Cast-in-place cylinder--This test method in-
strength become similar, repeatability is improved. This volves the determination of the compressive strength ofexplains why the NBS tests with lightweight aggregate cylindrical specimens cured in the special molds locatedperformed like tests with plain mortar. Bocca's results in the structure. Thus, the repeatability would be(Bocca 1984), which are summarized in Table 3.2, also expected to be similar to other compression tests onlend support to this pattern of behavior. In this case, cylinders. Few data have been published. Bloem (1968)high-strength concrete was used and the high mortar reported a within-test coefficient of variation rangingstrength approached that of the coarse aggregate. This from 2.7 to 5.2 percent with an average of 3.5 percentcondition, plus the use of small maximum aggregate for three replicate tests at ages from 1 to 91 days. Rich-size, may explain why the coefficients of variation were ards* reported values from 1.2 to 5.8 percent with anlower than typically obtained with similar pullout test average of 2.8 percent for two replicate tests at ages ofconfigurations on lower strength concrete, from 7 to 64 days.
In summary, a wide variety of test data has been ac- ASTM C 873 states that the coefficient of variationcumulated on the repeatability of the pullout tests. Dif- for three cylinders cast from the same batch has been
fering results can often be explained because of differ- determined to be 3.6 percent.ences in the materials and the testing conditions. Ingeneral, it appears that an average coefficient of varia-tion of 8 percent is typical for pullout tests conforming 3.3--Correlationwith the requirements of ASTM C 900 and with 3.3.1 General--The term "correlation" as used inembedment depths on the order of 1 in. (25 ram). The this report means establishing the relationship betweenactual value expected in any particular situation will be the quantities measured by each type of in-place test
and the corresponding compressive strength of stan-primarily affected by the nature of the coarse aggre-gate, as discussed in previous paragraphs, dard specimens. The standard specimen may be the
standard cylinder, such as used in North American3.2.4 Pulse velocity--In contrast to the previous testtechniques, which probe a relatively thin layer of the practice, or standard cubes. Very often, the in-placeconcrete in a structure, the pulse-velocity method tests are correlated with the compressive strength ofprobes the entire thickness of concrete between the cores, since core strength is the most established andtransducers. Any localized differences in the compost- accepted measure of in-place strength. The statistical
techniques for establishing the correlation relationshiption of the concrete because of inherent variability areexpected to have a negligible effect on the measured are independent of the type of "standard" specimen.travel times of the ultrasonic pulses. Thus the repeata- However, the specimen type is important when inter-bility of this method is expected to be much better than preting the results of in-place tests.the previous techniques. The common aspects of correlation are discussed in
The following coefficients of variation have been ob- this section and subsequent sections present the specifictained in various laboratory studies: procedures being used for each type of in-place test.
The preferred approach is to establish the correlationby a laboratory testing program, which is performed
Rangeof Average prior to using the in-place test method in the field. Thecoefficient coefficient testing program typically involves preparing test speci-
Reference of variation of variationmens using the same concreting materials to be used in
Keiller 0.5 to 1.5°7o 1.1070 construction. At regular intervals, measurements areCarrette and
Malhotra 0.1to0.8% 0.4°70 made using the in-place test techniques, and the com-Bocca 0.4to 1.2070 0.7°70 pressive strengths of standard specimens, such as
molded cylinders or cores, are also measured. Thepaired data are subjected to regression analysis to de-
In ASTM C 597, it is reported that for path lengths termine the best-fit estimate of the correlation relation-
from 0.3 to 6 m through sound concrete and for differ- ship.ent operators using the same instrument or one opera- For some techniques it may be possible to performtor using different instruments, the repeatibility of test the in-place test on standard specimens without dam-results is within 2 percent, aging them, and the specimens can be subsequently
3.2.5 Maturity method--In the maturity method, the tested for compressive strength. However, in most casestemperature history of the concrete is recorded and in-place tests are carried out on separate specimens, andused to compute a maturity value. Therefore, the re- it is extremely important that the in-place tests andpeatability of the maturity values is dependent on the standard tests are performed on specimens at the sameinstrumentation that is used. One would expect the re- maturity and compaction. This may be achieved bypeatability to be lower when using an electronic "ma- using curing conditions that insure similar internalturity meter" than when maturity is computed from temperature histories in all specimens. Alternatively,temperature readings on a strip-chart recorder. How- internal temperatures can be recorded and test ages canever, at present there are no published data on repeat-ability of maturity measurements using differentinstrumentation. *Personal communication from Owen Richards.
IN-PLACEDETERMINATIONOF STRENGTH 228.1R-17
be adjusted so that the in-place tests and standard tests which is the weighted average deviation of the Y-valuesare performed at the same maturity, from the straight line. The standard error is used to
The testing program should be planned so that the compute the confidence limits for the correlation rela-range of compressive strength includes the lowest and tionship, which are useful when evaluating in-placehighest values that may be encountered in the field, compressive strength from the results of the in-placeThis assures that the correlation relationship will be tests. The formulas for computing these confidenceused only for interpolation and not extrapolation. The limits are given in books on experimental data analysisuncertainty associated with the correlation relationship (Natrella 1963).is reduced with increasing number of tests, but of 3.3.2 Rebound hammer--At each test age, a set ofcourse the expense of the testing program would in- ten rebound numbers should be obtained from each of
crease. It is not easy to determine the optimum number a pair of cylinders held firmly in a compression testingof points, i.e., strength levels, to use for correlation, machine or other suitable device at a load of about 500However, it is recommended that as a minimum, six psi (3 MPa). The rebound hammer tests should be
strength levels that are approximately evenly spaced made in the direction relative to gravity in which theyshould be used. This is achieved by testing specimens will be made on the structure. The cylinders shouldfrom the same mixture at different ages. then be tested in compression. If it is not feasible to test
The number of replicate tests at each strength level the cylinders with the hammer in the same orientationshould be chosen so .that the compressive strength and as will be used to test the structure, the correction fac-
in-place test values are measured with the same degree tors supplied by the equipment manufacturer can beof certainty. Thus the ratio of the number of in-place used to account for differences in orientation. As men-
tests to the number of standard tests equals the ratio of tioned in Section 2.2, the surface produced by the ma-the squares of the corresponding within-test coeffi- terial of the cylinder molds can differ from the surfacecients of variation produced by the form material for the structure. This
factor should also be considered in the correlation test-
/_z\2 ing. If considerable difference is expected between theni
_ (,i_ (3-1) surfaces in the structure and of the cylinders, addi-ns \Vfl tional prismatic specimens should be prepared for re-
bound tests. These specimens should be formed withwhere ni = number of in-place tests the same type of forming materials that will be used in
n_ = number of standard tests construction and they should be similar in size to theVi = coefficient of variation cylinders so that they will experience similar thermal
of in-place test histories.V, = coefficient of variation For accurate estimates of in-place strength, the mois-
of standard test ture content and texture of the surfaces of the cylindersat the time of the correlation tests must be similar to
For planning purposes, it may be assumed that the those anticipated for the concrete in the structure at thecoefficient of variation of compressive strength of time of in-place testing. As a practical matter, the onlystandard cylinders is 4 percent. If compressive strength easily reproducible moisture condition for concreteis determined by testing cores, a coefficient of varia- surfaces is the saturated condition.
tion of 5 percent may be assnmed. 3.3.3 Probe penetration--To permit tests at six dif-The usual practice is to treat the average values of the ferent ages, a set of 12 standard cylinders and a test
replicate compressive strength and in-place tests at each slab large enough for 18 probe penetration tests shouldstrength level as one data pair. The data pairs are plot- be cast. For in-place testing of vertical elements, theted using the in-place test value as the X-variable and recommended procedure is to cast a wall specimen andcompressive strength as the Y-variable. Regression take cores adjacent tO the probe tests. All test speci-analysis is performed on the data pairs to obtain the mens should be cured under identical conditions of
best estimate for the correlation relationship. It is corn- moisture and temperature. At each test age, twomon to assume that the relationship is a straight line compression tests and three probe penetration testsand to use programmed handheld calculators to deter- should be made.
mine the best estimates of the slope and Y-intercept of The recommended minimum thickness for the testthe line. Ordinary linear regression analysis assumes slab is 6 in. (150 mm). (See ASTM C 803 for minimumthat there is no error in the X-variable, which is clearly spacing between test probes).not a good assumption for in-place tests. A procedure 3.3.4 Pullout--A number of techniques have beenhas been developed for modifying the formulas in or- used. Pullout inserts have been cast in the bottom ofdinary linear regression which account for the error in standard cylinders, and a pullout test was made prior tothe X-variable (Mandel 1984). the standard cylinder being tested in compression
It is common practice to compute the correlation (Bickley 1982). In this case, the pullout test is stoppedcoefficient of the regression line. This quantity indi- when the maximum load has been attained, which iscates how well the data fit the straight line. A more rel- indicated by a drop in the load with further displace-evant statistic is the "standard error of estimate," ment. The insert is not extracted and the cylinder can
228.1R.18 ACl COMMITTEEREPORT
be capped and tested in compression. Alternatively, sion tests according to ASTM method C 39. Test atcompanion cylinders have been cast with and without least three specimens at each age.inserts, and the pullout test has been performed on one At each test age, record the average maturity valuestandard cylinder and the other cylinder tested in for the instrumented specimens. On graph paper, plotcompression. Some investigators have experienced dif- the average compressive strength as a function of theficulty with both of these procedures, particularly at average maturity value. Draw a best-fit curve through
high strengths, with radial cracking at the end of the the data. The resulting curve is the strength-maturitycylinder containing the pullout insert; this is believed to relationship to be used for estimating in-place strength.result in lower ultimate pullout loads. 3.3.7 Cast-in-place cylinder--Test results should be
A third alternative has been to cast standard cylin- corrected for the height-diameter ratio using the values
ders for compression testing and to place pullout in- given in ASTM C 42. Otherwise no other correlation isserts in cubes (or slabs or beams) so that the pullout needed since the specimens are representative of thetests can be made at the same time as the standard cyl- concrete in the placement and the test is a uniaxial
inder tests but in the companion specimen, compression test.This latter approach is the preferred method, provid-
ing compaction is consistent between the standard cyl- 3.4--Samplinginders and the cubes or other specimens containing the 3.4.1 General--The number of in-place tests to be
pullout inserts, and the maturity of all specimens tested made and their location on the structure will depend onis the same. The minimum size of cube recommended the purpose of the tests. Generally, in-place testing falls
is 8 in. (200 mm) for 1 in. (25 mm) diameter inserts, into two categories:Four pullouts can be placed in each cube, one in the 1. The investigation of an older structure.middle of each vertical side. For each test age, cast and 2. Tests made at an early age of the structure to de-
test two standard cylinders and perform eight pullout termine a safe time for form removal or post-tension-tests, ing, or to control curing and reshoring.
3.3.5 Ultrasonic pulse velocity--It is preferable to It has also been demonstrated (Bickley 1984) that in-
develop the correlation relationship from concrete in place testing can be used during construction for thethe structure. Tests should be on cores obtained from acceptance of concrete, but additional time and study
the concrete being evaluated. Tests with standard cyl- is required before widespread application of in-placeinders can lead to unreliable correlations because of testing for this purpose can be realized.different moisture conditions between the cylinders and Careful planning is required to gain maximum useful
the in-place concrete, information from in-place testing. Factors such as theBecause the geometry of the test specimens has an number of tests and their location in the structure
effect on the determination of the pulse velocity, the should be carefully selected. A number of ASTM Stan-correlation data should represent conditions similar to dard Practices are available, which can be of use in
the testing configuration used in the field. A conve- planning an in-place testing program.nient manner to obtain this is to select certain areas in 3.4.2 ASTM E 105--Practice for probability sam-the structure which represent various levels of pulse ve- piing of materials--According to ASTM E 105, proba-locities. At these locations, it is recommended that five bility sampling must be used to make valid inferences
velocity determinations be made to assure a represen- about the properties of the population from the sampletative average value of the pulse velocity. For each test results. The use of random-number tables is rec-measurement, the transducers should be uncoupled ommended as a means for objectively choosing whichfrom the surface and then recoupled, to avoid system- samples shall be tested. Objective sampling is impor-atic errors due to poor coupling. Then obtain at least tant to apply probability theory to the sample statisticstwo cores from each of the same locations for corn- (average and standard deviation). For tests, such as
pressive strength testing. Pulse velocity determinations pullout, which require preplanning, a random numberfor these cores, once they have been removed from the scheme could be used to select where to place the test-structure, will usually not be the same as the determi- ing hardware prior to concrete placement.nations on the structure and would not be representa- 3.4.3 ASTM C 823--Practice for Examination and
tive of the pulse velocity of the structure. Sampling of Hardened Concrete in Constructions--3.3.6 Maturity-- The following procedure is given in ASTM C 823 provides a series of guidelines for imple-
ASTM C 1074: menting the requirements of ASTM E 105. The stan-
Prepare cylindrical concrete specimens according to dard deals primarily with the drilling of cores or theASTM C 192 using the mixture proportions for the taking of sawn samples, but there is a section dealingconcrete intended for the structure. Embed tempera- with the use of in-place testing. Two sampling situa-ture sensors at the centers of at least two specimens, tions may be encountered. In one situation, all of the
Connect the sensors to maturity instruments or to a concrete in the structure is believed to be of similarmultichannel temperature recording device, composition and quality. For this condition, random
Moist-cure the specimens in a water bath or in a sampling should be spread out over the entire structuremoist room meeting the requirements of ASTM C 511. and the results treated together. The other situation isAt ages of l, 3, 7, 14, and 28 days, perform compres- when there is information to suggest that the concrete
IN-PLACEDETERMINATIONOF STRENGTH 228.1R-19
in different portions of the structure may be of differ- cases, increasing the sample size may only result in aent composition or quality. For this situation, random minimal decrease in the allowable error, and the addi-sampling should be conducted within each portion of tional testing cost may not be justified. Fig. 3.9 (whichthe structure that is suspected of being different. Test comes from the same data as Fig. 3.8) shows how theresults from different portions of a structure should not allowable error is affected by sample size for differentbe combined unless it is shown by statistical tests (Na- coefficients of variations (the risk is again 5 percent).trella 1963) that there are no significant differences be- As the sample size increases (for a particular coeffi-tween the means and standard deviations of the results, cient of variation), the incremental reduction in error
In selecting sampling locations, it should be kept in diminishes. Clearly there is a sample size for which themind that it is well established that tests at the top of a cost of an additional test is not justified. This optimumcolumn or slab will yield lower strength than at the sample size will depend on the cost of the test and onbottom (Murphy 1984; Munday and Dhir 1984). the risk the user is willing to accept that the true aver-
3.4.4 ASTM E 122--Practice for Choice of Sample age differs from the sample average. For this reason, aSize to Estimate the Average Quality of a Lot or Pro- single sample size cannot be specified for each testcess-- The sample size to use depends on three factors: method that should be used in all situations.
1. The maximum allowable difference (or error) ac- 3.4.5 Number of in-place tests--The following typi-ceptable between the sample average and the true aver- cal values for coefficient of variation are suggested forage. guidance in selecting the number of in-place tests:
2. The variability of the test method.3. The acceptable risk that the allowable difference is Within-test
exceeded, coefficientof variation,
Fig. 3.8 shows how the sample size varies with the percent
allowable error and with the coefficient of variation of Probe penetration 5the test for a 5-percent risk. This figure can be used to Pullout 8Core 5answer the question: How many in-place tests should be Standard cylinder 4done to have the same confidence in the average as Cast in-place cylinder 4Reboundhammer 10would be obtained from testing cores? For example, if Ultrasonic pulse velocity 2three cores are tested and the coefficient of variation of
core strengths is 5 percent, this corresponds to an al- Assuming two standard cylinders are acceptable as alowable error of about 6 percent. If an in-place test is test result and using Eq. (3-1), the following numbersused with a coefficient of variation of 10 percent, then of the other tests would insure that the average in-place12 tests should be done, i.e., four times the number of test result is known with the same degree of confidencecore tests. This only assures that the average value of as the average cylinder strength:the in-place test result is within about 6 percent of the
true average. This is not equivalent to saying the in- Probe penetration 3place compressive strength can be predicted to within 6 Pullout 8percent of its true value. Core 3Cast-in-placecylinder 2
This standard stresses that economy should also be Rebound hammer 12Ultrasonicpulsevelocity 5considered when selecting the sample size. In some
Since the cost of taking additional pulse velocity read-ings at one location is minimal, the recommended
2o_ number of pulse velocity tests is not based strictly on191817 20
16 CV=20_ 1915 1814 1713 16 -
r_ 12 15 -,_ 11 _" 14 -
9 : 12-• ,,-7 <> 10-s _z 9-s 8-
3 6-
2 _ 5-1 4-
0 _ S- Ii , i r i , i i i is ; ' ; ,, ,s ,5 ,? ,s _- I
1 - I
ALLOWABLE ERROR IN AVERAGE (_) * m , I , r _ _ m , ; , i i m i :0 2 4 6 m' ' 10 12 14 16 18 2"
Fig. 3.8--Sample size as a function of allowable error SAMPLESIZEthat the true average exceeds the sample average (riskO.05). Curves are for various values of coefficient of Fig. 3.9-- Allowable error in average versus sample sizevariation for different coefficients o.[ variation (risk = 0.05)
228.1R-20 ACICOMMITTEEREPORT
Eq. (3-1). Five readings are recommended to assure that concrete is tested at an early age to determine a safea representative reading is obtained because of varia- time to remove forms, a larger number of tests may bebility in the efficiency of transducer coupling to the required than the preceding numbers would indicate.specimen. Whatever sample sizes and locations are determined to
The pulse velocity technique is not typically used in meet statistically sound requirements, there is an over-North America for early-age strength during construc- riding safety aspect that requires the application oftion. Since the test requires access to opposite faces of common sense to deciding the sample size.a member, it is impractical for estimating concrete Where tests are made at early ages, the strength ofstrength in slabs, which are often the critical elements the concrete will be more variable than at later ages.in high-rise construction. In addition, as explained in Also, extreme variations from batch to batch are moreChapter 2, various factors (Sturrup, Vecchio, and Car- critical to safety at early ages than later ages. A flooratin 1984) may influence the results, and experienced placement of 100 yd3 (60 m3) might comprise 10 truck-personnel are needed for data interpretation. In some loads of concrete. The sample size must provide assur-countries (Facaoaru 1984), the technique is used rou- ance about the strength of all batches of concrete.tinely. However, in this case, extensive background re- A model specification developed for pullout testing,search has been performed and a comprehensive series but which could be applied to all methods, states, "In-of correction coefficients have been developed to ac- stall at least 15 pullout inserts per 100 m3 pour of con-count for some of these factors, crete. For pours in excess of 100 m3, provide at least 1
As stated in Section 3.4.1, there are two principal additional insert per 20 m3. Generally at least 10 testsapplications of in-place tests: 1) evaluation of concrete will be made."in existing structures, and 2) strength evaluation at early Where common sense suggests more tests than theages during construction. The recommended values number determined by statistical theory (which as-for the number of tests are intended for the second ap- sumes a homogenous population), more tests should beplication. When these techniques are used on existing made.structures, the number of tests should be based on en-
gineering judgement, taking into consideration such 3.5--Interpretationfactors as the importance of concrete strength on the 3.5.1 General--Interpretation of in-place tests shouldoverall strength of the structure, the perceived variabil- be made by the use of standard statistical procedures.ity of concrete quality in the structure, and the inherent It is not sufficient to simply average the values of thevariability of the test method, in-place test results and then compute the equivalent
3.4.6 Field practice--Early-age strength determina- compressive strength by means of the previously estab-tion--The question of how many tests to make on a lished correlation relationship. It is necessary to
placement of concrete has to be, in part, answered by account for the uncertainties that exist. While no pro-the principles reviewed in the preceding and, in part, by cedure has yet been agreed upon for determining theengineering judgment. If the strength of a structural tenth-percentile in-place strength based on the results ofcomponent has to be determined by test, current codes in-place tests, proponents of in-place testing haverequire that a minimum of three cores be obtained from developed and are using statistically based interpreta-that component and tested. It is, of course, the deci- tions. Three approaches suggested to date, while devel-sion of the engineer to elect to have a larger number of oped for pullout testing, are applicable in principle totests made if this is judged to be prudent. If the mini- all tests. The first two methods to be described are
mum number of three cores is taken to obtain the av- relatively simple to use, requiring only tabulated statis-
erage core strength at a given location, then based on tical factors and a handheld calculator. The third pro-the values for coefficients of variations suggested in cedure is more complex, and for practical applicationsSection 3.4.5, the minimum numbers of other in-place a personal computer is needed.tests at a given location would be as follows: 3.5.2 Danish approach (Bickley 1982)--In this ap-
proach, the pullout strengths obtained from the fieldProbe penetration [ 3 tests are directly converted to equivalent compressive
Pullout ] 8 strengths by means of a relationship (correlation equa-"Cast-in-placecylinder 2Reboundnumber 12 tion) that has been determined by regression analysis of
previously generated data for the particular concreteThis number of in-place tests assures that the average being used at the construction site. The standard devia-test result is known with the same degree of certainty as tion of the converted data is then calculated. The tenth-the average core strength. However, this does not mean percentile compressive strength of the concrete isthat the compressive strength of the concrete will be obtained by subtracting the standard deviation times aknown with the same degree of certainty. As explained factor (which varies with the number of tests made andin the following section, the uncertainty of the correla- the desired level of confidence) from the mean of thetion relationship affects the reliability of the estimated converted data. The factors used in this approach arein-place compressive strength, one-sided tolerance factors (Natrella 1963), which are
In practice, the appropriate number of tests to make discussed in Section 3.5.3. The values for the factors Khas to be related to the purpose of the tests. Where for different numbers of tests are given in Column 2 of
Table 3.3 The following example illustrates the proce- In the tolerance factor approach, the lower tenth-dure. The example uses 10 test results but some other percentile strength is developed from in-place test re-appropriate number may be used in larger placements, suits, by considering quality control, number of tests n,
and the required confidence level p. Three quality con-
Example trol levels are considered: excellent, average, and poor,with the distribution function of strength assumed as
Individualequivalent normal, mixed normal-lognormal, and lognormal, re-compressivestrength spectively. Suggested values of p are 75 percent for
psi (MPa)* Calculationordinary structures, 90 percent for very important
3990 (27.5) Mean )_ = 3730 psi (25.7 MPa)3620 (25.0) Standard buildings, and 95 percent for crucial parts of nuclear3550 (24.5) deviation S, = 330 psi (2.3 MPa) power plants (Hindo and Bergstrom 1985). However,3620 (25.0) Factor K = 1.671'3260 (22.5) since safety during construction is the primary concern,3480(24.0) Tenth a single value of p may be adequate for all structures.3700 (25.5) percentile = ,,V- K S, MPa4130 (28.5) strength = 3180 psi (21.9 MPa) A value of p equal to 75 percent is widely used in prac-3620 (25.0) tice.
4350 (30.0) The tolerance factor K, along with the sample aver-*Convertedfrom pullout force measurements using correlation curve, age X, and standard deviation Sx, are used to establish'The constants K to be used in the calculation of the tenth percentile are given
in Column 2 of Table 3.3. a lower tolerance limit, which is the lower tenth per-centile of strength. For a normal distribution function(excellent quality control), the estimate of the tenth-
3.5.3 Tolerance factor approach (Hindo and Bergs- percentile strength X.t0 can be determined as followstrom 1985)--The acceptance criteria for strength of
concrete cylinders in ACI 214 are based on the assump- X.,0 = X-K Sx (3-2)(ion that the probability of obtaining a test with
strength less than f,: is less than approximately 10 per- where X,0 = lower tenth percentile ofcent. A suggested approach for evaluating in-place tests strength (10 percentof concrete at early ages is to determine the lower tenth defective)percentile of strength, with a prescribed confidence X = sample average strengthlevel. K = one-sided tolerance
It has been established that the variation of cylinder factorcompressive strength can be modeled by the normal or S,- = sample standardthe lognormal distribution function depending upon the deviation
• degree of quality control. In cases of excellent qualitycontrol, the distribution of compressive strength results The tolerance factor is determined from statisticalis better modeled by the normal distribution; in cases of characteristics of the normal probability distribution
poor control, it is better modeled by a lognormal dis- and depends upon the number of tests n, the confi-tribution (Hindo and Bergstrom 1985). dence level p, and the defect percentage. Values of K
228.1R.22 ACI COMMITTEEREPORT
may be found in reference books such as that by Na- o..trella (1963). The values in Table 3.3 are one-sided tol- o., = _ cv=_,erance factors for confidence levels of 75, 90, and 95 0.,.
CV=I Oil
percent and a defective level of 10 percent. 0.0-
For the lognormal distribution (poor quality con- _ 0._6- / cv*,_
trol), the lower tenth percentile of strength can be cal- _culated in the same manner but using the average and _. Of' _[ CV_2_ II "
standard deviation of the logarithms of strengths in Eq. _ 0.65(3-2). o.a
By dividing both sides of Eq. (3-2) by the average o.snstrength X, the following is obtained o.6-
0.46 i i i i i 1 i i i , i i
XI 0. 6 tO 14 18 22 26 30
- - 1 - K V,. (3-3) .,,,._, oFrtsrsX
where V_ = coefficient of variation (expressed as a Fig. 3.10--Ratio of tenth-percentile strength to averagedecimal), strength as a function of coefficient of variation and
In Eq. (3-3), the tenth-percentile strength is ex- number of tests (normal distribution assumed)pressed as a fraction of the average strength. Fig. 3.10
is a plot of Eq. (3-3) for p = 75 percent and for coef- the tolerance factor into Eq. (3-3), the ratio of theficients of variation of 5, 10, 15, and 20 percent. Basi- tenth-percentile strength to the average strength iscally, this figure shows that as the variability of the test found to be 0.835. Therefore, the tenth-percentile in-results increases or as fewer tests are performed, a place strength is 2690 psi (18.5 MPa). Since the tenth-smaller fraction of the average strength has to be used percentile strength is greater than 0.85 × 2900 psi (20for the tenth-percentile strength. MPa) = 2465 psi (17 MPa), post-tensioning may be
The tolerance factor approach is similar to the Dan- applied.ish approach. The results of the in-place tests are con- 3.5.4 Rigorous approach (Stone and Reeve 1986)--verted to equivalent compressive strengths using the The preceding approaches convert each in-place test re-correlation relationship, and the equivalent compres- suit to an "equivalent" compressive strength value bysive strengths are used to compute the sample average means of the correlation relationship. The average andand standard deviation, standard deviation of the equivalent compressive
The following example illustrates the application of strength are used to eompute the tenth-percentile in-the tolerance factor approach for probe-penetration place strength. Two major objections have been raisedtests. It is desired to know whether the in-place strength to these approaches (Stone, Carino, and Reeve 1986;of concrete in a slab is sufficient for the application of Stone and Reeve 1986): 1) the correlation relationshippost-tensioning. The compressive strength requirement is presumed to have no error, and 2) the variability offor post-tensioning is 2900 psi (20 MPa). The numbers the compressive strength in the structure is assumed toin the first column are the measured exposed lengths of be equal to the variability of the in-place test results.
each of eight probes, and the second column gives the The first factor will tend to make the estimates of in-corresponding compressive strengths based on the pre- place tenth-percentile strength unconservative, while theviously established correlation relationship for the con- second factor will tend to make the estimates overlycrete being evaluated, conservative.
The National Bureau of Standards (NBS) has devel-
Correlation relationship: X(psi)= 145 + 2540 L oped a comprehensive technique for the statisticalX (MPa) = - I + 0.69L analysis of in-place test results (Stone and Reeve 1986).
Compressive This rigorous method encompasses three procedures:Exposed length L, strength X,
(mm) psi(MPa) 1. Regression analysis to determine the correlation1.18 (30) 2850 (19.7) relationship.1.38(35) 3360 (23.2) 2. Estimation of the variability of the in-place com-1.34 (34) 3260 (22.5)
1.38 (35) 3360 (23.2) pressive strength.
1.50(38) 3660 (25.2) 3 Computation of the in-place tenth-percentile1.42 (36) 3460 (23.9) "
1.22 (31) 2950 (20.3) strength.1.18(30) i 2850 (19.7) The correlation relationship is obtained by a regres-
Average3220psi(22.2MPa) sion analysis procedure that accounts for the fact thatStandard deviation 300 psi ( 2.1 MPa)
Coefficientofvariation0.093 the X-variable (pullout strength) has measurement er-ror. This contrasts with routine linear regression, which
For eight tests and a confidence level of 75 percent, the is based on the assumption that there is no measure-tolerance factor is 1.74. It is assumed that the normal ment error for the X-variable. Because the within-testdistribution describes the variation of concrete strength, variabilities of cylinder strength and pullout strengthThus, by substituting the coefficient of variation and are best described in terms of constant coefficients of
IN-PLACEDETERMINATIONOF STRENGTH 228.1R-23
variation, linear regression analysis is performed using in-place compressive strength equals the variability ofthe logarithms of the test values obtained during cot- the in-place test results. In the rigorous approach, it isrelation testing. The resulting correlation relationship is assumed that the variability of compressive strength di-a power function fit to the untransformed experimental vided by the variability of the in-place test results is adata. The estimation errors associated with the regres- constant. Thus, the ratio obtained during correlationsion coefficients are computed and used later to calcu- testing is assumed to be valid for the tests conducted inlate the in-place tenth-percentile strength, the field. This provides a means for estimating the var-
In Section 3.2, it was shown that the within-test var- lability of the in-place compressive strength based on
lability of in-place test results is generally greater than the results of the in-place tests.compression-test results. This is why objections have The in-place tenth-percentile strength computed bybeen raised against assuming that the variability of the the rigorous procedure accounts for the error associ-
ated with the correlation relationship. The user can de-termine the tenth-percentile strength at any desired
K J H G F E D C B A confidence level for a particular group of field test re-[ I [ [ ] I I I 1 sults. In addition, the user can choose the percentile to
@ @ ® I @ ® ® _) be a value other than the tenth percentile.e__._ Pour *_2 The NBS researchers compared tenth-percentilei
@ ® _ L ® @ @ strengths computed by the three approaches that have
_,_p,2zzr,,-_-_,_zc,'-_d_/,r.,-____d" --2 been discussed (Stone, Carino, and Reeve 1986). It was_-zz.z_ z_r.z r.,'-Pfzl_r_,r,,z'_= (_ found that the Danish and the tolerance-factor ap---3
(_ ® _ (_) (_ @ proaches give values lower than the rigorous approach./90u r _' 1 The differences were as high as 40 percent when the in-
place tests results had high variability (coefficient of@ @ (_./ variation = 20 percent). Thus, it was concluded thatC) (_ <_ (_ I 4compared with the rigorous method, the tolerance-fac-tor and Danish approaches tend tO be more conserva-
Fig. 3./l--Sample form for identifying locations of in- tive and do not produce a consistentconfidence level.place tests in afloor slab of a multistory building Studies are needed to compare the tenth-percentile
TESTING COMPANY TESTING COMPANY LETTERHEAD
FIELD RECORD OF IN-PLACETESTING
Project No: Report Number --Client: (in sequence)
Project Number Address:
TEST TEST EQUIVALENT Project Name
NUMBER RESULT COMPRESSIVESTRENGTH Location in ATTENTION:
Structure
1 Testing of In-Place Strel_thPLACe: Project Name
2 Date AddressTime
3 Size Dear Sir:The following are the results of in-place tests of 4000 psi concrete atthe above site.4 Mix Number
5 Location in Structure: IndividualTest Results
IN-PLACE TESTING: Date Time (psi)6 DATE
TIME
7 Pour:
8 Test:CURING CONDITIONS
Proposed Time of
Maturity: C-Hours
I0 TEST RESULTS S_YTemperature at Test:
II Ambient Number of Tests Made:Within Enclosure -
12 Mean In-Place Strength (psi):Appearance of Top Surface:
13 Standard Deviation (psi):
14 Minimum In-Place Strength (psi):REMARKS:
15 Remarks:
Requirements of -- psi mean and -- psi minimumstrength prior to stripping and reshorlng are/are
CALC_TIONS not me_ by the above results
Number of Tests: -- Copy given to Site Superintendant
Equivalent Strength:Mean Date: Yours very truly,
Standard Deviacion Time:
Technician Signed
K-Value -- Checked by (for Testing Co.) SignedInstrument: Number (Testing Co, Engineer)
Fig. 3.12--Sample form for recording in-place test re- Fig. 3.13--Sample form for reporting in-place test re-suits suits
228.1R-24 ACI COMMITTEEREPORT
strength predicted by these different approaches with contractor's and structural engineer's representatives asthe value obtained from a large number of core tests, soon as the results have been checked. It provides forOnly then can the reliability of these approaches be identification of the placement involved, the individualevaluated, results, and the calculated mean and minimum
The rigorous method is best suited for implementa- strengths. It records the engineer's requirements fortion on a personal computer. For example, an interac- form removal and states whether or not these require-tive computer program has been developed* that ments have been met. It requires the contractor's rep-permits the user to develop the correlation relationship resentative's signature on the testing company's copy.for each particular construction site and then use therelationship to estimate the in-place strength (for anydesired confidence level) based on the field test results.
The program prompts the user at each step of the anal-ysis and provides guidance in interpreting the testresults. In addition, a simplified procedure has been CHAPTER 4--REFERENCESdeveloped that gives results very similar to the rigorous 4.1wRecommended references
method. The simplified method has been implemented The documents of the various standards-producingon a personal computer using commercial "spread- organizations referenced in this report are listed belowsheet" software (Carino and Stone 1987). with their serial designation, including year of adop-
3.5.5 Reporting results--For the different tests and tion or revision. The documents listed were the latest
for different purposes, a variety of report forms will be effort at the time this report was revised. Since some ofappropriate. In most cases, relevant ASTM standards these documents are revised frequently, generally inprovide guidance as to the information required on a minor detail only, the user of this report should checkreport. Where in-place testing is made at early ages, directly with the sponsoring group if it is desired to re-some particular reporting data are desirable. A set of fer to the latest revision.forms similar to those developed for use in pullout
testing is shown in Fig. 3.11 to 3.13. These may serve American Concrete Instituteas useful models for developing forms for reporting theresults of other types of in-place tests. 214-77 Recommended Practice for
Briefly, the three forms provide for the following: (Reapproved 1983) Evaluation of Strength Test1. Record of test locations (Fig. 3.11)--This form Results of Concrete
gives a plan view of a typical floor in a multistory 306R-78 Cold Weather Concretingbuilding. The location of each test is noted. Where ma- (Revised 1983)turity meters are installed, their location would also be 308-81 Standard Practice for Curingshown. Location data is considered important in the Concreteevent of low or variable results. Where tests are made 318-83 Building Code Requirements for
at very early ages and the time to complete a placement Reinforced Concreteis relatively long, there may be a significant age-strength variation from the start to the finish of the ASTM
placement. C 31-87a Standard Practice for Making2. Record of field-test results (Fig. 3.12)--This is the and Curing Concrete Test
form on wh'ich test data, the calculated results, and Specimens in the Fieldother pertinent data are recorded at the site. The form C 39-86 Standard Test Method for
has been designed for evaluating the data with the Compressive Strength ofDanish or tolerance-factor approaches (minimum Cylindrical Concrete Specimensstrength is the tenth-percentile strength). It includes C 42-84a Standard Method of Obtainingprovisions for entering information on maturity data, and Testing Drilled Cores andprotection details, and concrete appearance used to Sawed Beams of Concrete
corroborate the test data in cold weather. Due to the C 192-81 Standard Method of Makingcritical nature of formwork removal, a recommended and Curing Concrete Testprocedure is for the field technician to phone the data Specimens in the Laboratoryto a control office and obtain confirmation of the cal- C 511-85 Standard Specification for Moistculations before giving the results to the contractor. Cabinets, Moist Rooms, and
3. Report of test results (Fig. 3.13)--This is the re- Water Storage Tanks Used inport form for the in-place tests. It is a printed multico- the Testing of Hydrauliclor self-carbon form designed to be completed on site Cements and Concretesby the technician, with copies given on site to both the C 597-83 Standard Test Method for Pulse
Velocity Through ConcreteC 803-82 Standard Test Method for
C 805-85 Standard Test Method for Carino, N. J.; Woodward, K. A.; Leyendecker, E. V.; and Fattal,
Rebound Number of Hardened s.G., July 1983, "Review of the Skyline Plaza Collapse," Concrete
Concrete International: Design & Construction, V. 5, No. 7, pp. 35-42.Carrette, G. G., and Malhotra, V. M., 1984, "In Situ Tests: Vari-
C 823-83 Standard Practice for ability and Strength Prediction at Early Ages," In Situ/Nondestruc-
Examination and Sampling of rive Testing of Concrete, SP-82, American Concrete Institute, De-
Hardened Concrete in troit, pp. I11-141.
Constructions Facaoaru, loan, 1984, "Romanian Achievements in Nondestruc-
C 873-85 Standard Test Method for rive Strength Testing of Concrete," In Situ/Nondestructive Testing ofConcrete, SP-82, American Concrete Institute, Detroit, pp. 35-56.
Compressive Strength of Hellier, Alan K.; Sansalone, Mary; Carino, Nicholas J.; Stone,
Concrete Cylinders Cast in Place William C.; and lngraffea, Anthony R., Summer 1987, "Finite-Ele-
in Cylindrical Molds ment Analysis of the Pullout Test Using a Nonlinear Discrete Crack-
C 900-87 Standard Test Method for ing Approach," Cement, Concrete, and Aggregates, V. 9, No. 1, pp.
Pullout Strength of Hardened 20-29.Hindo, Kal R., and Bergstrom, Wayne R., Feb. 1985, "Statistical
Concrete Evaluation of the In-Place Compressive Strength of Concrete,"
C 1074-87 Standard Practice for Estimating Concrete International: Design & Construction, V. 7, No. 2, pp. 44-Concrete Strength by the 48.
Maturity Method Keiller, A. P., 1982, "Preliminary Investigation of Test Methods
E 105-58 Recommended Practice for for the Assessment of Strength of In Situ Concrete," Technical Re-port No. 42.551, Cement and Concrete Association, Wexham
(Reapproved 1975) Probability Sampling of Springs, 37 pp.
Materials Khoo, L. M., 1984, "Pullout Technique--An Additional Tool for
E 122-72 Recommended Practice for In Situ Concrete Strength Determination," In Situ/Nondestructive(Reapproved 1979) Choice of Sample Size to Testing of Concrete, SP-82, American Concrete Institute, Detroit, pp.
Estimate the Average Quality of 143-159.Lew, H. S., Feb. 1980, "West Virginia Cooling Tower Collapse
a Lot or Process Caused by Inadequate Concrete Strength," Civil Engineering--
ASCE, V. 50, No. 2, pp. 62-67.
Malhotra, V. M., Nov. 1971, "Maturity Concept and the Estima-
tion of Concrete Strength--A Review," Information Circular No. IC
277, Department of Energy, Mines and Resources, Ottawa, 43 pp.
These publications may be obtained from the follow- Malhotra, V. M., Jan.-Feb. 1975, "Evaluation of the Pull-Out Testto Determine Strength of ln-Situ Concrete," Materials and Struc-
ing organizations: tures, Research and Testing (RILEM, Paris), V. 8, No. 43, pp. 19-31.
American Concrete Institute Malhotra, V. M., 1976, Testing Hardened Concrete: Nondestruc-
Detroit, MI 48219-0150 Iowa State University Press, Detroit, 204 pp.Malhotra, V. M., and Carrette, G., May-June 1980, "Comparison
of Pullout Strength of Concrete with Compressive Strength of Cyl-
ASTM inders and Cores, Pulse Velocity, and Rebound Number," ACI
1916 Race St. JOURNAL, Proceedings V. 77, No. 3, pp. 161-170.
Philadelphia, PA 19103 Mandel, J., Jan. 1984, "Fitting Straight Lines When Both Vari-ables are Subject to Error," Journal of Quality Technology, V. 16,No. I, pp. 1-14.
Munday, John G. L., and Dhir, Ravindra K., 1984, "Assessment4.2--Cited references of In Situ Concrete Quality by Core Testing," In Situ/Nondestruc-
Ballarini, R.; Shah, S. P.; and Keer, L. M., 1986, "Failure Char- rive Testing of Concrete, SP-82, American Concrete Institute, De-acteristics of Short Anchor Bolts Embedded in a Brittle Material," troit, pp. 339-410.
Proceedings, Royal Society of London, A404, pp. 35-54. Murphy, William E., 1984, "Interpretation of Tests on the
Bickley, J. A., Apr. 1982, "Variability of Pullout Tests and In- Strength of Concrete in Structures," In Situ/Nondestructive TestingPlace Concrete Strength," Concrete International: Design & Con- of Concrete, SP-82, American Concrete Institute, Detroit, pp. 377-struction, V. 4, No. 4, pp. 44-51. 392.
Bickley, J. A., 1984, "Evaluation and Acceptance of Concrete Natrella, M., 1963, "Experimental Statistics," Handbook No. 9,
Quality by In-Place Testing," In Situ/Nondestructive Testing of National Bureau of Standards, U.S. Government Printing Office,Concrete, SP-82, American Concrete Institute, Detroit, pp. 95-109. Washington, D.C.
Bloem, Delmar L., Mar. 1968, "Concrete Strength in Structures," Ottosen, Niels Saabye, Apr. 1981, "Nonlinear Finite Element
ACi JOURNAL, Proceedings V. 65, No. 3, pp. 176-187. Analysis of Pullout Test," Proceedings, ASCE, V. 107, ST4, pp. 591-Bocca, P., May-June 1984, "Application of Pull-Out Test to High 603.
Strength Concrete Strength Estimation," Materials and Structures, RILEM Commission 42-CEA, Nov.-Dec. 1981, "Properties ofResearch and Testing, (RILEM, Paris), V. 17, No. 99, pp. 211-216. Concrete at Early Ages--State-of-the-Art Report," Materials and
Bungey, J. H., 1982, Testing of Concrete in Structures, Surrey Structures, Research and Testing (RILEM, Paris), V. 14, No. 84, pp.University Press, Glasgow, 207 pp. 399-450.
Carino, N. J., Winter 1984, "Maturity Method: Theory and Ap- Samarin, Alek, and Dhir, Ravindra K., 1984,"Determination of In
plication," Cement, Concrete, and Aggregates. V. 6, No. 2, pp. 61- Situ Concrete Strength: Rapidly and Confidently by Nondestructive
73. Testing," In Situ/Nondestructive Testing of Concrete, SP-82, Amer-Carino, N. J., and Stone, W. C., 1987,"Analysis of In-Place Test ican Concrete Institute, Detroit, pp. 77-94.
Data With Spreadsheet Software," Computer Use for Statistical Samarin, A., and Meynink, P., Mar. 1981, "Use of Combined UI-
Analysis of Concrete Test Data, SP-101, American Concrete Insti- trasonic and Rebound Hammer Method for Determining Strength of
Construction, V. 3, No. 3, pp. 25-29. Nondestructive Testing of Concrete, SP-82, American Concrete In-
Stone, William C._ and Carino, Nicholas J., Nov.-Dec. 1983, _titute, Detroit, pp. 201-227."Deformation and Failure in Large-Scale Pullout Tests," ACI JouR- Swamy, R. N., and AI-Hamad, A. H. M. S., June 1984, "Eval-
NAL, Proceedings V. 80, No. 6, pp. 501-513. uation of the Windsor Probe Test to Assess In Situ Concrete
Stone, William C., and Carino, Nicholas J., Jan.-Feb. 1984, Strength," Proceedings, Institution of Civil Engineers (London), V.
"Comparision of Analytical with Experimental Strain Distribution 77, Part 2, pp. 167-194.for the Pullout Test," ACI JOURNAL, Proceedings V. 81, No. 1, pp. Tanigawa, Yasuo; Baba, Kenji; and Mori, Hiroshi, 1984, "Esti-
3-12. mation of Concrete Strength by Combined Nondestructive Testing
Stone, William C.; Carino, Nicholas J.; and Reeve, Charles P., Method," In Situ/Nondestructive Testing of Concrete, SP-82,
Sept.-Oct. 1986,"Statistical Methods for In-Place Strength Predic- American Concrete Institute, Detroit, pp. 57-76.tion by the Pullout Test," ACI JOURNAL, Proceedings V. 83, No. 5, Yener, Muzaffer, and Chen, Wai-Fah, Winter 1984,"On in-Place
pp. 745-755. Strength of Concrete and Pullout Tests," Cement, Concrete, andStone, William C., and Giza, Bruce J., Feb. 1985, "Effect of Ge- Aggregates, V. 6, No. 2, pp. 90-99.
ometry and Aggregate on the Reliability of the Pullout Test," Con- Yener, M., and Vajarasathira, K., Oct. 1985, "Plastic-Fracture Fi-
crete International: Design & Construction, V. 7, No. 2, pp. 27-36. nite Element Analysis of Pullout Tests," ,°reprints, 22nd Annual
Stone, William C., and Reeve, Charles P., Summer 1986, "New Technical Meeting of the Society of Engineering Science, ESP22/Statistical Method for Prediction of Concrete Strength from In-Place 85038, Pennsylvania State University, University Park, 11 pp.
Tests," Cement, Concrete, and Aggregates, V. 8, No. 1, pp. 3-12.
Sturrup, V. R.; Vecchio, F. J.; and Caratin, H., 1984, "Pulse Ve- This report was submitted to letter ballot of the committee and was ap-Iocity as a Measui'e of Concrete Compressive Strength," In Situ/ proved in accordance with ACI balloting procedures.
Concrete and Structures Advisory Committee
Chairman LiaisonsJames J. Murphy
New York Department of Transportation (retired) Theodore R. Ferragut
Federal Highway AdministrationVice Chairman
Howard H. Newlon, Jr. Crawford F. Jencks
Virginia Transportation Research Council (retired) Transportation Research Board
Members Bryant MatherUSAE Waterways Experiment Station
Charles J. Arnold
Michigan Department of Transportation Thomas J. Pasko, Jr.
Federal Highway AdministrationDonald E, Beuerlein
Koss Construction Co. John L. Rice
Federal Aviation AdministrationBernard C. Brown
Iowa Department of Transportation Suneel Vanikar
Federal Highway AdministrationRichard D. Gaynor
National Aggregates Association�National Ready Mixed Concrete ll/19/92Association
Robert J. Girard Expert Task Group
Missouri Highway and Transportation Department Bernard C. Brown
David L. Gress Iowa Department of Transportation
University of New Hampshire Nicholas J. Carino
Gary Lee Hoffman National Institute of Standards and Technology
Pennsylvania Department of Transportation Stephen Forster
Brian B. Hope Federal Highway Administration
Queens University Richard D. Gaynor
National Aggregates Association�National Ready Mix ConcreteCarl E. Locke, Jr. AssociationUniversity of Kansas
Clellon L. Loveall David L. Gress
Tennessee Department of Transportation University of New Hampshire
David G. Manning Crawford F. Jencks
Ontario Ministry of Transportation Transportation Research Board
Robert G. Packard Celick OzyildirimPortland Cement Association Virginia Transportation Research Council
Sandor Popovics
James E. Roberts Drexel UniversiO_California Department of Transportation
John M. Scanlon, Jr. John M, Scanlon, Jr.
Wiss Janney Elstner Associates, Inc: Wiss Janney Elstner Associates, Inc.
Charles F. Scholer Richard K. Smutzer
Purdue University lndiana Department of Transportation