360
Final Report – Pre- Feasibility Study for Proposed Economic Zone at Sitakundo, Bangladesh Bangladesh Economic Zones Authority 24 February 2021 Strictly Private and Confidential

Final Report – Pre-Feasibility Study for Proposed Economic Zone at Sitakundo, Bangladesh
Bangladesh Economic Zones Authority
24 February 2021
Strictly Private and
Confidential

PricewaterhouseCoopers Private Limited, Building No. 10, 17th Floor, Tower C, DLF Cyber City, Gurgaon -122002, India. Tel: +91 124 3306000; Fax: +91 124 3306999 www.pwc.com/india
February 24, 2021
To
Project Director
Support to Capacity Building
Bangladesh Economic Zones Authority
Sub: Pre-feasibility study of 12 Economic Zones in Bangladesh- Submission of Final Report for the proposed
Economic Zone at Sitakundo.
Dear Sir,
Greetings from PricewaterhouseCoopers Private Limited.
We are glad to submit the Final Report for the proposed Economic Zone at Sitakundo. Please find enclosed
herewith the report for your kind reference.
We have captured the following details in this report-
• Executive summary on this report outlining key findings and recommendations
• Introduction to the project and location assessment of the proposed EZ with maps
• Benchmarking of the proposed EZ with respect internationally selected economic zones and similar
developments– parametric comparison of the proposed EZ against its competing developments
• Industry assessment to suggest the best fit sectors for the proposed EZ
• Demand projection to forecast the industrial space uptake and estimate utility requirements
• Transport assessment elucidating the multimodal connectivity surrounding the proposed EZ
• Environmental and Social Review
We request you to kindly acknowledge the receipt of the same.
We always assure you of our best service.
Thank you.
Yours sincerely,
Manish R Sharma
Partner
PricewaterhouseCoopers Private Limited
17th Floor, Building No 10, Tower C, DLF Cyber City
Gurgaon – 122002, India

24 February 2021
PwC 2
Disclaimer
The report has been prepared by PricewaterhouseCoopers Pvt Ltd (PwC) for Bangladesh Economic Zones
Authority (BEZA). This is pursuant to the Scope of Work under the contract document “Support to Capacity
Building of Bangladesh Economic Zones Authority Project (under Private Sector Development Support
Project)" executed between PwC and BEZA. PricewaterhouseCoopers Pvt. Ltd. (PwC) has been appointed by
BEZA to undertake pre-feasibility study for twelve selected economic zones in Bangladesh. PwC would be
undertaking the commercial aspects of the scope of work with assistance from Infrastructure Investment
Facilitation Company (IIFC) and the technical aspects have been subcontracted to Mahindra Consulting
Engineers Ltd. (MACE). Any third party should obtain prior consent of PwC before copying or reproducing, in
whole or in part, the contents of this report. PwC disclaims any responsibility for any loss or damage suffered by
any third party by taking reliance of this report. Furthermore, PwC will not be bound to discuss, explain or reply
to queries raised by any agency other than the intended recipients of this report. All information in the report is
intellectual property of BEZA.
PwC does not accept any liability or responsibility for the accuracy, reasonableness or completeness of, or for any
errors, omissions or misstatements, negligent or otherwise, and does not make any representation or warranty,
express or implied, with respect to the information contained in this document. The information contained in
this document is selective and is subject to updating, expansion, revision and amendment. It does not purport to
contain all the information that a recipient may require. Further this is not an audit report and no reliance should
be based on this report for the purposes of audit.
Our assessment and review are based on the facts and details provided to us during our discussions specific to
the Project and may not be similar across the organization / state. If any of these facts or details provided to us
are not complete or accurate, the conclusions drawn from subsequent complete or accurate facts or details could
cause us to change our opinion. The conclusions drawn and recommendations made are based on the information
available at the time of writing this report.
24 February 2021
PwC 3
Important message to any person not authorized to have access to this report
Any person who is not an addressee of this report or who has not signed and returned to
PricewaterhouseCoopers Pvt Ltd a Release Letter is not authorized to access to this report.
Should any unauthorized person obtain access to and read this report, by reading this report such person
accepts and agrees to the following terms:
1. The reader of this report understands that the work performed by PricewaterhouseCoopers Pvt Ltd. was
performed in accordance with instructions provided by our Addressee Client and was performed
exclusively for our Addressee Client’s sole benefit and use.
2. The reader of this report acknowledges that this report was prepared at the direction of our Addressee
Client and may not include all procedures deemed necessary for the purposes of the reader.
3. The reader agrees that PricewaterhouseCoopers Pvt Ltd., its Partners, Principals, Employees and Agents
neither owe nor accept any duty or responsibility to it, whether in contract or in tort (including without
limitation, negligence and breach of statutory duty), and shall not be liable in respect of any loss, damage
or expense of whatsoever nature which is caused by any use the reader may choose to make of this report,
or which is otherwise consequent upon the gaining of access to the report by the reader. Further, the
reader agrees that this report is not to be referred to or quoted, in whole or in part, in any prospectus,
registration statement, offering circular, public filing, loan, other agreement or document and not to
distribute the report without prior written consent of PricewaterhouseCoopers Pvt. Ltd. and the World
Bank.
PwC
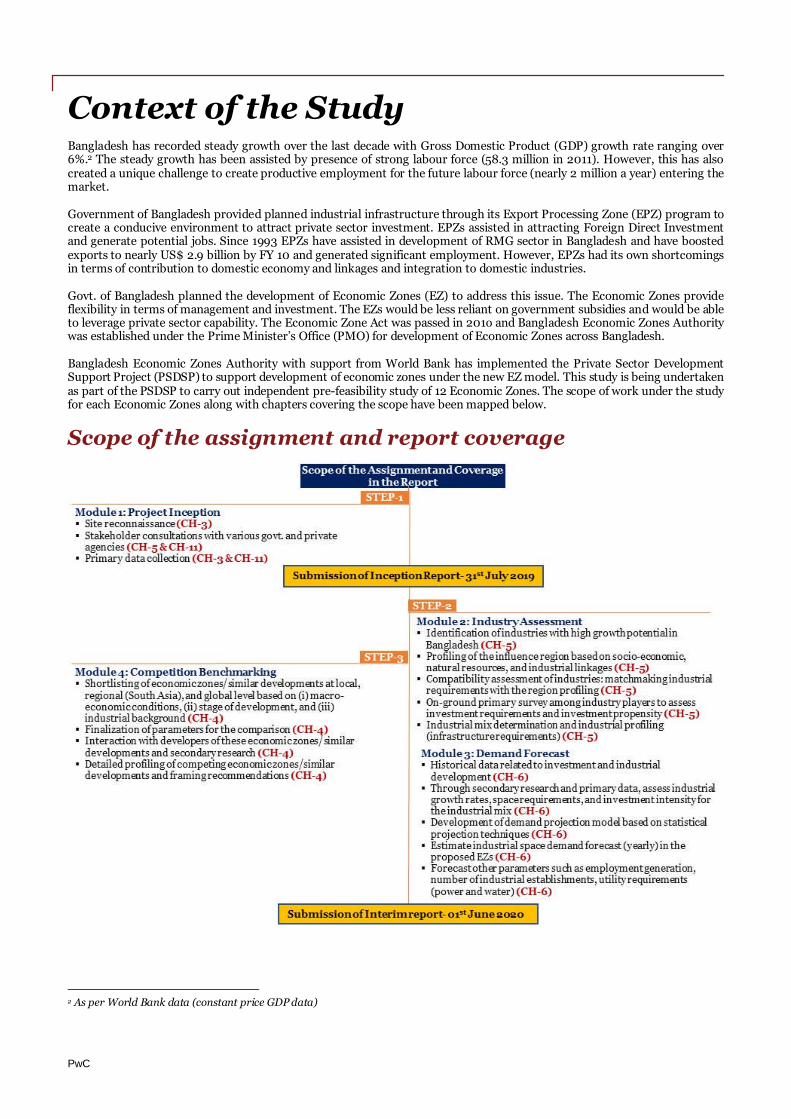
Context of the StudyBangladesh has recorded steady growth over the last decade with Gross Domestic Product (GDP) growth rate ranging over6%.2 The steady growth has been assisted by presence of strong labour force (58.3 million in 2011). However, this has alsocreated a unique challenge to create productive employment for the future labour force (nearly 2 million a year) entering themarket.
Government of Bangladesh provided planned industrial infrastructure through its Export Processing Zone (EPZ) program tocreate a conducive environment to attract private sector investment. EPZs assisted in attracting Foreign Direct Investmentand generate potential jobs. Since 1993 EPZs have assisted in development of RMG sector in Bangladesh and have boostedexports to nearly US$ 2.9 billion by FY 10 and generated significant employment. However, EPZs had its own shortcomingsin terms of contribution to domestic economy and linkages and integration to domestic industries.
Govt. of Bangladesh planned the development of Economic Zones (EZ) to address this issue. The Economic Zones provideflexibility in terms of management and investment. The EZs would be less reliant on government subsidies and would be ableto leverage private sector capability. The Economic Zone Act was passed in 201o and Bangladesh Economic Zones Authoritywas established under the Prime Minister’s Office (PMO) for development of Economic Zones across Bangladesh.
Bangladesh Economic Zones Authority with support from World Bank has implemented the Private Sector DevelopmentSupport Project (PSDSP) to support development of economic zones under the new EZ model. This study is being undertakenas part of the PSDSP to carry out independent pre-feasibility study of 12 Economic Zones. The scope of work under the studyfor each Economic Zones along with chapters covering the scope have been mapped below.
Scope of the assignment and report coverage
2 As per World Bank data (constant price GDP data)

PwC
Scope Limitations
Sitakundo Site is located within Bangabandhu Sheikh Mujib Shilpa Nagar (BSMSN). Based on discussionwith World Bank, Sitakundo would follow master plan of BSMSN prepared by Sheltech. Hence detailedmasterplanning, financial modelling and economic modelling has been excluded in this report

24 February 2021
PwC 4
List of Abbreviations Abbreviation Full Form
AC Air Conditioner
AI Artificial Intelligence
APC Automated Process Control
API Active Pharmaceutical Ingredients
BAPA Bangladesh Agro-Processors' Association
BBS Bangladesh Bureau of Statistics
BCMEA Bangladesh Ceramics Manufacturers and Exporters Association
BDI Baltic Dry Index
BDT Bangladeshi Taka
BEPZA Bangladesh Export Processing Zone Authority
BEZA Bangladesh Economic Zones Authority
BGMEA Bangladesh Garments Manufacturers and Exporters Association
BIDA Bangladesh Investment Development Authority
BSMSN Bangabandhu Sheikh Mujib Shilpa Nagar
CAGR Compound Annual Growth Rate
CETP Central Effluent Treatment Plant
CKD Completely Knocked Down
COVID Coronavirus Disease
DDT Dividend Distribution Tax
EPZ Export Processing Zones
ETP Effluent Treatment Plant
EU European Union
EXIM Export & Import
EZ Economic Zone
F&B Food and Beverages
FCL Full Container Load
FDI Foreign Direct Investment
FMCG Fast Moving Consumer Goods
FY Financial Year
G2G Government to Government
GDP Gross Domestic Product
GNI Gross National Income
GoB Government of Bangladesh
GST Goods and Services Tax
GVA Gross Value Added
GVC Gross Value Chain
HBR Harvard Business Review

24 February 2021
PwC 5
Abbreviation Full Form
HYV High Yielding Variety
IIFC Infrastructure Investment Facilitation Company
IOT Internet of Things
IT Information Technology
ITC International Trade Centre
KL Kilo Liter
Km Kilometer
KV Kilovolt
KWH Kilo-Watt Hour
LDC Least Developed Country
LLP Limited Liability Partnership
LNG Liquefied Natural Gas
LPG Liquefied Petroleum Gas
MAC Middle and Affluent Class
MACE Mahindra Consulting Engineers Limited
MLD Million Liters per Day
MMSCFD Million standard cubic feet per day
MSME Micro, Small and Medium Enterprises
MT Metric Ton
MVA Mega Volt Ampere
NSSF National Social Security Fund
OD Origin Destination
PBF Pre-Built Factory
PEZA Philippines Economic Zone Authority
PGCB Power Grid Company of Bangladesh
PHP Philippine peso
PIWTT Protocol on Inland Water Transit and Trade
PPP Public Private Partnership
PSDSP Private Sector Development Support Project
PVC Polyvinyl Chloride
PwC PricewaterhouseCoopers
QIIP Quantum Index of Industrial Production
R&D Research & Development
RHD Roads and Highways Department
RMG Readymade Garments
SASEC South Asia Sub regional Economic Cooperation
SEZ Special Economic Zone
SME Small and Medium-sized Enterprises
SMI Survey of Manufacturing Industries
SOEs State Owned Enterprise

24 February 2021
PwC 6
Abbreviation Full Form
STP Sewage Treatment Plant
ToR Terms of Reference
TV Television
TVET Technical and Vocational Education and Training
UN United Nations
UNO Upazila Nirbahi Officer
USA United States of America
USD United States Dollar
VAT Value Added Tax
WB World Bank
WTO World Trade Organization
YOY Year on Year
24 February 2021
PwC 7
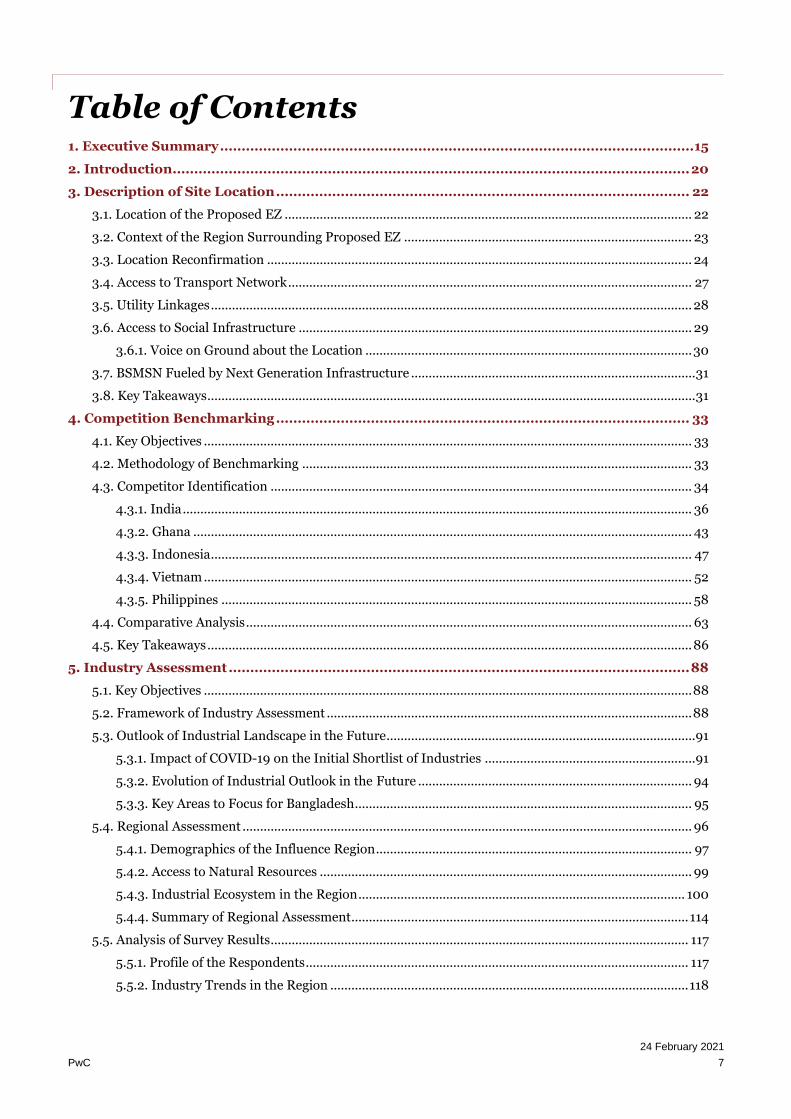
Table of Contents 1. Executive Summary .............................................................................................................. 15
2. Introduction........................................................................................................................ 20
3. Description of Site Location ................................................................................................ 22
3.1. Location of the Proposed EZ .................................................................................................................... 22
3.2. Context of the Region Surrounding Proposed EZ .................................................................................. 23
3.3. Location Reconfirmation ......................................................................................................................... 24
3.4. Access to Transport Network ................................................................................................................... 27
3.5. Utility Linkages ......................................................................................................................................... 28
3.6. Access to Social Infrastructure ................................................................................................................ 29
3.6.1. Voice on Ground about the Location ............................................................................................. 30
3.7. BSMSN Fueled by Next Generation Infrastructure ................................................................................. 31
3.8. Key Takeaways ........................................................................................................................................... 31
4. Competition Benchmarking ................................................................................................ 33
4.1. Key Objectives ........................................................................................................................................... 33
4.2. Methodology of Benchmarking ............................................................................................................... 33
4.3. Competitor Identification ........................................................................................................................ 34
4.3.1. India ................................................................................................................................................. 36
4.3.2. Ghana .............................................................................................................................................. 43
4.3.3. Indonesia ......................................................................................................................................... 47
4.3.4. Vietnam ........................................................................................................................................... 52
4.3.5. Philippines ...................................................................................................................................... 58
4.4. Comparative Analysis ............................................................................................................................... 63
4.5. Key Takeaways .......................................................................................................................................... 86
5. Industry Assessment ........................................................................................................... 88
5.1. Key Objectives ........................................................................................................................................... 88
5.2. Framework of Industry Assessment ........................................................................................................ 88
5.3. Outlook of Industrial Landscape in the Future........................................................................................ 91
5.3.1. Impact of COVID-19 on the Initial Shortlist of Industries ............................................................ 91
5.3.2. Evolution of Industrial Outlook in the Future .............................................................................. 94
5.3.3. Key Areas to Focus for Bangladesh ................................................................................................ 95
5.4. Regional Assessment ................................................................................................................................ 96
5.4.1. Demographics of the Influence Region .......................................................................................... 97
5.4.2. Access to Natural Resources .......................................................................................................... 99
5.4.3. Industrial Ecosystem in the Region ............................................................................................. 100
5.4.4. Summary of Regional Assessment................................................................................................ 114
5.5. Analysis of Survey Results ....................................................................................................................... 117
5.5.1. Profile of the Respondents ............................................................................................................. 117
5.5.2. Industry Trends in the Region ...................................................................................................... 118
24 February 2021
PwC 8
5.5.3. Barriers to Investment ................................................................................................................... 118
5.5.4. Perception about Economic Zone Regime ................................................................................... 121
5.5.5. Stakeholder Consultation – Industrial Tenants in BSMSN ....................................................... 122
5.5.6. Voice on Ground- Interventions Solicited ................................................................................... 122
5.5.7. Arriving at the Final Shortlist of Industries ................................................................................ 124
5.5.8. Final Shortlist of Site-Specific Industry Sectors .......................................................................... 125
5.5.9. Sector Profiles ............................................................................................................................... 126
5.6. Key Takeaways ........................................................................................................................................ 136
6. Demand Forecast .............................................................................................................. 138
6.1. Purpose and Objective ............................................................................................................................ 138
6.2. Methodology of Demand Forecast ........................................................................................................ 138
6.3. Demand Scenarios and Associated Assumptions ................................................................................. 139
6.3.1. Demand Scenarios ........................................................................................................................ 139
6.3.2. Key Assumptions .......................................................................................................................... 140
6.4. Demand Forecasting ............................................................................................................................... 147
6.4.1. Industrial Space Uptake ................................................................................................................ 147
6.4.2. Utility Requirements ..................................................................................................................... 151
6.4.3. Employment Generation ............................................................................................................... 153
6.5. Key Takeaways ......................................................................................................................................... 153
7. Transport Assessment ........................................................................................................ 155
7.1. Purpose and Objective ............................................................................................................................. 155
7.2. Methodology of Transport Assessment .................................................................................................. 155
7.3. Review of National Infrastructure with respect to site .......................................................................... 156
7.3.1. Road connectivity ........................................................................................................................... 157
7.3.2. Land ports ...................................................................................................................................... 161
7.3.3. Sea Ports and Inland Water Terminals ....................................................................................... 163
7.3.4. Airports........................................................................................................................................... 167
7.3.5. Railways ......................................................................................................................................... 168
8. Master Planning ................................................................................................................. 175
9. Social Review ..................................................................................................................... 176
9.1. Purpose and Objective ............................................................................................................................. 176
9.2. Methodology of Social Review ................................................................................................................ 176
9.3. Socio-Economic Environment ................................................................................................................ 176
9.3.1. Demographics & Housing .............................................................................................................. 176
9.3.2. Livelihood and Economy ............................................................................................................... 178
9.3.3. Social Infrastructure ...................................................................................................................... 179
9.4. Calculation of land cost ........................................................................................................................... 179
9.5. Requirements for SIA and RAP .............................................................................................................. 181
9.5.1. Social Impact Assessment Requirement ...................................................................................... 181
9.5.2. Requirement of RAP ...................................................................................................................... 181
24 February 2021
PwC 9
9.5.3. Land Requirements and Resettlement Issues............................................................................. 184
9.6. Overview of Social Legal and Policy Requirements.............................................................................. 185
9.7. Stakeholder Consultation ....................................................................................................................... 186
9.7.1. Introduction and Objective ........................................................................................................... 186
9.7.2. Methodology for Stakeholder’s Consultation ............................................................................... 187
9.7.3. Level of Consultation ..................................................................................................................... 187
9.7.4. Institutional Stakeholders Consultation ...................................................................................... 187
9.7.5. Focused Group Discussions (FGD) .............................................................................................. 189
9.8. Conclusion ............................................................................................................................................... 191
10. Environmental Review .....................................................................................................193
10.1. Purpose and Objective .......................................................................................................................... 193
10.2. Methodology of Environmental Review .............................................................................................. 193
10.3. Overview of Environmental Legal, Regulatory and Policy requirements for the project (GoB, WB etc.)
........................................................................................................................................................................ 194
10.4. Project Description ............................................................................................................................... 198
10.5. Baseline Scenario .................................................................................................................................. 200
10.5.1. Location and Study Area ............................................................................................................. 200
10.5.2. Topography and Seismology ...................................................................................................... 201
10.5.3. Climatological Condition ............................................................................................................ 202
10.5.4. Land use Pattern & Soil Type ..................................................................................................... 203
10.5.5. Air Environment ......................................................................................................................... 203
10.5.6. Noise Environment ..................................................................................................................... 204
10.5.7. Water Environment .................................................................................................................... 204
10.5.8. Biological Environment .............................................................................................................. 205
10.5.9. Social Environment .................................................................................................................... 210
10.5.10. Demography ............................................................................................................................... 211
10.5.11. Social Infrastructure ................................................................................................................... 211
10.5.12. Livelihood and Economy ........................................................................................................... 211
10.6. Impact assessment and proposed mitigation ..................................................................................... 212
10.6.1. Impact Identification .................................................................................................................. 214
10.6.2. Impact on Climate and Meteorology ......................................................................................... 216
10.6.3. Impact on Land and Natural Drainage ..................................................................................... 216
10.6.4. Impact due to Embankment (Super Dyke) ............................................................................... 221
10.6.5. Impacts due to Dredging ............................................................................................................ 222
10.6.6. Impact on Air Environment ....................................................................................................... 223
10.6.7. Impact on Noise Environment ................................................................................................... 225
10.6.8. Impact on Water Environment .................................................................................................. 226
10.6.9. Impact on Biodiversity ............................................................................................................... 228
10.6.10. Impacts on Occupation Health and Safety .............................................................................. 230
10.6.11. Flood and Cyclone Risk ..............................................................................................................231

24 February 2021
PwC 10
10.6.12. Sanitation and Disease Vectors .................................................................................................231
10.7. Stakeholders’ Consultations ................................................................................................................. 232
10.7.1. Methodology of Stakeholders Consultation ............................................................................... 232
10.7.2. Level of Consultations ................................................................................................................ 233
10.7.3. Institutional Stakeholders Consultation .................................................................................... 233
10.7.4. Focused Group Discussions (FGD) ............................................................................................ 235
10.8. Environmental Management Plan and Cost of EMP.......................................................................... 237
11. Annexures ........................................................................................................................ 238
11.1. Annexure 1 – Team of Experts and Project Timeframe....................................................................... 238
11.2. Annexure 2 – Site Photographs ............................................................................................................ 241
11.3. Annexure 3 – Precinct Plan of BSMSN ................................................................................................ 243
11.4. Annexure 4 – Country Level Assessment of Industrial Sectors ......................................................... 246
11.5. Annexure 5 – Import Trend of Bangladesh ......................................................................................... 249
11.6. Annexure 6 – Export Trend of Bangladesh ......................................................................................... 255
11.7. Annexure 7 – Gross Output of Manufacturing Sector in Bangladesh ................................................ 260
11.8. Annexure 8 – Industry 4.0 ................................................................................................................... 262
11.9. Annexure 9 – Global Value Chain Concept and Analysis ................................................................... 264
11.10. Annexure 10 – Sector Specific Forward and Backward Linkages .................................................... 266
11.11. Annexure 11 – Respondents’ Profile: Primary Survey ....................................................................... 277
11.12. Annexure 12 – Gross Value Added of Manufacturing Sector in Bangladesh ................................... 282
11.13. Annexure 13 – Estimation of Industrial Growth Rate ....................................................................... 284
11.14. Annexure 14 – Assumption Related to Investment Inflow ............................................................... 287
11.15. Annexure 15 – Competition Phase Out Plan ...................................................................................... 288
11.16. Annexure 16 – Demand Forecasting Calculations ............................................................................. 290
11.17. Annexure 17 - Attendees of Public Consultation ................................................................................ 302
11.18. Annexure 18 - Project Boundary shown on Mouza Map ................................................................... 303
11.19. Annexure 19 – Affected Plot detail ..................................................................................................... 304
11.20. Annexure 20- Baseline Monitoring Map ........................................................................................... 305
11.21. Annexure 21 – Information Regarding Private EZ ............................................................................ 306
11.22. Annexure 22 – Response Matrix ........................................................................................................ 307

24 February 2021
PwC 11
Table of Figures Figure 1: Location map of Sitakundo ......................................................................................................................... 18 Figure 2: Locations of the 12 Economic Zones ......................................................................................................... 20 Figure 3: Location of the Proposed EZ (for representation purposes only) ........................................................... 22 Figure 4: Urban/ industrial nodes and EXIM gateways with respect to the proposed EZ .................................... 23 Figure 5: Site boundary of the proposed EZ ............................................................................................................. 26 Figure 6: Benchmarking Methodology ...................................................................................................................... 33 Figure 7: Selection criteria for economic zones for benchmarking ......................................................................... 34 Figure 8: Geographic Spread of Comparable EZ ...................................................................................................... 34 Figure 9: GDP Trend of India .................................................................................................................................... 36 Figure 10: Inflation Trend of India ............................................................................................................................ 36 Figure 11: Dahej Special Economic Zone .................................................................................................................. 38 Figure 12: Sri City SEZ ............................................................................................................................................... 40 Figure 13: GDP Trend of Ghana ................................................................................................................................ 43 Figure 14: Inflation Trend of Ghana .......................................................................................................................... 43 Figure 15: Tema Export Processing Zone .................................................................................................................. 44 Figure 16: GDP of Indonesia ...................................................................................................................................... 47 Figure 17: Inflation Trend of Indonesia .................................................................................................................... 48 Figure 18: Bitung Industrial Special Economic Zone ............................................................................................... 49 Figure 19: GDP Trend of Vietnam ............................................................................................................................. 52 Figure 20: Inflation Trend of Vietnam ...................................................................................................................... 53 Figure 21: Quang Chau Industrial Park..................................................................................................................... 54 Figure 22: GDP Trend of Philippines ........................................................................................................................ 58 Figure 23: Inflation Trend of Philippines ................................................................................................................. 59 Figure 24: Freeport of Bataan .................................................................................................................................... 60 Figure 25: Industry assessment framework .............................................................................................................. 88 Figure 26: Initial shortlist of industries .................................................................................................................... 89 Figure 27: Master plan prepared by Sheltech for BSMSN ....................................................................................... 90 Figure 28: Gender wise Population Distribution in the District (2020 estimated) ............................................... 97 Figure 29: Gender wise and Urban-Rural Distribution for Districts in influence region (2020 estimated) ........ 98 Figure 30: Literacy rate for population in the influence region (2020 estimated) ................................................ 98 Figure 31: Distribution of industries as per their asset size (2019 estimated) ...................................................... 100 Figure 32: Sector wise share of total engaged person and total establishments in the district ............................ 101 Figure 33: Major industrial Players in Chattogram District ................................................................................... 101 Figure 34: Export, Investment and Employment Trend in Chattogram EPZ ....................................................... 103 Figure 35: Export, employment and investment trends in Karnaphuli EZ .......................................................... 103 Figure 36: Nearby districts to the proposed EZ ...................................................................................................... 104 Figure 37: Investment and land procured by different industries in BSMSN ....................................................... 105 Figure 38: Area allocated for heavy industries in BSMSN (master plan developed by Sheltech) ........................ 107 Figure 39: Raw materials requirement for production of 1000 kgs/one MT of crude steel ................................ 108 Figure 40: Profile of the Respondents...................................................................................................................... 117 Figure 41: Responses depicting growth ................................................................................................................... 118 Figure 42: Responses depicting decline ................................................................................................................... 118 Figure 43: Barriers to Investment in Bangladesh .................................................................................................... 119 Figure 44: Voice on ground (Interventions) ............................................................................................................ 123 Figure 45: Responses from Industry Players ........................................................................................................... 124 Figure 46: Industry Shortlisting ............................................................................................................................... 125 Figure 47: Overall approach for demand forecast ................................................................................................... 138 Figure 48: Revised Growth Rates of Industries due to COVID 19 pandemic ........................................................ 142 Figure 49: Transport Assessment Methodology ...................................................................................................... 155 Figure 50: Bangladesh’s major transport nodes with respect to Proposed EZ site ............................................... 156 Figure 51: Road infrastructure in the vicinity of the proposed EZ ......................................................................... 157 Figure 52: Last mile connectivity for the proposed EZ ........................................................................................... 158 Figure 53: Existing and upcoming seaports in Bangladesh .................................................................................... 163 Figure 54: IWT and Sea ports near the proposed EZ .............................................................................................. 164 Figure 55: Chittagong Port – Annual cargo Import and Export Figures ............................................................... 165 Figure 56: Year-wise cargo traffic estimation .......................................................................................................... 165 Figure 57: Average Pre-berthing delays at Chittagong port .................................................................................... 166

24 February 2021
PwC 12
Figure 58: Railway Network in the vicinity of the proposed EZ ............................................................................. 169 Figure 59: Freight per ton per km across different transit modes ......................................................................... 171 Figure 60: Location map of Sitakundo ..................................................................................................................... 175 Figure 61: The Master Plan for Bangabandhu Sheikh Mujib Shilpanagar (BSMSN) ............................................ 199 Figure 62: Sitakundo Site Location (Chattogram Division-Chattogram District-Sitakundo Upazila) ............... 200 Figure 63: Location of the proposed EZ on Google Earth ...................................................................................... 201 Figure 64: Proposed site shown on Seismic Zoning Map of Bangladesh .............................................................. 202 Figure 65: Ecologically Critical Areas of Bangladesh ............................................................................................. 206 Figure 66: Protected Areas of Bangladesh showing location of Proposed Site ..................................................... 207 Figure 67: Forest Areas of Bangladesh .................................................................................................................... 208 Figure 68: Solid Waste Facilities in BSMSN ............................................................................................................ 221 Figure 69: Delineation of Precinct J on BSMSN Masterplan ................................................................................ 230 Figure 70: Team of Experts ...................................................................................................................................... 238 Figure 71: Outline of the engagement ..................................................................................................................... 240 Figure 72: Precinct Plan of BSMSN ......................................................................................................................... 243 Figure 73: Top Export and Import basket of Bangladesh ...................................................................................... 246 Figure 74: Gross output across various sectors in Bangladesh (Estimated 2019, In BDT Billion) ..................... 247 Figure 75: Top 80% of items produced in Bangladesh in terms of gross output .................................................. 247 Figure 76: Industrial Production Index of industrial sectors in Bangladesh ........................................................ 248 Figure 77: Priority Sectors by Government of Bangladesh .................................................................................... 248 Figure 78: Concept of Industry 4.0 ......................................................................................................................... 262

24 February 2021
PwC 13
Table of Tables Table 1: Industrial space occupancy (in %) for the three scenarios (cumulative) ................................................... 17 Table 2: Industrial space occupancy (in %) for the three scenarios (cumulative) ................................................... 17 Table 3: BSMSN land use ............................................................................................................................................ 17 Table 4: Location reconfirmation for the proposed EZ ............................................................................................ 24 Table 5: Assessment of transport infrastructure .......................................................................................................27 Table 6: Assessment of utility linkages ..................................................................................................................... 28 Table 7: Prevailing social infrastructure ................................................................................................................... 30 Table 8: Type of Infrastructure Planned within BSMSN .......................................................................................... 31 Table 9: Brief Overview of Shortlisted SEZ ............................................................................................................... 35 Table 10: Macro-economic Parameter of India .........................................................................................................37 Table 11: Dahej Special Economic Zone .................................................................................................................... 38 Table 12: Sri City Special Economic Zone ................................................................................................................. 40 Table 13: Macro-economic Parameter of Ghana ...................................................................................................... 44 Table 14: Details of Tema Export Processing Zone .................................................................................................. 45 Table 15: Macro-economic Parameter of Indonesia ................................................................................................. 48 Table 16: Bitung Industrial Special Economic Zone ................................................................................................ 49 Table 17: Macro-economic Parameters of Vietnam .................................................................................................. 53 Table 18: Quang Chau Industrial Park ...................................................................................................................... 54 Table 19: Macro-economic Parameter of Philippines .............................................................................................. 59 Table 20: Freeport Area of Bataan ............................................................................................................................ 60 Table 21: Macro-Economic indicators (2019) ........................................................................................................... 63 Table 22: FDI indicators 2018 ................................................................................................................................... 63 Table 23: Heritage Foundation Score 2020 .............................................................................................................. 63 Table 24: Global Competitiveness Ranking 2019 ..................................................................................................... 64 Table 25: Global Financial Market Development Ranking (World Economic Forum 2019) ................................. 64 Table 26: World Bank Doing Business Ranking 2020 ............................................................................................. 64 Table 27: World Bank Doing Business Components 2019 ....................................................................................... 65 Table 28: Comparative Analysis ................................................................................................................................ 66 Table 29: Key Takeaways ........................................................................................................................................... 86 Table 30: Industrial sector profiling and impact assessment due to COVID-19 .................................................... 92 Table 31: How Industry 4.0 shall change the outlook of industrial sectors by 2041 .............................................. 94 Table 32: Some key Short term and Long-term focus areas for Bangladesh .......................................................... 96 Table 33: Key details about districts in the influence region ................................................................................... 97 Table 34: TVET Institutes in Chattogram district .................................................................................................... 99 Table 35: Economic Zones in Chattogram District................................................................................................. 102 Table 36: Major firms investing in BSMSN ............................................................................................................ 106 Table 37: Key Infrastructure Projects undertaken by GoB in the influence region ............................................... 110 Table 38: Few major common problems faced by businesses in the country ........................................................ 119 Table 39: Industry specific barriers as expressed by the respondents .................................................................. 120 Table 40: Voice on ground from stakeholder consultations ................................................................................... 121 Table 41: Sector Profile - Non-Metallic Minerals .................................................................................................... 126 Table 42: Sector Profile - Chemicals Industry .........................................................................................................128 Table 43: Sector Profile - Heavy Machineries .......................................................................................................... 129 Table 44: Sector Profile – Petroleum products (including bottling) ...................................................................... 132 Table 45: Sector profile - Auto & Automobile accessories ...................................................................................... 134 Table 46: Organic industrial growth rate related assumptions .............................................................................. 141 Table 47: Assumptions related to investment inflow in economic zones of Chattogram division ....................... 143 Table 48: Assumptions related to investment-land intensity ratio ........................................................................ 144 Table 49: Competing economic zones within influence division ............................................................................ 144 Table 50: Utility requirements and employment generation- benchmark figures ................................................ 146 Table 51: Industrial space occupancy (in %) for the three scenarios (cumulative) ............................................... 147 Table 52: Industrial space occupancy (in %) for the three scenarios (cumulative) ............................................... 147 Table 53: Industrial space uptake- Conservative Scenario (figures in acres) – cumulative ................................ 148 Table 54: Industrial space uptake- Conservative Scenario (figures in acres) – cumulative ................................ 148 Table 55: Industrial space uptake- Base Scenario (figures in acres) – cumulative ............................................... 149 Table 56: Industrial space uptake- Base Scenario (figures in acres) – cumulative ............................................... 149 Table 57: Industrial space uptake- Aggressive Scenario (figures in acres) – cumulative ..................................... 150
24 February 2021
PwC 14
Table 58: Industrial space uptake- Aggressive Scenario (figures in acres) – cumulative ..................................... 150 Table 59: Estimation of Industrial Establishments- cumulative ............................................................................ 151 Table 60: Estimation of Industrial Establishments- cumulative............................................................................ 151 Table 61: Power Requirements- Three Scenarios (figures in MVA) – cumulative ................................................ 151 Table 62: Power Requirements- Three Scenarios (figures in MVA) – cumulative ................................................ 152 Table 63: Water Requirements- Three Scenarios (figures in MLD) – cumulative ................................................ 152 Table 64: Water Requirements- Three Scenarios (figures in MLD) – cumulative ................................................ 152 Table 65: Direct employment generation for the three scenarios .......................................................................... 153 Table 66: Direct employment generation for the three scenarios .......................................................................... 153 Table 67: Types of goods being traded through Bibirbazar Land Port ................................................................... 161 Table 68: Export and Import through Bibirbazar land Port (in MT) ..................................................................... 161 Table 69: Types of goods being traded through Akhaura land port ....................................................................... 162 Table 70: Export and Import through Akhaura land Port (in MT) ........................................................................ 162 Table 71: Details of existing and upcoming capacities ............................................................................................ 166 Table 72: Proposed Infrastructure Interventions .................................................................................................... 173 Table 73: Population and demographics .................................................................................................................. 177 Table 74: Number and Average Population of Administrative Units in the Upazila ............................................. 177 Table 75: Employment status of the Shibaloy Upazila ............................................................................................ 178 Table 76: Employment Status: Gender Disaggregated ........................................................................................... 178 Table 77: Details of land under the project area ...................................................................................................... 179 Table 78: Mouza wise per acre land price (million BDT) ....................................................................................... 180 Table 79: Cost of Land .............................................................................................................................................. 180 Table 80: Loss of Lands (Agricultural, Homestead, Commercial & Others) .........................................................182 Table 81: Loss of Agricultural, Business, Employment & Rental Income .............................................................. 183 Table 82: Unforeseen losses .................................................................................................................................... 184 Table 83: Details of Focus Group Discussions ........................................................................................................ 189 Table 84: Applicability of Key Environmental Legislation at a Glance .................................................................. 194 Table 85: Proposed EZ Site Information ................................................................................................................ 200 Table 86: Details of land under the project area .................................................................................................... 203 Table 87: Ambient Air Quality of Project Area ....................................................................................................... 203 Table 88: Ambient Noise Quality of Project Area................................................................................................... 204 Table 89: Ground Water Quality of Project Area ................................................................................................... 204 Table 90: Surface Water Quality of Project Area .................................................................................................... 205 Table 91: Employment status of the Shibaloy Upazila ............................................................................................ 212 Table 92: Employment Status: Gender Disaggregated ........................................................................................... 212 Table 93: Classification of Social and Environmental Components....................................................................... 214 Table 94: Impact Matrix for Proposed Off-site Infrastructure .............................................................................. 214 Table 95: Waste Generation from various industries .............................................................................................. 219 Table 96: Emissions from various industries ......................................................................................................... 224 Table 97: Types of consultations ............................................................................................................................. 233 Table 98: Details of Focus Group Discussions........................................................................................................ 235 Table 99: Project timeframe .................................................................................................................................... 238 Table 100: Precinct Plan of BSMSN ........................................................................................................................ 244 Table 101: Top 75% Imports of Bangladesh (Figures in USD Million).................................................................. 249 Table 102: Top Exports 75% from Bangladesh (Figures in USD million) ............................................................. 255 Table 103: Industries with high GVC index across globe ....................................................................................... 265

24 February 2021
PwC 15
1. Executive Summary Changing global dynamics depict the growth prospect in Bangladesh and how this country has been shaping up
as an attractive investment destination. Country’s specialisation in RMG sector is a success story for which
Bangladesh has been able to effectively leverage on its demographic dividend. However, the country has been
over dependent on this sector and is not being able to diversify its export basket. Moreover, with the advent of
the global Corona virus (COVID-19) pandemic, which has adversely affected the Textiles & RMG due to its labour-
intensive nature, Bangladesh should look towards diversification now even more than ever. In a prescience move
GoB had already envisaged that organized industrialization in the country will be able to improve the country’s
competitiveness thereby attracting more investments from manufacturers globally and help in the diversification
process. In lieu of this, the emergence of the EZ model, is expected to foster organized industrialization in the
country, which in turn shall promote investment inflow and employment generation.
In tandem with this initiative, economic zone (EZ) regime ushered in, and BEZA was conceptualized. BEZA is the
nodal agency mandated for economic zone development in the country. BEZA in support with World Bank is
implementing PSDSP to upkeep pilot multi-product EZ projects under the new EZ regime.
As part of this endeavour, BEZA and the World Bank intend to undertake pre-feasibility studies of twelve
economic zone locations spread across the country. This report captures location assessment, competitive
benchmarking and demand assessment modules of the pre-feasibility assessment of economic zone location at
Sitakundo, Chattogram district.
Proposed EZ is a part of Bangabandhu Sheikh Mujib Shilpa Nagar (BSMSN) which is the flagship
project of BEZA. The BSMSN master plan has been approved by BEZA’s Executive Board and is
to be adopted by the PMO in early 2021. Sheltech was hired by BEZA to prepare the BSMSN master
plan. Due to Sitakundo’s proximity, all policies, rules, regulations and design guidelines for
BSMSN will be used as the basis for the planning, design and implementation of Sitakundo EZ.
The proposed EZ is spread over an area of approximately 2368.57 acres which falls under BSMSN, thus the
proposed EZ can leverage the offsite and onsite infrastructure planned for BSMSN. It is located in Sitakundo and
Mirsarai upazilas of Chattogram district in Chattogram division. Nearest highway connectivity to the proposed
EZ is Dhaka-Chattogram highway (N1) which is ~8 km from the proposed EZ. At present, last mile approach to
proposed EZ is via ~8 km long pitched road (~3 m wide) which connects the proposed EZ with N1. As per Draft
Report of BSMSN Master Plan IV (by Sheltech) report, the proposed EZ will have access to/from N1 via road
networks within BSMSN to support the movement of heavy cargo. N1 connects the proposed EZ with Chattogram
(~51 km), Comilla (~116) and Dhaka (~226 km). The nearest rail head is at Sitakundo which is at a distance of
around 19 km from the proposed EZ. Chattogram seaport is at distance of ~51 km from the proposed EZ. The
proposed Mirsarai port (to come up within BSMSN) is located in close proximity (~1 km) to the proposed EZ.
Chandpur river port is the nearest river port which is located at a distance of ~177 km from the proposed EZ.
There are few water channels in the vicinity of the proposed EZ (Mohuri Lake). However, due to the salinity levels
it cannot be relied a source of water. Tube wells and water reservoirs envisaged within BSMSN can act as surface
water sources for the proposed EZ. The nearest power source is 132/33 kV Baroawliya sub-station (~20 km having
capacity of 240 MVA with a surplus of ~20 MVA. Apart from this, 230/33 kV grid substation within BSMSN
having capacity of 2×120/180 is envisaged by PGCB. As per Draft Report of BSMSN Master Plan IV (by Sheltech)
report, 150 MW solar power plant is proposed in the master plan of BSMSN. Nearest gas station is Barabkundu
gas station (~5 km) in Sitakundo Upazila. Utility requirements (power, water and gas) and the possible strategies
to source the same would be assessed in the draft final report. BEZA may request relevant nodal agencies to
extend the utility connection to the proposed EZ.
Basic social infrastructure (medical, residential, and academic) are available in this region to cater to the
requirements of unskilled and semi-skilled manpower. Quality social infrastructure (medical, residential, and
academic facilities suitable for expats, executives and skilled human resources) is available in Chattogram. In
addition, proposed EZ could also leverage the world-class social infrastructure facilities envisaged within BSMSN.
24 February 2021
PwC 16
In order to incorporate the best prevalent practices in development of industrial infrastructure, it is imperative
that the proposed zone is evaluated against similar developments in comparable neighbouring and global
economies. In this regard, the competitive benchmarking exercise is taken into cognizance so that the developer
becomes oblivious with the drivers of an EZ and assess the proposed zone vis a vis similar development taking
place globally. The benchmarking exercise assesses various parameters such as commercial terms, infrastructure
availability, labour cost, distance from trade gateways, etc. for similar developments across the globe. Once
completed, this analysis not only provides the relative competitiveness of the proposed economic zone vis a vis
the other zones but also synthesises the key learnings from each of these zones. Since, this report captures only
the location analysis, and the industry and demand assessment of the proposed economic zone apart from
competition benchmarking, certain sections in the comparative analysis section are kept to be updated as we
further proceed to the relevant modules (like master planning, infrastructure assessment, and financial
modelling) on course during the pre-feasibility study.
In line with the identified features of the proposed EZ and its competitiveness, a framework of industry
assessment has been formulated. The industry assessment framework is based on a stepwise approach to finalise
the industrial sectors which are best fit for the proposed EZ. In summary, it emphasizes on the trade potential of
each sector, their participation in the Global Value Chain and the priority sectors of the GoB to highlight an initial
set of industrial sectors best suited for development in the country. As per the Sheltech report, the proposed EZ
lies in the heavy industry zone depicted in the BSMSN master plan, and hence only heavy industries are
considered for the further industry assessment. The impact of COVID-19 pandemic on these sectors has also been
assessed to understand its underlining effect on the demand side. Our assessment depicted that Chemicals would
be amongst the most adversely affected sectors due to ongoing lockdown protocols.
Through amalgamation of the national industrial landscape with the regional landscape and site intrinsic features
along with the reference from Sheltech prepared master plan for BSMSN, suitability of various industrial sectors
to the proposed EZ has been assessed with additional validation of this desk-based study through primary
survey’s amongst domestic and foreign investors. Basis this hypothesis, the following industrial sectors emerged
out as the potential industrial mix for the proposed EZ:
Shortlisted industries:
• Chemicals
• Heavy Machinery, Iron & Steel and Metals
• Non-Metallic Minerals
• Automobiles and Accessories
• Petroleum products (Including bottling)
Desk based study in synthesis with primary survey indicates that the economy of Chattogram district is
predominantly dependent on non-farm activities such as manufacturing sector. Being located in close proximity
to the Chittagong port and within the heavy industrial area of BSMSN, the proposed EZ is slated to host heavy
industries. Apart from these, BSMSN is also envisaged to host light and medium industrial sectors in designated
area within itself which could act as feeder or support industries to these heavy sectors. Voice on ground also
captured that the investors are require certain pre-requisites in order to relocate to the proposed economic zone
in terms of availability of cheap source of labor, proximity to the source of raw materials, access to CETP/STP,
uninterrupted power supply for continual industrial production, warehousing facilities, subsidized land tariffs
etc. among others. They also pointed out certain challenges such as high duty on customs, complicated clearance
processes, shortage of power, high utility tariffs, social security as some of the issues acting as hindrances to
investment.
Based on the above-mentioned industrial mix, land demand forecasting in light of statistical projection
techniques have been undertaken. Three scenarios have been considered viz. aggressive, base, and
conservative. Assumptions related to industrial growth rates and investment inflow to the proposed EZ have been
varied as per the three scenarios. It has been assumed that in aggressive (conservative) case, higher (lower)
infrastructure induced growth rate and higher (lower) investment inflow taking place to the proposed EZ. Base

24 February 2021
PwC 17
case considers the current scenario backed up by evidences and present trends. Similarly, the industrial growth
rates assumed have been varied in order to factor in the impact of COVID-19 on their future growth.
Demand projection outlines that in the post-COVID scenario, complete industrial space uptake would take
place in 17 years in conservative case. For base and aggressive cases, the same would be spread over 16 years and
15 years respectively. Corresponding to this land demand, the ultimate power and water demand for the proposed
economic zone is 207.30 MVA and 71.20 MLD respectively (for Base case). The project would generate direct
employment of approximately 573,800. (for Base case).
The cumulative land uptake for the proposed EZ across the three cases – Conservative, Base and Aggressive are
as follows –
Table 1: Industrial space occupancy (in %) for the three scenarios (cumulative)
Scenarios 2025 2026 2027 2028 2029 2030 2031 2032
Conservative 3% 6% 9% 13% 16% 20% 25% 29%
Base 3% 7% 10% 14% 18% 22% 27% 32%
Aggressive 3% 7% 11% 15% 19% 24% 29% 35%
Source: Statistical projection technique; Demand Forecasting
Table 2: Industrial space occupancy (in %) for the three scenarios (cumulative)
Scenarios 2033 2034 2035 2036 2037 2038 2039 2040 2041 to
2044
Conservative 35% 42% 50% 57% 64% 73% 84% 94% 100%
Base 38% 45% 54% 62% 71% 80% 92% 100% 100%
Aggressive 42% 50% 59% 68% 77% 87% 100% 100% 100%
Source: Statistical projection technique; Demand Forecasting
The area for the proposed EZ falls under the precinct I of the BSMSN for which master plan has been approved
by BEZA’s Executive board. The BSMSN Master Plan sets out: i) land uses, ii) access and transport networks, iii)
precinct boundaries and characteristics, iv) zoning and permitted uses, v) development guidelines, and iv)
environmental and green resilient rules to follow when implementing the zone
As per the master plan BSMSN site has been divided into 12 separate precincts, which have their own land uses.
The precincts, (their land use and size) for BSMSN are identified below.
Table 3: BSMSN land use
Precinct Land Use Designation Size in Acres
A Residential and Support Amenities 4,606.57
B City Center/Business Hub 1,682.91
C Health and Education Center 837.35
D Mixed Use/Residential 1,778.59
E Administrative/Institutional Center 880.68
F Light/Medium Industrial Area 10,043.12
G Port and Logistics Hub 1,802.29
H Forest/Transitional Area 1,778.75
I Heavy Industrial Area 3,956.35
J Open Space 6,030.42
K Leisure/Entertainment Area 350.89
24 February 2021
PwC 18
Precinct Land Use Designation Size in Acres
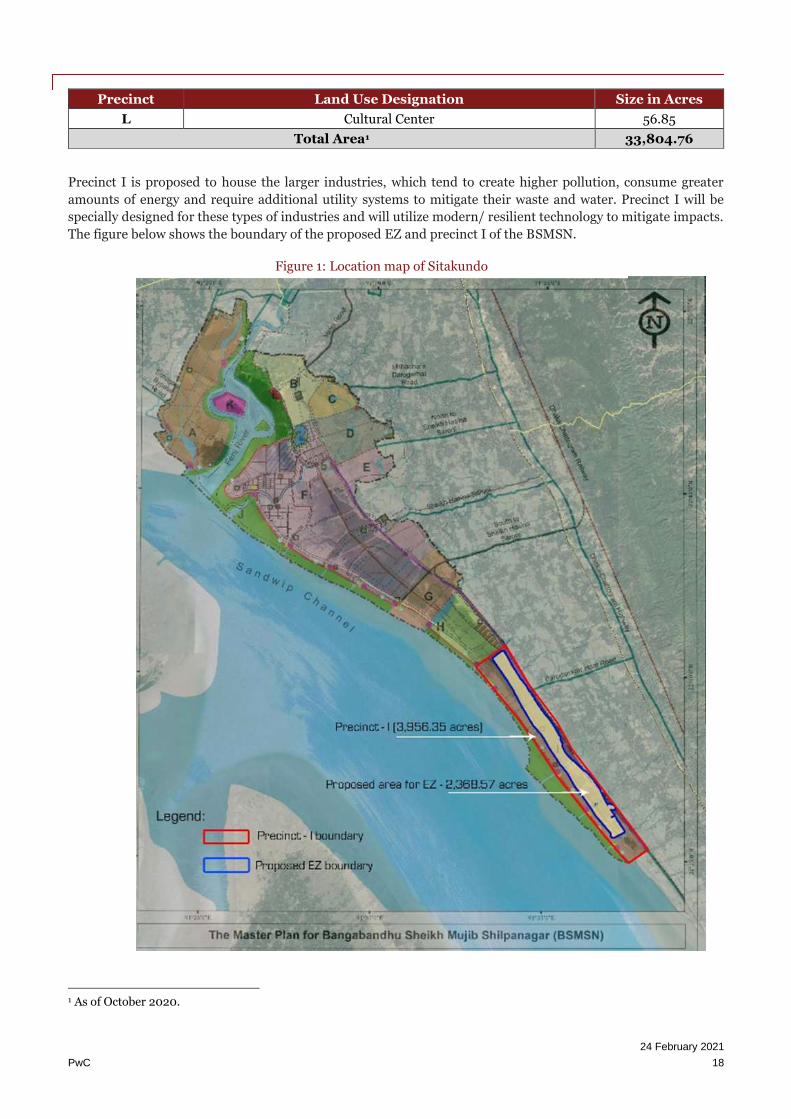
L Cultural Center 56.85
Total Area1 33,804.76
Precinct I is proposed to house the larger industries, which tend to create higher pollution, consume greater
amounts of energy and require additional utility systems to mitigate their waste and water. Precinct I will be
specially designed for these types of industries and will utilize modern/ resilient technology to mitigate impacts.
The figure below shows the boundary of the proposed EZ and precinct I of the BSMSN.
1 As of October 2020.
Figure 1: Location map of Sitakundo
24 February 2021
PwC 19
As per the master plan Precinct I will have access to/from the Chattogram Highway via public, arterial road
networks within BSMSN, which are 80-100m in width to support large trucks and heavy cargo loads and
movements. Master plan for the proposed EZ must use the same design rules, regulations and
standards as BSMSN.
The proposed EZ is part of the precinct I of the BSMSN, which is planned to house the large-scale
industries. As per market assessment it is anticipated that by FY’ 25, demand for industrial land
will outreach the level to support the development 0f EZ. However, proposed site at Sitakundo
can be developed only after completion of embankment. The development of the proposed EZ
should be aligned with master plan of BSMSN.
Considering the demand in the region, BEZA should place the proposed EZ at Sitakundo under
high priority2, to cater the land demand for large scale industries.
2 Basis the demand assessment site which can commence operation by Fy’25 are defined as high priority site for BEZA.
24 February 2021
PwC 20
2. Introduction Bangladesh has been depicting sound growth with Gross Domestic Product (GDP) growth rate ranging over 6%
in the last decade.3 The country is taking rapid strides towards shaping up as a “developed economy” by 2041.
Manufacturing sector outlook of Bangladesh is “factor driven” at present and the country specializes in
production of basic products which are traditional and manpower oriented. The country aims to become
efficiency driven economy in the future by focusing on efficient process and technology enablement to produce
specialized products and to obviate the import dependency. Recent COVID-19 outbreak would have significant
influence on this growth trajectory and in turn would cause slow-down in the short term.
So far, the growth trajectory of the country has been highly dependent on Ready Made Garments (RMG) and the
export basket is not diversified. Govt. of Bangladesh (GoB) has realized that in order to shape up as developed
economy, it is highly crucial to promote organized industrialization through diversification of manufacturing
output. Economic Zone (EZ) development in the country is poised to promote inclusion of local supply chain,
broadening the product portfolio, and increase export basket. This in turn shall enable a deeper rooted and
inclusive growth for the economy in general.
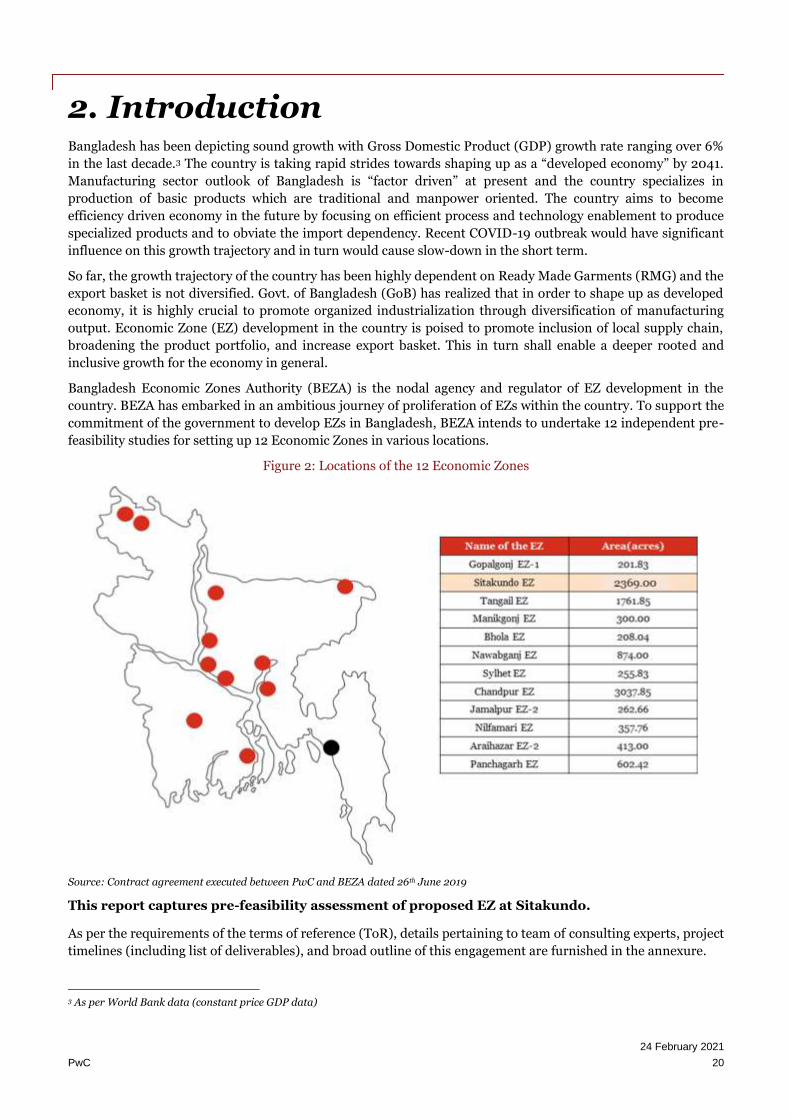
Bangladesh Economic Zones Authority (BEZA) is the nodal agency and regulator of EZ development in the
country. BEZA has embarked in an ambitious journey of proliferation of EZs within the country. To support the
commitment of the government to develop EZs in Bangladesh, BEZA intends to undertake 12 independent pre-
feasibility studies for setting up 12 Economic Zones in various locations.
Figure 2: Locations of the 12 Economic Zones
Source: Contract agreement executed between PwC and BEZA dated 26th June 2019
This report captures pre-feasibility assessment of proposed EZ at Sitakundo.
As per the requirements of the terms of reference (ToR), details pertaining to team of consulting experts, project
timelines (including list of deliverables), and broad outline of this engagement are furnished in the annexure.
3 As per World Bank data (constant price GDP data)

24 February 2021
PwC 21
This report takes the reference of the Draft Report of BSMSN Master Plan IV prepared by the
consulting firm Sheltech4. Sheltech was hired by BEZA for the development of masterplan for the
Bangabandhu Sheikh Mujib Shilpa Nagar (BSMSN) at Mirsarai in co-ordination with the World
Bank. The master plan submitted by Sheltech is approved by the BEZA as well as the World Bank,
and its approval is under process from the Prime Minister’s Office of Government of Bangladesh.
Hence the Sheltech’s Draft Report of BSMSN Master Plan IV report is taken as a reference while
making this report.
4 Shared by World Bank on 30th June 2020 over mail

24 February 2021
PwC 22
3. Description of Site Location Taking cues from similar EZs across the globe and basis opinions of various manufacturing sector players, it is
imperative that a strategic EZ location should possess the following attributes-
• Good access to transport network to ensure smooth movement of input and finished goods
• Access to utilities (like Power, Water, and Natural Gas) to ensure continuous production activity
• Proximity to urban hubs ascertaining prevalence of social infrastructure
This chapter aims at assessing the key features of the proposed EZ to evaluate its adequacy to shape up as a
prospective EZ location based on the above-mentioned aspects. This analysis is based on the information
obtained through initial site reconnaissance and stakeholder consultation with various government departments.
3.1. Location of the Proposed EZ
Proposed EZ is located in Sitakundo and Mirsarai Upazilas of Chattogram district in Chattogram division.
Regional landscape of Chattogram district indicates dependency on non-farm activities. The industrial eco-
system of the district is characterized by the dominance of the manufacturing sector (such as
shipbuilding/shipbreaking, iron & steel, textile and RMG, cement, food processing, steel, light engineering,
furniture etc.).
A part of the proposed EZ (1,273.58 acres) falls within the precinct plan of Bangabandhu Sheikh Mujib Shilpa
Nagar (BSMSN) which is the flagship project of BEZA. The remaining portion i.e. 933.26 acres (out of total
alienated area of 2,369 acres) is outside the BSMSN and located in the Sitakundo Upazila.
The BSMSN comprises of three EZs- Mirsarai and Sitakundo in Chattogram district and Sonagazi in Feni district.5
It is the biggest industrial city in the country and is currently developed by BEZA on ~30,000 acres of land spread
across Mirsarai and Sitakundo upazila in Chattogram district and Sonagazi upazila in Feni district. It is developed
with a target of creating employment opportunities for 15 lakh people within the next 15 years and generating
exports worth $15 billion.
Figure 3: Location of the Proposed EZ (for representation purposes only)
Source: Google Map and Draft Report of BSMSN Master Plan IV prepared by Sheltech (Shared by World Bank on 30th June 2020)
5 https://thefinancialexpress.com.bd/economy/bangladesh/bangabandhu-shilpa-nagar-many-plots-ready-to-host-industrial-units-1580623822
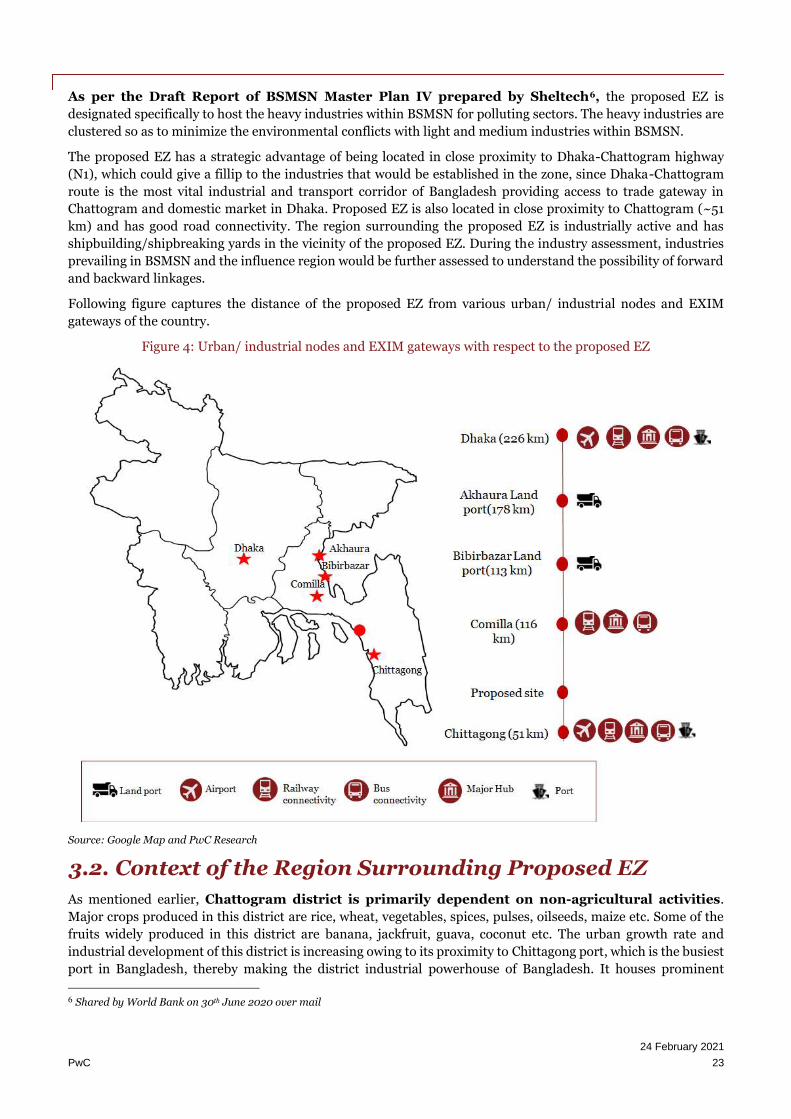
24 February 2021
PwC 23
As per the Draft Report of BSMSN Master Plan IV prepared by Sheltech6, the proposed EZ is
designated specifically to host the heavy industries within BSMSN for polluting sectors. The heavy industries are
clustered so as to minimize the environmental conflicts with light and medium industries within BSMSN.
The proposed EZ has a strategic advantage of being located in close proximity to Dhaka-Chattogram highway
(N1), which could give a fillip to the industries that would be established in the zone, since Dhaka-Chattogram
route is the most vital industrial and transport corridor of Bangladesh providing access to trade gateway in
Chattogram and domestic market in Dhaka. Proposed EZ is also located in close proximity to Chattogram (~51
km) and has good road connectivity. The region surrounding the proposed EZ is industrially active and has
shipbuilding/shipbreaking yards in the vicinity of the proposed EZ. During the industry assessment, industries
prevailing in BSMSN and the influence region would be further assessed to understand the possibility of forward
and backward linkages.
Following figure captures the distance of the proposed EZ from various urban/ industrial nodes and EXIM
gateways of the country.
Figure 4: Urban/ industrial nodes and EXIM gateways with respect to the proposed EZ
Source: Google Map and PwC Research
3.2. Context of the Region Surrounding Proposed EZ
As mentioned earlier, Chattogram district is primarily dependent on non-agricultural activities.
Major crops produced in this district are rice, wheat, vegetables, spices, pulses, oilseeds, maize etc. Some of the
fruits widely produced in this district are banana, jackfruit, guava, coconut etc. The urban growth rate and
industrial development of this district is increasing owing to its proximity to Chittagong port, which is the busiest
port in Bangladesh, thereby making the district industrial powerhouse of Bangladesh. It houses prominent
6 Shared by World Bank on 30th June 2020 over mail

24 February 2021
PwC 24
industries within the sectors of textile, RMG, steel manufacturing, light engineering, power, etc. The first Export
Processing Zone (EPZ) of Bangladesh, established in 1983 is located in Chattogram. Many international
companies have their offices in Chattogram.
The major industries in this region are Heavy industries (Petroleum, Shipbuilding/Shipbreaking etc.), Cement,
Oil refineries, Leather industries, Chemicals, Textile and Garments and other small-scale industries such as jute
mills, rice mills, oil mills etc. Sitakundo upazila also houses the country's first eco-park, as well as alternative
energy projects related to wind and geothermal power.
As mentioned earlier, a part of the proposed EZ falls within the precinct plan of Bangabandhu Sheikh Mujib
Shilpa Nagar (BSMSN). BSMSN is expected to house industries related to Garments, Agro-processing, Integrated
textiles, Leather and Leather products, Automobiles, Shipbuilding, Food and Beverages, Paper and Products etc
across 10,092.72 acres of Light and Medium industrial land and 3,956.35 acres of Heavy industrial land7. The
area of the proposed EZ has been designated to host heavy industries (as per the Draft Report of BSMSN Master
Plan IV prepared by Sheltech8) out of which ~1273 acres falls under BSMSN. The precinct plan of BSMSN as per
Draft Report of BSMSN Master Plan IV prepared by Sheltech is presented in the annexures.
Details of the regional profiling including assessment of the local sourcing of input materials (thus the possibility
of forward and backward linkages) have been captured in the industry assessment chapter.
3.3. Location Reconfirmation
Post site visit, based on primary data collected, location and demarcation details of the proposed EZ have been
reconfirmed.
Table 4: Location reconfirmation for the proposed EZ
Parameters Details
Site co-ordinates 22°68'16.18"N
91°56'19.66"E
Site boundaries on East BWDB embankment road, Settlements, agriculture land and mass
development
Site boundaries on West Bay of Bengal
Site boundaries on North Forest Plantation
Site boundaries on South Forest Plantation
Total area of the site 2368.57 acres
Privately owned land 18.77 acres
Government Land/ Khas land 2349.8 acres
Current land use pattern Water channels, Embankment road, agricultural land (single cropping)
and settlements
Resettlement within the site There are settlements within the proposed EZ area; Suitable mitigation
strategy for resettlement and rehabilitation is proposed in the social
review section of this report.
Nearest administrative node/ town Sitakundo
7 As per the Distribution of area for the Precinct Plan of BSMSN (BSMSN Master Plan IV) 8 Shared by World Bank on 30th June 2020 over mail
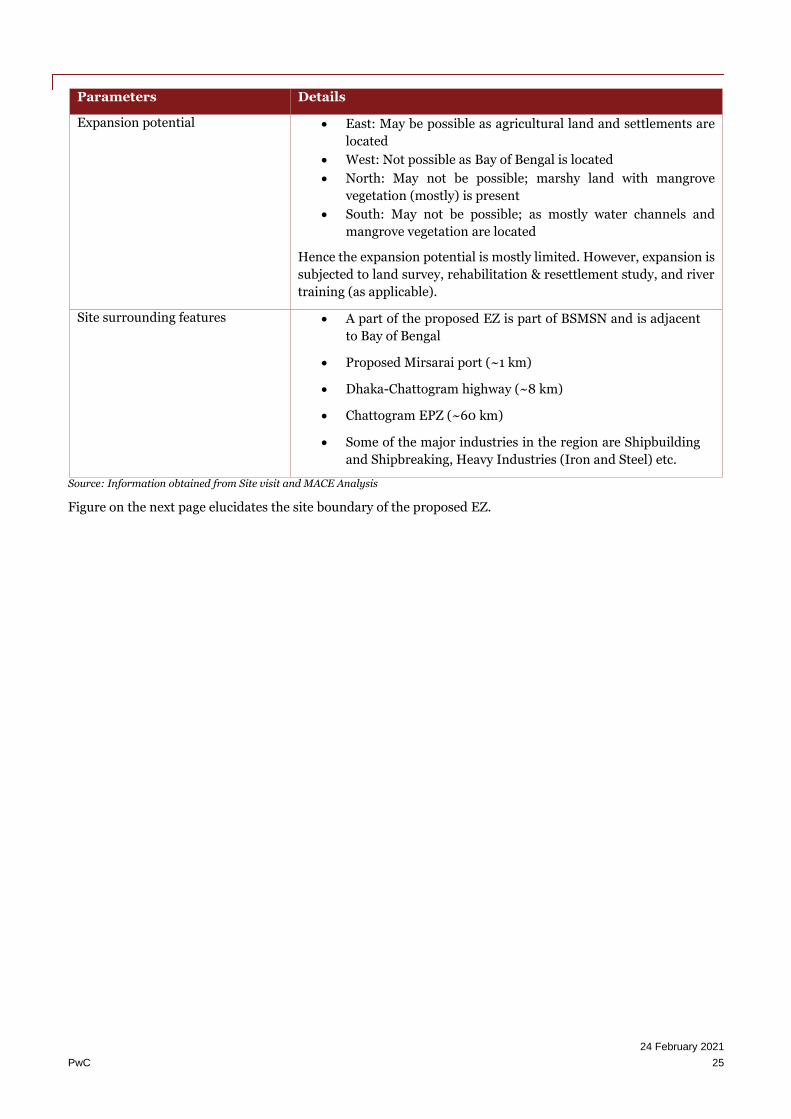
24 February 2021
PwC 25
Parameters Details
Expansion potential • East: May be possible as agricultural land and settlements are
located
• West: Not possible as Bay of Bengal is located
• North: May not be possible; marshy land with mangrove
vegetation (mostly) is present
• South: May not be possible; as mostly water channels and
mangrove vegetation are located
Hence the expansion potential is mostly limited. However, expansion is
subjected to land survey, rehabilitation & resettlement study, and river
training (as applicable).
Site surrounding features • A part of the proposed EZ is part of BSMSN and is adjacent
to Bay of Bengal
• Proposed Mirsarai port (~1 km)
• Dhaka-Chattogram highway (~8 km)
• Chattogram EPZ (~60 km)
• Some of the major industries in the region are Shipbuilding
and Shipbreaking, Heavy Industries (Iron and Steel) etc.
Source: Information obtained from Site visit and MACE Analysis
Figure on the next page elucidates the site boundary of the proposed EZ.

24 February 2021
PwC 26
Figure 5: Site boundary of the proposed EZ
Source: Information obtained from Site visit and MACE Analysis

24 February 2021
PwC 27
3.4. Access to Transport Network
For any location to shape up as a potential EZ, access to multimodal connectivity is an important feature. In this
report, a holistic review of the transport network has been undertaken; details of the same are captured in the
transport assessment chapter of this report. Following table captures the details of existing transport network
and the proposed improvements as per the Draft Report of BSMSN Master Plan IV prepared by Sheltech 9with
respect to the proposed EZ.
Table 5: Assessment of transport infrastructure
Highway
connectivity
• Nearest highway connectivity is Dhaka-Chattogram highway (N1) which
is ~8 km from the proposed EZ.
• N1 connects the proposed EZ with Chattogram (~51 km), Comilla
(~116) and Dhaka (~226 km).
Last mile
connectivity
with nearest
highway
• Currently, there is ~8 km long pitched road (~3 m wide) which provides
the last mile approach connecting the proposed EZ with N1.
• Adequacy of this approach road to cater to the increased traffic movement
and the possibility of widening (once this EZ is operational) are evaluated
in the transport assessment section.
• The proposed EZ can also be accessed via last mile approach road (~12
km single lane road) for BSMSN which is currently being developed by
RHD and BEZA to connect it with N1.
• As per Draft Report of BSMSN Master Plan IV (by Sheltech) report, the
proposed EZ will have access to/from Dhaka-Chattogram highway via
road networks within BSMSN which are 80-100m in width to support
the movement of large trucks and heavy cargo.
• As per discussions with BSMSN officials, it was understood that currently
the road stretch is being developed into a 2-lane road. There is provision
to expand this stretch into four-lane roads based on the traffic
requirements at a later stage.
Rail
connectivity
• Sitakundo railway station (approx. 19 km) is the nearest rail station to the
proposed EZ. It can be accessed via N1 and Sitakundo bazar road. This
station is a small station with no cargo handling facility.
• Mirsarai railway station (approx. 22 km) is another rail station which
can be accessed via N1. Currently, GoB has plans to upgrade the station
in order to improve the security and cargo handling facilities.
• Chattogram railway station (approx. 51 km) is the nearest junction station
(with cargo handling facility) to the proposed EZ. It can be accessed via
N1. This station is connected to all the major nodes of the country.
• The Bangladesh Railways has started primary assessment for railway
connection to BSMSN which is being developed by BEZA. This railway
linkage would be key in shipment of cargo between the Mirsarai region
and Chittagong port.10
9 Shared by World Bank on 30th June 2020 over mail 10 http://www.beza.gov.bd/news/investment-promotion-seminar-titled-attracting-investment-in-economic-zones-of-bangladesh-held-at-radisson-blu-dhaka/

24 February 2021
PwC 28
Air
connectivity
• Shah Amanat International Airport (~51 km) in Chattogram is the nearest
airport to the proposed EZ. This airport can be accessed via N1 and Port
link road.
Sea Port and
IWT
connectivity
• Nearest river port is Chandpur river port (~177 km) and is accessible
from road via N1 followed by Comilla-Chandpur Highway (R140).
• Chandpur port is a port of call for the Protocol on Inland Water Transit
and Trade (PIWTT) between India and Bangladesh which facilitates
movement of passenger and cargo between the two countries.
• Chattogram Sea port (~51 km) is the nearest seaport which can be
accessed via N1 and Port link road.
• The proposed Bay container terminal is located ~64 km from the
proposed EZ and can be accessed via N1 and Port link road.
• Chittagong port Authority has envisaged to develop a new port in
Mirsarai (~1 km) to enable direct sea connectivity to the industrial city.
As per studies conducted in this respect, there is approx. 8.5 m of draft
available in this part of the sea channel. Currently, this project is in
conceptualization and planning stage
Land Port
Connectivity
• Bibirbazar land port (approx. 113 km) is the closest land port which can
be accessed through N1 and further through Comilla-Chattogram bypass
road.
• Akhaura land port (approx. 178 km) is another land port which can
accessed via N1 and Comilla-Sylhet highway (N102).
Source: Data collected during site visit and secondary research
3.5. Utility Linkages
Availability of utilities is most critical to support day to day operations of any industry. Different industries have
varying requirement of utilities depending on their raw material and final products. Basic utilities that are
required by any industry can be captured in three baskets i.e. power, water, and gas. It is important for industries
to have uninterrupted access to utility sources to facilitate manufacturing. Following table captures the details of
existing utility linkages and the proposed improvements as per the Draft Report of BSMSN Master Plan IV
prepared by Sheltech with respect to the proposed EZ.
Table 6: Assessment of utility linkages
Power
availability
• During preliminary site reconnaissance, it was observed that the
nearest power source is 132/33 kV Baroawliya sub-station (~20 km).
This sub-station has a total capacity of 240 MVA with a surplus of ~20
MVA. This can be relied as a source of power supply to meet the power
requirements of the initial construction activities (approx. 4 MVA) for
proposed EZ.
• Apart from this, PGCB has established a 230/33 kV GIS grid substation
within BSMSN in Zone 25 having capacity of 2×120/180 MVA.
• As per Draft Report of BSMSN Master Plan IV (by Sheltech) report, 150
MW solar power plant is proposed in the master plan of BSMSN.
• Total power demand during operation stage is around 208 MVA.
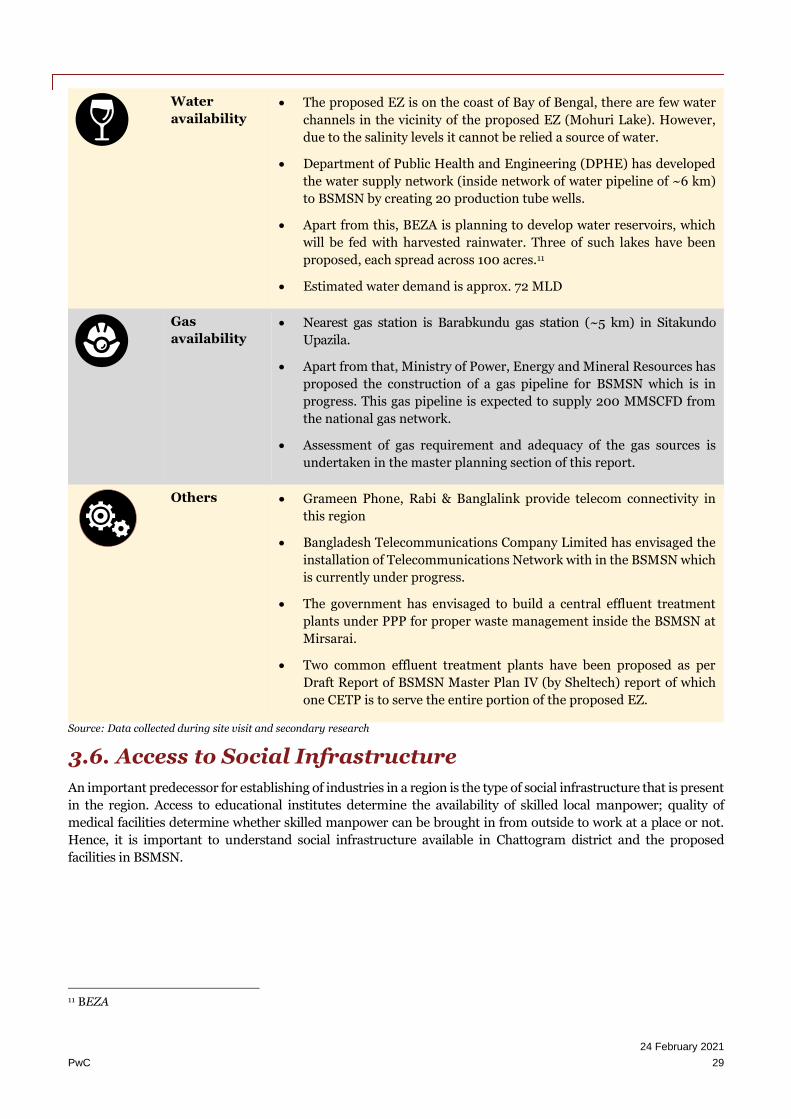
24 February 2021
PwC 29
Water
availability
• The proposed EZ is on the coast of Bay of Bengal, there are few water
channels in the vicinity of the proposed EZ (Mohuri Lake). However,
due to the salinity levels it cannot be relied a source of water.
• Department of Public Health and Engineering (DPHE) has developed
the water supply network (inside network of water pipeline of ~6 km)
to BSMSN by creating 20 production tube wells.
• Apart from this, BEZA is planning to develop water reservoirs, which
will be fed with harvested rainwater. Three of such lakes have been
proposed, each spread across 100 acres.11
• Estimated water demand is approx. 72 MLD
Gas
availability
• Nearest gas station is Barabkundu gas station (~5 km) in Sitakundo
Upazila.
• Apart from that, Ministry of Power, Energy and Mineral Resources has
proposed the construction of a gas pipeline for BSMSN which is in
progress. This gas pipeline is expected to supply 200 MMSCFD from
the national gas network.
• Assessment of gas requirement and adequacy of the gas sources is
undertaken in the master planning section of this report.
Others • Grameen Phone, Rabi & Banglalink provide telecom connectivity in
this region
• Bangladesh Telecommunications Company Limited has envisaged the
installation of Telecommunications Network with in the BSMSN which
is currently under progress.
• The government has envisaged to build a central effluent treatment
plants under PPP for proper waste management inside the BSMSN at
Mirsarai.
• Two common effluent treatment plants have been proposed as per
Draft Report of BSMSN Master Plan IV (by Sheltech) report of which
one CETP is to serve the entire portion of the proposed EZ.
Source: Data collected during site visit and secondary research
3.6. Access to Social Infrastructure
An important predecessor for establishing of industries in a region is the type of social infrastructure that is present
in the region. Access to educational institutes determine the availability of skilled local manpower; quality of
medical facilities determine whether skilled manpower can be brought in from outside to work at a place or not.
Hence, it is important to understand social infrastructure available in Chattogram district and the proposed
facilities in BSMSN.
11 BEZA

24 February 2021
PwC 30
Table 7: Prevailing social infrastructure
Educational
facilities
• There are over 200 schools (primary, secondary) and 7 colleges in
Sitakundo upazila.
• International quality educational facilities are not available in this
upazila. State of the art educational facilities are available in
Chattogram (~51 km).
• There is a total of 466 Technical and Vocational Education and
Training (TVET) institutes operational in Chattogram district. These
institutes can help in sourcing semi-skilled human resources for the
proposed EZ.
• Industries in the proposed EZ may consider customizing the courses in
the TVETs to suit to the industrial requirements, this shall facilitate in
easy sourcing of human resources.
Medical
facilities
• There are 1 Upazila Govt. Hospital (50 Bed facility), 55 private
clinics, 11 diagnostic centers in the Sitakundo upazila.
• There are 16 Government health complex, 6 missionary hospitals,
516 diagnostic centers and 215 private clinics in Chattogram district.
• Basic healthcare facilities are available in these medical units however
state of the art medical facilities can be availed in Chattogram (~51 km).
• In addition, as per Draft Report of BSMSN Master Plan IV (by Sheltech)
report land parcel of magnitude 814.30 acres (2% of total area of
BSMSN) is also earmarked for health and educational facilities to be
developed within BSMSN.
Source: Data collected during site visit and secondary research
Apart from these, for planning and development of BSMSN, “Eco-efficient and Sustainable Urban Infrastructure
approach – An initiative for Green Economic Growth” concept has been adopted. As per the as per Draft Report
of BSMSN Master Plan IV (by Sheltech) report, an area of 5,266.15 acres (16% of total area) within BSMSN has
been earmarked to incorporate eco-friendly residential facilities. In order to support the residents of the
neighborhoods and the expatriates working within the industrial city, quality health centers, primary and
secondary schools, shopping, convenience retail outlets, and entertainment/leisure areas will be strategically
located within this earmarked area. The proposed EZ being a part of BSMSN is envisaged to access to these
facilities and realize the potential of such world class infrastructure. A breakup of the proposed land use pattern
of BSMSN has been presented in Annexure 3 of this report.
3.6.1. Voice on Ground about the Location
Stakeholder consultations conducted as part of our mandate has captured the opinion formed by local
(Sitakundo, Mirsarai and regional level) and national (Bangladesh level) investors/ other stakeholders about the
locational attributes of the proposed EZ.
Local Iron & Steel
industry player
“The proposed EZ being part of BSMSN gives it immense edge in terms of attracting
reputed industry players; every established business house in the country is looking
towards BSMSN as the next big thing in Bangladesh.”
Local Govt.
Stakeholder
“The land for the proposed EZ is entirely Government owned and thus would entail no
extra cost associated with land acquisition; this will bring down the project cost of
developing the site”

24 February 2021
PwC 31
Domestic. Food &
Beverages player
“The portion of the land parcel demarcated for the proposed EZ that falls within BSMSN
is mainly designated for heavy industries; thus, development of food & beverages unit in
the proposed EZ, being a light to medium sector becomes questionable”
Domestic
Ceramics player
“The site could be suitable for cement and ceramics manufacturing units provided its
location which is tentatively in proximity to the proposed port inside BSMSN”
Source: Primary stakeholder consultations
Industry assessment chapter captures in detail the opinions shared by various industry players on the locational
attractiveness of the proposed EZ.
3.7. BSMSN Fueled by Next Generation Infrastructure
BSMS, the flagship project of BEZA is planned and designed to attract foreign and domestic investors and provide
seamless, multi-transport/logistics (sea, air, road, rail) to support a wide range of industrial sectors. BSMSN is
proposed to be constructed with world class infrastructure and utilities, focusing on green technology and resilience
measures to elevate the zone to an environmentally friendly level, which tackles climate change and sustainability
which is a key concern for coastal developments such as BSMSN site.
Various types of infrastructure/utilities are envisaged within BSMSN to provide world class networks which will
make BSMSN competitive, sustainable and resilient zone. The table below provides an overview of the different
types of infrastructure facilities envisaged within BSMSN.
Table 8: Type of Infrastructure Planned within BSMSN
Key Infrastructure, Services and Functions
Types of Infrastructure/Utility Assets
Flood Protection and Management
Coastal embankments, River dykes, Pumps, Gates, Storm water drainage, etc.
Transport Roads, Bridges, Ports, etc. Buildings
Factory shells, Administration building, Residential buildings, Fire service, Schools, Medical centres, Commercial areas, Residential areas, etc.
Telecommunication Towers, Cables, etc. Water Supply and Sanitation Sewage treatment plants (STP), Water treatment plant (WTP), Water
reservoirs, Desalination plants, etc. Energy Power plants, Sub-stations, Solar (including floating solar) etc. Waste Management Waste treatment plants (CETP), Bio-gas plants etc.
Source: Draft Report of BSMSN Master Plan IV (by Sheltech) report (Shared by World Bank on 30th June 2020 over mail)
Being located within the BSMSN site, the proposed EZ at Sitakundo could leverage the envisaged
world class infrastructure and planned utilities to attract foreign and domestic investors.
3.8. Key Takeaways
• The entire EZ forms part of Precinct I of BSMSN which is being developed as one of the
largest industrial projects in Bangladesh with strong focus on industrial, social and
physical infrastructure.
• The proposed EZ is spread across an area of 2,368.57 acres, which is entirely government-
owned land. This would reduce significant project cost associated with land acquisition.
• The land parcel of the proposed EZ is designated to host heavy industries (as per the Draft
Report of BSMSN Master Plan IV prepared by Sheltech)
• The strategic location of the proposed EZ provides access to multi-modal connectivity to industrial nodes
in Bangladesh as well as other neighboring countries
o Dhaka-Chattogram highway (N1) is the nearest highway which is ~8 km from the proposed EZ.

24 February 2021
PwC 32
o Currently, there is ~8 km long pitched road (~3 m wide) which provides the last mile approach
connecting the proposed EZ with N1.
o As per Draft Report of BSMSN Master Plan IV (by Sheltech) report, the proposed EZ will have
access to/from Dhaka-Chattogram highway via road networks within BSMSN.
o Sitakundo rail station (~19 km) is the nearest rail node from the proposed EZ.
o Proposed Mirsarai port (to come up within BSMSN) is located in close proximity to the proposed
EZ and Chattogram seaport is located at ~51 km from the proposed EZ.
o Shah Amanat International airport is located ~51 km from the proposed EZ and has direct road
connectivity.
• Proposed EZ has good access to the planned utilities within the BSMSN along with the existing facilities
in the region surrounded the proposed EZ.
o 132 kV Baroawliya grid substation (~20 km) can be used for sourcing initial power requirement
during construction stage. PGCB has established a 230/33 kV GIS grid substation within
BSMSN which can act as the source of power during operation stage.
o As per Draft Report of BSMSN Master Plan IV (by Sheltech) report, 150 MW solar power plant
is proposed in the master plan of BSMSN.
o Tube wells and water reservoirs envisaged within BSMSN can act as surface water sources for
the proposed EZ.
o Nearest gas station is Barabkundu gas station (~5 km) in Sitakundo Upazila. Ministry of Power,
Energy and Mineral Resources has proposed the construction of a gas pipeline for BSMSN
which is in progress.
• Basic social infrastructure is available in Sitakundo upazila which can cater to the needs of semi-skilled
and unskilled labour.
• In addition, proposed EZ could also leverage the world-class social infrastructure facilities
envisaged within BSMSN.

24 February 2021
PwC 33
4. Competition Benchmarking
4.1. Key Objectives
It is imperative for any economic development project across geographies to understand the prevalent best
practices in a particular landscape. Thus, the success of an economic zone can often be co-related with similar
developments across comparable economies around the globe. Moreover, at the inception stage, a developer,
whether Government or private should be well acquainted with the best practices and key drivers of the economic
zones that have been successfully fulfilling their potential across the world. In order to gain that knowledge,
studying and understanding of the development strategies of other economic zones becomes crucial from the
perspective of imbibing and applying the best prevalent practices of the world.
Based on this premise, this chapter attempts to provide a profiling of various economic zones which share similar
physical and economic attributes as the proposed economic zone.
4.2. Methodology of Benchmarking
The benchmarking exercise has been conducted through extensive research which entailed primary interactions
with developers of economic zones supported by detailed secondary research, etc. An illustration for the flow of
the benchmarking exercise has been depicted below:
Figure 6: Benchmarking Methodology
Source: PwC Analysis
The identification of economic zones has been carried out on the following broad parameters as described below:

24 February 2021
PwC 34
Figure 7: Selection criteria for economic zones for benchmarking
Source: PwC Analysis
The data obtained through primary interactions (telephonic, email correspondence etc.) have been further
validated through detailed secondary research in order to ensure data adequacy and accuracy.
Post receipt of all data points a brief macro-economic profiling of the respective countries has been conducted to
assess their economic landscapes.
Finally, a comparative assessment of all these EZs have been done keeping the proposed Sitakundo EZ in
cognizance in order to pinpoint and understand the best practices.
4.3. Competitor Identification
The subject economic zone is located in Sitakundo, Bangladesh and is envisaged to cover a land area of 2368.57
acres. Based on extensive research and the parameters as highlighted above, the following economic zones have
been identified in the figure shown on next page.
Figure 8: Geographic Spread of Comparable EZ
Source: PwC Research
A brief overview and rational for selection for each of these economic zones have been provided below:
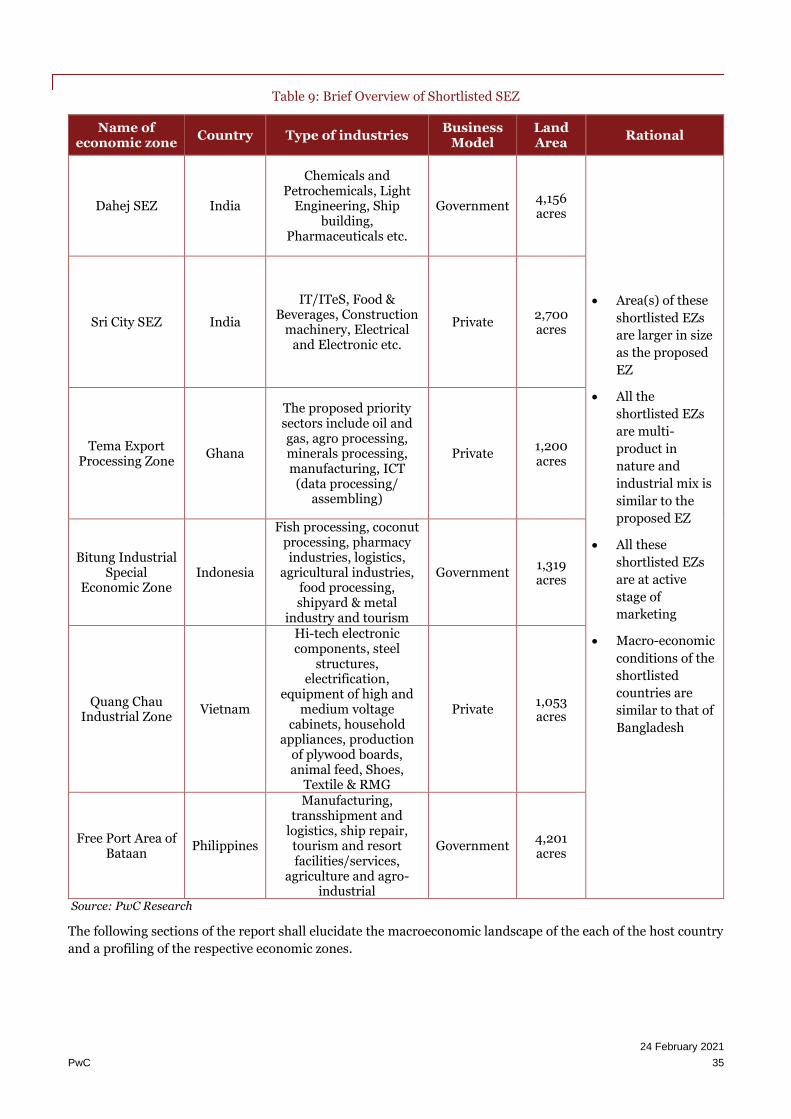
24 February 2021
PwC 35
Table 9: Brief Overview of Shortlisted SEZ
Name of economic zone
Country Type of industries Business
Model Land Area
Rational
Dahej SEZ India
Chemicals and Petrochemicals, Light
Engineering, Ship building,
Pharmaceuticals etc.
Government 4,156 acres
• Area(s) of these
shortlisted EZs
are larger in size
as the proposed
EZ
• All the
shortlisted EZs
are multi-
product in
nature and
industrial mix is
similar to the
proposed EZ
• All these
shortlisted EZs
are at active
stage of
marketing
• Macro-economic
conditions of the
shortlisted
countries are
similar to that of
Bangladesh
Sri City SEZ India
IT/ITeS, Food & Beverages, Construction
machinery, Electrical and Electronic etc.
Private 2,700 acres
Tema Export Processing Zone
Ghana
The proposed priority sectors include oil and gas, agro processing, minerals processing, manufacturing, ICT
(data processing/ assembling)
Private 1,200 acres
Bitung Industrial Special
Economic Zone Indonesia
Fish processing, coconut processing, pharmacy industries, logistics,
agricultural industries, food processing, shipyard & metal
industry and tourism
Government 1,319 acres
Quang Chau Industrial Zone
Vietnam
Hi-tech electronic components, steel
structures, electrification,
equipment of high and medium voltage
cabinets, household appliances, production
of plywood boards, animal feed, Shoes,
Textile & RMG
Private 1,053 acres
Free Port Area of Bataan
Philippines
Manufacturing, transshipment and
logistics, ship repair, tourism and resort facilities/services,
agriculture and agro-industrial
Government 4,201 acres
Source: PwC Research
The following sections of the report shall elucidate the macroeconomic landscape of the each of the host country
and a profiling of the respective economic zones.
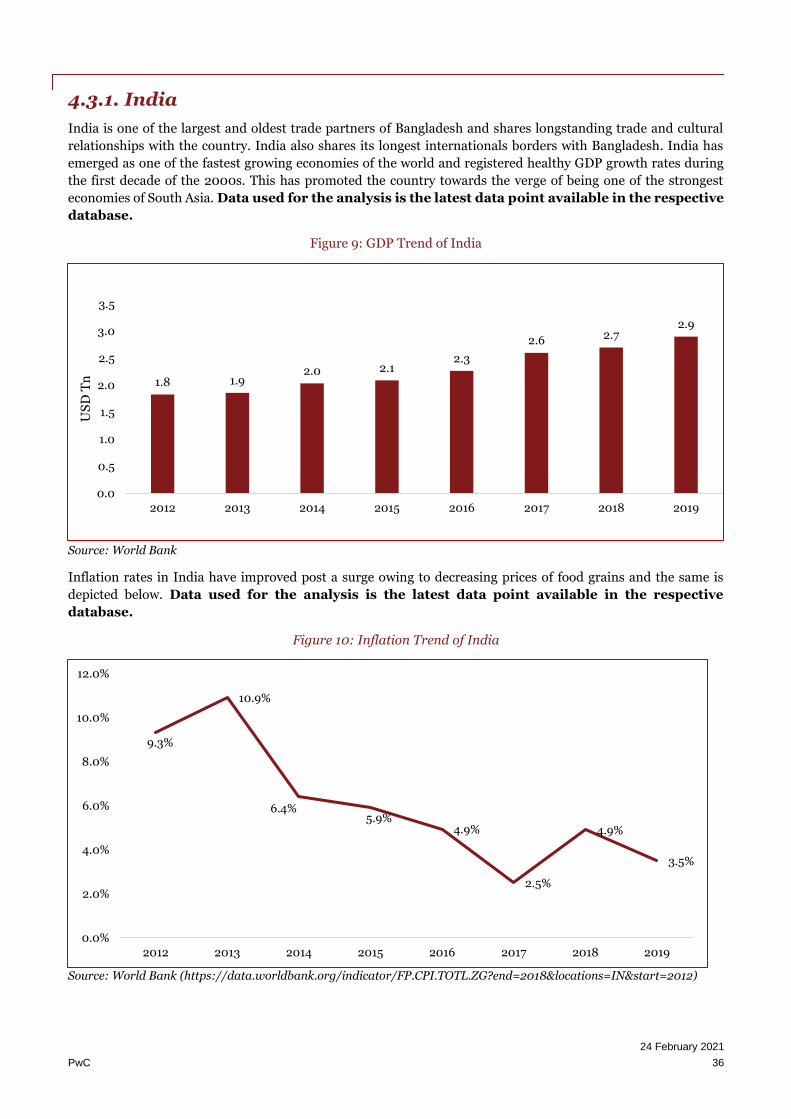
24 February 2021
PwC 36
4.3.1. India
India is one of the largest and oldest trade partners of Bangladesh and shares longstanding trade and cultural
relationships with the country. India also shares its longest internationals borders with Bangladesh. India has
emerged as one of the fastest growing economies of the world and registered healthy GDP growth rates during
the first decade of the 2000s. This has promoted the country towards the verge of being one of the strongest
economies of South Asia. Data used for the analysis is the latest data point available in the respective
database.
Figure 9: GDP Trend of India
Source: World Bank
Inflation rates in India have improved post a surge owing to decreasing prices of food grains and the same is
depicted below. Data used for the analysis is the latest data point available in the respective
database.
Figure 10: Inflation Trend of India
Source: World Bank (https://data.worldbank.org/indicator/FP.CPI.TOTL.ZG?end=2018&locations=IN&start=2012)
1.8 1.92.0 2.1
2.3
2.6 2.72.9
0.0
0.5
1.0
1.5
2.0
2.5
3.0
3.5
2012 2013 2014 2015 2016 2017 2018 2019
US
D T
n
9.3%
10.9%
6.4%5.9%
4.9%
2.5%
4.9%
3.5%
0.0%
2.0%
4.0%
6.0%
8.0%
10.0%
12.0%
2012 2013 2014 2015 2016 2017 2018 2019

24 February 2021
PwC 37
The other macroeconomic indicators for the country have been summarized below:
Table 10: Macro-economic Parameter of India
Macroeconomic Indicator Description Data Source
Unemployment 2.6% The Heritage Foundation
FDI Inflow USD 42.12 Billion The World Bank
Exports USD 322.78 Billion in 2019 ITC Trade Map
Imports USD 480 Billion in 2019 ITC Trade Map
Heritage Foundation’s Index of Economic
Freedom Rankings. 120
The Heritage Foundation
2019
Cato Institute's Human Freedom ranking 94 Human Freedom Index | Cato
Institute
World Economic Freedom's Global
Competitive Index Rating 68
Global Competitiveness Index
2019 rankings
WB Doing Business ranking 63 Doing Business 2020
Source: PwC Research
India was a restricted economy pre-1990s. Economic liberalization measures like industrial deregulation,
privatization of state-owned enterprises and reduced controls on foreign trade and investment began in the 1990s
and liberated the economy from a longstanding regime of regulations. The country since then has gradually
become a more open market economy from a largely regulated and restricted one. The introduction of Goods &
Services Tax (GST) was a paradigm shift in its taxation regime. This is evident in the ease of doing business
ranking where the country improved its standings from 100 in 2018 to 63 in 2020.
However, a push in infrastructure development together with increased public spending and initiatives such as
“Make in India” has helped India gain significantly on the economic competitiveness front and become a leader
amongst South Asian economies.
Post identification of the various macro-economic parameters of India, the subsequent section of the report
intends to highlight the various attributes of identified economic zones in the country.
4.3.1.1. Dahej Special Economic Zone
The Dahej Special Economic Zone is located in western part of Bharuch District, Gujarat, India. The SEZ is
strategically located in the Western Coast with excellent multi-modal connectivity. The multi-product SEZ is one
amongst the top 50 ‘free zones’ in the world. Dahej SEZ covers the total land area of 1682 ha which is divided into
Part-1 (East) and Part-2 (West) which is joined by a dedicated corridor. The SEZ houses industries from sectors
like Chemicals and Petrochemicals, Light Engineering, Ship building, Pharmaceuticals etc.
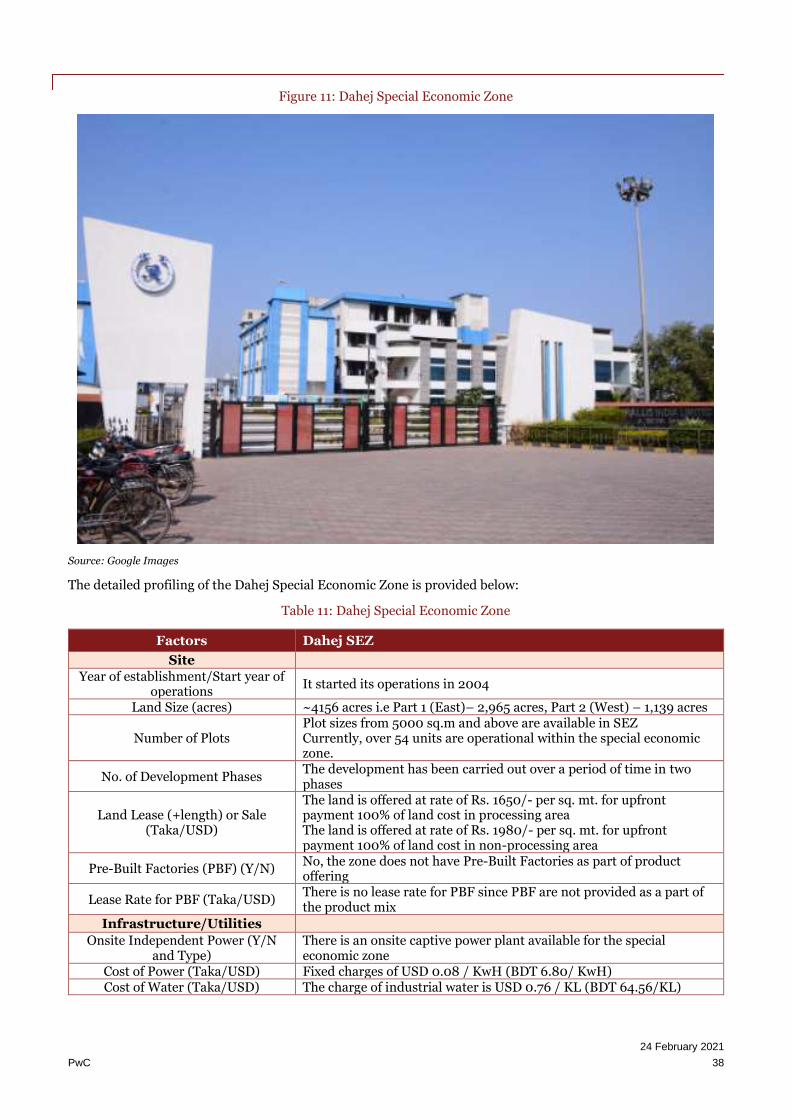
24 February 2021
PwC 38
Figure 11: Dahej Special Economic Zone
Source: Google Images
The detailed profiling of the Dahej Special Economic Zone is provided below:
Table 11: Dahej Special Economic Zone
Factors Dahej SEZ
Site
Year of establishment/Start year of operations
It started its operations in 2004
Land Size (acres) ~4156 acres i.e Part 1 (East)– 2,965 acres, Part 2 (West) – 1,139 acres
Number of Plots Plot sizes from 5000 sq.m and above are available in SEZ Currently, over 54 units are operational within the special economic zone.
No. of Development Phases The development has been carried out over a period of time in two phases
Land Lease (+length) or Sale (Taka/USD)
The land is offered at rate of Rs. 1650/- per sq. mt. for upfront payment 100% of land cost in processing area The land is offered at rate of Rs. 1980/- per sq. mt. for upfront payment 100% of land cost in non-processing area
Pre-Built Factories (PBF) (Y/N) No, the zone does not have Pre-Built Factories as part of product offering
Lease Rate for PBF (Taka/USD) There is no lease rate for PBF since PBF are not provided as a part of the product mix
Infrastructure/Utilities
Onsite Independent Power (Y/N and Type)
There is an onsite captive power plant available for the special economic zone
Cost of Power (Taka/USD) Fixed charges of USD 0.08 / KwH (BDT 6.80/ KwH) Cost of Water (Taka/USD) The charge of industrial water is USD 0.76 / KL (BDT 64.56/KL)
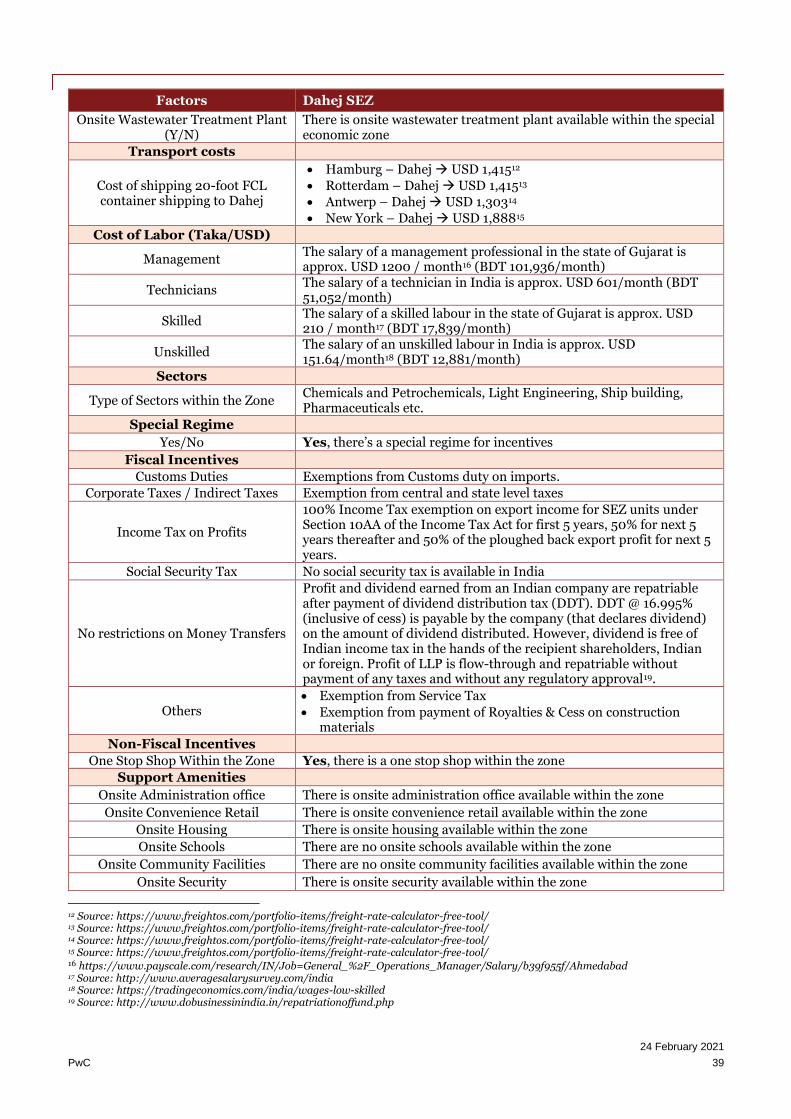
24 February 2021
PwC 39
Factors Dahej SEZ
Onsite Wastewater Treatment Plant (Y/N)
There is onsite wastewater treatment plant available within the special economic zone
Transport costs
Cost of shipping 20-foot FCL container shipping to Dahej
• Hamburg – Dahej → USD 1,41512
• Rotterdam – Dahej → USD 1,41513
• Antwerp – Dahej → USD 1,30314
• New York – Dahej → USD 1,88815
Cost of Labor (Taka/USD)
Management The salary of a management professional in the state of Gujarat is approx. USD 1200 / month16 (BDT 101,936/month)
Technicians The salary of a technician in India is approx. USD 601/month (BDT 51,052/month)
Skilled The salary of a skilled labour in the state of Gujarat is approx. USD 210 / month17 (BDT 17,839/month)
Unskilled The salary of an unskilled labour in India is approx. USD 151.64/month18 (BDT 12,881/month)
Sectors
Type of Sectors within the Zone Chemicals and Petrochemicals, Light Engineering, Ship building, Pharmaceuticals etc.
Special Regime
Yes/No Yes, there’s a special regime for incentives
Fiscal Incentives
Customs Duties Exemptions from Customs duty on imports.
Corporate Taxes / Indirect Taxes Exemption from central and state level taxes
Income Tax on Profits
100% Income Tax exemption on export income for SEZ units under Section 10AA of the Income Tax Act for first 5 years, 50% for next 5 years thereafter and 50% of the ploughed back export profit for next 5 years.
Social Security Tax No social security tax is available in India
No restrictions on Money Transfers
Profit and dividend earned from an Indian company are repatriable after payment of dividend distribution tax (DDT). DDT @ 16.995% (inclusive of cess) is payable by the company (that declares dividend) on the amount of dividend distributed. However, dividend is free of Indian income tax in the hands of the recipient shareholders, Indian or foreign. Profit of LLP is flow-through and repatriable without payment of any taxes and without any regulatory approval19.
Others • Exemption from Service Tax
• Exemption from payment of Royalties & Cess on construction materials
Non-Fiscal Incentives
One Stop Shop Within the Zone Yes, there is a one stop shop within the zone
Support Amenities
Onsite Administration office There is onsite administration office available within the zone
Onsite Convenience Retail There is onsite convenience retail available within the zone
Onsite Housing There is onsite housing available within the zone
Onsite Schools There are no onsite schools available within the zone
Onsite Community Facilities There are no onsite community facilities available within the zone
Onsite Security There is onsite security available within the zone
12 Source: https://www.freightos.com/portfolio-items/freight-rate-calculator-free-tool/ 13 Source: https://www.freightos.com/portfolio-items/freight-rate-calculator-free-tool/ 14 Source: https://www.freightos.com/portfolio-items/freight-rate-calculator-free-tool/ 15 Source: https://www.freightos.com/portfolio-items/freight-rate-calculator-free-tool/ 16 https://www.payscale.com/research/IN/Job=General_%2F_Operations_Manager/Salary/b39f955f/Ahmedabad 17 Source: http://www.averagesalarysurvey.com/india 18 Source: https://tradingeconomics.com/india/wages-low-skilled 19 Source: http://www.dobusinessinindia.in/repatriationoffund.php

24 February 2021
PwC 40
Factors Dahej SEZ
Quality of Life
International Housing (Within 15 Km)
There are township/housing blocks are available within 10km from SEZ
International Hospital/Clinic (Within 20km)
Medical Centers are in operation in IPCL and Birla Copper Plant in the vicinity of Dahej SEZ
International Schools (Within 20 kms)
Quality schools like Reliance foundation school, Sanskardeep Vidhyalaya are available within close proximity of the zone
The Dahej SEZ has well developed infrastructure facilities and also strategically located in the Western Coast with
excellent connectivity to National Highways, State Highways, Broad Gauge Railways, State-of-the-art Ports in the
vicinity. The strategic location combined with well-developed industrial infrastructure of SEZ has attracted
companies to set up their industrial units in the SEZ. Some of the major industries in the SEZ are DIC Fine
Chemicals, Pidilite industries, Torrent Pharmaceuticals, Rallis India Ltd, Godrej & Boyce etc.
4.3.1.2. Sri City Special Economic Zone
Sri City is located in the eastern state of Andhra Pradesh which is well known for its industrial eco system. Sri City encompasses well-planned and dedicated zones for industry and business services, and full-fledged social support infrastructure. The industrial park includes a Multi-product Special Economic Zone (SEZ), a Free Trade & Warehousing Zone (FTWZ), a Domestic Tariff Zone (DTZ), and an Electronics Manufacturing Cluster (EMC). The larger integrated township includes zones for residences, retail, healthcare, and education. The economic zone is located strategically on the National Highway 16 and enjoys excellent connectivity through road, rail, air and sea. City was developed in functional partnership with the Government of the State of Andhra Pradesh and the Government of India. Sri City is regarded as one of the most successful economic zones of India replete with state-of-the-art infrastructure. The success of the economic zone has revolved around superior infrastructure, excellent connectivity through various modes, well developed master plan, efficient marketing activities, etc.
Figure 12: Sri City SEZ
Source: Sri City Brochure
The detailed profiling of Sri City is provided below:
Table 12: Sri City Special Economic Zone
Factors Sri City SEZ
Site
Year of establishment/Start year of operations
It was founded in 2008

24 February 2021
PwC 41
Factors Sri City SEZ
Land Size (acres) Total area is 7,500 acres; however, SEZ is set up on 2,700 acres
Number of Plots/Units/Firms Plots of variable sizes are available; however, the exact number of plots have not been demarcated Over 185 companies are operational within the special economic zone
No. of Development Phases The development has been carried out over a period of time but in two phases
Land Lease (+length) or Sale (Taka/USD)
One-time upfront land premium of USD 38.50 / sq. m (BDT 3,262,55/ sq. m) is applicable
Pre-Built Factories (PBF) (Y/N) There are no Pre-Built Factories provided as a part of the product offering
Lease Rate for PBF (Taka/USD) There is no lease rate for PBF since PBF are not part of the product offering
Infrastructure/Utilities
Onsite Independent Power (Y/N and Type)
There is no onsite captive power plant available for the special economic zone
Cost of Power (Taka/USD) Fixed charges of USD 0.73 / Kw / month (BDT 61.86 /KwH) and additional energy charges of USD 0.088 / KwH (BDT 7.46/KwH) of energy consumed20
Cost of Water (Taka/USD) The charge of industrial water is USD 0.80 / KL (BDT 67.79/ KL) Onsite Wastewater Treatment Plant
(Y/N) There is an onsite wastewater treatment plant available within the special economic zone
Transport costs
Cost of shipping 20-foot FCL container shipping to Chennai
• Hamburg – Chennai → USD 1,90621
• Rotterdam – Chennai → USD 1,88622
• Antwerp – Chennai → USD 1,69723
• New York – Chennai → USD 5,32524
Cost of Labor (Taka/USD)
Management The salary of a manager is approx. USD 662/ month (BDT 56,235/month)25
Technicians The salary of an entry-level engineer is approx. USD 340 / month (BDT 28,882/month)26
Skilled The salary of a skilled laborer in Andhra Pradesh is approx. USD 175/month (BDT 14,866/month)27
Unskilled The salary of an unskilled labourer in Andhra Pradesh is approx. USD 122/month (BDT 10,364/month)28
Sectors
Type of Sectors within the Zone Automotive, Light Engineering, Food & Beverages, Fast Moving Consumer Goods (FMCG), Automotive parts etc.
Special Regime
Yes/No Yes, there’s a special regime for incentives
Fiscal Incentives
Customs Duties Exemptions from customs duties and excise for import/procurement of goods for development, operations and maintenance are applicable29
Corporate Taxes / Indirect Taxes There is no exemption from minimum alternate tax
20 Source: http://www.aperc.gov.in/aperc1/assets/uploads/files/08f97-to2016-17.pdf 21 Source: https://www.freightos.com/portfolio-items/freight-rate-calculator-free-tool/ 22 Source: https://www.freightos.com/portfolio-items/freight-rate-calculator-free-tool/ 23 Source: https://www.freightos.com/portfolio-items/freight-rate-calculator-free-tool/ 24 Source: https://www.freightos.com/portfolio-items/freight-rate-calculator-free-tool/ 25 Source: https://www.payscale.com/research/IN/Location=Visakhapatnam-Andhra-Pradesh/Salary 26 Source: https://www.payscale.com/research/IN/Location=Visakhapatnam-Andhra-Pradesh/Salary 27 Source: http://labour.ap.gov.in/ELabour/Documents/MinimumWages/12/1any%20manufacturing%20(1).pdf 28 Source: http://labour.ap.gov.in/ELabour/Documents/MinimumWages/12/1any%20manufacturing%20(1).pdf 29 Source: http://www.vsez.gov.in/vsez_wsp__sez_schme.aspx

24 February 2021
PwC 42
Factors Sri City SEZ
Income Tax on Profits Exemption from payment of Income Tax on export income for the first 5 years, 50% for next five years and 50% of ploughed in profits for next 5 years30
Social Security Tax No social security tax is available in India
No restrictions on Money Transfers
Profit and dividend earned from an Indian company are repatriable after payment of DDT. DDT @ 16.995% (inclusive of cess) is payable by the company (that declares dividend) on the amount of dividend distributed. However, dividend is free of Indian income tax in the hands of the recipient shareholders, Indian or foreign. Profit of LLP is flow-through and repatriable without payment of any taxes and without any regulatory approval31
Others • Exemption from payment of service tax, Central Sales Tax, AP
VAT, stamp duty and registration fee on registration of lease deeds, capital contribution charges for supply of water etc.32
Non-Fiscal Incentives
One Stop Shop Within the Zone Yes, there’s a special regime for incentives
Support Amenities
Onsite Administration office There is an onsite administration office available within the zone
Onsite Convenience Retail There is an onsite convenience retail available within the zone
Onsite Housing There is onsite housing is available within the zone
Onsite Schools There is onsite schooling is available within the zone
Onsite Community Facilities There are onsite community facilities available within the zone
Onsite Security There is onsite security available within the zone
Quality of Life
International Housing (Within 15 Km)
Investment grade accommodation of more than 600 dwelling in 3 different locations, ready for occupation is located in close proximity to the zone
International Hospital/Clinic (Within 20km)
Quality health care facilities like SRM Institutes for Medical Science is available in close proximity of the EZ
International Schools (Within 20 kms)
Quality schools like Chinmaya Vidyalaya School is available in close proximity of the EZ
Source: PwC Research
Sri City has witnessed resounding success owing to its superior quality infrastructure, strategic location in the industrial state of Andhra Pradesh and proximity to Chennai which is one of the major cities of India. The region also has access to ports, international airports, rail heads, etc. which allows for seamless transportation of goods and raw materials to and from the zone. Identifying Foxconn as the anchor tenant has allowed the zone to develop a superior brand image and quick land offtake.
30 Source: http://www.vsez.gov.in/vsez_wsp__sez_schme.aspx 31 Source: http://www.dobusinessinindia.in/repatriationoffund.php 32 Source: http://www.vsez.gov.in/vsez_wsp__sez_schme.aspx

24 February 2021
PwC 43
4.3.2. Ghana
Ghana is located along the Gulf of Guinea and Atlantic Ocean and in the region of West Africa. It is one of the
emerging economies of Africa striding on manufacturing and export of digital technology goods in addition to
assembling and exporting of automobiles and ships. The country is also rich in industrial minerals, agricultural
products such as cocoa, petroleum and natural gas. Ghana adopted the concept of Special Economic Zones (SEZs)
in order to stimulate the economic growth by increasing its exports and improve its competitiveness in the world.
The economy registered a decent growth regime. The same has been depicted in the chart below:
Figure 13: GDP Trend of Ghana
Source: World Bank
Inflation rates in Ghana have eased owing to the continued monetary restrictions by the Bank of Ghana, fiscal
consolidation and the sharp reductions in non-food inflation and the same is depicted below. Data used for
the analysis is the latest data point available in the respective database.
Figure 14: Inflation Trend of Ghana
Source: World Bank
4043 44 45 47
5154
66
0
10
20
30
40
50
60
70
2012 2013 2014 2015 2016 2017 2018 2019
US
D B
n
7.1%
11.7%
15.5%
17.1% 17.5%
12.4%
9.8%
11.1%
0%
2%
4%
6%
8%
10%
12%
14%
16%
18%
20%
2012 2013 2014 2015 2016 2017 2018 2019

24 February 2021
PwC 44
The other macroeconomic indicators for the country have been summarized below:
Table 13: Macro-economic Parameter of Ghana
Macroeconomic Indicator Description Data Source
Unemployment 6.7% The Heritage Foundation
FDI Inflow USD 3.0 Billion The World Bank
Exports USD 13.8 Million ITC Trade Map
Imports USD 15.86 Million ITC Trade Map
Heritage Foundation’s Index of Economic Freedom Rankings.
104 The Heritage Foundation
Cato Institute's Human Freedom ranking 70 Human Freedom Index | Cato
Institute World Economic Freedom's Global
Competitive Index Rating 111
Global Competitiveness Index 2019 rankings
WB Doing Business ranking 118 Doing Business 2020
Source: PwC Research
Ghana is an emerging economy and ranks 104th in terms of economic freedom. The country’s growth is
predominantly led by strong growth in mining, petroleum, agriculture and sustained expansion in forestry and
logging. Expanding crude oil production and rising prices have fostered GDP growth. A stable government,
initiatives to formalize the economy and introduction of a favorable tax structure are providing an additional
impetus to the growth of the economy.
Post identification of the various macro-economic parameters of Ghana, the subsequent section of the report
intends to highlight the various attributes of Tema Export Processing Zone in Ghana.
4.3.2.1. Tema Export Processing Zone
Tema Export Processing Zone is located in Tema, one of Ghana’s major and fastest growing residential and
industrial cities. The Ghana Free Zone Authority promotes the development of Export Processing Zones as part
of the Ghana Free Zones Programme in order to transform into the gateway to West Africa.
Figure 15: Tema Export Processing Zone
Source: Ghana Free Zones Board
The detailed profiling of this Export Processing Zone is provided below.

24 February 2021
PwC 45
Table 14: Details of Tema Export Processing Zone
Factors Tema Export Processing Zone
Site
Year of establishment/Start year of operations
It was established in 1995
Land Size (acres) 1,200 acres
Number of Plots/Units/Firms Plots of variable sizes are available; however, the exact number of plots have not been demarcated Currently, 19 tenants are operational in the zone
No. of Development Phases The park has been developed in various phases over a period of time
Land Lease (+length) or Sale (Taka/USD)
Industrial land is provided on lease in Africa is USD 30,000 to USD 150,000/acre/year or approx. USD 0.625/m2/month (BDT 53.09/m2/month)
Pre-Built Factories (PBF) (Y/N) No, the zone has not had Pre-Built Factories as part of product offering
Lease Rate for PBF (Taka/USD) There is no lease rate for PBF since PBF are not provided as a part of the product mix
Infrastructure/Utilities
Onsite Independent Power (Y/N and Type)
At the site, there is no independent power provider. Power for industrial purpose is provided by national electricity grid
Cost of Power (Taka/USD) • 0-300 units=USD 0.00199/KwH33 (BDT 0.17/KwH)
• 301-600 units= USD 0.00212/KwH34 (BDT 0.18/KwH)
• 601+ units= USD 0.00335/KwH35 (BDT 0.28/KwH) Cost of Water (Taka/USD) The cost of industrial water is approx. USD 0.02074/m3 (BDT 1.76/ m3)
Onsite Wastewater Treatment Plant (Y/N)
There is no onsite water treatment plant since industries within the zone typically have their own treatment plant
Transport costs
Cost of shipping 20-foot FCL container
The approximate shipping charges of a 20-foot FCL Container from the nearest port are as follows:
• Hamburg – Tema Port → USD 869-96136
• Rotterdam – Tema Port → USD 861-952
• Antwerp – Tema Port → USD 878-970
• New York – Tema Port → USD 2,636-2,91337
Cost of Labour (Taka/USD)
Management The salary of management professional is approximately USD 1,390/month38 (BDT 118,076/month)
Technicians The salary of a technician is approx. USD 958/month39 (BDT 81,379/month)
Skilled The salary of a skilled labourer is approximately 2,030 GHS/Month (USD 418.1/Month)40,41 (BDT 35,516/month)
Unskilled The salary of an unskilled labourer is approx. 870 GHS/Month (USD 179.2/Month)42,43 (BDT 15,222/month)
Sectors
Type of Sectors within the Zone Oil and gas, agro processing, minerals processing, manufacturing, ICT (data processing/ assembling)44
Special Regime
Yes/No Yes, there is a special regime for incentives
33 Note: As of December 31, 2018, exchange rate 0.00002 34 Note: As of December 31, 2018, exchange rate 0.00002 35 Note: As of December 31, 2018, exchange rate 0.00002 36 Source: https://www.freightos.com/portfolio-items/freight-rate-calculator-free-tool/ 37 Source: https://worldfreightrates.com/freight 38 Source: https://www.averagesalarysurvey.com/ghana 39 Source: https://www.averagesalarysurvey.com/ghana 40 Note: As of December 31, 2018, exchange rate 0.00002 41 Source: https://tradingeconomics.com/ghana/wages-high-skilled 42 Note: As of December 31, 2018, exchange rate 0.00002 43 Source: https://tradingeconomics.com/ghana/wages-low-skilled 44 Source: https://www.jetro.go.jp/ext_images/world/africa/seminar_reports/pdf/20160520/s2.pdf

24 February 2021
PwC 46
Factors Tema Export Processing Zone
Fiscal Incentives
Customs Duties 100% exemption from payment of direct and indirect duties and levies on all imports for production and exports from free zones
Corporate Taxes / Indirect Taxes 100% exemption from payment of direct and indirect duties & taxes
Income Tax on Profits 100% exemption from payment of income tax on profits for 10 years and shall not exceed 15% thereafter
Social Security Tax For corporates: Compulsory social security contribution of 13% of monthly basic salaries of employees
No restrictions on Money Transfers
• Total exemption from payment of withholding taxes from dividends arising out of free zone investments
• Free zone investments are guaranteed against nationalization and expropriation
• There are no conditions or restrictions on: repatriation of dividends or net profit; payments for foreign loan servicing; payments of fees and charges for technology transfer agreements; and remittance of proceeds from sale of any interest in a free zone investment
Others
• 100% exemption from payment of withholding taxes
• Relief from double taxation for foreign investors and employees
• 100% ownership of shares by any investor – foreign or national in a free zone enterprise is allowed
Non-Fiscal Incentives
One Stop Shop Within the Zone Yes, there is a one stop shop within the Zone
Support Amenities
Onsite Administration office There is onsite administration office available within the zone45
Onsite convenience retail There is no onsite convenience retail available within the zone
Onsite Housing There is no onsite housing available within the zone
Onsite Schools There are no onsite schools available within the zone
Onsite Community Facilities There are no onsite community facilities available within the zone
Onsite Security There is onsite security available within the zone
Quality of Life
International Housing (Within 15 km)
There is no international housing facility available within 15 km radius of the EZ
International Hospital/Clinic (Within 20 km)
Quality Hospital like American International Hospital and International Maritime Hospital is available in close proximity to the zone
Healthcare facilities can also be availed at Atlantis Clinic, Tema General Hospital and The Lord’s Pentecostal Church International, Ashaiman Central46
International Schools (Within 20 km)
There are quality schools like Tema International School, Aves International Academy, Jesus Life International School, Witsands International School, SOS-Hermann Gmeiner International College and a few others in close proximity to the zone47
Source: PwC analysis and data collection
Tema EPZ provides a favorable and conducive environment for manufacturing, service and commercial activities.
The presence of one-stop shops with services such as customs excise and preventive service, police, immigration,
environmental protection agency, internal revenue service makes it very favorable for business processing. In
addition, the wide range of facilities, makes it attractive prospective investors who are willing to establish their
industrial units within the zone48.
45 Source: https://unctad.org/en/Docs/diaepcb20095_en.pdf 46 Source: https://www.google.com/maps/search/international+hospitals+in+Tema+Export+Processing+Zones/@5.6967906,-0.0080828,14z/data=!3m1!4b1 47 Source: https://www.google.com/maps/search/international+schools+in+Tema+Export+Processing+Zones/@5.694637,-0.0446726,13z/data=!3m1!4b1 48 Source: https://gfzb.gov.gh/index.php/tema-export-processing-zones/

24 February 2021
PwC 47
4.3.3. Indonesia
Indonesia, the world’s largest island country is located Southeast Asia between Indian and Pacific oceans. The
largest economy in Southeast Asia is classified as a newly industrialized country and has mixed economy, where
state-owned enterprises (SOEs) and large private business groups (conglomerates) play a significant role. The
Indonesian economy is traditionally a commodity export-oriented economy with palm oil and coal briquettes
being the main exports followed by petroleum gas, crude petroleum, rubber and cars. Lately the central
government has been providing strong support to increase the role of manufacturing industry in the country, thus
reducing the dependence on exports. Resilient economic growth, low government debt and prudent fiscal
management play a key role in attracting financial inflows into Indonesia. Over the last decade, economic clusters
in Indonesia have increased manifold given the country’s locational advantage, rich natural resources and climate
conducive to agriculture. The GDP growth of Indonesia has been depicted below. Data used for the analysis
is the latest data point available in the respective database.
Figure 16: GDP of Indonesia
Source: The World Bank
The inflation rate in Indonesia has been higher than its peer nations. During the period 2005-2014, average
annual inflation in Indonesia has been 8.5%. The high volatility in inflation has been mainly due to significant
energy subsidies. However, the current government has diverted such funds subsidies to infrastructure
development, getting inflation under control. The same is depicted below. Data used for the analysis is the
latest data point available in the respective database.
850897
942988
1,0381,090
1,1471,207
0
200
400
600
800
1,000
1,200
1,400
2012 2013 2014 2015 2016 2017 2018 2019
in U
SD
Bn
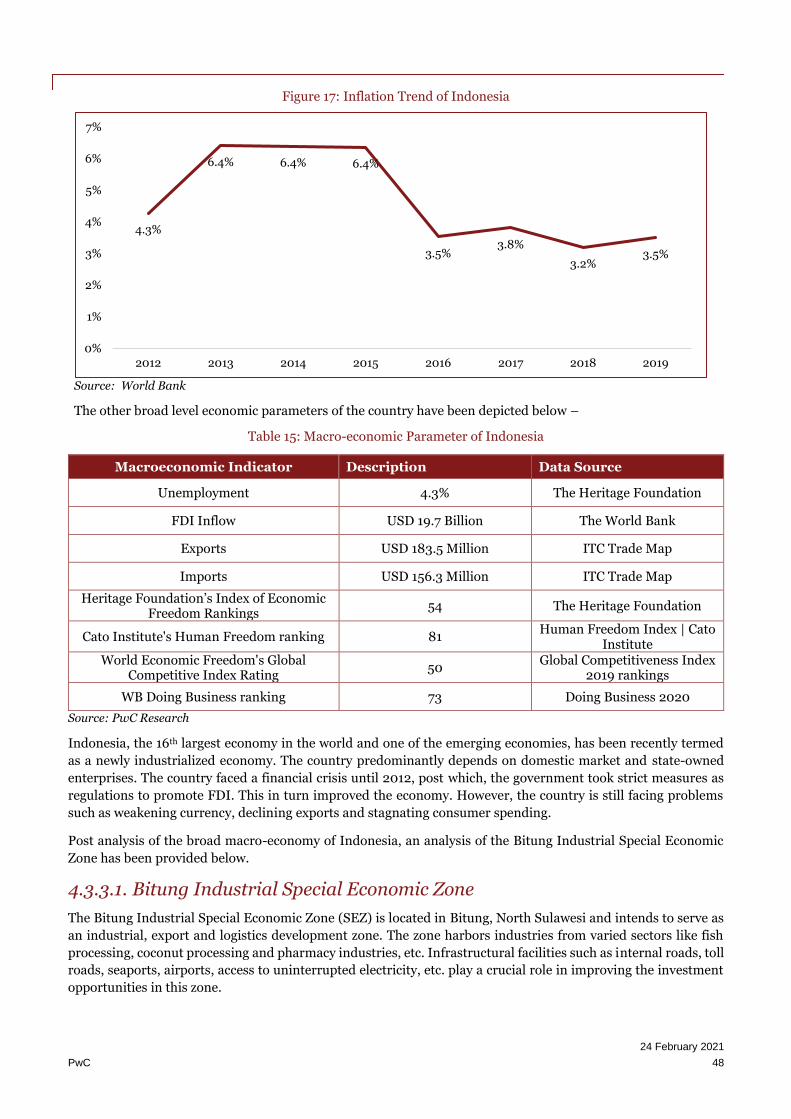
24 February 2021
PwC 48
Figure 17: Inflation Trend of Indonesia
Source: World Bank
The other broad level economic parameters of the country have been depicted below –
Table 15: Macro-economic Parameter of Indonesia
Macroeconomic Indicator Description Data Source
Unemployment 4.3% The Heritage Foundation
FDI Inflow USD 19.7 Billion The World Bank
Exports USD 183.5 Million ITC Trade Map
Imports USD 156.3 Million ITC Trade Map
Heritage Foundation’s Index of Economic Freedom Rankings
54 The Heritage Foundation
Cato Institute's Human Freedom ranking 81 Human Freedom Index | Cato
Institute World Economic Freedom's Global
Competitive Index Rating 50
Global Competitiveness Index 2019 rankings
WB Doing Business ranking 73 Doing Business 2020
Source: PwC Research
Indonesia, the 16th largest economy in the world and one of the emerging economies, has been recently termed
as a newly industrialized economy. The country predominantly depends on domestic market and state-owned
enterprises. The country faced a financial crisis until 2012, post which, the government took strict measures as
regulations to promote FDI. This in turn improved the economy. However, the country is still facing problems
such as weakening currency, declining exports and stagnating consumer spending.
Post analysis of the broad macro-economy of Indonesia, an analysis of the Bitung Industrial Special Economic
Zone has been provided below.
4.3.3.1. Bitung Industrial Special Economic Zone
The Bitung Industrial Special Economic Zone (SEZ) is located in Bitung, North Sulawesi and intends to serve as
an industrial, export and logistics development zone. The zone harbors industries from varied sectors like fish
processing, coconut processing and pharmacy industries, etc. Infrastructural facilities such as internal roads, toll
roads, seaports, airports, access to uninterrupted electricity, etc. play a crucial role in improving the investment
opportunities in this zone.
4.3%
6.4% 6.4% 6.4%
3.5%3.8%
3.2%3.5%
0%
1%
2%
3%
4%
5%
6%
7%
2012 2013 2014 2015 2016 2017 2018 2019

24 February 2021
PwC 49
Figure 18: Bitung Industrial Special Economic Zone
Source: Google Images
A detailed profiling of the park is provided below –
Table 16: Bitung Industrial Special Economic Zone
Factors Bitung Industrial Special Economic Zone
Site
Year of establishment/Start year of operations
It was established in 2014
Land Size (acres) 1,319 acres49 Number of Plots/Units/Firms There are approx. 133 plots in Bitung Industrial SEZ50
No. of Development Phases The development has been carried out over a period of time in 5 phases51
Land Lease (+length) or Sale (Taka/USD)
Varies between USD 22 – 74/m2, 52 (BDT 1868 – 6286/m2)
Pre-Built Factories (PBF) (Y/N) No, pre-built factories are provided as a part of the product offering
Lease Rate for PBF (Taka/USD) Lease rate for PBF is not applicable since PBFs are not a part of the product offering
Infrastructure/Utilities
Onsite Independent Power (Y/N and Type)
Yes, Onsite independent power capacity available and excess power supply is sourced from a 30 MW Tanjung Merah substation inside the Bitung SEZ location53
Cost of Power (Taka/USD) Base industrial power tariff in Indonesia: USD 0.075/KwH54 (BDT 6.37/KwH)
Cost of Water (Taka/USD) The cost of industrial water is approx. USD 0.0021/m3 55 (BDT 0.18/KwH)
Onsite Wastewater Treatment Plant (Y/N)
Yes, onsite wastewater treatment plant is present within the zone
49 Source: https://apecenergy.tier.org.tw/database/db/ewg51/file4/bitung_case.pptx.pdf 50 https://kek.go.id/kawasan/Bitung 51 Source: http://digilib.mercubuana.ac.id/manager/t!@file_artikel_abstrak/Isi_Artikel_191432575710.pdf 52 Source: http://iiif2019.com/wp-content/uploads/2019/03/SEZ_Land_Price.pdf 53 Source: http://kek.go.id/kawasan/Bitung 54 Source: https://www.pwc.com/id/en/publications/assets/eumpublications/utilities/Private%20Power%20Utilities%20-%20Economic%20Benefit s%20of%20Captive%20Power%20in%20Industrial%20Estates%20in%20Indonesia.pdf 55 Source: https://core.ac.uk/download/pdf/6288966.pdf
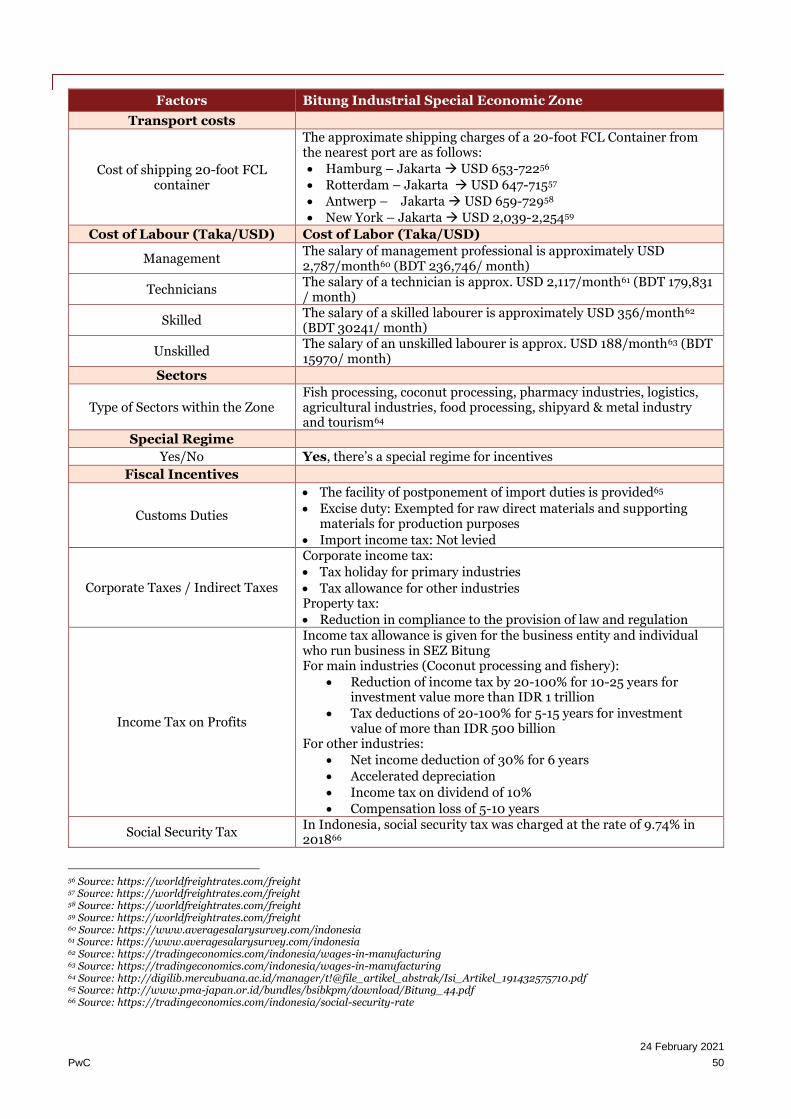
24 February 2021
PwC 50
Factors Bitung Industrial Special Economic Zone
Transport costs
Cost of shipping 20-foot FCL container
The approximate shipping charges of a 20-foot FCL Container from the nearest port are as follows:
• Hamburg – Jakarta → USD 653-72256
• Rotterdam – Jakarta → USD 647-71557
• Antwerp – Jakarta → USD 659-72958
• New York – Jakarta → USD 2,039-2,25459
Cost of Labour (Taka/USD) Cost of Labor (Taka/USD)
Management The salary of management professional is approximately USD 2,787/month60 (BDT 236,746/ month)
Technicians The salary of a technician is approx. USD 2,117/month61 (BDT 179,831 / month)
Skilled The salary of a skilled labourer is approximately USD 356/month62 (BDT 30241/ month)
Unskilled The salary of an unskilled labourer is approx. USD 188/month63 (BDT 15970/ month)
Sectors
Type of Sectors within the Zone Fish processing, coconut processing, pharmacy industries, logistics, agricultural industries, food processing, shipyard & metal industry and tourism64
Special Regime
Yes/No Yes, there’s a special regime for incentives
Fiscal Incentives
Customs Duties
• The facility of postponement of import duties is provided65
• Excise duty: Exempted for raw direct materials and supporting materials for production purposes
• Import income tax: Not levied
Corporate Taxes / Indirect Taxes
Corporate income tax:
• Tax holiday for primary industries
• Tax allowance for other industries Property tax:
• Reduction in compliance to the provision of law and regulation
Income Tax on Profits
Income tax allowance is given for the business entity and individual who run business in SEZ Bitung For main industries (Coconut processing and fishery):
• Reduction of income tax by 20-100% for 10-25 years for investment value more than IDR 1 trillion
• Tax deductions of 20-100% for 5-15 years for investment value of more than IDR 500 billion
For other industries:
• Net income deduction of 30% for 6 years
• Accelerated depreciation
• Income tax on dividend of 10%
• Compensation loss of 5-10 years
Social Security Tax In Indonesia, social security tax was charged at the rate of 9.74% in 201866
56 Source: https://worldfreightrates.com/freight 57 Source: https://worldfreightrates.com/freight 58 Source: https://worldfreightrates.com/freight 59 Source: https://worldfreightrates.com/freight 60 Source: https://www.averagesalarysurvey.com/indonesia 61 Source: https://www.averagesalarysurvey.com/indonesia 62 Source: https://tradingeconomics.com/indonesia/wages-in-manufacturing 63 Source: https://tradingeconomics.com/indonesia/wages-in-manufacturing 64 Source: http://digilib.mercubuana.ac.id/manager/t!@file_artikel_abstrak/Isi_Artikel_191432575710.pdf 65 Source: http://www.pma-japan.or.id/bundles/bsibkpm/download/Bitung_44.pdf 66 Source: https://tradingeconomics.com/indonesia/social-security-rate

24 February 2021
PwC 51
Factors Bitung Industrial Special Economic Zone
No restrictions on Money Transfers No such incentives are prevailing in EZ
Others Value-Added Tax (VAT) (VAT and PPnBM) & Luxury Sales Tax: Exemption for taxable goods
Non-Fiscal Incentives
One Stop Shop Within the Zone No, there is no one stop shop within the zone
Support Amenities
Onsite Administration office There is onsite administration office available within the zone
onsite convenience retail There is no onsite convenience retail available within the zone
Onsite Housing There is onsite housing available within the zone
Onsite Schools There are no onsite schools available within the zone
Onsite Community Facilities There are no onsite community facilities available within the zone
Onsite Security There is onsite security available within the zone
Quality of Life
International Housing (Within 15 Km)
There is no international housing facility available within 15 km radius of the EZ
International Hospital/Clinic (Within 20km)
Quality healthcare facilities like RS Budi Mulia Bitung is available in proximity to the economic zone
International Schools (Within 20 kms)
There are quality schools like Manado International School and Polaris school in close proximity to the zone
Source: PwC Research
The Bitung Industrial SEZ has attracted an investment of approximately IDR 35,190 trillion till date. With the
zone having geo-economic and geo-strategic potencies and advantages, the SEZ is expected to help in the
development of the eastern Indonesia as a logistics center. The government has also committed to develop the
regions investment climate through forming one-spot integrated service.

24 February 2021
PwC 52
4.3.4. Vietnam
Vietnam is also an emerging economy like Bangladesh and is developing from a highly agrarian to a more
industrial and market-based economy. Vietnam exceeded its GDP growth target of 6.7% in 2017 with a growth of
6.8% and between 2018 & 2019 the country has grown by a healthy 7%, majorly due to unexpected increases in
domestic demand, and strong manufacturing exports. The major exports of the country crude oil, textile and
garments, aquaculture, processed forest products etc and the country is steadily shifting its focus on more high-
value items such as electronics. The Government of Vietnam in a bid to attract foreign investments have also
developed Export Processing Zones and state of the art Industrial parks in the country and provide prudent
incentives. The GDP growth of Vietnam has been depicted below. Data used for the analysis is the latest
data point available in the respective database.
Figure 19: GDP Trend of Vietnam
Source: World Bank
Vietnam has a stable currency and a relatively low inflation rate. The average inflation rate in Vietnam was 3.54%
in 2018. The country experienced a server drop in inflation of below 1% in 2015. However, inflation in Vietnam
has stabilized again over the years and is expected to settle down at around 4% in the next few years. The following
graph elucidates the inflation trend of Vietnam. Data used for the analysis is the latest data point
available in the respective database.
155.8171.2
186.2193.24
205.3
223.8
245261.6
0
50
100
150
200
250
300
2012 2013 2014 2015 2016 2017 2018 2019
US
D B
n
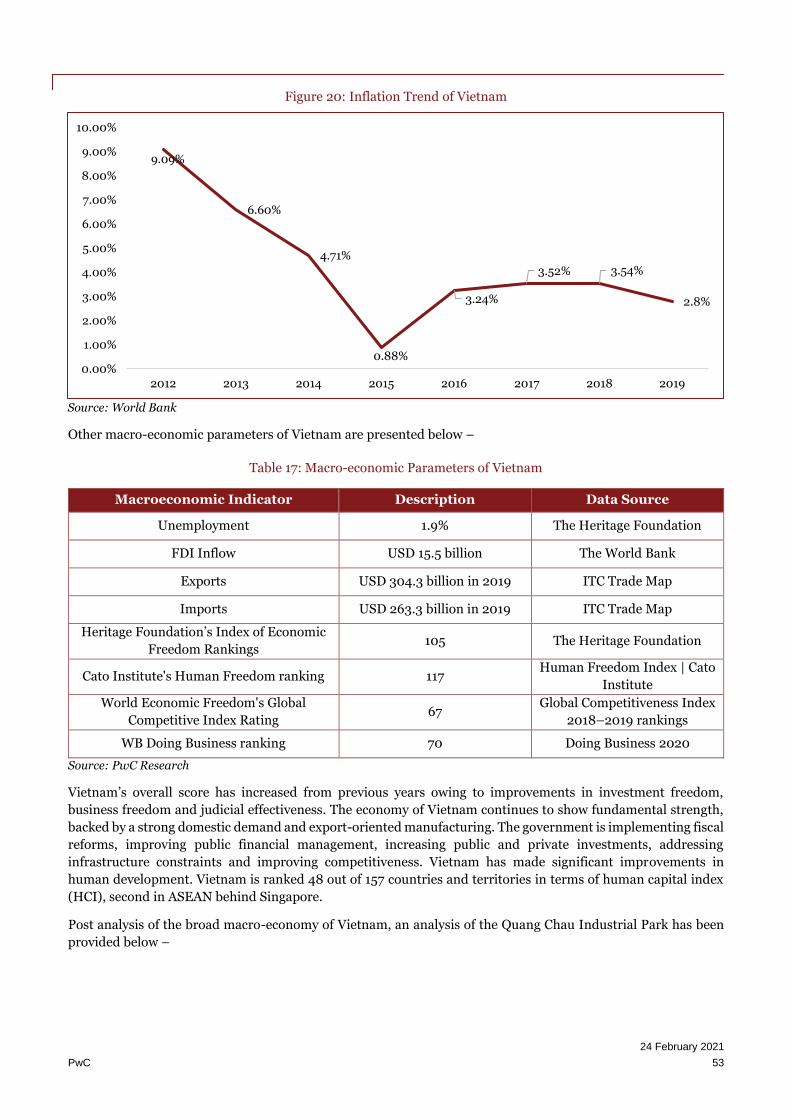
24 February 2021
PwC 53
Figure 20: Inflation Trend of Vietnam
Source: World Bank
Other macro-economic parameters of Vietnam are presented below –
Table 17: Macro-economic Parameters of Vietnam
Macroeconomic Indicator Description Data Source
Unemployment 1.9% The Heritage Foundation
FDI Inflow USD 15.5 billion The World Bank
Exports USD 304.3 billion in 2019 ITC Trade Map
Imports USD 263.3 billion in 2019 ITC Trade Map
Heritage Foundation’s Index of Economic
Freedom Rankings 105 The Heritage Foundation
Cato Institute's Human Freedom ranking 117 Human Freedom Index | Cato
Institute
World Economic Freedom's Global
Competitive Index Rating 67
Global Competitiveness Index
2018–2019 rankings
WB Doing Business ranking 70 Doing Business 2020
Source: PwC Research
Vietnam’s overall score has increased from previous years owing to improvements in investment freedom,
business freedom and judicial effectiveness. The economy of Vietnam continues to show fundamental strength,
backed by a strong domestic demand and export-oriented manufacturing. The government is implementing fiscal
reforms, improving public financial management, increasing public and private investments, addressing
infrastructure constraints and improving competitiveness. Vietnam has made significant improvements in
human development. Vietnam is ranked 48 out of 157 countries and territories in terms of human capital index
(HCI), second in ASEAN behind Singapore.
Post analysis of the broad macro-economy of Vietnam, an analysis of the Quang Chau Industrial Park has been
provided below –
9.09%
6.60%
4.71%
0.88%
3.24%
3.52% 3.54%
2.8%
0.00%
1.00%
2.00%
3.00%
4.00%
5.00%
6.00%
7.00%
8.00%
9.00%
10.00%
2012 2013 2014 2015 2016 2017 2018 2019

24 February 2021
PwC 54
4.3.4.1. Quang Chau Industrial Park
Quang Chau Industrial Park (IP), with an area of 426 ha, located in Viet Yen dist., Bac Giang province. The IP is
situated at convenient location: 33km from Hanoi, 100 km from Huu Nghi Border Gate (Lang Son), 33km from
Noi Bai airport. It is also close to the Hanoi - Quang Ninh, HCMC - Hanoi - Yunnan (China) railway lines, and
next to the Bridge River Port. With this advantage, Quang Chau industrial park acts as the goods circulation
center. The transportation system entailing the park is relatively convenient both in terms of waterways, roads
and railways. Electronic component manufacturing is one of the major manufacturing investment areas in Quang
Chau Industrial Park.
Figure 21: Quang Chau Industrial Park
Source: Google Images
A detailed profiling of the Port Klang Free Zone is provided below –
Table 18: Quang Chau Industrial Park
Factors Quang Chau Industrial Park
Site
Year of establishment/Start year of operations
It was established in 2006
Land Size (acres) 1,053 acres
Number of Plots/Units/Firms
Plots of variable sizes are available; however, the exact number of plots have not been demarcated 24 enterprises are operational within the park67
No. of Development Phases The development has been carried out over a period of time and in a single phase
Land Lease (+length) or Sale (Taka/USD)
Industrial land lease rental is USD 65/m2/whole leasing term (BDT 5,521.38/m2/ whole leasing term)68. Land is lease for 50 years
Pre-Built Factories (PBF) (Y/N) Yes, pre-built factories are provided as a part of the product offering
Lease Rate for PBF (Taka/USD)
Lease rate for PBFs are: Workshop: USD 3/m2/month (BDT 255/m2 /month)69
67 Source: https://en.bacgiang.gov.vn/detailed-news/-/asset_publisher/MVQI5B2YMPsk/content/quang-chau-industrial-park 68 Source: https://investvietnam.vn/quang-chau-lo173.html 69 Source: http://ipcn.vn/en/component/settingup/locations/d_23/119/quang-chau-industrial-zone.html?Itemid=0

24 February 2021
PwC 55
Factors Quang Chau Industrial Park
Office: USD 6/m2/month (BDT 510/m2 /month)
Infrastructure/Utilities
Onsite Independent Power (Y/N and Type)
No, onsite captive power plant is available for the zone Power is obtained from National power grid through substation 110/22KV and low voltage path to each functional area with capacity of 2x40 MVA70
Cost of Power (Taka/USD)
The cost of industrial power in the park is: Normal hour: USD 0.07/ KwH (BDT 5.95/KwH)
Low hour: USD 0.04/KwH (BDT 3.40/KwH)
Rush hour: USD 0.12/KwH (BDT 10.19/KwH)71
Cost of Water (Taka/USD) The cost of industrial water is USD 0.43/m3 (BDT 36.53 /m3) (excluding VAT)72
Onsite Wastewater Treatment Plant (Y/N)
Yes, there is Onsite Wastewater Treatment Plant73
Transport costs
Cost of shipping 20-foot FCL container74
The approximate shipping charges of a 20-foot FCL Container from
Hai Phong International Sea Port are as follows:
• Hamburg – Hai Phong → USD 1,887-2,086
• Rotterdam – Hai Phong → USD 1,867-2,066
• Antwerp – Hai Phong → USD 1,905-2,106
• New York – Hai Phong → USD 1,929-2,132
Cost of Labour (Taka/USD) 75
Management The minimum wage of a manager is USD 1,000/month (BDT 84,944/month)
Technicians The minimum wage of a technician is USD 500/month (BDT 42,472/month)
Skilled The minimum wage of a skilled labourer is USD 230/month (BDT 19,537/month)
Unskilled The minimum wage of a skilled labourer is USD 150/month (BDT 12,742/month)
Sectors
Type of Sectors within the Zone
Hi-tech electronic components, steel structures, electrification, equipment of high and medium voltage cabinets, household appliances, production of plywood boards, animal feed, Shoes, Textile & RMG
Special Regime
Yes/No Yes, there is a special regime for incentives available
Fiscal Incentives76
Customs Duties
Custom duty exemption for the following:
• For export processing enterprises (EPE)
70 Source: http://ipcn.vn/en/component/settingup/locations/d_23/119/quang-chau-industrial-zone.html?Itemid=0 71 Source: https://investvietnam.vn/quang-chau-lo173.html 72 Source: https://investvietnam.vn/quang-chau-lo173.html / 73 Source: https://investvietnam.vn/quang-chau-lo173.html 74 Source: https://worldfreightrates.com/freight 75 Source: https://investvietnam.vn/quang-chau-lo173.html 76 Source: https://vietnam-inv.com/en/iparks/quang-chau-industrial-park/
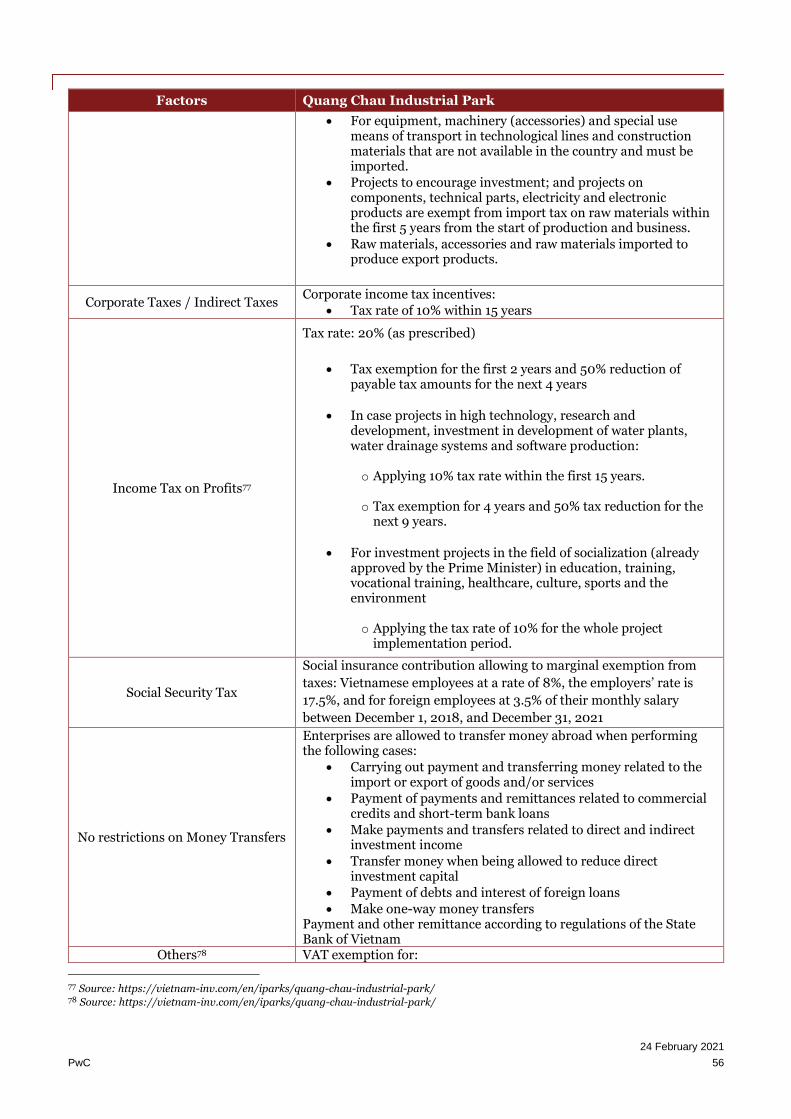
24 February 2021
PwC 56
Factors Quang Chau Industrial Park
• For equipment, machinery (accessories) and special use means of transport in technological lines and construction materials that are not available in the country and must be imported.
• Projects to encourage investment; and projects on components, technical parts, electricity and electronic products are exempt from import tax on raw materials within the first 5 years from the start of production and business.
• Raw materials, accessories and raw materials imported to produce export products.
Corporate Taxes / Indirect Taxes Corporate income tax incentives:
• Tax rate of 10% within 15 years
Income Tax on Profits77
Tax rate: 20% (as prescribed)
• Tax exemption for the first 2 years and 50% reduction of payable tax amounts for the next 4 years
• In case projects in high technology, research and development, investment in development of water plants, water drainage systems and software production:
o Applying 10% tax rate within the first 15 years. o Tax exemption for 4 years and 50% tax reduction for the
next 9 years.
• For investment projects in the field of socialization (already approved by the Prime Minister) in education, training, vocational training, healthcare, culture, sports and the environment
o Applying the tax rate of 10% for the whole project
implementation period.
Social Security Tax
Social insurance contribution allowing to marginal exemption from
taxes: Vietnamese employees at a rate of 8%, the employers’ rate is
17.5%, and for foreign employees at 3.5% of their monthly salary
between December 1, 2018, and December 31, 2021
No restrictions on Money Transfers
Enterprises are allowed to transfer money abroad when performing the following cases:
• Carrying out payment and transferring money related to the import or export of goods and/or services
• Payment of payments and remittances related to commercial credits and short-term bank loans
• Make payments and transfers related to direct and indirect investment income
• Transfer money when being allowed to reduce direct investment capital
• Payment of debts and interest of foreign loans
• Make one-way money transfers Payment and other remittance according to regulations of the State Bank of Vietnam
Others78 VAT exemption for:
77 Source: https://vietnam-inv.com/en/iparks/quang-chau-industrial-park/ 78 Source: https://vietnam-inv.com/en/iparks/quang-chau-industrial-park/

24 February 2021
PwC 57
Factors Quang Chau Industrial Park
• Export processing enterprises (EPE)
• Equipment, machinery and special equipment used in technological lines that are not domestically produced and must be imported.
Non-Fiscal Incentives
One Stop Shop Within the Zone Yes, there is one stop shop within the zone
Support Amenities
Onsite Administration office There is onsite administration office available within the park
Onsite Convenience Retail There is no onsite convenience retail available within the park
Onsite Housing There is no onsite housing available within the park
Onsite Schools There are no onsite schools available within the park
Onsite Community Facilities There are onsite community facilities available within the park
Onsite Security There is onsite security available within the park
Quality of Life
International Housing (Within 15 Km)
There are quality housing facilities available near the park in Bac Giang city
International Hospital/Clinic (Within 20km)
There are quality hospitals in vicinity of the park such as International Hospital Hanoi-Bac Giang, Bac Giang Province General Hospital etc.
International Schools (Within 20 kms)
International schools are available in the area such as Nhat Ahn Language International etc.
Source: PwC Analysis
Quang Chau Industrial Park offers extensive care for professionals working in the industrial park as well as
complete production line from transporting raw materials, fuel for the storage of goods, and export and import
procedures. In order to simplify administrative procedures, Quang Chau Industrial Park is helped in business
registration, registration of investment by the Department of Planning - Investment and Bac Giang’s Industrial
Park Management Board. Investors are estimated to save significant time in administrative procedure.
Constructed to meet international standards, Quang Chau Industrial Park has become the first choice of investors
at home and abroad, especially in clean technology, high-tech, precision engineering, electronics, refrigeration,
automation, automobile assembly etc.
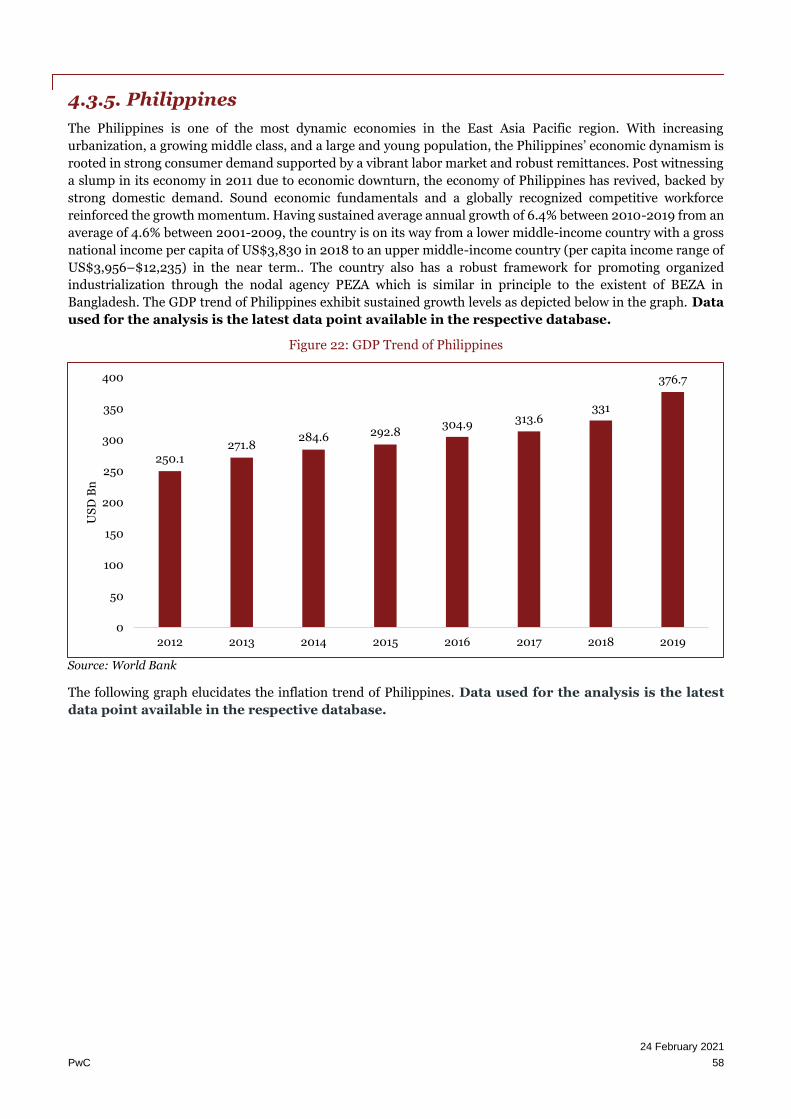
24 February 2021
PwC 58
4.3.5. Philippines
The Philippines is one of the most dynamic economies in the East Asia Pacific region. With increasing
urbanization, a growing middle class, and a large and young population, the Philippines’ economic dynamism is
rooted in strong consumer demand supported by a vibrant labor market and robust remittances. Post witnessing
a slump in its economy in 2011 due to economic downturn, the economy of Philippines has revived, backed by
strong domestic demand. Sound economic fundamentals and a globally recognized competitive workforce
reinforced the growth momentum. Having sustained average annual growth of 6.4% between 2010-2019 from an
average of 4.6% between 2001-2009, the country is on its way from a lower middle-income country with a gross
national income per capita of US$3,830 in 2018 to an upper middle-income country (per capita income range of
US$3,956–$12,235) in the near term.. The country also has a robust framework for promoting organized
industrialization through the nodal agency PEZA which is similar in principle to the existent of BEZA in
Bangladesh. The GDP trend of Philippines exhibit sustained growth levels as depicted below in the graph. Data
used for the analysis is the latest data point available in the respective database.
Figure 22: GDP Trend of Philippines
Source: World Bank
The following graph elucidates the inflation trend of Philippines. Data used for the analysis is the latest
data point available in the respective database.
250.1271.8
284.6 292.8304.9 313.6
331
376.7
0
50
100
150
200
250
300
350
400
2012 2013 2014 2015 2016 2017 2018 2019
US
D B
n

24 February 2021
PwC 59
Figure 23: Inflation Trend of Philippines
Source: World Bank
Other macro-economic parameters of Philippines are presented below –
Table 19: Macro-economic Parameter of Philippines
Macroeconomic Indicator Description Data Source
Unemployment 2.5% The Heritage Foundation
FDI Inflow USD 9.8 billion The World Bank
Exports USD 70.3 billion in 2019 ITC Trade Map
Imports USD 112.9 billion in 2019 ITC Trade Map
Heritage Foundation’s Index of Economic
Freedom Rankings 7079 The Heritage Foundation
Cato Institute's Human Freedom ranking 76 Human Freedom Index | Cato
Institute
World Economic Freedom's Global
Competitive Index Rating 64
Global Competitiveness Index
2018–2019 rankings
WB Doing Business ranking 95 Doing Business 2020
Source: PwC Research
Although real economic growth slowed in 2019 but was still strong with 6.0% year-on-year. Growth is now
projected to significantly decelerate this year due to the impact of the COVID-19 outbreak, through the slowdown
in trade, investment, tourism, remittances, and social distancing—including the associated community
quarantine. Nevertheless, economic growth is expected to rebound gradually in 2021-2022 as global conditions
improve, and with more robust domestic activity bolstered by the public investment momentum and a boost from
2022 election-related spending.
Post analysis of the broad macro-economy of Philippines, an analysis of Free port of Bataan has been provided
below –
79 Source: https://www.heritage.org/index/ranking
3.0%2.6%
3.6%
0.7%
1.3%
2.9%
5.2%
4.0%
0.0%
1.0%
2.0%
3.0%
4.0%
5.0%
6.0%
2012 2013 2014 2015 2016 2017 2018 2019

24 February 2021
PwC 60
4.3.5.1. Free Port of Bataan
The Freeport of Bataan is located within the Municipality of Mariveles in the Province of Bataan in Philippines.
The Freeport is governed by the he Authority of the Freeport Area of Bataan (AFAB), a government-owned and
controlled corporation under the Office of the President. The region became the first export processing zone of
Philippines, however it witnessed limited success in the initial years of its formation. In order to augment the
Bataan Economic Zone’s investment potential and allow the zone to fulfill its original mandate to become a
catalyst for progress and development in the region bill for the conversion of then BEZ into a Freeport was
drafted. Currently, Freeport of Bataan is a hub for quality brand of bags, garments and apparels, shoes, among
other industrial products. The region is equipped with a natural deep-sea port and rich pool of labor in the
vicinity.
Figure 24: Freeport of Bataan
Source: Google Images
A detailed profiling of the Freeport of Bataan is provided below -
Table 20: Freeport Area of Bataan
Factors Freeport Area of Bataan
Site
Year of establishment/Start year of operations
It started its operations in 1972as an export processing zone; it was rechristened into a freeport area in 2009
Land Size (acres) 4,201 acres
Number of Plots/Units/Firms There are approximately 128 companies who have manufacturing units within the economic zone
No. of Development Phases The zone has been developed a period of time, in a single phase
Land Lease (+length) or Sale (Taka/USD)
The lease rental for industrial land is USD 0.37 /m2/month80 (BDT 31.44/m2/month)
Pre-Built Factories (PBF) (Y/N) Yes, there are Pre-Built Factories (PBF) available for the tenants
Lease Rate for PBF (Taka/USD) • Entire Floor: USD 3.18/m2/month (BDT 270.24/ m2/month)
• Half Floor: USD 3.6/m2/month (BDT 306/ m2/month)
80http://afab.gov.ph/
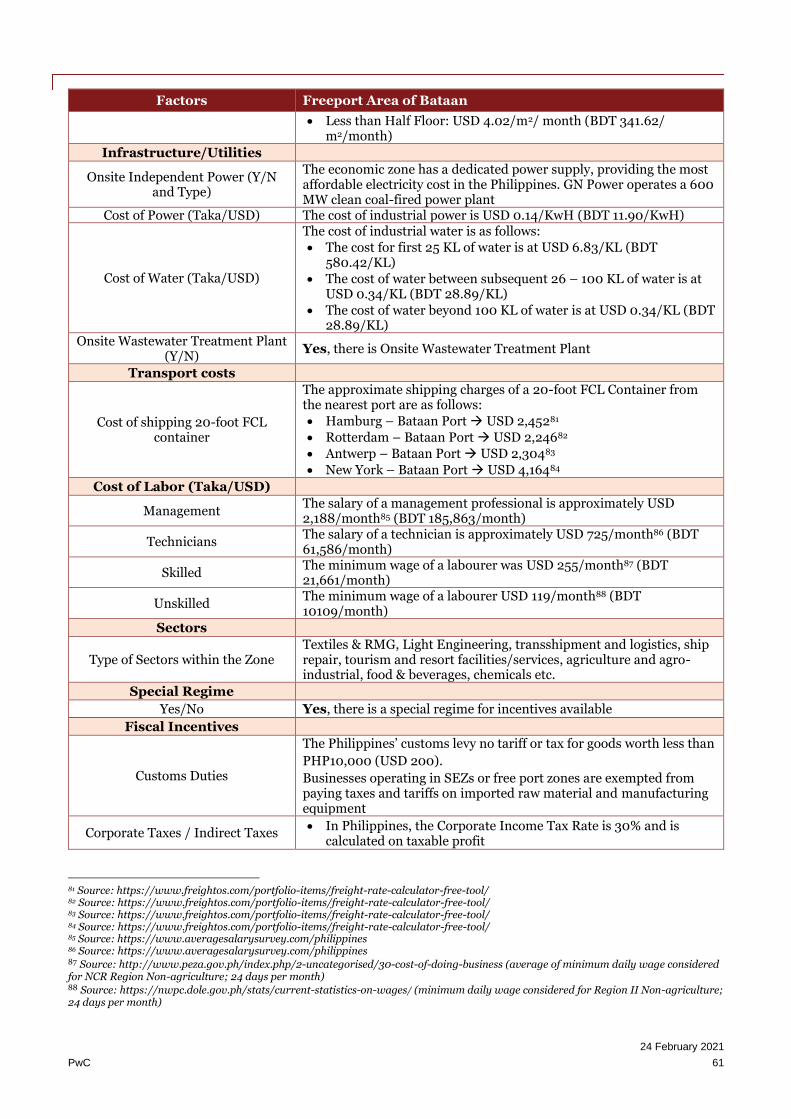
24 February 2021
PwC 61
Factors Freeport Area of Bataan
• Less than Half Floor: USD 4.02/m2/ month (BDT 341.62/ m2/month)
Infrastructure/Utilities
Onsite Independent Power (Y/N and Type)
The economic zone has a dedicated power supply, providing the most affordable electricity cost in the Philippines. GN Power operates a 600 MW clean coal-fired power plant
Cost of Power (Taka/USD) The cost of industrial power is USD 0.14/KwH (BDT 11.90/KwH)
Cost of Water (Taka/USD)
The cost of industrial water is as follows:
• The cost for first 25 KL of water is at USD 6.83/KL (BDT 580.42/KL)
• The cost of water between subsequent 26 – 100 KL of water is at USD 0.34/KL (BDT 28.89/KL)
• The cost of water beyond 100 KL of water is at USD 0.34/KL (BDT 28.89/KL)
Onsite Wastewater Treatment Plant (Y/N)
Yes, there is Onsite Wastewater Treatment Plant
Transport costs
Cost of shipping 20-foot FCL container
The approximate shipping charges of a 20-foot FCL Container from the nearest port are as follows:
• Hamburg – Bataan Port → USD 2,45281
• Rotterdam – Bataan Port → USD 2,24682
• Antwerp – Bataan Port → USD 2,30483
• New York – Bataan Port → USD 4,16484
Cost of Labor (Taka/USD)
Management The salary of a management professional is approximately USD 2,188/month85 (BDT 185,863/month)
Technicians The salary of a technician is approximately USD 725/month86 (BDT 61,586/month)
Skilled The minimum wage of a labourer was USD 255/month87 (BDT 21,661/month)
Unskilled The minimum wage of a labourer USD 119/month88 (BDT 10109/month)
Sectors
Type of Sectors within the Zone Textiles & RMG, Light Engineering, transshipment and logistics, ship repair, tourism and resort facilities/services, agriculture and agro-industrial, food & beverages, chemicals etc.
Special Regime
Yes/No Yes, there is a special regime for incentives available
Fiscal Incentives
Customs Duties
The Philippines’ customs levy no tariff or tax for goods worth less than
PHP10,000 (USD 200).
Businesses operating in SEZs or free port zones are exempted from paying taxes and tariffs on imported raw material and manufacturing equipment
Corporate Taxes / Indirect Taxes • In Philippines, the Corporate Income Tax Rate is 30% and is
calculated on taxable profit
81 Source: https://www.freightos.com/portfolio-items/freight-rate-calculator-free-tool/ 82 Source: https://www.freightos.com/portfolio-items/freight-rate-calculator-free-tool/ 83 Source: https://www.freightos.com/portfolio-items/freight-rate-calculator-free-tool/ 84 Source: https://www.freightos.com/portfolio-items/freight-rate-calculator-free-tool/ 85 Source: https://www.averagesalarysurvey.com/philippines 86 Source: https://www.averagesalarysurvey.com/philippines 87 Source: http://www.peza.gov.ph/index.php/2-uncategorised/30-cost-of-doing-business (average of minimum daily wage considered for NCR Region Non-agriculture; 24 days per month) 88 Source: https://nwpc.dole.gov.ph/stats/current-statistics-on-wages/ (minimum daily wage considered for Region II Non-agriculture; 24 days per month)
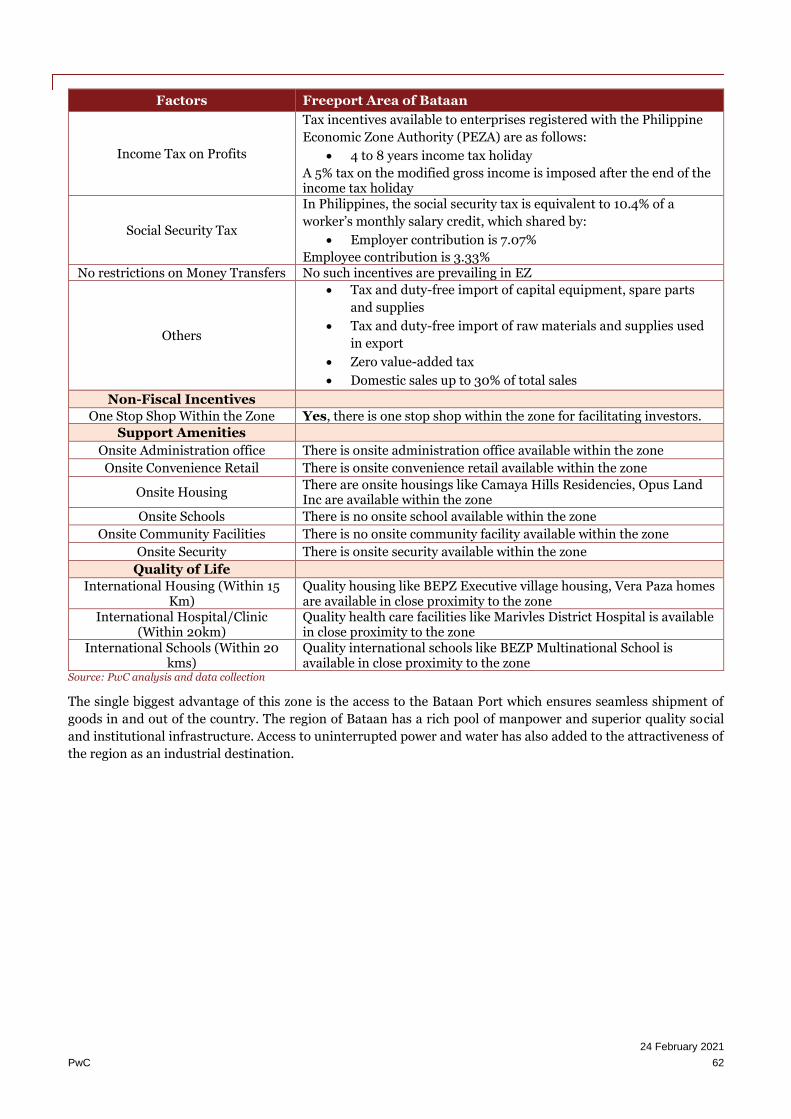
24 February 2021
PwC 62
Factors Freeport Area of Bataan
Income Tax on Profits
Tax incentives available to enterprises registered with the Philippine
Economic Zone Authority (PEZA) are as follows:
• 4 to 8 years income tax holiday
A 5% tax on the modified gross income is imposed after the end of the income tax holiday
Social Security Tax
In Philippines, the social security tax is equivalent to 10.4% of a
worker’s monthly salary credit, which shared by:
• Employer contribution is 7.07%
Employee contribution is 3.33% No restrictions on Money Transfers No such incentives are prevailing in EZ
Others
• Tax and duty-free import of capital equipment, spare parts
and supplies
• Tax and duty-free import of raw materials and supplies used
in export
• Zero value-added tax
• Domestic sales up to 30% of total sales
Non-Fiscal Incentives
One Stop Shop Within the Zone Yes, there is one stop shop within the zone for facilitating investors.
Support Amenities
Onsite Administration office There is onsite administration office available within the zone
Onsite Convenience Retail There is onsite convenience retail available within the zone
Onsite Housing There are onsite housings like Camaya Hills Residencies, Opus Land Inc are available within the zone
Onsite Schools There is no onsite school available within the zone
Onsite Community Facilities There is no onsite community facility available within the zone
Onsite Security There is onsite security available within the zone
Quality of Life
International Housing (Within 15 Km)
Quality housing like BEPZ Executive village housing, Vera Paza homes are available in close proximity to the zone
International Hospital/Clinic (Within 20km)
Quality health care facilities like Marivles District Hospital is available in close proximity to the zone
International Schools (Within 20 kms)
Quality international schools like BEZP Multinational School is available in close proximity to the zone
Source: PwC analysis and data collection
The single biggest advantage of this zone is the access to the Bataan Port which ensures seamless shipment of
goods in and out of the country. The region of Bataan has a rich pool of manpower and superior quality social
and institutional infrastructure. Access to uninterrupted power and water has also added to the attractiveness of
the region as an industrial destination.

24 February 2021
PwC 63
4.4. Comparative Analysis
This section tries to capture a comparative analysis of specific comparative parameters between the EZs
elaborated above and the proposed EZ in Sitakundo. Tables below provide an insight into macro-economic
performance indicators of the countries which are home to the industrial parks shortlisted as benchmarking
options to the proposed EZ in Sitakundo, Bangladesh. This comparison is important from the perspective of both
local and international investors as they often take into consideration the macro-economic performance of
countries to shortlist investment destinations in order to minimize risks to their investments and maximize their
returns.
Table 21: Macro-Economic indicators (2019)
Country GDP (USD
billion)
GDP
annual
growth
rate (%)
GDP per
capita
(USD)
Inflation
Rate (%)
Unemployment
Rate (%)
Population
(million)
India 2,935.6 6.1 2,036.2 3.5 2.6 1,334.2
Bangladesh 317.5 7.8 1,744.5 5.6 4.3 164.9
Ghana 66.0 6.2 2,205.8 11.1 6.7 29.6
Indonesia 1,206.6 4.8 3,870.6 3.5 4.3 264.2
Philippines 376.7 6.0 3,103.6 4.0 2.5 106.6
Vietnam 261.6 6.8 2,551.1 2.8 1.9 94.6
Source: World Economic Forum
Table 22: FDI indicators 2018
Country FDI for 2018 (USD million)
India 42,117.5
Bangladesh 2,940.2
Ghana 66.0
Indonesia 1,206.6
Philippines 9,832.3
Vietnam 15,500.0
Source: World Bank
Table 23: Heritage Foundation Score 2020
Country Heritage
Foundation
Rating (global)
Individual
country
score
Score
change
Freedom group
ranking
Competitor’s
ranking
India 120 56.5 +1.3 Mostly unfree 5
Bangladesh 122 56.4 +0.8 Mostly unfree 6
Ghana 104 59.4 +1.9 Mostly unfree 3
Indonesia 54 67.2 +1.4 Moderately free 1
Philippines 70 64.5 +0.7 Moderately free 2
Vietnam 105 58.8 +3.5 Mostly unfree 4
Source: The Heritage Foundation
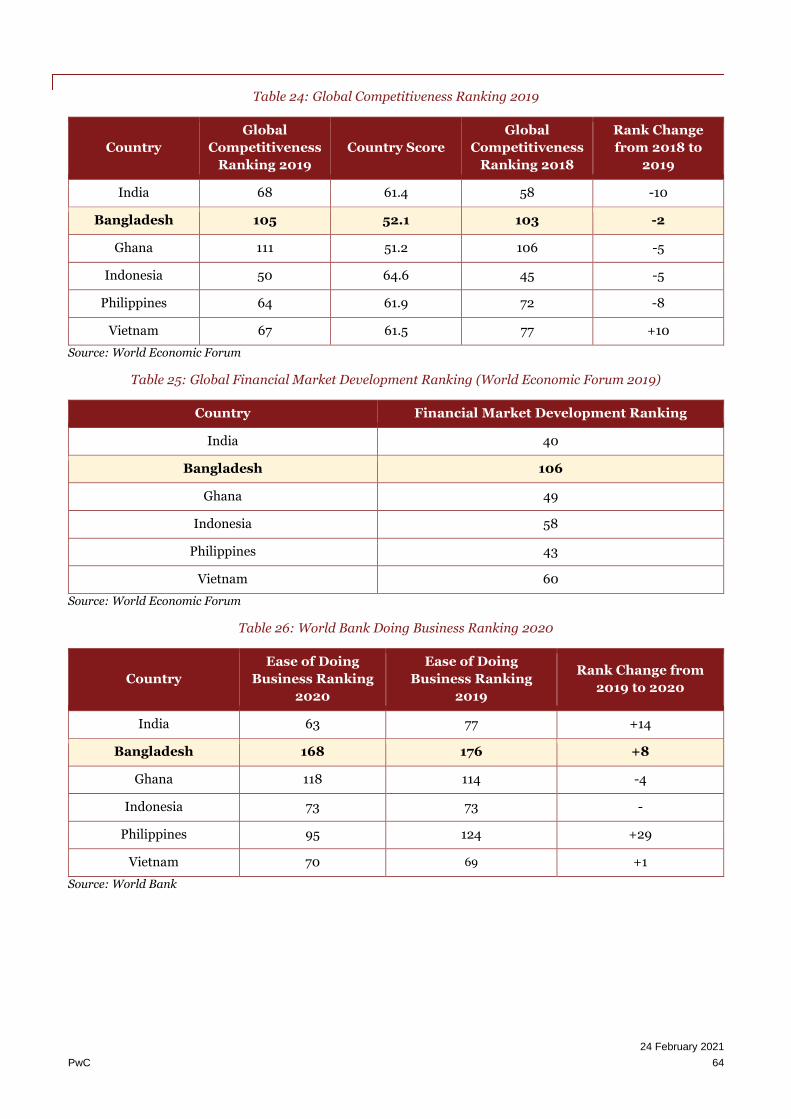
24 February 2021
PwC 64
Table 24: Global Competitiveness Ranking 2019
Country
Global
Competitiveness
Ranking 2019
Country Score
Global
Competitiveness
Ranking 2018
Rank Change
from 2018 to
2019
India 68 61.4 58 -10
Bangladesh 105 52.1 103 -2
Ghana 111 51.2 106 -5
Indonesia 50 64.6 45 -5
Philippines 64 61.9 72 -8
Vietnam 67 61.5 77 +10
Source: World Economic Forum
Table 25: Global Financial Market Development Ranking (World Economic Forum 2019)
Country Financial Market Development Ranking
India 40
Bangladesh 106
Ghana 49
Indonesia 58
Philippines 43
Vietnam 60
Source: World Economic Forum
Table 26: World Bank Doing Business Ranking 2020
Country
Ease of Doing
Business Ranking
2020
Ease of Doing
Business Ranking
2019
Rank Change from
2019 to 2020
India 63 77 +14
Bangladesh 168 176 +8
Ghana 118 114 -4
Indonesia 73 73 -
Philippines 95 124 +29
Vietnam 70 69 +1
Source: World Bank
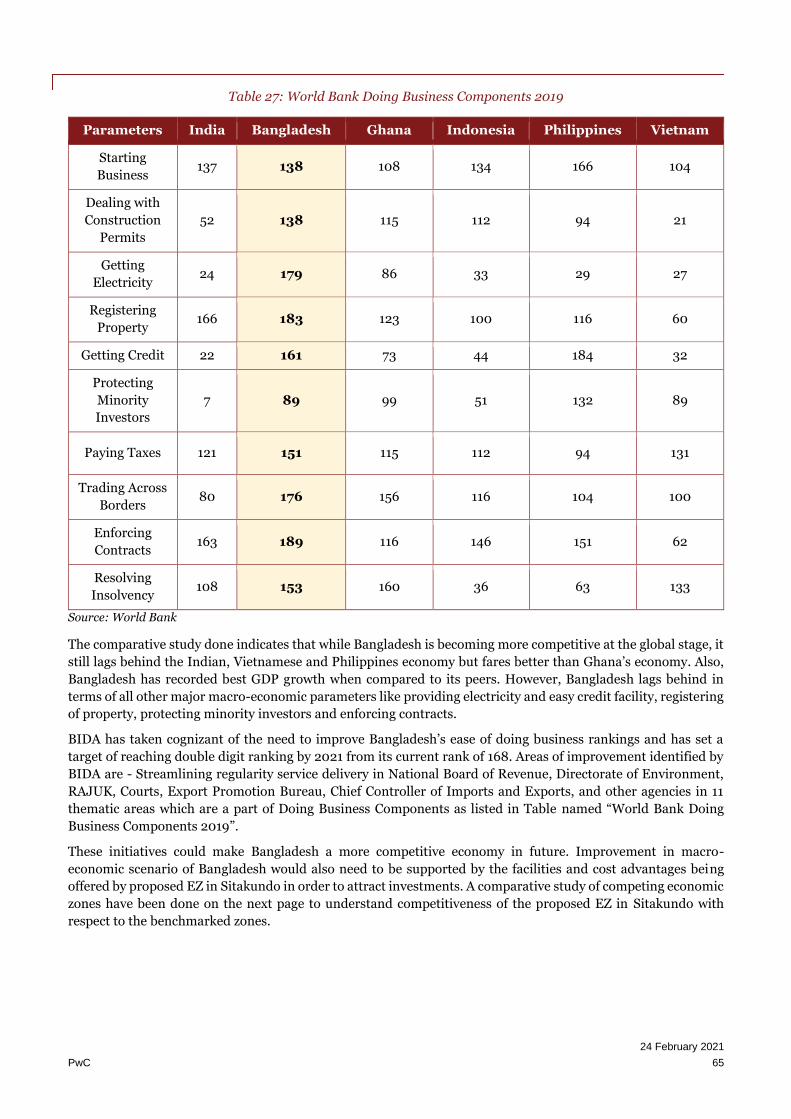
24 February 2021
PwC 65
Table 27: World Bank Doing Business Components 2019
Parameters India Bangladesh Ghana Indonesia Philippines Vietnam
Starting
Business 137 138 108 134 166 104
Dealing with
Construction
Permits
52 138 115 112 94 21
Getting
Electricity 24 179 86 33 29 27
Registering
Property 166 183 123 100 116 60
Getting Credit 22 161 73 44 184 32
Protecting
Minority
Investors
7 89 99 51 132 89
Paying Taxes 121 151 115 112 94 131
Trading Across
Borders 80 176 156 116 104 100
Enforcing
Contracts 163 189 116 146 151 62
Resolving
Insolvency 108 153 160 36 63 133
Source: World Bank
The comparative study done indicates that while Bangladesh is becoming more competitive at the global stage, it
still lags behind the Indian, Vietnamese and Philippines economy but fares better than Ghana’s economy. Also,
Bangladesh has recorded best GDP growth when compared to its peers. However, Bangladesh lags behind in
terms of all other major macro-economic parameters like providing electricity and easy credit facility, registering
of property, protecting minority investors and enforcing contracts.
BIDA has taken cognizant of the need to improve Bangladesh’s ease of doing business rankings and has set a
target of reaching double digit ranking by 2021 from its current rank of 168. Areas of improvement identified by
BIDA are - Streamlining regularity service delivery in National Board of Revenue, Directorate of Environment,
RAJUK, Courts, Export Promotion Bureau, Chief Controller of Imports and Exports, and other agencies in 11
thematic areas which are a part of Doing Business Components as listed in Table named “World Bank Doing
Business Components 2019”.
These initiatives could make Bangladesh a more competitive economy in future. Improvement in macro-
economic scenario of Bangladesh would also need to be supported by the facilities and cost advantages being
offered by proposed EZ in Sitakundo in order to attract investments. A comparative study of competing economic
zones have been done on the next page to understand competitiveness of the proposed EZ in Sitakundo with
respect to the benchmarked zones.

24 February 2021
PwC 66
Table 28: Comparative Analysis
Parameters Sitakundo EZ Dahej SEZ
(India)
Tema Export
Processing Zone
(Ghana)
Bitung Industrial
SEZ (Indonesia)
Quang Chau
Industrial Park
(Vietnam)
Free Port of
Bataan
(Philippines)
Sri City SEZ
(India)
Site
Land Size (acres) 2369 acres 4,156 acres 1,200 acres 1,319 acres 1,053 acres 4,201 acres 2,700 acres
Business Model PPP
(Recommended) Government Private Government Private Government Private
Number of
Plots/Units/Firms
There are
provisions of
1,480 plots as per
the Master Plan
Plot sizes from 5000 sq.m and
above are available in SEZ
Currently, over 54
units are
operational
within the special
economic zone.
Plots of variable sizes are available; however, the exact
number of plots have not been demarcated
Currently, 19
tenants are
operational in the
zone
There are approx.
133 plots in Bitung
Industrial SEZ89
Plots of variable sizes are available; however, the exact
number of plots have not been demarcated
24 enterprises are
operational within
the park
There are
approximately 128
companies who
have manufacturing
units within the
economic zone
Plots of variable sizes
are available;
however, the exact
number of plots have
not been demarcated
Over 185 industrial
units are operational
in the zone
No. of
Development
Phases
The project is
planned to be
developed in Five
phases
The development has been carried out over a period
of time in two phases
The park has been developed in
various phases over a period of time
The development
has been carried out
over a period of time
in 5 phases90
The development has been carried out over a period of time and in a
single phase
The zone has been
developed a period
of time, in a single
phase
The development has
been carried out over
a period of time but
in two phases
89 https://kek.go.id/kawasan/Bitung 90 Source: http://digilib.mercubuana.ac.id/manager/t!@file_artikel_abstrak/Isi_Artikel_191432575710.pdf

24 February 2021
PwC 67
Parameters Sitakundo EZ Dahej SEZ
(India)
Tema Export
Processing Zone
(Ghana)
Bitung Industrial
SEZ (Indonesia)
Quang Chau
Industrial Park
(Vietnam)
Free Port of
Bataan
(Philippines)
Sri City SEZ
(India)
Land Lease
(+length) or Sale
(Taka/USD)
Land lease
rental is BDT
30/ sq. ft. per
annum (for 50
years) when
BEZA develops
the project and
BDT 35/sq. ft.
per annum (for
50 years) when
PPP developer
develops the
project
The land is offered at rate of
Rs. 1650/- per sq. mt. for upfront
payment 100% of land cost in
processing area
The land is offered at rate of
Rs. 1980/- per sq. mt. for upfront
payment 100% of land cost in non-processing area
Industrial land is provided on lease in
Africa is USD 30,000 to USD
150,000/acre/year or approx. USD
0.625/m2/month (BDT
53.09/m2/month)
Varies between USD 22 – 74/m2, 91 (BDT
1868 – 6286/m2)
Industrial land lease rental is USD
65/m2/whole leasing term (BDT
5,521.38/m2/ whole leasing term). Land is
leased for 50 years
The lease rental for
industrial land is
USD 0.37
/m2/month92 (BDT
31.44/m2/month)
One-time upfront
land premium of
USD 38.50 / sq. m
(BDT 3,262,55/ sq.
m) is applicable
Pre-Built
Factories (PBF)
(Y/N)
PFB is planned
only in case of
PPP developer
developing the
project
No, the zone does not have Pre-Built Factories as part
of product offering
No, the zone does not have Pre-Built Factories as part of
product offering
No, pre-built factories are
provided as a part of the product offering
Yes, pre-built factories are
provided as a part of the product
offering
Yes, there are Pre-
Built Factories
(PBF) available for
the tenants
The zone does not
have Pre-Built
Factories as part of
product offering
Lease Rate for
PBF (Taka/USD)
Land lease
rental for PFB is
BDT 300/ sq. ft.
per annum
There is no lease rate for PBF since
PBF are not provided as a part
of the product mix
There is no lease rate for PBF since
PBF are not provided as a part of the product mix
Lease rate for PBF is not applicable since PBFs are not a part
of the product offering
Lease rate for PBFs are:
• Workshop: USD 3/m2/month (BDT 255/m2 /month)93
• Entire Floor: USD 3.18/m2/month (BDT 270.24/ m2/month)
• Half Floor: USD 3.6/m2/month
There is no lease rate
for PBF since PBF
are not provided as a
part of the product
mix
91 Source: http://iiif2019.com/wp-content/uploads/2019/03/SEZ_Land_Price.pdf 92http://afab.gov.ph/ 93 Source: http://ipcn.vn/en/component/settingup/locations/d_23/119/quang-chau-industrial-zone.html?Itemid=0

24 February 2021
PwC 68
Parameters Sitakundo EZ Dahej SEZ
(India)
Tema Export
Processing Zone
(Ghana)
Bitung Industrial
SEZ (Indonesia)
Quang Chau
Industrial Park
(Vietnam)
Free Port of
Bataan
(Philippines)
Sri City SEZ
(India)
Office: USD 6/m2/month (BDT 510/m2
/month)
(BDT 306/ m2/month)
Less than Half
Floor: USD
4.02/m2/ month
(BDT 341.62/
m2/month)
Infrastructure/ Utilities
Onsite
Independent
Power (Y/N and
Type)
Yes, there is
provision for
onsite power
distribution
through internal
sub-stations of
33/11 KV and
132/33 KV
There is an onsite captive power
plant available for the special
economic zone
At the site, there is
no independent
power provider.
Power for industrial
purpose is provided
by national
electricity grid
Yes, Onsite
independent power
capacity available
and excess power
supply is sourced
from a 30 MW
Tanjung Merah
substation inside
the Bitung SEZ
location94
No, onsite captive
power plant is
available for the
park
Power is obtained
from National
power grid
through
substation
110/22KV and low
voltage path to
each functional
area with capacity
of 2x40 MVA
The economic zone
has a dedicated
power supply,
providing the most
affordable electricity
cost in the
Philippines. GN
Power operates a
600 MW clean coal-
fired power plant
There is no onsite
captive power plant
available for the
special economic
zone
94 Source: http://kek.go.id/kawasan/Bitung

24 February 2021
PwC 69
Parameters Sitakundo EZ Dahej SEZ
(India)
Tema Export
Processing Zone
(Ghana)
Bitung Industrial
SEZ (Indonesia)
Quang Chau
Industrial Park
(Vietnam)
Free Port of
Bataan
(Philippines)
Sri City SEZ
(India)
Cost of Power
(Taka/USD)
Cost of power is
BDT 8.97/ KwH
Fixed charges of USD 0.08 / KwH (BDT 6.80/ KwH)
• 0-300 units=USD 0.00199/KwH95 (BDT 0.17/KwH)
• 301-600 units= USD 0.00212/KwH96 (BDT 0.18/KwH)
601+ units= USD
0.00335/KwH97
(BDT 0.28/KwH)
Base industrial
power tariff in
Indonesia: USD
0.075/KwH98 (BDT
6.37/KwH)
The cost of
industrial power
in the park is:
• Normal hour: USD 0.07/ KwH (BDT 5.95/KwH)
• Low hour: USD 0.04/KwH (BDT 3.40/KwH)
Rush hour: USD
0.12/KwH (BDT
10.19/KwH)99
The cost of
industrial power is
USD 0.14/KwH
(BDT 11.90/KwH)
Fixed charges of USD
0.73 / Kw / month
(BDT 61.86 /KwH)
and additional
energy charges of
USD 0.088 / KwH
(BDT 7.46/KwH) of
energy consumed
Cost of Water
(Taka/USD)
Cost of water is
BDT 37.21/ m3
The charge of industrial water is
USD 0.76 / KL (BDT 64.56/KL)
• The cost of industrial water is approx. USD 0.02074/m3
(BDT 1.76/ m3)
The cost of
industrial water is
approx. USD
0.0021/m3 100 (BDT
0.18/KwH)
The cost of
industrial water is
USD 0.43/m3
(BDT 36.53 /m3)
(excluding VAT)101
The cost of industrial water is
as follows:
• The cost for first 25 KL of water
is at USD
The charge of
industrial water is
USD 0.80 / KL (BDT
67.79/ KL)
95 Note: As of December 31, 2018, exchange rate 0.00002 96 Note: As of December 31, 2018, exchange rate 0.00002 97 Note: As of December 31, 2018, exchange rate 0.00002 98 Source: https://www.pwc.com/id/en/publications/assets/eumpublications/utilities/Private%20Power%20Utilities%20-%20Economic%20Benefit s%20of%20Captive%20Power%20in%20Industrial%20Estates%20in%20Indonesia.pdf 99 Source: https://investvietnam.vn/quang-chau-lo173.html 100 Source: https://core.ac.uk/download/pdf/6288966.pdf 101 Source: https://investvietnam.vn/quang-chau-lo173.html /

24 February 2021
PwC 70
Parameters Sitakundo EZ Dahej SEZ
(India)
Tema Export
Processing Zone
(Ghana)
Bitung Industrial
SEZ (Indonesia)
Quang Chau
Industrial Park
(Vietnam)
Free Port of
Bataan
(Philippines)
Sri City SEZ
(India)
6.83/KL (BDT 580.42/KL)
• The cost of water between
subsequent 26 – 100 KL of water
is at USD 0.34/KL (BDT
28.89/KL) The cost of water
beyond 100 KL of
water is at USD
0.34/KL (BDT
28.89/KL)
Onsite
Wastewater
Treatment Plant
(Y/N)
Yes, there is
provision for
wastewater
treatment plan
in the Master
Plan of the
proposed EZ
There is onsite wastewater
treatment plant available within
the special economic zone
There is no onsite water treatment plant since industries within the zone typically have their own treatment plant
Yes, onsite
wastewater
treatment plant is
present within the
zone
Yes, there is an
Onsite Wastewater
Treatment Plant
present within the
park
Yes, there is Onsite Wastewater
Treatment Plant
There is onsite
wastewater
treatment plant
available within the
special economic
zone
Transport Costs
Cost of shipping
20-foot FCL
container
The approximate shipping charges of a 20-foot FCL Container from
The approximate
shipping charges
of a 20-foot FCL
Container from
the nearest port
are as follows:
The approximate shipping charges of a 20-foot FCL Container from the nearest port are as follows:
The approximate shipping charges of a 20-foot FCL Container from the nearest port are as follows:
The approximate
shipping charges
of a 20-foot FCL
Container from
Hai Phong
International Sea
The approximate shipping charges of a 20-foot FCL Container from the nearest port are as follows:
The approximate
shipping charges of a
20-foot FCL
Container from the
nearest port are as
follows:
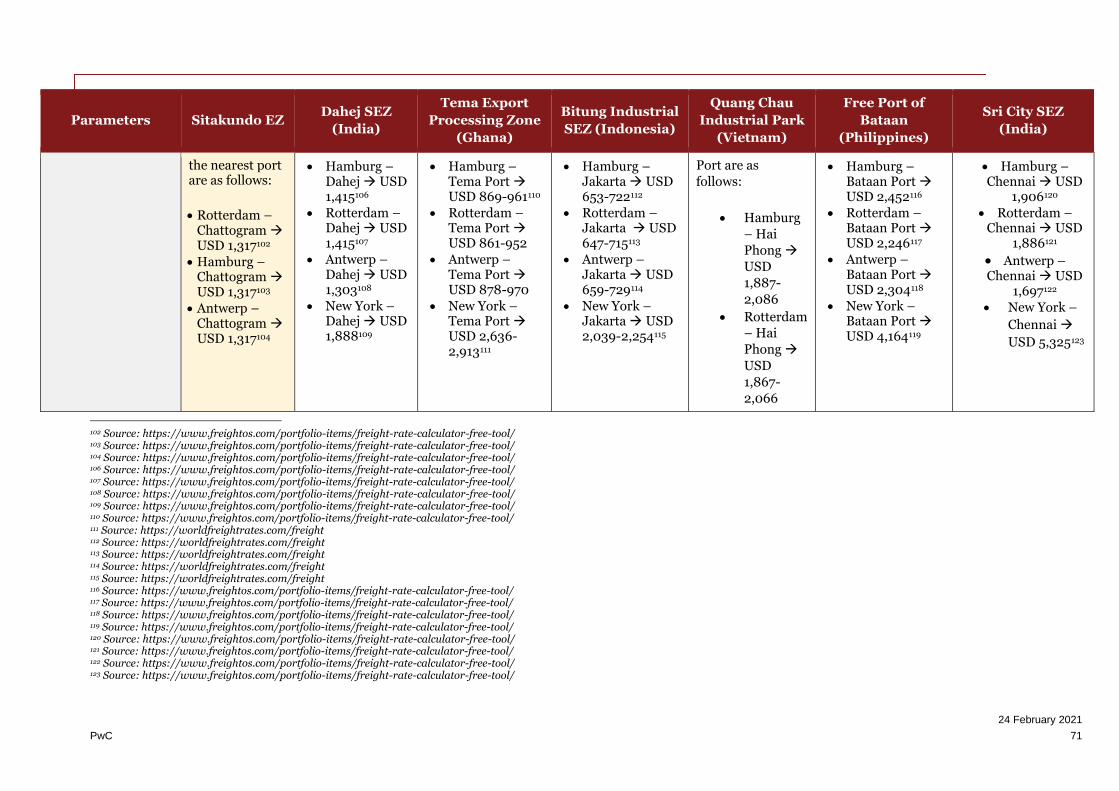
24 February 2021
PwC 71
Parameters Sitakundo EZ Dahej SEZ
(India)
Tema Export
Processing Zone
(Ghana)
Bitung Industrial
SEZ (Indonesia)
Quang Chau
Industrial Park
(Vietnam)
Free Port of
Bataan
(Philippines)
Sri City SEZ
(India)
the nearest port are as follows:
• Rotterdam – Chattogram → USD 1,317102
• Hamburg – Chattogram → USD 1,317103
• Antwerp – Chattogram → USD 1,317104
• Hamburg – Dahej → USD 1,415106
• Rotterdam – Dahej → USD 1,415107
• Antwerp – Dahej → USD 1,303108
• New York – Dahej → USD 1,888109
• Hamburg – Tema Port → USD 869-961110
• Rotterdam – Tema Port → USD 861-952
• Antwerp – Tema Port → USD 878-970
• New York – Tema Port → USD 2,636-2,913111
• Hamburg – Jakarta → USD 653-722112
• Rotterdam – Jakarta → USD 647-715113
• Antwerp – Jakarta → USD 659-729114
• New York – Jakarta → USD 2,039-2,254115
Port are as
follows:
• Hamburg
– Hai
Phong →
USD
1,887-
2,086
• Rotterdam
– Hai
Phong →
USD
1,867-
2,066
• Hamburg – Bataan Port → USD 2,452116
• Rotterdam – Bataan Port → USD 2,246117
• Antwerp – Bataan Port → USD 2,304118
• New York – Bataan Port → USD 4,164119
• Hamburg – Chennai → USD
1,906120
• Rotterdam – Chennai → USD
1,886121
• Antwerp – Chennai → USD
1,697122 • New York –
Chennai →
USD 5,325123
102 Source: https://www.freightos.com/portfolio-items/freight-rate-calculator-free-tool/ 103 Source: https://www.freightos.com/portfolio-items/freight-rate-calculator-free-tool/ 104 Source: https://www.freightos.com/portfolio-items/freight-rate-calculator-free-tool/ 106 Source: https://www.freightos.com/portfolio-items/freight-rate-calculator-free-tool/ 107 Source: https://www.freightos.com/portfolio-items/freight-rate-calculator-free-tool/ 108 Source: https://www.freightos.com/portfolio-items/freight-rate-calculator-free-tool/ 109 Source: https://www.freightos.com/portfolio-items/freight-rate-calculator-free-tool/ 110 Source: https://www.freightos.com/portfolio-items/freight-rate-calculator-free-tool/ 111 Source: https://worldfreightrates.com/freight 112 Source: https://worldfreightrates.com/freight 113 Source: https://worldfreightrates.com/freight 114 Source: https://worldfreightrates.com/freight 115 Source: https://worldfreightrates.com/freight 116 Source: https://www.freightos.com/portfolio-items/freight-rate-calculator-free-tool/ 117 Source: https://www.freightos.com/portfolio-items/freight-rate-calculator-free-tool/ 118 Source: https://www.freightos.com/portfolio-items/freight-rate-calculator-free-tool/ 119 Source: https://www.freightos.com/portfolio-items/freight-rate-calculator-free-tool/ 120 Source: https://www.freightos.com/portfolio-items/freight-rate-calculator-free-tool/ 121 Source: https://www.freightos.com/portfolio-items/freight-rate-calculator-free-tool/ 122 Source: https://www.freightos.com/portfolio-items/freight-rate-calculator-free-tool/ 123 Source: https://www.freightos.com/portfolio-items/freight-rate-calculator-free-tool/
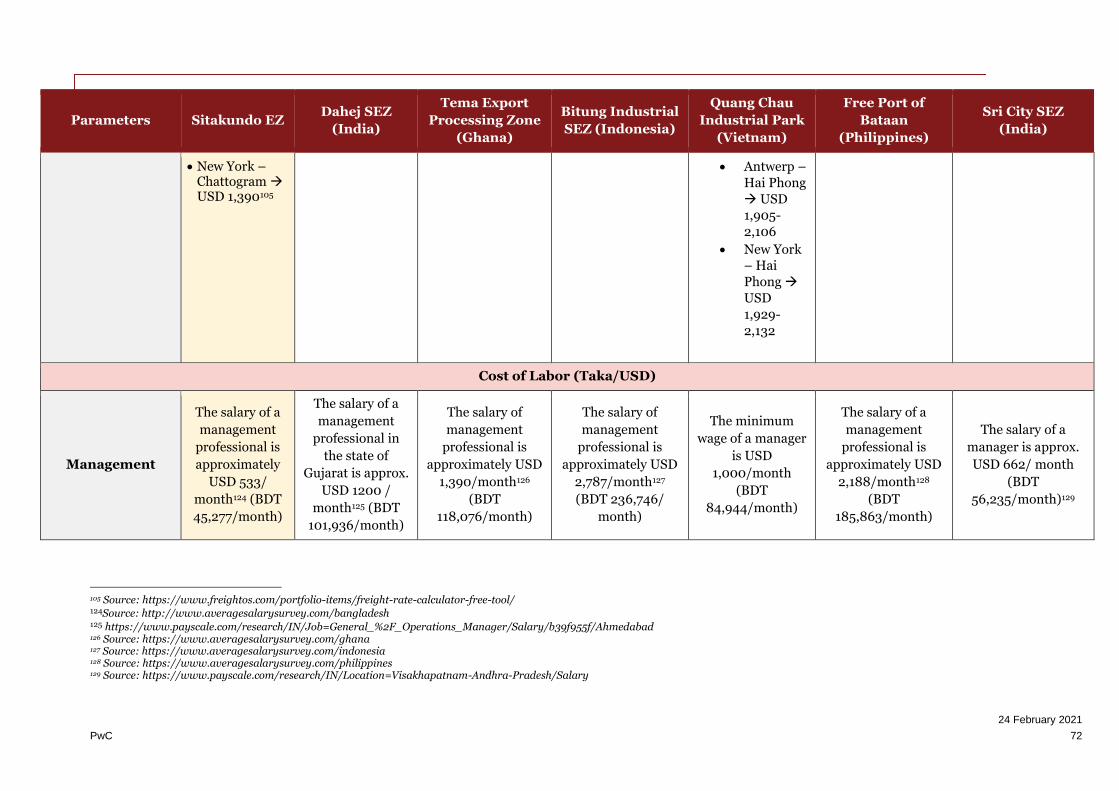
24 February 2021
PwC 72
Parameters Sitakundo EZ Dahej SEZ
(India)
Tema Export
Processing Zone
(Ghana)
Bitung Industrial
SEZ (Indonesia)
Quang Chau
Industrial Park
(Vietnam)
Free Port of
Bataan
(Philippines)
Sri City SEZ
(India)
• New York – Chattogram → USD 1,390105
• Antwerp –
Hai Phong
→ USD
1,905-
2,106
• New York
– Hai
Phong →
USD
1,929-
2,132
Cost of Labor (Taka/USD)
Management
The salary of a
management
professional is
approximately
USD 533/
month124 (BDT
45,277/month)
The salary of a
management
professional in
the state of
Gujarat is approx.
USD 1200 /
month125 (BDT
101,936/month)
The salary of
management
professional is
approximately USD
1,390/month126
(BDT
118,076/month)
The salary of
management
professional is
approximately USD
2,787/month127
(BDT 236,746/
month)
The minimum
wage of a manager
is USD
1,000/month
(BDT
84,944/month)
The salary of a
management
professional is
approximately USD
2,188/month128
(BDT
185,863/month)
The salary of a
manager is approx.
USD 662/ month
(BDT
56,235/month)129
105 Source: https://www.freightos.com/portfolio-items/freight-rate-calculator-free-tool/ 124Source: http://www.averagesalarysurvey.com/bangladesh 125 https://www.payscale.com/research/IN/Job=General_%2F_Operations_Manager/Salary/b39f955f/Ahmedabad 126 Source: https://www.averagesalarysurvey.com/ghana 127 Source: https://www.averagesalarysurvey.com/indonesia 128 Source: https://www.averagesalarysurvey.com/philippines 129 Source: https://www.payscale.com/research/IN/Location=Visakhapatnam-Andhra-Pradesh/Salary
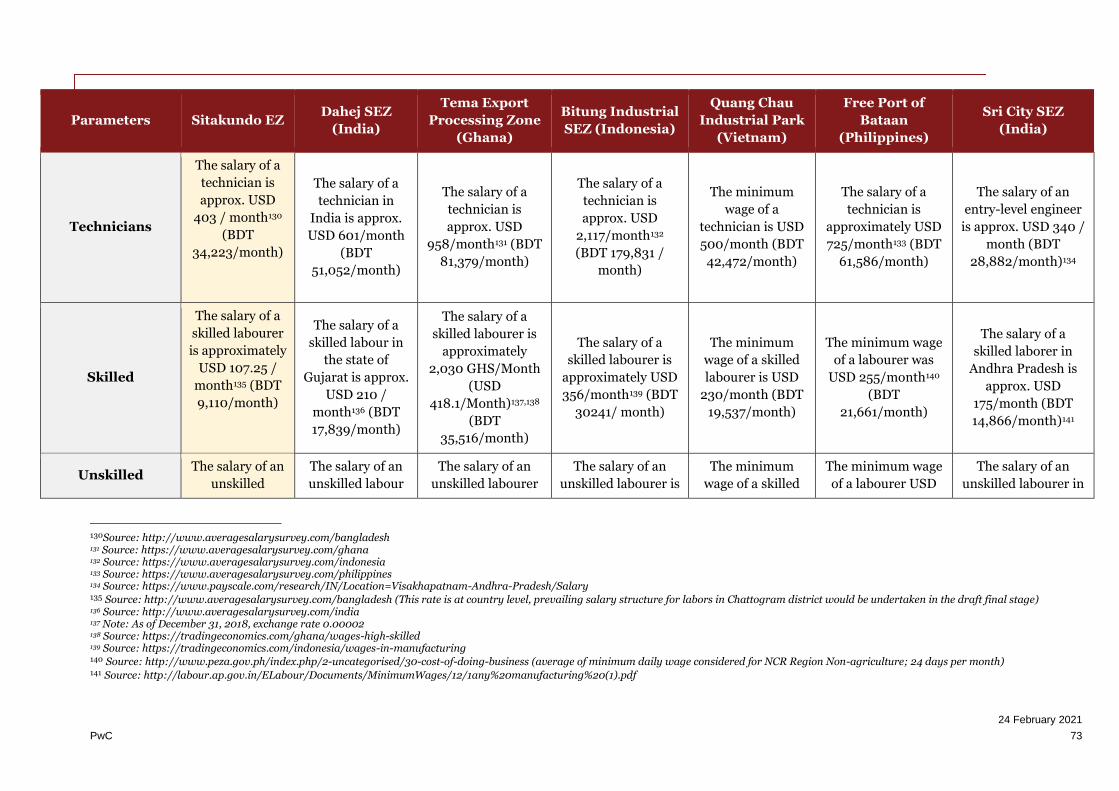
24 February 2021
PwC 73
Parameters Sitakundo EZ Dahej SEZ
(India)
Tema Export
Processing Zone
(Ghana)
Bitung Industrial
SEZ (Indonesia)
Quang Chau
Industrial Park
(Vietnam)
Free Port of
Bataan
(Philippines)
Sri City SEZ
(India)
Technicians
The salary of a
technician is
approx. USD
403 / month130
(BDT
34,223/month)
The salary of a
technician in
India is approx.
USD 601/month
(BDT
51,052/month)
The salary of a
technician is
approx. USD
958/month131 (BDT
81,379/month)
The salary of a
technician is
approx. USD
2,117/month132
(BDT 179,831 /
month)
The minimum
wage of a
technician is USD
500/month (BDT
42,472/month)
The salary of a
technician is
approximately USD
725/month133 (BDT
61,586/month)
The salary of an
entry-level engineer
is approx. USD 340 /
month (BDT
28,882/month)134
Skilled
The salary of a
skilled labourer
is approximately
USD 107.25 /
month135 (BDT
9,110/month)
The salary of a
skilled labour in
the state of
Gujarat is approx.
USD 210 /
month136 (BDT
17,839/month)
The salary of a
skilled labourer is
approximately
2,030 GHS/Month
(USD
418.1/Month)137,138
(BDT
35,516/month)
The salary of a
skilled labourer is
approximately USD
356/month139 (BDT
30241/ month)
The minimum
wage of a skilled
labourer is USD
230/month (BDT
19,537/month)
The minimum wage
of a labourer was
USD 255/month140
(BDT
21,661/month)
The salary of a
skilled laborer in
Andhra Pradesh is
approx. USD
175/month (BDT
14,866/month)141
Unskilled The salary of an
unskilled
The salary of an
unskilled labour
The salary of an
unskilled labourer
The salary of an
unskilled labourer is
The minimum
wage of a skilled
The minimum wage
of a labourer USD
The salary of an
unskilled labourer in
130Source: http://www.averagesalarysurvey.com/bangladesh 131 Source: https://www.averagesalarysurvey.com/ghana 132 Source: https://www.averagesalarysurvey.com/indonesia 133 Source: https://www.averagesalarysurvey.com/philippines 134 Source: https://www.payscale.com/research/IN/Location=Visakhapatnam-Andhra-Pradesh/Salary 135 Source: http://www.averagesalarysurvey.com/bangladesh (This rate is at country level, prevailing salary structure for labors in Chattogram district would be undertaken in the draft final stage) 136 Source: http://www.averagesalarysurvey.com/india 137 Note: As of December 31, 2018, exchange rate 0.00002 138 Source: https://tradingeconomics.com/ghana/wages-high-skilled 139 Source: https://tradingeconomics.com/indonesia/wages-in-manufacturing 140 Source: http://www.peza.gov.ph/index.php/2-uncategorised/30-cost-of-doing-business (average of minimum daily wage considered for NCR Region Non-agriculture; 24 days per month) 141 Source: http://labour.ap.gov.in/ELabour/Documents/MinimumWages/12/1any%20manufacturing%20(1).pdf

24 February 2021
PwC 74
Parameters Sitakundo EZ Dahej SEZ
(India)
Tema Export
Processing Zone
(Ghana)
Bitung Industrial
SEZ (Indonesia)
Quang Chau
Industrial Park
(Vietnam)
Free Port of
Bataan
(Philippines)
Sri City SEZ
(India)
labourer is
approx. USD
56/month142
(BDT
4,757/month)
in India is approx.
USD
151.64/month143
(BDT
12,881/month)
is approx. 870
GHS/Month (USD
179.2/Month)144,145
(BDT
15,222/month)
approx. USD
188/month146 (BDT
15970/ month)
labourer is USD
150/month (BDT
12,742/month)
119/month147 (BDT
10109/month)
Andhra Pradesh is
approx. USD
122/month (BDT
10,364/month)148
Sectors
Type of Sectors
within the Zone
Chemicals,
Heavy
Machinery, Iron
& Steel and
Metals,
Automobiles,
non-metallic
minerals,
Petroleum
products
(including
bottling)
Chemicals and
Petrochemicals,
Light
Engineering, Ship
building,
Pharmaceuticals
etc.
Oil and gas, agro
processing,
minerals
processing,
manufacturing, ICT
(data processing/
assembling)149
Fish processing,
coconut processing,
pharmacy
industries, logistics,
agricultural
industries, food
processing, shipyard
& metal industry
and tourism150
Hi-tech electronic
components, steel
structures,
electrification,
equipment of high
and medium
voltage cabinets,
household
appliances,
production of
plywood boards,
animal feed,
Textiles & RMG,
Light Engineering,
transshipment and
logistics, ship
repair, tourism and
resort
facilities/services,
agriculture and
agro-industrial, food
& beverages,
chemicals etc.
Automotive, Light
Engineering, Food &
Beverages, Fast
Moving Consumer
Goods (FMCG) etc.
142 Source: http://www.averagesalarysurvey.com/bangladesh (This rate is at country level, prevailing salary structure for labors in Chattogram district would be undertaken in the draft final stage) 143 Source: https://tradingeconomics.com/india/wages-low-skilled 144 Note: As of December 31, 2018, exchange rate 0.00002 145 Source: https://tradingeconomics.com/ghana/wages-low-skilled 146 Source: https://tradingeconomics.com/indonesia/wages-in-manufacturing 147 Source: https://nwpc.dole.gov.ph/stats/current-statistics-on-wages/ (minimum daily wage considered for Region II Non-agriculture; 24 days per month) 148 Source: http://labour.ap.gov.in/ELabour/Documents/MinimumWages/12/1any%20manufacturing%20(1).pdf 149 Source: https://www.jetro.go.jp/ext_images/world/africa/seminar_reports/pdf/20160520/s2.pdf 150 Source: http://digilib.mercubuana.ac.id/manager/t!@file_artikel_abstrak/Isi_Artikel_191432575710.pdf

24 February 2021
PwC 75
Parameters Sitakundo EZ Dahej SEZ
(India)
Tema Export
Processing Zone
(Ghana)
Bitung Industrial
SEZ (Indonesia)
Quang Chau
Industrial Park
(Vietnam)
Free Port of
Bataan
(Philippines)
Sri City SEZ
(India)
Shoes, Textile &
RMG
Special Regime
Special Regime
(Yes/No)
Yes, there’s a
special regime
for incentives
Yes, there’s
special regime for
incentives
Yes, there’s a
special regime for
incentives
Yes, there’s a special
regime for
incentives
Yes, there’s a
special regime for
incentives
Yes, there’s a special
regime for
incentives
Yes, there’s a special
regime for incentives
Fiscal Incentives
Customs Duties
• Declaration of
EZ as Ware
housing
Station- Duty
free import &
Export of Raw
material etc.
• 100% duty free
Import of
Vehicle (One
Car, One
Microbus-
2000 cc)
• 100% VAT free
Import of
Machinery,
Exemptions from
Customs duty on
imports.
100% exemption
from payment of
direct and indirect
duties and levies on
all imports for
production and
exports from free
zones
• The facility of postponement of import duties is provided151
• Excise duty: Exempted for raw direct materials and supporting materials for production purposes
• Import income tax: Not levied
Custom duty
exemption for the
following:
• For export
processing
enterprises
(EPE)
• For
equipment,
machinery
(accessories)
and special use
means of
transport in
technological
lines and
construction
The Philippines’
customs levy no
tariff or tax for
goods worth less
than PHP10,000
(USD 200).
Businesses
operating in SEZs or
free port zones are
exempted from
paying taxes and
tariffs on imported
raw material and
manufacturing
equipment
Exemptions from
customs duties and
excise for
import/procurement
of goods for
development,
operations and
maintenance are
applicable152
151 Source: http://www.pma-japan.or.id/bundles/bsibkpm/download/Bitung_44.pdf 152 Source: http://www.vsez.gov.in/vsez_wsp__sez_schme.aspx
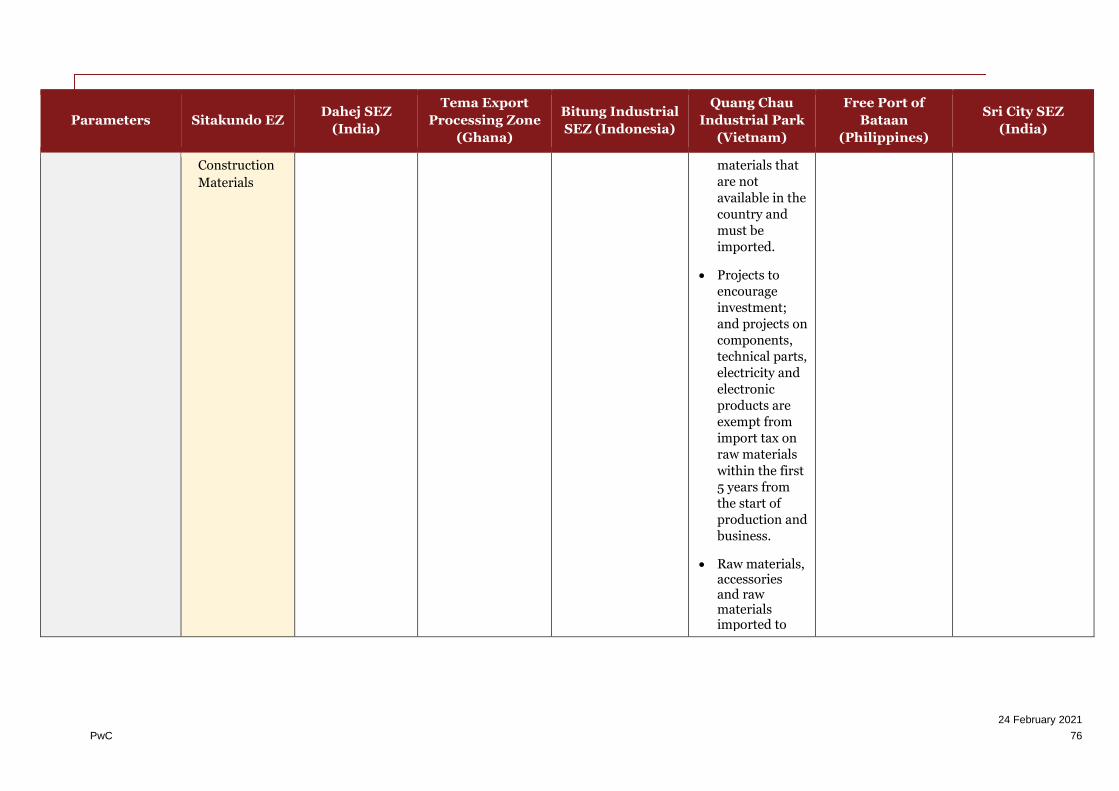
24 February 2021
PwC 76
Parameters Sitakundo EZ Dahej SEZ
(India)
Tema Export
Processing Zone
(Ghana)
Bitung Industrial
SEZ (Indonesia)
Quang Chau
Industrial Park
(Vietnam)
Free Port of
Bataan
(Philippines)
Sri City SEZ
(India)
Construction
Materials
materials that
are not
available in the
country and
must be
imported.
• Projects to
encourage
investment;
and projects on
components,
technical parts,
electricity and
electronic
products are
exempt from
import tax on
raw materials
within the first
5 years from
the start of
production and
business.
• Raw materials, accessories and raw materials imported to
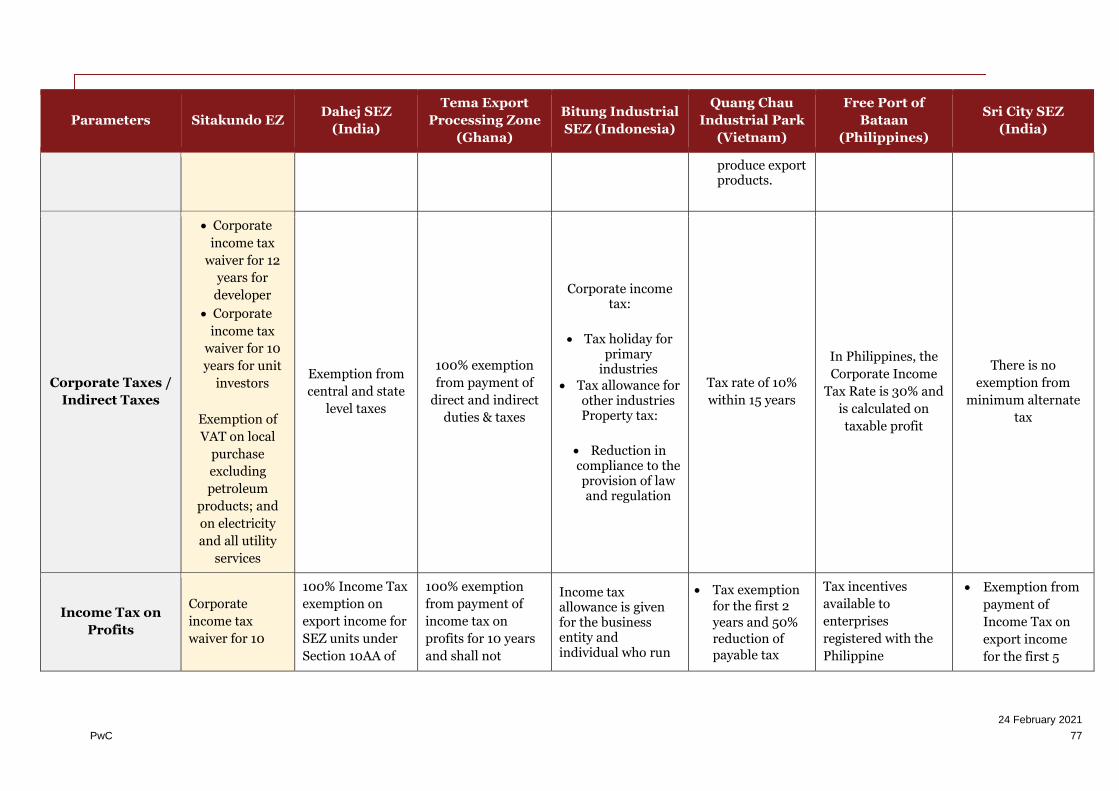
24 February 2021
PwC 77
Parameters Sitakundo EZ Dahej SEZ
(India)
Tema Export
Processing Zone
(Ghana)
Bitung Industrial
SEZ (Indonesia)
Quang Chau
Industrial Park
(Vietnam)
Free Port of
Bataan
(Philippines)
Sri City SEZ
(India)
produce export products.
Corporate Taxes /
Indirect Taxes
• Corporate
income tax
waiver for 12
years for
developer
• Corporate
income tax
waiver for 10
years for unit
investors
Exemption of
VAT on local
purchase
excluding
petroleum
products; and
on electricity
and all utility
services
Exemption from
central and state
level taxes
100% exemption
from payment of
direct and indirect
duties & taxes
Corporate income tax:
• Tax holiday for primary
industries
• Tax allowance for other industries Property tax:
• Reduction in compliance to the provision of law and regulation
Tax rate of 10%
within 15 years
In Philippines, the
Corporate Income
Tax Rate is 30% and
is calculated on
taxable profit
There is no
exemption from
minimum alternate
tax
Income Tax on
Profits
Corporate
income tax
waiver for 10
100% Income Tax
exemption on
export income for
SEZ units under
Section 10AA of
100% exemption
from payment of
income tax on
profits for 10 years
and shall not
Income tax allowance is given for the business entity and individual who run
• Tax exemption
for the first 2
years and 50%
reduction of
payable tax
Tax incentives
available to
enterprises
registered with the
Philippine
• Exemption from
payment of
Income Tax on
export income
for the first 5
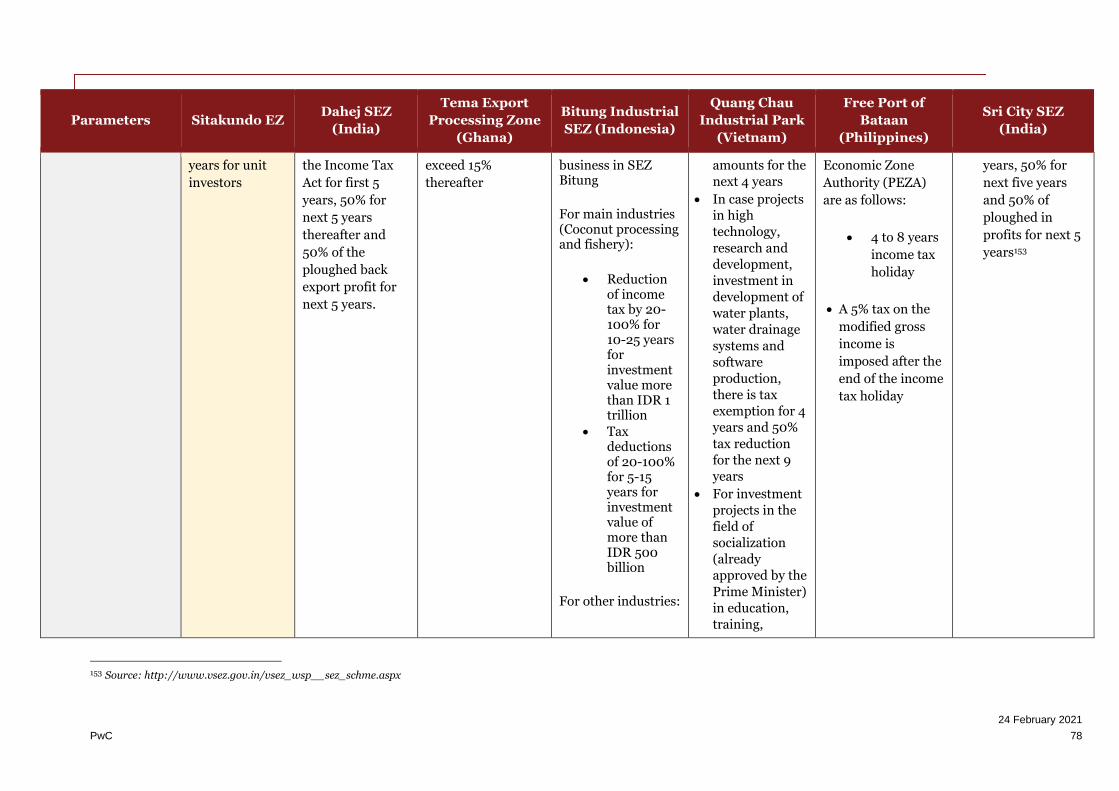
24 February 2021
PwC 78
Parameters Sitakundo EZ Dahej SEZ
(India)
Tema Export
Processing Zone
(Ghana)
Bitung Industrial
SEZ (Indonesia)
Quang Chau
Industrial Park
(Vietnam)
Free Port of
Bataan
(Philippines)
Sri City SEZ
(India)
years for unit
investors
the Income Tax
Act for first 5
years, 50% for
next 5 years
thereafter and
50% of the
ploughed back
export profit for
next 5 years.
exceed 15%
thereafter
business in SEZ Bitung
For main industries (Coconut processing and fishery):
• Reduction of income tax by 20-100% for 10-25 years for investment value more than IDR 1 trillion
• Tax deductions of 20-100% for 5-15 years for investment value of more than IDR 500 billion
For other industries:
amounts for the
next 4 years
• In case projects
in high
technology,
research and
development,
investment in
development of
water plants,
water drainage
systems and
software
production,
there is tax
exemption for 4
years and 50%
tax reduction
for the next 9
years
• For investment
projects in the
field of
socialization
(already
approved by the
Prime Minister)
in education,
training,
Economic Zone
Authority (PEZA)
are as follows:
• 4 to 8 years
income tax
holiday
• A 5% tax on the
modified gross
income is
imposed after the
end of the income
tax holiday
years, 50% for
next five years
and 50% of
ploughed in
profits for next 5
years153
153 Source: http://www.vsez.gov.in/vsez_wsp__sez_schme.aspx
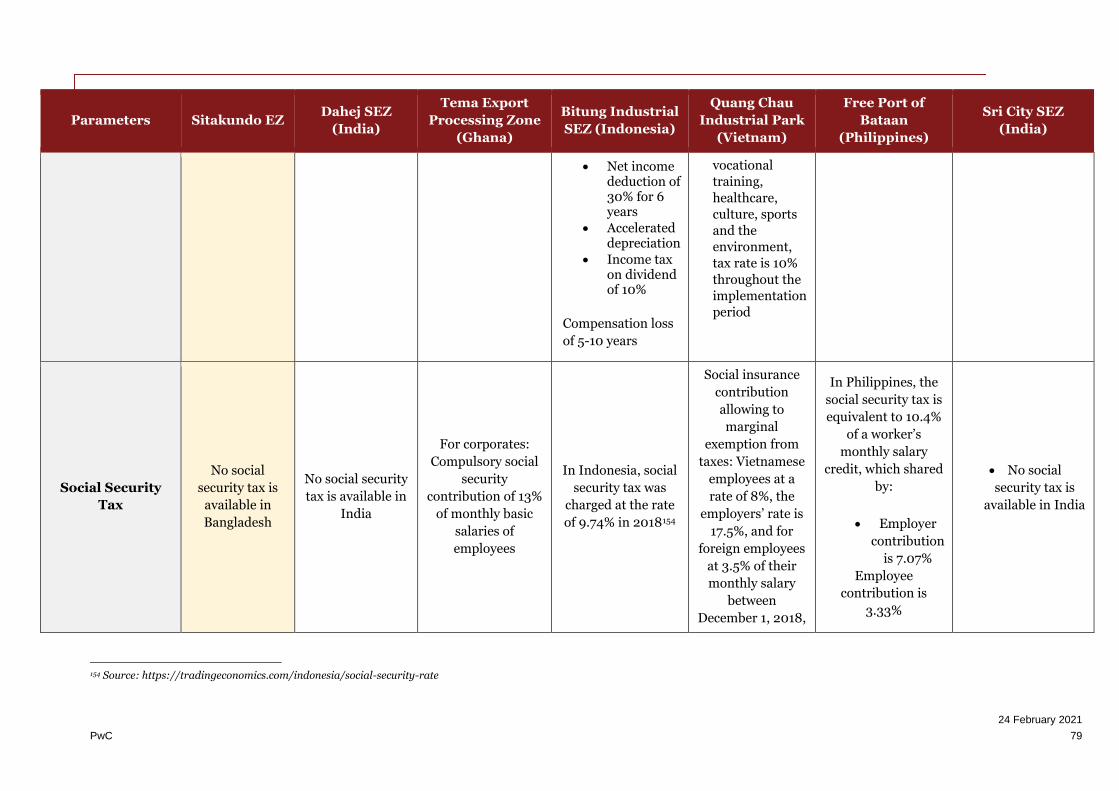
24 February 2021
PwC 79
Parameters Sitakundo EZ Dahej SEZ
(India)
Tema Export
Processing Zone
(Ghana)
Bitung Industrial
SEZ (Indonesia)
Quang Chau
Industrial Park
(Vietnam)
Free Port of
Bataan
(Philippines)
Sri City SEZ
(India)
• Net income deduction of 30% for 6 years
• Accelerated depreciation
• Income tax on dividend of 10%
Compensation loss
of 5-10 years
vocational
training,
healthcare,
culture, sports
and the
environment,
tax rate is 10%
throughout the
implementation
period
Social Security
Tax
No social
security tax is
available in
Bangladesh
No social security
tax is available in
India
For corporates:
Compulsory social
security
contribution of 13%
of monthly basic
salaries of
employees
In Indonesia, social
security tax was
charged at the rate
of 9.74% in 2018154
Social insurance
contribution
allowing to
marginal
exemption from
taxes: Vietnamese
employees at a
rate of 8%, the
employers’ rate is
17.5%, and for
foreign employees
at 3.5% of their
monthly salary
between
December 1, 2018,
In Philippines, the
social security tax is
equivalent to 10.4%
of a worker’s
monthly salary
credit, which shared
by:
• Employer
contribution
is 7.07%
Employee
contribution is
3.33%
• No social
security tax is
available in India
154 Source: https://tradingeconomics.com/indonesia/social-security-rate

24 February 2021
PwC 80
Parameters Sitakundo EZ Dahej SEZ
(India)
Tema Export
Processing Zone
(Ghana)
Bitung Industrial
SEZ (Indonesia)
Quang Chau
Industrial Park
(Vietnam)
Free Port of
Bataan
(Philippines)
Sri City SEZ
(India)
and December 31,
2021
No restrictions on
Money Transfers
Full repatriation
of capital
invested from
foreign sources
is allowed by
Bangladesh.
Similarly,
profits and
dividend
accruing to
foreign
investment may
be transferred in
full. If foreign
investors
reinvest their
repatriable
dividends and
or retained
earnings, those
will be treated
as new
investment.
Foreigners
employed in
Bangladesh are
entitled to remit
Profit and
dividend earned
from an Indian
company are
repatriable after
payment of
dividend
distribution tax
(DDT). DDT @
16.995%
(inclusive of cess)
is payable by the
company (that
declares
dividend) on the
amount of
dividend
distributed.
However,
dividend is free of
Indian income tax
in the hands of
the recipient
shareholders,
Indian or foreign.
Profit of LLP is
flow-through and
• Total exemption from payment of withholding taxes
from dividends arising out of free zone investments
• Free zone investments are
guaranteed against
nationalization and expropriation
There are no
conditions or
restrictions on:
repatriation of
dividends or net
profit; payments for
foreign loan
servicing; payments
of fees and charges
for technology
transfer
agreements; and
remittance of
proceeds from sale
of any interest in a
No such incentives
are prevailing in EZ
Enterprises are
allowed to transfer
money abroad
when performing
the following
cases:
• Carrying out
payment and
transferring
money related to
the import or
export of goods
and/or services;
• Payment of
payments and
remittances
related to
commercial
credits and short-
term bank loans;
• Make payments
and transfers
related to direct
and indirect
investment
income;
• No such
incentives are
prevailing in EZ
Profit and dividend
earned from an
Indian company are
repatriable after
payment of DDT.
DDT @ 16.995%
(inclusive of cess) is
payable by the
company (that
declares dividend)
on the amount of
dividend
distributed.
However, dividend
is free of Indian
income tax in the
hands of the
recipient
shareholders, Indian
or foreign. Profit of
LLP is flow-through
and repatriable
without payment of
any taxes and
without any

24 February 2021
PwC 81
Parameters Sitakundo EZ Dahej SEZ
(India)
Tema Export
Processing Zone
(Ghana)
Bitung Industrial
SEZ (Indonesia)
Quang Chau
Industrial Park
(Vietnam)
Free Port of
Bataan
(Philippines)
Sri City SEZ
(India)
up to 50 percent
of their salary
and will enjoy
facilities for full
repatriation of
their savings
and retirement
benefits
repatriable
without payment
of any taxes and
without any
regulatory
approval155.
free zone
investment
• Transfer money
when being
allowed to reduce
direct investment
capital;
• Payment of debts
and interest of
foreign loans
• Make one-way
money transfers
Payment and
other remittance
according to
regulations of the
State Bank of
Vietnam
regulatory
approval156
Others
Exemption from
income tax on
salary of
expatriates,
dividend tax and
royalty,
technical fees,
local govt. tax,
land
development tax
• Exemption from Service Tax
Exemption from
payment of
Royalties & Cess
on construction
materials
• 100% exemption from payment of withholding taxes
• Relief from double taxation for foreign investors and employees
100% ownership of
shares by any
investor – foreign
Value-Added Tax
(VAT) (VAT and
PPnBM) & Luxury
Sales Tax:
Exemption for
taxable goods
VAT exemption
for:
• Export
processing
enterprises
(EPE)
• Equipment and
machinery and
special
• Tax and
duty-free
import of
capital
equipment,
spare parts
and
supplies
• Tax and
duty-free
Exemption from
payment of
service tax,
Central Sales
Tax, AP VAT,
stamp duty and
registration fee
on registration of
lease deeds,
capital
155 Source: http://www.dobusinessinindia.in/repatriationoffund.php 156 Source: http://www.dobusinessinindia.in/repatriationoffund.php
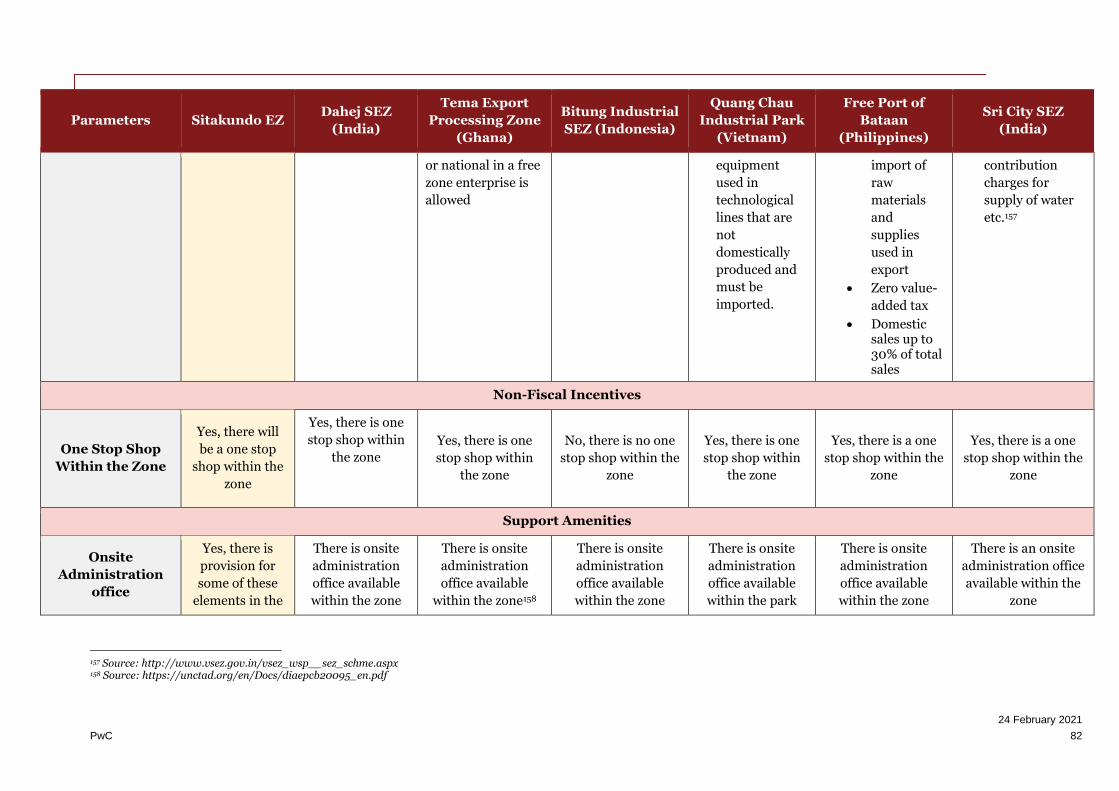
24 February 2021
PwC 82
Parameters Sitakundo EZ Dahej SEZ
(India)
Tema Export
Processing Zone
(Ghana)
Bitung Industrial
SEZ (Indonesia)
Quang Chau
Industrial Park
(Vietnam)
Free Port of
Bataan
(Philippines)
Sri City SEZ
(India)
or national in a free
zone enterprise is
allowed
equipment
used in
technological
lines that are
not
domestically
produced and
must be
imported.
import of
raw
materials
and
supplies
used in
export
• Zero value-
added tax
• Domestic sales up to 30% of total sales
contribution
charges for
supply of water
etc.157
Non-Fiscal Incentives
One Stop Shop
Within the Zone
Yes, there will
be a one stop
shop within the
zone
Yes, there is one
stop shop within
the zone
Yes, there is one
stop shop within
the zone
No, there is no one
stop shop within the
zone
Yes, there is one
stop shop within
the zone
Yes, there is a one
stop shop within the
zone
Yes, there is a one
stop shop within the
zone
Support Amenities
Onsite
Administration
office
Yes, there is
provision for
some of these
elements in the
There is onsite
administration
office available
within the zone
There is onsite
administration
office available
within the zone158
There is onsite
administration
office available
within the zone
There is onsite
administration
office available
within the park
There is onsite
administration
office available
within the zone
There is an onsite
administration office
available within the
zone
157 Source: http://www.vsez.gov.in/vsez_wsp__sez_schme.aspx 158 Source: https://unctad.org/en/Docs/diaepcb20095_en.pdf

24 February 2021
PwC 83
Parameters Sitakundo EZ Dahej SEZ
(India)
Tema Export
Processing Zone
(Ghana)
Bitung Industrial
SEZ (Indonesia)
Quang Chau
Industrial Park
(Vietnam)
Free Port of
Bataan
(Philippines)
Sri City SEZ
(India)
Onsite
Convenience
Retail
Master Plan of
the proposed EZ
There is onsite
convenience retail
available within
the zone
There is no onsite
convenience retail
available within the
zone
There is no onsite
convenience retail
available within the
zone
There is no onsite
convenience retail
available within
the park
There is onsite
convenience retail
available within the
zone
There is an onsite
convenience retail
available within the
zone
Onsite Housing
There is onsite
housing available
within the zone
There is no onsite
housing available
within the zone
There is onsite
housing available
within the zone
There is no onsite
housing available
within the park
There are onsite
housings like
Camaya Hills
Residencies, Opus
Land Inc are
available within the
zone
There is onsite
housing is available
within the zone
Onsite Schools
There are no
onsite schools
available within
the zone
There are no onsite
schools available
within the zone
There are no onsite
schools available
within the zone
There are no
onsite schools
available within
the park
There is no onsite
school available
within the zone
There is onsite
schooling is available
within the zone
Onsite
Community
Facilities
There are no
onsite community
facilities available
within the zone
There are no onsite
community
facilities available
within the zone
There are no onsite
community facilities
available within the
zone
There are onsite
community
facilities available
within the park
There is no onsite
community facility
available within the
zone
There are onsite
community facilities
available within the
zone
Onsite Security
There is onsite
security available
within the zone
There is onsite
security available
within the zone
There is onsite
security available
within the zone
There is onsite
security available
within the park
There is onsite
security available
within the zone
There is onsite
security available
within the zone
Quality of Life
International
Housing (Within
15 Km)
There is no
international
housing facility
There are
township/housing
blocks are
There is no
international
housing facility
There is no
international
housing facility
There are quality
housing facilities
available near the
There is quality
housing like BEPZ
Executive village
Investment grade
accommodation of
more than 600
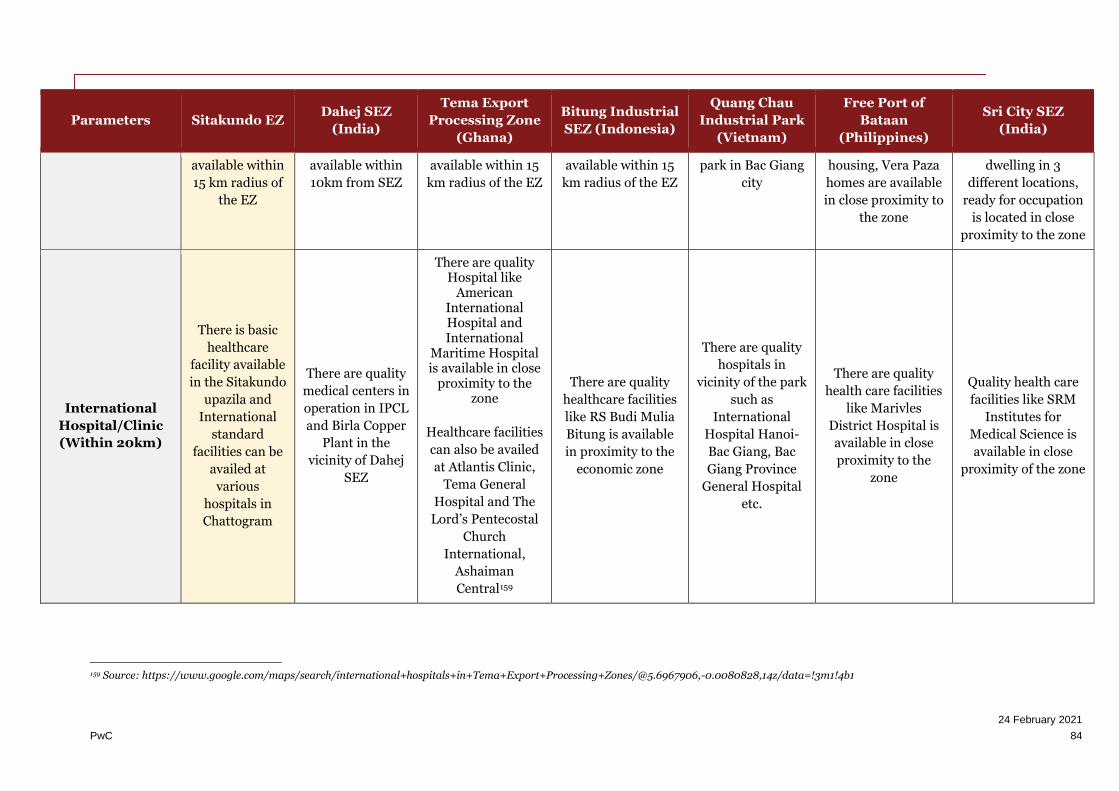
24 February 2021
PwC 84
Parameters Sitakundo EZ Dahej SEZ
(India)
Tema Export
Processing Zone
(Ghana)
Bitung Industrial
SEZ (Indonesia)
Quang Chau
Industrial Park
(Vietnam)
Free Port of
Bataan
(Philippines)
Sri City SEZ
(India)
available within
15 km radius of
the EZ
available within
10km from SEZ
available within 15
km radius of the EZ
available within 15
km radius of the EZ
park in Bac Giang
city
housing, Vera Paza
homes are available
in close proximity to
the zone
dwelling in 3
different locations,
ready for occupation
is located in close
proximity to the zone
International
Hospital/Clinic
(Within 20km)
There is basic
healthcare
facility available
in the Sitakundo
upazila and
International
standard
facilities can be
availed at
various
hospitals in
Chattogram
There are quality
medical centers in
operation in IPCL
and Birla Copper
Plant in the
vicinity of Dahej
SEZ
There are quality Hospital like
American International Hospital and International
Maritime Hospital is available in close
proximity to the zone
Healthcare facilities
can also be availed
at Atlantis Clinic,
Tema General
Hospital and The
Lord’s Pentecostal
Church
International,
Ashaiman
Central159
There are quality
healthcare facilities
like RS Budi Mulia
Bitung is available
in proximity to the
economic zone
There are quality
hospitals in
vicinity of the park
such as
International
Hospital Hanoi-
Bac Giang, Bac
Giang Province
General Hospital
etc.
There are quality
health care facilities
like Marivles
District Hospital is
available in close
proximity to the
zone
Quality health care
facilities like SRM
Institutes for
Medical Science is
available in close
proximity of the zone
159 Source: https://www.google.com/maps/search/international+hospitals+in+Tema+Export+Processing+Zones/@5.6967906,-0.0080828,14z/data=!3m1!4b1

24 February 2021
PwC 85
Parameters Sitakundo EZ Dahej SEZ
(India)
Tema Export
Processing Zone
(Ghana)
Bitung Industrial
SEZ (Indonesia)
Quang Chau
Industrial Park
(Vietnam)
Free Port of
Bataan
(Philippines)
Sri City SEZ
(India)
International
Schools (Within
20 kms)
There are no international
schools available within 20 km radius.
State of art
educational
facilities can be
availed in
Chattogram
There are quality
schools like
Reliance
foundation
school,
Sanskardeep
Vidhyalaya are
available within
close proximity of
the zone
There are quality
schools like Tema
International
School, Aves
International
Academy, Jesus
Life International
School, Witsands
International
School, SOS-
Hermann Gmeiner
International
College and a few
others in close
proximity to the
zone160
There are quality
schools like Manado
International School
and Polaris school
in close proximity to
the zone
There are
international
schools are
available in the
area such as Nhat
Ahn Language
International etc.
There are quality
international
schools like BEZP
Multinational
School is available
in close proximity to
the zone
Quality schools like
Chinmaya Vidyalaya
School is available in
close proximity of
the site
Source: PwC Analysis
160 Source: https://www.google.com/maps/search/international+schools+in+Tema+Export+Processing+Zones/@5.694637,-0.0446726,13z/data=!3m1!4b1

24 February 2021
PwC 86
4.5. Key Takeaways
Some important features and best practices that were present across the benchmarked EZs which helped remain
competitive and attract industrial tenants are as follows:
Table 29: Key Takeaways
Location • Location is one of the most important factors for any EZ.
• The EZs used for benchmarking are successful EZs which are either
located close to the capital city or major urban nodes or trade
gateways which help in access to export/import opportunities,
backward/forward linkages, major markets, social infrastructure and
availability of human resources that will be employed.
• The proposed zone is located in close proximity to Chattogram, the
commercial capital of Bangladesh, which could give a fillip to the
industries that would be established in the zone
Multi-modal
Connectivity
• The EZs site location is chosen such that it is well connected via roads,
railways, airports, seaports etc. to other main locations for ease of
business and trade.
• The proposed EZ at Sitakundo is well connected through different
modes of transportation which can facilitate the smooth flow of
inputs/finished goods to and from the proposed EZ.
Access to
Utilities
• Presence of Infrastructure/ Utilities such as Onsite Independent
Power (at a competitive price), availability of water (at a competitive
price) adds to the attraction of EZ.
• In case of the proposed EZ, the nearest power source is ~20 km from
site and nearest water source is within the proposed EZ in the form of
tube wells and reservoirs.
• Details of sourcing power and water is evaluated in the master
planning section of this report.
Cost of Utilities • Out of the competing EZs, cost of power is high in India, Malaysia and
Philippines whereas it is lower in Ghana and Indonesia as compared
to Bangladesh.
• Cost of water is low in Ghana, Vietnam and Indonesia, whereas it is
high in India, and Philippines as compared to Bangladesh.
• Lower cost of utility shall result in reduced cost of manufacturing.
Cost of
Manpower
• Cost of labor (management, technicians, skilled and unskilled) should
be competitive. The cost of labor when compared to other global EZs
is very low.
• This shows that the proposed EZ has an edge and is very competitive
when it comes to cost of labor.
Cost of
Transportation
• For an EZ to be competitive globally, cost of transportation should be
low.

24 February 2021
PwC 87
• Comparison of cost of shipping a 20-foot FCL container from various
locations indicates that transport cost to Bangladesh is higher as
compared to the other competing EZs from Indonesia, and Ghana but
lower when compared to India, Vietnam and Philippines.
• Higher cost of transportation means increased manufacturing cost.
Support
Amenities
• The benchmarking exercise demonstrates that EZs have support
amenities such as Administration office, Convenience retail, Housing,
Schools, Hospitals, Security etc. to support the people working and
living in the EZ, and hence helps in attracting more investors.
• Similar facilities are envisaged for BSMSN, which could be leveraged
by the proposed EZ (refer to Annexure 3).
Sustainability • Presence of an onsite wastewater treatment plant is a must-have for
any EZ.
• Majority of the EZs used for benchmarking globally had these plants.
• BSMSN has proposed CETP facilities planned within it as per the
Draft Report of Master Plan IV (by Sheltech)161
Economic
Competitiveness
of Host Country
• Out of the countries considered in this benchmarking exercise, India,
Vietnam and Philippines have fared well in terms of FDI inflow, global
competitiveness ranking, financial market development ranking, and
in ease of doing business.
• Bangladesh is laggard in terms of these macro-economic and
regulatory parameters. However, its robust growth in the recent years
have outperformed most of its peers
Source: PwC Analysis
These notable best-practices and offerings can add to the potential of the proposed EZ from the perspective of attracting lucrative investments from reputed industrial houses and increase its demand. The same are kept in mind and incorporated in the master planning, and infrastructure assessment of the proposed EZ. Basis the analysis done above, the proposed EZ is found to be competitive with respect to other EZs on majority of the comparative parameters.
161 Shared by World Bank on 30th June 2020 over mail

24 February 2021
PwC 88
5. Industry Assessment
5.1. Key Objectives
Main objective of industry assessment is to identify site-specific best-fit industries which can be compatible with
the local economy and existing supply chains of the region. Through this chapter, recent growth trends and policy
support for various industries will be highlighted to draw attention to industry segments that are exhibiting
significant development potential in Bangladesh. Local level infrastructural and manpower support, presently
available and proposed plans, would be elaborated and site-specific suitability of various industries would be
covered. Reference to insights obtained through primary survey have also been elucidated in this section. Further
the results obtained from both primary (bottom-up) and secondary (top-down) studies would be synthesized to
arrive at the final shortlist of industries for the proposed EZ. A detailed industrial profile would be undertaken
for these target industrial sectors, covering typical land, power and water requirements, as well as, typical
employment requirements for these sectors.
5.2. Framework of Industry Assessment
The process to arrive at the best-fit industrial mix that would be compatible in the context of the proposed EZ is
a four-pronged approach covering macro level assessment of the country, which funnels down to site level and
regional specific assessment, with validation from current manufacturers and members of various industrial
associations.
Figure 25: Industry assessment framework
Source: PwC analysis
Level-1 and Level-2 filtrations delve into top-down assessment and are based on secondary research, whereas the
findings from these two levels of filtrations are validated in the level-3 filtration (bottom-up assessment). As
discussed previously, the Sheltech master plan has designated the zone area as the heavy industry zone, and hence
only heavy industries are planned to be promoted in the proposed EZ. These industries are further assessed in
through primary survey, and their results are revalidated through relevant stakeholder interaction on ground.
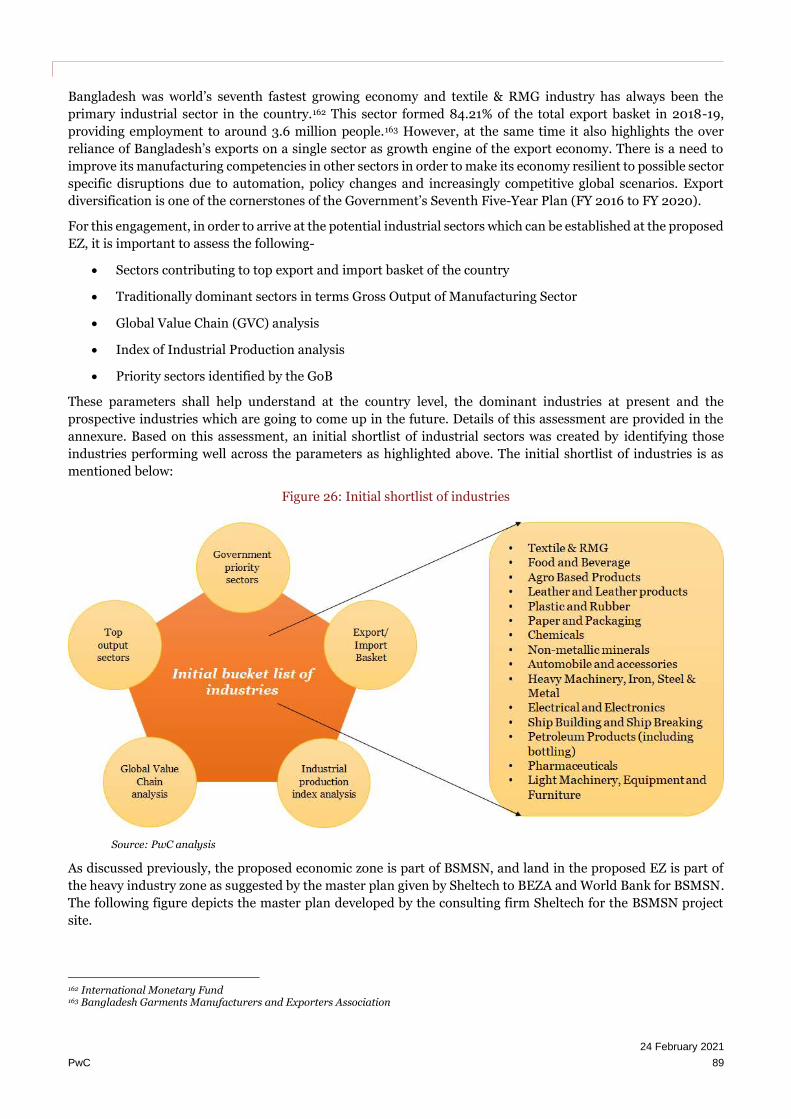
24 February 2021
PwC 89
Bangladesh was world’s seventh fastest growing economy and textile & RMG industry has always been the
primary industrial sector in the country.162 This sector formed 84.21% of the total export basket in 2018-19,
providing employment to around 3.6 million people.163 However, at the same time it also highlights the over
reliance of Bangladesh’s exports on a single sector as growth engine of the export economy. There is a need to
improve its manufacturing competencies in other sectors in order to make its economy resilient to possible sector
specific disruptions due to automation, policy changes and increasingly competitive global scenarios. Export
diversification is one of the cornerstones of the Government’s Seventh Five-Year Plan (FY 2016 to FY 2020).
For this engagement, in order to arrive at the potential industrial sectors which can be established at the proposed
EZ, it is important to assess the following-
• Sectors contributing to top export and import basket of the country
• Traditionally dominant sectors in terms Gross Output of Manufacturing Sector
• Global Value Chain (GVC) analysis
• Index of Industrial Production analysis
• Priority sectors identified by the GoB
These parameters shall help understand at the country level, the dominant industries at present and the
prospective industries which are going to come up in the future. Details of this assessment are provided in the
annexure. Based on this assessment, an initial shortlist of industrial sectors was created by identifying those
industries performing well across the parameters as highlighted above. The initial shortlist of industries is as
mentioned below:
Figure 26: Initial shortlist of industries
Source: PwC analysis
As discussed previously, the proposed economic zone is part of BSMSN, and land in the proposed EZ is part of
the heavy industry zone as suggested by the master plan given by Sheltech to BEZA and World Bank for BSMSN.
The following figure depicts the master plan developed by the consulting firm Sheltech for the BSMSN project
site.
162 International Monetary Fund 163 Bangladesh Garments Manufacturers and Exporters Association

24 February 2021
PwC 90
Figure 27: Master plan prepared by Sheltech for BSMSN
Source: Masterplan report prepared by Sheltech for BSMSN
The above figure shows the proposed economic zone lies in the heavy industrial area designated within the
masterplan developed by Sheltech for the BSMSN region. Hence only heavy industries are considered for further
evaluation in this industry assessment chapter. This also complements the strategic location of economic zone
along the coastline, which makes handling of heavy goods cost effective, and lets industries handle the EXIM
supply chain with minimum costs. The proposed Mirsarai port is also likely to offer these industries a trade
gateway, as well as major cargo transportation hub for the domestic and international logistics of heavy cargo.
Hence the heavy industries are considered for the proposed EZ.
The following heavy industries of the above set of initial shortlists is considered for further evaluation. These
industries are:
• Chemicals
• Non-Metallic Minerals
• Automobiles and Accessories
• Petroleum Products
• Heavy Machinery, Iron and Steel, and Metals
• Shipbuilding and Shipbreaking
All these sectors have either demonstrated sound growth or part of the priority sectors identified by the
Government or are going to come up in the future.
24 February 2021
PwC 91
5.3. Outlook of Industrial Landscape in the Future
Bangladesh has set forth an ambitious growth target of shaping up as a developed economy by 2041. However, it
is imperative to note that in the recent times, due to the COVID-19 outbreak, various disruptions in global supply
chain and industrial linkages are taking place. A deep recession has loomed across the globe and UN trade agency
highlights that COVID-19 is likely to cost economy USD 1 trillion during 2020. Bangladesh is no exception, RMG
sector has already witnessed cancellation of orders around USD 3 billion from 1,059 Bangladeshi suppliers. This
could result in employment loss of more than 1.44 million workers and export loss in the range of USD 4 billion.164
5.3.1. Impact of COVID-19 on the Initial Shortlist of Industries
Harvard Business Review (HBR) indicates that the largest 1,000 companies or their suppliers own more than
12,000 facilities in COVID quarantine areas. Since the past decade, China (the epicenter of COVID-19) has
gradually established itself as the hub of electronics, technology products, industrial, and automotive
manufacturing. China has placed itself as the second largest importer (USD 1.674 trillion in 2019) accounting for
~9.1% of global imports and largest exporter (USD 2.524 trillion in 2019) accounting for ~13.7% of global exports.
COVID-19 will hinder this EXIM relationship between China and rest of the world. Bangladesh, owing to its
import dependency on China is expected to suffer a massive slowdown in its industrial growth.
Industrial slowdown will directly impact supply chain, logistics, and shipping sector. Worldwide COVID-19 has
disrupted supply chain of all commodities. HBR reviews indicate that COVID-19 has disrupted supply chains for
nearly 75% of US companies. Baltic Dry Index (BDI) is down by 52% since December 2019. This steep fall in the
BDI indicates substantial idle bulk shipping capacity.
While global economy is expected to contract by 2.2% in 2020 and this contraction would be highest in the G-20
economies.165 These G-20 nations are the primary market for the RMG sector of Bangladesh, which is the
backbone of the economy. Anticipated landslide in RMG sector might create a cascading effect and as a result
further creates impact on other industrial sectors. World Bank indices indicate that the regional growth of South
Asia would decline to a range between 1.8% to 2.8% in 2020 (from 6.3% projected six months back). Although
various fiscal stimulus has been declared to revive the economy, the growth forecast in the coming 2 years is bleak
for the country. World Bank indices indicate that real GDP of Bangladesh is expected to grow at:
• 2% to 3% in 2020 (it was 8.2% in 2019)
• 1.2% to 2.9% in 2021
• 2.8% to 3.9% in 2022
World Bank also has estimated the industry growth rates for Bangladesh between 2020-22, which are:
• ~2% in 2020 (from ~12.7% in 2019)
• ~3.5% in 2021
• ~6.1% in 2022
Recovery from this pandemic would take 3 to 4 years (at least) for the country. Bangladesh lacks indigenous
production of raw materials and natural resources and the country is primarily import dependent on China and
India. Apart from Textile & RMG and leather (constitute over 80% of export basket), all other sectors are domestic
consumption oriented. Since the country is highly dependent on foreign trade, global slowdown will result in
significant dip across the industrial sectors of the country.
In the following, a broad level assessment has been undertaken on the possible impact of COVID-19 across
industrial sectors of the country.
164 PwC Research 165 World Economic Forum

24 February 2021
PwC 92
Table 30: Industrial sector profiling and impact assessment due to COVID-19
Industrial sectors Prevailing overview of the sector Expected impact of COVID-19
Chemicals
• Domestic consumption driven
industry, with significant import
dependency
• Domestic production is estimated to
grow between 1-2% in the next five
years.
• Import of ~835 million USD worth
organic chemicals in 2019, while
~392 million USD worth inorganic
chemicals were imported in the same
year.
• High impact in short term as
imports are affected and industrial
needs getting depleted
• Low impact in long terms, as
industrial production will continue
once the pandemic recovers
2 3
Non-metallic minerals
• Majorly domestic consumption
market driven industry.
• Exports are limited. Exports worth
~47 million USD in 2019, while
imports were recorded at ~247
million USD in the same year.
• Volatile nature of exports with few
years depicting growth in exports
while few years decrease.
• Industry is estimated to grow north of
~10% in the coming five years.
• Low impact in long term due to
nature of products, and demand for
construction, real estate (major
consumer industries) is likely to go
back to normal in long term as
pandemic recovers.
• In short term, there is significant dip
in the demand for industry products
(e.g. cement, ceramics, and glass),
and hence considerable impact
• Disruption in recently rising exports
from Bangladesh might impact in
long term in international market.
2 3
Automobiles and
accessories
• Domestic market consumption-
based industry. Most of the
domestically consumed materials is
imported.
• Exports worth ~95 million USD in
2019, and it is estimated to grow
north of 5% YOY in the coming five
years.
• Imports were recorded worth ~1075
billion USD in 2019
• Low impacts in long term
considering the nascent stage of
development of industry in the
country.
• Few assembly plants are closed amid
lockdown, and hence decrease in
domestic production in short term.
• Possible impact on domestic
consumption market, as global
supply chains (and hence
production lines) are likely to be
disrupted
1 3
Heavy Machinery,
Iron, Steel and Metal
• Import dependency, and low exports
in the sector
• Low impacts in long term
considering the nascent stage of
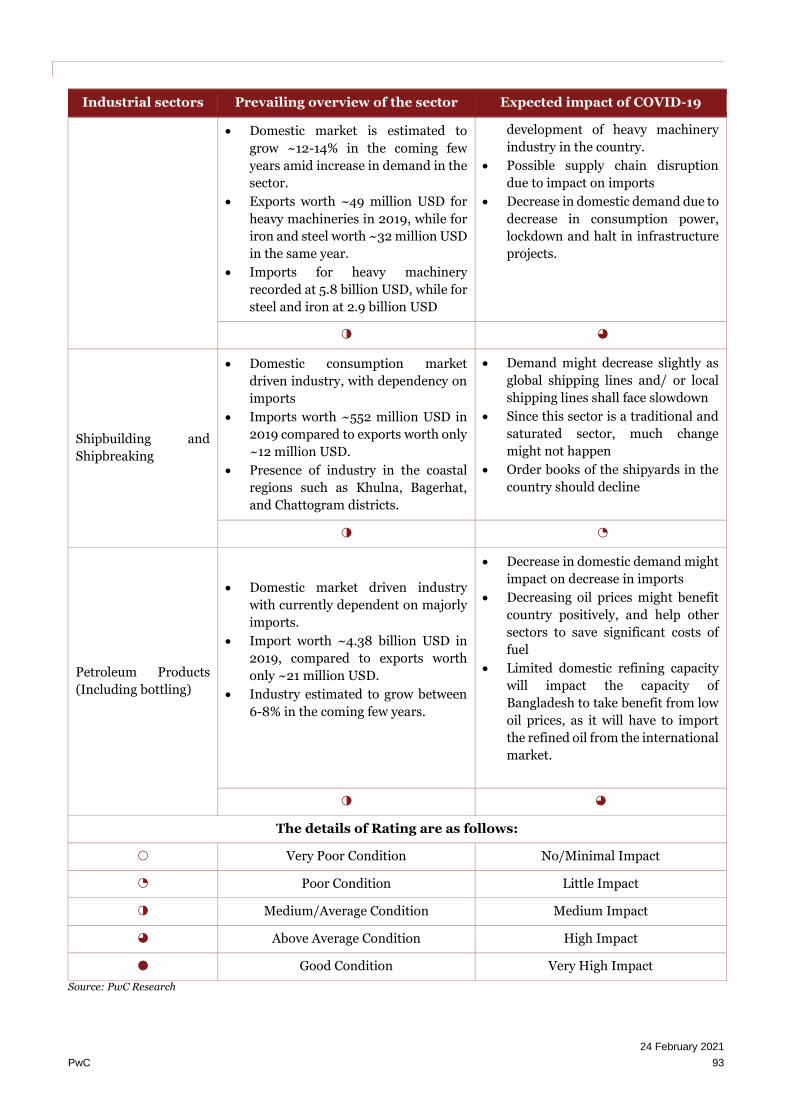
24 February 2021
PwC 93
Industrial sectors Prevailing overview of the sector Expected impact of COVID-19
• Domestic market is estimated to
grow ~12-14% in the coming few
years amid increase in demand in the
sector.
• Exports worth ~49 million USD for
heavy machineries in 2019, while for
iron and steel worth ~32 million USD
in the same year.
• Imports for heavy machinery
recorded at 5.8 billion USD, while for
steel and iron at 2.9 billion USD
development of heavy machinery
industry in the country.
• Possible supply chain disruption
due to impact on imports
• Decrease in domestic demand due to
decrease in consumption power,
lockdown and halt in infrastructure
projects.
2 3
Shipbuilding and
Shipbreaking
• Domestic consumption market
driven industry, with dependency on
imports
• Imports worth ~552 million USD in
2019 compared to exports worth only
~12 million USD.
• Presence of industry in the coastal
regions such as Khulna, Bagerhat,
and Chattogram districts.
• Demand might decrease slightly as
global shipping lines and/ or local
shipping lines shall face slowdown
• Since this sector is a traditional and
saturated sector, much change
might not happen
• Order books of the shipyards in the
country should decline
2 1
Petroleum Products
(Including bottling)
• Domestic market driven industry
with currently dependent on majorly
imports.
• Import worth ~4.38 billion USD in
2019, compared to exports worth
only ~21 million USD.
• Industry estimated to grow between
6-8% in the coming few years.
• Decrease in domestic demand might
impact on decrease in imports
• Decreasing oil prices might benefit
country positively, and help other
sectors to save significant costs of
fuel
• Limited domestic refining capacity
will impact the capacity of
Bangladesh to take benefit from low
oil prices, as it will have to import
the refined oil from the international
market.
2 3
The details of Rating are as follows:
0 Very Poor Condition No/Minimal Impact
1 Poor Condition Little Impact
2 Medium/Average Condition Medium Impact
3 Above Average Condition High Impact
4 Good Condition Very High Impact
Source: PwC Research

24 February 2021
PwC 94
Owing to COVID-19, disruptions have taken place across the industrial sectors in Bangladesh; however, this may
also result in opportunities. It is imperative that the country continues scouting for foreign investors and the EZ
is also marketed to attract the foreign manufacturing players to set up their units in Bangladesh.
The onset of USA-China trade war prompted a lot of foreign companies to migrate from China and shift to other
South Asian locations. In order to reduce higher tariffs imposed by USA, many Chinese players are also relocating.
In the post COVID era, multiple foreign players shall move out from China; recent news articles indicate that
Japanese companies are being incentivized to move from China.
Bangladesh as an investment destination offers low cost of operations and low cost of human resources. During
these uncertain times, the companies must choose between opting for automation to reduce cost or to relocate to
such locations which offer lower cost of manufacturing- Bangladesh is right suited for the same. In order to attract
these foreign investors, the EZ regime should attract investors by offering competitive fiscal incentive packages
(such as higher tenure for corporate tax exemption, import duty waiver on used machineries).
5.3.2. Evolution of Industrial Outlook in the Future
While the impact of COVID-19 is expected to last for the coming 3-5 years, post which the industrial outlook shall
improve. Keeping cognizance of the ulterior objective of GoB in shaping up the country as developed economy by
2041, in the long-run, Bangladesh should focus on Industry 4.0. The term Industry 4.0 encompasses a promise
of new industrial revolution. It is the digital transformation of industrial markets; specifically manufacturing
industry driven by four disruptions: the astonishing rise in data volumes, computational power, connectivity and
business intelligence capabilities.166 It takes the automation of manufacturing processes to a new level by
introducing customized and flexible mass production technologies.
According to recent research study by McKinsey Global Institute, industries with highest potential for automation
are manufacturing, accommodation, food services, transportation and warehousing. Experts forecast that
businesses will be able to increase their productivity by about 30% using Industry 4.0 by 2025.167 Bangladesh
being a developing economy depends on export of manufactured products to foreign countries. However, with
the advent of industry 4.0 regime, manufacturing is becoming less labor intensive, which might create challenges
for manufacturing industry in Bangladesh, which is majorly driven by cheap labor in the country. In light of
Industry 4.0, it is pertinent for countries like Bangladesh, to do away with cheap labor being the primary driver
of competitiveness and focus on infrastructure & logistics, research & development, and technology will be
required to remain competitive in a changed industrial landscape. Therefore, it is imperative to develop the
management of manufacturing and chain productions so that the efficiency would be substantially increased
which is a strong indicator that Industry 4.0 is crucial for Bangladesh to move forward. Bangladesh needs the
adaptation of Industry 4.0 not only to increase the industrial production but also to bolster the overall socio-
economic growth.
Table 31: How Industry 4.0 shall change the outlook of industrial sectors by 2041
Industrial sectors Solutions through Industry 4.0 (2041)
Chemicals
• Deployment of connected systems and analytical models for predictive asset
management.
• Bangladesh can get ready for export-oriented manufacturing by streamlining
the operations. Technologies such as AI, Robotics and additive
manufacturing can be efficiently integrated to digital transform the
operations in the chemical industry.
166 McKinsey Publications

24 February 2021
PwC 95
Industrial sectors Solutions through Industry 4.0 (2041)
• Smart techniques introduced by industry 4.0 can help this sector in
enhancing productivity and aligning manufacturing operations.
Non-metallic minerals
• Issues such as rising costs, enormous energy consumptions and overall
complexity can be reduced with the help of 4.0 techniques such predictive
analytics maintenance, end-to-end optimization thereby improving
operational efficiency and reducing operational costs.
Automobiles and
accessories
• Technologies such as Machine learning and Advanced analytics help with
greater connectivity with their automobiles, pushing the industry to evolve.
• Bangladesh needs to focus on promotion of more research and development
in the automobile sector and through induction of new technologies in the
production lines.
Heavy Machinery,
Iron, Steel and Metal
• Manufacturing can be done efficiently through Industry 4.0 concepts and
new developed manufacturing techniques such as Smart factories and Smart
manufacturing.
Shipbuilding and
Shipbreaking
• Smart Ship building by introducing robotics, 3-D printing technology to
increase the efficiency.
• Bangladesh needs to focus on promotion of more research and development
in this sector and through induction of new technologies in the production
lines so as to reduce the production and operational cost and increase its
production efficiency.
Petroleum Products
(Including bottling)
• Smart Sensors in the Oil refineries enhance the monitoring the safety and
functionality of all processes.
• Similar automation and digitization techniques in this sector such as
Information Management systems etc. will play a crucial role in the
upliftment of this sector.
Source: PwC Research
Above discussions bring out the popular industrial sectors in Bangladesh context and how the future would shape
up for these sectors. Following section delves into the holistic assessment of the region surrounding the proposed
EZ to understand the suitability of the initial shortlist of industries in site surrounding context.
5.3.3. Key Areas to Focus for Bangladesh
As established in the earlier sections, the effect of this pandemic would be prolonged in case of industrial
manufacturing sector. Although, sectors such as Food & Beverages, Agro-based products, and Pharmaceuticals
are somewhat immune against this but on a broader spectrum, overall industrial growth is expected to be lower
than previously optimistic growth rates projected in the pre-COVID era. In order to cope and emerge stronger
economically, Bangladesh should focus on certain areas and define its strategy in both short and long term. The
table below tries to highlight certain tactics (short term) and strategies (long term) which could help Bangladesh
minimize the ill-effects of this pandemic on its economy.
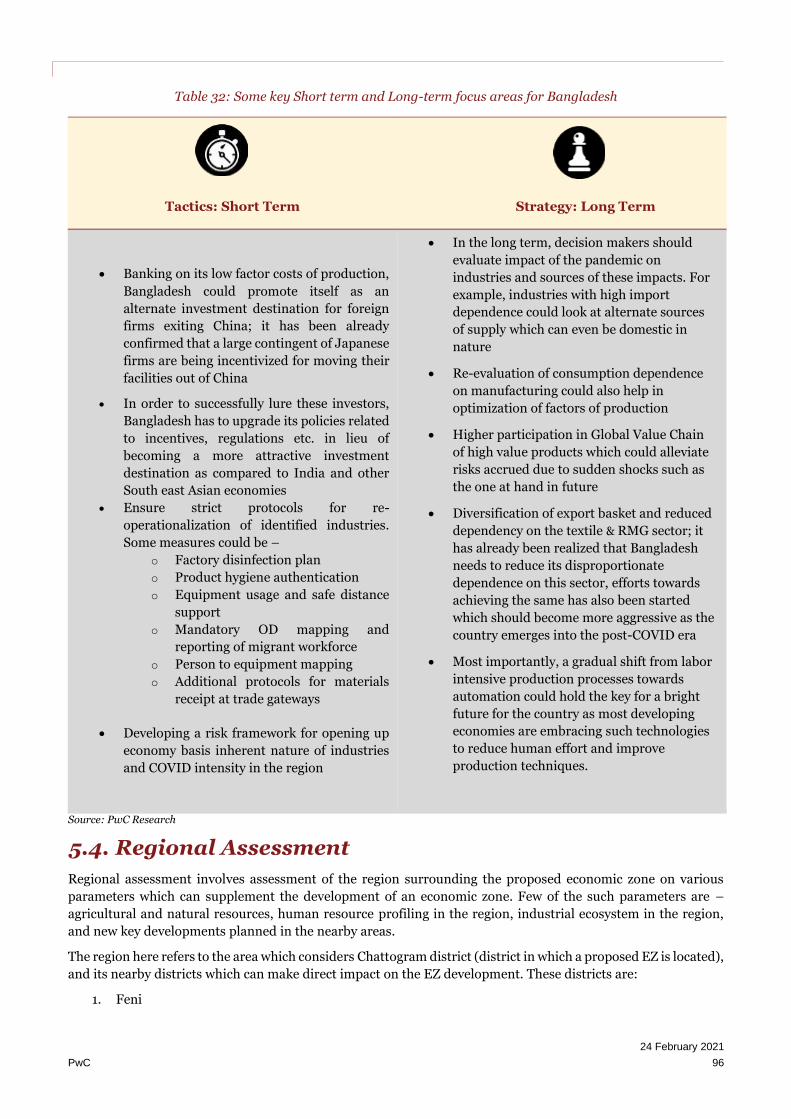
24 February 2021
PwC 96
Table 32: Some key Short term and Long-term focus areas for Bangladesh
Tactics: Short Term
Strategy: Long Term
• Banking on its low factor costs of production,
Bangladesh could promote itself as an
alternate investment destination for foreign
firms exiting China; it has been already
confirmed that a large contingent of Japanese
firms are being incentivized for moving their
facilities out of China
• In order to successfully lure these investors,
Bangladesh has to upgrade its policies related
to incentives, regulations etc. in lieu of
becoming a more attractive investment
destination as compared to India and other
South east Asian economies
• Ensure strict protocols for re-
operationalization of identified industries.
Some measures could be –
o Factory disinfection plan
o Product hygiene authentication
o Equipment usage and safe distance
support
o Mandatory OD mapping and
reporting of migrant workforce
o Person to equipment mapping
o Additional protocols for materials
receipt at trade gateways
• Developing a risk framework for opening up
economy basis inherent nature of industries
and COVID intensity in the region
• In the long term, decision makers should
evaluate impact of the pandemic on
industries and sources of these impacts. For
example, industries with high import
dependence could look at alternate sources
of supply which can even be domestic in
nature
• Re-evaluation of consumption dependence
on manufacturing could also help in
optimization of factors of production
• Higher participation in Global Value Chain
of high value products which could alleviate
risks accrued due to sudden shocks such as
the one at hand in future
• Diversification of export basket and reduced
dependency on the textile & RMG sector; it
has already been realized that Bangladesh
needs to reduce its disproportionate
dependence on this sector, efforts towards
achieving the same has also been started
which should become more aggressive as the
country emerges into the post-COVID era
• Most importantly, a gradual shift from labor
intensive production processes towards
automation could hold the key for a bright
future for the country as most developing
economies are embracing such technologies
to reduce human effort and improve
production techniques.
Source: PwC Research
5.4. Regional Assessment
Regional assessment involves assessment of the region surrounding the proposed economic zone on various
parameters which can supplement the development of an economic zone. Few of the such parameters are –
agricultural and natural resources, human resource profiling in the region, industrial ecosystem in the region,
and new key developments planned in the nearby areas.
The region here refers to the area which considers Chattogram district (district in which a proposed EZ is located),
and its nearby districts which can make direct impact on the EZ development. These districts are:
1. Feni

24 February 2021
PwC 97
2. Khagrachari
3. Rangamati
4. Noakhali
All the above four districts are part of Chattogram division. This section will attempt to understand the profile of
the region and will assess the region for understanding the better industrial mix at the proposed economic zone.
Few details about the districts in the influence region are as shown in Table 33:
Table 33: Key details about districts in the influence region
Sr.
No
Name of the
District
Area in Sq.
Km
Population
(2020,
estimated) in
Million
Per Capital
GDP (Current
USD) #
Average
Consumption
Expenditure
(USD per
Capita)
1 Feni 990 1.59 1,186 1,313
2 Khagrachari 2,749 0.68 1,110 918
3 Rangamati 6,116 0.66 1,670 1,025
4 Noakhali 3,686 3.45 1,337 1,471
5 Chattogram 5,283 8.45 2,500 1,372
#-Estimated for 2018, the country’s per capita GDP is for year 2018
Source: Lagging District Survey (LGED), Bangladesh Bureau of Statistics, and World Bank Database
Chattogram and Rangamati are the largest districts in the influence region, but Chattogram hosts largest
population due to its high population density and the presence of Chattogram city, the major urban centre in
Bangladesh after Dhaka, and the port city of Bangladesh. Chattogram district also has the highest per capita GDP
in the influence region, as it is the largest industrial hub in the country after Dhaka city. Given the high-income
levels in the district, it is also estimated to have high per capita consumption expenditure.
5.4.1. Demographics of the Influence Region
Chattogram district, located in the South East of capital city Dhaka and part of the Chattogram division is
estimated to have ~8.45 million population in the district by 2020, and its share in the national population is
estimated to be ~5.5%. The district has almost equitable population of both male and female, and considerable
population of the district resides in the rural areas.
Graph depicted in Figure 28 tries to depict the gender wise population distribution in the district.
Figure 28: Gender wise Population Distribution in the District (2020 estimated)
47.89%
50.80%
49.60%
52.11%
49.20%
50.40%
44%
46%
48%
50%
52%
54%
Urban Areas Rural Areas Total
Per
cen
tag
e o
f to
tal
po
pu
lati
on
Female Male

24 February 2021
PwC 98
Note: The ratio is calculated on the basis of population estimated for 2020
Source: Population and Housing Census, Bangladesh Bureau of Statistics
It may be noted from Figure 28 that, proportion of female population in the rural is higher compared to the male
population, while the opposite is observed in case of urban areas. At the overall district level, the male population
is marginally higher than the female population.
Graph in Figure 29 depicts the gender wise distribution of population as well as population distribution by urban
rural divide for all the districts which are part of the influence area.
Figure 29: Gender wise and Urban-Rural Distribution for Districts in influence region (2020 estimated)
Note: The ratio is calculated on the basis of population estimated for 2020 Source: Population and Housing Census, Bangladesh Bureau of Statistics
It may be noted that, female population is marginally higher than the male population in Feni and Noakhali
districts, while the opposite is observed in case of Khagrachari, Rangamati and Chattogram district. Also, the
share urban population is highest in Chattogram district (~41%) while it is lowest in Noakhali district (~16%),
while for the rest of the districts, the share lies mainly in the range of 20% - 27%. The high urban population is
observed in Chattogram district mainly because of presence of Chattogram city, one of the major cities in
Bangladesh. Additionally, the equitable distribution of the population across the gender depicts the employability
of local population across various industries, be that textile & RMG industry where female employees are
observed dominating in the country, or heavy industries where male employees are mostly observed.
The quality of manpower is generally determined by literacy rate. The literacy rate of the districts in the influence
area is depicted in the Figure 30.
Figure 30: Literacy rate for population in the influence region (2020 estimated)
Note: The numbers are estimated for 2020, on the basis of latest results in 2011 census.
Source: Population and Housing Census, Bangladesh Bureau of Statistics
20%
35%
27%
16%
41%
0%
10%
20%
30%
40%
50%
60%
Feni Khagrachhari Rangamati Noakhali Chittagong
Per
cen
tag
e o
f to
tal
Po
pu
lati
on
Female Male Urban Population
64.91%
50.36%55.98%
50.95%
62.11%
0%
10%
20%
30%
40%
50%
60%
70%
Feni Khagrachhari Rangamati Noakhali Chittagong
Lit
era
cy R
ate

24 February 2021
PwC 99
As depicted in the figure above, Feni and Chattogram district have higher literacy rate compared to other districts
in the influence region. All the districts have literacy rate above ~50%, and hence have availability of skilled as
well as unskilled labor.
Most of the people residing in Chattogram district are employed in manufacturing sector, followed by wholesale
and retail trade sector. Similar trend is observed across other districts such as Feni and Khagrachari. In
Rangamati and Noakhali, wholesale and retail trade are major employer, followed by manufacturing sector.
Sourcing of Human Resources
It is important to have adequate training and educational infrastructure in the district in order to train the
manpower. There are total 466 technical and vocational educational training institutions in the district. The
following table depicts the number of TVET institutions in influence region and their distribution as per the type
of institutions.
Table 34: TVET Institutes in Chattogram district
Type of Institute Feni Khagrachari Rangamati Noakhali Chattogram
Polytechnic Institutes 6 - 2 2 16
HSC (Business Management) 3 2 1 2 10
Training Institute (Basic skill development)
66 37 17 92 330
Vocational Secondary Education 1 1 - 7 8
General Secondary School (Attached vocational education)
12 3 3 11 33
Institute of Medical Technology 2 1 - 6 10
Nursing Institute 1 - 3 1 6
Union Digital Centre (UDC) 3 12 7 42 24
Technical School and College 1 1 - 2 -
Office (Training) 15 15 10 8 29
Total 110 72 43 173 466
Source: TVET Institution Census
The TVET institutions offer various trainings such as welding, plumbing, and carpentry, which can be directly
used in the industry. These courses will help factories in proposed EZ to get workforce, while will also offer
employment option to the local youth. Industries in the EZ can also collaborate with the TVET institutions for
training purposes and new innovative and on demand courses may be started in these TVET institutions through
industry-academia collaboration.
The unskilled labor can be easily sourced from influence region and other areas of Chattogram division.
Generally, in Bangladesh, unskilled labor is not a big challenge, as migration of unskilled labor is quite prevalent
and widespread in the country. The only challenge is for skilled or semi-skilled labor, which can also be sourced
from various TVET institutions in the district, and districts in the influence region. Development of economic
zone in the district will also restrict the trend of people migrating from the district to the urban areas close to
Dhaka and Chattogram in search of employment.
5.4.2. Access to Natural Resources
Natural resources are essential for the development of manufacturing industry, and hence access to them is one
of the major criteria for the assessment of region and industry profile of the industrial hub. As per the master
Districts in the influence region have availability of skilled as well as unskilled labor, and hence industries such as electrical and electronics, automotive and transport equipment,
iron and steel, chemicals, non-metallic minerals, and heavy machineries have opportunities to get developed in the proposed EZ.
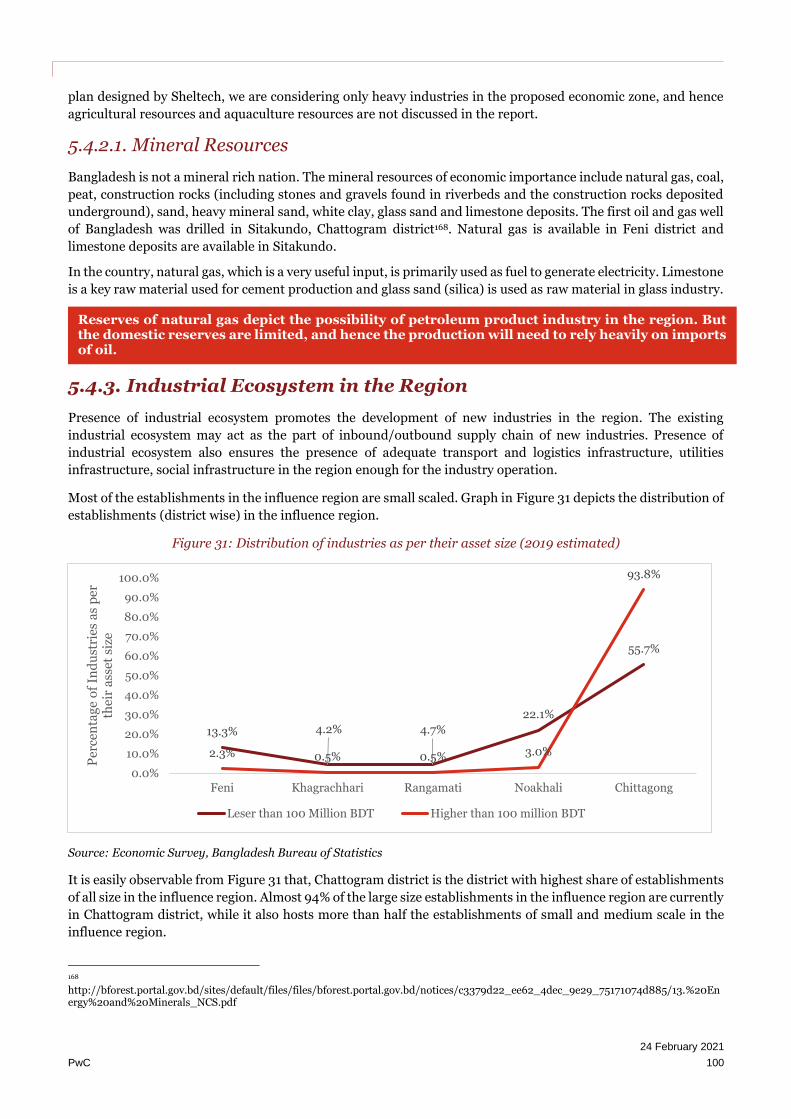
24 February 2021
PwC 100
plan designed by Sheltech, we are considering only heavy industries in the proposed economic zone, and hence
agricultural resources and aquaculture resources are not discussed in the report.
5.4.2.1. Mineral Resources
Bangladesh is not a mineral rich nation. The mineral resources of economic importance include natural gas, coal,
peat, construction rocks (including stones and gravels found in riverbeds and the construction rocks deposited
underground), sand, heavy mineral sand, white clay, glass sand and limestone deposits. The first oil and gas well
of Bangladesh was drilled in Sitakundo, Chattogram district168. Natural gas is available in Feni district and
limestone deposits are available in Sitakundo.
In the country, natural gas, which is a very useful input, is primarily used as fuel to generate electricity. Limestone
is a key raw material used for cement production and glass sand (silica) is used as raw material in glass industry.
5.4.3. Industrial Ecosystem in the Region
Presence of industrial ecosystem promotes the development of new industries in the region. The existing
industrial ecosystem may act as the part of inbound/outbound supply chain of new industries. Presence of
industrial ecosystem also ensures the presence of adequate transport and logistics infrastructure, utilities
infrastructure, social infrastructure in the region enough for the industry operation.
Most of the establishments in the influence region are small scaled. Graph in Figure 31 depicts the distribution of
establishments (district wise) in the influence region.
Figure 31: Distribution of industries as per their asset size (2019 estimated)
Source: Economic Survey, Bangladesh Bureau of Statistics
It is easily observable from Figure 31 that, Chattogram district is the district with highest share of establishments
of all size in the influence region. Almost 94% of the large size establishments in the influence region are currently
in Chattogram district, while it also hosts more than half the establishments of small and medium scale in the
influence region.
168 http://bforest.portal.gov.bd/sites/default/files/files/bforest.portal.gov.bd/notices/c3379d22_ee62_4dec_9e29_75171074d885/13.%20Energy%20and%20Minerals_NCS.pdf
13.3% 4.2% 4.7%
22.1%
55.7%
2.3% 0.5% 0.5% 3.0%
93.8%
0.0%
10.0%
20.0%
30.0%
40.0%
50.0%
60.0%
70.0%
80.0%
90.0%
100.0%
Feni Khagrachhari Rangamati Noakhali Chittagong
Per
cen
tag
e o
f In
du
stri
es a
s p
er
thei
r a
sset
siz
e
Leser than 100 Million BDT Higher than 100 million BDT
Reserves of natural gas depict the possibility of petroleum product industry in the region. But the domestic reserves are limited, and hence the production will need to rely heavily on imports of oil.

24 February 2021
PwC 101
5.4.3.1. Chattogram District
As discussed above, Chattogram district is the second biggest industrial hub in Bangladesh after capital city
Dhaka and its nearby regions, and hence it hosts maximum share of establishments in the influence region.
District hosts Chittagong port, which is the biggest and the only major port in Bangladesh, and hence handles
~90% of the EXIM related cargo in the country by volume. Due to its key role as the major trade gateway in
Bangladesh, the district has developed significantly and is currently the major hub for investment in the country.
As discussed previously, district has manufacturing sector as the major sector with maximum employment,
followed by wholesale and retail trade. The following table depicts the employment as well as establishment trend
in the district:
Figure 32: Sector wise share of total engaged person and total establishments in the district
Source: Bangladesh Bureau of Statistics
Chattogram district has presence of wide range of industries from food and beverages, textile and RMG, leather
and footwear, non-metallic minerals, metals, iron and steel, heavy machineries, pharmaceuticals, chemicals,
plastic and rubber, furniture, and oil. These industries have potential to play a key role as the feeder industries
for the heavy industries in the proposed economic zone. Large number of establishments in the district produce
export-oriented products, as they can be easily exported via Chittagong port. The major industrial players in the
district are depicted in the following figure:
Figure 33: Major industrial Players in Chattogram District
Source: PwC research
Chattogram hosts the only oil refinery in Bangladesh, Eastern Refinery Limited, and also is home to shipbreaking
industry in the country. Chattogram is known as the world’s cheapest place to break ships, and hence ship
0.00%
10.00%
20.00%
30.00%
40.00%
50.00%
60.00%
Manufacturing Wholesale andRetail Trade
Accomodationand Travel
Services
Transportationand Storage
Services
Education Other EconomicActivities
Sh
are
of
To
tal
Va
lue
s in
th
e D
istr
ict
% of total person engaged % of total establishments

24 February 2021
PwC 102
breaking is one of the major industries in the district. Chattogram district has dedicated ship-breaking yard
located in the Sitakundo upazila, which employs over 0.2 million w0orkforce, and produces up to 60% of the steel
used in Bangladesh is manufacturing through scrap generated from ship breaking industry.169 But domestic
industry faces challenges with respect to the lack of sustainable practices followed in shipbreaking, and industry
witnesses several accidents a year due to this, even causing the death of working personnel in few cases.170
Chattogram district is also hosts Progati Industries Limited - vehicle assembly plant, and Mitsubishi is planning
to invest ~100 million USD in Bangladesh at BSMSN for the car manufacturing facility.
Dedicated shipbreaking yard is located at Faujdarhat, in Sitakundo upazila of Chattogram district. The
shipbreaking yard is the world’s largest shipbreaking yard and handles about fifth the total ship breaking across
the globe. The shipyard employs over 200 thousand people and is responsible for almost half the steel produced
in Bangladesh. The shipbreaking industry in the district is facing challenges with respect to the safety of the
workers, and hence fatalities due to accidents in the industry is quite common, and hence a topic of debate. Habib
steels, AG Shipbreaking Industries, Ratanpur Ship Recycling Industries, PHP Shipbreaking Industries, and Raja
Shipbreaking Yard are few major ship breaking firms operating in the district.
In addition to the above-mentioned stand-alone industries, Chattogram district also hosts few economic zones
which are expected to offer industrial ecosystem for the industries planned to come in the proposed economic
zone in Sitakundo. The economic zones in Chattogram district are detailed in the following table:
Table 35: Economic Zones in Chattogram District
Sr. No Name of the EZ Government/Private Owned
1 Anowara Economic Zone Government
2 Anowara Economic Zone – 2 Government
3 Bangabandhu Sheikh Mujib Shilpa Nagar (BSMSN) Government
4 Karnaphuli Dry Dock Special Economic Zone Private
5 Kazi Farms Economic Zone Ltd. Private
Source: BEZA
As depicted in the above table, three of the five economic zones in the district are government owned, and they
are either in planning or development stage, except BSMSN which has already seen traction from industrial
investors and developers with ~2,500 acres of industrial land already allocated to tenants from various sectors,
while the rest two are private economic zones which are in the development/operation stage.
In addition to the above planned economic zones, Chattogram district also hosts two export processing zones
each at Chattogram and Karnaphuli respectively. The strategic location of these two economic zones being close
to the country’s trade gateway has helped them to get more and more investment every year from the domestic
as well as international investors. Figure 34 and Figure 35 given below depict the investment, employment and
export trends from these two EPZs.
169 The Economist 170 The Guardian

24 February 2021
PwC 103
Figure 34: Export, Investment and Employment Trend in Chattogram EPZ
Source: BEPZA
Figure 35: Export, employment and investment trends in Karnaphuli EZ
Source: BEPZA
The figures given above depict the attractiveness of the region for investment by various industrial investors.
The increasing trend in investment, and hence employment depict the increasing demand for the industrial land,
and the availability of labor in the domestic market. Given such high demand for industrial land in the influence
area, the proposed EZ is expected to play a great role in supplying the land for meeting this increasing land
demand in coming years.
5.4.3.2. Other Districts in Influence Region
Figure 36 depicts the five districts in the influence region around the proposed EZ. These districts are Noakhali,
Feni, Khagrachari, and Rangamati. Industrial ecosystem in these four districts is assessed in the next parts of the
section here.
0
200
400
600
800
1,000
1,200
1,400
1,600
1,800
2,000
0
50,000
100,000
150,000
200,000
250,000
2010 2011 2012 2013 2014 2015 2016 2017 2018 2019 Cu
mu
lati
ve
Inv
estm
ent
in M
n
US
D
Em
plo
ym
ent/
Ex
po
rt i
n M
n
US
D
Employment Export (Mn USD) Cumulative Investment (Mn USD)
0
100
200
300
400
500
600
700
0
20,000
40,000
60,000
80,000
100,000
2010 2011 2012 2013 2014 2015 2016 2017 2018 2019 Cu
mu
lati
ve
Inv
estm
ent
in M
n
US
D
Em
plo
ym
ent/
Ex
po
rt i
n M
n
US
D
Employment Export (Mn USD) Cumulative Investment (Mn USD)

24 February 2021
PwC 104
Figure 36: Nearby districts to the proposed EZ
Source: PwC Analysis
Districts other than Chattogram in the influence region have economy mainly dependent on the agricultural and
other key natural resources produced in the district. Most of the industries in these districts are dependent on
the local natural resources production, which acts as the sources of input. Wholesale and retail trade are the major
employer in these districts, as the presence of manufacturing facilities is limited in them.
Major industries in these districts are rice milling, textile and RMG, weaving and handloom, husking craft mill,
pottery, and furniture. Rice mills are observed in almost every district, as rice is the major agricultural product
in the region. Textile mills are majorly found in Rangamati district, while dry fish processing is found majorly in
Rangamati district, and its presence in other districts is very limited.
In addition to the above-mentioned industries, industries such as food and beverages, agro processing, chemicals,
leather, ship breaking, and automotive are also observed in the influence region. The major industrial players in
this region are – Royal Peak Electrical Industries, Bangladesh Auto Industries Limited, Nasir Food and Agro
Products Limited, Jahan Motors, Reliance Can Industries, Mamun Bricks, Silva Pharmaceuticals, Kazi Food
Industries to name few. The presence of above industries in these districts is likely to help in development of
industries in the proposed EZ, as all the above industries will provide industrial ecosystem, and will supply input
to the establishments coming in the proposed EZ.
5.4.3.3. Bangabandhu Sheikh Mujib Shilpa Nagar (BSMSN)
Sitakundo economic zone is located in Bangabandhu Sheikh Mujib Shilpa Nagar (here onwards called BSMSN),
a flagship project by the of Government of Bangladesh. BSMSN is spread across three upazilas – Mirsarai,
Sitakundo and Sonagazi. Mirsarai and Sitakundo are part of Chattogram district, while Sonagazi is part of Feni

24 February 2021
PwC 105
district. As per the master plan by Sheltech, ~19,766 acres of land from BSMSN lies in Mirsarai and Sitakundo
upazilas, while the rest ~10,335 acres lies in Sonagazi upazila. The location of the industrial city is very strategic,
as it is located in between Chittagong port, the major trade gateway for Bangladesh, and Dhaka city, the major
consumption market in the country. The location is also connected by the major highway of the country, Dhaka
Chattogram Highway (N1), which further connects the zone to the other parts of the country through network of
national and regional highways.
BSMSN spans across 30,000 acres and has coastline of ~25 km with the Bay of Bengal. This coastline is unique
advantage for the BSMSN, as it offers opportunity for the site for the construction of the port, which may help in
transporting of input/output goods from the BSMSN to the desired domestic/international locations via
waterways. Mirsarai port is planned development in the BSMSN, and it is likely to promote the cargo heavy
industries in the region, which have disadvantage of being developed in the country’s mainland majorly due to
logistics challenges. Additionally, the business costs and land costs in this region are comparatively lower, as this
land is not a part of any urban cluster and is located far from the capital city Dhaka.
The BSMSN has proved to be the attractive location for the international as well as domestic investors for setting
up the industries in the country. Many investors have invested in the industrial city for setting up their factories
or organized industrial clusters. Little higher 25 hundred acres of the industrial city is already occupied, and the
rest land is also in high demand. Snapshots of this investment are depicted in the following table:
Figure 37: Investment and land procured by different industries in BSMSN
Source: BEZA
It may be noted from the above figure that industries such as steel, industrial activities, textile and RMG, LPG
and petroleum are among the major industries (as per investment and land acquisition) in the proposed economic
zone. Textile and RMG industry have also shown better investment trend in the BSMSN, and hence it is one of
the major destinations for investment in the proposed EZ.
Major players who have invested in the BSMSN are as depicted in the following table:
-
1,000
2,000
3,000
4,000
5,000
0
200
400
600
800
Inv
estm
ent
in M
illi
on
US
D
La
nd
in
Acr
es
Land in Acres Investment in Million USD

24 February 2021
PwC 106
Table 36: Major firms investing in BSMSN
Note: The sector wise area allocated is depicted in Figure 37 above.
Source: PwC Research
Being located near the coastline, close to the existing Chittagong port, as well as near to the planned Bay and
Patenga terminal, Sitakundo EZ has better opportunity for the development of heavy industries compared to the
others. Heavy industries such as iron and steel, heavy machineries, non-metallic minerals, automotive and
transport equipment have logistical challenges for to be developed in the mainland Bangladesh. But these
industries can be competitively developed in Sitakundo EZ, as logistics can be easily managed due to proximity
to various existing and proposed ports in the region.
Given this advantage of the EZ location, in the master plan developed by Sheltech (as discussed above), ~3956
acres of area is being allocated to the development of heavy industries in BSMSN region. The area in the southern
end of BSMSN as given in the Figure 38 attached below (precinct I).
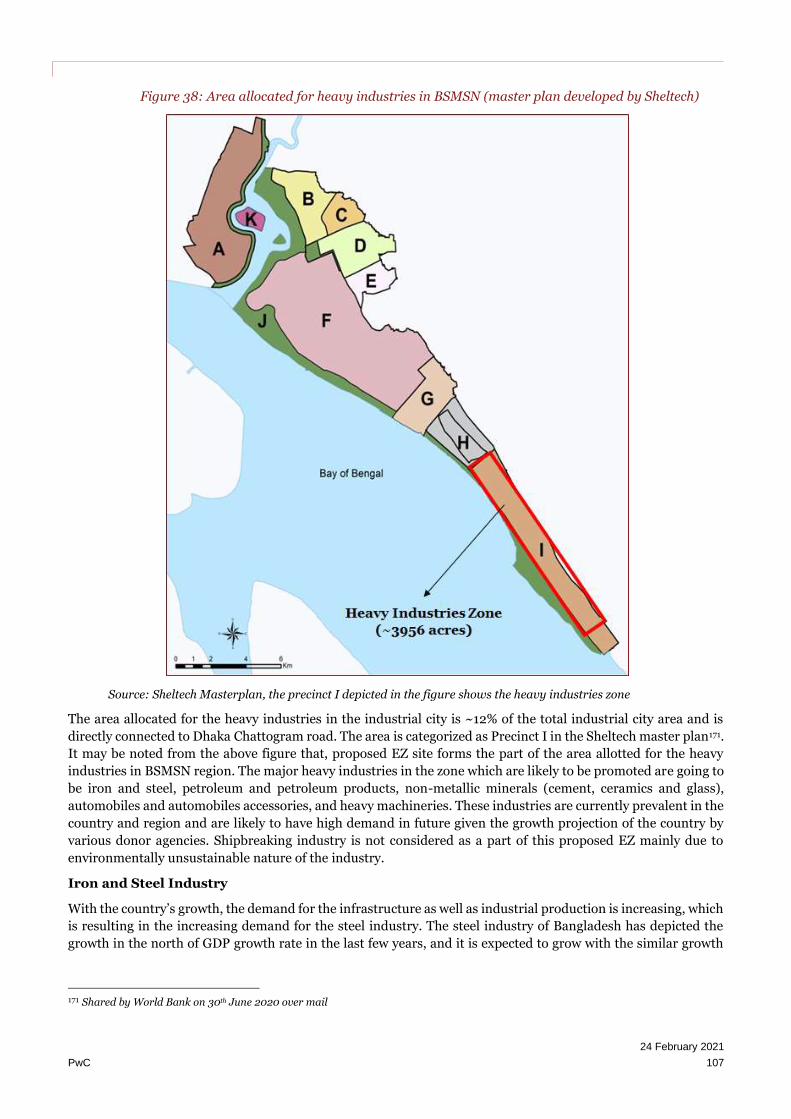
24 February 2021
PwC 107
Figure 38: Area allocated for heavy industries in BSMSN (master plan developed by Sheltech)
Source: Sheltech Masterplan, the precinct I depicted in the figure shows the heavy industries zone
The area allocated for the heavy industries in the industrial city is ~12% of the total industrial city area and is
directly connected to Dhaka Chattogram road. The area is categorized as Precinct I in the Sheltech master plan171.
It may be noted from the above figure that, proposed EZ site forms the part of the area allotted for the heavy
industries in BSMSN region. The major heavy industries in the zone which are likely to be promoted are going to
be iron and steel, petroleum and petroleum products, non-metallic minerals (cement, ceramics and glass),
automobiles and automobiles accessories, and heavy machineries. These industries are currently prevalent in the
country and region and are likely to have high demand in future given the growth projection of the country by
various donor agencies. Shipbreaking industry is not considered as a part of this proposed EZ mainly due to
environmentally unsustainable nature of the industry.
Iron and Steel Industry
With the country’s growth, the demand for the infrastructure as well as industrial production is increasing, which
is resulting in the increasing demand for the steel industry. The steel industry of Bangladesh has depicted the
growth in the north of GDP growth rate in the last few years, and it is expected to grow with the similar growth
171 Shared by World Bank on 30th June 2020 over mail

24 February 2021
PwC 108
rate post the COVID backlash. The industry is expected to have continuous demand in the domestic market, and
hence it is recommended to have this industry in the proposed economic zone.
Steel production in Bangladesh is done by two major methods of production – Blast Furnace Method, and Electric
Arc Furnace Method. The following figure depicts the raw materials requirement for the two methods.
Figure 39: Raw materials requirement for production of 1000 kgs/one MT of crude steel
Source: World Steel Association
It may be noted from the above figure that, for both the methods of manufacturing steel the raw material required
is bulky, and it required transportation to the industry site. In both the methodologies, the input materials
required is almost double the final production of steel, and hence the optimistic location of factory will be near
the center of input rather than consumption for saving on the logistics cost. The major input material in this is
iron ore, which is mostly imported in Bangladesh, and hence being close to the port is will help in easy
procurement of iron ore. Similar is the case with other input materials which are imported in the country and
need to be transported to the factory location from the port. Steel scrap is also easily available in the costal
districts of Bangladesh, and shipbreaking is one of the major industries in these regions.
Petroleum Products
The demand for the petroleum products depicts the growth of industrial development going on in the country.
Bangladesh Petroleum Corporation, the government established, and owned firm currently runs the petroleum
product companies in Bangladesh. There are three oil marketing companies (POCL, JOCL, and MPL), two
lubricant blending companies (Eastern Lubricant Blending, and Standard Asiatic Oil), one LP gas bottling (LP
Gas Ltd), and one refinery which are currently the subsidiaries of BPC.172
The petroleum refinery requires crude oil, which needs to be imported from the middle east nations to Bangladesh
via sea way. As this crude oil is liquid bulk cargo, and transporting it to the factory location is costly, it is necessary
for the oil refinery to be in the proximity of the port. Presently, the only refinery in Bangladesh, eastern refinery
is located in the backyards of Chittagong port, and the imported crude oil is directly transported to the factory
through oil pipeline. Similar to it, the proposed economic zone being located on the coastal region, and also in
the backyards of proposed Mirsarai port, represents unique location for the construction of new oil refinery in
the country.
Various other oil products such as lubricants can also be developed in the same EZ along with the regular refined
oil for further consumption. The oil produced in the refinery can act as input to the various industrial
172 Bangladesh Petroleum Corporation (BPC)
24 February 2021
PwC 109
establishments coming up in the BSMSN region. Also, it can be transported to Dhaka, as well as other major
urban centers through IWT route using oil tankers.
Non-Metallic Minerals
Non-metallic minerals mainly include industries such as cement, glass and ceramics. Along with the increasing
demand of iron and steel (driven by infrastructure development), the demand for the non-metallic industry is
likely to grow in future post the COVID times. Ceramics industry require clay, while glass require sand as major
input material. Even though sand and clay are available in the country, their sources are limited, and there are
challenges with respect their extraction. Hence some sand and clay are imported via Chittagong port as well. On
the other side, ceramics and glass products are also exported to the international market via Chittagong port. In
such scenario, the location of factory near the EXIM trade gateway will play a major role in optimizing the logistics
cost for the industry, for inward as well as outward supply chain.
Cement industry also demands limestone/clinker, which is partly imported in Bangladesh. The required input
materials can be imported via Mirsarai port for the factory located in proposed Sitakundo EZ. Additionally, with
the development of industrial city, and associated social, industrial, urban and utility infrastructure in Mirsarai
region, high demand for cement industry is estimated to come in coming years. Cement factory located in the
proposed EZ can cater to this rising demand with much ease, and hence optimize its logistics cost being close to
the center of input as well as to the consumption market.
Automotive and Heavy Industries
The domestic market of automotive and transport equipment industry of Bangladesh is rising rapidly, and most
of the domestically produced passenger vehicles are imported from outside and refurbished to sale in the
domestic market. The domestic market in Bangladesh is estimated to grow in the north of 5% post the COVID
times, and hence there is going to be huge demand for the domestic production of automotive and transport
equipment. Proposed EZ at Sitakundo represents the strategic location for the development of automotive and
transport equipment industry given advantage over logistics cost, and availability of domestic industrial
ecosystem in the region. Similar is the case with heavy machineries, where Sitakundo EZ can offer strategic
location, and hence will save significantly on the logistics cost.
Chemicals
Being a priority location for the development of petroleum and other heavy industries, the proposed EZ also
represents the strategic location for the development of chemical industry. Chemical industry acts as industry of
input to various heavy industries, while it requires the input from petroleum industry for the preparation of
various organic products. Chemical industry as potential to offer significant employment in the region, and some
of the products manufactured in the industry such as paints have huge demand in the local market. Hence
chemical industry is also shortlisted for the proposed EZ.
Shipbuilding and Shipbreaking
Shipbuilding and shipbreaking is one of the major industries in Chattogram and other districts in the influence
region. These districts, being located on the coastline of the country, have access to the waterfront which helps
them in activities related to shipbuilding and ship breaking. Karnaphuli Dry Dock Private Economic Zone is one
such project the in the nearby region of the proposed EZ site, with an intention to promote the shipbuilding
industry in the region. Additionally, Chattogram district has dedicated shipbreaking yard at Faujdarhat in
Sitakundo upazila, which is the world’s largest shipbreaking yard, and handles about the fifth of total ship
breaking across the world. The shipyard employs over 200 thousand people and is responsible for almost half the
steel produced in Bangladesh. The shipbreaking industry in the district is facing challenges with respect to the
safety of the workers, and hence fatalities due to accidents in the industry is quite common, and hence a topic of
debate. These industries can be one of the major industries in heavy industry sector for the proposed EZ, but they
have significant facilities in the other parts other parts of the influence area and hence proposed EZ might face
challenges in attracting the investment from this sector. Additionally, these industries are not of environmentally
sustainable nature, and hence may be not recommendable for the proposed EZ.

24 February 2021
PwC 110
Plastic and Rubber, Paper and Packaging, and Light Engineering
Plastic and rubber, paper and packaging and light engineering industries can provide input to the heavy
industries in the BSMSN region. Hence, they can be developed in the EZ competitively with much ease as feeder
industries. But given the allocation of the land within proposed Sitakundo EZ to heavy industries, the feeder
industries might not be developed in the proposed EZ.
5.4.3.4. Strategic Assets for the Proposed Economic Zone
Following (Table 37) are some of the key infrastructure development projects that are being undertaken by the
GoB towards the overall improvement of socio-economic condition of this region. These infrastructure projects
have been identified on the basis of secondary research, primary interaction, and with reference from report
submitted by Sheltech.173
Table 37: Key Infrastructure Projects undertaken by GoB in the influence region
Strategic Projects Project Description Expected
Timeline
Responsible
Agency/Firm
Construction of Karnaphuli
Tunnel Project
• Most of country’s export and
import activities are being
carried out through Chittagong
port situated in the mouth of
the Karnaphuli River.
• The proposed tunnel will
connect the Chittagong port
City directly with other side of
the Karnaphuli river and
indirectly with other parts of
the country through Dhaka-
Chattogram-Cox’s Bazar
Highway.
• The width of the river at the site
of the proposed Tunnel is 700
meters and the water depth are
9-11 meters. The indicative
length of the proposed Tunnel
is 2,000 meters174, 175.
The project is
expected to be
completed by
2022
Government of
Bangladesh
173 Shared by World Bank on 30th June 2020 over mail 174 http://www.bba.gov.bd/construction-of-multi-lane-tunnel-under-the-river-karnaphuli-at-Chattogram-city/ 175 http://bba-beta.dayspringltd.com/wp-content/uploads/2015/01/Karnaphuli_tunnel_Feasibility-study-report.pdf
Considering the industrial ecosystem in the region, industries such as iron and steel, heavy machineries, automotive and transport equipment, petroleum products, and non-metallic
minerals are the potential industries to be developed in the proposed Sitakundo EZ.

24 February 2021
PwC 111
Strategic Projects Project Description Expected
Timeline
Responsible
Agency/Firm
Construction of Patenga
Container Terminal
• In order to de-congest
Chittagong port and enhance
its capacity and its array of
services, Chittagong port
Authority is planning to
construct a modern container
terminal at Patenga.
• The proposed PCT is expected
to increase the container
handling capacity of the CPA
(by over 0.40 TEUs) and
contribute to the economic
development of the country.
• Once operational it would
immensely benefit industrial
activity in the region as with
growing container traffic,
turnaround time for vessels
plying through the Chittagong
port would increase thus
affecting lifecycle of finished
goods as well as raw materials
sourced through it.
• Once manufacturing
activities begin at the
proposed EZ, the terminal
would act as an additional
avenue for export and
import of goods.
The project is
targeted to be
completed by
2020. 176
Government of
Bangladesh,
Chittagong port
Authority,
Bangladesh Navy
Construction of Bay
Container Terminal
• The GoB has initiated a move to
construct a bay container
terminal with the Indian credit
to enhance the capacity of
Chittagong port which will
reduce congestion at the port
• The coastal area adjacent to
Halishahar, Chattogram was
primarily identified for the
establishment of the Bay
Container Terminal.
• The project consists of one
multi-purpose terminal and
two container terminals. For
The shipping
ministry has a
target to
launch the Bay
Container
Terminal by
2021 upon
completion of
the first phase
of its work.178
Government of
Bangladesh,
Chittagong port
Authority
176 https://www.dhakatribune.com/bangladesh/development/2019/02/05/patenga-container-terminal-construction-progressing-rapidly 178 http://www.maritimegateway.com/Chittagong-port-bay-container-terminal/
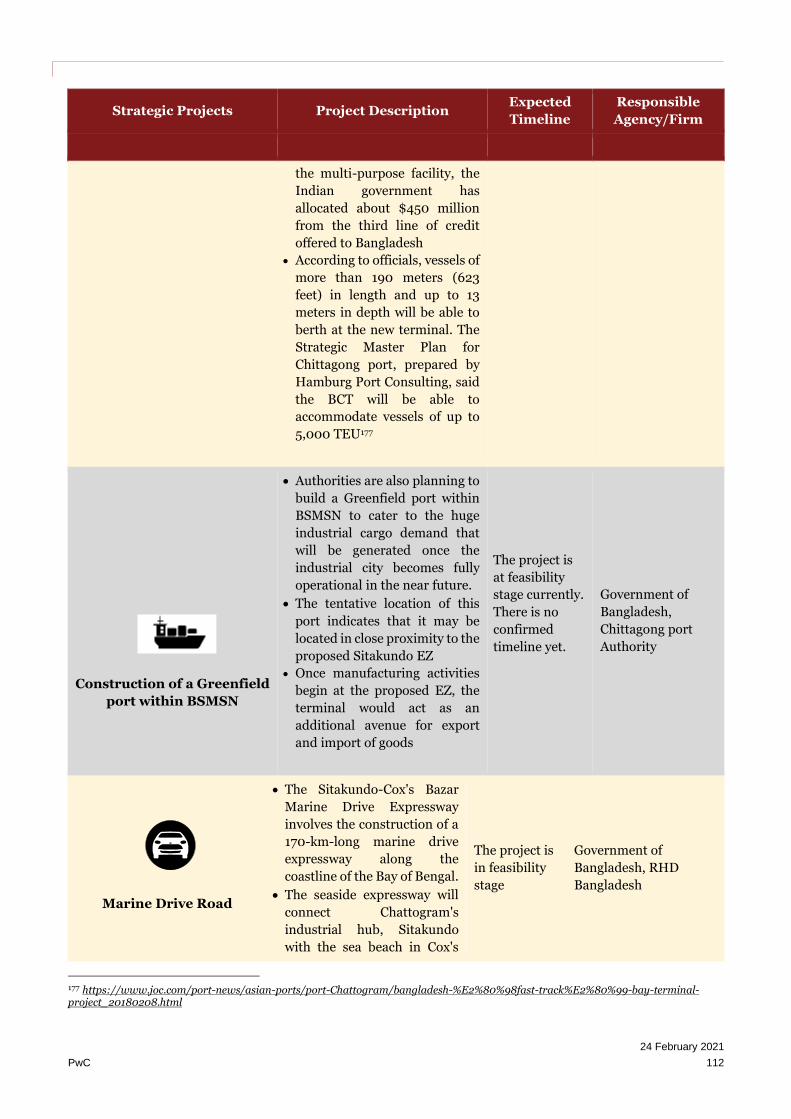
24 February 2021
PwC 112
Strategic Projects Project Description Expected
Timeline
Responsible
Agency/Firm
the multi-purpose facility, the
Indian government has
allocated about $450 million
from the third line of credit
offered to Bangladesh
• According to officials, vessels of
more than 190 meters (623
feet) in length and up to 13
meters in depth will be able to
berth at the new terminal. The
Strategic Master Plan for
Chittagong port, prepared by
Hamburg Port Consulting, said
the BCT will be able to
accommodate vessels of up to
5,000 TEU177
Construction of a Greenfield
port within BSMSN
• Authorities are also planning to
build a Greenfield port within
BSMSN to cater to the huge
industrial cargo demand that
will be generated once the
industrial city becomes fully
operational in the near future.
• The tentative location of this
port indicates that it may be
located in close proximity to the
proposed Sitakundo EZ
• Once manufacturing activities
begin at the proposed EZ, the
terminal would act as an
additional avenue for export
and import of goods
The project is
at feasibility
stage currently.
There is no
confirmed
timeline yet.
Government of
Bangladesh,
Chittagong port
Authority
Marine Drive Road
• The Sitakundo-Cox's Bazar
Marine Drive Expressway
involves the construction of a
170-km-long marine drive
expressway along the
coastline of the Bay of Bengal.
• The seaside expressway will
connect Chattogram's
industrial hub, Sitakundo
with the sea beach in Cox's
The project is
in feasibility
stage
Government of
Bangladesh, RHD
Bangladesh
177 https://www.joc.com/port-news/asian-ports/port-Chattogram/bangladesh-%E2%80%98fast-track%E2%80%99-bay-terminal-project_20180208.html

24 February 2021
PwC 113
Strategic Projects Project Description Expected
Timeline
Responsible
Agency/Firm
Bazar. This expressway will
be connected with the
Bangladesh–China–India–
Myanmar (BCIM) Economic
Corridor and Asian Highway-
41.
• The project includes
approximately 100 bridges
and 80 km of coastal
protection works. Completion
of this marine drive could
help in bringing down the
travel time in the afore-
mentioned route and thus de-
congest Dhaka – Chattogram
Highway. This would also
help in smooth
transportation of goods to
and from Chattogram.
• Once the proposed
infrastructure surrounding
this region is operational, the
proposed EZ is expected to
get a boost towards industrial
development facilitating
smooth cargo movement.
Upgradation of Dhaka –
Chattogram Highway (N1)
• Recently, Dhaka-Chattogram
Highway was upgraded to 4
lanes to ensure fast and smooth
conveyance of goods and
passengers between Dhaka and
Chattogram.
• The 193-kilometer Dhaka-
Chattogram highway,
considered as Bangladesh’s
economic lifeline, has
undergone the upgrade to
accommodate the rising
volume of traffic on this route.
Completed
Government of
Bangladesh, RHD
Bangladesh
• The proposed Dhaka –
Chattogram high-speed railway
will cover 227.3 kilometers of
railway network with six
stations namely Dhaka,
The project
was planned to
be operational
2022 but the
recent
Bangladesh
Railways

24 February 2021
PwC 114
Strategic Projects Project Description Expected
Timeline
Responsible
Agency/Firm
Dhaka – Chattogram high-
speed railway
Narayanganj, Comilla, Feni,
Pahartali and Chattogram.179
• The high-speed on this route
would run at the speed of 300
kilometers per hour and carry
approximately 50,000
passengers daily one way.
• According to the plan, the
double track high-speed rail
would be mostly elevated to
ensure high speed at the level
crossings and other entry
points of the line. For the first
time ballast-less tracks would
be developed in Bangladesh for
this project.
pandemic has
halted its
progress
LPG pipeline between
Chattogram and Tripura
• The Ministry of Petroleum and
Natural Gas has taken up with
Bangladesh for laying a pipeline
for carrying natural gas from
Chattogram to Tripura to meet
the crisis of cooking gas (LPG)
in the North-eastern region
• The pipeline if approved by the
Bangladesh government would
be laid by the side of the rail
lines which pass near the Indo-
Bangla international border
No confirmed
timeline yet
Ministry of
Petroleum and
Natural Gas, Govt.
of India,
Government of
Bangladesh
Development of Super Dike
• Development of 18.4 km long
and 9-meter-high super dike
along the seaside of the project
area
• It is expected to protect the
project site from the tidal
waves.
Not confirmed
yet
Bangladesh Water
Development
Board
5.4.4. Summary of Regional Assessment
The above discussions may be summarized as:
179 https://www.urbantransportnews.com/corona-virus-halted-dhaka-Chittagong-high-speed-rail-project/

24 February 2021
PwC 115
Demographics of the Influence Region
• Most of the population in the influence region resides in the rural region, while the population residing
in the urban areas range within ~20% to ~35% among districts in the influence region
• More than 50% of the population is literate in all the districts, while literacy rate in districts such as
Chattogram district is estimated to be ~65% (highest in the influence region).
• Large number of people are employed in the wholesale and retail sector in the influence region, followed
by manufacturing sector.
• The influence region has abundance supply of unskilled labor, and hence unskilled labor is not a major
challenge. The region also has supply of skilled labor due to presence of Chattogram city, which is one
major urban center of the region. TVET institutions are also present in the district, and influence region
which supply the skilled labor for the various activities in the industrial production.
Access to Natural Resources
• There are no major minerals in the influence region, which may be useful in industrial production. There
are reserves of natural gas in Feni district, which depict the possibility of development of petroleum and
its related industries in the proposed EZ.
Industrial Ecosystem
• Most of the establishments in the influence region are either small or medium scale with assets size worth
lesser than ~100 million BDT. Chattogram is the major industrial hub in the region, and it is home to
more than ~55% of the small and medium scaled factories, and ~94% of the large scaled factories in the
region.
• Chattogram is the major industrial hub in the influence region, and hence it is house for many industries
including heavy industries such as ship breaking, iron and steel, petroleum products, and even feeder
industries such as plastic and rubber, chemicals, and light engineering.
• Bangabandhu Sheikh Mujib Shilpa Nagar (BSMSN) is the planned industrial city by BEZA in the Mirsarai
region and is spanning across ~30 thousand acres in the region. The industrial city is located at the
strategic location between Dhaka and Chattogram and is well connected by Dhaka Chattogram Highway
(N1). The industrial city is expected to get developed in three phases – phase I till 2025, phase II till 2030,
and phase III till 2040.
• BSMSN is expected to host various types of developments, which are light and medium industrial areas,
heavy industry area, residential area, entertainment area, and health centers among others. As per the
master plan prepared by Sheltech and approved by BEZA and the World Bank, the heavy industry area
is expected to be ~3,956 acres in the region, and Sitakundo EZ is the part of the area allotted for heavy
industries.
• Sitakundo EZ, being a part of BSMSN, is expected to host the heavy industries. Being located in the
BSMSN area close to Dhaka Chattogram Highway, and in the backyards of Mirsarai Port along with in
the close proximity of Bay Terminal, the EZ is more suitable for development of heavy industries
compared to other industries such as textile, RMG, and leather & footwear.
• Apart from primary based industries, industries such as shipbreaking, steel and iron, oil refining,
automotive and transport equipment, and heavy machineries are the major industries in the nearby
regions of the district. These industries are likely to offer industrial ecosystem for the development of
heavy industries in the proposed EZ.

24 February 2021
PwC 116
• Industries such as iron and steel, petroleum product, chemicals, automotive and transport equipment,
and heavy machineries can be promoted in the proposed EZ. The industries such as plastic, rubber and
light machineries may act as feeder industries to the proposed industries in the EZ.
• Completion of various planned infrastructure projects is expected to promote the pro-industry
environment in the region further.
Based on the analysis done, an initial shortlist of six sectors were created from the bucket list of 15 sectors. These
shortlisted sectors were found to be most suitable for the proposed EZ due to the compatibility of their forward
and backward linkages, access to factors of production and growth prospects in Bangladesh. The shortlisted
sectors are –
1) Chemicals, 2) Heavy Machinery, Iron & Steel and Metals, 3) Automobile and Automobile Accessories, 4)
Petroleum Products (including bottling), 5) Non-Metallic Minerals 6) Shipbuilding/Shipbreaking
Stepwise approach brings out the shortlist of these six industrial sectors. Next section captures voice on ground to arrive at the final shortlist of industrial
sectors suitable for the proposed EZ

24 February 2021
PwC 117
5.5. Analysis of Survey Results
Former sections delve into assessment of initial shortlist of industries based on top-down approach based on
secondary research and insights obtained through interactions with various govt. departments and data collected
from various sources during the site visit. This section delves into primary stakeholder consultations among
industrial players within the country and from overseas. A total of 85 respondents were interviewed (out of which
66 are Bangladeshi and rest are foreign) to validate the hypothesis formed during the top-down approach. A
questionnaire (which was formed by leveraging our experience in line with the ToR) was used as an instrument
to undertake this primary survey.
5.5.1. Profile of the Respondents
Respondents of this survey were selected from the six sectors shortlisted for the proposed EZ as per the analysis
undertaken in the former sections. As per the ToR, at least 10 local respondents and 3-4 foreign respondents were
surveyed. While the local respondents were interviewed physically, the foreign respondents were interviewed
through telecom and video conference. Local respondents are based out of various locations of the country (such
as Sitakundo, Mirsarai, Chattogram and Dhaka).
Figure 40: Profile of the Respondents
Source: Primary Survey and PwC Analysis
The participants in the stakeholder consultations belonged to diverse set of industries, as indicated in the figure
above. The final shortlist of industries was prepared after taking into consideration the responses received
through these stakeholder consultations.
It is to be noted that the output of the primary survey is dependent on the sample size. If the sample size is
changed, the output may change accordingly. The results obtained in this analysis may also vary during on-
ground implementation of the project.
Chemicals18%
Non Metallic Minerals
19%
Automobiles and Automobile Accessories
17%
Petroleum Products16%
Heavy Machinery, Iron and Steel and
Metals18%
Shipbuilding and Shipbreaking
12%

24 February 2021
PwC 118
In the following various inputs would be analyzed as depicted in the primary survey.
5.5.2. Industry Trends in the Region
In order to understand the growth prospects of the industrial sectors in the region, the respondents were asked
to specify the industries which have witnessed growth in the region and the industries which have relatively
declined in the region.
Figure 41: Responses depicting growth
Source: Primary Survey
Figure 42: Responses depicting decline
Source: Primary Survey
Considering the location advantage of the proposed EZ, manufacturers from Cement, Chemicals, Heavy
Machineries and Iron and Steel, and Petroleum have majorly evinced positive interest about the
growth prospects of their sectors in the region of the proposed EZ as depicted in the figures above.
On the other side, shipbuilding and shipbreaking industry shows high responses depicting decline given the fact
that the industry is not environmentally sustainable, and the proposed EZ is likely to face challenges due to
competition for facilities in the influence area for shipbuilding and shipbreaking industry. Hence shipbuilding
and shipbreaking industry is not considered a part of the industry assessment section for further assessment.
5.5.3. Barriers to Investment
During the stakeholder consultation exercise, the respondents were asked about the current challenges faced by
them in running business in Bangladesh and barriers to investment, specific to the EZ area. The responses
received can be broken up into 3 parts – Bangladesh specific, sector specific and site specific.
28.2%
23.4%
18.5%21.0%
3.2%5.6%
0.0%
5.0%
10.0%
15.0%
20.0%
25.0%
30.0%
Cement Chemicals HeavyMachinery, Iron
and Steel andMetal
Petroleum Automobiles Shipbuilding andShipbreakingP
erce
mta
ge
of
tota
l re
spo
nse
s
12.0% 11.8% 9.3% 6.9% 8.7%
56.8%
0.0%10.0%20.0%30.0%40.0%50.0%60.0%
Cement Chemicals Automobiles andAutomobileAccessories
HeavyMachineries,
Iron and Steeland Metal
PetroleumProducts
Shipbuildingand
Shipbreaking
Per
cem
tag
e o
f to
tal
resp
on
ses

24 February 2021
PwC 119
5.5.3.1. Bangladesh Specific Barriers
Most of the respondents surveyed were optimistic about the Bangladesh’s economy and expressed their
satisfaction about the country’s growth. However, country specific hindrances to growth and investment
mentioned by the respondents had resonance across the sectors. Subsequent figure captures the barriers to
investment as mentioned by the respondents.
Figure 43: Barriers to Investment in Bangladesh
Source: Primary Survey, the participants in the stakeholder consultations belonged to diverse set of industries, which are
shortlisted specific to the proposed EZ.
Common problems faced by the manufacturers in running a business in the country (across industrial sectors)
are listed in the following across two categories (major and minor). Table 38 below depicts few of the above-
mentioned common problems faced by manufacturers in running a business in a country.
Table 38: Few major common problems faced by businesses in the country
Problem Name Details
Power Shortage
All the investors surveyed expressed discontent with power availability in rural
areas of Bangladesh. Many complained about the 3-4-hour power outages suffered
on a daily basis, which had affected the capacity utilization of existing machineries.
Investor from few sectors such as Electrical and Electronics, Light Machinery,
Food and Beverage, Plastic also highlighted the issue of power quality (Voltage
fluctuation).
Social Safety/ security Respondents in their feedback, have expressed concern about the Social safety/
security issues prevailing in Bangladesh.
1%
1%
1%
1%
2%
2%
3%
3%
3%
4%
4%
5%
5%
6%
6%
7%
10%
11%
12%
13%
Restrictions on foreign investment
Lack of protection of IPR
Inadequate logistics infrastructure
Complicated administrative procedures
No increase in new clients or markets
Limitation of fuel supply
Unavailability of skilled labour
Lack of Utilities (ETP/CETP/STP)
Complicated and time consuming customs..
Decrease in orders from clients
Lack of infrastrcutural space for production
High energy tariff
High attrition rate
Lack of trained manpower
Increase in employee wages
Difficulty in local procurement of inputs
Tax burdens
High customs duties on imported goods
Social Safety/Security
Power Shortage and Power quality

24 February 2021
PwC 120
Problem Name Details
High customs duties on
imported capital goods
and intermediary goods
Manufacturing sector in Bangladesh is dependent on import of raw materials for
their production to take place. All the investors surveyed expressed discontent
regarding the high customs duties on imported capital goods and intermediary
goods. Import duty on goods are levied on basis of their HS codes. Respondents
claimed that custom officials suddenly charge higher import duty on items of
regular import, by changing the applicable HS code under which the item is
covered. This results in extra hassle for the importers as they need to visit customs
law office to get the goods cleared and get clarity on applicable HS code. Sudden
changes in the rate of applicable import duty creates uncertainty among the
manufacturers as it causes delay in access to raw material and also makes it
difficult to accurately predict costing of the manufactured goods
Tax burdens
During the stakeholder consultation exercise, most of the respondents expressed
disappointment on the corporate taxes and transfer pricing taxes levied on them.
This is a major hindrance to investment in Bangladesh.
Difficulty in local
procurement of parts
and raw materials
During interactions, investors also complained about the difficulty in procuring
the raw materials from the local markets.
5.5.3.2. Sector Specific Barriers
The respondents were also asked questions about their sectors in which they are operating to understand the
challenges they are facing in their sector, which is hindering their current business operations and affecting the
growth/expansion plans. The problems specific to each sector are listed below –
Table 39: Industry specific barriers as expressed by the respondents
Industrial Sectors Industry specific barriers
Non-Metallic Minerals Respondents from this sector raised their concerns about high reliability on
imports, this sector is dependent on global price markets as any fluctuations
due to geo-political or economic issues impact prices in this sector. Moreover,
cement manufacturers were concerned with over capacity of cement
production in Bangladesh, resulting in shrinking profit margins and price
wars.
Heavy Machinery, Iron and
Steel Manufacturers in this sector highlighted challenges related to raw material,
tax structure and port congestion. Due to lack of iron ore deposits in
Bangladesh, currently steel and iron manufacturers import scrap iron or
billets for manufacturing of steel products. Unavailability of raw material
forces Bangladesh to produce either steel billets or scrap steel. GoB has
imposed a higher tax on import of billet in order to promote domestic
manufacturing resulting in adverse effect on smaller players.
Automobiles and Accessories Manufacturers mentioned that lack of advanced technology and technical
know-how are the major concerns. Manufacturers expressed their displeasure
on tax structure imposed by GoB. The respondents mentioned about the poor
transport network of the country and were interested in setting up plants near
trade gateways.
Petroleum products
(including bottling) Respondents in this sector did not highlight any major challenges which were
specific to their sectors.

24 February 2021
PwC 121
Industrial Sectors Industry specific barriers
Chemicals This sector is mostly import dependent for its raw material. Respondents
faced issues due to uncertainty with HS codes of the items of import and
unpredictable rate of taxes being levied. Fertilizer manufacturers have robust
demand in the country; however, lack of power and gas is hindering their
production capacity.
Shipbuilding/Shipbreaking Respondents in this sector highlighted challenges in accessing easy and cheap
credit as a major hindrance for capacity expansion. Moreover, shipbuilders
also faced a dearth of skilled manpower and technological know-how. Ship
breaking industry also faced challenge of using outdated labor intensive
technology.
Source: Primary Survey
5.5.3.3. Proposed EZ- Site Specific Barriers
As per the survey responses, major challenges in the proposed region include the following –
• Congestion at Chittagong port also hindered investment decisions of some manufacturers, who were of
the opinion that if Chittagong port is struggling to meet the current traffic demand, it would be difficult
for CPA to cater to additional traffic from new EZs in Bangladesh. However, this problem could be
addressed by the proposed new bay terminal.
• Several respondents were unsure as to how long it would take in order for the proposed EZ to be
established. This prevented the manufacturers from making investment decisions with respect to the
proposed EZ.
5.5.4. Perception about Economic Zone Regime
One of the key objectives of primary stakeholder consultation was to assess the awareness about the GoB’s
Economic Zone policy among the industrial players and also the investment appetite for the proposed EZ. The
key findings from the various sectors are as below:
Table 40: Voice on ground from stakeholder consultations
Sector Opinion about EZ regime as obtained during the survey
Chemicals
Manufacturers would be interested in taking up land in the Economic Zone since
it would be easier for them to commence operations within the EZ as developer
would be obtaining environmental clearances. Furthermore, common ETP at the
proposed EZ would also be useful for them as presently they face issues in
disposing their waste and effluent.
Non-metallic minerals
(Ceramics)
Primary stakeholder consultation of manufacturers in this industry revealed the
readiness of the players to expand into an EZ due to ease of utility support being
provided by the developer letting them concentrate on the core manufacturing
processes.
Heavy Machinery, Iron
and Steel
Primary stakeholder consultation of manufacturers in this industry revealed the
readiness of the players to expand into an EZ as the raw material imported or
obtained from ship breaking can be transported to EZ as it is located in proximity
to Chattogram seaport.
Auto and Automobiles
Most of the manufacturers expressed their interest as the proposed EZ is close
proximity to Chattogram seaport as this sector is dependent on import of CKD
units.
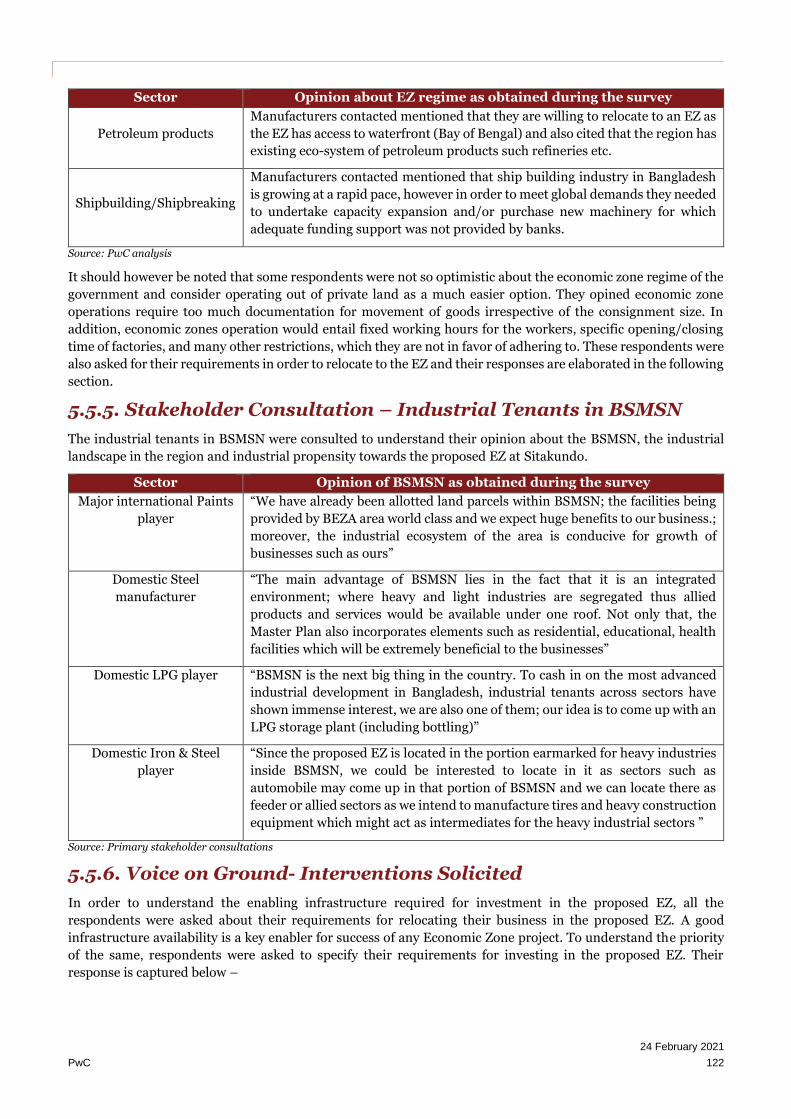
24 February 2021
PwC 122
Sector Opinion about EZ regime as obtained during the survey
Petroleum products
Manufacturers contacted mentioned that they are willing to relocate to an EZ as
the EZ has access to waterfront (Bay of Bengal) and also cited that the region has
existing eco-system of petroleum products such refineries etc.
Shipbuilding/Shipbreaking
Manufacturers contacted mentioned that ship building industry in Bangladesh
is growing at a rapid pace, however in order to meet global demands they needed
to undertake capacity expansion and/or purchase new machinery for which
adequate funding support was not provided by banks.
Source: PwC analysis
It should however be noted that some respondents were not so optimistic about the economic zone regime of the
government and consider operating out of private land as a much easier option. They opined economic zone
operations require too much documentation for movement of goods irrespective of the consignment size. In
addition, economic zones operation would entail fixed working hours for the workers, specific opening/closing
time of factories, and many other restrictions, which they are not in favor of adhering to. These respondents were
also asked for their requirements in order to relocate to the EZ and their responses are elaborated in the following
section.
5.5.5. Stakeholder Consultation – Industrial Tenants in BSMSN
The industrial tenants in BSMSN were consulted to understand their opinion about the BSMSN, the industrial
landscape in the region and industrial propensity towards the proposed EZ at Sitakundo.
Sector Opinion of BSMSN as obtained during the survey
Major international Paints
player
“We have already been allotted land parcels within BSMSN; the facilities being
provided by BEZA area world class and we expect huge benefits to our business.;
moreover, the industrial ecosystem of the area is conducive for growth of
businesses such as ours”
Domestic Steel
manufacturer
“The main advantage of BSMSN lies in the fact that it is an integrated
environment; where heavy and light industries are segregated thus allied
products and services would be available under one roof. Not only that, the
Master Plan also incorporates elements such as residential, educational, health
facilities which will be extremely beneficial to the businesses”
Domestic LPG player “BSMSN is the next big thing in the country. To cash in on the most advanced
industrial development in Bangladesh, industrial tenants across sectors have
shown immense interest, we are also one of them; our idea is to come up with an
LPG storage plant (including bottling)”
Domestic Iron & Steel
player
“Since the proposed EZ is located in the portion earmarked for heavy industries
inside BSMSN, we could be interested to locate in it as sectors such as
automobile may come up in that portion of BSMSN and we can locate there as
feeder or allied sectors as we intend to manufacture tires and heavy construction
equipment which might act as intermediates for the heavy industrial sectors ”
Source: Primary stakeholder consultations
5.5.6. Voice on Ground- Interventions Solicited
In order to understand the enabling infrastructure required for investment in the proposed EZ, all the
respondents were asked about their requirements for relocating their business in the proposed EZ. A good
infrastructure availability is a key enabler for success of any Economic Zone project. To understand the priority
of the same, respondents were asked to specify their requirements for investing in the proposed EZ. Their
response is captured below –
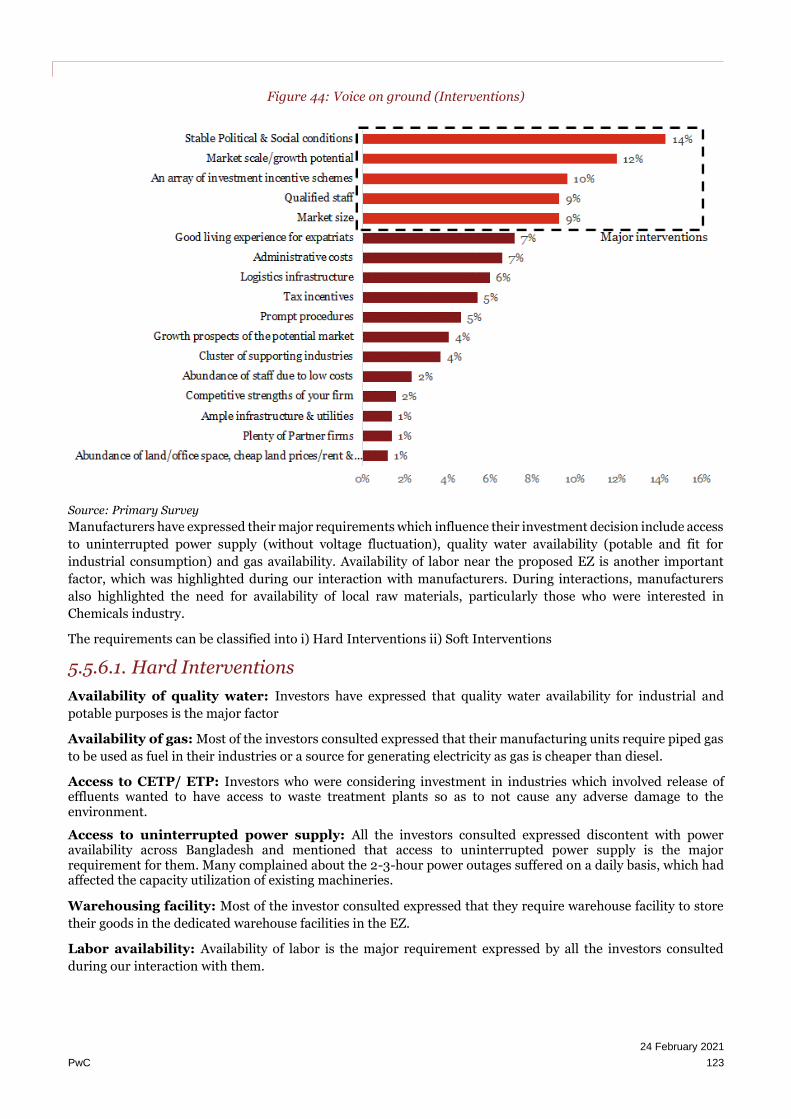
24 February 2021
PwC 123
Figure 44: Voice on ground (Interventions)
Source: Primary Survey
Manufacturers have expressed their major requirements which influence their investment decision include access
to uninterrupted power supply (without voltage fluctuation), quality water availability (potable and fit for
industrial consumption) and gas availability. Availability of labor near the proposed EZ is another important
factor, which was highlighted during our interaction with manufacturers. During interactions, manufacturers
also highlighted the need for availability of local raw materials, particularly those who were interested in
Chemicals industry.
The requirements can be classified into i) Hard Interventions ii) Soft Interventions
5.5.6.1. Hard Interventions
Availability of quality water: Investors have expressed that quality water availability for industrial and
potable purposes is the major factor
Availability of gas: Most of the investors consulted expressed that their manufacturing units require piped gas
to be used as fuel in their industries or a source for generating electricity as gas is cheaper than diesel.
Access to CETP/ ETP: Investors who were considering investment in industries which involved release of effluents wanted to have access to waste treatment plants so as to not cause any adverse damage to the environment.
Access to uninterrupted power supply: All the investors consulted expressed discontent with power availability across Bangladesh and mentioned that access to uninterrupted power supply is the major requirement for them. Many complained about the 2-3-hour power outages suffered on a daily basis, which had affected the capacity utilization of existing machineries.
Warehousing facility: Most of the investor consulted expressed that they require warehouse facility to store
their goods in the dedicated warehouse facilities in the EZ.
Labor availability: Availability of labor is the major requirement expressed by all the investors consulted
during our interaction with them.
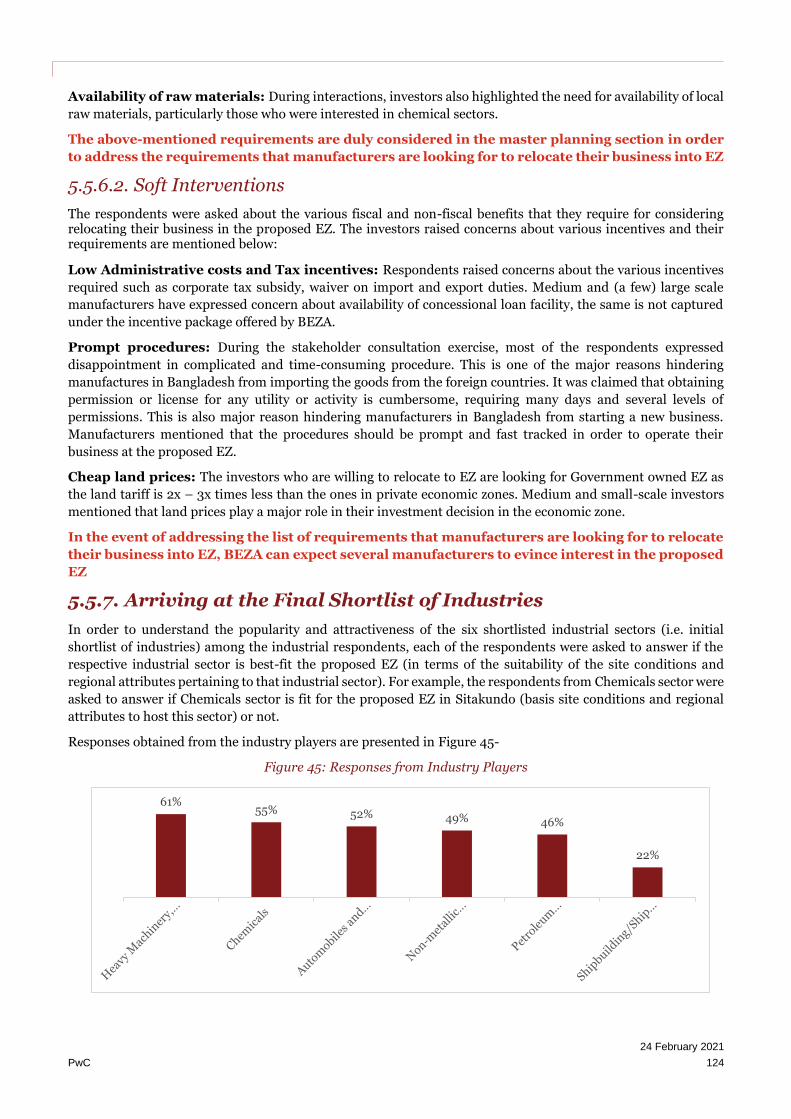
24 February 2021
PwC 124
Availability of raw materials: During interactions, investors also highlighted the need for availability of local
raw materials, particularly those who were interested in chemical sectors.
The above-mentioned requirements are duly considered in the master planning section in order
to address the requirements that manufacturers are looking for to relocate their business into EZ
5.5.6.2. Soft Interventions
The respondents were asked about the various fiscal and non-fiscal benefits that they require for considering relocating their business in the proposed EZ. The investors raised concerns about various incentives and their requirements are mentioned below:
Low Administrative costs and Tax incentives: Respondents raised concerns about the various incentives
required such as corporate tax subsidy, waiver on import and export duties. Medium and (a few) large scale
manufacturers have expressed concern about availability of concessional loan facility, the same is not captured
under the incentive package offered by BEZA.
Prompt procedures: During the stakeholder consultation exercise, most of the respondents expressed
disappointment in complicated and time-consuming procedure. This is one of the major reasons hindering
manufactures in Bangladesh from importing the goods from the foreign countries. It was claimed that obtaining
permission or license for any utility or activity is cumbersome, requiring many days and several levels of
permissions. This is also major reason hindering manufacturers in Bangladesh from starting a new business.
Manufacturers mentioned that the procedures should be prompt and fast tracked in order to operate their
business at the proposed EZ.
Cheap land prices: The investors who are willing to relocate to EZ are looking for Government owned EZ as
the land tariff is 2x – 3x times less than the ones in private economic zones. Medium and small-scale investors
mentioned that land prices play a major role in their investment decision in the economic zone.
In the event of addressing the list of requirements that manufacturers are looking for to relocate
their business into EZ, BEZA can expect several manufacturers to evince interest in the proposed
EZ
5.5.7. Arriving at the Final Shortlist of Industries
In order to understand the popularity and attractiveness of the six shortlisted industrial sectors (i.e. initial
shortlist of industries) among the industrial respondents, each of the respondents were asked to answer if the
respective industrial sector is best-fit the proposed EZ (in terms of the suitability of the site conditions and
regional attributes pertaining to that industrial sector). For example, the respondents from Chemicals sector were
asked to answer if Chemicals sector is fit for the proposed EZ in Sitakundo (basis site conditions and regional
attributes to host this sector) or not.
Responses obtained from the industry players are presented in Figure 45-
Figure 45: Responses from Industry Players
61%55% 52% 49% 46%
22%

24 February 2021
PwC 125
Source: Primary Survey
Figure 45 depicts that the following sectors have obtained most popularity from the investor community in the
context of the proposed EZ:
• Heavy Machinery, Iron & Steel and Metals
• Chemicals
• Non-metallic minerals
• Automobiles and Accessories
• Petroleum products (including bottling)
5.5.8. Final Shortlist of Site-Specific Industry Sectors
On basis of incorporating the feedback received during the survey, it can be safely deduced that from among the
manufacturers contacted, out of the initial shortlisted sectors. Manufacturers mentioned that all the six sectors
are popular with respective to the proposed EZ. However, from the analysis of the primary survey it was observed
that manufacturers from Non-metallic minerals (Cement, Ceramics and Glass), Chemicals and Heavy Machinery,
Iron & steel, and metals, Automobiles and Accessories followed by Petroleum products have expressed positive
interest in relocating their business to the proposed EZ in Sitakundo. Figure 46 below depicts the step wise
approach followed to arrive at the final short list of industries.
Figure 46: Industry Shortlisting
Source: PwC Methodology
Therefore, demand assessment exercise is performed on the five final short list of sectors mentioned below
Heavy Machinery, Iron & steel and metals, Automobiles and accessories, Non-metallic minerals
(Cement, Ceramics etc.), Chemicals, Petroleum products (including bottling)
The industrial mix proposed is indicative in nature and based on our analysis and findings from primary survey.
The choice of industries might change during on-ground implementation based on the response received from
market.
A demand forecast model will be prepared in the next chapter, for the above mentioned five industries to
understand the land, utility and employment requirements for these industries over the years.

24 February 2021
PwC 126
5.5.9. Sector Profiles
This section contains the profiles of all the five shortlisted sectors obtained through industry assessment exercise.
This sector profile provides a brief overview about the various sub-categories of the sectors, sector overview,
sector trends, barriers to investment in the sector and various utility requirements.
Table 41: Sector Profile - Non-Metallic Minerals
Sector Non-metallic minerals
Sub-Categories Proposed Ceramics, Cement, Glass etc.
Sector Overview
Based on secondary research, sector overview detailing on the production, market
demand, foreign trade, and growth projections has been captured in chapter 5.3
and 5.4
Based on responses received during primary survey, sector overview has been
detailed out in the following-
• Ceramics industry is one the growing manufacturing sectors in Bangladesh
due to the steady economic growth and urbanization. The core products of
this sector are tiles, tableware and sanitary ware.
• The ceramics industry caters to 85% of the local demand and also serves a
major portion of the export market
• More than 50,000 people are engaged in this sector in Bangladesh
• Bangladesh Ceramic Manufacturers & Exporters Association (BCMEA) is
the National trade Organization uniting the Ceramic Products
Manufacturers and Exporters in Bangladesh.
• Cement industry is booming sector in Bangladesh and the country is the
world’s 40th largest cement market.180
• The production capacity of cement stood at 58 million tons in 2018 while
the demand has seen a rise to 31 million tons.
• Out of the locally produced cement Government consumption is 35 percent,
commercial developers’ consumption is 35 percent and the remaining
amount by the individuals and small buyers.
• The per capita consumption of cement raised by 97 per cent to stand at 187
kg from 2011 to 2018. However, it still lags behind the global average of per
capita consumption of 563 kg.
• The major cement players in Bangladesh are Lafarge Holcim, Shah cement,
Basundhara cement and Fresh cement.
Sector Trends
• Non-metallic sector in Bangladesh is estimated to grow up to ~10% in the
coming five years.
• Ceramic products are currently exported to more than 50 countries such as
USA, Italy, New Zealand, Australia, Sweden, Spain and France.
180 https://tbsnews.net/economy/bangladeshs-cement-industry-booming

24 February 2021
PwC 127
• The export demand for the ceramics is increasing due to the availability of
variety of products at competitive prices meeting the international
standards.
• The growth of cement industry looks promising in terms of increasing
demand due to rapid urbanization, real estate and government projects.
• High growth in this sector is observed due to the fact that Bangladesh is one
of the largest global importers of clinkers.
• Bangladesh looks to be rapidly closing the gap between national per capital
consumption and global average.
• Currently, 14 cement manufacturers are involved in exporting their products
to Nepal, Srilanka, Maldives and other foreign countries.
• New technologies are being implemented in this industry in order to
improve operational efficiencies and reduce wastage in the industry.
Current Barriers to
Investment Please refer to chapter 5.5.3
Land Requirements
• Land requirement depends on the capacity of the factory, type of technology
and type of sub-sector (finished goods).
• Basis primary survey, typically medium scale players require 10 to 14 acres
of land; whereas large scale players require 16 to 20 acres for setting up a
single Non-metallic minerals sector manufacturing facility
• Following chapter delves into forecasting of industrial land requirement for
this sector
Power Requirements
• Power requirement depends on the capacity of the factory, type of
technology and type of sub-sector (finished goods).
• For medium scale facility, power requirement can vary from 1.25 to 1.75
MVA for single facility; whereas, for a large-scale facility, power requirement
may vary from 2.0 MVA to 2.5 MVA for single facility
• Following chapter delves into forecasting of industrial power requirement
for this sector
Water Requirements
• Water requirement depends on the capacity of the factory, type of
technology and type of sub-sector (finished goods)
• For medium scale facility, water requirement can vary from 500 to 700
Cum/ day for single facility; whereas, for a large-scale facility, water
requirement may vary from 800 cum/ day to 1000 cum/ day for single
facility
• Following chapter delves into forecasting of industrial water requirement
for this sector
Employment per Factory • Manpower requirement depends on the capacity of the factory, type of
technology and type of sub-sector (finished goods)

24 February 2021
PwC 128
• For medium scale facility, typically 6,000 to 8,500 number of
manufacturing related employees are employed in a single facility; whereas
for a large facility, typically 9,700 to 12,000 number of manufacturing
related employees are employed in a facility
• Following chapter delves into forecasting of manpower requirement for this
sector
Table 42: Sector Profile - Chemicals Industry
Sector Chemicals
Sub-Categories Proposed Fertilizers
Sector Overview
Based on secondary research, sector overview detailing on the production, market
demand, foreign trade, and growth projections has been captured in chapter 5.3
and5.4.
Based on responses received during primary survey, sector overview has been
detailed out in the following-
• Due to the rapid industrialization in the country, Chemicals sector in
Bangladesh has triples in the last decade.
• The Chemicals sector in Bangladesh is driven by domestic consumption with
significant import dependency due to lack of integrated chemical
manufacturing facilities.
• Chemicals sector comprises various products viz. (i) fertilizer, (ii) adhesives
& paints related products, and (iii) other chemicals.
• Import of ~835 million USD worth organic chemicals in 2019, while ~392
million USD worth inorganic chemicals were imported in the same year.
• Bangladesh is heavily dependent on import of Urea as well as finished
product (Fertilizer), 68% of its total demand is met by imports.
• Chemicals sector acts as the downstream sector for various sectors such as
food processing, fertilizer and agro based, Appliance and foam industries,
leather and plastic products, shipbuilding, and heavy machineries.
• Currently Bangladesh imports chemicals from India, China, Germany,
Japan, France etc.181
Sector Trends
• Bangladesh has a huge agricultural land; improvement of chemical sector
may trigger agro and industrial revolution simultaneously.
• Domestic production of chemicals is estimated to grow between 1-2% in the
next five years.
• High cropping intensity and decreasing soil intensity are the main demand
drivers for this sector in the country.
181 https://www.daily-sun.com/post/412886/2019/08/04/Potentiality-of-our-chemical-sector
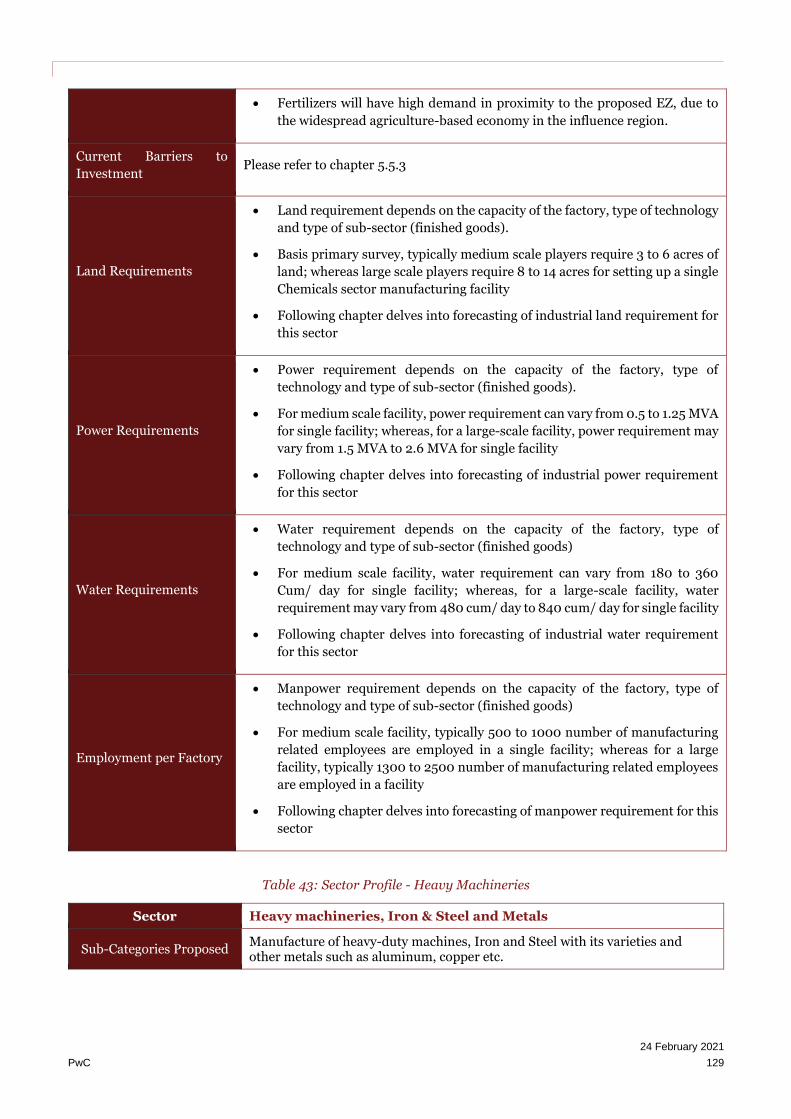
24 February 2021
PwC 129
• Fertilizers will have high demand in proximity to the proposed EZ, due to
the widespread agriculture-based economy in the influence region.
Current Barriers to
Investment Please refer to chapter 5.5.3
Land Requirements
• Land requirement depends on the capacity of the factory, type of technology
and type of sub-sector (finished goods).
• Basis primary survey, typically medium scale players require 3 to 6 acres of
land; whereas large scale players require 8 to 14 acres for setting up a single
Chemicals sector manufacturing facility
• Following chapter delves into forecasting of industrial land requirement for
this sector
Power Requirements
• Power requirement depends on the capacity of the factory, type of
technology and type of sub-sector (finished goods).
• For medium scale facility, power requirement can vary from 0.5 to 1.25 MVA
for single facility; whereas, for a large-scale facility, power requirement may
vary from 1.5 MVA to 2.6 MVA for single facility
• Following chapter delves into forecasting of industrial power requirement
for this sector
Water Requirements
• Water requirement depends on the capacity of the factory, type of
technology and type of sub-sector (finished goods)
• For medium scale facility, water requirement can vary from 180 to 360
Cum/ day for single facility; whereas, for a large-scale facility, water
requirement may vary from 480 cum/ day to 840 cum/ day for single facility
• Following chapter delves into forecasting of industrial water requirement
for this sector
Employment per Factory
• Manpower requirement depends on the capacity of the factory, type of
technology and type of sub-sector (finished goods)
• For medium scale facility, typically 500 to 1000 number of manufacturing
related employees are employed in a single facility; whereas for a large
facility, typically 1300 to 2500 number of manufacturing related employees
are employed in a facility
• Following chapter delves into forecasting of manpower requirement for this
sector
Table 43: Sector Profile - Heavy Machineries
Sector Heavy machineries, Iron & Steel and Metals
Sub-Categories Proposed Manufacture of heavy-duty machines, Iron and Steel with its varieties and other metals such as aluminum, copper etc.
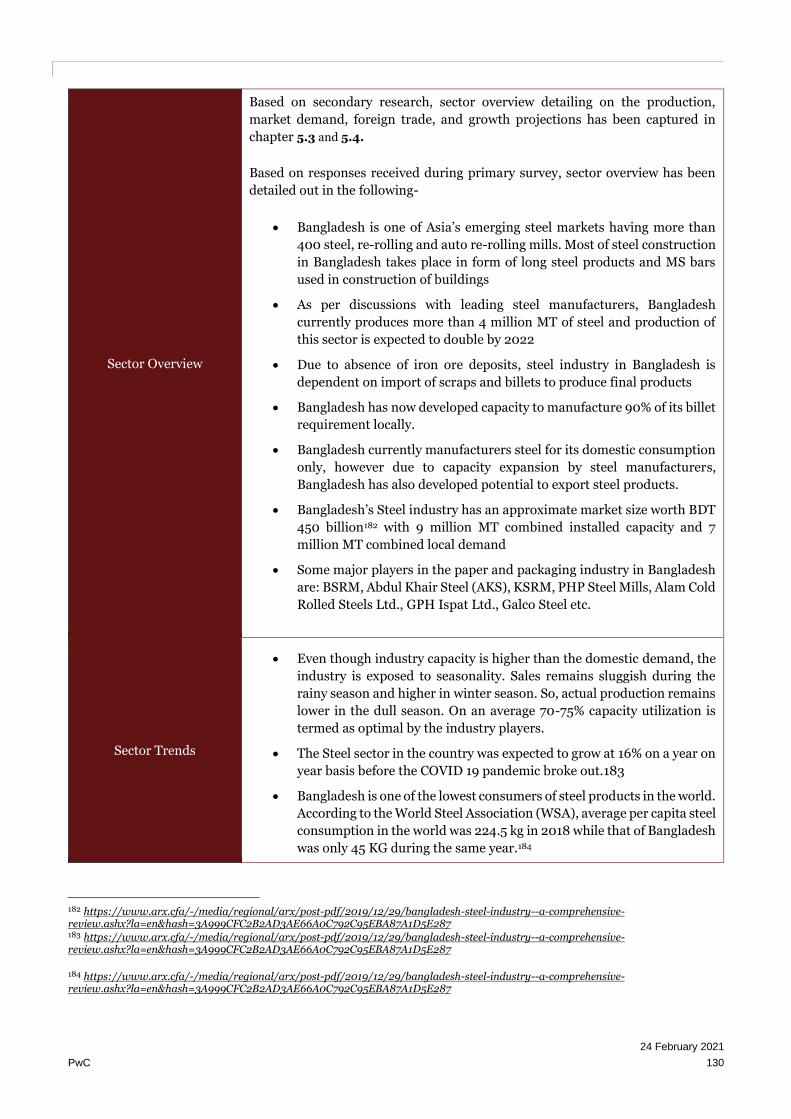
24 February 2021
PwC 130
Sector Overview
Based on secondary research, sector overview detailing on the production,
market demand, foreign trade, and growth projections has been captured in
chapter 5.3 and 5.4.
Based on responses received during primary survey, sector overview has been
detailed out in the following-
• Bangladesh is one of Asia’s emerging steel markets having more than
400 steel, re-rolling and auto re-rolling mills. Most of steel construction
in Bangladesh takes place in form of long steel products and MS bars
used in construction of buildings
• As per discussions with leading steel manufacturers, Bangladesh
currently produces more than 4 million MT of steel and production of
this sector is expected to double by 2022
• Due to absence of iron ore deposits, steel industry in Bangladesh is
dependent on import of scraps and billets to produce final products
• Bangladesh has now developed capacity to manufacture 90% of its billet
requirement locally.
• Bangladesh currently manufacturers steel for its domestic consumption
only, however due to capacity expansion by steel manufacturers,
Bangladesh has also developed potential to export steel products.
• Bangladesh’s Steel industry has an approximate market size worth BDT
450 billion182 with 9 million MT combined installed capacity and 7
million MT combined local demand
• Some major players in the paper and packaging industry in Bangladesh
are: BSRM, Abdul Khair Steel (AKS), KSRM, PHP Steel Mills, Alam Cold
Rolled Steels Ltd., GPH Ispat Ltd., Galco Steel etc.
Sector Trends
• Even though industry capacity is higher than the domestic demand, the
industry is exposed to seasonality. Sales remains sluggish during the
rainy season and higher in winter season. So, actual production remains
lower in the dull season. On an average 70-75% capacity utilization is
termed as optimal by the industry players.
• The Steel sector in the country was expected to grow at 16% on a year on
year basis before the COVID 19 pandemic broke out.183
• Bangladesh is one of the lowest consumers of steel products in the world.
According to the World Steel Association (WSA), average per capita steel
consumption in the world was 224.5 kg in 2018 while that of Bangladesh
was only 45 KG during the same year.184
182 https://www.arx.cfa/-/media/regional/arx/post-pdf/2019/12/29/bangladesh-steel-industry--a-comprehensive-review.ashx?la=en&hash=3A999CFC2B2AD3AE66A0C792C95EBA87A1D5E287 183 https://www.arx.cfa/-/media/regional/arx/post-pdf/2019/12/29/bangladesh-steel-industry--a-comprehensive-review.ashx?la=en&hash=3A999CFC2B2AD3AE66A0C792C95EBA87A1D5E287 184 https://www.arx.cfa/-/media/regional/arx/post-pdf/2019/12/29/bangladesh-steel-industry--a-comprehensive-review.ashx?la=en&hash=3A999CFC2B2AD3AE66A0C792C95EBA87A1D5E287

24 February 2021
PwC 131
• Currently, the government projects account for nearly 35% to 40% of
total steel consumption which was only 15% a decade ago
• Scrap, sponge, and pig iron are major raw materials for steel smelting in
Bangladesh with imports growing from 2.5 Mn MT in 2016 to 4-4.5 Mn
MT in 2018185
• Considering that the government’s lofty goals of achieving double digital
growth in the economy, measures being taken to better facilitate the ease
of doing business, and several mega projects, economic processing
zones, and incentives for foreign investment, the macroeconomic factors
to stimulate growth in this sector look bright and with due reason
Current Barriers to Investment
Please refer to chapter 5.5.3
Land Requirements
• Land requirement depends on the capacity of the factory, type of
technology and type of sub-sector
• Basis primary survey, typically medium scale players require 10 to 15 acres
of land; whereas large scale players require 15 to 20 acres for setting up a
single heavy machinery, iron & steel manufacturing facility.
• Following chapter delves into forecasting of industrial land requirement
for this sector
Power Requirements
• Power requirement depends on the capacity of the factory, type of
technology and type of sub-sector
• For medium scale facility, power requirement can vary from 1.8 to 2.7
MVA; whereas, for a large-scale facility, power requirement may vary from
2.8 MVA to 3.6 MVA
• Following chapter delves into forecasting of industrial power requirement
for this sector
Water Requirements
• Water requirement depends on the capacity of the factory, type of technology and type of sub-sector
• Current practice in Bangladesh is to install deep tube-wells and extract groundwater for industrial consumption. Permission from GoB needs to be taken to install the pump, however, there is no monitoring mechanism in place to check the amount of water extracted
• For medium scale facility, water requirement can vary from 500 to 750
Cum/ day; whereas, for a large-scale facility, water requirement may vary
from 750 cum/ day to 1000 cum/ day
• Following chapter delves into forecasting of industrial water requirement
for this sector
Employment per Factory
• Manpower requirement depends on the capacity of the factory, type of technology and type of sub-sector (finished goods)
• For medium scale facility, typically 800 to 1,200 number of manufacturing related employees are employed; whereas for a large facility, typically 1,200 to 1,600 number of manufacturing related employees are employed in a facility
185 https://www.lightcastlebd.com/insights/2019/03/20/steel-industry-giving-strength-to-construction

24 February 2021
PwC 132
• Following chapter delves into forecasting of manpower requirement for
this sector
Table 44: Sector Profile – Petroleum products (including bottling)
Sector Petroleum Products (including bottling)
Sub-Categories Proposed LPG Bottling plant and downstream products
Sector Overview
Based on responses received during secondary research and primary survey,
sector overview has been detailed out in the following-
• Bangladesh is a major importer of petroleum products. Based on the
petroleum and petroleum-based products (such as LPG, LNG, and
polymers), gas refining, storage and bottling facilities have been developed
in waterfront locations mostly located near the sea sides of the country
• Since natural gas contributes a major portion of electricity generation and
thus contributes 56 percent of domestic energy demand; a necessity for
alternative resources have come up and as a result LPG and other energy
sources have appeared in the scenario.
• The industry is largely import oriented (95% of the total LPG is imported)
and imports are estimated to reach 2.7 million tons by 2025186
• Although producing significant volume of natural gas, Bangladesh still
cannot meet its local demand. As confirmed by Petro Bangla, the country’s
gas reserve has decreased to 12.88 TCF in the producing and non-
producing fields. To counter the decreasing gas reserves of the country,
LNG is scheduled to be imported and blended with domestic gas in the
national gas pipeline
• GoB is expected to provide the consumers with price subsidy for promoting
LPG usage in the upcoming 2018-19 budget. Policymakers hold this belief
that the demand for piped gas can be driven down if the use of LPG is
promoted well for industrial and household use.
• Access to waterfront is one of the most critical factors for this sector
• The LPG industry consists of local players like Basundhara, Jamuna,
Omera, TK Gas and foreign companies like Total Gas and Laugfs Gas
(corporate brand name Kleanheat gas)
Sector Trends
• Mostly import focused sector, as demand is rising but natural reserves are
depleting
• The LPG market in Bangladesh is led by Bashundhara (24%) followed by
Omera (20%), Jamuna (17%) and BM (11%).187
• Bashundhara LPG has state-of-the-art LP Gas plant in Mongla having
capacity of 3,000 Metric ton with daily refill capacity of 50,000 units of gas
cylinders.
186 https://databd.co/profiles/industries/profile-lp-gas#:~:text=Market%20Share,Mongla%20with%203%2C800%20MT%20capacity. 187 https://databd.co/profiles/industries/profile-lp-gas#:~:text=Market%20Share,Mongla%20with%203%2C800%20MT%20capacity.
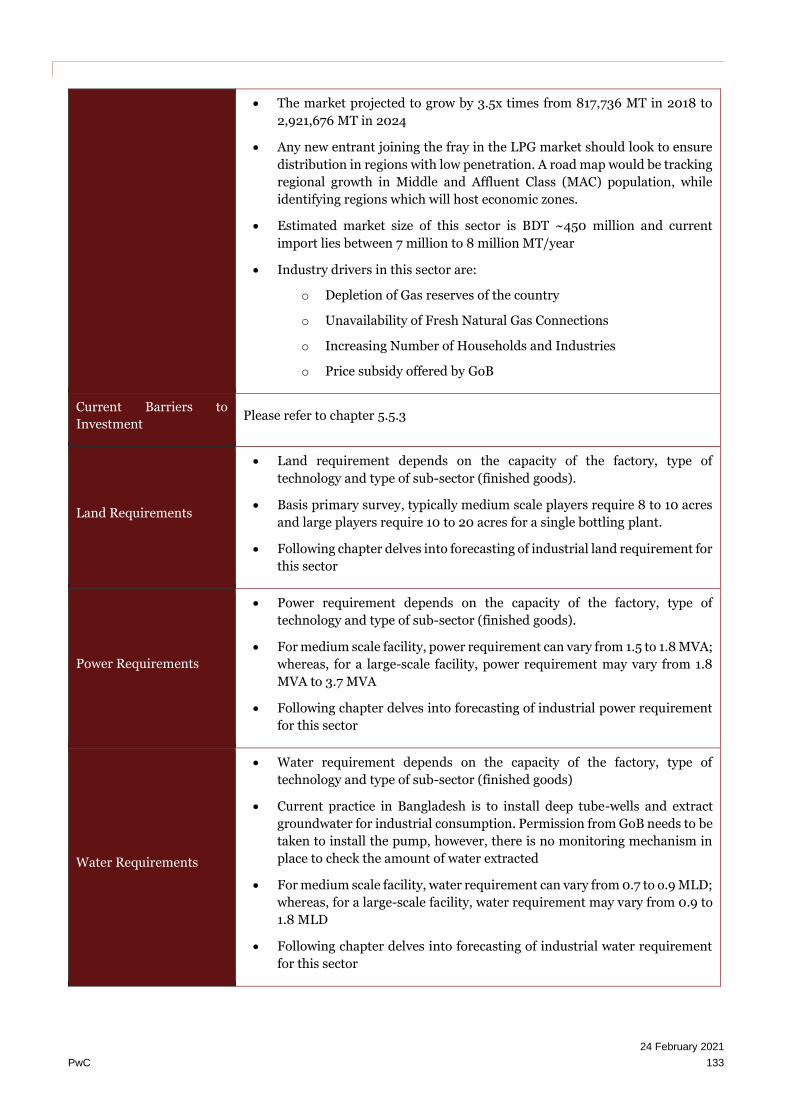
24 February 2021
PwC 133
• The market projected to grow by 3.5x times from 817,736 MT in 2018 to
2,921,676 MT in 2024
• Any new entrant joining the fray in the LPG market should look to ensure
distribution in regions with low penetration. A road map would be tracking
regional growth in Middle and Affluent Class (MAC) population, while
identifying regions which will host economic zones.
• Estimated market size of this sector is BDT ~450 million and current
import lies between 7 million to 8 million MT/year
• Industry drivers in this sector are:
o Depletion of Gas reserves of the country
o Unavailability of Fresh Natural Gas Connections
o Increasing Number of Households and Industries
o Price subsidy offered by GoB
Current Barriers to
Investment Please refer to chapter 5.5.3
Land Requirements
• Land requirement depends on the capacity of the factory, type of
technology and type of sub-sector (finished goods).
• Basis primary survey, typically medium scale players require 8 to 10 acres
and large players require 10 to 20 acres for a single bottling plant.
• Following chapter delves into forecasting of industrial land requirement for
this sector
Power Requirements
• Power requirement depends on the capacity of the factory, type of
technology and type of sub-sector (finished goods).
• For medium scale facility, power requirement can vary from 1.5 to 1.8 MVA;
whereas, for a large-scale facility, power requirement may vary from 1.8
MVA to 3.7 MVA
• Following chapter delves into forecasting of industrial power requirement
for this sector
Water Requirements
• Water requirement depends on the capacity of the factory, type of
technology and type of sub-sector (finished goods)
• Current practice in Bangladesh is to install deep tube-wells and extract
groundwater for industrial consumption. Permission from GoB needs to be
taken to install the pump, however, there is no monitoring mechanism in
place to check the amount of water extracted
• For medium scale facility, water requirement can vary from 0.7 to o.9 MLD;
whereas, for a large-scale facility, water requirement may vary from 0.9 to
1.8 MLD
• Following chapter delves into forecasting of industrial water requirement
for this sector

24 February 2021
PwC 134
Employment per Factory
• Manpower requirement depends on the capacity of the factory, type of
technology and type of sub-sector (finished goods)
• For medium scale facility, typically 300 to 400 number of manufacturing
related employees are employed; whereas for a large facility, typically 400
to 700 number of manufacturing related employees are employed in a
facility
• Following chapter delves into forecasting of manpower requirement for
this sector
Table 45: Sector profile - Auto & Automobile accessories
Sector Auto & Automobile accessories
Sub-Categories Proposed Manufacture of automobiles, spares, automobile accessories etc.
Sector Overview
Based on responses received during primary survey and secondary research,
sector overview has been detailed out in the following-
• Bangladesh is not present across the value chain of automobile industry. The
country has been primarily dependent on assembling of automobile
components; these components (completely knock down units) are being
imported.
• Currently the passenger car import comprises of refurbished cars or re-used
cars that are reconditioned in Bangladesh.
• The Bangladesh commercial vehicle industry remains dependent on imports
from Asian countries – specifically India, Japan, and China.
• The market for commercial vehicles is oligopolistic in nature, with high
capital investment and regulation under the Bangladesh Road Transport
Corporation.
• The market leader is Nitol Motors Limited, with a market share of 40%,
closely followed by IFAD Autos with 38%. Runner Motors Limited is also a
significant player with a share of 10% and is due to open its own assembly
plant later this year. The dominance of these three companies over 88% of
the market limits the buying power of consumers.188
• Other players include Rangs Motors Limited, Uttara Motors, Energypac etc.
• Like most of the Bangladeshi automobile industry, the supply of the market
is limited by the lack of raw materials and backward linkage. Its dependence
on imports creates an upper limit for the industry’s size. The market must
shift from Complete Built-Up (CBU) to Complete Knocked-Down (CKD)
vehicles, which will be more affordable in terms of import duties and will
incorporate local materials for tires, windows, etc.
Sector Trends • Mostly domestic focused sector, but heavily dependent on imports
188 https://www.lightcastlebd.com/insights/2019/07/24/high-prospects-in-the-commercial-vehicle-market

24 February 2021
PwC 135
• The commercial vehicle market is growing as the capacity of the Bangladeshi
economy grows. The government is developing supply-side policies by
improving infrastructure, which will provide support to all industries and
increase the need for local transport.
• The development of megaprojects and the Belt and Road Initiative will allow
businesses to access new markets and expand operations, putting demand
pressure on companies to build assembly plants.
• Due to GoB’s tax structure which imposes 165 percent duty on imported new
cars, 60 percent duty on cars made in Bangladesh and 25 percent
supplementary duty on reconditioned hybrid cars, Bangladesh is witnessing
a rising demand of refurbished vehicles in Bangladesh.
• Bangladesh has a growing market with sales forecast of as much as $2.5
billion per year in this sector189
• The size of Bangladesh automotive market as per the trend is – 36,000 for
commercial vehicles, 2,50,000 for two-wheelers and 25,000 in passenger
car segment.190
• Since major consumption hub is centered around Dhaka and Chattogram,
proximity of Chattogram serves the proposed EZ with immediate market
access.
• Moreover, Chittagong port, being the major commercial port of the country
could also provide easy access to CKD units imported from abroad.
• As per recent reports, major Indian auto companies such as Tata Motors,
Ashok Leyland, Hero MotoCorp, Bajaj, Eicher, Mahindra, TVS, Maruti has
started showing significant interest towards investing in Bangladesh.
• Tata Motors is setting up an assembly plant in Jessore in collaboration with
Bangladesh's Nitol Niloy Group. Hero Motor Corp is also setting up two-
wheeler plant in Jessore while another automaker Ashok Leyland is also
establishing their plant in Bangladesh, according to the report.191 In total
Indian investments in the sector in Bangladesh are pegged to be around $ 3
billion
• Going forward, the Electric Vehicle industry, which is the future of
automobile, also has the potential to create an informal sector and facilitate
entrepreneurship in the areas of Mechanics, Driving, Battery recycling,
Battery Charging, Auto mechanics, Panel Beating and Spraying, Tyre
technicians
Current Barriers to
Investment Please refer to chapter 5.7.3
Land Requirements • Land requirement depends on the capacity of the factory, type of technology
and type of sub-sector (finished products).
189 https://en.prothomalo.com/bangladesh/Indian-automakers-eye-market-expansion-in 190 https://en.prothomalo.com/bangladesh/Indian-automakers-eye-market-expansion-in 191 https://en.prothomalo.com/bangladesh/Indian-automakers-eye-market-expansion-in

24 February 2021
PwC 136
• Basis primary survey, typically small-scale players require 1 to 5 acres and
medium players require 6 to 10 acres for a single automobile or automobile
accessories manufacturing facility.
• For automobile or automobile accessories manufacturing facility, area is
dependent on capacity of the assembly line.
• Following chapter delves into forecasting of industrial land requirement for
this sector
Power Requirements
• Power requirement depends on the capacity of the factory, type of
technology and type of sub-sector (finished products).
• For small scale facility, power requirement can vary from 0.2 to 0.7 MVA;
whereas, for a medium-scale facility, power requirement may vary from 1.0
MVA to 1.5 MVA
• Following chapter delves into forecasting of industrial power requirement
for this sector
Water Requirements
• Water requirement depends on the capacity of the factory, type of
technology and type of sub-sector (finished products)
• For small scale facility, water requirement can vary from 40 to 200 Cum/
day; whereas, for a medium-scale facility, water requirement may vary from
250 cum/ day to 400 cum/ day
• Following chapter delves into forecasting of industrial water requirement
for this sector
Employment per Factory
• Manpower requirement depends on the capacity of the factory, type of
technology and type of sub-sector (finished products)
• For small scale facility, typically 100 to 500 number of manufacturing
related employees are employed; whereas for a medium facility, typically
600 to 1000 number of manufacturing related employees are employed in a
facility
• Following chapter delves into forecasting of manpower requirement for this
sector
Sectoral overview and the numbers mentioned in the sectoral profile are on the basis of primary surveys, while
the sectoral trend is a blend of primary and secondary research. The detailed demand assessment of the above-
mentioned industries will be taken up in demand assessment chapter based on the inputs of the primary survey.
5.6. Key Takeaways
In order to arrive at the most suitable industries in site surrounding context, an industry assessment framework
comprising of top-down (secondary research) and bottom-up (primary survey) was adopted.
The top-down approach identifies 15 best-performing industrial sectors (initial bucket list of industries) in the
country context based on historical trend analysis of industrial production and foreign trade. At the next level,
sectoral outlook of these industries was studied in detail to understand about (i) raw material sourcing, (ii) major
markets being served, and (iii) factors of production (such as utility, logistics, and manpower) necessary.

24 February 2021
PwC 137
In-depth regional landscape assessment of the influence region (comprising of adjoining districts)
surrounding the proposed EZ was undertaken in light of (i) economic profiling, (ii) natural resources (mainly
mineral), (iii) industrial ecosystem in the influence region, and (iv) availability of semi-skilled and skilled
manpower. Markets in Chattogram can be accessed for the end products as the industries in the proposed EZ will
have access to consumer markets.
Regional assessment depicts the suitability of the initial bucket list of industries in site surrounding and influence
region context. Six industries were initially shortlisted ex post facto this regional landscape assessment. The
core industries are: (a) Heavy Machinery, Iron and steel and metals, (b) Non-metallic minerals (Cement), (c)
Chemicals, (d) Automobiles and accessories, (e) Petroleum products (including bottling) (f) Shipbuilding
/Shipbreaking
On-ground primary survey was undertaken to validate the aptness of these initially shortlisted industries and
to capture the feedback from investors. A total of 85 respondents (comprising of 66 Bangladeshi and rest foreign)
were surveyed. Voice on ground also captured that the investors are facing challenges regarding high customs
duties, time consuming customs clearance procedures, power shortage, unavailability of fuel (natural gas), and
with overall logistics scenario in the country. These challenges (country specific, site specific, and sector specific)
are causing hindrances to investment.
Respondents opined that they have certain pre-requisites of investment. Key pre-requisites as divulged by the
primary survey are:
• Qualified staff
• Availability of labor
• Availability of raw materials
• Access to concessional loans
• Corporate income tax subsidy
• Access to CETP/STP
• Uninterrupted access to quality utility services (power, water, and gas)
• Warehousing facility
• Subsidized industrial land space and utility tariffs
• Prompt administrative procedures
Many fiscal and infrastructure related pre-requisites are already under implementation by BEZA as part of its EZ
incentive package and operational guidelines.
Following industries have been shortlisted at the proposed EZ based on the above analysis:
• Heavy Machinery (Iron & steel and metals)
• Automobiles and Automobile accessories
• Non-metallic minerals (Cement, Ceramics, Glass etc.)
• Chemicals
• Petroleum Products (including bottling)

24 February 2021
PwC 138
6. Demand Forecast
6.1. Purpose and Objective
The former chapter assessed various industrial sectors in the perspective of national and regional landscapes,
and identifies the key sectors having potential to be developed in the proposed economic zone. As a next step,
this chapter delves into estimating the year on year demand generated by these industries through a mathematical
model prepared using statistics techniques. The model attempts to estimate the demand for land for the proposed
economic zone for a span of 20 years. It also attempts to estimate the year on year demand for various utilities
such as power, and water, and year on year employment generation. Basis the key findings of this demand model,
land demand uptake and potential industrial mix for the proposed EZ is arrived at; this forms the basis of the
best practice master planning and infrastructure planning.
6.2. Methodology of Demand Forecast
For estimation of demand of various parameters for the proposed economic zone, up-down approach is used,
where macroeconomic parameters are estimated initially at the national level, and then they are boiled down to
the regional level in order to understand the potential demand at the proposed economic zone. Figure 47 given
here depict the methodology for the demand forecast.
Figure 47: Overall approach for demand forecast
Source: PwC Analysis
Stepwise approach has been elucidated in the following-
1. As a first step in demand forecasting exercise, GVA (Gross Value Addition) of best performing 15
industrial sectors is taken from SMI 2012 database for further forecasting purpose.192
2. GVA for these 15 industrial sectors have been forecasted based on industrial growth rates. It has been
considered that these growth rates are generating owing to the organic growth rate(s) of the respective
industrial sector(s). The possible dip in growth rates due to COVID 19 pandemic is also taken into
consideration for years between 2020 to 2025.
QIIP published for the month of May 2019 by BBS has been analyzed to find out CAGR for each of these
industry sectors. The results obtained from the same have been further validated by detailed secondary
192 GVA stands for gross value addition for a given industry in a span of one year. The term is different from gross product, where gross value of final product is considered for calculation.

24 February 2021
PwC 139
research on sectoral outlook and industry trends in Bangladesh. Data points in support to these
parameters are furnished in the annexure.
The decrease growth rates for different industries have been estimated in proportion to the decrease in
growth rates of Bangladesh estimated by The World Bank in its report depicting the impact of COVID 19
on South Asia. The dips are taken after detailed assessment of possible impact of COVID 19 on various
industries, which is further rated on a scale from one to five.
3. The year on year investment is calculated from the projected GVA values of the 15 industrial sectors using
investment to GVA ratios (calculated from SMI 2012 data). Further GDP contribution of districts in the
influence area is used to estimate the incremental investment in the influence region (defined in section
5.5 – “Regional Assessment”).
4. The investment projections are discounted further to boil down to the investments that will be accrued
to the Greenfield projects in the influence area of the proposed EZ. The resulting investment forecast in
Greenfield projects in the afore-mentioned influence area is subsequently discounted further to ascertain
the magnitude of investment (year on year) that would be accrued to the Economic Zone space.
5. Investment-land intensity ratio is assessed on the basis of secondary research, industry sector outlook,
and primary interaction with industries, which is further used to estimate the year on year land uptake
in the various economic zones in the influence area.
6. In addition to the proposed EZ, various other economic zones are planned within its influence area. In
consultation with BEZA officials and past experience, land uptake in these proposed economic zones have
been prepared. After considering competition from these economic zones within the influence area, land
uptake projection at the proposed EZ is arrived at.
7. Based on the shortlisted industry sectors suitable for the proposed EZ (identified in last chapter), land
uptake projection has been calculated. Proceeds from the same have been used to formulate the best
practice master planning and accordingly infrastructure requirements have been assessed.
8. Referring to secondary research and prevailing best practices, utility requirements and employment
generation (per unit area) have been considered. These index figures have been validated through the
primary interaction held on ground. Based on the same, projection of utility requirements and
employment generation for the proposed EZ has been estimated.
It is to be noted that forecasting of land uptake, utility requirements and employment generation are based on
the hypothesis elaborated above. Actual scenario during on-ground development of the proposed EZ may vary
than this estimation.
6.3. Demand Scenarios and Associated Assumptions
6.3.1. Demand Scenarios
Three scenarios have been considered while developing the demand forecasting model.
• Aggressive case: Economic conditions of Bangladesh and the region are improving and behaving better
than expected; as a result of the same, macro-economic indicators showing good prospect and potential
infrastructure projects are commencing as scheduled.
• Base case: Economic conditions of Bangladesh and the region are showing steady trend and behaving as
expected; macro-economic indicators also indicating good prospect.
• Conservative case: Economic conditions of Bangladesh and the region are showing lagging trend and
behaving worse than expected; macro-economic indicators indicating hindrances to growth.
All the three cases take into consideration the impact of COVID 19 pandemic on the country’s economy.
24 February 2021
PwC 140
6.3.2. Key Assumptions
1. Timing and related assumptions
Looking at the landscape of competing economic zones in the country, various economic zones are at an advanced
stage of development. These economic zones are Bangabandhu Sheikh Mujib Shilpa Nagar (BSMSN)193, BEZA
owned zones (like Dhaulghata in Maheshkhali, Jamalpur), 20194 private EZs which have received final license &
pre-qualification license, PPP EZ in Mongla, and G2G EZs (like Japanese EZ in Araihazar, Chinese EZ in
Anowara, Indian EZ in Mongla). There also lies the possibility that new EZs may be launched in the short term
(coming five years). Market intelligence and hypothesis formed based on input from BEZA indicates that in the
coming five years, majority of the investment in these EZs (which are at advanced stages of development and the
possible new entrants) could be directed towards these EZs (which are at an advanced stage of development) and
in EZs which are located in proximity to Dhaka and Chattogram. In conjunction with this, as mentioned earlier
the proposed EZ at Sitakundo is a part of the BSMSN in Mirsarai. Land area in the magnitude of 1273.58 acres
out of the demarcated area of 2368.57 acres is a part of the BSMSN Master Plan195. BSMSN being the flagship
economic zone project of BEZA has witnessed enormous traction in the past with about 2500 acres of industrial
land already allotted to various domestic and international industry houses. Such steady demand of industrial
land was expected to continue considering the strategic location of BSMSN and the emphasis on its success.
But, in the post-COVID era, investors could be more risk averse in choosing an investment destination within
Bangladesh and may express interest in moving out of the country. The impact of the COVID pandemic could
also prompt investors to re-think their investment plans which may impact demand of industrial space uptake in
economic zones.
Keeping cognizance of the above, it has been assumed that regulatory activities and study on the proposed EZ
would start from 2021 owing to competition from other EZ locations and also factoring in the expected short-
term effect of the global pandemic situation. Thus, construction activities can begin from 2023. Taking cues from
similar developments across the globe, and the area being 2368.57 acres, construction timeline of 8 years (from
2023 to 2030) has been considered.
Basis above timelines, it has been assumed that land uptake in the proposed EZ to commence from 2025 and
accordingly a demand model has been prepared for 20 years (i.e. from 2025 to 2044).
2. Industries considered for this assessment
As elaborated in earlier chapters and in conjunction with the Master Plan of BSMSN, the area of the proposed EZ
has been designated to host heavy industries (as per the Draft Report of BSMSN Master Plan IV prepared by
Sheltech). Thus, the following heavy industries have been identified for the demand projection framework.
Core set of industries:
• Chemicals
• Non-metallic minerals
• Heavy Machinery, Iron & Steel and Metals
• Auto and Automobile accessories
• Petroleum products (including bottling)
3. Assumptions related to industrial growth rate (organic)
193 This is an integrated industrial arcade comprising of industrial tenants, PPP developers (such as SBG), and other developers (like BEPZA, BGMEA, Indian EZ to name a few). Mirsarai Bangabandhu Shiekh Mujib Industrial City is spread over 30,000 acres and details about the land allotment has been obtained from BEZA officials 194 As per the information obtained from BEZA, details are provided in the annexure. 195 Draft Report of BSMSN Master Plan IV prepared by Sheltech (Shared by World Bank on 30th June 2020 over mail)
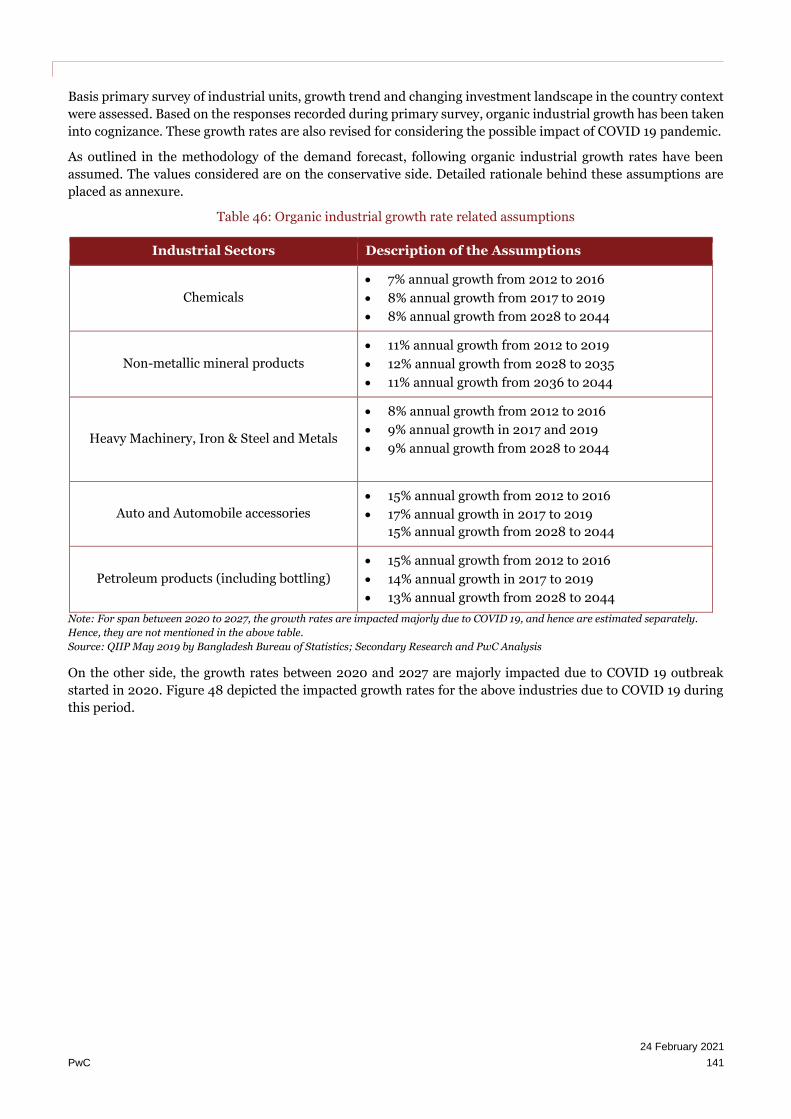
24 February 2021
PwC 141
Basis primary survey of industrial units, growth trend and changing investment landscape in the country context
were assessed. Based on the responses recorded during primary survey, organic industrial growth has been taken
into cognizance. These growth rates are also revised for considering the possible impact of COVID 19 pandemic.
As outlined in the methodology of the demand forecast, following organic industrial growth rates have been
assumed. The values considered are on the conservative side. Detailed rationale behind these assumptions are
placed as annexure.
Table 46: Organic industrial growth rate related assumptions
Industrial Sectors Description of the Assumptions
Chemicals
• 7% annual growth from 2012 to 2016
• 8% annual growth from 2017 to 2019
• 8% annual growth from 2028 to 2044
Non-metallic mineral products
• 11% annual growth from 2012 to 2019
• 12% annual growth from 2028 to 2035
• 11% annual growth from 2036 to 2044
Heavy Machinery, Iron & Steel and Metals
• 8% annual growth from 2012 to 2016
• 9% annual growth in 2017 and 2019
• 9% annual growth from 2028 to 2044
Auto and Automobile accessories
• 15% annual growth from 2012 to 2016
• 17% annual growth in 2017 to 2019
15% annual growth from 2028 to 2044
Petroleum products (including bottling)
• 15% annual growth from 2012 to 2016
• 14% annual growth in 2017 to 2019
• 13% annual growth from 2028 to 2044
Note: For span between 2020 to 2027, the growth rates are impacted majorly due to COVID 19, and hence are estimated separately.
Hence, they are not mentioned in the above table.
Source: QIIP May 2019 by Bangladesh Bureau of Statistics; Secondary Research and PwC Analysis
On the other side, the growth rates between 2020 and 2027 are majorly impacted due to COVID 19 outbreak
started in 2020. Figure 48 depicted the impacted growth rates for the above industries due to COVID 19 during
this period.

24 February 2021
PwC 142
Figure 48: Revised Growth Rates of Industries due to COVID 19 pandemic

24 February 2021
PwC 143
The Rationale behind the growth rates:
Due to the outbreak of COVID 19 pandemic in the country, and across the globe, the industry growth for various
industrial sectors is expected to suffer in short term. In order to consider this, each industry is assessed in the
perspective of COVID 19 pandemic impact, and revised growth rates are estimated based on the economic
forecasts of the World Bank. These industrial growth rates are estimated to dip in the initial years (2020 to 2025),
while they are expected to pick up due to low base effect along with possible economic boom for next couple of
years. From Figure 48, the dip in growth rates between 2020 to 2025 can be observed, while the expected boom
post the dip can also be seen for year 2026 and 2027.
4. Assumptions related to investment inflow in the influence area of the proposed EZ in
Sitakundo
Out of the total investment forecasted at the country level, certain portion is expected to inflow at the influence
area (refer to section 5.5 – “Regional Assessment”) level for the proposed EZ. A part of this investment inflow is
Greenfield in nature (involves setting up of new facilities). Out of the total Greenfield investment estimated at the
influence area level, it has been assumed that a certain quantum would take place in the economic zones proposed
within this area. Following table captures the assumptions related to investment inflow in economic zones of the
influence area for the proposed EZ.
Table 47: Assumptions related to investment inflow in economic zones of Chattogram division
Details Conservative Base Aggressive
Investment in the EZ influence area as % of the total
investment estimated for the country 14.5% 15.0% 15.5%
% of Greenfield investment 49.0% 50.0% 51.0%
Investment in economic zones (%) out of total
Greenfield investment 69.0% 70.0% 71.0%
Source: Secondary research and PwC Analysis
Based on information availed from secondary research and PwC analysis, the districts constituting the influence
area of the proposed EZ contributes to ~18.1% of GDP of the country. Thus, investment in this influence area has
been assumed as 10% (in base case) of the total investment inflow in the country. Research articles suggest that
in developing countries, % of Greenfield investment is ~57.85%.196 Thus in base case, 50% of Greenfield
investment has been assumed.
BEZA has embarked into an ambitious journey of setting up of 100 economic zones across Bangladesh by 2029.
In addition, a significant number of these planned EZs are proposed in the Dhaka and Chattogram division.
Keeping in cognizance of the same and the fact that BSMSN is the focus of industrial development in the country,
it has been assumed that in base case, 70% novel investment in economic zones (out of total Greenfield
investment) would flow in.
Detailed rationale behind these assumptions are placed as annexure.
5. Assumptions related to investment-land intensity and number of establishments
Based on prevailing practices and primary interaction with industries and taking in cognizance similar
developments in the geographical context, investment-land intensity ratio (investment per unit land area) for the
shortlisted industries have been arrived at. These figures are indicative in nature and may vary depending on the
exact stage of value chain and the type of finished goods.
It is very difficult to estimate number of industrial establishments in any economic zone during project
conceptualization stage. Synthesizing number of industrial establishment data obtained from Survey of
Manufacturing Industries 2012 with the feedback obtained from primary survey, number of industrial
196 http://documents.worldbank.org/curated/en/628261468781753575/110510322_20041117173021/additional/325780wps3192.pdf
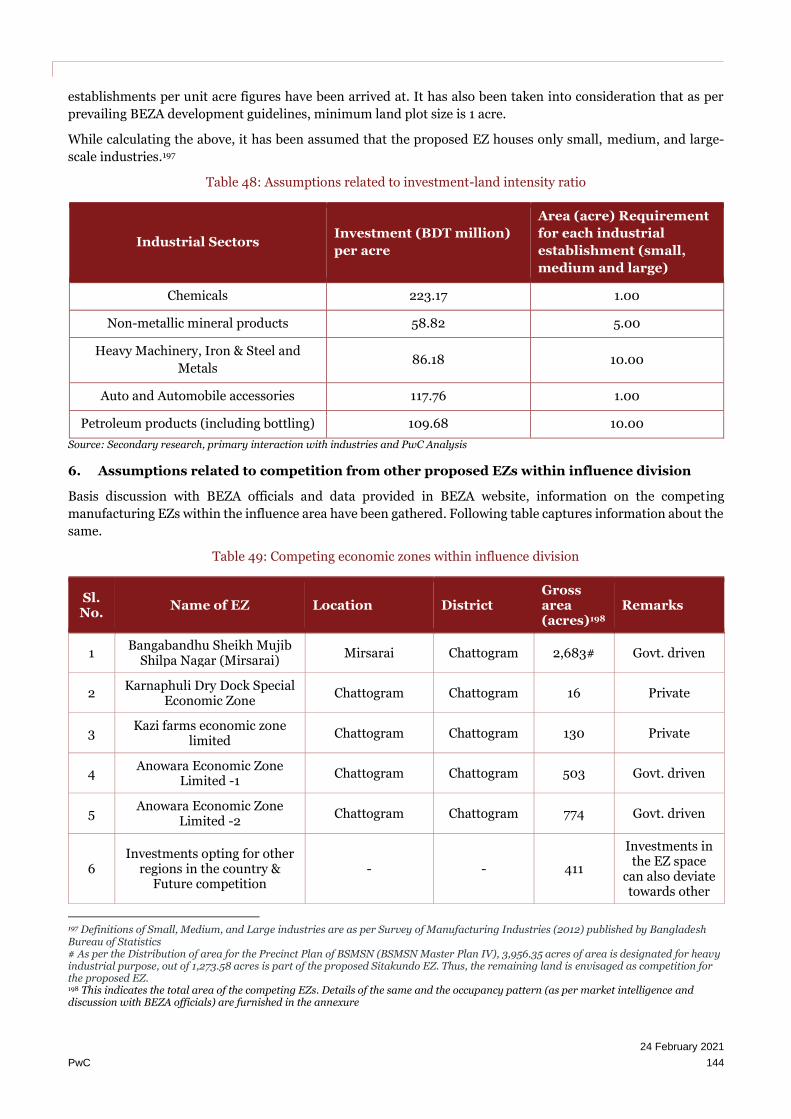
24 February 2021
PwC 144
establishments per unit acre figures have been arrived at. It has also been taken into consideration that as per
prevailing BEZA development guidelines, minimum land plot size is 1 acre.
While calculating the above, it has been assumed that the proposed EZ houses only small, medium, and large-
scale industries.197
Table 48: Assumptions related to investment-land intensity ratio
Industrial Sectors Investment (BDT million)
per acre
Area (acre) Requirement
for each industrial
establishment (small,
medium and large)
Chemicals 223.17 1.00
Non-metallic mineral products 58.82 5.00
Heavy Machinery, Iron & Steel and
Metals 86.18 10.00
Auto and Automobile accessories 117.76 1.00
Petroleum products (including bottling) 109.68 10.00
Source: Secondary research, primary interaction with industries and PwC Analysis
6. Assumptions related to competition from other proposed EZs within influence division
Basis discussion with BEZA officials and data provided in BEZA website, information on the competing
manufacturing EZs within the influence area have been gathered. Following table captures information about the
same.
Table 49: Competing economic zones within influence division
Sl. No.
Name of EZ Location District Gross area (acres)198
Remarks
1 Bangabandhu Sheikh Mujib
Shilpa Nagar (Mirsarai) Mirsarai Chattogram 2,683# Govt. driven
2 Karnaphuli Dry Dock Special
Economic Zone Chattogram Chattogram 16 Private
3 Kazi farms economic zone
limited Chattogram Chattogram 130 Private
4 Anowara Economic Zone
Limited -1 Chattogram Chattogram 503 Govt. driven
5 Anowara Economic Zone
Limited -2 Chattogram Chattogram 774 Govt. driven
6 Investments opting for other
regions in the country & Future competition
- - 411
Investments in the EZ space
can also deviate towards other
197 Definitions of Small, Medium, and Large industries are as per Survey of Manufacturing Industries (2012) published by Bangladesh Bureau of Statistics # As per the Distribution of area for the Precinct Plan of BSMSN (BSMSN Master Plan IV), 3,956.35 acres of area is designated for heavy industrial purpose, out of 1,273.58 acres is part of the proposed Sitakundo EZ. Thus, the remaining land is envisaged as competition for the proposed EZ. 198 This indicates the total area of the competing EZs. Details of the same and the occupancy pattern (as per market intelligence and discussion with BEZA officials) are furnished in the annexure
24 February 2021
PwC 145
Sl. No.
Name of EZ Location District Gross area (acres)198
Remarks
regions in the country owing
to the prosperity of
the Dhaka division. In
order to factor that in our
calculations and to factor the effect of
future competitions
that may creep up in the form of more EZs in
the same influence area,
we have assumed that ~10% of the
total land of the competing
zones will be contributing to lost demand in
the form of investments
opting for other regions in the
country & future
competition
Source: BEZA website and discussion with BEZA officials
In line with the above information, industrial space uptake in the competing EZs have been assumed. Details of
the same are placed in the annexure. Basis market intelligence and suggestions obtained from various BEZA
officials, and realistic development scenarios of these competing EZs, this assumption has been formulated.
However, on ground scenario may vary than this assumption.
7. Industrial space requirement as % of total land area
In any EZ, a certain proportion is allotted for industrial space. Remaining portion is kept reserved for allied on-
site infrastructure (such as internal road connection, water and sewer system, effluent treatment facilities and
utility connection) and non-processing zone (such as entrance plaza, social infrastructure, skill development
facilities, green space and other amenities). Typically, 65% to 75% of the total land area is earmarked for industrial
purposes. In small land parcels, this % is higher and it is lower for large land parcels. Considering the size of this
land parcel (2,206.84 acres), it has been assumed that 65% of the total land area would be earmarked for
industrial purposes. However, this is tentative and based on development guidelines of BEZA & similar
developments worldwide.
8. Utility requirements and employment generation
Standard industry benchmarks and excerpts from the primary survey have been referred to arrive at the
benchmark figures (per unit area) towards estimation of utility requirements and direct employment generation.
It is to be noted that these figures are indicative in nature. These figures may vary during on-ground

24 February 2021
PwC 146
implementation of the proposed EZ and as per the stage in the value chain for the industry. These figures are also
dependent on the production capacity and exact type of finished goods being produced.
Following table captures these benchmark figures.
Table 50: Utility requirements and employment generation- benchmark figures
Industry sectors
Power
requirements (kVA
per acre)
Water
requirements
(Cum per day per
acre)
Direct
Employment
generation
(Number per
acre)
Chemicals 185.00 60.00 164
Non-metallic mineral products 125.00 50.00 603
Heavy Machinery, Iron & Steel and
Metals 185.00 50.00 82
Auto and Automobile accessories 145.00 56.43 98
Petroleum products (including
bottling) 185.00 90.00 36
Source: Industry best practices & standard benchmarks, primary survey
Basis primary survey, most of the industries use gas as fuel source to generate power and for boiler usage.
Depending on the value chain requirements and requirements of factors of production, the same would vary. It
is very difficult to estimate gas requirements without comprehending the exact requirements and exact product
type from these industries. Thus, estimation of gas requirement has not been carried out in this module.
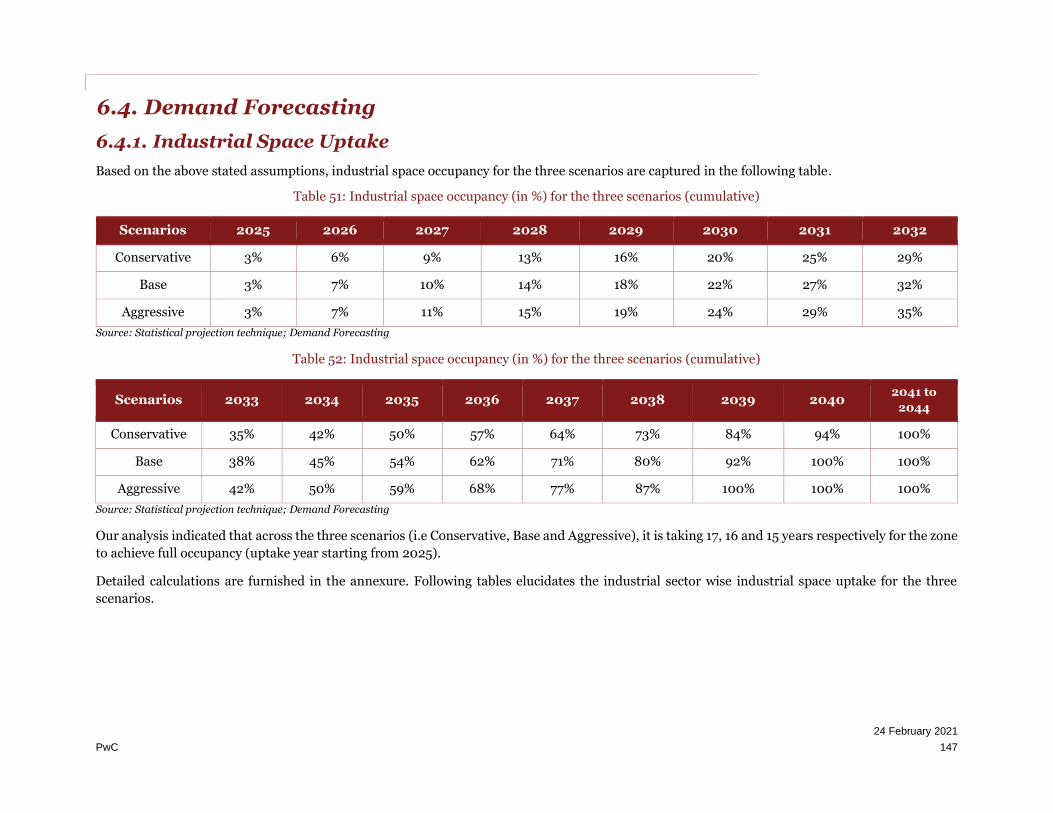
24 February 2021
PwC 147
6.4. Demand Forecasting
6.4.1. Industrial Space Uptake
Based on the above stated assumptions, industrial space occupancy for the three scenarios are captured in the following table.
Table 51: Industrial space occupancy (in %) for the three scenarios (cumulative)
Scenarios 2025 2026 2027 2028 2029 2030 2031 2032
Conservative 3% 6% 9% 13% 16% 20% 25% 29%
Base 3% 7% 10% 14% 18% 22% 27% 32%
Aggressive 3% 7% 11% 15% 19% 24% 29% 35%
Source: Statistical projection technique; Demand Forecasting
Table 52: Industrial space occupancy (in %) for the three scenarios (cumulative)
Scenarios 2033 2034 2035 2036 2037 2038 2039 2040 2041 to
2044
Conservative 35% 42% 50% 57% 64% 73% 84% 94% 100%
Base 38% 45% 54% 62% 71% 80% 92% 100% 100%
Aggressive 42% 50% 59% 68% 77% 87% 100% 100% 100%
Source: Statistical projection technique; Demand Forecasting
Our analysis indicated that across the three scenarios (i.e Conservative, Base and Aggressive), it is taking 17, 16 and 15 years respectively for the zone
to achieve full occupancy (uptake year starting from 2025).
Detailed calculations are furnished in the annexure. Following tables elucidates the industrial sector wise industrial space uptake for the three
scenarios.

24 February 2021
PwC 148
Table 53: Industrial space uptake- Conservative Scenario (figures in acres) – cumulative
Industry 2025 2026 2027 2028 2029 2030 2031 2032
Chemicals 2 4 6 8 10 12 14 16
Non-Metallic Minerals 24 51 79 107 137 172 211 252
Auto and Automobile Accessories
3 6 10 14 19 24 30 36
Heavy Machinery, Iron & Steel and Metals
12 24 38 50 64 79 95 111
Petroleum Products including Bottling
0 1 1 2 3 3 4 5
Total 41 86 135 180 231 290 354 421
Source: Statistical projection technique; Demand Forecasting (kindly ignore the rounding off)
Table 54: Industrial space uptake- Conservative Scenario (figures in acres) – cumulative
Industry 2033 2034 2035 2036 2037 2038 2039 2040 2041 to
2044
Chemicals 19 22 26 29 33 36 41 45 48
Non-Metallic Minerals 301 359 430 493 558 630 724 813 865
Auto and Automobile Accessories
44 54 66 78 91 106 126 146 158
Heavy Machinery, Iron & Steel and Metals
131 153 180 205 231 258 294 327 345
Petroleum Products including Bottling
6 7 9 10 12 13 15 18 19
Total 502 596 711 815 925 1044 1201 1348 1434
Source: Statistical projection technique; Demand Forecasting (kindly ignore the rounding off)

24 February 2021
PwC 149
Table 55: Industrial space uptake- Base Scenario (figures in acres) – cumulative
Industry 2025 2026 2027 2028 2029 2030 2031 2032
Chemicals 2 4 6 8 11 13 15 18
Non-Metallic Minerals 26 55 87 116 150 188 231 276
Auto and Automobile Accessories
3 7 11 15 20 26 33 40
Heavy Machinery, Iron & Steel and Metals
13 27 41 55 70 86 104 122
Petroleum Products including Bottling
0 1 2 2 3 4 4 5
Total 44 94 147 197 253 317 388 461
Source: Statistical projection technique; Demand Forecasting (kindly ignore the rounding off)
Table 56: Industrial space uptake- Base Scenario (figures in acres) – cumulative
Industry 2033 2034 2035 2036 2037 2038 2039 2040 2041 to
2044
Chemicals 21 24 28 32 36 40 45 49 49
Non-Metallic Minerals 330 393 470 539 611 690 793 865 865
Auto and Automobile Accessories
49 59 72 85 100 116 138 154 154
Heavy Machinery, Iron & Steel and Metals
144 168 197 224 253 283 322 348 348
Petroleum Products including Bottling
6 8 9 11 13 14 17 19 19
Total 550 653 777 891 1012 1144 1315 1434 1434
Source: Statistical projection technique; Demand Forecasting (kindly ignore the rounding off)

24 February 2021
PwC 150
Table 57: Industrial space uptake- Aggressive Scenario (figures in acres) – cumulative
Industry 2025 2026 2027 2028 2029 2030 2031 2032
Chemicals 2 5 7 9 11 14 17 20
Non-Metallic Minerals 29 60 94 127 163 205 252 301
Auto and Automobile Accessories
3 7 12 17 22 28 36 43
Heavy Machinery, Iron & Steel and Metals
14 29 45 60 76 94 113 133
Petroleum Products including Bottling
0 1 2 2 3 4 5 6
Total 48 102 160 215 276 345 423 503
Source: Statistical projection technique; Demand Forecasting (kindly ignore the rounding off)
Table 58: Industrial space uptake- Aggressive Scenario (figures in acres) – cumulative
Industry 2033 2034 2035 2036 2037 2038 2039 2040 2041 to
2044
Chemicals 23 27 31 35 39 44 49 49 49
Non-Metallic Minerals 360 429 512 587 666 753 864 865 865
Auto and Automobile Accessories 53 65 79 93 109 127 151 151 151
Heavy Machinery, Iron & Steel and Metals 157 183 214 244 275 309 351 351 351
Petroleum Products including Bottling 7 8 10 12 14 16 18 19 19
Total 600 712 846 971 1104 1248 1434 1434 1434
Source: Statistical projection technique; Demand Forecasting (kindly ignore the rounding off)
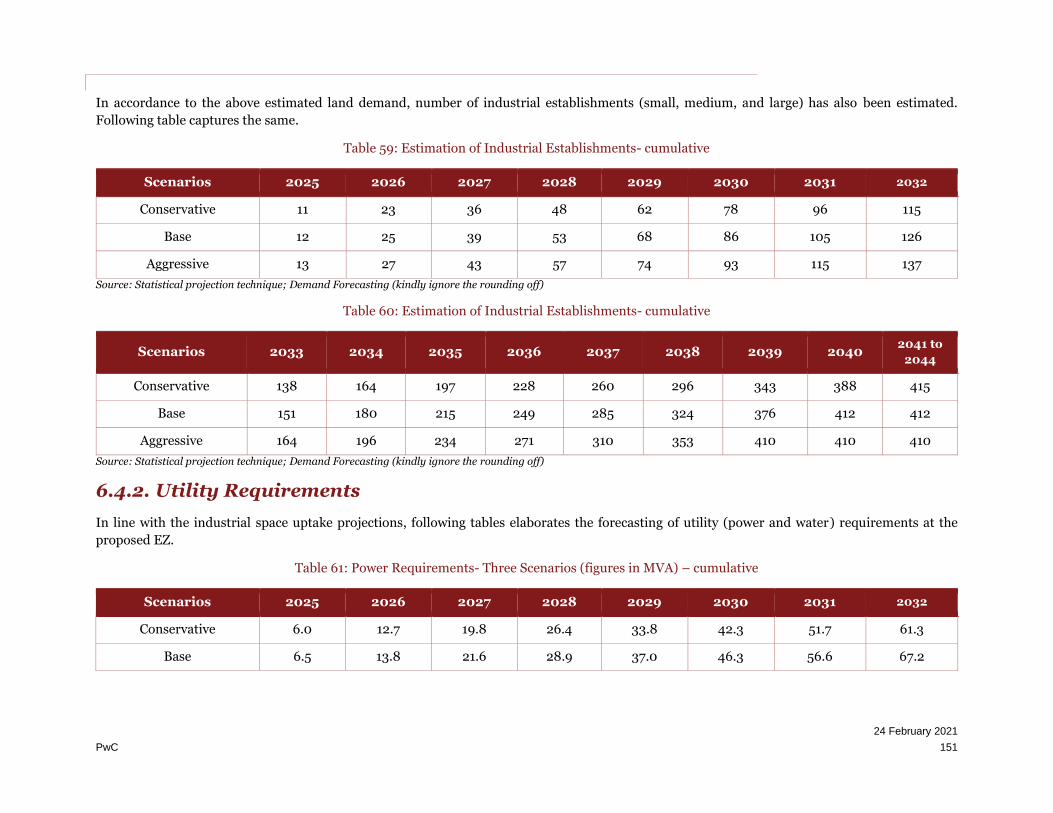
24 February 2021
PwC 151
In accordance to the above estimated land demand, number of industrial establishments (small, medium, and large) has also been estimated.
Following table captures the same.
Table 59: Estimation of Industrial Establishments- cumulative
Scenarios 2025 2026 2027 2028 2029 2030 2031 2032
Conservative 11 23 36 48 62 78 96 115
Base 12 25 39 53 68 86 105 126
Aggressive 13 27 43 57 74 93 115 137
Source: Statistical projection technique; Demand Forecasting (kindly ignore the rounding off)
Table 60: Estimation of Industrial Establishments- cumulative
Scenarios 2033 2034 2035 2036 2037 2038 2039 2040 2041 to
2044
Conservative 138 164 197 228 260 296 343 388 415
Base 151 180 215 249 285 324 376 412 412
Aggressive 164 196 234 271 310 353 410 410 410
Source: Statistical projection technique; Demand Forecasting (kindly ignore the rounding off)
6.4.2. Utility Requirements
In line with the industrial space uptake projections, following tables elaborates the forecasting of utility (power and water) requirements at the
proposed EZ.
Table 61: Power Requirements- Three Scenarios (figures in MVA) – cumulative
Scenarios 2025 2026 2027 2028 2029 2030 2031 2032
Conservative 6.0 12.7 19.8 26.4 33.8 42.3 51.7 61.3
Base 6.5 13.8 21.6 28.9 37.0 46.3 56.6 67.2

24 February 2021
PwC 152
Scenarios 2025 2026 2027 2028 2029 2030 2031 2032
Aggressive 7.1 15.0 23.4 31.4 40.3 50.4 61.6 73.3
Source: Statistical projection technique; Demand Forecasting (kindly ignore the rounding off)
Table 62: Power Requirements- Three Scenarios (figures in MVA) – cumulative
Scenarios 2033 2034 2035 2036 2037 2038 2039 2040 2041 to
2044
Conservative 73.0 86.6 103.0 118.1 133.9 151.1 173.7 194.8 207.2
Base 80.0 94.8 112.6 129.2 146.6 165.5 190.1 207.3 207.3
Aggressive 87.3 103.4 122.6 140.7 159.8 180.6 207.4 207.4 207.4
Source: Statistical projection technique; Demand Forecasting (kindly ignore the rounding off)
Table 63: Water Requirements- Three Scenarios (figures in MLD) – cumulative
Scenarios 2025 2026 2027 2028 2029 2030 2031 2032
Conservative 2.05 4.32 6.74 9.01 11.56 14.46 17.68 20.99
Base 2.23 4.70 7.35 9.85 12.64 15.82 19.35 23.00
Aggressive 2.41 5.10 7.99 10.72 13.77 17.24 21.09 25.10
Source: Statistical projection technique; Demand Forecasting (kindly ignore the rounding off)
Table 64: Water Requirements- Three Scenarios (figures in MLD) – cumulative
Scenarios 2033 2034 2035 2036 2037 2038 2039 2040 2041 to
2044
Conservative 25.02 29.69 35.38 40.55 45.99 51.87 59.64 66.90 71.16
Base 27.42 32.51 38.68 44.35 50.34 56.84 65.28 71.20 71.20
Aggressive 29.92 35.45 42.11 48.31 54.88 62.01 71.23 71.23 71.23
Source: Statistical projection technique; Demand Forecasting (kindly ignore the rounding off)
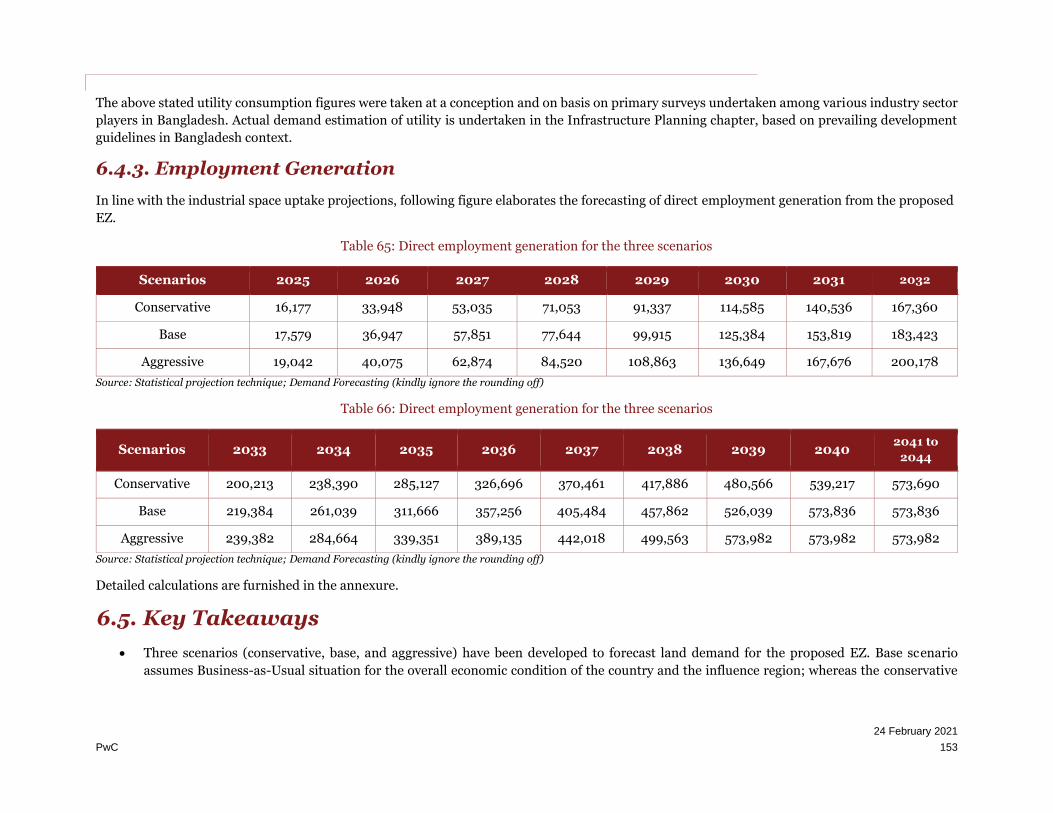
24 February 2021
PwC 153
The above stated utility consumption figures were taken at a conception and on basis on primary surveys undertaken among various industry sector
players in Bangladesh. Actual demand estimation of utility is undertaken in the Infrastructure Planning chapter, based on prevailing development
guidelines in Bangladesh context.
6.4.3. Employment Generation
In line with the industrial space uptake projections, following figure elaborates the forecasting of direct employment generation from the proposed
EZ.
Table 65: Direct employment generation for the three scenarios
Scenarios 2025 2026 2027 2028 2029 2030 2031 2032
Conservative 16,177 33,948 53,035 71,053 91,337 114,585 140,536 167,360
Base 17,579 36,947 57,851 77,644 99,915 125,384 153,819 183,423
Aggressive 19,042 40,075 62,874 84,520 108,863 136,649 167,676 200,178
Source: Statistical projection technique; Demand Forecasting (kindly ignore the rounding off)
Table 66: Direct employment generation for the three scenarios
Scenarios 2033 2034 2035 2036 2037 2038 2039 2040 2041 to
2044
Conservative 200,213 238,390 285,127 326,696 370,461 417,886 480,566 539,217 573,690
Base 219,384 261,039 311,666 357,256 405,484 457,862 526,039 573,836 573,836
Aggressive 239,382 284,664 339,351 389,135 442,018 499,563 573,982 573,982 573,982
Source: Statistical projection technique; Demand Forecasting (kindly ignore the rounding off)
Detailed calculations are furnished in the annexure.
6.5. Key Takeaways
• Three scenarios (conservative, base, and aggressive) have been developed to forecast land demand for the proposed EZ. Base scenario
assumes Business-as-Usual situation for the overall economic condition of the country and the influence region; whereas the conservative
24 February 2021
PwC 154
(aggressive) scenarios assume bad (good) performance of economic and infrastructure indicators in regard to the country and the influence
region.
• Previous assumptions related to industrial growth rates has been revised to factor in the effect of the COVID-19 pandemic. The effect of the
same has been considered in the land uptake projections.
• Our analysis indicates that in conservative case, complete land uptake would take place in 17 years. For base and aggressive cases, the same
would be spread over 16 years and 15 years respectively in the Post-COVID scenario.
• Our analysis indicates that Non-Metallic Minerals and Iron & Steel exhaust most of the industrial land (~84%). Followed by Chemicals, Auto
& Automobile Accessories, and Petroleum products (including bottling), which constitute the rest of the industrial mix (~16%)
• Total number of industrial establishments (small, medium, and large) across Conservative, Base and Aggressive scenario is 415, 412, and
410 respectively.
• For conservative case, ultimate power and water demand have been estimated as 207.2 MVA and 71.16 MLD; For base case, ultimate power
and water demand have been estimated as 207.3 MVA and 71.20 MLD; For aggressive case, ultimate power and water demand have been
estimated as 207.4 MVA and 71.23 MLD.
• Proposed EZ is expected to generate direct employment of 573,690 in conservative case. In base and aggressive cases, employment
generation figures could be 573,836 and 573,982. These figures are indicative and may vary during implementation.

24 February 2021
PwC 155
7. Transport Assessment
7.1. Purpose and Objective
Transport Assessment is a systematic and comprehensive process that lists and analyzes current transport
facilities (which includes Road connectivity, Land Ports, Sea Ports and Inland and Water Terminals,
Airports and Railways), various issues and challenges related to such facilities and future plans linked to a
proposed development. A well developed and linked transport infrastructure facilitates easy movement of
people and material to and from a proposed development. In an increasingly globalized economy, industrial
development of any region or sector needs to be linked to the development of areas that support the
development of the same industry and sector. Hence, analysis and development of the current transport
sector associated with the said development is very important as it ensures movement of traffic in and out
to major international transit gateways and domestic centers.
This chapter will highlight and assess the current transport infrastructure available in the vicinity of
proposed EZ site and existing connectivity with major international transit points. A comprehensive study
of the transport infrastructure consisting of road, railway, IWT, port and airport will be performed to
understand as-is scenario. The impact of the development of proposed EZ site on all transport modes will
be considered and proposals to upgrade the existing transport network in order to support the proposed EZ
site will be explained.
7.2. Methodology of Transport Assessment
The approach adopted to assess the transport infrastructure, supporting movement of goods and
passengers in the vicinity of the proposed EZ site is segregated into 2 modules. 1st module deals with
evaluation of the existing status of different modes of transport with respect to its features, connectivity,
traffic flow, ongoing projects for upgradation and transportation costs involved. 2nd module contains
recommended upgradations of different modes of transport infrastructure to support the future traffic flows
due to the proposed EZ, cost implication of such upgradations, timeframe over which the upgradation
should take place and the departments responsible for the concerned upgradation.
Figure 49: Transport Assessment Methodology
Source: PwC Analysis

24 February 2021
PwC 156
7.3. Review of National Infrastructure with respect to site
A macro level view of major transport nodes across Bangladesh has been outlined in the figure below –
Source: PwC Analysis
Figure 50: Bangladesh’s major transport nodes with respect to Proposed EZ site

24 February 2021
PwC 157
7.3.1. Road connectivity
Road connectivity is essential to foster last mile connectivity of cargo from source to destination. Good
access to roadways shall enable seamless movement of cargo to/ from the proposed EZ to industrial nodes
and trade gateways.
Following figure captures the road infrastructure in the vicinity of the project site.
Figure 51: Road infrastructure in the vicinity of the proposed EZ
Source: Google Map and PwC Analysis
As mentioned in the earlier sections, the proposed EZ is a part of BSMSN Industrial city and is also located
along the industrial corridor (and the major spine of the country i.e. Dhaka Chattogram highway – N1) from
Dhaka to Chattogram. The locational advantage of proposed EZ site could give a fillip to the industries that
would be established at proposed EZ site since Dhaka-Chattogram route is the most vital industrial and
transport corridor of Bangladesh providing access to trade gateway in Chattogram and domestic market in
Dhaka. The location of proposed EZ site could provide market access and raw material access to both
domestic and export oriented industries.

24 February 2021
PwC 158
7.3.1.1. Highways near the proposed EZ
Dhaka-Chattogram Highway is the most important arterial route in Bangladesh connecting the industrial
hubs along Dhaka-Chattogram corridor. This highway is a mix of 4-lane and 2- lane roads having an average
width of 8.35 meters and bulk of the commercial traffic passing between Dhaka-Chattogram make use of
this road. Inclusion of this highway to be a part of the Asian Highway network (AH41) highlights the
importance of this stretch of road in providing connectivity to neighboring countries like India and
Myanmar.
As per Draft Report of BSMSN Master Plan IV prepared by Sheltech, the proposed EZ is connected to N1
via 8 km long road (Barodamgar Haat road). BEZA and RHD are undertaking construction works on this
stretch to make it conducive for cargo movement as the proposed EZ at Sitakundo is specially designated
for Heavy industries. Following depicts the last mile connectivity aspect for the proposed EZ at Sitakundo.
Figure 52: Last mile connectivity for the proposed EZ
Source: Draft Report of BSMSN Master Plan IV prepared by Sheltech

24 February 2021
PwC 159
As shown in the figure above, Barodamgar Haat road directly connects the proposed EZ with N1. N1
connects the site with Dhaka (~226 km) and Chattogram (~51 km). N1 also connects the site with Comilla
(~116 km). The site is connected with Sylhet (~353 km) through N1 which connects it to Comilla –
Burichang road (Z1041) which further connects to Dhaka – Sylhet Highway (N2) via Mainamati – Comilla
Highway (N102). Sitakundo is also connected to the Chittagong port and Shah Amanat International airport
through the Port Link which deviates from N1 at Salimpur and provide smooth connectivity and reduces
the distance by around 15 km and thus decrease transportation time for goods.
N1, N102, N2 are black top roads which can support movement of heavy vehicles. The location of proposed
EZ site is favorably in proximity to Dhaka-Chattogram highway (N1).
Vehicular Traffic
As per data available in Roads and Highways Department (RHD) database, Average Annual Daily Traffic
(AADT) for N1 is 12,582 vehicles, out of which 11,896 is motorized, rest is non-motorized.
Data from RHD reveals that AADT for N102 is 10,860 vehicles, out of which 1,352 is motorized and rest is
non-motorized and AADT for Z1041 is 4,493 vehicles, out of which 4,132 is motorized and rest is non-
motorized. Traffic volume in Z1041 is significantly lower than the traffic volume of busiest road links in the
country.
The existing Dhaka-Chattogram highway (N1) is proposed to be augmented from 4-lane to 6-lane. This
would allow a faster 2-way movement of heavy vehicles, which is essential for transporting construction
material, as well as raw material and manufactured goods. Augmentation works are already underway in
N102 road connecting Comilla with Brahmanbaria.
Present Hindrance and Redressal by GoB
By virtue of providing connectivity between the two most important hubs in Bangladesh. Dhaka-
Chattogram highway transports the bulk of Bangladesh’s cargo meant for international trade. Taking
cognizance of the economic importance of this highway, GoB had undertaken a road widening exercise
along the entire alignment of this highway. However, there were some stretches where road widening could
not be performed due to geographical challenges or presence of human settlement. These stretches often
result in bottlenecks, as a result which Dhaka-Chattogram highway witness’s heavy traffic congestion often
resulting in tailbacks stretching several kilometers.199
In order to ensure smooth flow of traffic, GoB has decided to construct a Dhaka-Chattogram Access
Controlled Expressway project to enhance and ensure safer and more reliable road communication between
Dhaka and Chattogram which would double the transportation capacity of vehicles, at the same time would
also reduce travel time along this corridor.200 Currently feasibility studies for construction of this
Expressway is in progress.
A four-lane road along with the coastal area from Feni (100 km. from Chattogram city) to the Chittagong
port is envisaged by the government. Completion of this marine drive would help in bringing down the
travel time in the afore-mentioned route and thus de-congest Dhaka – Chattogram Highway. This would
also help in smooth transportation of goods to and from Chattogram.
199 http://www.dhakatribune.com/bangladesh/nation/2018/03/31/42km-long-tailback-dhaka-Chattogram-highway/ 200 http://www.pppo.gov.bd/projects-dhaka-Chattogram-access-controlled-highway.php

24 February 2021
PwC 160
The proposed EZ is expected to get a boost towards industrial development facilitating
smooth cargo movement once the proposed infrastructure within BSMSN and in the region
is operational.
7.3.1.2. Trunk Connectivity to Chattogram, Feni, Comilla and Dhaka
Trunk connectivity to the following major urban/industrial nodes in vicinity of the proposed EZ site are
highlighted below. These are –
• Dhaka
• Feni
• Comilla
• Chattogram
Dhaka city is the capital and largest city of Bangladesh. It is the commercial hub of the country, attracting
people from all over Bangladesh, who migrate to Dhaka in search of job and business prospects. Large
corporate houses (both domestic and foreign) in Bangladesh have their head-office in Dhaka. Several major
industries like textile/ RMG, pharmaceutical, leather, food processing, cement, electrical & electronics,
FMCG etc. are located in and around this city. The proposed EZ is around 223 km from Dhaka city and can
be accessed via Dhaka- Chattogram highway (N1). The travel time to reach Dhaka city from the proposed
EZ site is approximately 5 hours. Preemptive measures such as expansion of the number of lanes of the road
are already being taken to prevent future congestion (Dhaka gets traffic from all over Bangladesh).
The proposed EZ is around 60 km from Feni and can be accessed via Dhaka-Chattogram Highway (N1).
The travel time to reach Comilla from the proposed EZ is approximately 1.5 hours. Feni is home to major
industries related to cottage industry, bamboo and cane industry, textile industry, rice mill, jute mill etc.
Comilla is the second-largest city of eastern Bangladesh after Chattogram. Comilla is very important for
the industries that might come up in the proposed EZ site as Comilla is home to major industries related to
chemicals, fertilizer, RMG, electrical equipment, iron, steel and metal products, and leather products etc.,
which have potential for providing upstream and downstream linkages. The proposed site is around 113 km
from Comilla and can be accessed via Dhaka- Chattogram highway (N1). The travel time to reach Comilla
from the proposed EZ site is approximately 2.5 hours.
The proposed EZ is around 49 km from Chattogram city and can be accessed by travelling along Dhaka-
Chattogram Highway (N1). The travel time to reach Chattogram from the proposed EZ site is approximately
1.5 hours. Accessibility to Chattogram is vital due to the presence of several large scale industries related to
steel re-rolling, cement, RMG etc. Chattogram also has Bangladesh’s most important seaport, Chittagong
Sea Port through which ~80% of Bangladesh’s international trade takes place.201
Having good connectivity to Dhaka, Comilla, Feni and Chattogram is vital for industries in
Bangladesh as besides being a major industrial corridor, these regions are most densely
populated regions in Bangladesh.
Dhaka, Comilla, Feni and Chattogram districts figure in top 10 most densely populated districts in
Bangladesh, with Dhaka being the most densely populated district in Bangladesh having a population
density of 8,707 people per square km.202 Such high density create potential for consumer focused markets
for industries to cater to the needs of local residents.
201 http://www.cpa.gov.bd/ 202 Lagging District Survey

24 February 2021
PwC 161
7.3.2. Land ports
Bangladesh and India share a border line of 4,096 km, which is the fifth longest border in the world.203 Such
a long land border creates opportunity for mutually beneficial foreign trade. Land ports facilitates trade and
commerce between two countries, since they provide secure gateways through which cargo can be
transported. Facilities that can be developed at land ports include weighbridges, cargo handling stations,
warehouses, Inland Container Depots etc. Currently, India and Bangladesh have 23 land ports to facilitate
trade between the two countries.204
Under the Bangladesh Sthala Bandar Kartipaksha Act, 2001, the Bangladesh Land Port Authority (BLPA)
came into being to facilitate and improve between Bangladesh and neighboring countries.205 BLPA
functions under the Ministry of Shipping.
Bibirbazar land port on the south-eastern border of Bangladesh is the nearest land port which is situated
at a distance of 113 km from the proposed EZ site, requiring a travel time of approximately 2.5 hours. The
proposed EZ site is connected to the land port via N1 and Comilla-Bibirbazar road. It started its operations
in April 23, 2009. It has a total handling capacity of 0.5 million MT and storage capacity of 500 MT, spread
over an area of 10 acre. 206This land port has good infrastructure facilities with 1 warehouse, 1 open stack
yard, administrative building etc. The major items of import and export through this port has been listed
in table below.
Table 67: Types of goods being traded through Bibirbazar Land Port
Major imports Spices, sanitary ware, leather, machinery, fabric, fruit etc.
Major exports Crashed stone, cement, drinks, PVC, furniture, knit fabrics, plastic door, ceramic tiles, cotton saree, plastic goods etc.
Source: Data from Bangladesh Land Port Authority Website
The following table depicts the quantity of exports and imports through Bibirbazar land port.
Table 68: Export and Import through Bibirbazar land Port (in MT)
Year 2012-13 2013-14 2014-15 2015-16 2016-17 2017-18 2018-19
Export 124,689 63,596 113,768 108,915 135,320 158,331 170,458
Import 0 24 28 231 455 317 479
Source: BLPA
The above table indicates that the cargo exports and imports have increased drastically over the years. Industries coming up within the EZ could source the raw materials and export the finished goods by leveraging this landport to India and other landlocked regions.
Akhaura land port is another land port on the eastern border of Bangladesh, which is located at a
distance of 178 km from the proposed EZ site, requiring a travel time of approximately 4.5 hours. This land
port is being operated by own management of BLPA. It has a capacity to handle 0.5 million Metric Tonnes
203 http://www.thehindu.com/news/national/half-of-indiabangladesh-border-fenced/article17396794.ece 204 Bangladesh Land Port Authority 205 Bangladesh Land Port Authority 206 Bangladesh Land Port Authority

24 February 2021
PwC 162
(MT) of goods per year and storage capacity of 2,000 MT. Access to Akhaura takes place via N1 and Comilla-
Sylhet Highway (N102). The major items of import and export through this port has been listed in table
below.
Table 69: Types of goods being traded through Akhaura land port
Major imports Bamboo, Turmeric, Watch, Ginger, Marble slab, Fruits etc.
Major exports Processed stone, Bricks, Tiles, Fish, Cement, Battery etc.
Source: Data from Bangladesh Land Port Authority Website
The items of trade enlisted in the tables above, indicate that presently heavy machineries or industrial goods
are not traded between Bangladesh and India through this port. This reveals that regional economy in
vicinity of the land port for both Bangladesh and India is non-industrialized and majorly dependent on
agriculture and light engineering. However, with growing urbanization, this region could witness a rise in
demand for industrial goods and heavy machinery. Industries that would operate in the proposed EZ could
cater to various consumer demand in the region and source raw materials by leveraging this land port. The
following table depicts the quantity of exports and imports through Akhaura land port.
Table 70: Export and Import through Akhaura land Port (in MT)
Year 2012-13 2013-14 2014-15 2015-16 2016-17 2017-18 2018-19
Export 372,381 278,377 635,547 568,480 214,755 201,580 209,962
Import 60 251 60 11 2 60 99
Source: BLPA
The above table indicates that the cargo is mainly exported from these land port. Industries coming up within the EZ could source the raw materials and export the finished goods by leveraging this landport.
Akhaura landport is at considerable distance from the proposed EZ making transfer of raw materials or
finished goods alike difficult to be transported to India, one of the major trade partners of Bangladesh.
Bibirbazar and Akhaura land ports are at relatively close distances from the proposed EZ, making transfer
of raw materials and finished goods easy to be transported to India, one of the major trade partners of
Bangladesh.
Present Hindrance and Redressal by GoB
Currently, cargo is being handled manually at the land ports. This results in slower clearance of goods that
are transported out of and into the ports, resulting in delays and congestion at the ports. As per our
discussions with Bangladesh Land Port Authority, mechanized cargo handling facilities are only available
at Benapole Land Port, located 444 km away from the EZ site.
A issue faced by at Bibirbazar Land port initially was that the Indian authorities had not issued pass for
loaded trucks and visible progress for the same was not visible. The highways connecting various industrial
hubs to these land ports are being developed further. Works for the same has already begun in intermittent
stretches. This will improve the flow of goods and raw materials to and from the proposed EZ to the land
ports.
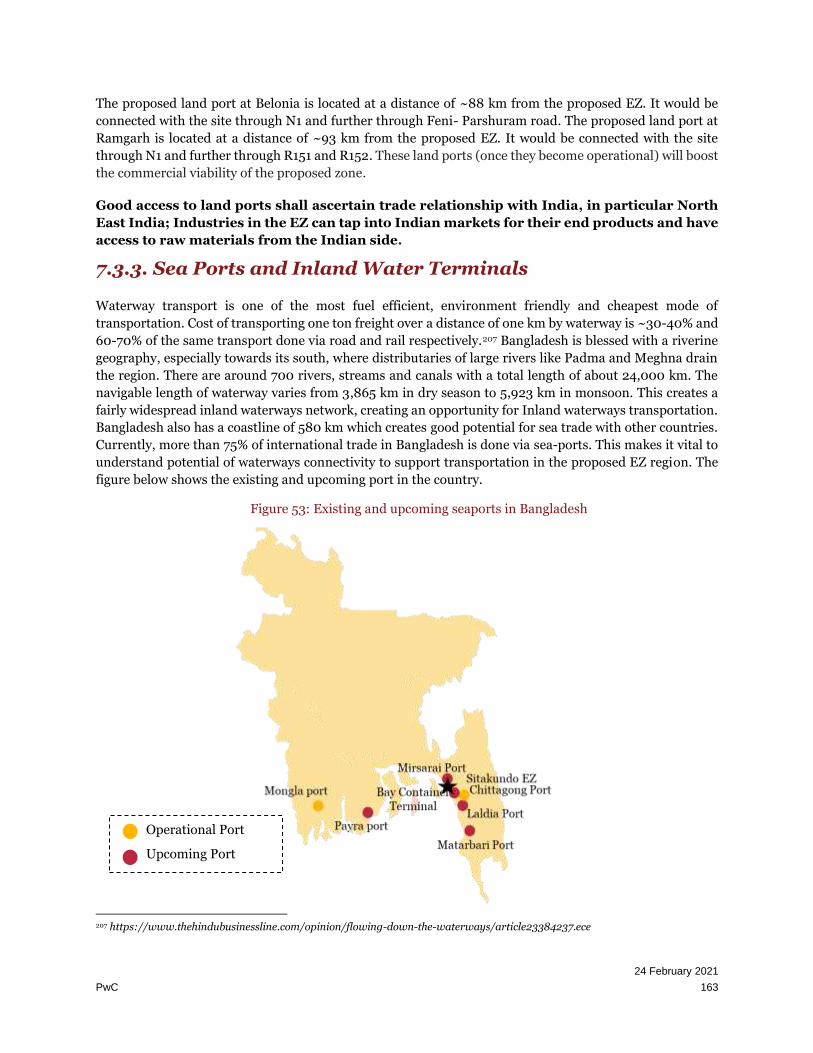
24 February 2021
PwC 163
The proposed land port at Belonia is located at a distance of ~88 km from the proposed EZ. It would be
connected with the site through N1 and further through Feni- Parshuram road. The proposed land port at
Ramgarh is located at a distance of ~93 km from the proposed EZ. It would be connected with the site
through N1 and further through R151 and R152. These land ports (once they become operational) will boost
the commercial viability of the proposed zone.
Good access to land ports shall ascertain trade relationship with India, in particular North
East India; Industries in the EZ can tap into Indian markets for their end products and have
access to raw materials from the Indian side.
7.3.3. Sea Ports and Inland Water Terminals
Waterway transport is one of the most fuel efficient, environment friendly and cheapest mode of
transportation. Cost of transporting one ton freight over a distance of one km by waterway is ~30-40% and
60-70% of the same transport done via road and rail respectively.207 Bangladesh is blessed with a riverine
geography, especially towards its south, where distributaries of large rivers like Padma and Meghna drain
the region. There are around 700 rivers, streams and canals with a total length of about 24,000 km. The
navigable length of waterway varies from 3,865 km in dry season to 5,923 km in monsoon. This creates a
fairly widespread inland waterways network, creating an opportunity for Inland waterways transportation.
Bangladesh also has a coastline of 580 km which creates good potential for sea trade with other countries.
Currently, more than 75% of international trade in Bangladesh is done via sea-ports. This makes it vital to
understand potential of waterways connectivity to support transportation in the proposed EZ region. The
figure below shows the existing and upcoming port in the country.
207 https://www.thehindubusinessline.com/opinion/flowing-down-the-waterways/article23384237.ece
Figure 53: Existing and upcoming seaports in Bangladesh
Operational Port
Upcoming Port

24 February 2021
PwC 164
Access to Sea Port
Chittagong Sea port is the nearest seaport which is located approximately 51 km from the proposed EZ. This
port is accessible via Dhaka-Chattogram highway (N1) and Port link road. The approximate travel time to
reach the port from the proposed EZ is around 1.5 hours. This seaport is the most important trade-
facilitating infrastructure in Bangladesh. The fact that on an average ~81.22% of Bangladesh’s international
trade takes place through Chittagong Port underlines the strategic importance of this seaport.208
Chittagong port has all major logistics infrastructure available like weighbridges, railway wagons for
container transport, railway terminal, container freight stations, dredgers, tugboats and specialized berths
for handling POL, grains, cement, urea, ammonia, containers, general cargo etc.
Figure 54: IWT and Sea ports near the proposed EZ
Source: Google Maps and PwC Research
Given the commercial importance of this port, infrastructure at Chittagong port is well developed. Figure below captures the quantum of cargo handled at Chittagong Port over the past 7 years.
208 http://www.cpa.gov.bd/

24 February 2021
PwC 165
Figure 55: Chittagong Port – Annual cargo Import and Export Figures
Source: Chittagong Port Authority
Figure above elucidates that volume of cargo being imported through Chittagong Port is far higher that
export figures and imports have more than doubled over the past 7 years. This highlights the need to boost
local manufacturing in Bangladesh. However, the rising trend of import and exports indicates that the
economy of Bangladesh is growing and with development of industrial infrastructure in Bangladesh, export
figures could get an impetus.
Present Hindrance and Redressal by GoB
Bangladesh EXIM demand stood at ~102 MTPA in FY 18 with containers contributing ~26% of share. Total
cargo traffic is estimated to grow at an effective growth rate of ~6.3% from FY 25 to FY 40 in line with GDP
forecast and to reach ~274 MTPA for bulk and ~11 million TEUs by FY 40.
Chittagong and Mongla are the only two major operational ports in the country; Chattogram handles more
than 90% of the total port traffic of the country. Draft constraints at Chittagong port prevents sea faring
mother vessel from reaching the port directly. The figure below depicts the rapid growth in pre-berthing
delay at Chittagong port
38,312 41,96048,941
58,32566,464
78,050 82,9395,0605,338
5,840
5,972
6,710
6,9976,846
2012-13 2013-14 2014-15 2015-16 2016-17 2017-18 2018-19
Met
ric
To
nn
e (i
n t
ho
usa
nd
s)
Import Export
2.7
4.2
6.3
8.7
11
0
2
4
6
8
10
12
FY 18 FY 25 FY 30 FY 35 FY 40
TEU traffic (Mn)
76
108
161
216
274
0
50
100
150
200
250
300
FY 18 FY 25 FY 30 FY 35 FY 40
Bulk cargo (MTPA)
Figure 56: Year-wise cargo traffic estimation
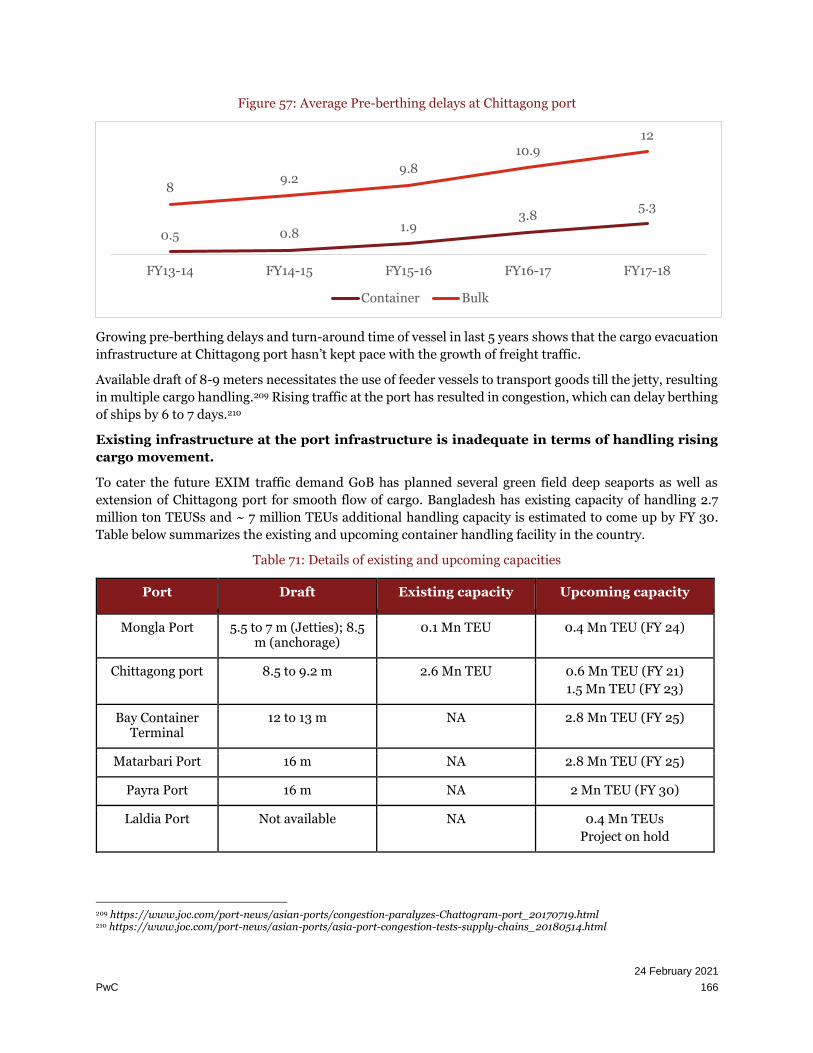
24 February 2021
PwC 166
Figure 57: Average Pre-berthing delays at Chittagong port
Growing pre-berthing delays and turn-around time of vessel in last 5 years shows that the cargo evacuation
infrastructure at Chittagong port hasn’t kept pace with the growth of freight traffic.
Available draft of 8-9 meters necessitates the use of feeder vessels to transport goods till the jetty, resulting
in multiple cargo handling.209 Rising traffic at the port has resulted in congestion, which can delay berthing
of ships by 6 to 7 days.210
Existing infrastructure at the port infrastructure is inadequate in terms of handling rising
cargo movement.
To cater the future EXIM traffic demand GoB has planned several green field deep seaports as well as
extension of Chittagong port for smooth flow of cargo. Bangladesh has existing capacity of handling 2.7
million ton TEUSs and ~ 7 million TEUs additional handling capacity is estimated to come up by FY 30.
Table below summarizes the existing and upcoming container handling facility in the country.
Table 71: Details of existing and upcoming capacities
Port Draft Existing capacity Upcoming capacity
Mongla Port 5.5 to 7 m (Jetties); 8.5 m (anchorage)
0.1 Mn TEU 0.4 Mn TEU (FY 24)
Chittagong port 8.5 to 9.2 m 2.6 Mn TEU 0.6 Mn TEU (FY 21)
1.5 Mn TEU (FY 23)
Bay Container Terminal
12 to 13 m NA 2.8 Mn TEU (FY 25)
Matarbari Port 16 m NA 2.8 Mn TEU (FY 25)
Payra Port 16 m NA 2 Mn TEU (FY 30)
Laldia Port Not available NA 0.4 Mn TEUs
Project on hold
209 https://www.joc.com/port-news/asian-ports/congestion-paralyzes-Chattogram-port_20170719.html 210 https://www.joc.com/port-news/asian-ports/asia-port-congestion-tests-supply-chains_20180514.html
0.5 0.81.9
3.85.3
89.2
9.8
10.912
FY13-14 FY14-15 FY15-16 FY16-17 FY17-18
Container Bulk

24 February 2021
PwC 167
In order to address these bottlenecks, Chittagong port Authority (CPA) has undertaken a dredging exercise
to increase the draft at Chittagong port. It is also in the process of installing new gantry cranes to enable
faster movement of goods. Additionally, to meet the increasing bulk cargo & container volumes and to
improve performance of port operations, and in a bid to strengthen the country’s trade handling
infrastructure, GoB has prioritized the establishment of a dedicated facility called the Bay Terminal (~64
km) that would assist in easing the pressure on Chittagong port.
Bay terminal would accommodate larger vessels and with improved quality of services and adequate
facilities, it would decrease the pressure on the Chittagong port. The new terminal is expected to be properly
designed with adequate parking facilities to avoid any vehicle related congestion issues; planned delivery
yards (for long-haul traffic) to prevent any interference with in-port movement & establish better control
on internal traffic. The storage yard capacities will be designed keeping in mind the surplus volumes
expected in future & will thus reduce the need for any sort of direct vessel feeding at Chittagong port.
Chittagong port Authority has envisaged to develop a new port in Mirsarai (~1 km) to enable direct sea
connectivity to the industrial city. As per studies conducted in this respect, there is approx. 8.5 m of draft
available in this part of the sea channel. Currently, this project is in conceptualization and planning stage
Once the proposed Mirsarai port is operationalized, it would provide a transit gateway to
manufacturers from EZ site to meet their sea trade requirements.
AS the EZ is sea facing, Jetty can be also used for transportation of raw material and finished goods directly
to EZ. This will drastically reduce the last mile logistics cost for the industries located within the EZ. Most
of the industry in Bangladesh are depends heavily on port either for import of raw material or export of
finished goods. Economic Zone with the allied port facility will be helpful in reducing the time lag in EXIM
and logistics cost for the industry in the region.
7.3.4. Airports
Air travel is the fastest mode of travel, which enables movement of passengers as well as time sensitive and
perishable cargo. Having such a mode of transport in vicinity of an industrial location enables faster
movement of decision makers of an organization who may have a need of making brief visits to production
centers. Perishable items like drugs, chemicals or food ingredients like dairy products, fish, fruits requiring
short travel time from centers of production to that of consumption also need access to air travel. This
necessitates the need to understand air travel facilities around the proposed EZ region.
Nearest major airport is Shah Amanat International Airport in Chattogram. It is Bangladesh’s 2nd largest
airport and provides air transport services to both domestic and international passengers. This airport is
around 51 km away from EZ site and can be accessed via Dhaka-Chattogram highway (N1) requiring around
1.5 hours of travel. Basis secondary research, it is understood that this airport has manual handling facilities
for cargo and provides services to more than 12 lakh people annually.211 Civil Aviation Authority of
Bangladesh has planned a few upgradation projects at this airport like construction of a parallel taxiway,
extension of the existing runway and construction of a cargo warehouse. These projects, upon completion,
will enable faster movement of cargo and enhance cargo handling capacity of this airport. This upgradation
would aid the industries that would be dependent on air cargo for movement of raw material and finished
products.212
211 http://dlca.logcluster.org/display/public/DLCA/2.2.2+Bangladesh+Shah+Amanat+International+Airport;jsessionid=D3203DDC18DB84A9D4C62A8A4DB784B2 212 http://caab.portal.gov.bd/site/page/199a0caf-101f-418f-bc8b-07626928a449

24 February 2021
PwC 168
Hazrat Shah Jalal International Airport (HSIA) at Dhaka is around 226 km from the proposed EZ. This
airport provides both international as well as domestic flight services. This airport has the capacity to handle
8 million passengers and 2 hundred thousand metric tonnes of cargo.
Both these airports can be accessed via Dhaka-Chattogram Highway.
7.3.5. Railways
It is cheaper to move goods through railways as compared to road. Railways can haul larger volumes of
cargo over longer distances as compared to trucks and trailers, and is also better than vehicles plying on
road, since it is easier to monitor and regulate traffic on railway lines. Moreover, transporting goods through
railways also help in easing traffic congestions on road by reducing the requirement of trucks which would
otherwise have to ply. However, the usage of railways in Bangladesh is currently restricted due to small size
of consignments and the additional costs associated with multiple handling points in the value chain. This
has deterred players from opting for rail wagon bookings for their inventory management.
Sitakundo railway station is the nearest rail head which is situated at a distance of 19 km from the proposed
site. It can be accessed via N1 and Sitakundo bazar road. However, it is a small station and currently there
is no cargo handling facility at the Sitakundo railway station which might be a hindrance once the EZ site
becomes operational as rail being a cheaper mode of transport can bring down cost of transportation
significantly for the industries.
Mirsarai railway station is another rail station which is located at a distance of 22 km from the proposed
EZ. It can be accessed via N1. As per discussion with the officials BSMSN, it was understood that the rail
head at Mirsarai is being upgraded to improve the security and cargo handling facilities at the station.
Chattogram railway station is the nearest junction railway station from the proposed EZ, located at a
distance of around 51 km, where cargo-handling facility is present currently. Access to Chattogram junction
railway station takes place through Dhaka-Chattogram highway and time of travel is ~2 hours. Chattogram
Railway station is connected to Inland Container Depot at Dhaka railway station. Currently containers are
transported only on Dhaka and Chattogram rail route, requiring a travel time of around 10 hours. In FY
2017-18, 73,204 number of containers were transported between Dhaka and Chattogram.213 As per
Bangladesh Railway Information Book, major items transported on this route are Cement, Jute, Fertilizer,
Rice, Wheat, Iron & Steel, Sugar cane etc.
213 Bangladesh Railway – Information Book 2018
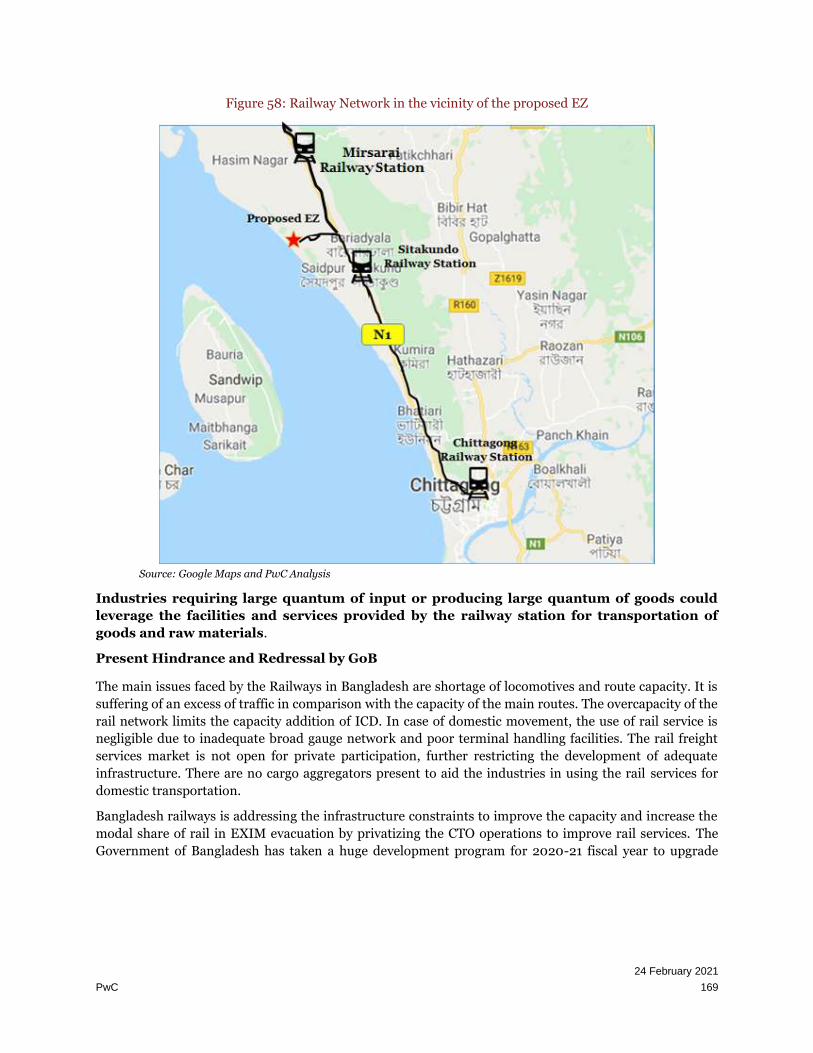
24 February 2021
PwC 169
Figure 58: Railway Network in the vicinity of the proposed EZ
Source: Google Maps and PwC Analysis
Industries requiring large quantum of input or producing large quantum of goods could
leverage the facilities and services provided by the railway station for transportation of
goods and raw materials.
Present Hindrance and Redressal by GoB
The main issues faced by the Railways in Bangladesh are shortage of locomotives and route capacity. It is
suffering of an excess of traffic in comparison with the capacity of the main routes. The overcapacity of the
rail network limits the capacity addition of ICD. In case of domestic movement, the use of rail service is
negligible due to inadequate broad gauge network and poor terminal handling facilities. The rail freight
services market is not open for private participation, further restricting the development of adequate
infrastructure. There are no cargo aggregators present to aid the industries in using the rail services for
domestic transportation.
Bangladesh railways is addressing the infrastructure constraints to improve the capacity and increase the
modal share of rail in EXIM evacuation by privatizing the CTO operations to improve rail services. The
Government of Bangladesh has taken a huge development program for 2020-21 fiscal year to upgrade

24 February 2021
PwC 170
Bangladesh railway network. As per the budget document, construction of 900 kms dual gauge double track
and 1,581 kms new rail track will be completed within this fiscal year.214
Bangladesh railway is set to construct a high-speed railway line from Dhaka to Chattogram, allowing the
travelers to reach their destinations in an hour. Currently detailed design and feasibility study is ongoing
for this project.215
GoB is also working with Indian Government to establish better rail links between the 2 countries. Work
has already started on construction of Agartala-Akhaura railway line and it is expected to get operational
by December 2021. 216These railway lines will give a boost to industries that would come up in the proposed
EZ site by providing faster access to markets and raw material in NE India.
The Bangladesh Railways has started primary assessment for railway connection to BSMSN which is being
developed by BEZA. This railway linkage would be key in shipment of cargo between the Mirsarai region
and Chittagong port.217
Chattogram-Cox’s Bazar railway line is a proposed 120km dual-gauge passenger line from Dohazari village
in south-east Bangladesh to Cox’s Bazar undertaken by the Bangladesh Railway (BR) to improve the
country’s rail connectivity with other Asian countries. It is part of Trans-Asian Railway (TAR) network and
will improve access to Myanmar and beyond. The project will take five years to complete and will enhance
trade and tourism in the southernmost parts of the country.218
On completion, these projects will support easy railway transportation of goods and people from proposed
EZ site to different parts of Bangladesh, as well as to neighboring countries like India and Myanmar.
7.4. Rate of freight for different modes of transport
In order to perform a holistic transport assessment, it is imperative to understand the freight charges
applicable for different modes of transportation. This would help in assessing the most economical mode
of cargo transport for the proposed EZ site and also assist in determining the interventions that could be
taken up by GoB to further improve the transport logistics infrastructure in the vicinity of the Economic
Zone site.
214 https://www.dhakatribune.com/bangladesh/2020/07/04/railways-development-comes-into-focus-in-fy21 215 www.thedailystar.net 216 https://www.indiatoday.in/india/story/india-bangladesh-rail-link-2021-1644781-2020-02-09 217 http://www.beza.gov.bd/news/investment-promotion-seminar-titled-attracting-investment-in-economic-zones-of-bangladesh-held-at-radisson-blu-dhaka/ 218 https://www.railway-technology.com/projects/Chattogram-coxs-bazar-railway-line/
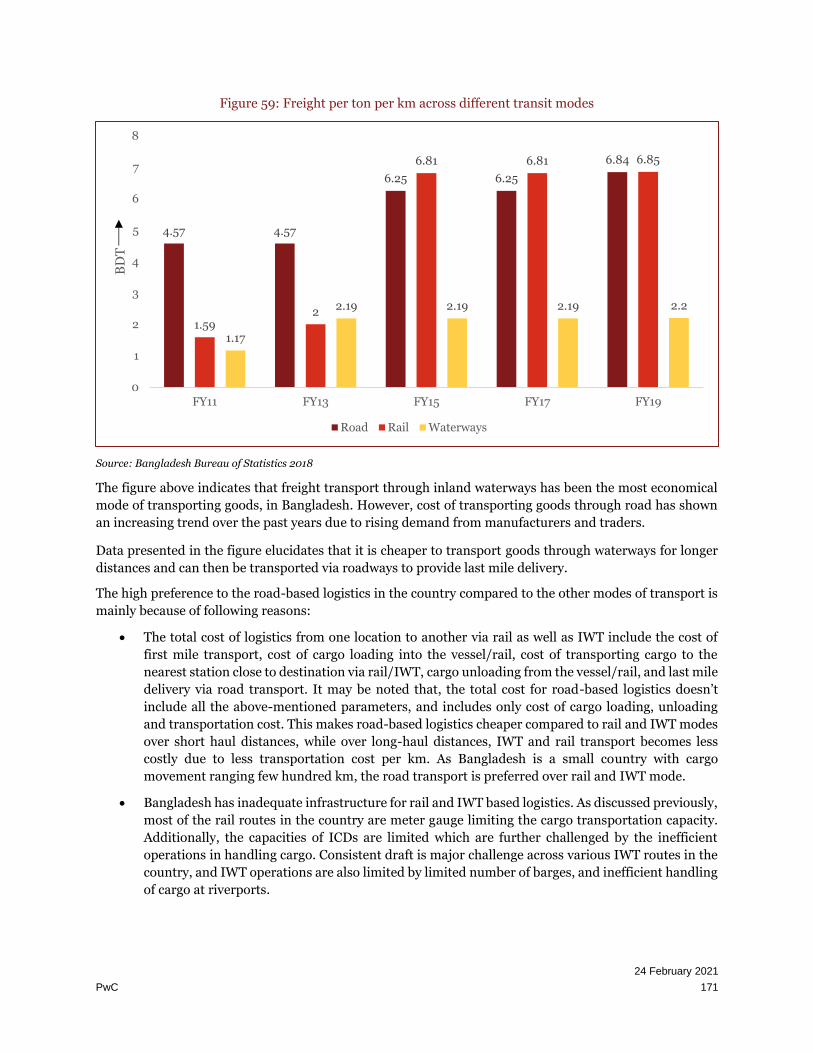
24 February 2021
PwC 171
Figure 59: Freight per ton per km across different transit modes
Source: Bangladesh Bureau of Statistics 2018
The figure above indicates that freight transport through inland waterways has been the most economical
mode of transporting goods, in Bangladesh. However, cost of transporting goods through road has shown
an increasing trend over the past years due to rising demand from manufacturers and traders.
Data presented in the figure elucidates that it is cheaper to transport goods through waterways for longer
distances and can then be transported via roadways to provide last mile delivery.
The high preference to the road-based logistics in the country compared to the other modes of transport is
mainly because of following reasons:
• The total cost of logistics from one location to another via rail as well as IWT include the cost of
first mile transport, cost of cargo loading into the vessel/rail, cost of transporting cargo to the
nearest station close to destination via rail/IWT, cargo unloading from the vessel/rail, and last mile
delivery via road transport. It may be noted that, the total cost for road-based logistics doesn’t
include all the above-mentioned parameters, and includes only cost of cargo loading, unloading
and transportation cost. This makes road-based logistics cheaper compared to rail and IWT modes
over short haul distances, while over long-haul distances, IWT and rail transport becomes less
costly due to less transportation cost per km. As Bangladesh is a small country with cargo
movement ranging few hundred km, the road transport is preferred over rail and IWT mode.
• Bangladesh has inadequate infrastructure for rail and IWT based logistics. As discussed previously,
most of the rail routes in the country are meter gauge limiting the cargo transportation capacity.
Additionally, the capacities of ICDs are limited which are further challenged by the inefficient
operations in handling cargo. Consistent draft is major challenge across various IWT routes in the
country, and IWT operations are also limited by limited number of barges, and inefficient handling
of cargo at riverports.
4.57 4.57
6.25 6.25
6.84
1.592
6.81 6.81 6.85
1.17
2.19 2.19 2.19 2.2
0
1
2
3
4
5
6
7
8
FY11 FY13 FY15 FY17 FY19
BD
T
Road Rail Waterways

24 February 2021
PwC 172
• The rail and IWT transport are further challenged by lack of private sector participation. On the
other side, road-based logistics involves significant participation from private sector, and hence it
is bit more efficient compared to the rail and IWT based transport in Bangladesh. However,
Bangladesh railways is addressing the infrastructure constraints to improve the capacity and
increase the modal share of rail in EXIM evacuation by privatizing the CTO operations.
7.5. Potential Infrastructure Interventions to support
proposed EZ
Proposed EZ site at Sitakundo has an advantage of being located in close proximity to Chattogram. While
the EZ site is well connected through multiple modes of transport (road, rail, air and ports) there could be
a few additional improvements needed to be undertaken by GoB to improve the attractiveness of the EZ site
with respect to transport infrastructure. This could include and not be limited to the following table on the
next page.
The table on the next page captures present and potential future hindrances for smooth movement of
manufactured goods in the region and infrastructure interventions that could be undertaken in order to
make the proposed EZ site attractive to industries looking to set up manufacturing units in the region.
Interventions suggested in the table on the next page have been done after taking into consideration the
infrastructure upgradation currently being planned by different departments of GoB. These interventions
are indicative development activities that could be further studied apart from development activities
already being implemented.

24 February 2021
PwC 173
Table 72: Proposed Infrastructure Interventions
Key Asset Existing Condition Issues Recommendation Cost Implications
Timeframe for Improvement
Jurisdictional Responsibility
Mirsarai port Currently, the average pre-berthing delay at Chittagong port which is nearest port to proposed EZ is ~12 days for bulk cargo and ~5.3 days for container.
Chittagong port is facing issues such as high berthing time, low draft and high loading/unloading time. The planned BSMSN will further increase the traffic at Chattogram.
Construction of green field port at Mirsarai
A detailed traffic estimation assessment is required to be taken to understand the feasibility of the project, and thereby the timelines need to be decided.
Chittagong port Authority
Augmentation of Shah Amanat International Airport
Currently, the airport has manual handling facilities for cargo and provides service to ~1.2 million people
Manual handling of cargo makes the process slow and increase the time lag and logistics cost. Absence of warehouse also hinder the movement of cargo from airport
Augmentation of airport to increase the passenger handling capacity. Warehousing facility and automation for cargo handling and movement is required.
A detailed traffic estimation assessment is required to be taken to understand the feasibility of the project, and thereby the timelines need to be decided.
Civil Aviation Authority of Bangladesh
Capacity expansion for Dhaka Chattogram Highway
Currently, the route is mix of two lane and four lane routes
Given the strategic role the route plays in the country’s EXIM related logistics, the route capacity is tending to get limited in certain stretches causing congestion. Given the rise in cargo and passenger traffic on the route in future,
Capacity expansion to six lanes by 2025.
A detailed traffic estimation assessment is required to be taken to understand the feasibility of the project, and thereby the locations for capacity expansions as well as timelines need to be decided.
Roads and Highways Department
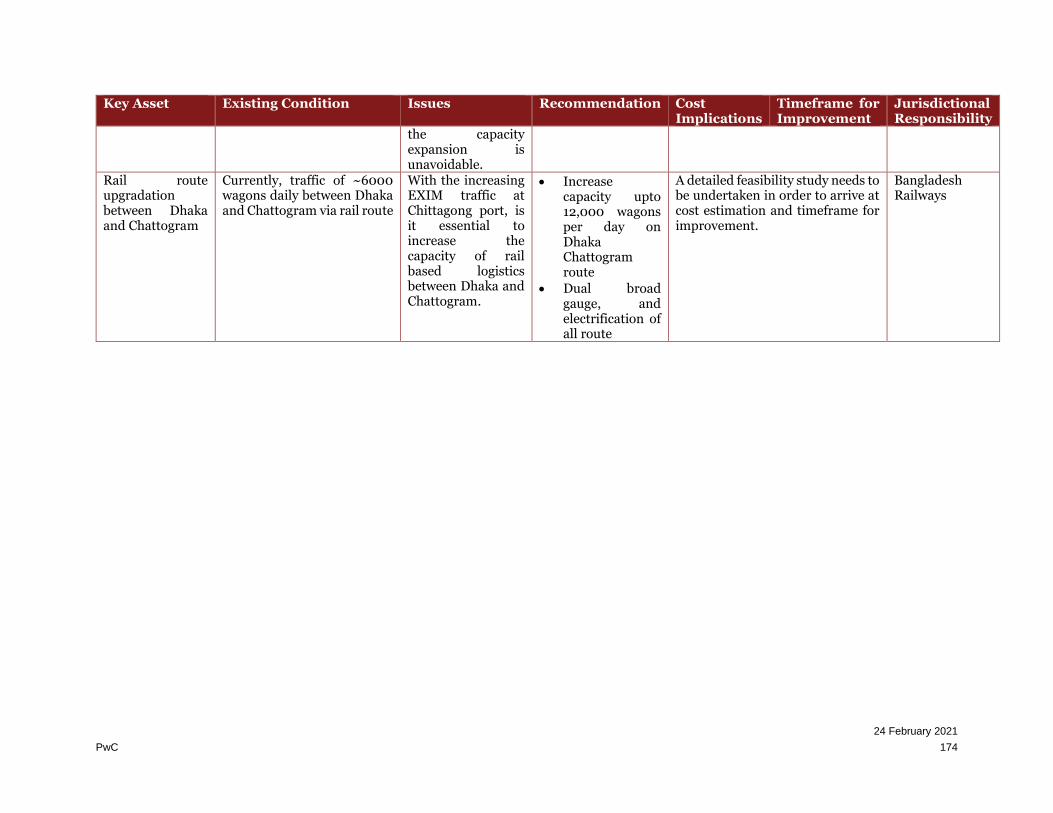
24 February 2021
PwC 174
Key Asset Existing Condition Issues Recommendation Cost Implications
Timeframe for Improvement
Jurisdictional Responsibility
the capacity expansion is unavoidable.
Rail route upgradation between Dhaka and Chattogram
Currently, traffic of ~6000 wagons daily between Dhaka and Chattogram via rail route
With the increasing EXIM traffic at Chittagong port, is it essential to increase the capacity of rail based logistics between Dhaka and Chattogram.
• Increase capacity upto 12,000 wagons per day on Dhaka Chattogram route
• Dual broad gauge, and electrification of all route
A detailed feasibility study needs to be undertaken in order to arrive at cost estimation and timeframe for improvement.
Bangladesh Railways

24 February 2021
PwC 175
8. Master Planning The area for the proposed EZ falls under the precinct I of the BSMSN for which master plan has been approved
by BEZA’s Executive board. The BSMSN Master Plan sets out: i) land uses, ii) access and transport networks, iii)
precinct boundaries and characteristics, iv) zoning and permitted uses, v) development guidelines, and iv)
environmental and green resilient rules to follow when implementing the zone
As per the master plan BSMSN site has been divided into 12 separate precincts, which have their own land uses.
Precinct I is proposed to house the larger industries, which tend to create higher pollution, consume greater
amounts of energy and require additional utility systems to mitigate their waste and water. Precinct I will be
specially designed for these types of industries and will utilize modern/ resilient technology to mitigate impacts.
The figure below shows the boundary of the proposed EZ and precinct I of the BSMSN.
As per the master plan Precinct I will have access to/from the Chattogram Highway via public, arterial road
networks within BSMSN, which are 80-100m in width to support large trucks and heavy cargo loads and
movements. Master plan for the proposed EZ must use the same design rules, regulations and
standards as BSMSN. Sitakundo EZ should not be developed until the BSMSN Precinct I is 70%
constructed.
Figure 60: Location map of Sitakundo

24 February 2021
PwC 176
9. Social Review
9.1. Purpose and Objective
As per the Resettlement and Social Management Framework (RSMF), which has been adopted in order to comply
with the social safeguards requirements of the World Bank’s operational policy on Involuntary Resettlement (OP
4.12), the proposed project is required to conduct a Social Impact Assessment Study of the impact area. The policy
requires that all unavoidable adverse impacts be mitigated with appropriate measures to enhance, or at least to
preserve, the current living standards of those who would be affected by any subproject under PSDSP.
9.2. Methodology of Social Review
Social review has been undertaken to ensure that potential social impacts/concerns are recognized at an early
stage of project preparation, so that these concerns can be effectively addressed during subsequent stages.
This social review is uses primary information gained during due diligence, primary information gained during
stakeholder consultations and interactions, and secondary information extracted from the latest census and
district statistics.
The review consists of:
• A Socio-economic profile that gives the main characteristics of the population, a sense of the socio-
economic conditions in which people live through data on housing and utilities and inventories of social
infrastructure, and the employment activities and patterns of the residents in the area.
• Calculations of the cost of land that needs to be acquired and the requirements of the social impact
assessment (SIA) and resettlement action plan (RAP).
• Overview of Social and Legal policies applicable both National and World Bank’s.
• Salient points from engagement and interactions with both institutional and community level
stakeholders. In the case of this study, stakeholder consultations are of even greater importance given
that a survey of the PAPs hasn’t been undertaken.
9.3. Socio-Economic Environment
The Sitakunda EZ is located at 22°68'16.18"N 91°56'19.66"E in Sitakundo Upazila of Chattogram District. It
covers 2368.57 acres and is surrounded by plantation of Forest Department to the North and South, BWDB
embankment road to the East and Bay of Bengal to the West. In terms of activities, the N1 highway, settlements,
agricultural lands and mass development lie towards the east, planted forest land lies towards the North and
South, and sea beach and the sea lie towards the west.
The key parameters that are required to establish a baseline socio-economic profile of population within the
project’s area of influence include gender, ethnicity, social structure, employment patterns, sources of income,
local tenure and property rights arrangements, common property resources (CPR) use of community and natural
resources. These have been provided at the Upazila level.
9.3.1. Demographics & Housing
Sitakundo Upazila is one of the fourteen Upazilas in Chittagong district. As per Housing and Population Census
2011, Chittagong district had an overall population of 76,16,352. As per Housing and Population Census 2011,
Sitakundo Upazila had an overall population of 3,87,832 (~ 5.09% of District’s population). The Upazila has 10
unions, 9 wards, 69 mauzas and 59 villages. The Upazila has a population density of 801 per sq. km.
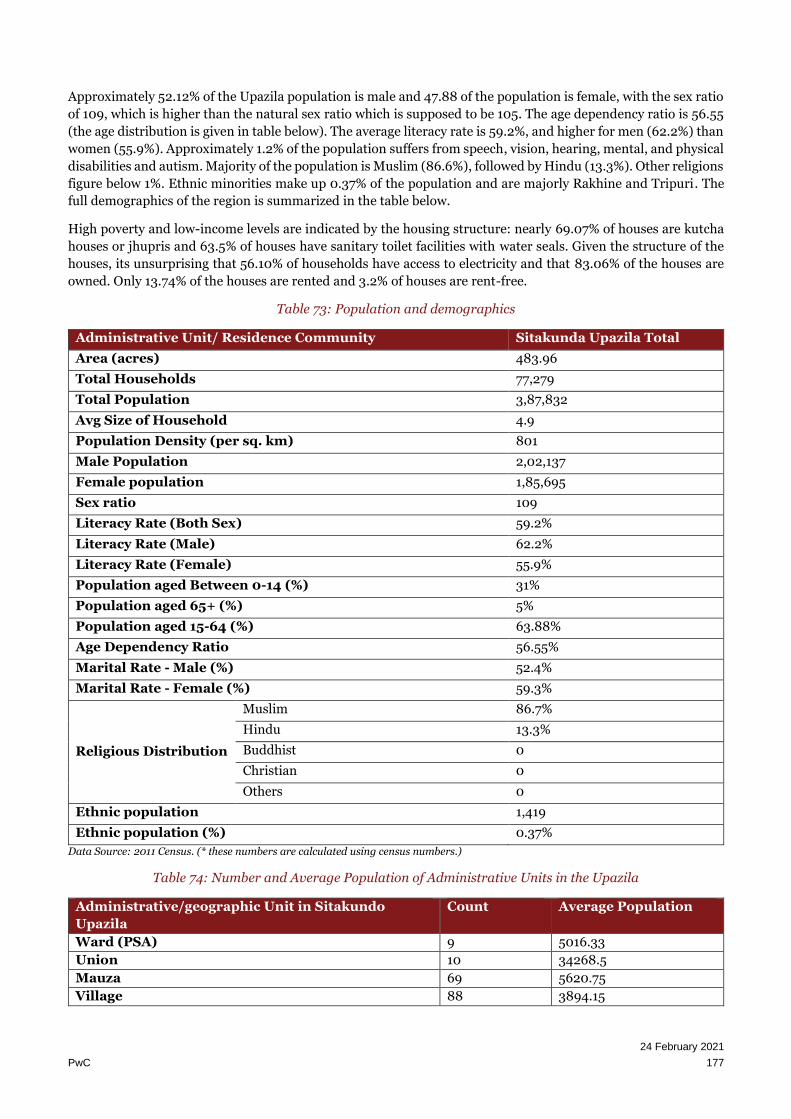
24 February 2021
PwC 177
Approximately 52.12% of the Upazila population is male and 47.88 of the population is female, with the sex ratio
of 109, which is higher than the natural sex ratio which is supposed to be 105. The age dependency ratio is 56.55
(the age distribution is given in table below). The average literacy rate is 59.2%, and higher for men (62.2%) than
women (55.9%). Approximately 1.2% of the population suffers from speech, vision, hearing, mental, and physical
disabilities and autism. Majority of the population is Muslim (86.6%), followed by Hindu (13.3%). Other religions
figure below 1%. Ethnic minorities make up 0.37% of the population and are majorly Rakhine and Tripuri. The
full demographics of the region is summarized in the table below.
High poverty and low-income levels are indicated by the housing structure: nearly 69.07% of houses are kutcha
houses or jhupris and 63.5% of houses have sanitary toilet facilities with water seals. Given the structure of the
houses, its unsurprising that 56.10% of households have access to electricity and that 83.06% of the houses are
owned. Only 13.74% of the houses are rented and 3.2% of houses are rent-free.
Table 73: Population and demographics
Administrative Unit/ Residence Community Sitakunda Upazila Total
Area (acres) 483.96
Total Households 77,279
Total Population 3,87,832
Avg Size of Household 4.9
Population Density (per sq. km) 801
Male Population 2,02,137
Female population 1,85,695
Sex ratio 109
Literacy Rate (Both Sex) 59.2%
Literacy Rate (Male) 62.2%
Literacy Rate (Female) 55.9%
Population aged Between 0-14 (%) 31%
Population aged 65+ (%) 5%
Population aged 15-64 (%) 63.88%
Age Dependency Ratio 56.55%
Marital Rate - Male (%) 52.4%
Marital Rate - Female (%) 59.3%
Religious Distribution
Muslim 86.7%
Hindu 13.3%
Buddhist 0
Christian 0
Others 0
Ethnic population 1,419
Ethnic population (%) 0.37%
Data Source: 2011 Census. (* these numbers are calculated using census numbers.)
Table 74: Number and Average Population of Administrative Units in the Upazila
Administrative/geographic Unit in Sitakundo
Upazila
Count Average Population
Ward (PSA) 9 5016.33
Union 10 34268.5
Mauza 69 5620.75
Village 88 3894.15

24 February 2021
PwC 178
Data Source: 2011 Census
9.3.2. Livelihood and Economy
The economy of Sitakundo is dominated by the service sector with 45.55% of the workforce employed by the
sector largely due proximity to Chittagong City, the second largest city in Bangladesh. Agriculture sector is the
second largest employment generator in Sitakundo with primary crops being paddy, mug (lentil) and
sugarcane.219. 37.56% of the working age population is employed and only 0.75% of the employable population is
looking for work. The employment status and the field of employment as a percentage of the employable
population is given to the below.
Table 75: Employment status of the Shibaloy Upazila
Employment Status Percentage
Employed 37.56
Looking for a Job 0.75
Household Work 39.88
Do not work 21.81
Field of Employment
Agriculture 29.85
Industry 24.60
Service 45.55 Data Source: 2011 Census
As the data shows, only 10% of the employed group are women; 98% of those who do household work are women.
Roughly an equal percentage of employable men and women don’t work. Of the employed women, nearly half of
the women are employed in service. Overall, a greater percentage of women work on service and industry while
a greater percentage of men work in agriculture.
Table 76: Employment Status: Gender Disaggregated
Field of Employment (Gender Disaggregated) Gender Percentage
Agriculture Male 95.67
Female 4.33
Industry Male 85.95
Female 14.05
Service Male 88.47
Female 11.53
Employment Status (Gender Disaggregated)
Employed Male 90.00
Female 10.00
Looking for a Job Male 77.43
Female 22.57
Household Work Male 1.93
Female 98.07
Do not work
Male 41.90
Female 58.10
Data Source: 2011 Census
219 District Statistics 2011
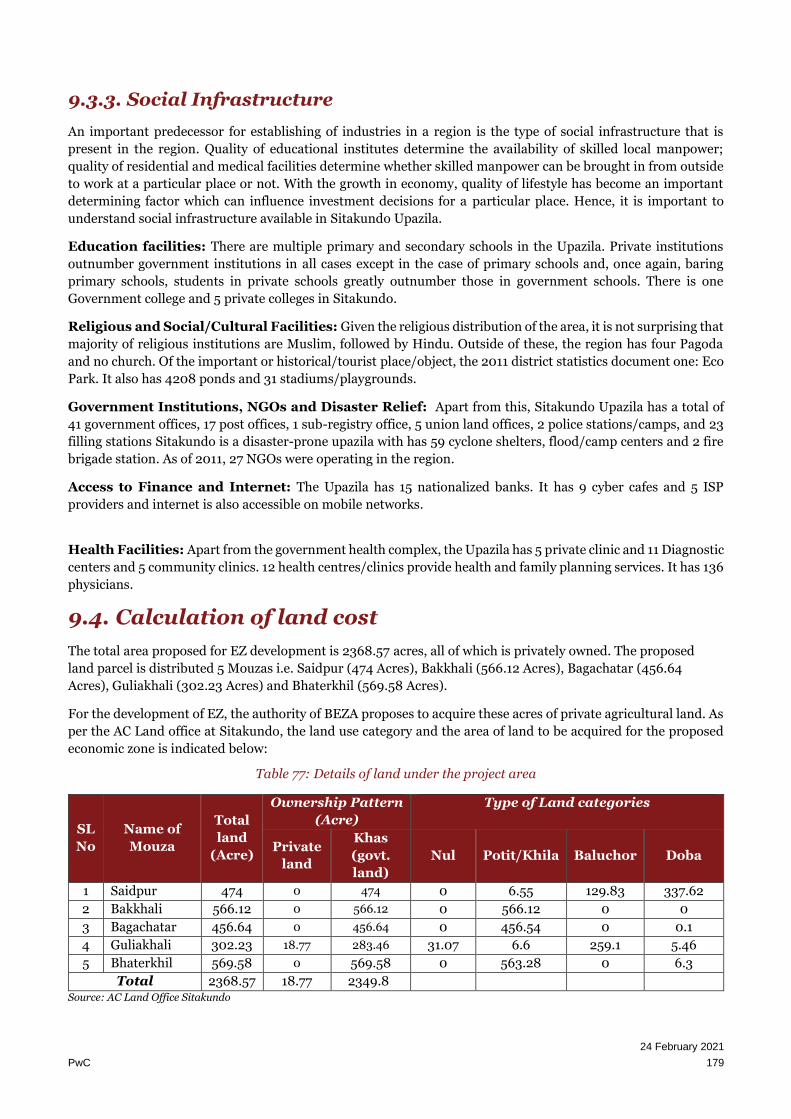
24 February 2021
PwC 179
9.3.3. Social Infrastructure
An important predecessor for establishing of industries in a region is the type of social infrastructure that is
present in the region. Quality of educational institutes determine the availability of skilled local manpower;
quality of residential and medical facilities determine whether skilled manpower can be brought in from outside
to work at a particular place or not. With the growth in economy, quality of lifestyle has become an important
determining factor which can influence investment decisions for a particular place. Hence, it is important to
understand social infrastructure available in Sitakundo Upazila.
Education facilities: There are multiple primary and secondary schools in the Upazila. Private institutions
outnumber government institutions in all cases except in the case of primary schools and, once again, baring
primary schools, students in private schools greatly outnumber those in government schools. There is one
Government college and 5 private colleges in Sitakundo.
Religious and Social/Cultural Facilities: Given the religious distribution of the area, it is not surprising that
majority of religious institutions are Muslim, followed by Hindu. Outside of these, the region has four Pagoda
and no church. Of the important or historical/tourist place/object, the 2011 district statistics document one: Eco
Park. It also has 4208 ponds and 31 stadiums/playgrounds.
Government Institutions, NGOs and Disaster Relief: Apart from this, Sitakundo Upazila has a total of
41 government offices, 17 post offices, 1 sub-registry office, 5 union land offices, 2 police stations/camps, and 23
filling stations Sitakundo is a disaster-prone upazila with has 59 cyclone shelters, flood/camp centers and 2 fire
brigade station. As of 2011, 27 NGOs were operating in the region.
Access to Finance and Internet: The Upazila has 15 nationalized banks. It has 9 cyber cafes and 5 ISP
providers and internet is also accessible on mobile networks.
Health Facilities: Apart from the government health complex, the Upazila has 5 private clinic and 11 Diagnostic
centers and 5 community clinics. 12 health centres/clinics provide health and family planning services. It has 136
physicians.
9.4. Calculation of land cost
The total area proposed for EZ development is 2368.57 acres, all of which is privately owned. The proposed
land parcel is distributed 5 Mouzas i.e. Saidpur (474 Acres), Bakkhali (566.12 Acres), Bagachatar (456.64
Acres), Guliakhali (302.23 Acres) and Bhaterkhil (569.58 Acres).
For the development of EZ, the authority of BEZA proposes to acquire these acres of private agricultural land. As
per the AC Land office at Sitakundo, the land use category and the area of land to be acquired for the proposed
economic zone is indicated below:
Table 77: Details of land under the project area
SL
No
Name of
Mouza
Total
land
(Acre)
Ownership Pattern
(Acre)
Type of Land categories
Private
land
Khas
(govt.
land)
Nul Potit/Khila Baluchor Doba
1 Saidpur 474 0 474 0 6.55 129.83 337.62
2 Bakkhali 566.12 0 566.12 0 566.12 0 0
3 Bagachatar 456.64 0 456.64 0 456.54 0 0.1
4 Guliakhali 302.23 18.77 283.46 31.07 6.6 259.1 5.46
5 Bhaterkhil 569.58 0 569.58 0 563.28 0 6.3
Total 2368.57 18.77 2349.8 Source: AC Land Office Sitakundo

24 February 2021
PwC 180
In accordance to the current legislations governing land acquisition of Bangladesh is the Acquisition and
Requisition of Immovable Property Act 2017 (hereinafter, “the Act”) which replaces the old 1982 Ordinance on
Acquisition and Requisition of Immovable Property and BEZA’s RSMF, cost of land was taken as 3 times the cost
obtained from AC land office for all categories.
Table 78: Mouza wise per acre land price (million BDT)
SL No Name of Mouza Cost of different categories of land per acre (million BDT)
Nul Potit/Baluchor/Khila Doba/Nodi/Khal
1 Saidpur 3.58 1.30 1.30
2 Bakkhali 4.42 3.21 1.14
3 Bagachatar 2.79 0.82 1.48
4 Guliakhali 3.81 1.62 1.22
5 Bhaterkhil 5.04 1.45 1.50
6 Boro Boali 1.92 2.19
Source: Sub-Registry office, Sitakundo, Chattogram (2017-2018)
Based on the information received from Sub-Registry office, Sitakundo, Chattogram, the price of the proposed
land as calculated has been furnished in below table. The total cost of the land parcel is valued 11,661.29 million
BDT. Pertinent to state that the proposed site falls within the extent of proposed BSMSN area. The cost for land
will be taken into account within the resettlement and rehabilitation cost for entire BSMSN area.
Table 79: Cost of Land
SL No Name of Mouza Total land
(Acre)
Average Mouza rate
including 200%
premium/CUL (million
BDT)
Remarks
1 Saidpur 474 970.25
Considered only
affected land
category
2 Bakkhali 566.12 5459.04
3 Bagachatar 456.64 1119.68
4 Guliakhali 302.23 1652.61
5 Bhaterkhil 569.58 2459.72
Total 2368.57 11661.29
Generally, two steps are followed to determine replacement value for the land acquired. The first one is the
‘Conventional’ rule set by the law often called DC payments or Cash compensation under law (CUL). Second, the
project has provision for ‘top up’ payments to match replacement value for land acquired in the case of difference
between DC valuation and current market price (CMP).
A detailed Social Impact Assessment (SIA) study and Resettlement Action Plan (PAP) should be carried out in
accordance to World Bank safeguard standards and Government of Bangladesh's social and resettlement rules.
The proposed site boundary superimposed on Mouza Map and affected details of Plots are furnished in
Annexure 3 and 4 in this report.
24 February 2021
PwC 181
9.5. Requirements for SIA and RAP
9.5.1. Social Impact Assessment Requirement
The ideal situation for any project would be that it does not have any adverse impact on the population around.
In practical, that is not always possible. The proposed EZ at Sitakundo Upazila under Chattogram district will
require acquisition of about 18.77 acres of private land (total Land requirement for the project is 2368.57 acres).
The private 18.77 acres of land is owned by 9 PAFs (Est. 44 PAPs). Based on site visits and stakeholder
consultations, it can be surmised that almost all the proposed area is government land and some of the land is
used for agricultural activity (mostly pisciculture and single crop cultivation). And the land used for
pisciculture/shrimp cultivation may be on government land.
A detailed social impact assessment (SIA) should be carried out to assess the standard of living of this population,
and hence arrive at an estimate of the losses that they will have to face in terms of loss of livelihood opportunities.
A resettlement Action Plan will be required to understand the entitlements of the PAFs as well as the mitigation
measures for the impacts borne by them due to the project. The Project Affected Families (PAFs - losing land and
loss of income) are estimated to be more than 300 in numbers, as surmised through consultations.
The SIA report may be used further for putting together a resettlement action plan to diminish the adverse
impacts to the affected population, as well as provide compensation as required. The SIA report can also be used
to understand the existing social fabric amongst the affected population, and this can deepen the understanding
of what an R&R plan will require.
Land Acquisition & Impact Mitigation Objectives
The principles and guidelines proposed in the RSMF are to avoid or minimize adverse impacts on private
landowners and khas/public land users; mitigate the adverse impacts that are unavoidable; and assist the project
affected persons (PAPs) to improve, or at least to restore, their living standards and income earning and
production capacity to the pre-acquisition levels. To achieve these objectives, BEZA will consistently adhere to
the following guidelines:
• Avoid or minimize private land acquisition;
• Avoid or minimize displacement from private homesteads;
• Avoid or minimize displacement of persons and households who may have been using khas/public
lands for residential, commercial and other purposes; and
• Mitigate the adverse impacts associated with private land acquisition; displacement from
khas/public lands; use of common property resources; and temporary displacement/closure of
business and livelihood activities during implementation of the civil works.
RSMF & Impact Mitigation Plans
The principles, policies and guidelines as proposed in this RSMF will apply, irrespective of PSDSP components,
to all EZs and similar sub-projects, and their off-site support infrastructures that will involve private land
acquisition and use of khas/public lands.
9.5.2. Requirement of RAP
A detailed Social Impact Assessment and formulation of a Resettlement Action Plan will be required prior to the
acquisition of the said land parcel. The proposed land parcel for EZ (2368.57 Acres) predominantly consists of
government land including forest plantations and some private agricultural land (18.77 Acres). The project will
cause substantial economic displacement considering the land parcel directly or indirectly generates income for
the nearby communities. Economic displaced persons include the agricultural land losers, income losers from

24 February 2021
PwC 182
squatter pisciculture farms and loss of income of the tourist oriented small businesses due to reduced tourist
traffic once the Sitakundo beach is acquired by the project.
It can be surmised from site visits, consultations and land records that the total number of PAFs will be more
than 300 and hence PAPs220 will be more than 1200. This required that Resettlement Action Plan be formulated
to mitigate the impacts of the project.
In cases of acquisition, a part of the compensation for lands and other affected assets built or grown thereon will
be assessed and paid to the title holding PAPs by the Deputy Commissioners (DCs), the heads of the Acquiring
Bodies. If this payment, ‘compensation under-law’ (CUL), is found smaller than their replacement costs and/or
market prices, BEZA will directly pay the difference or ‘top-up’ to make up for the shortfall.
With or without acquisition compensations/assistance due to all other PAPs, such as non-titled persons, business
owners and employees and those, who are not covered by the acquisition ordinance, but eligible according to this
RSMF, will also be directly paid by BEZA.
Top-up Determination and Payment: Where an owner loses lands and other assets in more than one mouza or
land administration unit, the person will be counted once, and his/her top-up will be paid together. The amount
of top-up due to the affected person will be determined by comparing the total amount of CUL paid by the DCs
for lands and other assets acquired in all mouzas with the total replacement costs and/or market prices thereof.
Compensation/entitlement due to the PAPs, including those who are not covered by the acquisition ordinance,
but eligible according to this RSMF, will be paid in full before they are evicted from the acquired private and
khas/other public lands.
Based on the principles proposed for impact mitigation, the following tables define the specific entitlements for
different types of losses, entitled person, and the institutional responsibility to implement them, in a tentative
manner.
Table 80: Loss of Lands (Agricultural, Homestead, Commercial & Others)
Ownership
Type Entitled Person Entitlement Responsibility
Private Legal Owners, as
determined by DCs,
or by courts in cases
of legal disputes
Compensation-under-law (CUL) or
replacement costs, whichever is greater.
If applicable
• Top-up equal to the difference between
CUL and replacement costs.
• Transition allowance (TA) for income
loss (see Loss Category 5).
CUL paid by DC
Top-up & TA paid by
Project
Khas & Other
Public Lands
Under Lease.
Leaseholders
• Contractual obligations with the public
agencies, as determined by DCs, and /
or Contractual obligations with other
GOB agencies.
Paid by DC and/or
Project
Households/
residential
structures on
khas & other
public lands
Vulnerable non-Title
persons
• Relocation assistance, including
developed plots in their own or other
public lands, to be arranged by BEZA.
• Provision of water supply & sanitation
facilities.
By Project
Vested Non-
Resident
Current
Owners/Users
As those stipulated above for trees and
fruits on trees, on private lands.
By Project
220 Average Household size of the District is 4.21
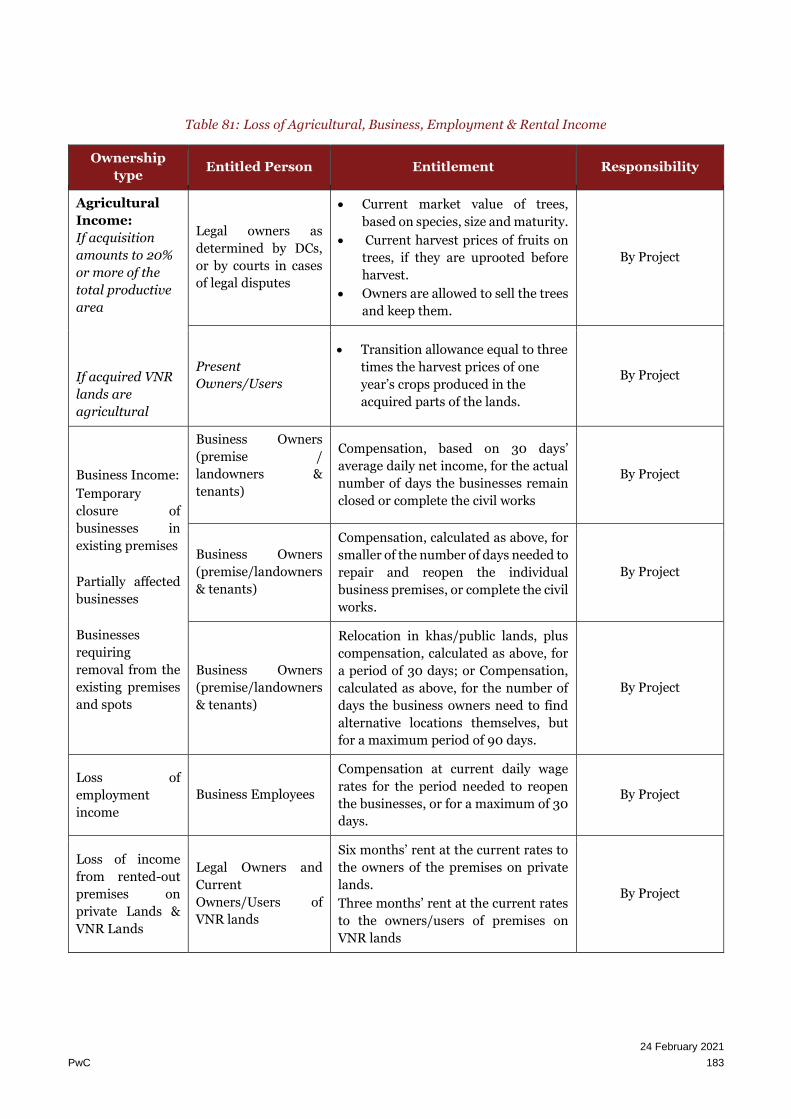
24 February 2021
PwC 183
Table 81: Loss of Agricultural, Business, Employment & Rental Income
Ownership
type Entitled Person Entitlement Responsibility
Agricultural
Income:
If acquisition
amounts to 20%
or more of the
total productive
area
If acquired VNR
lands are
agricultural
Legal owners as
determined by DCs,
or by courts in cases
of legal disputes
• Current market value of trees,
based on species, size and maturity.
• Current harvest prices of fruits on
trees, if they are uprooted before
harvest.
• Owners are allowed to sell the trees
and keep them.
By Project
Present
Owners/Users
• Transition allowance equal to three
times the harvest prices of one
year’s crops produced in the
acquired parts of the lands.
By Project
Business Income:
• Temporary
closure of
businesses in
existing premises
• Partially affected
businesses
• Businesses
requiring
removal from the
existing premises
and spots
Business Owners
(premise /
landowners &
tenants)
• Compensation, based on 30 days’
average daily net income, for the actual
number of days the businesses remain
closed or complete the civil works
By Project
Business Owners
(premise/landowners
& tenants)
• Compensation, calculated as above, for
smaller of the number of days needed to
repair and reopen the individual
business premises, or complete the civil
works.
By Project
Business Owners
(premise/landowners
& tenants)
• Relocation in khas/public lands, plus
compensation, calculated as above, for
a period of 30 days; or Compensation,
calculated as above, for the number of
days the business owners need to find
alternative locations themselves, but
for a maximum period of 90 days.
By Project
• Loss of
employment
income
Business Employees
• Compensation at current daily wage
rates for the period needed to reopen
the businesses, or for a maximum of 30
days.
By Project
• Loss of income
from rented-out
premises on
private Lands &
VNR Lands
Legal Owners and
Current
Owners/Users of
VNR lands
• Six months’ rent at the current rates to
the owners of the premises on private
lands.
• Three months’ rent at the current rates
to the owners/users of premises on
VNR lands
By Project
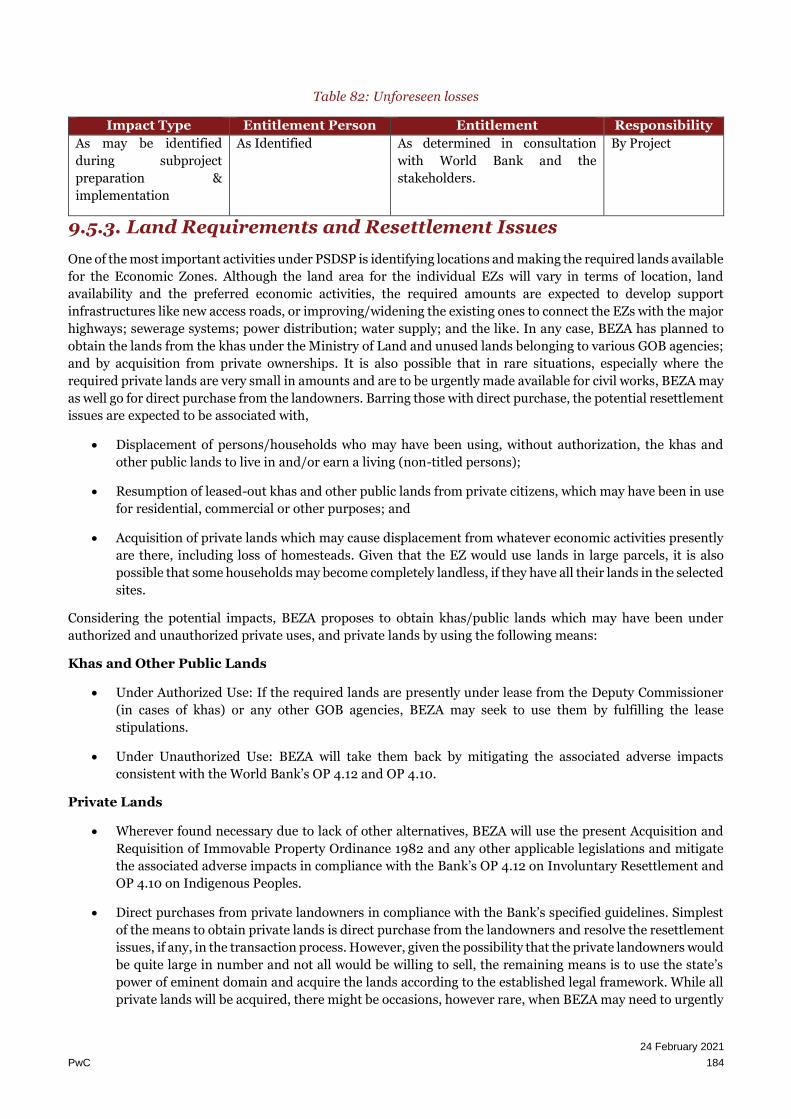
24 February 2021
PwC 184
Table 82: Unforeseen losses
Impact Type Entitlement Person Entitlement Responsibility
As may be identified
during subproject
preparation &
implementation
As Identified
As determined in consultation
with World Bank and the
stakeholders.
By Project
9.5.3. Land Requirements and Resettlement Issues
One of the most important activities under PSDSP is identifying locations and making the required lands available
for the Economic Zones. Although the land area for the individual EZs will vary in terms of location, land
availability and the preferred economic activities, the required amounts are expected to develop support
infrastructures like new access roads, or improving/widening the existing ones to connect the EZs with the major
highways; sewerage systems; power distribution; water supply; and the like. In any case, BEZA has planned to
obtain the lands from the khas under the Ministry of Land and unused lands belonging to various GOB agencies;
and by acquisition from private ownerships. It is also possible that in rare situations, especially where the
required private lands are very small in amounts and are to be urgently made available for civil works, BEZA may
as well go for direct purchase from the landowners. Barring those with direct purchase, the potential resettlement
issues are expected to be associated with,
• Displacement of persons/households who may have been using, without authorization, the khas and
other public lands to live in and/or earn a living (non-titled persons);
• Resumption of leased-out khas and other public lands from private citizens, which may have been in use
for residential, commercial or other purposes; and
• Acquisition of private lands which may cause displacement from whatever economic activities presently
are there, including loss of homesteads. Given that the EZ would use lands in large parcels, it is also
possible that some households may become completely landless, if they have all their lands in the selected
sites.
Considering the potential impacts, BEZA proposes to obtain khas/public lands which may have been under
authorized and unauthorized private uses, and private lands by using the following means:
Khas and Other Public Lands
• Under Authorized Use: If the required lands are presently under lease from the Deputy Commissioner
(in cases of khas) or any other GOB agencies, BEZA may seek to use them by fulfilling the lease
stipulations.
• Under Unauthorized Use: BEZA will take them back by mitigating the associated adverse impacts
consistent with the World Bank’s OP 4.12 and OP 4.10.
Private Lands
• Wherever found necessary due to lack of other alternatives, BEZA will use the present Acquisition and
Requisition of Immovable Property Ordinance 1982 and any other applicable legislations and mitigate
the associated adverse impacts in compliance with the Bank’s OP 4.12 on Involuntary Resettlement and
OP 4.10 on Indigenous Peoples.
• Direct purchases from private landowners in compliance with the Bank’s specified guidelines. Simplest
of the means to obtain private lands is direct purchase from the landowners and resolve the resettlement
issues, if any, in the transaction process. However, given the possibility that the private landowners would
be quite large in number and not all would be willing to sell, the remaining means is to use the state’s
power of eminent domain and acquire the lands according to the established legal framework. While all
private lands will be acquired, there might be occasions, however rare, when BEZA may need to urgently

24 February 2021
PwC 185
use small amounts of private lands that may not have been included in the LAPs submitted to the
Acquiring Body and the legal acquisition process is already well underway or completed. In situations
like this and considering the lengthy acquisition process, BEZA may decide to purchase the lands directly
from the owners in accord with the following guidelines:
• All direct purchases must be on a 'willing buyer-seller basis. That is, the landowners cannot be forced or
intimidated directly or indirectly to sell and at prices that are lower than the current market rates for
similar lands.
• Prices for lands and other assets created or grown on them are to be negotiated and paid transparently
in the presence of community leaders and organizations, NGOs, and others who are respected by the local
people for their fairness and integrity. BEZA will always try to avoid dealing with middle-men (dalal) and
remain fair and transparent by having the communities and individuals, as suggested, participate in the
transaction process.
• Documentations consisting of minutes of price negotiations indicating location, amount, and any assets
built or grown (structures, trees, etc.); names, addresses and telephone numbers of persons participated
in the negotiations; and the purchase records are required to be submitted to the Bank for its review and
clearance.
9.6. Overview of Social Legal and Policy Requirements
The current legislations governing land acquisition for Bangladesh is the Acquisition and Requisition of
Immovable Property Act 2017 (hereinafter, “the Act”) which replaces the old 1982 Ordinance on Acquisition and
Requisition of Immovable Property. The Act provides safeguards for landowners and has provisions for payment
of ‘fair value’ for the property acquired. The act also made provisions for payment of crop compensation to tenant
cultivators. However, it does not cover project-affected persons without titles or ownership record and does not
ensure their replacement value of the property acquired. It does not permit the affected persons to take the
salvageable materials for which compensation has been paid by the DC. It has no provision of resettlement
assistance and transitional allowances for restoration of livelihoods of the non-titled affected persons.
In all cases, the Deputy Commissioner (DC) determines (i) market value of acquired assets on the date of notice
of acquisition (based on the registered value of similar property bought and/or sold in the area over the preceding
12 months); and (ii) 200% premium on the assessed value (other than crops) due to compulsory acquisition. The
DC payments “awarded” to owners is called cash compensation under law (CCL). The market value determined
by DC is invariably less than the real market price as owners customarily report undervalued land transaction
prices in order to pay lower stamp duty and registration fees. The premium paid by DC has been increased from
50% to 200% of market value for government land acquisition and to 300% in case of private land acquisition in
the new act. However, even so in most cases the compensation remains less than the real market price or
replacement value (RV).
World Bank’s policy on involuntary settlement OP 4.12 covers direct economic and social impact caused by
(a) the involuntary taking of land resulting in (i) relocation or loss of shelter; (ii) loss of assets or access
to assets; or (iii) loss of income sources or means of livelihood, whether the affected persons must move
to another location; or
(b) the involuntary restriction of access to legally designated parks and protected areas resulting in
adverse impacts on the livelihoods of the displaced persons
Table below shows the comparison of GOB’s Ordinance and WB policy gaps between WB OP 4.12 and GOB 2017
Act.
Gaps between WB OP 4.12 and GOB 2017
Act. Recommendation to bridge the gaps
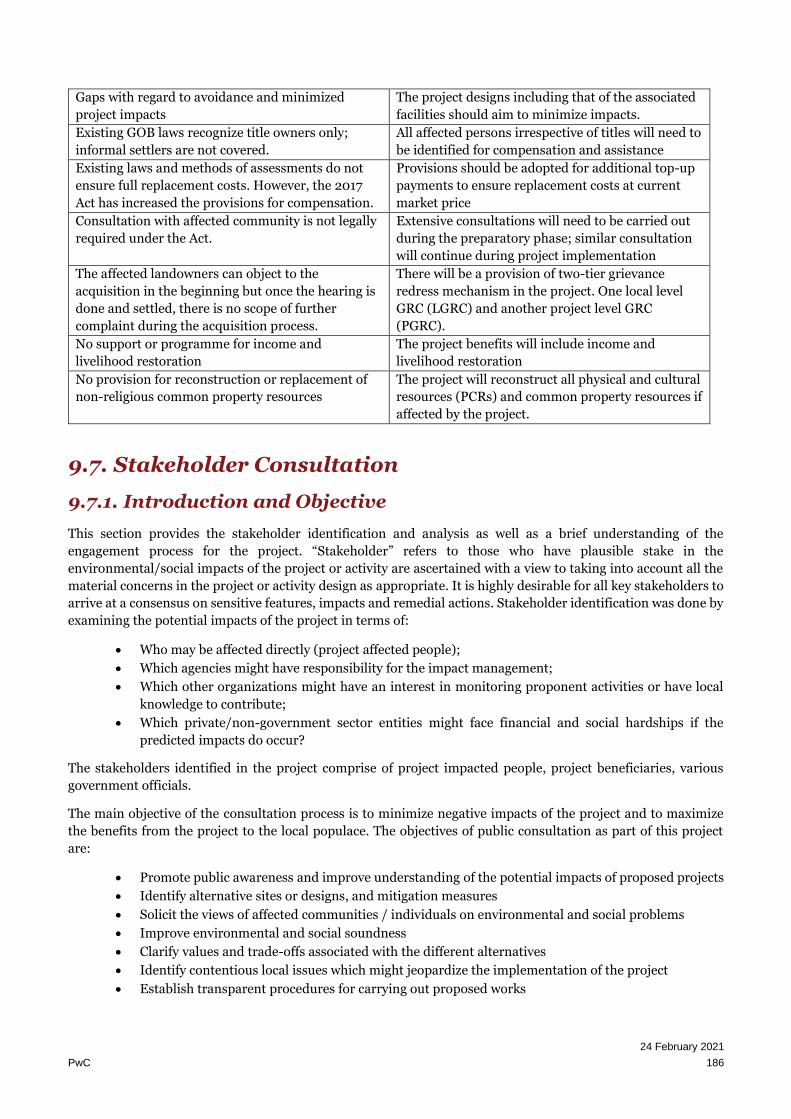
24 February 2021
PwC 186
Gaps with regard to avoidance and minimized
project impacts
The project designs including that of the associated
facilities should aim to minimize impacts.
Existing GOB laws recognize title owners only;
informal settlers are not covered.
All affected persons irrespective of titles will need to
be identified for compensation and assistance
Existing laws and methods of assessments do not
ensure full replacement costs. However, the 2017
Act has increased the provisions for compensation.
Provisions should be adopted for additional top-up
payments to ensure replacement costs at current
market price
Consultation with affected community is not legally
required under the Act.
Extensive consultations will need to be carried out
during the preparatory phase; similar consultation
will continue during project implementation
The affected landowners can object to the
acquisition in the beginning but once the hearing is
done and settled, there is no scope of further
complaint during the acquisition process.
There will be a provision of two-tier grievance
redress mechanism in the project. One local level
GRC (LGRC) and another project level GRC
(PGRC).
No support or programme for income and
livelihood restoration
The project benefits will include income and
livelihood restoration
No provision for reconstruction or replacement of
non-religious common property resources
The project will reconstruct all physical and cultural
resources (PCRs) and common property resources if
affected by the project.
9.7. Stakeholder Consultation
9.7.1. Introduction and Objective
This section provides the stakeholder identification and analysis as well as a brief understanding of the
engagement process for the project. “Stakeholder” refers to those who have plausible stake in the
environmental/social impacts of the project or activity are ascertained with a view to taking into account all the
material concerns in the project or activity design as appropriate. It is highly desirable for all key stakeholders to
arrive at a consensus on sensitive features, impacts and remedial actions. Stakeholder identification was done by
examining the potential impacts of the project in terms of:
• Who may be affected directly (project affected people);
• Which agencies might have responsibility for the impact management;
• Which other organizations might have an interest in monitoring proponent activities or have local
knowledge to contribute;
• Which private/non-government sector entities might face financial and social hardships if the
predicted impacts do occur?
The stakeholders identified in the project comprise of project impacted people, project beneficiaries, various
government officials.
The main objective of the consultation process is to minimize negative impacts of the project and to maximize
the benefits from the project to the local populace. The objectives of public consultation as part of this project
are:
• Promote public awareness and improve understanding of the potential impacts of proposed projects
• Identify alternative sites or designs, and mitigation measures
• Solicit the views of affected communities / individuals on environmental and social problems
• Improve environmental and social soundness
• Clarify values and trade-offs associated with the different alternatives
• Identify contentious local issues which might jeopardize the implementation of the project
• Establish transparent procedures for carrying out proposed works

24 February 2021
PwC 187
• Inform the affected populace about the entitlement framework and to settle problems with mutual
consent
• Create accountability and sense of local ownership during project implementation; and
• To obtain information on baseline environment
9.7.2. Methodology for Stakeholder’s Consultation
Different techniques of consultation with stakeholders were used during project preparation, viz., in-depth
interviews, public meetings, group discussions etc. to understand the socio-economic profile of the community
and the affected families, baseline environment, environmental/social concerns etc.
A two-fold Stakeholder Consultation Meeting (SCM) will be carried out during the Environmental and Social
Review study. In this regard, the SCMs were conducted firstly with the primary and secondary stakeholders and
later, affected persons within the occupation were consulted through Focused Group Discussions (FGD). The
Focused Group Discussions (FGD) were carried out with different groups at the proposed EZ area. PWC
personnel discussed about the future developments and benefits to the community due to the development of
the EZ.
9.7.3. Level of Consultation
Public consultations in the form of institutional and focused group discussions were carried in July 2019 and
October 2020. The consultations with the community are in the process along with the enumeration exercise.
However, the details of the institutional consultations conducted is provided below:
Level Type Key Participants
Institutional Stakeholder Meeting Various Govt. Officials
Community Focused Group Discussion PAP, marginalized people
9.7.4. Institutional Stakeholders Consultation
Date of Meeting: 23 July 2019
Location of Meeting: UNO Office, Sitakundo, Chattogram
Officials Met:
Name of Person Designation Contact
Details
Date of
Consultation
Mr. Milon Ray Upazila Nirbahi Officer 01837711450 23 July 2019
Sayed Nazmul Haque AC Land, Sitakundo 01710272081 23 July 2019
Mr Shafkat Ryad UAO (in-Charge) Sitakundo 01751778154 23 July 2019
Mohammad Mamun Upazila secondary Education
Officer 01817021257
23 July 2019
Mr. Raseduzzaman Sub-Assistant Engineer, DPHE 01741288180 23 July 2019
Dr Shajalal Moh.
Younus
Upazila Livestock Officer
(In-Charge) 01843531181
23 July 2019
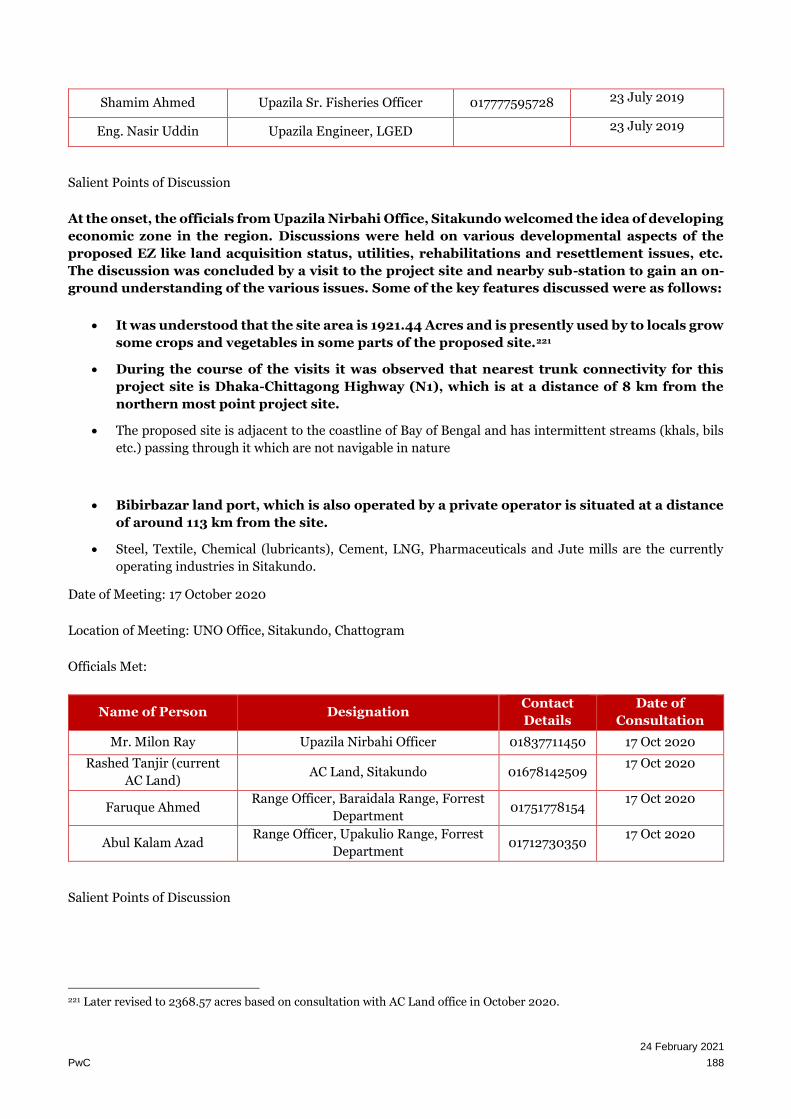
24 February 2021
PwC 188
Shamim Ahmed Upazila Sr. Fisheries Officer 017777595728 23 July 2019
Eng. Nasir Uddin Upazila Engineer, LGED 23 July 2019
Salient Points of Discussion
At the onset, the officials from Upazila Nirbahi Office, Sitakundo welcomed the idea of developing
economic zone in the region. Discussions were held on various developmental aspects of the
proposed EZ like land acquisition status, utilities, rehabilitations and resettlement issues, etc.
The discussion was concluded by a visit to the project site and nearby sub-station to gain an on-
ground understanding of the various issues. Some of the key features discussed were as follows:
• It was understood that the site area is 1921.44 Acres and is presently used by to locals grow
some crops and vegetables in some parts of the proposed site.221
• During the course of the visits it was observed that nearest trunk connectivity for this
project site is Dhaka-Chittagong Highway (N1), which is at a distance of 8 km from the
northern most point project site.
• The proposed site is adjacent to the coastline of Bay of Bengal and has intermittent streams (khals, bils
etc.) passing through it which are not navigable in nature
• Bibirbazar land port, which is also operated by a private operator is situated at a distance
of around 113 km from the site.
• Steel, Textile, Chemical (lubricants), Cement, LNG, Pharmaceuticals and Jute mills are the currently
operating industries in Sitakundo.
Date of Meeting: 17 October 2020
Location of Meeting: UNO Office, Sitakundo, Chattogram
Officials Met:
Name of Person Designation Contact
Details
Date of
Consultation
Mr. Milon Ray Upazila Nirbahi Officer 01837711450 17 Oct 2020
Rashed Tanjir (current
AC Land) AC Land, Sitakundo 01678142509
17 Oct 2020
Faruque Ahmed Range Officer, Baraidala Range, Forrest
Department 01751778154
17 Oct 2020
Abul Kalam Azad Range Officer, Upakulio Range, Forrest
Department 01712730350
17 Oct 2020
Salient Points of Discussion
221 Later revised to 2368.57 acres based on consultation with AC Land office in October 2020.

24 February 2021
PwC 189
Continuation to the discussion started in July 2019, a follow-up meeting was held with the
officials from UNO office, AC Land and Forest Department. Some of the key features discussed
were as follows:
• It was understood that the site area is revised to 2368.57 Acres and is presently used by to
locals grow some crops and vegetables in some parts of the proposed site. The proposed
site encompasses 1358.52 acres (57.4% of total EZ) of land with planted forest by the
Department of Forest, Bangladesh.
• According to Boroiyadhala Range officer, the water flowing through these intermittent streams originates
in the hills of the Boroiyadhala National Park from the number of fountains present in the National Park.
The flow of these streams should be maintained by the project to avoid water logging in the adjoining
areas.
• According to Upakulio Range Officer, the forest plantation contains plant species like Kewra, Baine,
Kakra, Sundori, Goran, Gewa and other plants like Hargoza (Shrup species). Animal species like deer,
gui shap and pigs are also there.
• According to Upakulio Range Officer, the land is owned by Forest Department and the mangrove species
were planted in the 1960’s. Development of the EZ will result in loss of mangrove species. However,
considering national interest such project may be undertaken. He also opined that any char (alluvial land)
which may form after the development of embankment should be replanted with mangrove species.
• Steel, Textile, Chemical (lubricants), Cement, LNG, Pharmaceuticals and Jute mills are the currently
operating industries in Sitakundo.
9.7.5. Focused Group Discussions (FGD)
The Focused Group Discussions (FGD) were carried out with different group at the proposed EZ area on 19-10-
2020. PwC personnel discussed about the future developments and benefits to the community due to the
development of the EZ. The FGD was carried out in presence of local farmers, Business group, local elites and
youth group. Locals from very adjacent villages near Guliakhali Sea Beach and Modyo Bhaterkhil, participated in
the discussion. The details of the Focused Group Discussions are furnished below. The record of attendees has
been attached in Annexure-2.
Table 83: Details of Focus Group Discussions
Location: Guliakhali Sea Beach, Sitakunda, Chattogram
Date: 19 August 2020
Relevant
Stakeholders Issues
Suggestion/Demand from
participants
Remarks
Local Farmer
Group & Small
Business
residential
settlements (16
participants)
• Lack of development
in the area
• The participants welcomed the
project initiative taken by
BEZA. They cited poor road
condition in the access roads
connecting the project area
with the main national
highway. Since, this is a tourist
area – local experience traffic
congestion during weekends
and holidays due to influx of
tourists by large numbers.
They expect that the project
• The access road to the project
site should be widened and
improved by the project.
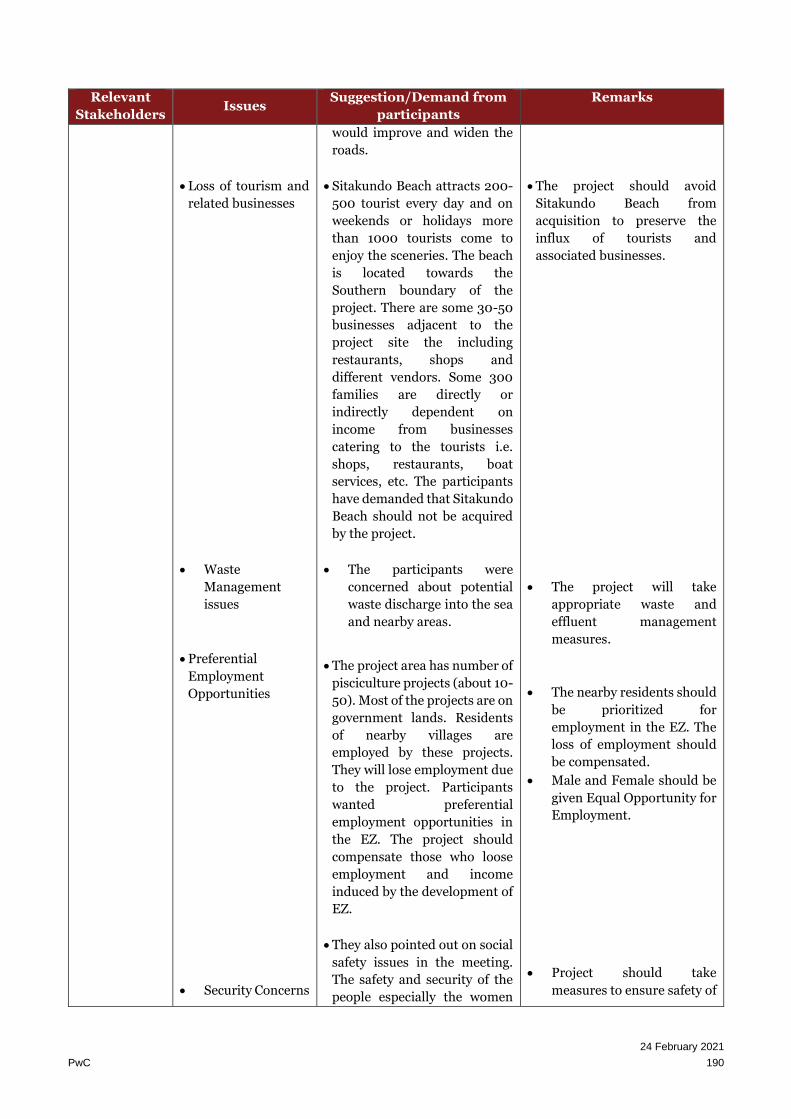
24 February 2021
PwC 190
Relevant
Stakeholders Issues
Suggestion/Demand from
participants
Remarks
• Loss of tourism and
related businesses
• Waste
Management
issues
• Preferential
Employment
Opportunities
• Security Concerns
would improve and widen the
roads.
• Sitakundo Beach attracts 200-
500 tourist every day and on
weekends or holidays more
than 1000 tourists come to
enjoy the sceneries. The beach
is located towards the
Southern boundary of the
project. There are some 30-50
businesses adjacent to the
project site the including
restaurants, shops and
different vendors. Some 300
families are directly or
indirectly dependent on
income from businesses
catering to the tourists i.e.
shops, restaurants, boat
services, etc. The participants
have demanded that Sitakundo
Beach should not be acquired
by the project.
• The participants were
concerned about potential
waste discharge into the sea
and nearby areas.
• The project area has number of
pisciculture projects (about 10-
50). Most of the projects are on
government lands. Residents
of nearby villages are
employed by these projects.
They will lose employment due
to the project. Participants
wanted preferential
employment opportunities in
the EZ. The project should
compensate those who loose
employment and income
induced by the development of
EZ.
• They also pointed out on social
safety issues in the meeting.
The safety and security of the
people especially the women
• The project should avoid
Sitakundo Beach from
acquisition to preserve the
influx of tourists and
associated businesses.
• The project will take
appropriate waste and
effluent management
measures.
• The nearby residents should
be prioritized for
employment in the EZ. The
loss of employment should
be compensated.
• Male and Female should be
given Equal Opportunity for
Employment.
• Project should take
measures to ensure safety of

24 February 2021
PwC 191
Relevant
Stakeholders Issues
Suggestion/Demand from
participants
Remarks
must be assured. There will be
so many migrants during the
process of development of EZ,
hence safety and security
should be ensured.
local women. The
construction workers
should be housed within the
project area.
Youth Group
(10
Participants)
• Employment
opportunity &
Priority for local
population
• Skills training to
enhance the
competency
• Welcomed the proposal for
establishment of Economic
Zone. They expect the project
shall provide them with
employment opportunities.
• Skill enhancement training
should be given youth group by
industries so that they can
work.
• Employment opportunities to
the local youths should be
offered on a priority.
• The local youth should be
provided with trainings as per
the requirements of the
industries going to be setup in
the EZ and the interest of the
stakeholders
9.8. Conclusion
• For the development of the proposed EZ, BEZA proposes to obtain 2368.57 acres of land, comprising of
private cultivable farmlands, government forest plantations and fallow lands.
• The project will affect more than 300 PAFs (more than 1200 PAPs) in terms of economic displacement.
Thus, a detailed social impact assessment and Resettlement Action Plan will be required prior to
acquisition of land. Due acquisition of private land (18.77 acres), 9 PAFs would be economically displaced
(est. 44 PAPs). Besides, there will be more than 300 PAFs (more than 1200 PAPs), due to loss of income
from tourists and fish cultivation income loss (pisciculture projects) farms on government lands.
Summary of Social Impacts • The development of the project would cause economic displacement due to loss of cultivatable farmlands
and small business catering to tourists attracted by Sitakunda Beach. • Based on consultations, total number of households who will lose farmlands will be around 9 households
(land only). However, if the project is developed more than 300 families would lose income due to loss of businesses (pisciculture farms) that are squatters on government land and income loss induced by reduced tourist traffic in the area.
• The development of the project will impact the existing livelihood patterns as it will disrupt income generated from cultivating crops and pisciculture.
• The existing economic structure will be impacted due to the development of the EZ, as that will potentially bring new types of jobs and livelihood opportunities that are different from the livelihood opportunities associated with farming.
• The project requires a detailed social assessment and the development of a comprehensive resettlement Action Plan which comprises of resettlement, livelihood generation and livelihood restoration strategies.
• The project preparation should also take into account the existing levels of literacy and skills in the area, so as to ascertain skill requirements for the PAPs to take advantage of the new jobs that are created during the construction as well as operation phases of the EZ.
• Loss of Grazing Land: Local people using the land as grazing land for cattle, will be acquired for EZ •

24 February 2021
PwC 192
• The development of the project will impact the existing livelihood patterns as it will disrupt income
generated from cultivating crops and pisciculture. The existing economic structure will be impacted due
to the development of the EZ, as that will potentially bring new types of jobs and livelihood opportunities
that are different from the livelihood opportunities associated with farming.
• The project preparation should also take into account the existing levels of literacy and skills in the area,
so as to ascertain skill requirements for the PAPs to take advantage of the new jobs that are created during
the construction as well as operation phases of the EZ.
• The project requires a detailed social assessment and the development of a comprehensive resettlement
Action Plan which comprises of livelihood generation/restoration strategies and a Gender Action Plan.
• A detailed Social Impact Assessment (SIA) study should be carried out and Resettlement Action Plan
(RAP) needs to be prepared for the PAPs in accordance to World Bank safeguard standards and
Government of Bangladesh's social and resettlement rules.
24 February 2021
PwC 193
10. Environmental Review
10.1. Purpose and Objective
The Environmental and Social Review has been undertaken with the following objectives –
• To facilitate an understanding of the elements of the existing baseline conditions of project’s area of
influence;
• To identify the aspects of the project likely to result in significant impacts to environmental and social
resources/receptors;
• To analyse and map relevant stakeholders involved in the project;
• To predict the significance of the impacts of the Project;
• To develop an understanding for the management and monitoring of impacts; and
• Preparation of Environmental Management Plan (EMP)
10.2. Methodology of Environmental Review
The methodology for the environmental review of the proposed site are:
• Identification and review of applicable local, state, national and international environmental and social
regulatory and institutional frameworks;
• Establishment of baseline conditions of the site and surrounding area through the following:
➢ Detailed surveys to observe environmental and social characteristics of the project area;
➢ Discussions with the stakeholders and identification key issues during planning, construction and
operation phase of the project;
➢ Baseline data collection of the site and project area with respect to water, ambient air and noise
quality etc.
➢ Ecological assessment on flora and fauna of the site and project area through secondary data
collection and consultation with stakeholders.
➢ Assessment of the socio-economic environment through collation of secondary information of the
site, supplemented by consultations with the local communities to understand community
perception with regard to the project and its activities;
• Impact Assessment and Mitigation Measures for environmental and social components for pre-
construction/construction and operation phases. To minimize the adverse impacts mitigations measures
will also be suggested; and
• Development of Environmental Management Action Plan which includes the following:
➢ Mitigations for adverse environmental impacts and associated risks;
➢ Institutional arrangement - management tools and techniques for the implementation of
environmental impacts and risk mitigations;
➢ Monitoring and reporting of requirements and mechanisms for the effective implementation of the
suggested mitigations;
➢ Monitoring arrangements for effective implementation of suggested mitigations for the proposed
project.
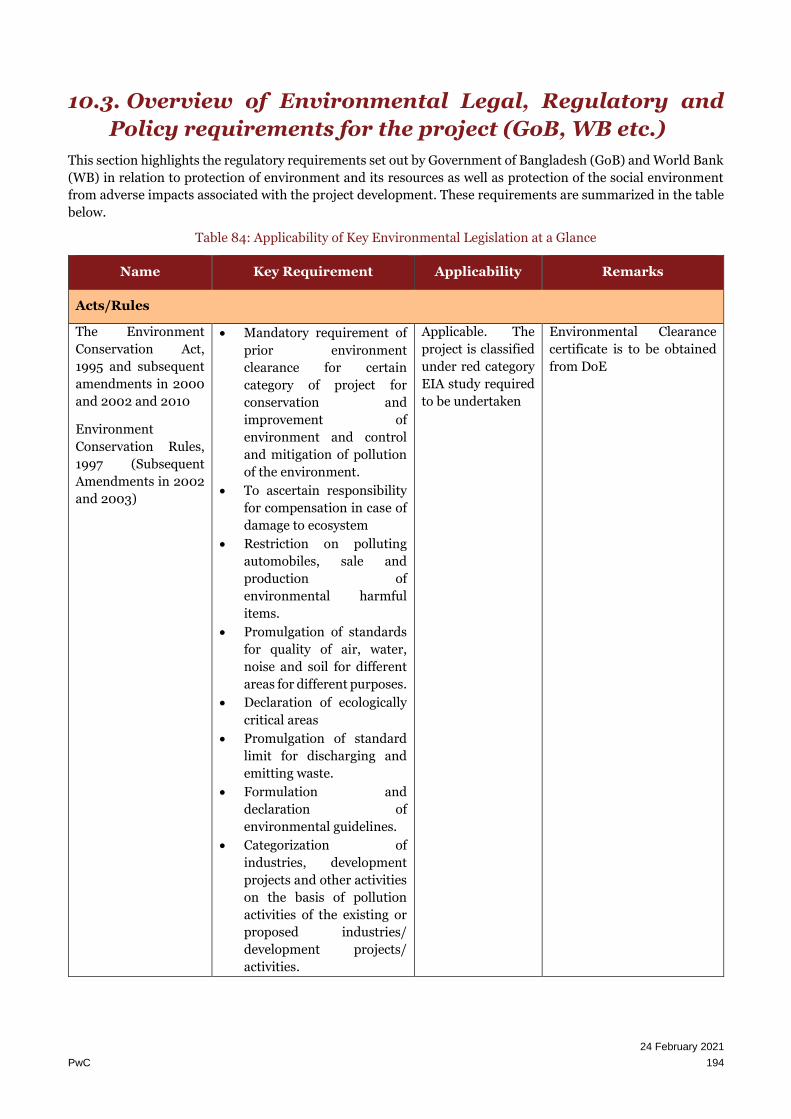
24 February 2021
PwC 194
10.3. Overview of Environmental Legal, Regulatory and
Policy requirements for the project (GoB, WB etc.)
This section highlights the regulatory requirements set out by Government of Bangladesh (GoB) and World Bank
(WB) in relation to protection of environment and its resources as well as protection of the social environment
from adverse impacts associated with the project development. These requirements are summarized in the table
below.
Table 84: Applicability of Key Environmental Legislation at a Glance
Name Key Requirement Applicability Remarks
Acts/Rules
The Environment
Conservation Act,
1995 and subsequent
amendments in 2000
and 2002 and 2010
Environment
Conservation Rules,
1997 (Subsequent
Amendments in 2002
and 2003)
• Mandatory requirement of
prior environment
clearance for certain
category of project for
conservation and
improvement of
environment and control
and mitigation of pollution
of the environment.
• To ascertain responsibility
for compensation in case of
damage to ecosystem
• Restriction on polluting
automobiles, sale and
production of
environmental harmful
items.
• Promulgation of standards
for quality of air, water,
noise and soil for different
areas for different purposes.
• Declaration of ecologically
critical areas
• Promulgation of standard
limit for discharging and
emitting waste.
• Formulation and
declaration of
environmental guidelines.
• Categorization of
industries, development
projects and other activities
on the basis of pollution
activities of the existing or
proposed industries/
development projects/
activities.
Applicable. The
project is classified
under red category
EIA study required
to be undertaken
Environmental Clearance
certificate is to be obtained
from DoE
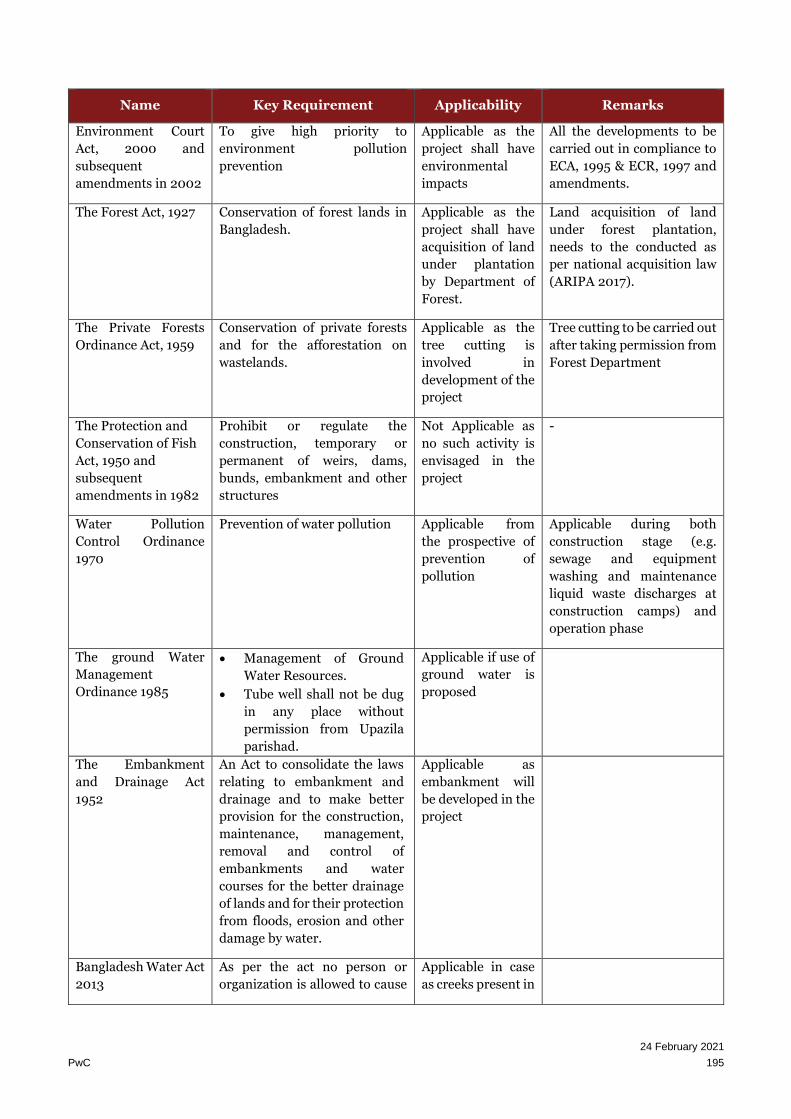
24 February 2021
PwC 195
Name Key Requirement Applicability Remarks
Environment Court
Act, 2000 and
subsequent
amendments in 2002
To give high priority to
environment pollution
prevention
Applicable as the
project shall have
environmental
impacts
All the developments to be
carried out in compliance to
ECA, 1995 & ECR, 1997 and
amendments.
The Forest Act, 1927 Conservation of forest lands in
Bangladesh.
Applicable as the
project shall have
acquisition of land
under plantation
by Department of
Forest.
Land acquisition of land
under forest plantation,
needs to the conducted as
per national acquisition law
(ARIPA 2017).
The Private Forests
Ordinance Act, 1959
Conservation of private forests
and for the afforestation on
wastelands.
Applicable as the
tree cutting is
involved in
development of the
project
Tree cutting to be carried out
after taking permission from
Forest Department
The Protection and
Conservation of Fish
Act, 1950 and
subsequent
amendments in 1982
Prohibit or regulate the
construction, temporary or
permanent of weirs, dams,
bunds, embankment and other
structures
Not Applicable as
no such activity is
envisaged in the
project
-
Water Pollution
Control Ordinance
1970
Prevention of water pollution Applicable from
the prospective of
prevention of
pollution
Applicable during both
construction stage (e.g.
sewage and equipment
washing and maintenance
liquid waste discharges at
construction camps) and
operation phase
The ground Water
Management
Ordinance 1985
• Management of Ground
Water Resources.
• Tube well shall not be dug
in any place without
permission from Upazila
parishad.
Applicable if use of
ground water is
proposed
The Embankment
and Drainage Act
1952
An Act to consolidate the laws
relating to embankment and
drainage and to make better
provision for the construction,
maintenance, management,
removal and control of
embankments and water
courses for the better drainage
of lands and for their protection
from floods, erosion and other
damage by water.
Applicable as
embankment will
be developed in the
project
Bangladesh Water Act
2013
As per the act no person or
organization is allowed to cause
Applicable in case
as creeks present in

24 February 2021
PwC 196
Name Key Requirement Applicability Remarks
alteration of water course
without permission from
authority
the EZ area is
diverted.
Water Rule 2018 Governs the right to access
water in Bangladesh. It also
governs the water
abstraction/extraction.
Applicable because
the EZ would be
abstracting water
for domestic and
industrial use.
Applicable during both
construction stage. The
necessary permits for water
abstraction are to be
received from WARPO as
per the law.
The Building
Construction Act 1952
(with latest
amendment 2006)
An Act to provide for the
prevention of haphazard
construction of building and
excavation of tanks which are
likely to interfere with the
planning of certain areas in
Bangladesh
Applicable as the
project involves
development of
infrastructure
Regulatory authority is
Ministry of Works
The Vehicle Act, 1927
The Motor Vehicles
Ordinance, 1983 The
Bengal Motor Vehicle
Rules, 1940
To regulate vehicular exhaust
emissions
Applicable as
heavy vehicle
movement is
involved both
during
construction and
operation phase
Regular maintenance and up
keeping of the vehicles
should be carried out.
Regulatory authority is
Bangladesh Road Transport
Authority
The Factories Act,
1965
Bangladesh Labor
Law 2006,
amendment 2013
Bangladesh Labor
Rules 2015
This Act pertains to the
occupational rights and safety
of factory workers and the
provision of a comfortable work
environment and reasonable
working conditions.
Applicable as the
workers will be
employed during
construction and
operation phase
Regulatory authority is
Ministry of labor
Policies
National
Environment Policy,
1992
For sustainable development Applicable for all
development
projects
Usage of energy efficient
building material, fuel etc.
should be encouraged
National
Environment
Management Action
Plan 1995
Conservation of natural
habitats, bio-diversity, energy,
sustainable development and
improvement of life of people
Applicable for all
development
projects
Usage of energy efficient
material, green building
techniques, reduction of
carbon footprints etc.
National
Conservation Strategy
Sustainable development of
Industrial Sector
Applicable for all
development
projects
Usage of energy efficient
material, green building
techniques, reduction of
carbon footprints etc.
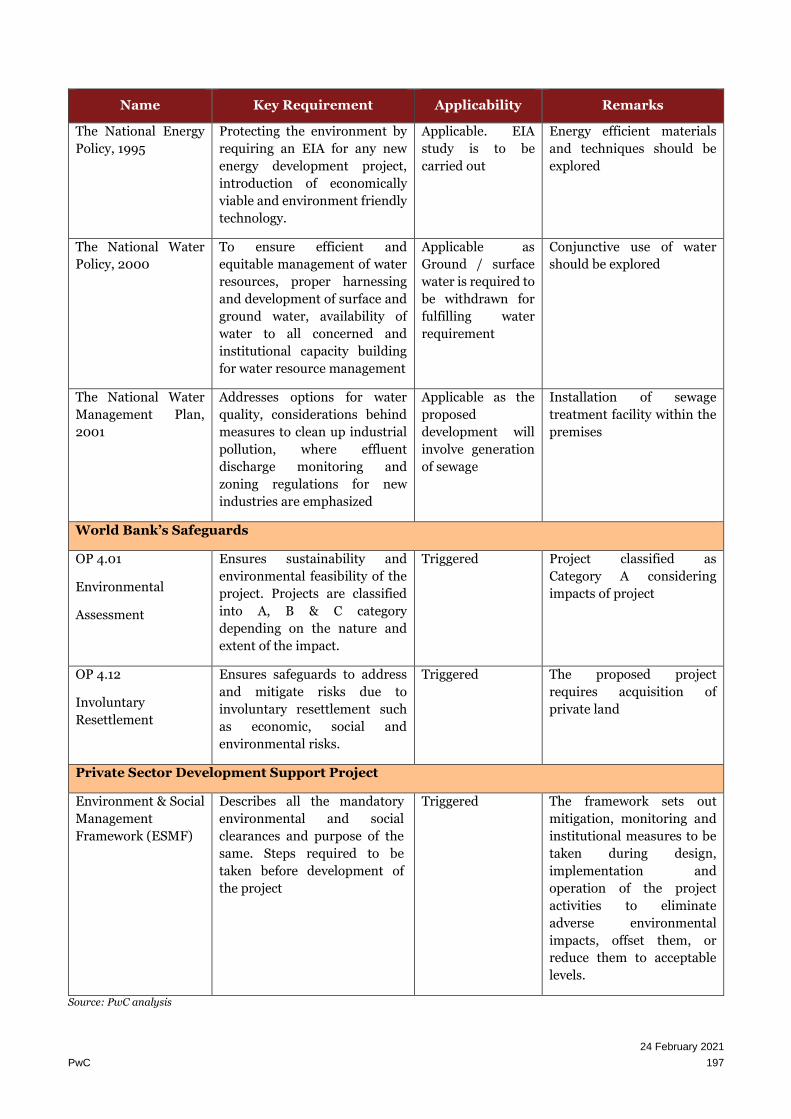
24 February 2021
PwC 197
Name Key Requirement Applicability Remarks
The National Energy
Policy, 1995
Protecting the environment by
requiring an EIA for any new
energy development project,
introduction of economically
viable and environment friendly
technology.
Applicable. EIA
study is to be
carried out
Energy efficient materials
and techniques should be
explored
The National Water
Policy, 2000
To ensure efficient and
equitable management of water
resources, proper harnessing
and development of surface and
ground water, availability of
water to all concerned and
institutional capacity building
for water resource management
Applicable as
Ground / surface
water is required to
be withdrawn for
fulfilling water
requirement
Conjunctive use of water
should be explored
The National Water
Management Plan,
2001
Addresses options for water
quality, considerations behind
measures to clean up industrial
pollution, where effluent
discharge monitoring and
zoning regulations for new
industries are emphasized
Applicable as the
proposed
development will
involve generation
of sewage
Installation of sewage
treatment facility within the
premises
World Bank’s Safeguards
OP 4.01
Environmental
Assessment
Ensures sustainability and
environmental feasibility of the
project. Projects are classified
into A, B & C category
depending on the nature and
extent of the impact.
Triggered Project classified as
Category A considering
impacts of project
OP 4.12
Involuntary
Resettlement
Ensures safeguards to address
and mitigate risks due to
involuntary resettlement such
as economic, social and
environmental risks.
Triggered The proposed project
requires acquisition of
private land
Private Sector Development Support Project
Environment & Social
Management
Framework (ESMF)
Describes all the mandatory
environmental and social
clearances and purpose of the
same. Steps required to be
taken before development of
the project
Triggered The framework sets out
mitigation, monitoring and
institutional measures to be
taken during design,
implementation and
operation of the project
activities to eliminate
adverse environmental
impacts, offset them, or
reduce them to acceptable
levels.
Source: PwC analysis

24 February 2021
PwC 198
10.4. Project Description
With the vision of improving the economy of the country and generating livelihood for the population,
Government of Bangladesh (GoB) has planned an era of organized industrialization by following the footsteps of
other South Asian countries. GoB set up Bangladesh Economic Zones Authority (BEZA) as the nodal agency and
regulator of EZ development within the country. BEZA has set forth an ambitious target of developing 100 EZs
in the coming 15 years spread across various locations of Bangladesh.
In line with the aspiring growth plan of the GoB, BEZA has envisaged and planned the development of twelve
prospective growth locations as economic zones (EZs) at various locations Across the country. BEZA (through
the funding from World Bank) has engaged PricewaterhouseCoopers Private Limited (PwC) in association with
Mahindra Consulting Engineers Limited (MACE) and Infrastructure Investment Facilitation Company (IIFC) as
sub consultants to undertake feasibility study of these project sites.
Proposed Sitakundo EZ is one of these 12 sites.
Proposed EZ is spread over an area of 2368.57 acres. The proposed EZ site is located in the Sitakundo Upazila as
a part of Chattogram district. Nearest highway connectivity for this project site is Dhaka-Chittagong highway (N1)
which 5.5 km from the proposed EZ. N1 connects the project site with Chittagong (~45 km) and Dhaka (~215
km). Sitakundo Railway station is the nearest railway station (~10 km from the proposed). The nearest seaport
at Chittagong Port at a distance of ~48 km from the site.
Based on the regional landscape and site intrinsic features, suitability of various industrial sectors has been
assessed. The following industrial sectors emerged out as the potential industrial mix for the proposed EZ-
• Heavy Machinery, Iron & Steel and Metals
• Chemicals
• Non-metallic minerals
• Automobiles and Accessories
• Petroleum products (including bottling)
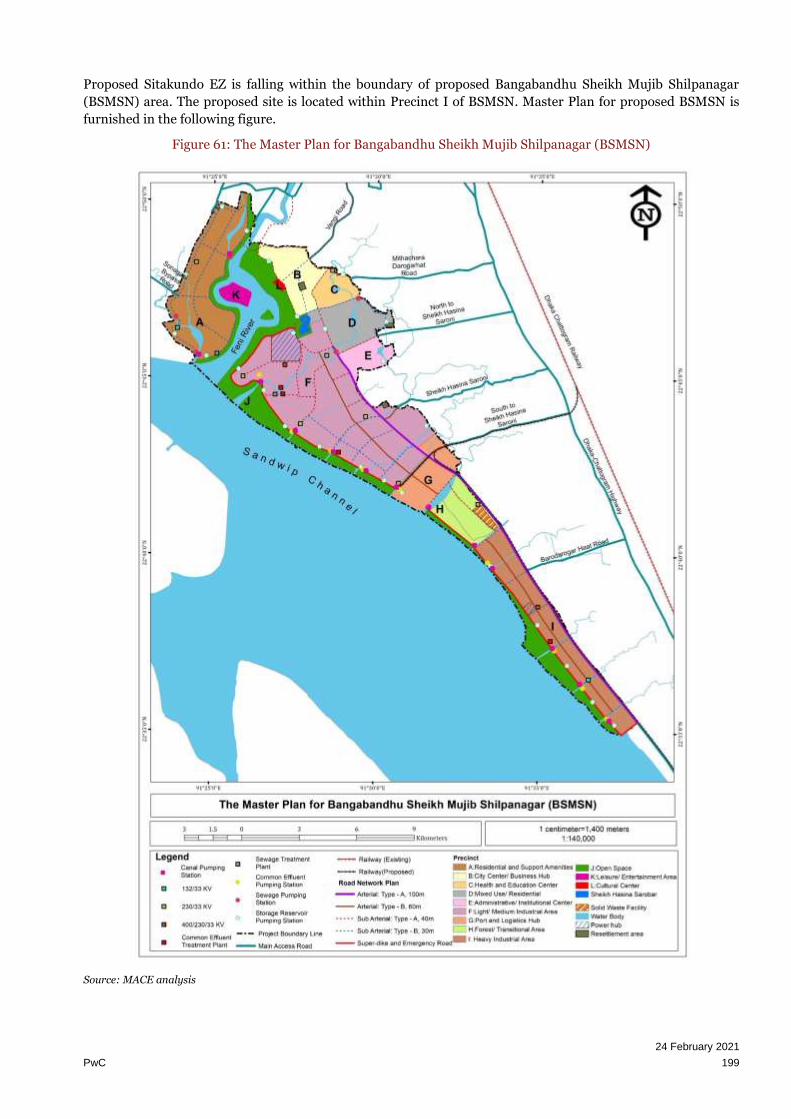
24 February 2021
PwC 199
Proposed Sitakundo EZ is falling within the boundary of proposed Bangabandhu Sheikh Mujib Shilpanagar
(BSMSN) area. The proposed site is located within Precinct I of BSMSN. Master Plan for proposed BSMSN is
furnished in the following figure.
Figure 61: The Master Plan for Bangabandhu Sheikh Mujib Shilpanagar (BSMSN)
Source: MACE analysis

24 February 2021
PwC 200
10.5. Baseline Scenario
10.5.1. Location and Study Area
The proposed EZ is located in Sitakundo Upazila of Chattogram District in Chattogram Division located at the
South Eastern part of the country and is the largest division among the eight administrative units of
Bangladesh. Chattogram division has 11 districts.
Chattogram District is surrounded by the following:
• Feni District– North
• Khagrachari, Rangamati and Bandarban– East
• Bay of Bengal –West
• Cox’s Bazar– South
The proposed site falls within jurisdiction of 5 Mouzas i.e. Saidpur, Bakkhali, Bagachatar, Guliakhali,
Bhaterkhil in Sitakundo Upazila of Chattogram District.
Figure 62: Sitakundo Site Location (Chattogram Division-Chattogram District-Sitakundo Upazila)
Source: Google Map and PwC Analysis
Table 85: Proposed EZ Site Information
Parameters Details
Site co-ordinates 22°68'16.18"N
91°56'19.66"E
Site boundaries on East BWDB embankment road, Settlements, agriculture land and mass
development
Site boundaries on West Bay of Bengal
Site boundaries on North Forest Plantation
Site boundaries on South Forest Plantation
Total area of the site 2368.57 acres
Privately owned land 18.77 acres
Government Land/ Khas
land
2349.8 acres
Source: Google Map and PwC Analysis

24 February 2021
PwC 201
Figure 63: Location of the proposed EZ on Google Earth
Source: MACE Analysis
The site is adjoining the Bay of Bengal on the western side of the proposed EZ. The site contains significant
amounts of mangrove planted by Forest Department in the 1960’s. The plantation also has number of deer
introduced by forest department. Within the project site, there are number of small creeks which gets water tidal
flow and rain. The streams get back water from the Bay of Bengal creating a brackish ecosystem in which
mangroves thrive. Considering the sensitivity of the ecosystem in the area, 10 km radius from proposed site
boundary has been considered as zone of influence due to the proposed development. Hence 10 Km radius is
considered as study area for carrying out Environmental and Social review. Zila/Upazila level secondary
information was also collected for various environmental and social components irrespective of any demarcated
boundary.
10.5.2. Topography and Seismology
Based on the study of site surrounding contour and site contour, it is found that the site needs to be filled for a
depth of about 1.80 m (6 ft – 7 ft) on an average. Dredging of sand from Bay of Bengal will likely be used as a
source for site filling.
Bangladesh has been divided into three generalized seismic zones. The northeastern regions of Bangladesh are
the most active zones and belong to the zone-I. The zone II consists of the regions of recent uplifted Pleistocene
blocks and considered as moderately active. The southwest Bangladesh is seismically quiet zone and represented
by zone III. Proposed site is located in Zone II.

24 February 2021
PwC 202
Figure 64: Proposed site shown on Seismic Zoning Map of Bangladesh
Source: Prime Minister's Office Library, Dhaka
10.5.3. Climatological Condition
The area has a tropical monsoon climate. It has three main seasons i.e.
• Summer/Pre-monsoon - March to May
• Rainy Season/monsoon - June to October
• Winter season - November to February
Hot summer, the long rainy season and the pleasant spring cum winter are the main noticeable seasons prevailing
in the district. The summer begins at the end of March and is merged with the rainy season that continues up to
September. The duration of the winter is recorded from early November to let February. The highest and the
lowest mean temperatures recorded in 2011 25°c in 2008 and 13.3°c in 2011 during the months of April and

24 February 2021
PwC 203
January respectively. The average relative humidity is around 75.8%. There is plenty of rainfall occurs during the
months of May to July. The annual rainfall recorded in 2011 was 3082 millimeters
10.5.4. Land use Pattern & Soil Type
As indicated by Agriculture Department, there are some agricultural activities in the proposed land (mostly single
crop and double crop). The possibility of double cropping is entirely dependent on flood situation. In Robi Season
Vegetables, Paddy (Boro) etc. are cultivated. In Kharif Season (if condition is favorable) Paddy (Amon/Aush) are
produced. Soil type is Sandy-Loam. Beside agriculture, local populace also carryout fishing in the proposed
through community based projects.
As per the AC Land office at Sitakundo, the land use category and the area of land to be acquired for the proposed
economic zone is indicated below:
Table 86: Details of land under the project area
SL
No
Name of
Mouza
Total
land
(Acre)
Ownership Pattern
(Acre)
Type of Land categories
Private
land
Khas
(govt.
land)
Nul Potit/Khila Baluchor Doba
1 Saidpur 474 0 474 0 6.55 129.83 337.62
2 Bakkhali 566.12 0 566.12 0 566.12 0 0
3 Bagachatar 456.64 0 456.64 0 456.54 0 0.1
4 Guliakhali 302.23 18.77 283.46 31.07 6.6 259.1 5.46
5 Bhaterkhil 569.58 0 569.58 0 563.28 0 6.3
Total 2368.57 18.77 2349.8 Source: AC Land Office Sitakundo
10.5.5. Air Environment
Based on the secondary information and the site reconnaissance survey it was observed that baseline air quality
was satisfactory and air pollution poses little or no threat presently. This may be due to the fact that the project
area is located in a rural area with no significant industries in the surrounding area and the traffic was relatively
less.
To establish the baseline of the study area, ambient air quality monitoring was conducted by Bangladesh
Environmental Engineering Training & Lab Services Ltd (BEETLSL), Bangladesh on January 21, 2021 to January
22, 2021. Ambient air (outdoor) quality of the project area was monitored for the parameters of NOx, SOx and
Suspended Particulate Matter. The monitored results for ambient air quality are furnished in the following table
Table 87: Ambient Air Quality of Project Area
Parameter Unit
Concentration
Present
(Longitude:
91.412643°
Latitude:
22.783037°)
IFC
Standard
mg/m3
Bangladesh
Standard
Duration
(hours) Method of Analysis
SPM µg/m3 78 - 200 24 Hr Gravimetric
SO2 µg/m3 01 125 365 24 Hr West- Geake
NO2 µg/m3 01 200 (1 Hr) NYS 24 Hr Jacob and Hochheiser
Source: Primary monitoring conducted by BEETLSL, Bangladesh
The detailed report on Ambient Air Quality Monitoring is furnished in the Annexure.

24 February 2021
PwC 204
10.5.6. Noise Environment
Based on the secondary information and the site reconnaissance survey it was observed that baseline noise level
was quite satisfactory. This may be due to the fact that the project area is located in a rural area with no significant
industries in the surrounding area and the traffic was relatively less.
To establish the baseline condition of noise environment monitoring of noise level was carried out by Bangladesh
Environmental Engineering Training & Lab Services Ltd (BEETLSL), Bangladesh on January 21, 2021 to January
22, 2021. Ambient air (outdoor) quality of the project area from the project area. Table below represents the
results of ambient noise quality of the project area. The detailed report on Ambient Noise Quality Monitoring is
furnished in the Annexure.
Table 88: Ambient Noise Quality of Project Area
Sample Location Land Use Category
Time Noise Level (dBA)
(LAeq)
Day Night Day Night
Start End Start End
Sitakundo Economic Zone Industrial Zone
(Proposed)
8.00 AM 3.59 PM 5.00
PM
12.59
AM
53.6 36.7
Noise level standard:
Bangladesh ECR -1997Standard for Day Time Nighttime
Industrial area 75 70
Commercial 70 60
Mixed area 60 50
Residential area 55 45
World Bank / IFC Standard Day Time Nighttime
Industrial area 70 70
Residential; Intuitional; Educational 55 45
Source: Primary monitoring conducted by BEETLSL, Bangladesh
10.5.7. Water Environment
10.5.7.1. Ground Water
From the discussion had with officials and local, it is understood that the groundwater is at a depth of 18-19 feet
and is non-potable in nature. It is proposed to provide desalination plant for BSMN site to meet the water demand
of EZ on a long-term basis.
To understand the ground water quality of the study area ground water sample was drawn by Bangladesh
Environmental Engineering Training & Lab Services Ltd (BEETLSL), Bangladesh on January 21, 2021 for further
analysis. Sampling of Ground water has been conducted by following grab sampling method. The analyzed result
of ground water quality of the project area is furnished in below table. The detailed report on Ground Water
Monitoring is furnished in the Annexure.
Table 89: Ground Water Quality of Project Area
SL
No.
Ground Water:
Parameters
Concentration
Present Unit
ECR 1997
Standard
for
Drinking
Water
Methods of Analysis
1. Total Dissolved Solids
(TDS)
138 mg/L 1000 APHA22nd EDN.2012 (2540C)
2. BOD 01 mg/L 0.2 APHA22nd EDN.2012 (5210 B)
3. COD 2.9 mg/L 4 APHA22nd EDN.2012 (5220 B)
4. Turbidity 5.9 NTU 10 APHA22nd EDN.2012 (2130 B)
5. Total Coliform (TC) 00 CFU/100ml 0.00 APHA22nd EDN.2012 (9222H)

24 February 2021
PwC 205
SL
No.
Ground Water:
Parameters
Concentration
Present Unit
ECR 1997
Standard
for
Drinking
Water
Methods of Analysis
6. Fecal Coliform (FC) 00 CFU/100ml 0.00 APHA22nd EDN.2012 (9222B)
7. Total Iron (Fe) 3.6 mg/L 0.3-1.0 APHA22nd EDN.2012 (3500- Fe)
Source: Primary monitoring conducted by BEETLSL, Bangladesh
10.5.7.2. Surface Water & Drainage
From the site visit it is observed that the proposed site is 6-7 feet below abutting BWDB embankment road and
it falls on the coast of Bay of Bengal. Also, there are low lying areas and water channels running within the site.
It has been communicated by the officials that every year during monsoon season, the site is getting flooded. This
necessitates to retain the existing water channels and development of an embankment along the proposed site.
To understand the surface water quality of the study area surface water sample was drawn by Bangladesh
Environmental Engineering Training & Lab Services Ltd (BEETLSL), Bangladesh from the channel located within
proposed site on January 21, 2021 for further analysis. Sampling of surface water has been conducted by following
grab sampling method. The analyzed result of surface water quality of the project area is furnished in below table.
The detailed report on Surface Water Monitoring is furnished in the Annexure.
Table 90: Surface Water Quality of Project Area
Source: Primary monitoring conducted by BEETLSL, Bangladesh
10.5.8. Biological Environment
10.5.8.1. Protected Area/Ecologically Critical Area (ECA)
Under the Environmental Conservation Act, ecologically sensitive and precious areas are designated as
Ecologically Critical Area (ECA) by Department of Environment in Bangladesh in cases where an ecosystem
or biodiversity area is considered to be threatened to reach to a critical state. On the other hand, protected
areas such as national parks and protected forests are designated by Department of Forest under the
Wildlife Order and Forest Act. There is no protected area or ECA located within the study area of 10Km radius
from proposed site boundary. The nearest protected area from proposed site is Baroiyadhala National Park, which
is about 7 Km away from proposed site towards Eastern direction.
Baroiyadhala National Park is IUCN Category II national park and nature reserve in Bangladesh. It was
declared a sanctuary in 2010 and it encompasses 2933.61 hectares. The park is home to over 50 species of plants,
including some rare species. Many indigenous species like Chapalish, Darmara, Horina grows naturally in the
SL No. Surface Water:
Parameters
Conce
ntratio
n
Presen
t
Unit ECR 1997
Standard for
Surface Water
Methods of Analysis
1. PH 7.47 mg/L 6-9 APHA 22nd EDN.2012 (4500H+B)
2. Electrical Conductivity
(EC)
1120 μS/c
m
1200 APHA22nd EDN.2012 (2510 B)
3. Total Dissolved Solids
(TDS)
589 mg/L 2100 APHA 22nd EDN.2012 (2540C)
4. BOD5 1.9 mg/L 50 APHA 22nd EDN.2012 (5210 B)
5. COD 2.9 mg/L 200 APHA 22nd EDN.2012 (5220 B)
6. Chloride (Cl)- 30.9 mg/L 600 APHA22nd EDN.2012 (4500 Cl-)
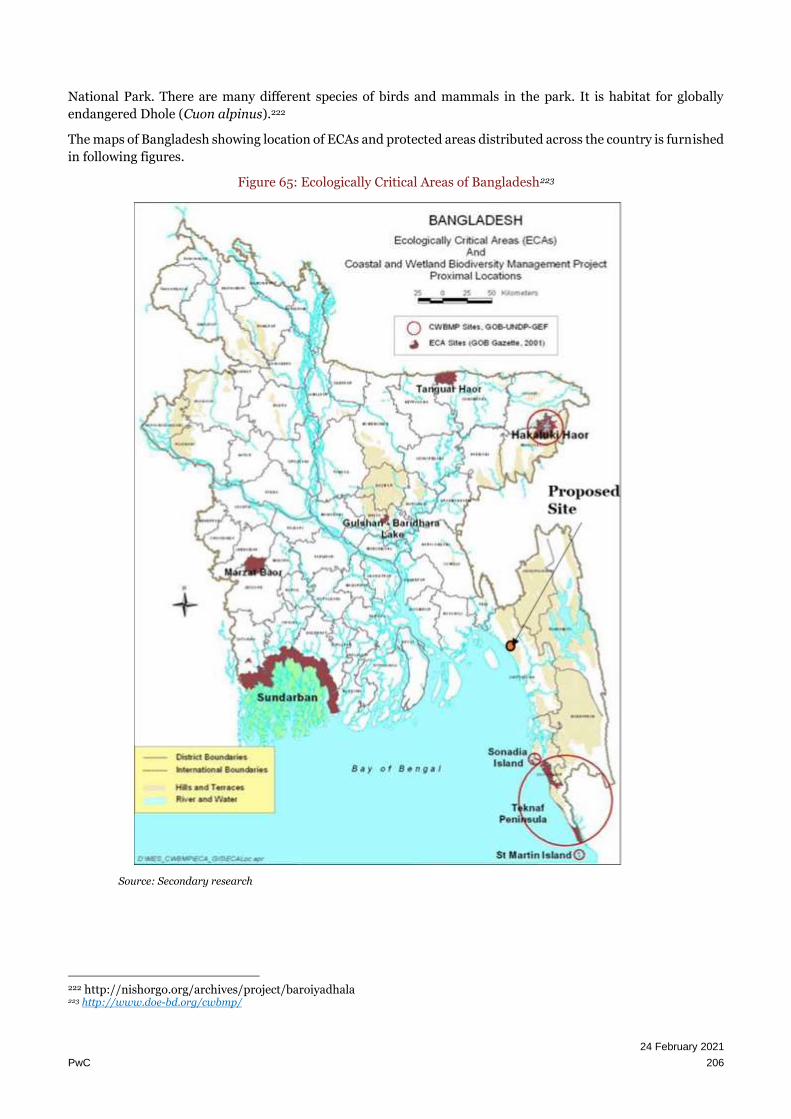
24 February 2021
PwC 206
National Park. There are many different species of birds and mammals in the park. It is habitat for globally
endangered Dhole (Cuon alpinus).222
The maps of Bangladesh showing location of ECAs and protected areas distributed across the country is furnished
in following figures.
Figure 65: Ecologically Critical Areas of Bangladesh223
Source: Secondary research
222 http://nishorgo.org/archives/project/baroiyadhala 223 http://www.doe-bd.org/cwbmp/

24 February 2021
PwC 207
Figure 66: Protected Areas of Bangladesh showing location of Proposed Site
Source: Forest Department of Bangladesh

24 February 2021
PwC 208
10.5.8.2. Forest Area/Vegetation Cover
The proposed site encompasses 1358.52 acres (57.4% of total EZ) of land with planted forest by the Department
of Forest, Bangladesh. According to forest department, this forest cover with mangrove species like kewra, baine,
kakra, sundori, goran ang gew. The area also has other plant species like Harzoga (shrub). The forest also has
animal species like deers (introduced by forest department), Bengal Monitor Snake (Gui shap), swine, crabs etc.
The rest of the land is mostly barren or under cultivation of paddy, vegetables and pisciculture.
The forest map of Bangladesh is furnished in below figure.
Figure 67: Forest Areas of Bangladesh
Source: Prime Minister's Office Library, Dhaka

24 February 2021
PwC 209
10.5.8.3. Flora & Fauna
About 57.4% of the project area is under forest cover (plantation by forest department). And Ganges-
Brahmaputra-Meghna Delta Region (spread over an area of 75000 Ha) is identified as a Key Biodiversity Area (K
BA) which is Important Bird and Biodiversity Area (IBA). Information pertaining to ecological resources were
collected from concerned stakeholders and Local community. The flora and fauna recorded from study area is
presented in below section:
Flora
The common varieties of trees that are found in the project area are kaligarjan (Dipterocarpus turbinatus),
dhaligarjan (Dipterocarpus alatus), civit (Swintorica floribunda), dhup (Canarium resiniferum), champa
(Michelia champaca), narkeli (Pterygota alata), chundul (Tetremeles nudiflora), bandarhola (Duabanga
sonneratioides), kamdeb (Callophylum polyanthum), dhakijam (Syzygium grande), etc. Common species of
bamboos found in these forests are mitenga (Bambusa tulda), muli (Melocannus compactiflorus), dolu
(Teinostaehynum dullooa), orah (Dendrocalamus longispathus), pitraj (Aphanamixls polystachia), chalmugra
(Hydnocarpus kurjii), nageswar (Mesua nagassarium), gamar (Gmelina arborea), chapalish (Artocarpus
chapalish), jarul (Lagerstroemia speciosa), haritaki (Terminalia chebula), bahera (Terminalia bellrica), jalpai
(Elaeocarpus stectorius), dumur (Ficus ariculata), bon sonalu (Cassia nodosa), mango (Mangifera indica),
boilam (Anisoptera scaphula), telsur (Hopea odorata), kanak (Schima wallicii), assar (Microcos paniculata),
barmala (Callicarpus arborea), kabita (Gluta elegans), sheora (Streblus asper), batana (Quercus spp), sindur
(Mallotas philippensis), telya garjan (Dipterocarpus turbinatus), baittya garjan (Dipterocarpus scaber) etc.
Fauna
Beside domesticated mammals like cow, buffalo, goat, dog, cat etc., the recorded mammalian species from the
project and its surrounding are Small cats like chita biral (Prionailurus bengalensis), mechi bagh (Prionailurus
viverrinus), sonali biral (Felis remmencki), ban biral (Felis chaus), Fox (Vulpes bengalensis), jackal (Canis
aureus) and the common mongoose (Harpestes edwarsi), etc.
The common birds of the district include crow, sparrow (Passer domesticus), shalik (Acridoth errestrisis), black
drongo (Dicurus macrocercus), redvented, bulbul (Picnonotus cafer) and the pariah kite. Nearly as common as
these are the doel (Cophychus saularis), tailor bird (Orthotomus sutorius), pied moyna, common weaver bird,
green bee-eater (Merops orinetalis) and the common kingfisher (Alcedo atthis). Besides these, there are broad
bills, parakeets, woodpecker (Picus myrmecophoneus), barbets (Glaucidium radiatum) and cuckoos (Cuculus
microplerus).
Besides, various species of migratory birds enter into Bangladesh mainly during the winter season are also
recorded in the region. The bar headed geese, ruddy Sheldrake and a few teal and duck are met during the season.
Shovellers, gad wall, pintail ducks and pochard are also found. The little grebe is common and one species of
petrel is found.
Following avifaunal species recorded from Ganges-Brahmaputra-Meghna Delta Region’s Important Bird and
Biodiversity Area (IBA).
Scientific Name Common name IUCN Red List Category
Anas acuta Northern Pintail LC
Anser indicus Bar-headed Goose LC
Calidris pygmaea Spoon-billed Sandpiper CR
Numenius arquata Eurasian Curlew NT
Aythya nyroca Ferruginous Duck NT
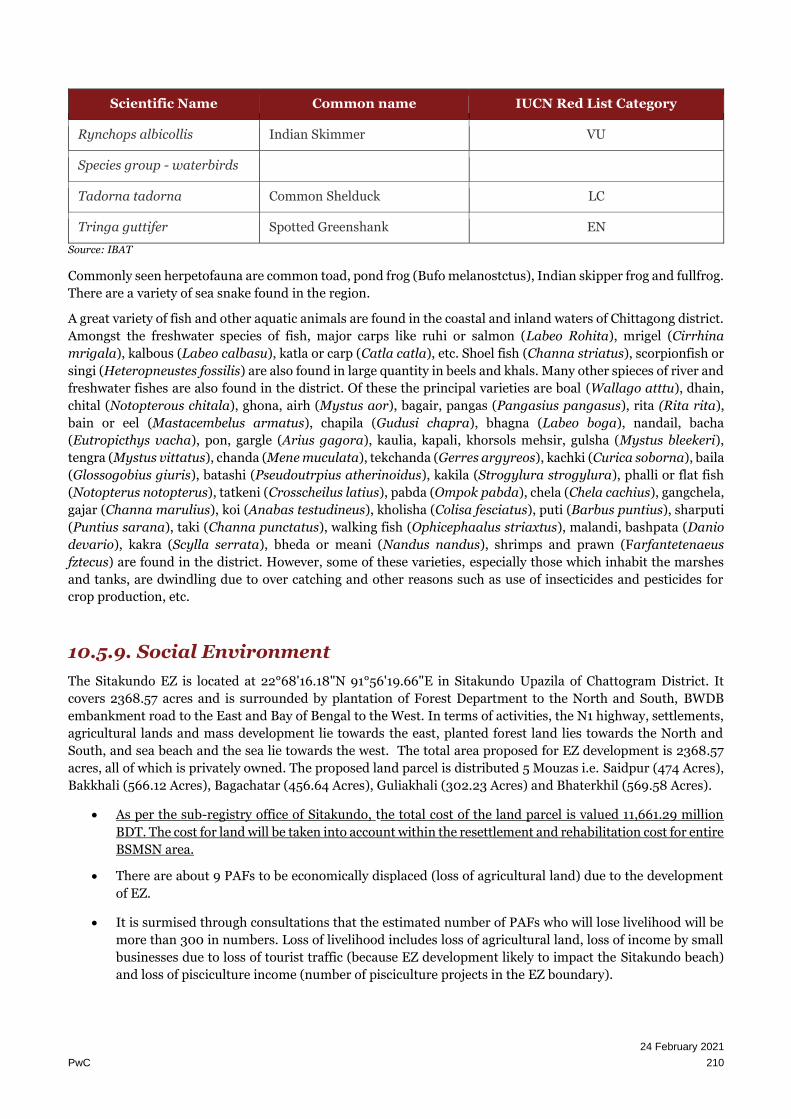
24 February 2021
PwC 210
Scientific Name Common name IUCN Red List Category
Rynchops albicollis Indian Skimmer VU
Species group - waterbirds
Tadorna tadorna Common Shelduck LC
Tringa guttifer Spotted Greenshank EN
Source: IBAT
Commonly seen herpetofauna are common toad, pond frog (Bufo melanostctus), Indian skipper frog and fullfrog.
There are a variety of sea snake found in the region.
A great variety of fish and other aquatic animals are found in the coastal and inland waters of Chittagong district.
Amongst the freshwater species of fish, major carps like ruhi or salmon (Labeo Rohita), mrigel (Cirrhina
mrigala), kalbous (Labeo calbasu), katla or carp (Catla catla), etc. Shoel fish (Channa striatus), scorpionfish or
singi (Heteropneustes fossilis) are also found in large quantity in beels and khals. Many other spieces of river and
freshwater fishes are also found in the district. Of these the principal varieties are boal (Wallago atttu), dhain,
chital (Notopterous chitala), ghona, airh (Mystus aor), bagair, pangas (Pangasius pangasus), rita (Rita rita),
bain or eel (Mastacembelus armatus), chapila (Gudusi chapra), bhagna (Labeo boga), nandail, bacha
(Eutropicthys vacha), pon, gargle (Arius gagora), kaulia, kapali, khorsols mehsir, gulsha (Mystus bleekeri),
tengra (Mystus vittatus), chanda (Mene muculata), tekchanda (Gerres argyreos), kachki (Curica soborna), baila
(Glossogobius giuris), batashi (Pseudoutrpius atherinoidus), kakila (Strogylura strogylura), phalli or flat fish
(Notopterus notopterus), tatkeni (Crosscheilus latius), pabda (Ompok pabda), chela (Chela cachius), gangchela,
gajar (Channa marulius), koi (Anabas testudineus), kholisha (Colisa fesciatus), puti (Barbus puntius), sharputi
(Puntius sarana), taki (Channa punctatus), walking fish (Ophicephaalus striaxtus), malandi, bashpata (Danio
devario), kakra (Scylla serrata), bheda or meani (Nandus nandus), shrimps and prawn (Farfantetenaeus
fztecus) are found in the district. However, some of these varieties, especially those which inhabit the marshes
and tanks, are dwindling due to over catching and other reasons such as use of insecticides and pesticides for
crop production, etc.
10.5.9. Social Environment
The Sitakundo EZ is located at 22°68'16.18"N 91°56'19.66"E in Sitakundo Upazila of Chattogram District. It
covers 2368.57 acres and is surrounded by plantation of Forest Department to the North and South, BWDB
embankment road to the East and Bay of Bengal to the West. In terms of activities, the N1 highway, settlements,
agricultural lands and mass development lie towards the east, planted forest land lies towards the North and
South, and sea beach and the sea lie towards the west. The total area proposed for EZ development is 2368.57
acres, all of which is privately owned. The proposed land parcel is distributed 5 Mouzas i.e. Saidpur (474 Acres),
Bakkhali (566.12 Acres), Bagachatar (456.64 Acres), Guliakhali (302.23 Acres) and Bhaterkhil (569.58 Acres).
• As per the sub-registry office of Sitakundo, the total cost of the land parcel is valued 11,661.29 million
BDT. The cost for land will be taken into account within the resettlement and rehabilitation cost for entire
BSMSN area.
• There are about 9 PAFs to be economically displaced (loss of agricultural land) due to the development
of EZ.
• It is surmised through consultations that the estimated number of PAFs who will lose livelihood will be
more than 300 in numbers. Loss of livelihood includes loss of agricultural land, loss of income by small
businesses due to loss of tourist traffic (because EZ development likely to impact the Sitakundo beach)
and loss of pisciculture income (number of pisciculture projects in the EZ boundary).
24 February 2021
PwC 211
• The above impacts of economic displacement necessitate that a detailed social impact assessment be
carried to develop a resettlement and relocation plan to mitigate the adverse impacts on the project
affected families.
The proposed site boundary superimposed on Mouza Map and affected details of Plots are furnished in
Annexure 3 and 4 in this report.
10.5.10. Demography
Sitakundo Upazila is one of the fourteen Upazilas in Chittagong district. As per Housing and Population Census
2011, Chittagong district had an overall population of 76,16,352. As per Housing and Population Census 2011,
Sitakundo Upazila had an overall population of 3,87,832 (~ 5.09% of District’s population). The Upazila has 10
unions, 9 wards, 69 mauzas and 59 villages. The Upazila has a population density of 801 per sq. km.
Approximately 52.12% of the Upazila population is male and 47.88 of the population is female, with the sex ratio
of 109, which is higher than the natural sex ratio which is supposed to be 105. The age dependency ratio is 56.55
(the age distribution is given in table below). The average literacy rate is 59.2%, and higher for men (62.2%) than
women (55.9%). Approximately 1.2% of the population suffers from speech, vision, hearing, mental, and physical
disabilities and autism. Majority of the population is Muslim (86.6%), followed by Hindu (13.3%). Other religions
figure below 1%. Ethnic minorities make up 0.37% of the population and are majorly Rakhine and Tripuri.
10.5.11. Social Infrastructure
An important predecessor for establishing of industries in a region is the type of social infrastructure that is
present in the region. Quality of educational institutes determine the availability of skilled local manpower;
quality of residential and medical facilities determine whether skilled manpower can be brought in from outside
to work at a particular place or not. With the growth in economy, quality of lifestyle has become an important
determining factor which can influence investment decisions for a particular place. Hence, it is important to
understand social infrastructure available in Sitakundo Upazila.
Education facilities: There are multiple primary and secondary schools in the Upazila. Private institutions
outnumber government institutions in all cases except in the case of primary schools and, once again, baring
primary schools, students in private schools greatly outnumber those in government schools. There is one
Government college and 5 private colleges in Sitakundo.
Religious and Social/Cultural Facilities: Given the religious distribution of the area, it is not surprising that
majority of religious institutions are Muslim, followed by Hindu. Outside of these, the region has four Pagoda
and no church. Of the important or historical/tourist place/object, the 2011 district statistics document one: Eco
Park. It also has 4208 ponds and 31 stadiums/playgrounds.
Government Institutions, NGOs and Disaster Relief: Apart from this, Sitakundo Upazila has a total of
41 government offices, 17 post offices, 1 sub-registry office, 5 union land offices, 2 police stations/camps, and 23
filling stations Sitakundo is a disaster prone upazila with has 59 cyclone shelters, flood/camp centers and 2 fire
brigade station. As of 2011, 27 NGOs were operating in the region.
Access to Finance and Internet: The Upazila has 15 nationalized banks. It has 9 cyber cafes and 5 ISP
providers and internet is also accessible on mobile networks.
Health Facilities: Apart from the government health complex, the Upazila has 5 private clinic and 11 Diagnostic
centers and 5 community clinics. 12 health centers/clinics provide health and family planning services. It has 136
physicians.
10.5.12. Livelihood and Economy
The economy of Sitakundo is dominated by the service sector with 45.55% of the workforce employed by the
sector largely due proximity to Chittagong City, the second largest city in Bangladesh. Agriculture sector is the

24 February 2021
PwC 212
second largest employment generator in Sitakundo with primary crops being paddy, mug (lentil) and
sugarcane.224. 37.56% of the working age population is employed and only 0.75% of the employable population is
looking for work. The employment status and the field of employment as a percentage of the employable
population is given to the below.
Table 91: Employment status of the Shibaloy Upazila
Employment Status Percentage
Employed 37.56
Looking for a Job 0.75
Household Work 39.88
Do not work 21.81
Field of Employment
Agriculture 29.85
Industry 24.60
Service 45.55 Data Source: 2011 Census
As the data shows, only 10% of the employed group are women; 98% of those who do household work are women.
Roughly an equal percentage of employable men and women don’t work. Of the employed women, nearly half of
the women are employed in service. Overall, a greater percentage of women work on service and industry while
a greater percentage of men work in agriculture.
Table 92: Employment Status: Gender Disaggregated
Field of Employment (Gender Disaggregated) Gender Percentage
Agriculture Male 95.67
Female 4.33
Industry Male 85.95
Female 14.05
Service Male 88.47
Female 11.53
Employment Status (Gender Disaggregated)
Employed Male 90.00
Female 10.00
Looking for a Job Male 77.43
Female 22.57
Household Work Male 1.93
Female 98.07
Do not work
Male 41.90
Female 58.10
Data Source: 2011 Census
10.6. Impact assessment and proposed mitigation
The environmental impacts assessment was carried out considering present environmental setting of the project
area and nature and extent of the proposed activities. The proposed project involves development of EZ and off-
224 District Statistics 2011
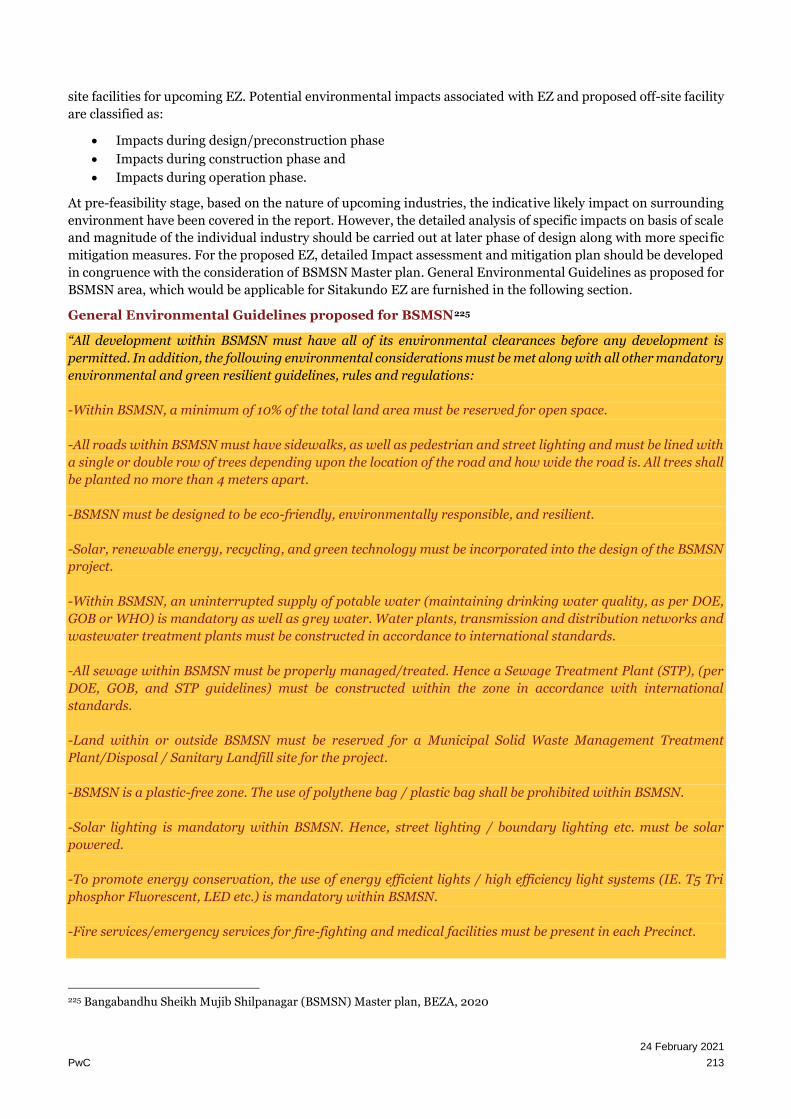
24 February 2021
PwC 213
site facilities for upcoming EZ. Potential environmental impacts associated with EZ and proposed off-site facility
are classified as:
• Impacts during design/preconstruction phase
• Impacts during construction phase and
• Impacts during operation phase.
At pre-feasibility stage, based on the nature of upcoming industries, the indicative likely impact on surrounding
environment have been covered in the report. However, the detailed analysis of specific impacts on basis of scale
and magnitude of the individual industry should be carried out at later phase of design along with more specific
mitigation measures. For the proposed EZ, detailed Impact assessment and mitigation plan should be developed
in congruence with the consideration of BSMSN Master plan. General Environmental Guidelines as proposed for
BSMSN area, which would be applicable for Sitakundo EZ are furnished in the following section.
General Environmental Guidelines proposed for BSMSN225
“All development within BSMSN must have all of its environmental clearances before any development is
permitted. In addition, the following environmental considerations must be met along with all other mandatory
environmental and green resilient guidelines, rules and regulations:
-Within BSMSN, a minimum of 10% of the total land area must be reserved for open space.
-All roads within BSMSN must have sidewalks, as well as pedestrian and street lighting and must be lined with
a single or double row of trees depending upon the location of the road and how wide the road is. All trees shall
be planted no more than 4 meters apart.
-BSMSN must be designed to be eco-friendly, environmentally responsible, and resilient.
-Solar, renewable energy, recycling, and green technology must be incorporated into the design of the BSMSN
project.
-Within BSMSN, an uninterrupted supply of potable water (maintaining drinking water quality, as per DOE,
GOB or WHO) is mandatory as well as grey water. Water plants, transmission and distribution networks and
wastewater treatment plants must be constructed in accordance to international standards.
-All sewage within BSMSN must be properly managed/treated. Hence a Sewage Treatment Plant (STP), (per
DOE, GOB, and STP guidelines) must be constructed within the zone in accordance with international
standards.
-Land within or outside BSMSN must be reserved for a Municipal Solid Waste Management Treatment
Plant/Disposal / Sanitary Landfill site for the project.
-BSMSN is a plastic-free zone. The use of polythene bag / plastic bag shall be prohibited within BSMSN.
-Solar lighting is mandatory within BSMSN. Hence, street lighting / boundary lighting etc. must be solar
powered.
-To promote energy conservation, the use of energy efficient lights / high efficiency light systems (IE. T5 Tri
phosphor Fluorescent, LED etc.) is mandatory within BSMSN.
-Fire services/emergency services for fire-fighting and medical facilities must be present in each Precinct.
225 Bangabandhu Sheikh Mujib Shilpanagar (BSMSN) Master plan, BEZA, 2020

24 February 2021
PwC 214
-All power sub-stations must be properly fenced and buffered with landscaping to reduce impacts on the road
and improve security of the infrastructure.
-As much as possible, green and resilient technology must be used for all large buildings/plots within BSMSN.
-All water channels within BSMSN must be designed to capture and drain water from the surrounding areas
outside BSMSN into the Bay of Bengal. These channels shall be kept active and shall be lined, planted and
enlarged to become water features/lakes/streams, and water reservoirs/harvesting/collection within BSMSN.
-A rainwater harvesting system designed to capture roof run off from a minimum of 200m2 (or 50% of the
available roof catchment area for roof areas less than 400m2) during regular rainfall events must be
incorporated into each building. The collected rainwater shall be plumbed to supply a seasonally independent
water use. IE. Toilet flushing and landscaping etc.
-Most of the components in BSMSN require environment clearance from DOE, GOB (Orange –B category) as
per The Environment Conservation Rules, 1997 and its amendments.
-No construction / developmental activities within BSMSN shall be permitted until environment clearance is
granted/received from DOE.”
During the Environmental Review study, Sensitive environmental components were identified during the site
visits and qualitative and quantitative techniques has been applied for direct and indirect assessment of impacts
on these components. Table below provides the classification of environmental components.
Table 93: Classification of Social and Environmental Components
Components Sub-component Parameters
PHYSICAL
Water Surface Water and Ground Water Hydrology, Water Quality
Air Air Air Quality
Noise Noise Noise Level
Land Soil Erosion, Soil Quality
ECOLOGICAL
Aquatic Fisheries/Aquatic Species and
Aquatic Ecosystem
Species, diversity, ec0nomic value, density and
species
Terrestrial Vegetation, Wildlife Species and Population
INFRASTRUCTURE
Water Supply Surface/ground water Frequency, quality
Electricity — Generation, Transmission, requirement
Transport Highways/Roads Access, availability, type, utility of each mode
Land Use Rail —
Drainage Air, Water Flooding, drainage
10.6.1. Impact Identification
During the site visit, various environmental sensitive features were identified which may potentially be impacted
by the project at various stages. Identified impacts of the project activities on the environment components are
given below along with the associated activities.
Table 94: Impact Matrix for Proposed Off-site Infrastructure

24 February 2021
PwC 215
S.
No. Activities Impacts
Negative
Impact
Positive
Impact Not
Applicable Short
Term
Long
Term
Short
Term
Long
Term
A Pre-Construction Phase
i Land Acquisition for site,
access road and utility
supply system
Change in land use
pattern
Impact on livelihood
Shifting of Utilities
ii
Site Preparation
Removal of Vegetation.
including significant
mangrove cover
Impact on aesthetic
aspects
Impact on ecosystem
B Construction Phase
i
Development of EZ and
Construction of Boundary
wall, embankment, Access
Road, electrical & water
supply system and
administration building
Loss of Top soil
Soil contamination due to
spillage of material
Surface water
contamination
Air pollution
Noise pollution
Increase in traffic
Un pleasant view
Impact on Health & safety
Social impact
Removal of Trees
C Operational Phase
i
Development of Off-site
Infrastructure, i.e.
Boundary wall,
embankment, access road,
water supply system,
development of
embankment electrical
supply line and
administration building
and operation of
industries
Impact on the ambient Air
Quality
Noise Pollution
Potential surface water
pollution due to industrial
waste discharge
Impact on hydrology due
to construction of long
embankment along the
shoreline
Economic Development
Accessibility
Groundwater abstraction
Potential for land
contamination due to
industrial activities
Increased Run-off
Generation of
Employment
Natural drainage pattern
Impact on drainage due to
construction of long
embankment /super dyke
structure along shoreline

24 February 2021
PwC 216
S.
No. Activities Impacts
Negative
Impact
Positive
Impact Not
Applicable Short
Term
Long
Term
Short
Term
Long
Term
Disturbance to coastal
brackish ecosystem due to
development of
Embankment
10.6.2. Impact on Climate and Meteorology
10.6.2.1. Pre-Construction, Construction and Operation Phase
Proposed project site is located in tropical region where summers are much rainier than winter. Though no
change in the macro-climatic setting (precipitation, temperature and wind) is envisaged due to the project, the
microclimate is likely to be temporarily modified by vegetation removal, the addition of increased pavement
surface and industrial operation which in turn might lead to rise of temperature especially during the daytime.
Mitigation Measures
• Adequate Greenery/Open Space inside the EZ should be recommended
• Plantation shall be carried out at suitable location to minimize impact on micrometeorology
• Precinct J proposed in BSMSN masterplan will be designed to minimize effects of climate change impact
10.6.3. Impact on Land and Natural Drainage
10.6.3.1. Pre-Construction and Construction Phase
Significant part of the proposed site remains submerged in high tide and monsoon. The preconstruction and
construction phase will involve backfilling of the land to a level higher than the High Flood Line (HFL) of the
nearby area with respect to the site to keep the eventual site ground level more than the high flood level ever
recorded. Moreover, to prevent tidal blow, an embankment (super dyke structure) has been proposed along the
periphery of the EZ site. It is expected that this will hinder mixing of fresh and marine water that naturally occurs
in the coastal zone.
The impacts on land due to the project are as follows:
• Dredging and landfilling activity
• Removal of mangrove vegetation
• Construction of super dyke and hindered mixing of fresh and marine water
• Soil erosion due to vegetation clearance and excavation activities
• Topsoil degradation
• Generation of waste (hazardous and non-hazardous) from site clearance, excavations, civil works
and activities of construction workers (general waste and sewage)
• Possible contamination of soil due to potential spills of lubricating oil, fuel oil, concrete etc.
• There could be alteration with the natural water flow pattern of the subject site due alteration of the
natural contours. It may create problem pertaining to water logging, soil erosion, contamination of
soil

24 February 2021
PwC 217
10.6.3.1.1. Soil Erosion
During the pre-construction and construction phase, the site clearance activities including clearing of vegetation,
construction of the structures, labor camps, storage area, toilets will involve removal of topsoil which will result
in slope destabilization and the land will be more susceptible to soil erosion.
The soil erosion will result in the run-off of the silt to surface water affecting brackish marine ecosystem with
increased suspended sediment load and associated nutrients.
Most importantly after landfilling, if the land is be kept for long without further development, it leads to soil
erosion due to lose topsoil.
10.6.3.1.2. Soil Compaction
During construction activities, there will be compaction of soil in the project area due to construction of the
internal access roads, movement of vehicles/ construction machinery and work force movement. The soil
compaction would impact the soil physical properties such as reduction in pore spaces, water infiltration rate and
soil strength etc. The extent of soil compaction is primarily limited to the Project footprint area and surroundings
within 100 m distance. The impact is restricted to the construction phase of the project.
10.6.3.1.3. Landfilling with dredged material
From the site visit it is observed that the proposed site is 6-7 feet below abutting BWDB embankment road and
it falls on the coast of Bay of Bengal. Significant amount of filling material will be required for landfilling. It is
proposed that sand for the backfilling operations will be obtained by dredging from the Bay of Bengal. Dredging
activity is likely to be carried out near the site location or away from site. Dredging activity will have two fold
impacts - firstly as a result of the dredging process itself and secondly as a result of the landfilling of the dredged
material. Impacts during dredging are given in the later section.
In case the soil quality at dumping site is different from the sediment from the dredging sites, the ultimate soil
quality of the disposal site can be affected. The soil used for landfilling should be free of any type of contamination
and have similar characteristics as that of native soil to avoid impacts on the soil quality.
10.6.3.1.4. Waste Generation
The construction waste generated onsite comprises of materials such as excavated soil, rocks, concrete, wooden
pallets, steel cuttings/filings, packaging paper or plastic, wood, metals etc. Municipal domestic wastes consisting
of food waste, plastic, glass, aluminum cans and waste paper will also be generated by the construction workforce
and labor camp site.
The waste generated during the construction phase will also include hazardous waste such as used oil, hydraulic
fluids, waste fuel, grease and waste oil containing rags. If improperly managed, solid waste could create impacts
not only to land but also to local air quality, water quality, and human health. Since the site will be raised above
present level, it is likely that the surface run off from site surrounding area will be drawn to the nearby surface
water system and marine water. From the drainage pattern it is observed that, in general the flow of the
surrounding area will be towards the nearby streams eventually to the sea. If the wastes and raw materials are
poorly managed, it will also be carried away by surface run off which will ultimately contaminate the aquatic
system.
10.6.3.1.5. Soil Contamination
Soil contamination during the construction phase may result from filling activity, leaks and spills of oil,
lubricants, or fuel from heavy equipment and wastewater. Such spills could have a long-term impact on soil
quality but are expected to be localized. Storm water run-off from the contaminated area can pollute the
downstream soil and water quality of adjacent river, other waterbodies and sea.
Spill control measures such as the storage and handling of chemicals and fuel in concrete areas with secondary
containment will be implemented to minimize impacts in the event of a spill.
24 February 2021
PwC 218
The soil characteristics of the native soil may also be changed due to import of soil for filling and levelling purpose.
It is envisaged that the filling activity may impact the native soil due to spillages during transportation of soil and
run-off during filling and compaction.
Apart from the embedded controls to be included in project design, the following mitigation measures will reduce
the negative impacts on soil environment:
Mitigation Measures
• Topsoil should be preserved and should be reused in borrow area or green area development
• Stripping of topsoil should be scheduled as the last mile activity (maintain vegetation cover for as
long as possible) in order to prevent the erosion (wind and water) of soil;
• Care should be taken to minimize percolation of soil used for filling to adjacent rivers and sea during
filling operations. Proper embankment should be provided in the downstream areas to minimize soil
percolation to streams/sea. Proposed super dyke structure will also help to resist soil erosion due to
tidal influence.
• Provision for channels at suitable locations should be kept maintaining flow of marine water towards
the riverine system
• Vegetation should be planned and maintained for slope stabilization and to prevent soil erosion after
construction period;
• The disturbed areas and soil stockpiles should be maintained moist to avoid wind erosion of soil;
• The routes for movement of heavy machinery should be designated to avoid the soil compaction in
other areas;
• Transport vehicles and equipment should undergo regular maintenance to avoid any oil leakages;
designate routes for bringing construction material and outside soil;
• Construction contractor should designate the sites to be used for storage of hazardous wastes
including waste oils, solvents, paint and batteries;
• The Contractor should ensure that no unauthorized dumping of hazardous waste are undertaken and
contractor should dispose of hazardous waste through licensed traders;
• Fuel and other hazardous substances should be stored in areas provided with roof, impervious
flooring and bund/containment wall;
• The soil used for landfilling should have similar characteristics to the native soil and free of any type
of contamination.
• Prior to dredging activity, analyze the soil sample to prevent impacts on the receiving environment
as a result of mismatch in soil characteristics;
• During dredging activity, physical barriers such as silt screen/ curtains should be employed to
prevent the spread of suspended sediments;
• The storm water drainage system shall be designed in synchronization with the existing natural
drainage pattern. The direction of the flow shall be engineered to be same as that of the natural flow
direction of rainwater;
• The construction debris and high silt content of the virgin soil, post excavation, should be kept in a
designated location so as to prevent leaching during monsoons. Storm water drains shall be designed
and shall be connected with rainwater harvesting pits. All the construction wastes and excavated soil

24 February 2021
PwC 219
shall be temporarily stacked on tarpaulin sheet (in order to prevent leaching to groundwater) and a
temporary tin sheet shall be placed on the top to prevent rainwater to maximum extent to carry the
soil and construction wastes to the adjacent aquatic system
• To demonstrate the commitment towards better environment Precinct J is proposed in BSMSN
masterplan will be designed to minimize effects of climate change impact
• It was seen that number of channels /streams are flowing within the proposed site. The flow of these
channels/ streams must be ensured so that it doesn’t erode the adjacent area.
• Adequate drainage system should be planned
10.6.3.2. Operation Phase
10.6.3.2.1. Impact on Soil Quality
After development of economic zone, disposal of industrial domestic and process waste may contaminate land
and soil quality of the area. The impact can be significant and long term in case of uncontrolled discharges.
Improper disposal of waste (hazardous and non-hazardous waste) may degrade soil, water, air quality and
ecology of the area. As per preliminary planning, Non-Metallic Minerals, Chemicals, Petroleum and Petroleum
Products, Automobiles and Heavy Machineries, Iron, steel and metal industries are envisaged for this EZ. These
industries are anticipated to be polluting to some severe extent and hence discharge of the generated sludge,
effluent and solid waste shall be done in a structured manner. The nature of waste likely to be generated in the
EZ are described in the subsequent section.
10.6.3.2.2. Waste Generation
Type of waste likely to be generated from the proposed EZ has been furnished in below table.
Table 95: Waste Generation from various industries
Industry Type Nature of Waste
Non-Metallic Minerals
Ceramics, Cement, Glass etc.
Dust generated from the manufacturing process and eventually collected in
bag house are the significant source of waste
Chemicals
Fertilizers
Waste contains toxic and hazardous components such as free ammonia,
numerous ammonium compounds, phosphate compounds, urea, Spent
Catalyst (Ni; Cu; Zn; Mo; Fe Based), oil, grease and fuel from machinery,
nitrogen, phosphate, potassium, sodium, silica, Sulphur, fluorine etc.
Petroleum and Petroleum
Products
LPG Bottling plant and
downstream products
The bottling activity does not envisage generation/ disposal of any hazardous
or toxic materials. However, effluent may contain paint residue to some extent
Automobiles and accessories
Effluent contains suspended and total solids such as oil, grease, dyestuff,
chromium, phosphate in washing products, coloring; significant amount of
dissolved organics, resulting in high BOD or COD loads
Heavy Machinery, Iron and
Steel and metals
Manufacture of heavy-duty
machines, Iron and Steel
with its varieties and other
Wastewater from iron and steel works contains a considerable amount of oil,
dust, acid, iron and other metals. Blast furnace gas is treated by water spraying
to remove dust. This wastewater contains cyanides, sulfur compounds, phenol,
dust, metal ions, ashes, slags, and ore particles.

24 February 2021
PwC 220
Industry Type Nature of Waste
metals such as aluminum,
copper etc.
Source: PwC Analysis
Beside the abovementioned, common type of waste like Process dry sludge, ETP sludge, e-wastes, scrap batteries,
domestic dry sludge, used oil, etc. are likely to be generated from the industries proposed. All these wastes shall
be segregated depending upon the source of its generation. Sludge generated from STP shall be dried using a
filter-press and the dried sludge could be used as manure. There are authorized vendor for recycling e-waste in
Bangladesh. These vendors are responsible for collecting the e-waste. General practice followed in Bangladesh
regarding the process waste is storage in a dedicated room. As the country doesn’t have a concrete rules and
regulations guiding the process waste disposal, practice to design and execute a localized landfill unit could be
helpful. Like construction phase, the waste generated during operation will also include hazardous waste such as
organic/inorganic residue, used oil, scrap batteries, waste fuel, grease, waste oil containing rags etc. If improperly
managed, waste could pollute not only to land but also to local air quality, water quality, human health and the
ecosystem.
Mitigation Measures
• Provision shall be made for proper storage and disposal of industrial waste by respective industries.
• Special care must be taken by all the industries to avoid any kind of accidental contamination which could
be a threat to the surrounding aquatic ecosystem
• Provisions shall be made to segregate e-waste with rest of the wastes generated.
• Alliance shall be done with e-waste recycling vendor and the segregated e-waste shall be send to the
vendor for recycling purposes
• ETP shall be mandatory for all the industries. Every unit shall have its own ETP unit.
• Based on estimated quantity of sewage and effluent, Sewage Treatment Plant (STP) of 4 MLD and ETP
28 MLD capacity has been proposed respectively.
• A Common waste storage area shall be designated for industrial domestic waste.
• Waste should be segregated at source into hazardous and non-hazardous waste. Further the waste should
be segregated into Biodegradable, recyclable and rejected waste. Recyclable waste should be sent to
licensed traders for recycling and rejected waste should be disposed as per the best industrial practice for
particular waste.
• From the above only bio-degradable waste can be treated in the SW treatment facility; The rate of MSW
generation in the initial stages will be less than the estimated quantity and hence during the initial stage,
the MSW generation rate can be considered as 50% of the estimated quantity; The entire MSW is planned
to be collected and treated in the composting plant within EZ and the rejects shall be disposed to suitable
landfill outside the EZ; Suitable area has been earmarked for development of composting plant within
EZ to handle the MSW generated.
• Industrial waste generated should be stored on sealed surfaces and should be disposed as per the best
industrial practice
• Local environmental bodies shall be consulted for the initiation for the designing and constructing
localized landfill for the disposal of process waste.
• No chemical/hazardous raw material should be allowed to spill over the land and should be operated in
covered systems
• Excessive packaging should be reduced and recyclable products such as aluminum, glass, and high-
density polyethylene (HDPE) should be used where applicable.
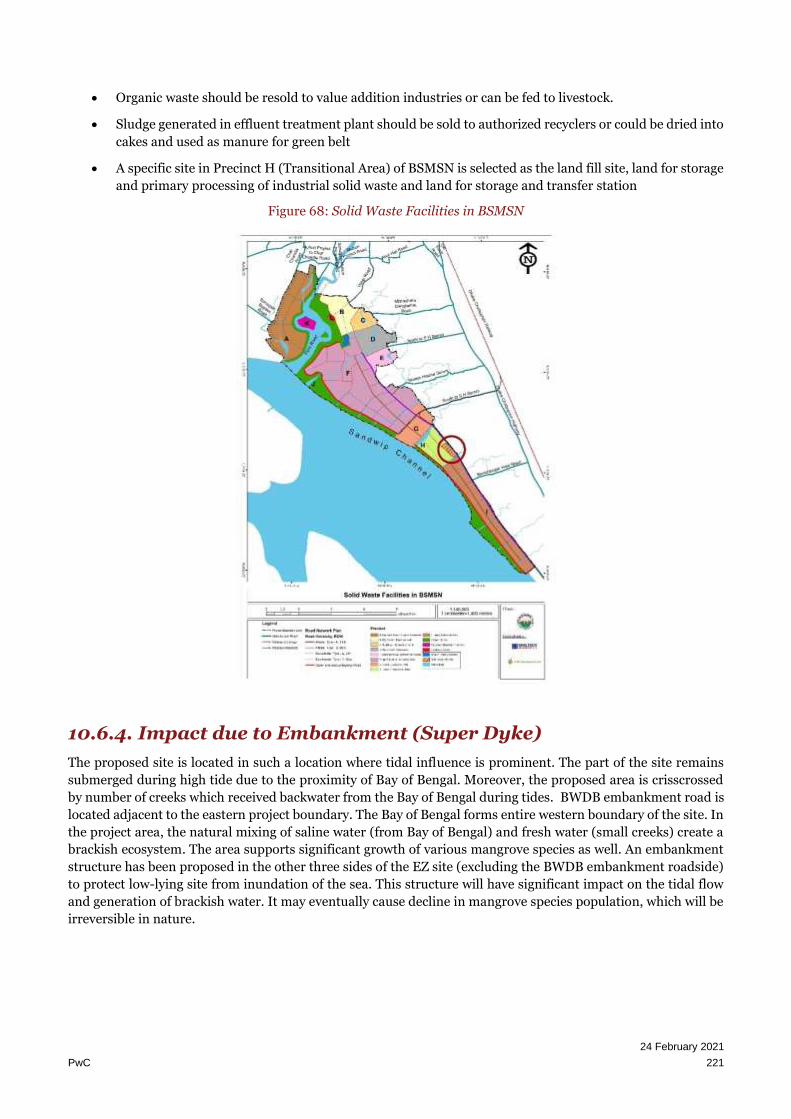
24 February 2021
PwC 221
• Organic waste should be resold to value addition industries or can be fed to livestock.
• Sludge generated in effluent treatment plant should be sold to authorized recyclers or could be dried into
cakes and used as manure for green belt
• A specific site in Precinct H (Transitional Area) of BSMSN is selected as the land fill site, land for storage
and primary processing of industrial solid waste and land for storage and transfer station
Figure 68: Solid Waste Facilities in BSMSN
10.6.4. Impact due to Embankment (Super Dyke)
The proposed site is located in such a location where tidal influence is prominent. The part of the site remains
submerged during high tide due to the proximity of Bay of Bengal. Moreover, the proposed area is crisscrossed
by number of creeks which received backwater from the Bay of Bengal during tides. BWDB embankment road is
located adjacent to the eastern project boundary. The Bay of Bengal forms entire western boundary of the site. In
the project area, the natural mixing of saline water (from Bay of Bengal) and fresh water (small creeks) create a
brackish ecosystem. The area supports significant growth of various mangrove species as well. An embankment
structure has been proposed in the other three sides of the EZ site (excluding the BWDB embankment roadside)
to protect low-lying site from inundation of the sea. This structure will have significant impact on the tidal flow
and generation of brackish water. It may eventually cause decline in mangrove species population, which will be
irreversible in nature.
24 February 2021
PwC 222
10.6.5. Impacts due to Dredging
10.6.5.1. Pre-Construction and Construction Phase
The preconstruction and construction phase will involve backfilling of the land to a level of 6-7 feet to match the
level of BWDB embankment road. It is proposed that sand for the backfilling operations will be obtained by
dredging from the Bay of Bengal. The possible physical impacts due to dredging are as follows:
• Resuspension of bottom sediments, thereby increasing turbidity
• Riverbank erosion
• Dispersion from and accumulation into bottom sediment of toxic substances
• Reduced primary productivity due to decrease in the depth of the euphotic zone
• Impact on habitat and breeding/spawning ground of fishes and other aquatic fauna due to bottom
disturbances
• Temperature alteration
• Increase in nutrient levels
• If the dredged material is polluted, it may affect the ecosystem, and fisheries activities at both dredging
and dumping locations
The extent of impacts due to dredging activity is highly varied and site specific, depending upon a number of
factors shown below:
• Method of dredging and disposal
• Channel size and depth
• The size, density and quality of the material
• Background levels of water and sediment quality, suspended sediment and turbidity
• Current direction and speed
• Rate of mixing
• Presence and sensitivity of animal and plant communities (including birds, sensitive benthic
communities, fish and shellfish)
Mitigation Measures
• Prior to dredging activity, analyze the soil sample to prevent impacts on the receiving environment as a
result of mismatch in soil characteristics;
• During dredging activity, physical barriers such as silt screen/ curtains should be employed to prevent
the spread of suspended sediments;
• Maintain the extent of the turbidity plumes close to the dredging and disposal areas to minimize
impacts on aquatic fauna habitat;
• Visually inspect for aquatic life and terrestrial organisms and stop dredging activity in case of any
organism in the vicinity

24 February 2021
PwC 223
10.6.6. Impact on Air Environment
10.6.6.1. Pre-construction phase
The pre-construction phase will involve site preparation activity for development of EZ, construction of access
road and water supply system which will lead to dust generations and other fugitive emissions. But these
emissions will be localized and have impact for short duration only during site preparation activity.
Mitigation Measures
To minimize the dust generation, water should be sprinkled regularly at the site and low Sulphur diesel should
be used in land levelling equipment to control the SO2 emissions.
10.6.6.2. Construction Phase
Air quality will be impacted from the following sources during the construction phase:
• Fugitive dust emissions from site clearing, excavation work, cutting and levelling work at sites and
access/ internal roads, stacking of soils, handling of construction material, transportation of material,
emission due to movements of vehicles, plying of heavy construction machinery etc.;
• Vehicular emissions due to traffic movement on site and on the connecting roads;
• Exhaust emissions (containing PM10, PM2.5, SPM, CO, HC, NOx, SO2 etc.) from construction
machineries, other heavy equipment as bull dozers, excavators, compactors; and
• Emissions from diesel generator required for emergency power during construction period.
Mitigation Measures
To mitigate the construction impacts, project proponent should have contract agreements with contractors as
well as sub-contractors to ensure implementation of mitigation measures.
• Sprinkling of water at construction site and haul roads
• Transportation of Raw materials in covered trucks
• Construction of barricades between the settlements and the site to minimize travel of fugitive emissions
towards settlements
• Shrub Plantation (native species) on either side of the approach road to mitigate the fugitive dust
emissions
• Construction vehicles and machinery should be regularly serviced and check for pollution control
• Prohibit usage of adulterated fuel in vehicles for running construction equipment and vehicles
• Covering the scaffolding (in case of administration building) to reduce the dust emission in outside
environment
• Speed of vehicles on site is recommended to be 10-15 km/hour which will help in minimizing fugitive
dust emissions due to vehicular movement
10.6.6.3. Operation Phase
Post development of the EZ & setting up of industries, the impacts on the air quality of the area will be from (a)
air emissions from the proposed industries and (b) emissions from increased vehicular movements. The
cumulative effect of the industries proposed in the EZ may have negative impact on the air quality of the site and
the nearby areas to some extent. Nature of Air emissions due to various industrial operations are furnished in the
table below.

24 February 2021
PwC 224
Table 96: Emissions from various industries
Industry Type Nature of Emission
Petroleum and
Petroleum
Products
No significant emission from such industry is envisaged. In general, vehicular emission
may cause pollution to some marginal extent.
Non-Metallic
Minerals
Air pollutants generated during the cement manufacturing process
consist primarily of particulates from the raw and finished materials. The
cement dusts are alkaline with size varying from 5 μm to 250 μm. Beside
these fugitive dust can be generated due to process related & Non-process
related activity.
Oxides of carbon, nitrogen, and sulfur are mainly produced as a byproduct of fuel
combustion for power generation (if captive power plant is established). SO2 is also
produced from oxidation of volatile sulfur present in the kind of limestone used as raw
material
Automobiles and
accessories
Air emissions are envisaged due to burning of various fuels and emission in the process
of fabrication, welding, cutting, blasting, metal plating, surface finishing and painting
process
Heavy Machinery,
Iron and Steel and
metals
Significantly air polluting in nature. Particulate Matter, SO2, NOx, CO emission occurs
from Plant, Melting Shop, Captive Power Plant, Ore Crushing, Screening and
Beneficiation Plant, Slag Crushing Plant and Material Handling areas
Chemicals
Fertilizers
Waste contains toxic and hazardous components such as free ammonia, numerous
ammonium compounds, phosphate compounds, urea, Spent Catalyst (Ni; Cu; Zn; Mo;
Fe Based), oil, grease and fuel from machinery, nitrogen, phosphate, potassium,
sodium, silica, sulphur, fluorine etc.
Source: PwC analysis
Mitigation Measures
• Provision should be made for peripheral green belt all along the EZ boundary and in the buffer zones.
For peripheral green belt, the tree species should be selected such that first inside row is of smaller height,
middle row of tree is of medium height and last row of tree is of higher height so that green belt formed
appears like a cascading canopy.
• Development of thick green belt and organized greens within each industrial plot. Broad-leaved species,
which can absorb pollutants, should be planted as they help to settle particulates with their higher surface
areas along with thick foliage
• Power Generators should be provided with stacks of adequate height (higher than nearest building) to
allow enough dispersion of emission.
• Process emission should be controlled with the installation of adequate air pollution control systems like
Venturi scrubbers, wet scrubbers, Electrostatic precipitator, cyclone separator & bag filter etc. as
applicable to the individual industry
24 February 2021
PwC 225
• All industries should obtain clearance from DoE, Bangladesh as applicable. Air pollution control
measures shall be adopted by respective industries in line with DOE permission
• Air pollution monitoring should be carried out to check the air pollution level.
• Preference of usage of clean fuel like LPG, low Sulphur diesel should be explored
• Odor should be managed at the site using odor suppressant and planting fragrant flowering trees.
• Periodic checkups should be conducted for the workers to reduce exposure levels, rotate the shifts of the
workers.
10.6.7. Impact on Noise Environment
10.6.7.1. Preconstruction and Construction Phase
Pre-construction phase will involve site clearance activity for development of access road and utilities. The site
clearance will involve removal of vegetation and land levelling activities. Operation of different machineries and
equipment for construction activities, running of heavy load traffic for construction materials transportation, and
regular traffic movement may generate noise during construction period. The heavy equipment, machineries,
transportation and earthworks used for the construction activities are the major sources of noise. It is envisaged
that there will be an increase in traffic and thereby in traffic noise impacts on the receptors near the approach
road from the transportation of equipment, construction materials. Towards the southern side there are tourist
traffic to Sitakundo Beach which are likely to be exposed to higher level of noise due to construction activity if
proper mitigation measures are not taken.
Mitigation Measures
The following mitigation measures should be implemented to minimize potential noise impacts during
preconstruction and construction phases:
• Regular maintenance of equipment such as lubricating moving parts, tightening loose parts and replacing
worn out components should be conducted;
• Machinery and construction equipment that may be in intermittent use should be shut down or throttled
down during idle time;
• Acoustic enclosure should be provided for the DG set;
• Equipment known to generate noise strongly in one direction should be orientated so that the noise is
directed away from nearby sensitive receptors as far as practicable;
• Honking should be avoided;
• Construction work should be carried out only during daytime (from 6.00am to 4 pm);
• Machinery to be used should comply with the noise standards prescribed by DoE.
• To deal with noise exposure by construction workers in construction site, pocket guide by OSHA is helpful.
• At individual worker level, the construction contractor should be insisted to provide earmuffs to the workers
exposed to high noise levels.
10.6.7.2. Operation Phase
After development of offsite infrastructure and economic zone, the noise levels may rise due to vehicular
movement, DG set, pump sets, Boilers, mechanical and industrial operations, Auxiliary activities like operation
of water pumps, booster pumps etc. Operations of ventilation units and fans can also add up to the noise
generation. In heavy machinery industries, noise is generated mostly from Turbine, Crushing units, Screening
unit and vehicular movement. High noise levels are generally found in the automated machines. In cement plants
noise levels near the raw material mill, ball mill and compressor may be higher. From other type of industries
24 February 2021
PwC 226
proposed in the EZ the major source of noise generation is vehicular movement, machinery operation and use of
DG in case of power failure. The following mitigation measures are suggested to mitigate the noise pollution
during operation phase.
Mitigation Measures
• Pumps should be fitted in close room, preferably acoustic enclosure to reduce the noise generation
• Green buffer should be developed all along the project boundary and buffer zone. This will help in reducing
the noise level significantly.
• Noise regulators must put a strong mandate and fine on vehicle operators which are not properly maintained,
produce noise (silencers not proper).
• All industries should obtain clearance from DoE before establishing industrial unit and should comply with
all the conditions mentioned in the letter of environment clearance
• All industries should install the new machinery of modern make which complies with the noise standards
prescribed by DoE.
• Job rotations should be practiced for workers in working at noise intensive locations to prevent prolonged
exposure to high noise level as it may lead to deafness, fatigue, headache, nausea and drowsiness. Propose
PPEs must be made compulsory for workers working at locations where the intensity of noise is high.
• Acoustic design with soundproof glass paneling will be provided for critical operator cabins / control rooms
of individual modules as well as central control facilities.
• Proper greasing, periodic checkups for frictionless movements.
• Honking should be regulated within the economic zone
10.6.8. Impact on Water Environment
10.6.8.1. Pre-Construction and Construction Phase
10.6.8.1.1. Impact on Surface Water and Groundwater Resource
Site is situated adjacent to Bay of Bengal on its western side. It is proposed to provide desalination plant in
BSMSN site to meet the water demand of EZ on a long-term basis.
10.6.8.1.2. Impact on Surface Water and Groundwater Quality
An embankment structure has been proposed along the periphery of EZ to protect low-lying coastal areas from
inundation of the sea. This structure will have significant impact on the tidal flow and generation of brackish
water. It may eventually cause decline in mangrove species population, which will be irreversible in nature. The
major source of wastewater generation during construction phase is from the labor camp, which will be
established for project construction activity. There is a potential for contamination of surface and groundwater
resources resulting from improper management of sewage. The storage of used engine oil and lubricants as waste
materials has a potential to create impacts if spillage occurs.
The quality of surrounding water bodies including the bay and creeks could also be affected due to surface runoff
from contaminated soil (soil contamination due to oil/ fuel spillage and leakages), particularly during monsoon
season. The surface runoff carrying the loose topsoil will lead to increased sedimentation in the receiving water
bodies. Contamination to water bodies may also result due to oil spilling during construction activities and/or
surface runoff from the construction site to the adjacent marine system. Thus, measures are required to be taken
to minimize the surface water pollution.

24 February 2021
PwC 227
Mitigation Measures
• Provision for channels at suitable location of embankment to allow the tidal flow (in and out) to some
acceptable volume
• Provision should be kept by the contractor for effective spill management plan
• To avoid excavation activities during rains
• To prevent piling up of excavated soil, raw material and construction debris at site by proper management
and disposal
• Construction of storm water drains along with sedimentation tanks with sandbags as partition as barrier for
direct flow of run off to aquatic system
• Check dams should be provided to prevent construction runoff from the site to the surrounding water
bodies.
• Minimize run-off by using sprays for curing
• Construction of adequate nos. of toilets and proper sanitation system for workers to prevent open
defecation along shoreline/ water supply lines
• Construction of soak pits/septic tanks to dispose-off the domestic wastewater generated from labor camps
to prevent disposal of sewage in surface water bodies. Alternatively collect labor camp sewage and connect
to nearby municipal sewers.
• Proper collection, management and disposal of construction and municipal waste from site to prevent
mixing of the waste in run-off and entering the water bodies
• Use of licensed contractors for management and disposal of waste and sludge;
• Laborers should be given training towards proactive use of designated areas/bins for waste disposal and
encouraged for use of toilets. Open defecation and random disposal of sewage will be strictly restricted;
• To prevent surface and ground water contamination by oil/grease, leak proof containers shall be used for
storage (preferably in paved area) and transportation of oil/grease
• Spill/ leakage clearance plan to be adopted for immediate cleaning of spills and leakages.
10.6.8.2. Operation Phase
To cater the industrial water requirement water from Bay of Bengal after desalination will be used. The
development of economic zone shall lead to the generation of process and domestic effluent. Liquid waste from
the proposed industries will be having potentiality to affect the water quality. The direct discharge of the
untreated process and domestic effluent waste will lead to impacts in the surface water quality. Also, it is
anticipated that surface run-off may significantly increase post development of economic zone which may impact
surface water quality.
Following measures should be adopted during operation phase to minimize impacts of development of Economic
zone on water quality.
Mitigation Measures
• Each industry should obtain consent of DoE Bangladesh before construction and operation and should
comply to the conditions laid by them
24 February 2021
PwC 228
• The Industry should also obtain the consent of the water abstraction limit from DoE, Bangladesh.
• No leachate, wastewater and waste material should be stored in pervious unlined area/pond.
• Efficient Rainwater Management Plan will be adopted to reduce the impact due to surface runoff
• ETP shall be mandatory for all the industries. Every unit shall have its own ETP unit.
• Each industry should treat the effluent and sewage generated by them so as to achieve zero discharge and
no untreated effluent should be discharged into any water body
• Sludge generated in effluent treatment plant should be sold to authorized recyclers or could be dried into
cakes and used as manure for green belt
• A water balance between the abstracted water and the water diverted for process purposes and domestic
purpose shall be developed. Based on the volume of the process and domestic waste, ETP and STP shall be
designed.
• Monitoring of surface and ground water quality should be done. Analysis of the process wastewater should
also be done on regular basis to check efficiency of ETP and STP.
• The effluent treated process wastewater shall be analyzed, and the analyzed parameter should be well below
the Bangladesh Standard (ECR, 1997).
• Rainwater harvesting structures should be proposed
• Each industry should practice rainwater harvesting to minimize the water consumption and reduce run-off
from the site
10.6.9. Impact on Biodiversity
The preconstruction and construction phase will involve backfilling of the land and vegetation cover including
precious mangrove species will be cleared. The proposed site encompasses acquisition of 1358.52 acres (57.4%
of total EZ) of land with planted mangrove vegetation by the Department of Forest, Bangladesh. Material for
backfilling will likely be dredged from Bay of Bengal. An embankment structure has also been proposed along the
periphery of EZ zone to protect low-lying coastal areas from inundation of the sea. As a result of these, following
impacts on biodiversity is envisaged
• Dredging- Impact on habitat and breeding/spawning ground of fishes and other aquatic fauna due to bottom
disturbances. Affect bottom dwellers; the Benthos are likely to be majorly affected. Possibility for loss of
wildlife
• Site preparation- Vegetation cover including significant Mangrove cover will be lost from the area. The loss
will be irreversible in nature. Various Avifauna, Herpetofauna, Pisces, Arthropods dependent with on the
intertidal Char Land, Mangroves and other vegetation for various reason like shelter, basking, Hunting
resting will be affected.
• Construction of Embankment- Almost in the entire project area, the natural mixing of saline water (from Bay
of Bengal) and fresh water (from small creeks) creates a brackish ecosystem. The proposed dyke may act as
a physical barrier and will have significant impact on the natural tidal flow. This will affect creation of
brackish water which may eventually cause decline in mangrove population in the area. It will also hinder the
movement of aquatic species specifically fishes which flows in and out in the freshwater stream during high
tide and low tide respectively.
• Contamination- Accidental spillage, poor management of waste may contaminate the water, eventually
aquatic life
24 February 2021
PwC 229
• Once the site is developed on proposed land, which is currently being used as habitat by various species, will
be lost. It is envisaged that, during operational period very limited diversity will be found in the EZ area. Poor
waste-effluent-sewage management, mishandling of raw material, accidental spillage may contaminate the
river as well as marine ecosystem. This kind of occurrence can threat wildlife of a vast area of the EZ
surrounding. According to forest department, the area is frequented by migratory bird species in the winter
season. Therefore, proper mitigation measure is essential.
Mitigation Measures
Following measures must be taken as a compensatory act and an effort to negate the impact on biodiversity-
• Provision for channels at suitable location of Embankment to allow the tidal flow (in and out) to some
satisfactory volume
• Plantation on the buffer zones as shown in the master plan and monitoring of its survival
• Effort to plant mangrove species on the Char Land which is likely to be formed on the outer periphery of
proposed super dyke
• Wildlife awareness program among the workers (during preconstruction, construction and operation
phase) should be conducted. Workers should report sighting of any uncommon species to the
environmental expert, who immediately should inform the incidence to local forest/wildlife authority/
conservationists
• Strict instruction to the workers must be passed on, so that they do not harm-catch-kill any wildlife or cut
down trees for any reason
• Awareness program on wildlife conservation among local community should be conducted so that they can
also feel the necessity for conservation of wildlife of the area
• Emission, effluent and waste must comply to GoB standard norms
• No waste shall be discharged in water bodies
• Accidental spill management plan should be developed
• No infrastructure development activities shall be encouraged close to the river/seashore line
• A half-yearly ecological assessment (preferably in winter and monsoon) during preconstruction,
construction, operation phase should be conducted through specialists to record chronological trend of
biodiversity in the project area surrounding.
• In BSMSN Masterplan, proposed Precinct J will be comprised of passive/active open space and
conservation/forest areas.
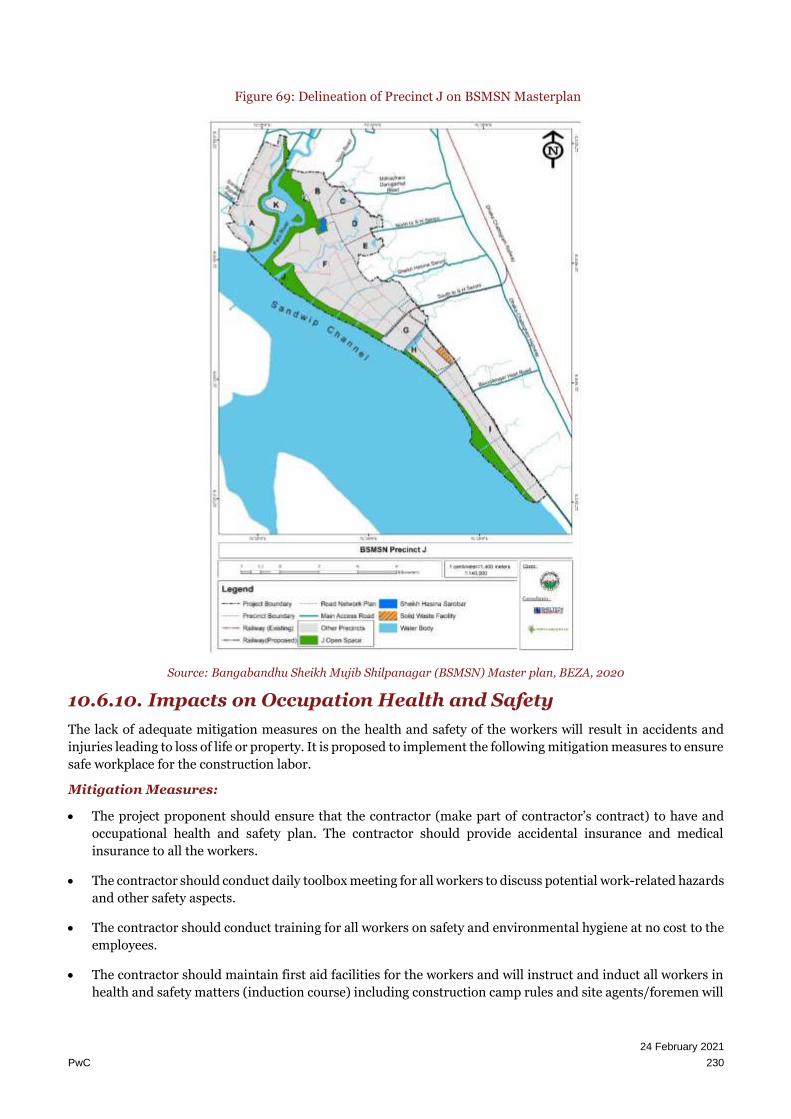
24 February 2021
PwC 230
Figure 69: Delineation of Precinct J on BSMSN Masterplan
Source: Bangabandhu Sheikh Mujib Shilpanagar (BSMSN) Master plan, BEZA, 2020
10.6.10. Impacts on Occupation Health and Safety
The lack of adequate mitigation measures on the health and safety of the workers will result in accidents and
injuries leading to loss of life or property. It is proposed to implement the following mitigation measures to ensure
safe workplace for the construction labor.
Mitigation Measures:
• The project proponent should ensure that the contractor (make part of contractor’s contract) to have and
occupational health and safety plan. The contractor should provide accidental insurance and medical
insurance to all the workers.
• The contractor should conduct daily toolbox meeting for all workers to discuss potential work-related hazards
and other safety aspects.
• The contractor should conduct training for all workers on safety and environmental hygiene at no cost to the
employees.
• The contractor should maintain first aid facilities for the workers and will instruct and induct all workers in
health and safety matters (induction course) including construction camp rules and site agents/foremen will
24 February 2021
PwC 231
follow up with toolbox talks on a weekly basis. Workforce training for all workers starting on site will include
safety and environmental hygiene.
• Fencing on all areas of excavation greater than 1m deep and sides of temporary works should be observed.
• Workers should be provided with appropriate personnel safety equipment such as safety boots, helmets,
gloves, protective clothes, dust mask, goggles, and ear protection at no cost to the workers.
• Reversing signals (visual and audible) should be installed on all construction vehicles and plant.
• Contractor should be responsible for evacuation injured person to the nearest medical center
• Pertinent H&S trainings should be provided to all the workers with respect to hazards linked to the activities.
Additionally, the workers will be informed of precautions to be taken to avoid impacts to the local community;
• Monitoring of the PPE usage can be strengthened, in that, a mechanism can be adopted whereby defaulters
receive a warning on non-usage and stringent actions can be taken on subsequent offences;
• Maintain H&S records of occupational H&S incidents, accidents, diseases and dangerous occurrences
• The contractors should ensure H&S standards of labor camps. The labor camps will be established in the
proposed site area. Additionally, the representative of project proponent should conduct random spot checks
to determine any issues related to improper waste disposal or the living conditions in these camps (i.e.
presence of secure shelter and flooring, number of persons per room, number of toilets for the manpower,
water availability etc.);
• Strong protocols should be built as part of contractual obligations around zero tolerance of child labor or
harassment of women workers and even health and safety aspects. These should also be monitored by
supervision and monitoring team.
• Individual industries should also adopt best practice as per the industry standards for proper implementation
of occupational health and safety.
10.6.11. Flood and Cyclone Risk
The project site is located adjacent to Bay of Bengal. Proposed site area falls under Cyclone and Flood Risk zone.
It is recommended to prepare a proper emergency preparedness plan for the project to combat sudden strike of
cyclone.
10.6.12. Sanitation and Disease Vectors
Potential sanitation and impacts from disease need to be controlled by maintaining hygienic conditions in the
EZ area throughout the operational phase as well during construction by implementing appropriate social and
health programs for the Project. BEZA should ensure that improvements are made to site sanitation and should
implement the mitigation measure below for all operational activities and also that the contractor (during
construction phase)/ industries (during operation phase) ensures that:
• Measures to prevent malaria should be implemented by installation of proper drainage to avoid water
stagnation, etc.
• Standing water should not be allowed to accumulate in the drainage facilities or along the warehouse sides
to prevent proliferation of mosquitoes.
• Temporary and permanent drainage facilities should be designed to facilitate the rapid removal of surface
water from all areas and prevent the accumulation of surface water ponds.
• Malaria controls should be implemented in line with social plans for the Project.
24 February 2021
PwC 232
• HIV/AIDS awareness and HIV-AIDS education and prevention program should be implemented in line
with social plans under the social development work stream.
10.7. Stakeholders’ Consultations
This section provides the stakeholder identification and analysis as well as a brief understanding of the
engagement process for the project. “Stakeholder Consultation” refers to the process by which the concerns of
local affected persons and others who have plausible stake in the environmental impacts of the project or activity
are ascertained with a view to taking into account all the material concerns in the project or activity design as
appropriate. It is highly desirable for all key stakeholders to arrive at a consensus on sensitive features, impacts
and remedial actions. Stakeholder identification was done by examining the potential impacts of the project in
terms of:
• Who may be affected directly (project affected people);
• Which agencies might have responsibility for the impact management;
• Which other organizations might have an interest in monitoring proponent activities or have local
knowledge to contribute; and
• Which private/non-government sector entities might face financial and social hardships if the predicted
impacts occur?
The stakeholders identified in the project comprise of project impacted people, project beneficiaries, various
government officials.
The main objective of the consultation process is to minimize negative impacts of the project and to maximize
the benefits from the project to the local populace. The objectives of public consultation as part of this project
are:
• Promote public awareness and improve understanding of the potential impacts of proposed projects
• Identify alternative sites or designs, and mitigation measures
• Solicit the views of affected communities / individuals on environmental and social problems
• Improve environmental and social soundness
• Identify contentious local issues which might jeopardize the implementation of the project
• Establish transparent procedures for carrying out proposed works
• Inform the affected populace about the entitlement framework and to settle problems with mutual
consent
• Create accountability and sense of local ownership during project implementation; and
• To obtain information on baseline environment
10.7.1. Methodology of Stakeholders Consultation
Different techniques of consultation with stakeholders were used during project preparation, viz., in-depth
interviews, public meetings, group discussions etc. to understand the socio-economic profile of the community
and the affected families, baseline environment, environmental/social concerns etc.
A two-fold Stakeholder Consultation Meeting (SCM) will be carried out during the Environmental and Social
Review study. In this regard, the SCMs were conducted firstly with the primary and secondary stakeholders and
later, affected persons within the occupation were consulted through Focused Group Discussions (FGD). The
Focused Group Discussions (FGD) were carried out with different groups at the proposed EZ area. PWC
personnel discussed about the future developments and benefits to the community due to the development of
the EZ.

24 February 2021
PwC 233
10.7.2. Level of Consultations
Public consultations in the form of institutional and focused group discussions were carried out in the months of
July 2019 till August of 2020. The types of consultations done with various participants using various tools
including, interviews with government officials, focused group discussion etc. are presented in the table below.
Table 97: Types of consultations
Level Type Key Participants
Institutional Stakeholder Meeting Various Govt. Officials
Community Focused Group Discussion PAP, marginalized people
10.7.3. Institutional Stakeholders Consultation
Date of Meeting: 23 July 2019
Location of Meeting: UNO Office, Sitakundo, Chattogram
Officials Met:
Name of Person Designation Contact
Details
Date of
Consultation
Mr. Milon Ray Upazila Nirbahi Officer 01837711450 23 July 2019
Sayed Nazmul Haque AC Land, Sitakundo 01710272081 23 July 2019
Mr. Shafkat Ryad UAO (in-Charge) Sitakundo 01751778154 23 July 2019
Mohammad Mamun Upazila secondary Education
Officer 01817021257
23 July 2019
Mr. Raseduzzaman Sub-Assistant Engineer, DPHE 01741288180 23 July 2019
Dr Shajalal Moh.
Younus
Upazila Livestock Officer
(In-Charge) 01843531181
23 July 2019
Shamim Ahmed Upazila Sr. Fisheries Officer 017777595728 23 July 2019
Eng. Nasir Uddin Upazila Engineer, LGED 23 July 2019
Salient Points of Discussion
At the onset, the officials from Upazila Nirbahi Office, Sitakundo welcomed the idea of developing
economic zone in the region. Discussions were held on various developmental aspects of the
proposed EZ like land acquisition status, utilities, rehabilitations and resettlement issues, etc.
The discussion was concluded by a visit to the project site and nearby sub-station to gain an on-
ground understanding of the various issues. Some of the key features discussed were as follows:
• It was understood that the site area is 1921.44 Acres and is presently used by to locals grow
some crops and vegetables in some parts of the proposed site.226
226 Later revised to 2368.57 acres based on consultation with AC Land office in October 2020.

24 February 2021
PwC 234
• During the course of the visits it was observed that nearest trunk connectivity for this
project site is Dhaka-Chittagong Highway (N1), which is at a distance of 8 km from the
northern most point project site.
• The proposed site is adjacent to the coastline of Bay of Bengal and has intermittent streams (khals, bils
etc.) passing through it which are not navigable in nature
• Bibirbazar land port, which is also operated by a private operator is situated at a distance
of around 113 km from the site.
• Steel, Textile, Chemical (lubricants), Cement, LNG, Pharmaceuticals and Jute mills are the currently
operating industries in Sitakundo.
Date of Meeting: 17 October 2020
Location of Meeting: UNO Office, Sitakundo, Chattogram
Officials Met:
Name of Person Designation Contact
Details
Date of
Consultation
Mr. Milon Ray Upazila Nirbahi Officer 01837711450 17 Oct 2020
Rashed Tanjir (current
AC Land) AC Land, Sitakundo 01678142509
17 Oct 2020
Faruque Ahmed Range Officer, Baraidala Range, Forrest
Department 01751778154
17 Oct 2020
Abul Kalam Azad Range Officer, Upakulio Range, Forrest
Department 01712730350
17 Oct 2020
Salient Points of Discussion
Continuation to the discussion started in July 2019, a follow-up meeting was held with the
officials from UNO office, AC Land and Forest Department. Some of the key features discussed
were as follows:
• It was understood that the site area is revised to 2368.57 Acres and is presently used by to
locals grow some crops and vegetables in some parts of the proposed site. The proposed
site encompasses 1358.52 acres (57.4% of total EZ) of land with planted forest by the
Department of Forest, Bangladesh.
• According to Upakulio Range Officer, the forest plantation contains plant species like Kewra, Baine,
Kakra, Sundori, Goran, Gewa and other plants like Hargoza (Shrup species). Animal species like deer,
gui shap and pigs are also there.
• According to Upakulio Range Officer, the land is owned by Forest Department and the mangrove species
were planted in the 1960’s. Development of the EZ will result in loss of mangrove species. However,
considering national interest such project may be undertaken. He also opined that any char (alluvial land)
which may form after the development of embankment should be replanted with mangrove species.
There are number of small creeks in the EZ location, which gets backwater from tidal flows and rain. The
flow of these streams should be maintained by the project to avoid water logging in the adjoining areas.

24 February 2021
PwC 235
10.7.4. Focused Group Discussions (FGD)
The Focused Group Discussions (FGD) were carried out with different group at the proposed EZ area on 19-10-
2020. PwC personnel discussed about the future developments and benefits to the community due to the
development of the EZ. The FGD was carried out in presence of local farmers, Business group, local elites and
youth group. Locals from very adjacent villages near Guliakhali Sea Beach and Modyo Bhaterkhil, participated in
the discussion. The details of the Focused Group Discussions are furnished below. The record of attendees has
been attached in Annexure-2.
Table 98: Details of Focus Group Discussions
Location: Guliakhali Sea Beach, Sitakunda, Chattogram
Date: 19 August 2020
Relevant
Stakeholders Issues
Suggestion/Demand from
participants
Remarks
Local Farmer
Group & Small
Business
residential
settlements (16
participants)
• Lack of development
in the area
• Loss of tourism and
related businesses
• The participants welcomed the
project initiative taken by
BEZA. They cited poor road
condition in the access roads
connecting the project area
with the main national
highway. Since, this is a tourist
area – local experience traffic
congestion during weekends
and holidays due to influx of
tourists by large numbers.
They expect that the project
would improve and widen the
roads.
• Sitakundo Beach attracts 200-
500 tourist every day and on
weekends or holidays more
than 1000 tourists come to
enjoy the sceneries. The beach
is located towards the
Southern boundary of the
project. There are some 30-50
businesses adjacent to the
project site the including
restaurants, shops and
different vendors. Some 300
families are directly or
indirectly dependent on
income from businesses
catering to the tourists i.e.
shops, restaurants, boat
services, etc. The participants
have demanded that Sitakundo
Beach should not be acquired
by the project.
• The access road to the project
site should be widened and
improved by the project.
• The project should avoid
Sitakundo Beach from
acquisition to preserve the
influx of tourists and
associated businesses.

24 February 2021
PwC 236
Relevant
Stakeholders Issues
Suggestion/Demand from
participants
Remarks
• Waste
Management
issues
• Preferential
Employment
Opportunities
• Security Concerns
• The participants were
concerned about potential
waste discharge into the sea
and nearby areas.
• The project area has number of
pisciculture projects (about 10-
50). Most of the projects are on
government lands. Residents
of nearby villages are
employed by these projects.
They will lose employment due
to the project. Participants
wanted preferential
employment opportunities in
the EZ. The project should
compensate those who loose
employment and income
induced by the development of
EZ.
• They also pointed out on social
safety issues in the meeting.
The safety and security of the
people especially the women
must be assured. There will be
so many migrants during the
process of development of EZ,
hence safety and security
should be ensured.
• The project will take
appropriate waste and
effluent management
measures.
• The nearby residents should
be prioritized for
employment in the EZ. The
loss of employment should
be compensated.
• Male and Female should be
given Equal Opportunity for
Employment.
• Project should take
measures to ensure safety of
local women. The
construction workers
should be housed within the
project area.
Youth Group
(10
Participants)
• Employment
opportunity &
Priority for local
population
• Skills training to
enhance the
competency
• Welcomed the proposal for
establishment of Economic
Zone. They expect the project
shall provide them with
employment opportunities.
• Skill enhancement training
should be given youth group by
industries so that they can
work.
• Employment opportunities to
the local youths should be
offered on a priority.
• The local youth should be
provided with trainings as per
the requirements of the
industries going to be setup in
the EZ and the interest of the
stakeholders

24 February 2021
PwC 237
10.8. Environmental Management Plan and Cost of EMP
The environmental management plan for the proposed EZ should be developed in congruence with the
consideration of BSMSN Master plan. Necessary budgetary allocation should be kept for implementation of EMP
and environmental monitoring for the entire BSMSN area. It is recommended in the BSMSN Masterplan that the
environmental mitigation measures will be a part of the infrastructure systems within Precinct I.
Summary of Environmental Impacts
• Cumulative Impact: Possibility of significant cumulative impact during operation stage due to the occurrence of new EZ sites in the vicinity and upcoming industries of the EZ
• Impact on Creeks: Number of small creeks are present which gets water from tidal flow and rain (crisscrossing the proposed EZ) should be ensured by provision of proper drainage system to avoid flooding and soil erosion in the area
• Irreversible Impact on Mangroves: The proposed project requires clearance of mangrove cover of about 1358.52 acres.
• Impact on Brackish Ecosystem: Due to construction of embankment, the natural mixing of fresh (small creeks) and saline (Bay of Bengal) water likely to be hindered
• Impact on Biodiversity: Loss of mangrove, loss of associated species, impact on habitat
• Loss of Grazing Land: Local people using the land as grazing land for cattle, will be acquired for EZ
• Surface Runoff: The runoff from EZ can draw waste & contaminants from site area (during construction & operation stage) to the sea.

Implementation strategy
The proposed site of Economic Zone at Sitakundo is part of Bangabandhu Sheikh Mujib Shilpa Nagar (BSMSN)which is the flagship project of BEZA. The proposed EZ is part of the precinct I of the BSMSN, which is plannedto house the large-scale industries.
The study team forecasts land offtake for proposed site at Sitakundo to begin in FY 2025 with offtake to becompleted by FY 2040 in base case scenario. As proposed economic site of Sitakundo is located within BSMSNthe study team was informed that the site would follow master plan of BSMSN prepared by Sheltech. Hencedetailed master planning, financial modelling and economic modelling has not been included in this report
Based on demand assessment the study team proposes that BEZA should place the development of the proposedEZ at Sitakundo under high priority. However, proposed site at Sitakundo can be developed only after completionof embankment. Hence, the development of the embankment is crucial for Sitakundo site development.

24 February 2021
PwC 238
11. Annexures
11.1. Annexure 1 – Team of Experts and Project Timeframe
Our team of experts are duly supported by a large team of non-key experts (i.e. support staffs) spread across
different locations in India and in Bangladesh. Some of the non-key experts are placed on-ground to ensure
smooth project coordination.
Figure 70: Team of Experts
Source: Contract agreement executed between PwC & BEZA dated 26th June 2019
In conformance to this engagement’s Terms of Reference, following deliverables will be submitted to BEZA as
per the schedule laid out in the below table –
Table 99: Project timeframe
Deliverables Description Timeline Status
D1 Inception report
30th September
2019 Submitted
Presentation on Inception Report findings 8th November 2019 Completed
D2
Draft interim report (6 sites) 05th February
2020 Submitted
Presentation workshop to discuss findings of the
interim report (6 sites)
03rd and 04th
March 2020 Completed
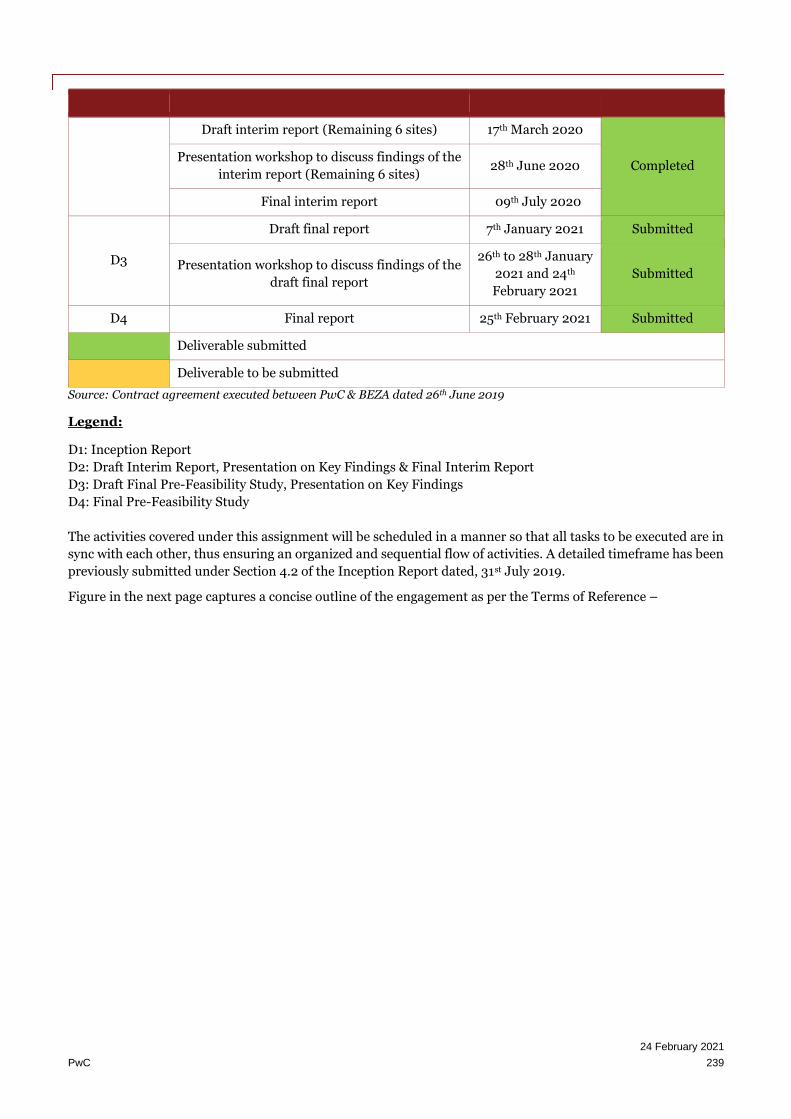
24 February 2021
PwC 239
Deliverables Description Timeline Status
Draft interim report (Remaining 6 sites) 17th March 2020
Completed Presentation workshop to discuss findings of the
interim report (Remaining 6 sites) 28th June 2020
Final interim report 09th July 2020
D3
Draft final report 7th January 2021 Submitted
Presentation workshop to discuss findings of the
draft final report
26th to 28th January
2021 and 24th
February 2021
Submitted
D4 Final report 25th February 2021 Submitted
Deliverable submitted
Deliverable to be submitted
Source: Contract agreement executed between PwC & BEZA dated 26th June 2019
Legend:
D1: Inception Report
D2: Draft Interim Report, Presentation on Key Findings & Final Interim Report
D3: Draft Final Pre-Feasibility Study, Presentation on Key Findings
D4: Final Pre-Feasibility Study
The activities covered under this assignment will be scheduled in a manner so that all tasks to be executed are in
sync with each other, thus ensuring an organized and sequential flow of activities. A detailed timeframe has been
previously submitted under Section 4.2 of the Inception Report dated, 31st July 2019.
Figure in the next page captures a concise outline of the engagement as per the Terms of Reference –

24 February 2021
PwC 240
Figure 71: Outline of the engagement

24 February 2021
PwC 241
11.2. Annexure 2 – Site Photographs
The photographs taken during the site visits have been shown below.
Discussion with UNO Sitakundo Upazila. Discussion with Small Business owners near Sitakundo
Beach.
Discussion with Farmer Groups

24 February 2021
PwC 242
Shops and Small businesses just outside the South East border of the proposed EZ catering to tourists visiting Sitakundo Beach.

24 February 2021
PwC 243
11.3. Annexure 3 – Precinct Plan of BSMSN
The precinct plan is a broad scale policy level land use plan that divides the BSMSN area into eleven suitable
precincts (A to K). Each precinct will have specific or restricted land use. The development of the BSMSN will
follow the policy guideline of these precincts. The following figure shows the proposed precinct plan for the
BSMSN.
Figure 72: Precinct Plan of BSMSN
Source: Draft Report of BSMSN Master Plan IV prepared by Sheltech (Shared by World Bank on 30th June 2020 over mail)

24 February 2021
PwC 244
Table 100: Precinct Plan of BSMSN
Precinct Name Overview Size (in Acres) %
A Residential/Supporting Amenities
Precinct A is comprised of eco-friendly residential neighbourhoods incorporating lush landscaping and natural water features. To support the residents of the neighbourhoods, small health clinics, primary and secondary schools, shopping, convenient retail, and entertainment/leisure areas will be strategically located in the precinct to support daily living.
5266.15 16%
B City Centre/Technology Hub Precinct B will be an international business/IT hub for foreign and domestic investors offering state-of-the-art technology and facilities
1779.84 5%
C Health and Education Centre
Precinct C is an international health and education centre for BSMSN and Bangladesh. It will contain international-level hospitals, universities, primary/secondary schools, research and development facilities, international schools, and appropriate medical and educational support services/facilities
814.30 2%
D Mixed Use/Residential
Precinct D is a mixed-use, residential area comprised of a variety of modern, international level, high-rise apartment buildings with at-grade retail/restaurants. It will have appropriate facilities and amenities such as small scale, convenient retail/restaurants/shopping/entertainment facilities to support the residential community.
2020.39 6%
E Administrative/Institutional
Precinct E is the institutional/administrative centre of BSMSN. It contains all government and BEZA buildings/offices as well as, support services and amenities for the project.
874.08 3%
F Light and Medium Industrial
Precinct F is the light industrial area of BSMSN. It will house only light and medium industry sectors in order to properly separate, buffer and protect the area from heavier, more polluting industries. It will be designed with eco-friendly/resilient infrastructure/utility networks specifically for light and medium industries.
10092.72 30%

24 February 2021
PwC 245
G Port and Logistics3
Precinct G is the port and logistics hub within BSMSN. It will be designed as a multi-modal, transport platform to provide improved logistics for the country. The proposed port is located in this precinct and has a special access road to/from the N1 in order to better facilitate trucks and separate cargo/vehicular traffic.
1798.28 5%
H Transitional
Precinct H is a forest conservation area, where no development is currently permitted. It is comprised of mangroves and similar plant material, which must remain – in accordance with the Forest Department.
1760.45 5%
I Heavy Industrial
Precinct I house the heavy industrial area within BSMSN. It houses the larger industries, which tend to create higher pollution, consume greater amounts of energy and require additional utility systems to mitigate their waste and water.
3956.35 12%
J Open Space
Precinct J will be comprised of passive/active open space and conservation/forest areas. It will be a mix of conservation, new mangrove planting and forests to keep the BSMSN resilient and protected from cyclones or natural disasters
5052.38 15%
K Leisure and Entertainment
Precinct K is a leisure and entertainment destination with parks, gathering spaces, marinas, restaurants, cafes, as well as golf and entertainment facilities such as a water park or outdoor cinemas.
350.89 1%
Source: Draft Report of BSMSN Master Plan IV prepared by Sheltech (Shared by World Bank on 30th June 2020 over mail)
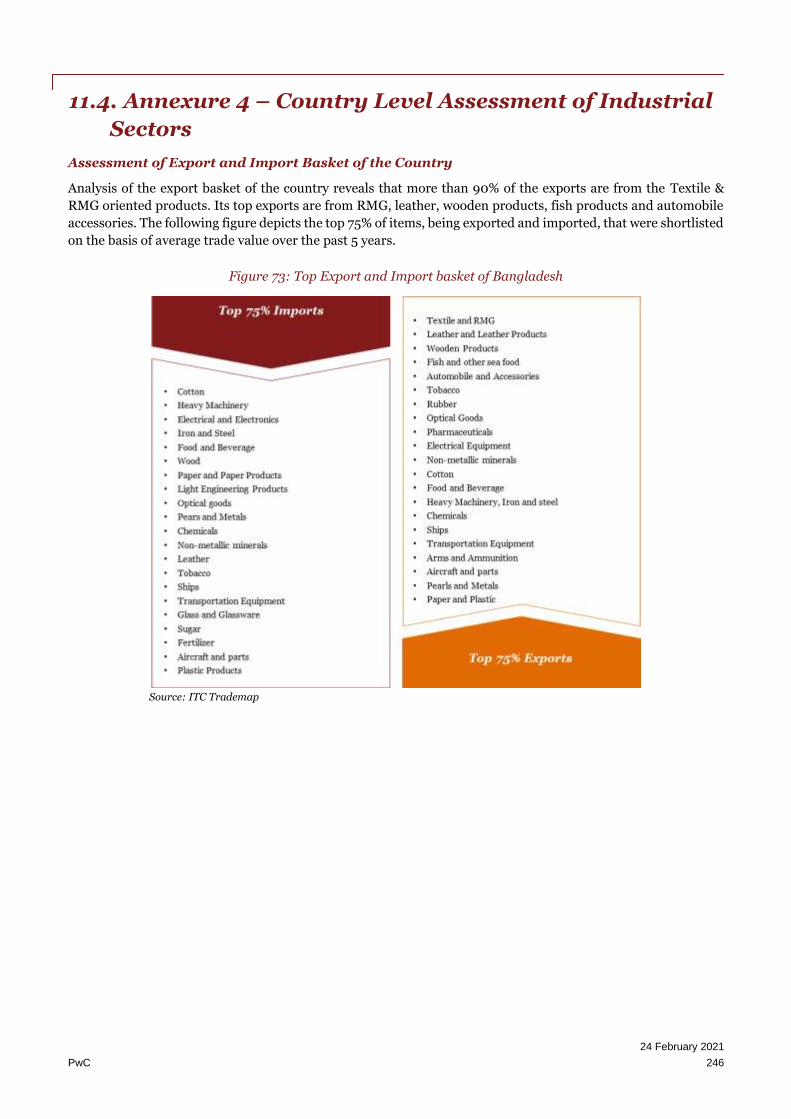
24 February 2021
PwC 246
11.4. Annexure 4 – Country Level Assessment of Industrial
Sectors
Assessment of Export and Import Basket of the Country
Analysis of the export basket of the country reveals that more than 90% of the exports are from the Textile &
RMG oriented products. Its top exports are from RMG, leather, wooden products, fish products and automobile
accessories. The following figure depicts the top 75% of items, being exported and imported, that were shortlisted
on the basis of average trade value over the past 5 years.
Figure 73: Top Export and Import basket of Bangladesh
Source: ITC Trademap

24 February 2021
PwC 247
Assessment of Gross Output of Manufacturing Sector
Figure 74: Gross output across various sectors in Bangladesh (Estimated 2019, In BDT Billion)
#Estimated for 2019
Source: Bangladesh Bureau of Statistics, Survey of Manufacturing Industries 2012
In terms of the specific sectors, it needs to be noted that Textiles and RMG, Food and Beverage, Heavy Machinery,
Iron & Steel, Non-metallic mineral products, Electrical & Electronics, Chemicals, Pharmaceuticals are dominant
in country. Following figure enlists the items that constitute the top 80% of the total output produced in
Bangladesh.
Figure 75: Top 80% of items produced in Bangladesh in terms of gross output
Source: ITC Trade Map
2735
714
94 82 55 69 151380
79
1054
1994 122 69
0
500
1000
1500
2000
2500
3000

24 February 2021
PwC 248
Index of Industrial Production Analysis
Industrial production index measures changes in industrial production and is widely used for the observation
and analysis of the current economic activity. The graph below represents the Industrial Production Index within
Bangladesh over the past 4 years.
Figure 76: Industrial Production Index of industrial sectors in Bangladesh
Source: SMI
Above graph depicts that a positive growth in production is observed in Textiles and RMG, Food and Beverages,
Leather and Leather products, Pharmaceuticals, Electrical and Electronics, Non-metallic minerals, Chemicals,
Light Machinery, Equipment and Furniture over the past 4 years.
Priority Sectors Identified by the Government of Bangladesh
Government of Bangladesh has identified priority sectors to make its economy resilient to possible sector specific
disruptions due to automation, policy changes and increasingly competitive global scenarios.
The following figure illustrates the priority sectors identified by the Government of Bangladesh.
Figure 77: Priority Sectors by Government of Bangladesh
Source: Bangladesh Investment Development Authority
0.00%
10.00%
20.00%
30.00%
40.00%
50.00%
0
300
600
900
1200
Te
xti
les
an
d R
MG
Fo
od
an
d B
ever
ag
es
Ag
ro b
ase
d p
rod
uct
s
Le
ath
er a
nd
Le
ath
erP
rod
uct
s
Pla
stic
an
d R
ub
be
r
Pa
pe
r a
nd
Pa
cka
gin
g
Ch
emic
als
No
n-m
eta
llic
Min
era
ls
Au
to a
nd
Au
tom
ob
ile…
Hea
vy
Ma
chin
ery
,Ir
on
& S
tee
l a
nd
…
Ele
ctri
cal
&E
lect
ron
ics
Pet
role
um
Pro
du
cts
incl
ud
ing
Bo
ttli
ng
Ph
arm
ace
uti
cals
Lig
ht
Ma
chin
ery
an
d E
qu
ipm
ent
&…
CA
GR
Ind
ust
rail
Pro
du
ctio
n I
nd
ex
2015-16 2016-17 2017-18 2018-19 CAGR

24 February 2021
PwC 249
11.5. Annexure 5 – Import Trend of Bangladesh
Table 101: Top 75% Imports of Bangladesh (Figures in USD Million)
Products 2015 2016 2017 2018 2019
Machinery, mechanical
appliances, nuclear
reactors, boilers; parts
thereof
4,792.33 5,245.07 5,953.71 6,824.21 5,800.91
Cotton 7,150.50 5,413.81 6,253.97 6,894.38 5,422.53
Mineral fuels, mineral
oils and products of
their distillation;
bituminous substances;
mineral ...
5,219.95 2,095.46 3,105.25 5,129.26 4,380.85
Electrical machinery
and equipment and
parts thereof; sound
recorders and
reproducers, television
...
2,450.61 3,156.28 3,660.48 4,103.02 3,242.16
Iron and steel 2,407.67 2,074.97 2,120.63 2,775.30 2,909.47
Plastics and articles
thereof 1,795.19 1,923.41 2,160.39 2,457.64 2,208.76
Vehicles other than
railway or tramway
rolling stock, and parts
and accessories thereof
1,143.51 1,676.47 1,976.15 2,077.69 1,747.36
Man-made staple fibers 1,623.93 1,509.96 1,702.43 1,955.58 1,617.90
Man-made filaments;
strip and the like of
man-made textile
materials
1,102.78 956.64 1,071.64 1,391.35 1,415.96
Knitted or crocheted
fabrics 590.15 1,013.30 1,197.23 1,383.06 1,353.37
Cereals 1,521.25 1,147.37 2,248.16 1,727.74 1,239.31
Articles of iron or steel 444.89 594.06 814.38 1,062.22 1,082.47
Oil seeds and oleaginous
fruits; miscellaneous
grains, seeds and fruit;
industrial or medicinal
...
592.23 386.41 531.16 608.82 881.37
Organic chemicals 656.77 596.30 734.91 813.40 835.14

24 February 2021
PwC 250
Products 2015 2016 2017 2018 2019
Aircraft, spacecraft, and
parts thereof 201.34 59.79 150.33 454.95 792.36
Tanning or dyeing
extracts; tannins and
their derivatives; dyes,
pigments and other
coloring ...
587.91 630.57 672.72 767.72 752.98
Optical, photographic,
cinematographic,
measuring, checking,
precision, medical or
surgical ...
400.35 577.74 642.54 680.57 700.44
Edible vegetables and
certain roots and tubers 704.76 628.73 554.85 510.02 684.07
Sugars and sugar
confectionery 837.74 696.75 1,144.73 585.74 666.22
Miscellaneous chemical
products 505.04 546.39 629.25 716.08 650.06
Paper and paperboard;
articles of paper pulp, of
paper or of paperboard
581.33 667.13 681.39 689.27 599.03
Animal or vegetable fats
and oils and their
cleavage products;
prepared edible fats;
animal ...
2,769.62 1,461.94 1,652.26 1,742.63 585.54
Salt; Sulphur; earths and
stone; plastering
materials, lime and
cement
991.99 674.74 783.80 994.90 556.41
Ships, boats and floating
structures 994.16 113.42 234.71 241.95 551.66
Fertilizers 1,255.60 671.00 715.47 832.05 520.09
Natural or cultured
pearls, precious or semi-
precious stones,
precious metals, metals
clad ...
7.92 497.08 629.93 979.17 501.92
Residues and waste
from the food industries;
prepared animal fodder
490.72 419.12 524.97 422.61 495.39
Special woven fabrics;
tufted textile fabrics; 162.76 390.81 391.12 464.10 482.81
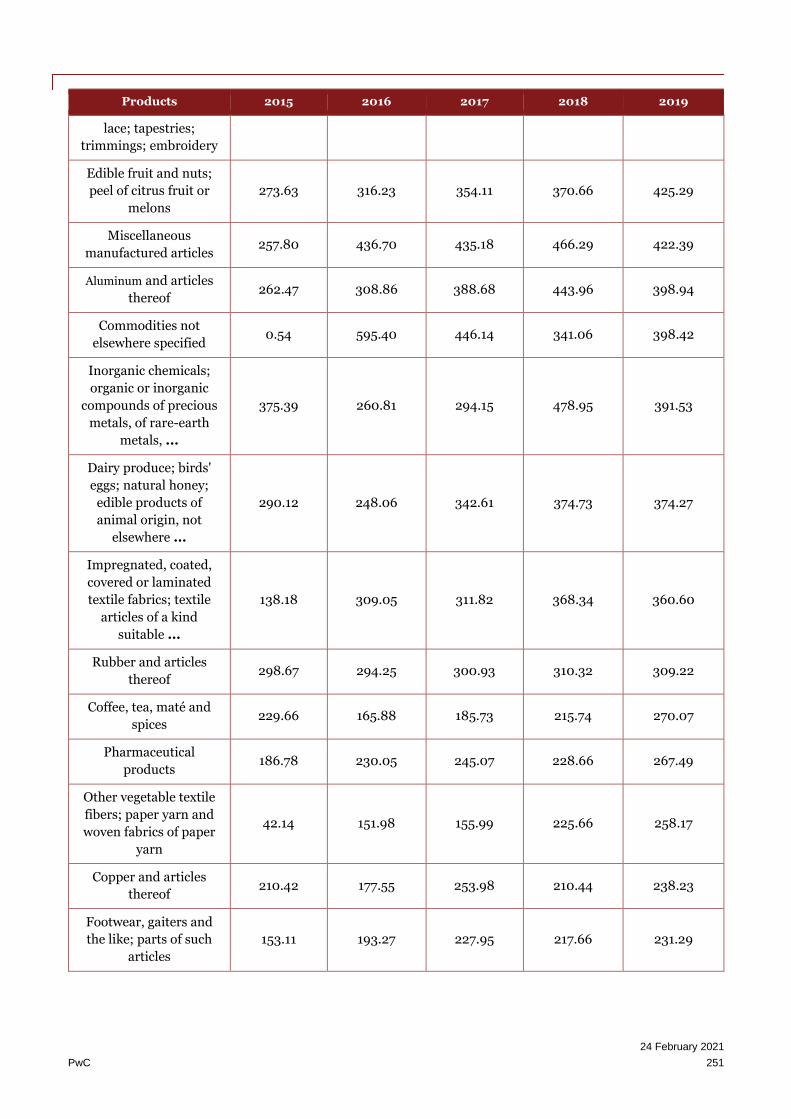
24 February 2021
PwC 251
Products 2015 2016 2017 2018 2019
lace; tapestries;
trimmings; embroidery
Edible fruit and nuts;
peel of citrus fruit or
melons
273.63 316.23 354.11 370.66 425.29
Miscellaneous
manufactured articles 257.80 436.70 435.18 466.29 422.39
Aluminum and articles
thereof 262.47 308.86 388.68 443.96 398.94
Commodities not
elsewhere specified 0.54 595.40 446.14 341.06 398.42
Inorganic chemicals;
organic or inorganic
compounds of precious
metals, of rare-earth
metals, ...
375.39 260.81 294.15 478.95 391.53
Dairy produce; birds'
eggs; natural honey;
edible products of
animal origin, not
elsewhere ...
290.12 248.06 342.61 374.73 374.27
Impregnated, coated,
covered or laminated
textile fabrics; textile
articles of a kind
suitable ...
138.18 309.05 311.82 368.34 360.60
Rubber and articles
thereof 298.67 294.25 300.93 310.32 309.22
Coffee, tea, maté and
spices 229.66 165.88 185.73 215.74 270.07
Pharmaceutical
products 186.78 230.05 245.07 228.66 267.49
Other vegetable textile
fibers; paper yarn and
woven fabrics of paper
yarn
42.14 151.98 155.99 225.66 258.17
Copper and articles
thereof 210.42 177.55 253.98 210.44 238.23
Footwear, gaiters and
the like; parts of such
articles
153.11 193.27 227.95 217.66 231.29
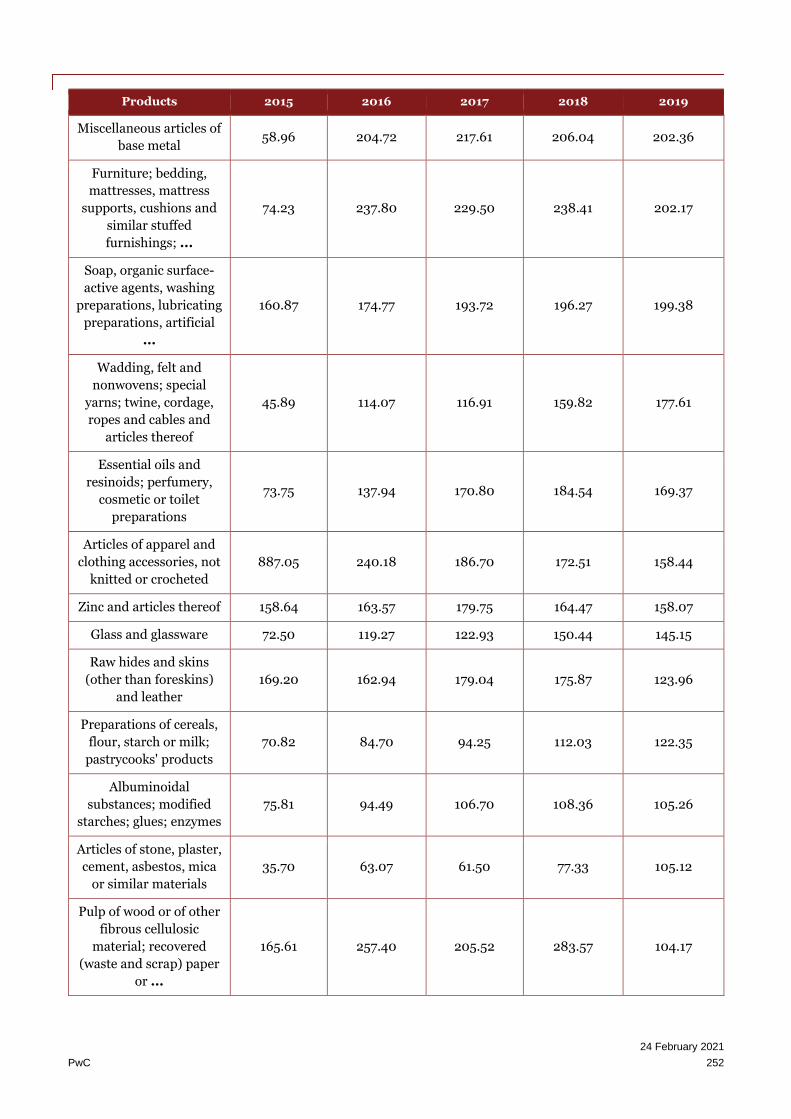
24 February 2021
PwC 252
Products 2015 2016 2017 2018 2019
Miscellaneous articles of
base metal 58.96 204.72 217.61 206.04 202.36
Furniture; bedding,
mattresses, mattress
supports, cushions and
similar stuffed
furnishings; ...
74.23 237.80 229.50 238.41 202.17
Soap, organic surface-
active agents, washing
preparations, lubricating
preparations, artificial
...
160.87 174.77 193.72 196.27 199.38
Wadding, felt and
nonwovens; special
yarns; twine, cordage,
ropes and cables and
articles thereof
45.89 114.07 116.91 159.82 177.61
Essential oils and
resinoids; perfumery,
cosmetic or toilet
preparations
73.75 137.94 170.80 184.54 169.37
Articles of apparel and
clothing accessories, not
knitted or crocheted
887.05 240.18 186.70 172.51 158.44
Zinc and articles thereof 158.64 163.57 179.75 164.47 158.07
Glass and glassware 72.50 119.27 122.93 150.44 145.15
Raw hides and skins
(other than foreskins)
and leather
169.20 162.94 179.04 175.87 123.96
Preparations of cereals,
flour, starch or milk;
pastrycooks' products
70.82 84.70 94.25 112.03 122.35
Albuminoidal
substances; modified
starches; glues; enzymes
75.81 94.49 106.70 108.36 105.26
Articles of stone, plaster,
cement, asbestos, mica
or similar materials
35.70 63.07 61.50 77.33 105.12
Pulp of wood or of other
fibrous cellulosic
material; recovered
(waste and scrap) paper
or ...
165.61 257.40 205.52 283.57 104.17

24 February 2021
PwC 253
Products 2015 2016 2017 2018 2019
Ceramic products 67.75 146.71 116.66 104.72 101.66
Miscellaneous edible
preparations 74.28 88.93 83.37 95.08 97.64
Tools, implements,
cutlery, spoons and
forks, of base metal;
parts thereof of base
metal
54.53 78.60 87.68 88.86 88.85
Toys, games and sports
requisites; parts and
accessories thereof
23.56 64.63 81.59 82.84 83.85
Printed books,
newspapers, pictures
and other products of
the printing industry;
manuscripts, ...
297.23 54.15 87.78 101.50 82.81
Wool, fine or coarse
animal hair; horsehair
yarn and woven fabric
43.29 62.24 60.98 71.32 80.17
Other made-up textile
articles; sets; worn
clothing and worn
textile articles; rags
34.16 59.87 64.88 67.68 71.24
Fish and crustaceans,
mollusks and other
aquatic invertebrates
55.28 42.74 46.49 46.57 68.90
Ores, slag and ash 72.46 30.36 28.86 61.46 59.60
Products of animal
origin, not elsewhere
specified or included
59.81 32.30 28.04 40.49 55.86
Articles of leather;
saddlery and harness;
travel goods, handbags
and similar containers;
articles ...
28.67 104.30 83.60 65.37 51.10
Arms and ammunition;
parts and accessories
thereof
130.36 7.44 25.41 21.38 46.32
Photographic or
cinematographic goods 29.45 40.29 39.51 39.63 45.11
Wood and articles of
wood; wood charcoal 113.80 61.44 70.21 51.84 45.11
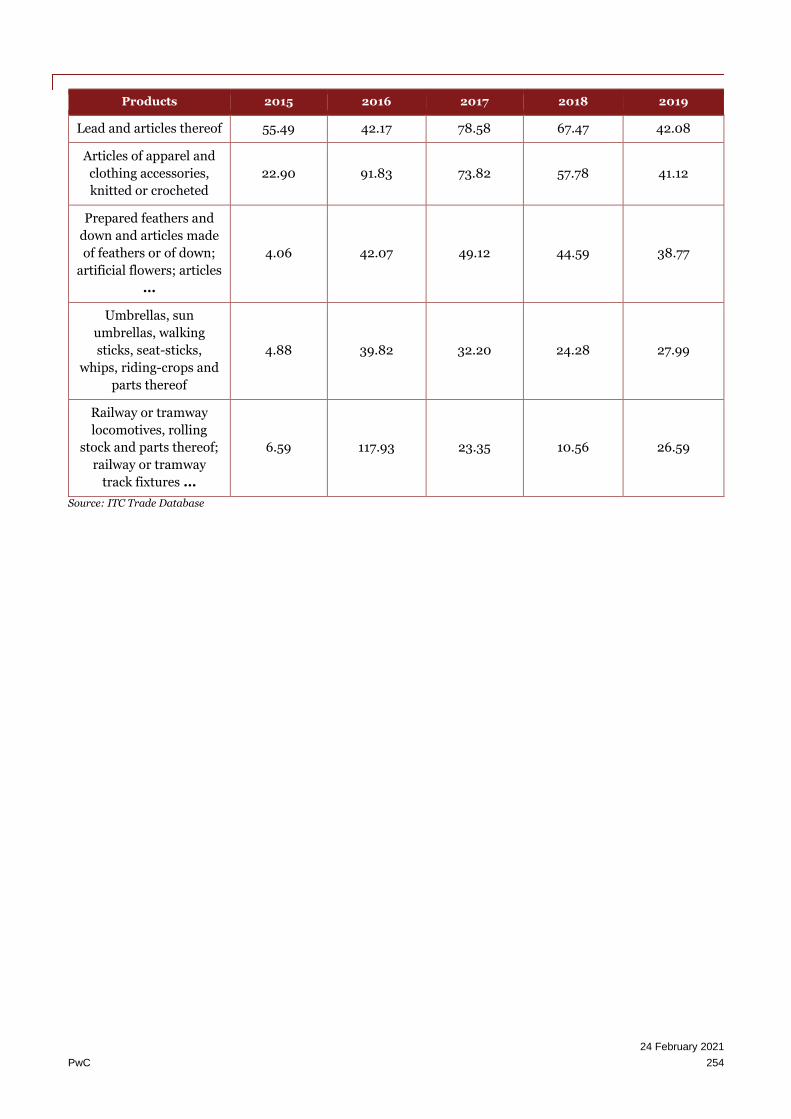
24 February 2021
PwC 254
Products 2015 2016 2017 2018 2019
Lead and articles thereof 55.49 42.17 78.58 67.47 42.08
Articles of apparel and
clothing accessories,
knitted or crocheted
22.90 91.83 73.82 57.78 41.12
Prepared feathers and
down and articles made
of feathers or of down;
artificial flowers; articles
...
4.06 42.07 49.12 44.59 38.77
Umbrellas, sun
umbrellas, walking
sticks, seat-sticks,
whips, riding-crops and
parts thereof
4.88 39.82 32.20 24.28 27.99
Railway or tramway
locomotives, rolling
stock and parts thereof;
railway or tramway
track fixtures ...
6.59 117.93 23.35 10.56 26.59
Source: ITC Trade Database

24 February 2021
PwC 255
11.6. Annexure 6 – Export Trend of Bangladesh
Table 102: Top Exports 75% from Bangladesh (Figures in USD million)
Products 2015 2016 2017 2018 2019
Articles of apparel and clothing
accessories, knitted or crocheted 12,767.10 16,668.99 17,791.37 20,115.53 20,343.41
Articles of apparel and clothing
accessories, not knitted or
crocheted
13,765.23 16,559.78 16,832.96 18,834.03 19,350.13
Footwear, gaiters and the like;
parts of such articles 696.82 894.90 949.66 1,017.42 1,110.00
Other made-up textile articles;
sets; worn clothing and worn
textile articles; rags
818.60 990.73 1,131.16 1,094.95 1,004.95
Other vegetable textile fibers;
paper yarn and woven fabrics of
paper yarn
681.19 788.68 853.45 720.81 603.28
Fish and crustaceans, mollusks
and other aquatic invertebrates 445.01 623.07 636.25 545.33 532.93
Articles of leather; saddlery and
harness; travel goods, handbags
and similar containers; articles
...
293.25 253.73 277.00 309.25 368.31
Headgear and parts thereof 75.63 280.17 300.51 311.30 332.64
Raw hides and skins (other than
fur skins) and leather 298.99 215.76 153.07 175.50 139.79
Plastics and articles thereof 80.22 84.50 95.81 108.51 113.23
Prepared feathers and down and
articles made of feathers or of
down; artificial flowers; articles
...
14.81 58.01 68.17 82.45 108.61
Optical, photographic,
cinematographic, measuring,
checking, precision, medical or
surgical ...
53.47 70.24 87.67 100.72 106.96
Tobacco and manufactured
tobacco substitutes 48.84 91.58 97.62 117.55 99.86
Vehicles other than railway or
tramway rolling stock, and parts
and accessories thereof
130.52 89.51 85.06 82.20 93.93

24 February 2021
PwC 256
Products 2015 2016 2017 2018 2019
Furniture; bedding, mattresses,
mattress supports, cushions and
similar stuffed furnishings; ...
39.82 45.13 63.37 91.08 88.91
Toys, games and sports
requisites; parts and accessories
thereof
26.71 59.09 64.37 92.24 87.89
Animal or vegetable fats and oils
and their cleavage products;
prepared edible fats; animal ...
17.56 10.93 10.75 23.21 86.20
Aircraft, spacecraft, and parts
thereof 14.53 1.51 18.32 43.32 80.13
Commodities not elsewhere
specified 0.51 36.79 72.67 85.33 73.55
Cotton 91.68 24.35 35.51 39.33 66.35
Electrical machinery and
equipment and parts thereof;
sound recorders and
reproducers, television ...
59.52 63.62 62.51 83.75 59.79
Preparations of cereals, flour,
starch or milk; pastrycooks'
products
84.84 35.94 42.47 55.52 58.08
Pharmaceutical products 70.12 90.30 108.43 108.39 57.44
Copper and articles thereof 26.26 24.82 51.01 59.58 53.37
Machinery, mechanical
appliances, nuclear reactors,
boilers; parts thereof
171.26 25.26 40.93 55.99 49.21
Wadding, felt and nonwovens;
special yarns; twine, cordage,
ropes and cables and articles
thereof
29.85 37.27 31.32 32.64 46.39
Ceramic products 36.85 48.64 58.56 61.40 42.32
Inorganic chemicals; organic or
inorganic compounds of
precious metals, of rare-earth
metals, ...
22.43 23.49 17.30 32.83 36.86
Iron and steel 18.91 14.89 23.70 31.27 32.05
Carpets and other textile floor
coverings 19.07 33.53 32.97 32.48 31.79
Beverages, spirits and vinegar 25.27 16.93 22.24 23.89 27.69

24 February 2021
PwC 257
Products 2015 2016 2017 2018 2019
Edible vegetables and certain
roots and tubers 70.25 51.59 56.14 54.82 25.01
Manufactures of straw, of
esparto or of other plaiting
materials; basket ware and
wickerwork
8.25 11.01 14.88 20.10 23.68
Mineral fuels, mineral oils and
products of their distillation;
bituminous substances; mineral
...
178.12 52.21 54.29 25.03 21.61
Coffee, tea, maté and spices 25.70 18.75 24.73 26.61 20.89
Knitted or crocheted fabrics 33.81 8.70 11.06 12.32 20.73
Edible fruit and nuts; peel of
citrus fruit or melons 26.62 26.67 36.86 40.15 17.09
Miscellaneous chemical
products 3.66 6.90 10.54 13.10 17.07
Man-made staple fibers 26.20 16.26 23.43 24.40 15.62
Residues and waste from the
food industries; prepared animal
fodder
3.24 8.00 0.89 7.68 15.13
Oil seeds and oleaginous fruits;
miscellaneous grains, seeds and
fruit; industrial or medicinal ...
17.87 14.84 9.74 10.67 14.32
Salt; Sulphur; earths and stone;
plastering materials, lime and
cement
2.20 13.27 20.48 13.84 13.49
Paper and paperboard; articles
of paper pulp, of paper or of
paperboard
36.00 6.01 14.75 24.35 13.46
Articles of iron or steel 26.89 9.75 6.79 13.76 13.23
Preparations of meat, of fish or
of crustaceans, mollusks or other
aquatic invertebrates
2.34 18.27 13.51 12.04 12.29
Rubber and articles thereof 21.68 9.61 9.44 10.51 12.25
Ships, boats and floating
structures 19.97 18.77 18.59 3.42 12.18
Miscellaneous manufactured
articles 15.30 7.78 10.78 12.68 11.34
Preparations of vegetables, fruit,
nuts or other parts of plants 70.47 30.17 29.34 18.69 10.86

24 February 2021
PwC 258
Products 2015 2016 2017 2018 2019
Cereals 6.05 11.13 8.04 9.90 9.58
Ores, slag and ash 7.74 10.50 9.71 6.05 9.00
Zinc and articles thereof 2.67 4.29 5.87 4.29 8.49
Sugars and sugar confectionery 9.18 12.99 8.32 7.32 7.71
Printed books, newspapers,
pictures and other products of
the printing industry;
manuscripts, ...
0.95 1.75 3.08 18.97 6.84
Organic chemicals 0.70 3.49 3.34 6.17 6.04
Products of animal origin, not
elsewhere specified or included 14.88 2.77 2.69 2.77 5.87
Glass and glassware 1.56 2.85 3.19 2.40 5.08
Vegetable plaiting materials;
vegetable products not
elsewhere specified or included
23.92 0.53 0.33 0.56 4.59
Umbrellas, sun umbrellas,
walking sticks, seat-sticks,
whips, riding-crops and parts
thereof
0.03 3.05 4.46 4.72 4.20
Nickel and articles thereof 0.08 0.45 3.24 2.68 3.97
Tools, implements, cutlery,
spoons and forks, of base metal;
parts thereof of base metal
6.28 2.25 3.00 3.58 3.80
Dairy produce; birds' eggs;
natural honey; edible products
of animal origin, not elsewhere
...
1.67 1.47 0.84 1.70 3.64
Wood and articles of wood;
wood charcoal 4.06 5.67 5.60 6.56 3.53
Natural or cultured pearls,
precious or semi-precious
stones, precious metals, metals
clad ...
5.02 5.17 6.02 4.44 3.46
Cocoa and cocoa preparations 0.39 0.94 1.89 3.07 3.00
Aluminum and articles thereof 1.60 1.81 2.03 14.32 2.78
Miscellaneous edible
preparations 0.25 7.69 5.12 5.57 2.37
Products of the milling industry;
malt; starches; inulin; wheat
gluten
1.62 1.00 1.33 2.55 2.32

24 February 2021
PwC 259
Products 2015 2016 2017 2018 2019
Special woven fabrics; tufted
textile fabrics; lace; tapestries;
trimmings; embroidery
49.34 3.78 5.11 2.49 2.28
Articles of stone, plaster,
cement, asbestos, mica or
similar materials
0.03 1.85 1.56 3.48 2.26
Soap, organic surface-active
agents, washing preparations,
lubricating preparations,
artificial ...
3.04 1.25 1.46 2.30 1.39
Essential oils and resinoids;
perfumery, cosmetic or toilet
preparations
0.63 1.29 1.91 3.85 1.37
Miscellaneous articles of base
metal 0.43 1.39 1.26 1.86 1.29
Source: ITC Trade Database
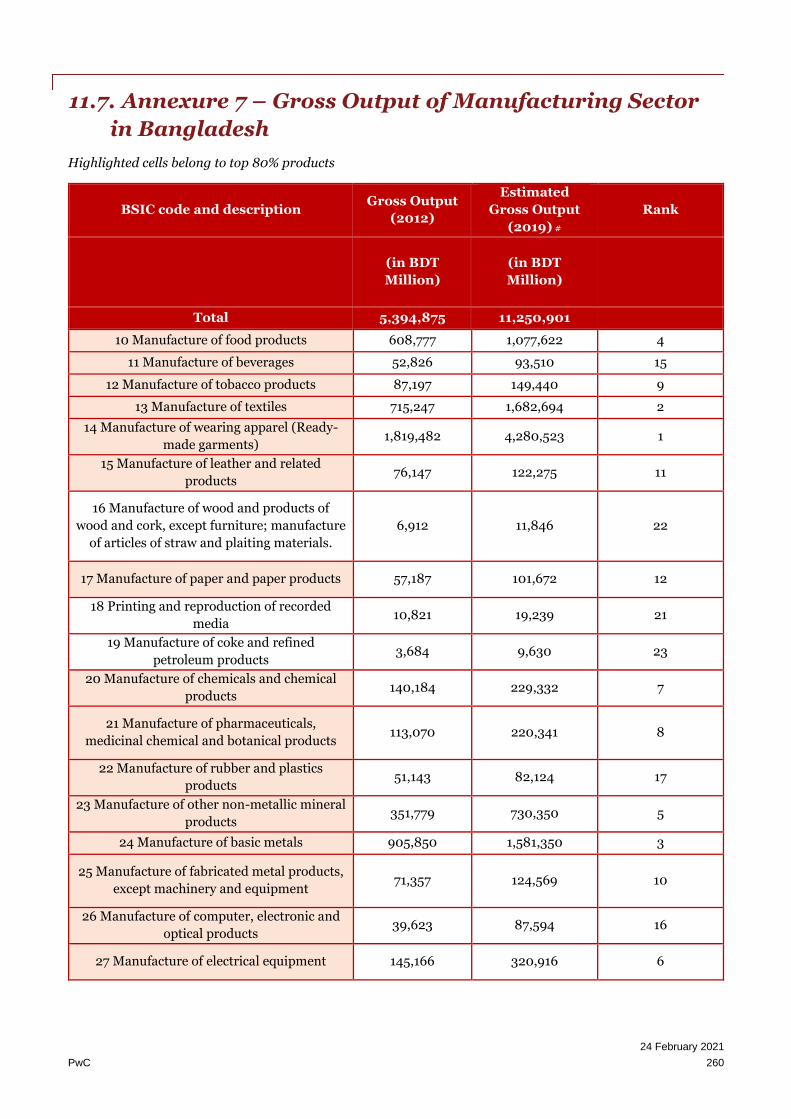
24 February 2021
PwC 260
11.7. Annexure 7 – Gross Output of Manufacturing Sector
in Bangladesh
Highlighted cells belong to top 80% products
BSIC code and description Gross Output
(2012)
Estimated
Gross Output
(2019) #
Rank
(in BDT
Million)
(in BDT
Million)
Total 5,394,875 11,250,901
10 Manufacture of food products 608,777 1,077,622 4
11 Manufacture of beverages 52,826 93,510 15
12 Manufacture of tobacco products 87,197 149,440 9
13 Manufacture of textiles 715,247 1,682,694 2
14 Manufacture of wearing apparel (Ready-
made garments) 1,819,482 4,280,523 1
15 Manufacture of leather and related
products 76,147 122,275 11
16 Manufacture of wood and products of
wood and cork, except furniture; manufacture
of articles of straw and plaiting materials.
6,912 11,846 22
17 Manufacture of paper and paper products 57,187 101,672 12
18 Printing and reproduction of recorded
media 10,821 19,239 21
19 Manufacture of coke and refined
petroleum products 3,684 9,630 23
20 Manufacture of chemicals and chemical
products 140,184 229,332 7
21 Manufacture of pharmaceuticals,
medicinal chemical and botanical products 113,070 220,341 8
22 Manufacture of rubber and plastics
products 51,143 82,124 17
23 Manufacture of other non-metallic mineral
products 351,779 730,350 5
24 Manufacture of basic metals 905,850 1,581,350 3
25 Manufacture of fabricated metal products,
except machinery and equipment 71,357 124,569 10
26 Manufacture of computer, electronic and
optical products 39,623 87,594 16
27 Manufacture of electrical equipment 145,166 320,916 6

24 February 2021
PwC 261
BSIC code and description Gross Output
(2012)
Estimated
Gross Output
(2019) #
Rank
(in BDT
Million)
(in BDT
Million)
28 Manufacture of machinery and equipment
N.E.C. 13,141 22,940 19
29 Manufacture of motor vehicles, trailers
and semitrailers 36,780 101,268 13
30 Manufacture of other transport equipment 36,291 99,922 14
31 Manufacture of furniture 39,685 77,335 18
32 Other manufacturing 11,263 21,948 20
33 Repair and installation of machinery and
equipment 1,134 2,210 24
34 Recycling 129 251 25
#Estimated for 2019
Source: Bangladesh Bureau of Statistics, Survey of Manufacturing Industries 2012
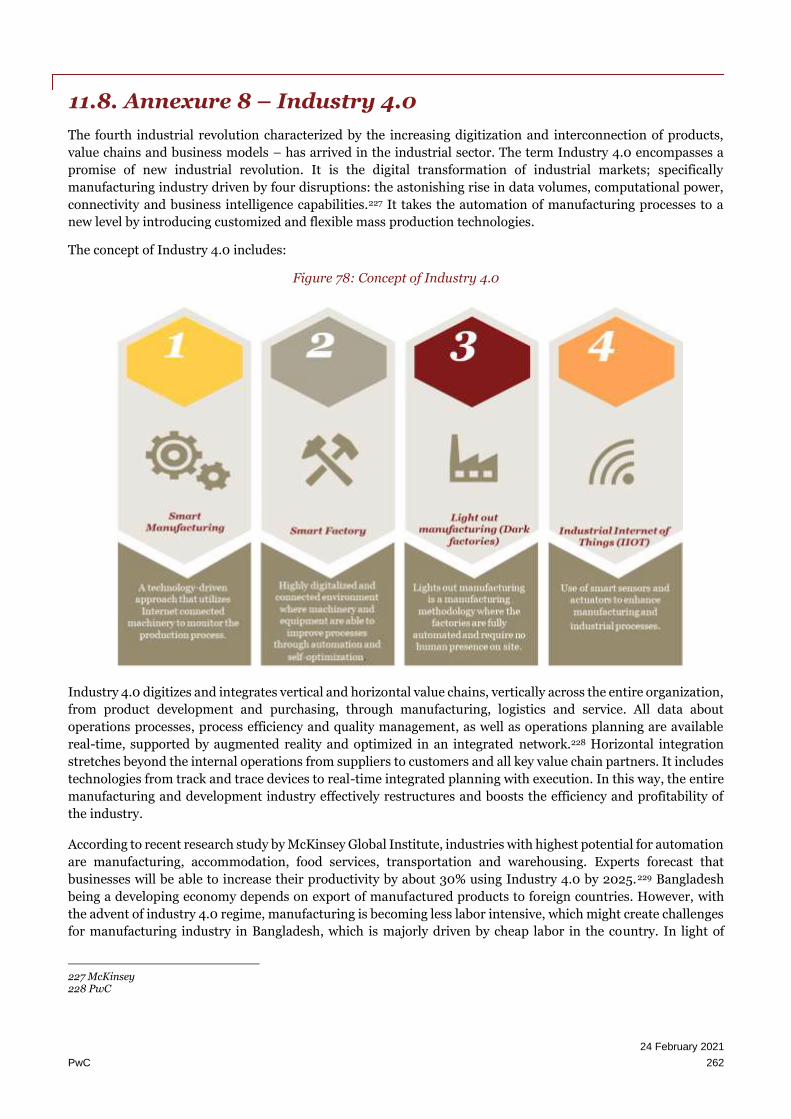
24 February 2021
PwC 262
11.8. Annexure 8 – Industry 4.0
The fourth industrial revolution characterized by the increasing digitization and interconnection of products,
value chains and business models – has arrived in the industrial sector. The term Industry 4.0 encompasses a
promise of new industrial revolution. It is the digital transformation of industrial markets; specifically
manufacturing industry driven by four disruptions: the astonishing rise in data volumes, computational power,
connectivity and business intelligence capabilities.227 It takes the automation of manufacturing processes to a
new level by introducing customized and flexible mass production technologies.
The concept of Industry 4.0 includes:
Figure 78: Concept of Industry 4.0
Industry 4.0 digitizes and integrates vertical and horizontal value chains, vertically across the entire organization,
from product development and purchasing, through manufacturing, logistics and service. All data about
operations processes, process efficiency and quality management, as well as operations planning are available
real-time, supported by augmented reality and optimized in an integrated network.228 Horizontal integration
stretches beyond the internal operations from suppliers to customers and all key value chain partners. It includes
technologies from track and trace devices to real-time integrated planning with execution. In this way, the entire
manufacturing and development industry effectively restructures and boosts the efficiency and profitability of
the industry.
According to recent research study by McKinsey Global Institute, industries with highest potential for automation
are manufacturing, accommodation, food services, transportation and warehousing. Experts forecast that
businesses will be able to increase their productivity by about 30% using Industry 4.0 by 2025.229 Bangladesh
being a developing economy depends on export of manufactured products to foreign countries. However, with
the advent of industry 4.0 regime, manufacturing is becoming less labor intensive, which might create challenges
for manufacturing industry in Bangladesh, which is majorly driven by cheap labor in the country. In light of
227 McKinsey 228 PwC

24 February 2021
PwC 263
Industry 4.0, it is pertinent for countries like Bangladesh, to do away with cheap labor being the primary driver
of competitiveness and focus on infrastructure & logistics, research & development, and technology will be
required to remain competitive in a changed industrial landscape. Therefore, it is imperative to develop the
management of manufacturing and chain productions so that the efficiency would be substantially increased
which is a strong indicator that Industry 4.0 is crucial for Bangladesh to move forward. Bangladesh needs the
adaptation of Industry 4.0 not only to increase the industrial production but also to bolster the overall socio-
economic growth. Additionally, to successfully implement the Industry 4.0 corresponding initiatives towards the
development of human resource is necessary as it requires highly skilled manpower. Hence, the upgradation of
the current educational infrastructure in the country with focus on developing the secondary and higher
education is essential.

24 February 2021
PwC 264
11.9. Annexure 9 – Global Value Chain Concept and
Analysis
Description of the Concept:
The value chain of a project is defined as “the full range of activities that firms and workers do to bring a product
from its conception to its end use” (Gereffi and Fernandez-Stark, 2011)
These days value chains of various products are highly fragmented and are spread across the globe to take
advantage of the unique advantages on offer at different countries for certain specific activities/productions along
the value chains of these products, thereby improving the quality of the product and minimizing the production
cost.
The purpose of using the GVC concept to identify products that Bangladesh can diversify into is explained as
follows – A product with a highly fragmented value chain spread across different countries, offers Bangladesh an
opportunity to participate in its value chain.
For e.g. – Let us say product P1 is manufactured in India, and the various inputs required to produce the product
P1 is imported by India from other countries. Bangladesh being the neighboring countries and with obvious
logistics cost advantage, can attempt to produce one or more of the various inputs that India is importing to
produce P1, given it has the necessary capacity. Using the GVC concept, we will attempt to identify products like
P1 in whose value chain Bangladesh can participate
In order to identify such products with highly fragmented value chains, we will use an index called the GVC
participation index. Higher the value of GVC index, higher is the fragmentation of the value chain of the product.
The GVC index is given by the formula –
FVik –Foreign value added in the export of product k by country i
IVik – Domestic value added by country i in the product k used in the export of third countries
Eik – Gross value of export of product k by country i
Methodology used:
The methodology adopted for identification of new products that Bangladesh can diversify into and export with
an advantage, using the GVC concept is described below systematically
1. Step 1 – Shortlist the countries whose products will be assessed. Neighboring countries and countries
with similar economies are shortlisted, and a list of products is compiled by taking the union of the set of
products for each country.
2. Step 2 – A threshold value of GVC participation index is selected. The GVC index value which is more
than 70% of all the GVC values in the GVC table is selected as the threshold value
3. Step 3 – Using these threshold value, a score is assigned to each product by counting the number of times
the GVC value associated with the product for each country is more than the threshold value
For e.g.
Country 1 Country 2 Country 3 Country 4 Country 5 Country 6 Score
GVC value
for Product
P1
3 4 2 2 4 2 3
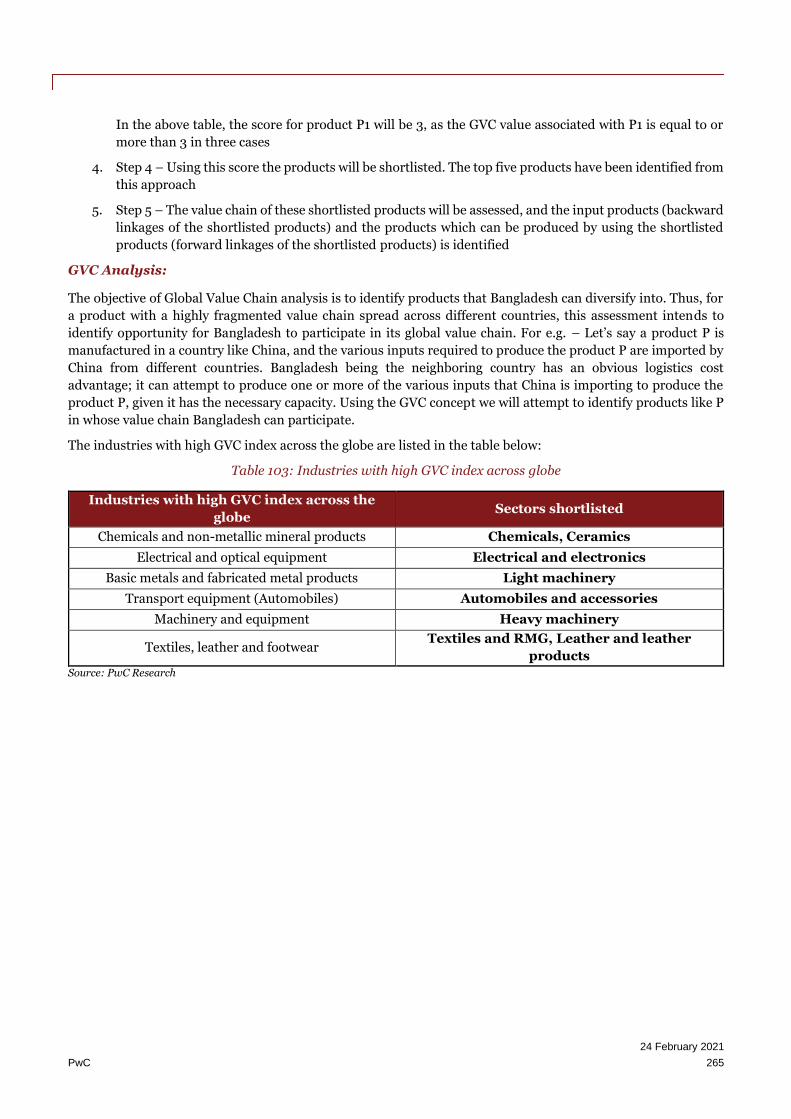
24 February 2021
PwC 265
In the above table, the score for product P1 will be 3, as the GVC value associated with P1 is equal to or
more than 3 in three cases
4. Step 4 – Using this score the products will be shortlisted. The top five products have been identified from
this approach
5. Step 5 – The value chain of these shortlisted products will be assessed, and the input products (backward
linkages of the shortlisted products) and the products which can be produced by using the shortlisted
products (forward linkages of the shortlisted products) is identified
GVC Analysis:
The objective of Global Value Chain analysis is to identify products that Bangladesh can diversify into. Thus, for
a product with a highly fragmented value chain spread across different countries, this assessment intends to
identify opportunity for Bangladesh to participate in its global value chain. For e.g. – Let’s say a product P is
manufactured in a country like China, and the various inputs required to produce the product P are imported by
China from different countries. Bangladesh being the neighboring country has an obvious logistics cost
advantage; it can attempt to produce one or more of the various inputs that China is importing to produce the
product P, given it has the necessary capacity. Using the GVC concept we will attempt to identify products like P
in whose value chain Bangladesh can participate.
The industries with high GVC index across the globe are listed in the table below:
Table 103: Industries with high GVC index across globe
Industries with high GVC index across the
globe Sectors shortlisted
Chemicals and non-metallic mineral products Chemicals, Ceramics
Electrical and optical equipment Electrical and electronics
Basic metals and fabricated metal products Light machinery
Transport equipment (Automobiles) Automobiles and accessories
Machinery and equipment Heavy machinery
Textiles, leather and footwear Textiles and RMG, Leather and leather
products
Source: PwC Research
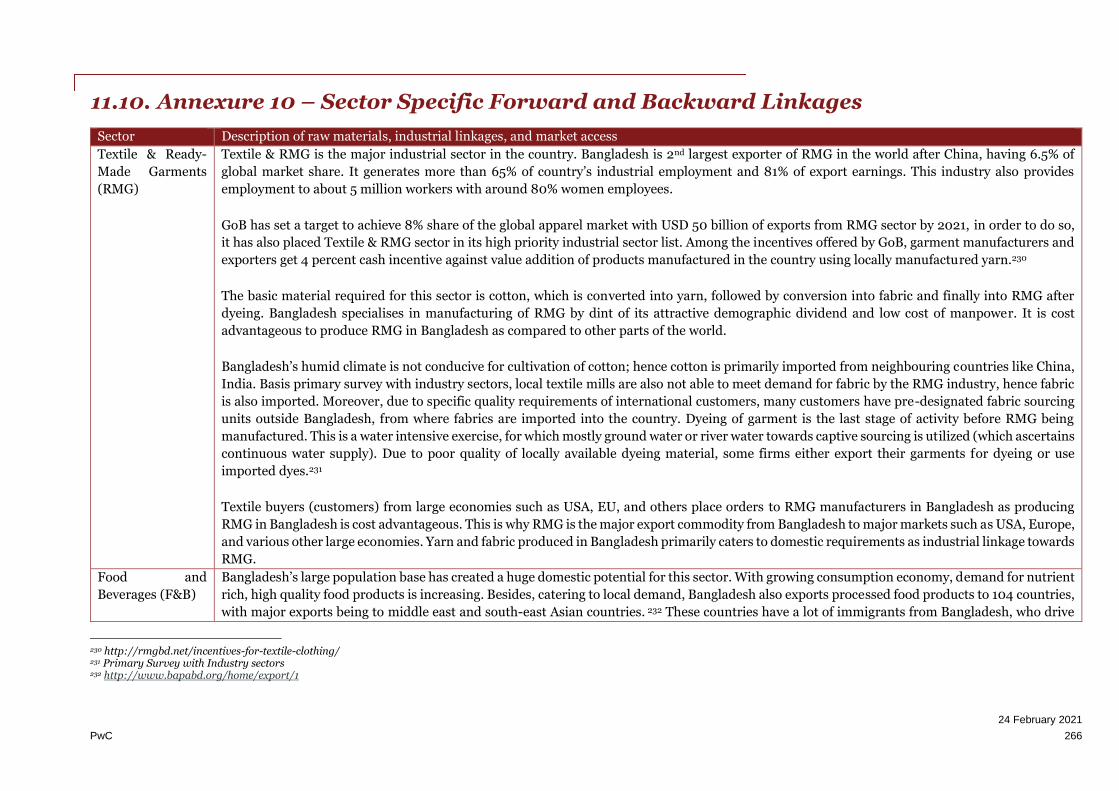
24 February 2021
PwC 266
11.10. Annexure 10 – Sector Specific Forward and Backward Linkages
Sector Description of raw materials, industrial linkages, and market access
Textile & Ready-
Made Garments
(RMG)
Textile & RMG is the major industrial sector in the country. Bangladesh is 2nd largest exporter of RMG in the world after China, having 6.5% of
global market share. It generates more than 65% of country’s industrial employment and 81% of export earnings. This industry also provides
employment to about 5 million workers with around 80% women employees.
GoB has set a target to achieve 8% share of the global apparel market with USD 50 billion of exports from RMG sector by 2021, in order to do so,
it has also placed Textile & RMG sector in its high priority industrial sector list. Among the incentives offered by GoB, garment manufacturers and
exporters get 4 percent cash incentive against value addition of products manufactured in the country using locally manufactured yarn.230
The basic material required for this sector is cotton, which is converted into yarn, followed by conversion into fabric and finally into RMG after
dyeing. Bangladesh specialises in manufacturing of RMG by dint of its attractive demographic dividend and low cost of manpower. It is cost
advantageous to produce RMG in Bangladesh as compared to other parts of the world.
Bangladesh’s humid climate is not conducive for cultivation of cotton; hence cotton is primarily imported from neighbouring countries like China,
India. Basis primary survey with industry sectors, local textile mills are also not able to meet demand for fabric by the RMG industry, hence fabric
is also imported. Moreover, due to specific quality requirements of international customers, many customers have pre-designated fabric sourcing
units outside Bangladesh, from where fabrics are imported into the country. Dyeing of garment is the last stage of activity before RMG being
manufactured. This is a water intensive exercise, for which mostly ground water or river water towards captive sourcing is utilized (which ascertains
continuous water supply). Due to poor quality of locally available dyeing material, some firms either export their garments for dyeing or use
imported dyes.231
Textile buyers (customers) from large economies such as USA, EU, and others place orders to RMG manufacturers in Bangladesh as producing
RMG in Bangladesh is cost advantageous. This is why RMG is the major export commodity from Bangladesh to major markets such as USA, Europe,
and various other large economies. Yarn and fabric produced in Bangladesh primarily caters to domestic requirements as industrial linkage towards
RMG.
Food and
Beverages (F&B)
Bangladesh’s large population base has created a huge domestic potential for this sector. With growing consumption economy, demand for nutrient
rich, high quality food products is increasing. Besides, catering to local demand, Bangladesh also exports processed food products to 104 countries,
with major exports being to middle east and south-east Asian countries. 232 These countries have a lot of immigrants from Bangladesh, who drive
230 http://rmgbd.net/incentives-for-textile-clothing/ 231 Primary Survey with Industry sectors 232 http://www.bapabd.org/home/export/1

24 February 2021
PwC 267
Sector Description of raw materials, industrial linkages, and market access
demand for Bangladesh food products in these countries. As per data available with BAPA, Bangladesh processed food fetched all time high export
receipts of $ 700 million in 2018-19.233Major items of exports were fruit juice, biscuits, potato crackers, chips, puffed rice, jam, confectionery items,
ketchup, parathas, singharas etc. As per BIDA, frozen food export is a priority sector for Bangladesh with special focus towards exports of shrimps.
Food and Beverage industry can be broadly segregated into two categories – (i) agro based products and (ii) animal products
For agro based products, the first stage is cultivation of necessary agricultural crops like cereals, fruits and vegetables. This is followed by 2-stage
processing, where products like wheat are converted into flour by agro based industries and flour is then converted into 2nd stage products. These
products are then packaged and sent to consumer markets.
F&B is the second stage in the value chain, while the first being agro based products.
Although Bangladesh being an agrarian economy is able to supply most of the raw material required for agro based industry, it also has to rely on
imports for products like Wheat, Sugar and few fruit various reasons ranging from poor protein content in wheat to poor productivity of sugarcane.
For animal products, Bangladesh is primarily focussed of exports of fish products, in particular exports of shrimp. Shrimp production is a three-
stage process, starting at hatcheries, where shrimp fries are cultivated, followed by farming where adult shrimps are cultivated from the shrimp
fries. This is followed by processing, where activities like deshelling, de-heading and some minimal processing takes place in order to increase the
shelf life of shrimp products. Lack of technological know-how prevents shrimp processing firms from adding further value to the processed shrimps.
Fish and shrimp cultivation take place in coastal parts of the country like Khulna, Barisal, Cox’s Bazar and Chattogram.
Basis primary survey, investors prefer setting up of F&B units at central locations of Bangladesh so that seamless supply to consumers located
across the country can take place easily. Some large domestic and foreign F&B players also source a part of their raw materials (like additives,
flavours, and chemicals) from outside the country from registered vendors in order to conform to their global quality policy.
Agro Based
Products
Agro based products act as source of raw material and intermediaries/ backward linkage to F&B sector in Bangladesh. Agro based products can
broadly be classified into three categories viz. (a) cereal, egg & fruits based; (b) tobacco; and (c) non edibles (such as jute, cotton). This sector deals
with first level processing of agricultural products and it acts as the upstream industry sector for F&B sector. Being an agrarian economy,
Bangladesh cultivates agricultural products in abundance.
233 https://thefinancialexpress.com.bd/views/processed-food-export-1583854567
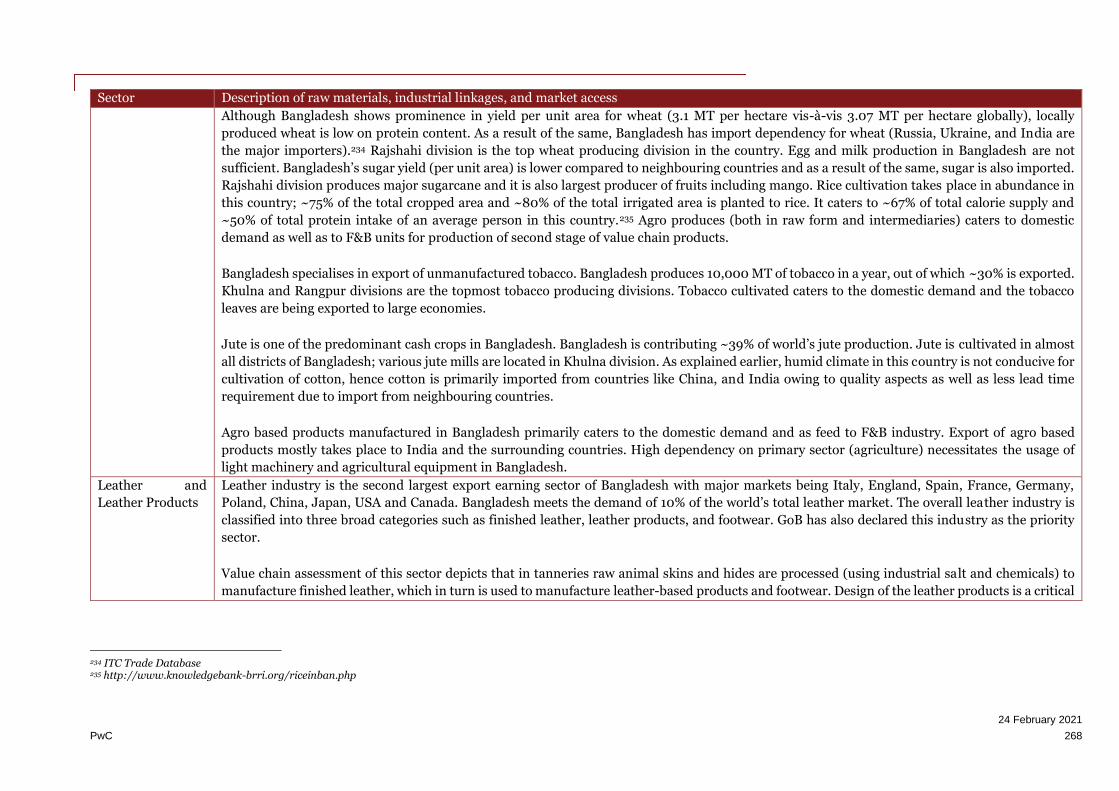
24 February 2021
PwC 268
Sector Description of raw materials, industrial linkages, and market access
Although Bangladesh shows prominence in yield per unit area for wheat (3.1 MT per hectare vis-à-vis 3.07 MT per hectare globally), locally
produced wheat is low on protein content. As a result of the same, Bangladesh has import dependency for wheat (Russia, Ukraine, and India are
the major importers).234 Rajshahi division is the top wheat producing division in the country. Egg and milk production in Bangladesh are not
sufficient. Bangladesh’s sugar yield (per unit area) is lower compared to neighbouring countries and as a result of the same, sugar is also imported.
Rajshahi division produces major sugarcane and it is also largest producer of fruits including mango. Rice cultivation takes place in abundance in
this country; ~75% of the total cropped area and ~80% of the total irrigated area is planted to rice. It caters to ~67% of total calorie supply and
~50% of total protein intake of an average person in this country.235 Agro produces (both in raw form and intermediaries) caters to domestic
demand as well as to F&B units for production of second stage of value chain products.
Bangladesh specialises in export of unmanufactured tobacco. Bangladesh produces 10,000 MT of tobacco in a year, out of which ~30% is exported.
Khulna and Rangpur divisions are the topmost tobacco producing divisions. Tobacco cultivated caters to the domestic demand and the tobacco
leaves are being exported to large economies.
Jute is one of the predominant cash crops in Bangladesh. Bangladesh is contributing ~39% of world’s jute production. Jute is cultivated in almost
all districts of Bangladesh; various jute mills are located in Khulna division. As explained earlier, humid climate in this country is not conducive for
cultivation of cotton, hence cotton is primarily imported from countries like China, and India owing to quality aspects as well as less lead time
requirement due to import from neighbouring countries.
Agro based products manufactured in Bangladesh primarily caters to the domestic demand and as feed to F&B industry. Export of agro based
products mostly takes place to India and the surrounding countries. High dependency on primary sector (agriculture) necessitates the usage of
light machinery and agricultural equipment in Bangladesh.
Leather and
Leather Products
Leather industry is the second largest export earning sector of Bangladesh with major markets being Italy, England, Spain, France, Germany,
Poland, China, Japan, USA and Canada. Bangladesh meets the demand of 10% of the world’s total leather market. The overall leather industry is
classified into three broad categories such as finished leather, leather products, and footwear. GoB has also declared this industry as the priority
sector.
Value chain assessment of this sector depicts that in tanneries raw animal skins and hides are processed (using industrial salt and chemicals) to
manufacture finished leather, which in turn is used to manufacture leather-based products and footwear. Design of the leather products is a critical
234 ITC Trade Database 235 http://www.knowledgebank-brri.org/riceinban.php
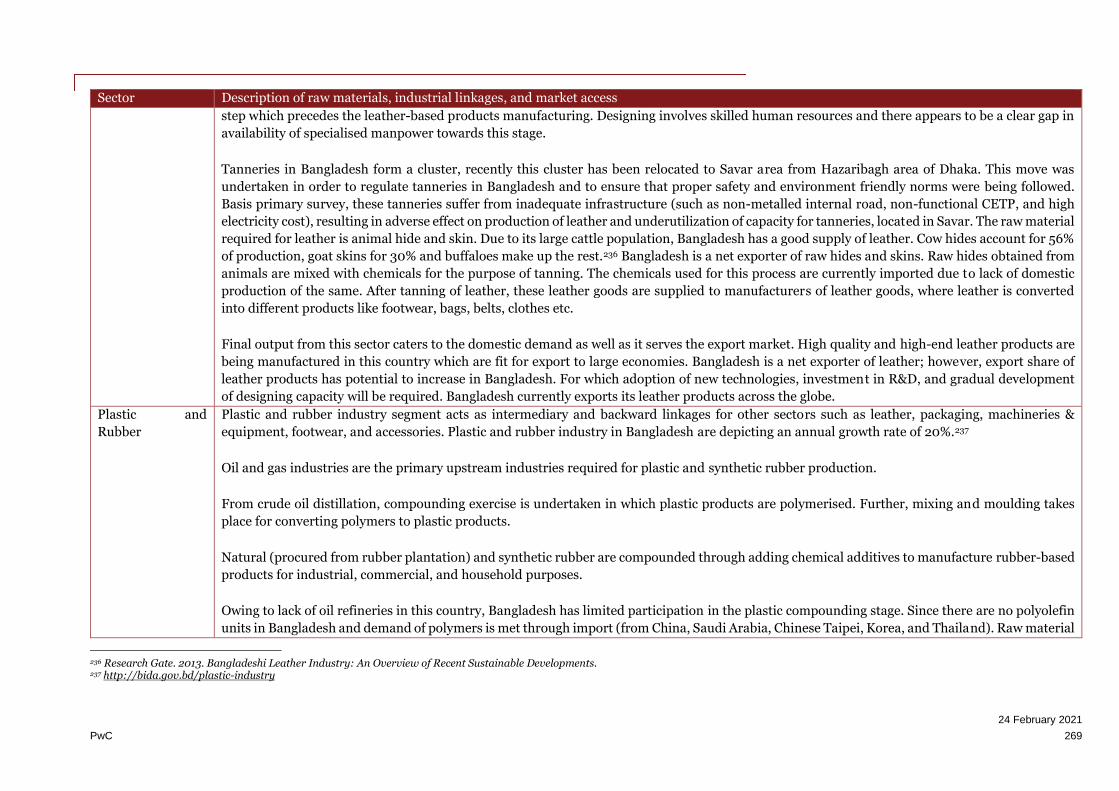
24 February 2021
PwC 269
Sector Description of raw materials, industrial linkages, and market access
step which precedes the leather-based products manufacturing. Designing involves skilled human resources and there appears to be a clear gap in
availability of specialised manpower towards this stage.
Tanneries in Bangladesh form a cluster, recently this cluster has been relocated to Savar area from Hazaribagh area of Dhaka. This move was
undertaken in order to regulate tanneries in Bangladesh and to ensure that proper safety and environment friendly norms were being followed.
Basis primary survey, these tanneries suffer from inadequate infrastructure (such as non-metalled internal road, non-functional CETP, and high
electricity cost), resulting in adverse effect on production of leather and underutilization of capacity for tanneries, located in Savar. The raw material
required for leather is animal hide and skin. Due to its large cattle population, Bangladesh has a good supply of leather. Cow hides account for 56%
of production, goat skins for 30% and buffaloes make up the rest.236 Bangladesh is a net exporter of raw hides and skins. Raw hides obtained from
animals are mixed with chemicals for the purpose of tanning. The chemicals used for this process are currently imported due to lack of domestic
production of the same. After tanning of leather, these leather goods are supplied to manufacturers of leather goods, where leather is converted
into different products like footwear, bags, belts, clothes etc.
Final output from this sector caters to the domestic demand as well as it serves the export market. High quality and high-end leather products are
being manufactured in this country which are fit for export to large economies. Bangladesh is a net exporter of leather; however, export share of
leather products has potential to increase in Bangladesh. For which adoption of new technologies, investment in R&D, and gradual development
of designing capacity will be required. Bangladesh currently exports its leather products across the globe.
Plastic and
Rubber
Plastic and rubber industry segment acts as intermediary and backward linkages for other sectors such as leather, packaging, machineries &
equipment, footwear, and accessories. Plastic and rubber industry in Bangladesh are depicting an annual growth rate of 20%.237
Oil and gas industries are the primary upstream industries required for plastic and synthetic rubber production.
From crude oil distillation, compounding exercise is undertaken in which plastic products are polymerised. Further, mixing and moulding takes
place for converting polymers to plastic products.
Natural (procured from rubber plantation) and synthetic rubber are compounded through adding chemical additives to manufacture rubber-based
products for industrial, commercial, and household purposes.
Owing to lack of oil refineries in this country, Bangladesh has limited participation in the plastic compounding stage. Since there are no polyolefin
units in Bangladesh and demand of polymers is met through import (from China, Saudi Arabia, Chinese Taipei, Korea, and Thailand). Raw material
236 Research Gate. 2013. Bangladeshi Leather Industry: An Overview of Recent Sustainable Developments. 237 http://bida.gov.bd/plastic-industry

24 February 2021
PwC 270
Sector Description of raw materials, industrial linkages, and market access
requirements of plastic are met through import and from local recycled plastic waste.238 It is to be noted that 20% of raw materials are from recycled
materials.239 Bangladesh has limited production capacity in this sector due to lack of advanced machinery and lack of skilled human resources. As
a result, plastic products manufactured in this country primarily cater to domestic demand.
Due to lack of upstream petrochemical industries, there is no production of synthetic rubber in Bangladesh. Natural rubber is produced from rubber
plantations located in Chattogram, Sylhet, Madhupura, and in Bandarban hill tracts.240 Major importing countries for synthetic rubber are India
and non SASEC countries. Produces from plastic and rubber industries are mostly used for industrial, commercial, and domestic consumption.
Due to lack of advanced technology, local small and medium players have restriction in producing quality rubber products. As a result, rubber
produced in Bangladesh primarily caters to the domestic demand and export contribution is very less.
Paper and
Packaging
As per Bangladesh Paper Mills Association, there are 110 paper mills in Bangladesh with a production capacity of 1.5 million metric tonne per year.
Manufacturers in Bangladesh are investing in upgradation of technology to produce export quality papers in order to export paper to 40 countries.
Paper and paper products exports from Bangladesh generated revenue of USD 16.24 million in 2018.241
The process of manufacturing paper products can be divided into a 3-stage process. The first stage involves acquiring raw material which can be
soft wood, bamboo or other fibre-based plants. Raw material availability in Bangladesh is limited currently due to lack of ample land, conducive
climate and soil conditions. Manufacturers are able to source local wood for manufacturing of basic paper. The wood obtained from plants is
converted into pulp through use of digester, bleaching agents are typically sourced from local suppliers.242 Manufacturers also use recycled paper
or import pulp from other countries depending on the final product. This pulp is then converted into paper or packaging products.
Usually integrated paper manufacturers in other countries have upstream access to forest towards sourcing of wood. In Bangladesh, locally sourced
wood is procured from forest areas in Bandarban and Chattogram forest areas. However, the pulp available locally is not of high-quality fit for
commercial and industrial purposes.
Per capita paper and board production in Bangladesh are ~3.5-4 kg, whereas the world average is 50 kg.243 This shows that Bangladesh is still
lagging behind the world in per capita paper production. Although, Bangladesh is producing sufficient paper for writing, printing and newsprint
purposes, consumers are still dependent on imports for packaging material used in RMG, medicine and food items. This is because Bangladesh
does not produce high quality pulp locally and while local raw material can meet local demand for basic paper and tissues, it does not satisfy the
238 http://emergingrating.com/wp-content/uploads/2017/09/Plastic-Industry-of-Bangladesh-Vol-I.pdf 239 The Financial Express. 2015. Export-Oriented Plastic Industry of Bangladesh: Opportunities and Challenges 240 http://en.banglapedia.org/index.php?title=Rubber_Industry 241 https://www.thedailystar.net/business/news/exports-prove-boon-paper-mills-1686010 242 Paper Sector in Bangladesh: MMA Quader (2011) 243 Paper Sector in Bangladesh: MMA Quader (2011)

24 February 2021
PwC 271
Sector Description of raw materials, industrial linkages, and market access
needs of manufacturers in RMG, F&B and pharmaceutical sectors, who are very particular about their paper quality. Paper packaging items are
currently imported from Japan, South Korea, China, India and Indonesia.
Chemicals Chemicals sector comprises various products viz. (i) fertilizer, (ii) adhesives & paints related products, and (iii) other chemicals. This sector exhibits
annual growth trend of ~9%.244 Chemicals sector acts as the downstream sector for various sectors such as agro based, shipbuilding, and heavy
machineries. Adhesives and paints-based products are consumed for household, commercial, and industrial purposes. At present, chemicals sector
fulfils domestic demand and it is not export oriented. This sector is largely dominated by local traders who offer competitive price across the range
of products.245 Primary survey among industrial players reveals that owing to lack of technical know-how, lack of skilled manpower, and lack of
quality laboratory facilities (research and testing) in this country, Chemicals sector is yet to shape up in Bangladesh and get ready for export oriented
manufacturing.
Urea is the major raw material for fertilizer production. Additives are added to Urea for manufacturing fertilizers. Basis primary survey, production
of urea-based fertilizer is controlled by GoB; current production of urea is not sufficient to meet local demand (demand is 2.5 million MT annual
and local supply is only 1 million MT annual) and owing to the same, import of fertilizer is required. Private players are involved in adding
micronutrients (NKPF) to urea in order to enhance the quality.
Resin is the basic raw material for adhesive manufacturing, the same is imported. Downstream produces from adhesives are used in footwear, light
engineering and construction sectors in the country. Large paints companies in Bangladesh are dependent on procuring raw materials through
import from reputed empanelled vendors worldwide. Basis primary survey with industrial players, local (small and medium scale) chemicals
manufacturers are dependent on importing resins from countries like India and South Asia.
Outputs of Chlor Alkali and Hydrogen Peroxide are basic chemicals necessary for all industrial usage. Downstream products from these basic
chemicals have demand across various sectors such as dyeing, textile, F&B, Electrical & Electronics, Steel, Leather, Pharmaceuticals, and Plastic.
These inputs are primarily imported from India, China, and other Asian countries. Due to lack of integrated chemical manufacturing facilities in
Bangladesh, this sector is import dependent.
Non-metallic
minerals
Non-metallic minerals sector comprises of (a) glass, (b) ceramics, and (c) cement. This sector records an average annual growth trend of ~24%.246
Manufacturing output from these sectors primarily caters to the domestic demand.
244 http://www.thedailystar.net/supplements/painting-the-future-bright-1331338 https://factsweek.com/160464/asia-textile-chemicals-market-is-projected-to-exhibit-a-cagr-of-7-6-from-2014-2020/ https://advancedtextilessource.com/2014/07/23/bangladesh-textile-chemicals-market-growth-continues/ 245 www.banglajol.info/index.php/jce/article/download/10178/7533 246 http://www.thedailystar.net/supplements/overview-bangladeshs-ceramics-industry-1498489

24 February 2021
PwC 272
Sector Description of raw materials, industrial linkages, and market access
Bangladesh glass and glassware sector are demonstrating healthy growth rate of ~20% annually. Main ingredient of glass industry is sand, although
quality sand is imported from China and Egypt.247 In addition, Bangladesh imports the other ingredients (like limestone, dolomite, feldspar, and
other minerals) required for glass industry. Local sand deposits of Bangladesh are located at Balijuri, Shahjibazar, Maddhyapara, and
Barapukuria.248 Secondary research depicts that local glass sector caters to ~95% of the domestic demand; local glass companies are exporting
products to South Asian countries (such as India, Nepal, Bhutan, and Sri Lanka).249
The domestic market for ceramic products, including tableware, tiles and sanitary ware, is worth about BDT 6,000 crore annually. According to
Bangladesh Ceramics Manufacturers and Exporters Association (BCMEA), Bangladesh exported ceramic products worth BDT 585 crore last
year,.250 Clay mining (main ingredient) is sourced locally from Mymensingh and Sylhet regions. Basis primary survey with industry sector players,
for high quality products, Bangladesh is import dependent and other raw materials (minerals, adhesives, and chemicals) are being imported. This
sector caters to ~85% of the domestic demand and export takes place to various countries (like India, large western economies).251 Natural gas is
used in the production process and owing to low Sulphur content in locally available natural gas, ceramics products look shiny and bright, which
makes it adequate for export to large markets.252
Limestone is the major raw material for cement production. Limestone is processed to form clinker, on which additives are mixed and crushed to
manufacture cement. For cement production in this country, end-to-end manufacturing is not available as Bangladesh doesn’t have enough supply
of limestone. Clinker (processed limestone) is being imported from countries such as India, China, and South East Asia. Coal is also imported, and
fly ash is sourced locally. All the cement based industrial units are located adjacent to river to facilitate smooth logistics. Cement production in this
country is primarily used for domestic consumption and minimal export takes place.
Automobile and
accessories
With rising income levels in the country, Bangladesh’s demand for automobiles is rising. The domestic market demand has been mostly satisfied
by imports. Bangladesh is not present across the value chain of automobile industry due to lack of technological know-how and trained manpower.
The country has been primarily dependent on assembling of automobile components; these components (completely knock down units) are being
imported. Currently the passenger car import comprises of refurbished cars or re-used cars that are reconditioned in Bangladesh. Import of
passenger cars has clocked USD 470 million (in 2019).
However, with development of technological know-how automobile manufacturers are starting to manufacture vehicles at competitive prices locally
and have also started targeting export markets. In the recent past several foreign entities expressed their intent to invest in Bangladesh. For
247 Secondary research and primary survey 248 Banglapedia 249 http://www.thedailystar.net/news-detail-42940 250 http://www.theindependentbd.com/post/227968 251 http://www.thedailystar.net/supplements/overview-bangladeshs-ceramics-industry-1498489 252 http://www.thedailystar.net/supplements/overview-bangladeshs-ceramics-industry-1498489

24 February 2021
PwC 273
Sector Description of raw materials, industrial linkages, and market access
example, recently Ashok Leyland opened a new commercial vehicle assembly plant near Dhaka. Various assemblers of vehicles are joint ventures
with foreign entities to help bring in technology and parts. Examples include a partnership between Ashok Leyland and IFAD Autos Limited, and
a partnership between Tata Motors and Nitol Niloy Group. Bangladesh has duty-free agreement with several countries due to which cars
manufactured and exported from Bangladesh do not attract import duties. These cars can also attract local customers who are interested in buying
new cars rather than refurbished cars.
Heavy Machinery,
Iron, Steel and
Metal
Bangladesh is one of Asia’s emerging steel markets having more than 400 steel, re-rolling and auto re-rolling mills. Most of steel manufacture in
Bangladesh takes place in form of long steel products and MS bars used in construction of buildings. Majority of the steel and metal based industrial
units in Bangladesh are re-rolling mills and they are located in Chattogram and Narayanganj areas, where downstream produces (steel and metal
scraps) from ship breaking industry are readily available. As per discussions with leading steel manufacturers, Bangladesh currently produces more
than 4 million tonnes of steel and production of this sector is expected to double by 2022.
The value of chain of this sector involves mining of iron ore and converting it into pig iron inside blast furnace. This pig iron is converted into steel
ingots by adding metals like magnesium, nickel etc. as per requirements of the final products. These steel ingots are then sent to rolling mills where
they are converted into billets. Billets are then converted into final products in re-rolling mills.
Due to absence of iron ore deposits, steel industry in Bangladesh is dependent on import of scraps and billets to produce final products. Bangladesh
currently manufactures steel for its domestic consumption only, however due to capacity expansion by steel manufacturers, Bangladesh has also
developed potential to export steel products. Heavy machineries are dependent on supply of metals and steel. However, the skill and technology
requisite for the same are not available in the country. Waterfront facilities are required for setting up of steel, metal, and heavy machinery
manufacturing related industries in the country.
Electrical and
Electronics
Electrical and electronics sector consists of various end products such as cables, electrical appliances, switches, white goods, electronics appliances
and goods. This sector caters to both household requirements as well as industrial requirements in sectors such as shipbuilding, heavy machineries
& equipment, and light machinery. The market size of the electronics industry (including both industrial and consumer electronics) is around 4
billion USD in 2017 and is expected to reach around 12 billion USD by 2025.253
Raw materials for this sector are diversified and dependent on industrial linkages of various sectors. Products from plastic and rubber industries
are used as base for production of switches and cables. Products from metal-based industries are used for electrical wiring. Electronics sector has
a fragmented value chain spread across various geographic locations. Spare parts of electronics sector (such as compressor, coil, and circuit) are
253 https://www.hcidhaka.gov.in/pdf/Report_on_Consumer_Electronics_Industry_in_Bangladesh(1).pdf
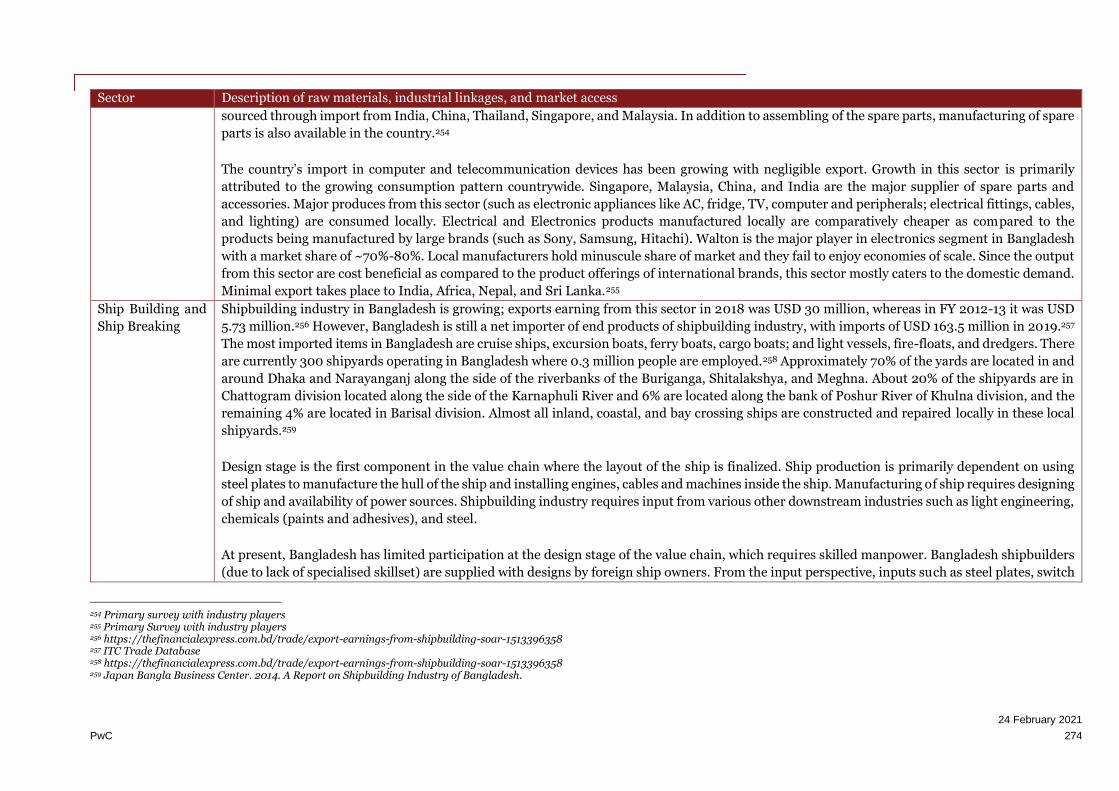
24 February 2021
PwC 274
Sector Description of raw materials, industrial linkages, and market access
sourced through import from India, China, Thailand, Singapore, and Malaysia. In addition to assembling of the spare parts, manufacturing of spare
parts is also available in the country.254
The country’s import in computer and telecommunication devices has been growing with negligible export. Growth in this sector is primarily
attributed to the growing consumption pattern countrywide. Singapore, Malaysia, China, and India are the major supplier of spare parts and
accessories. Major produces from this sector (such as electronic appliances like AC, fridge, TV, computer and peripherals; electrical fittings, cables,
and lighting) are consumed locally. Electrical and Electronics products manufactured locally are comparatively cheaper as compared to the
products being manufactured by large brands (such as Sony, Samsung, Hitachi). Walton is the major player in electronics segment in Bangladesh
with a market share of ~70%-80%. Local manufacturers hold minuscule share of market and they fail to enjoy economies of scale. Since the output
from this sector are cost beneficial as compared to the product offerings of international brands, this sector mostly caters to the domestic demand.
Minimal export takes place to India, Africa, Nepal, and Sri Lanka.255
Ship Building and
Ship Breaking
Shipbuilding industry in Bangladesh is growing; exports earning from this sector in 2018 was USD 30 million, whereas in FY 2012-13 it was USD
5.73 million.256 However, Bangladesh is still a net importer of end products of shipbuilding industry, with imports of USD 163.5 million in 2019.257
The most imported items in Bangladesh are cruise ships, excursion boats, ferry boats, cargo boats; and light vessels, fire-floats, and dredgers. There
are currently 300 shipyards operating in Bangladesh where 0.3 million people are employed.258 Approximately 70% of the yards are located in and
around Dhaka and Narayanganj along the side of the riverbanks of the Buriganga, Shitalakshya, and Meghna. About 20% of the shipyards are in
Chattogram division located along the side of the Karnaphuli River and 6% are located along the bank of Poshur River of Khulna division, and the
remaining 4% are located in Barisal division. Almost all inland, coastal, and bay crossing ships are constructed and repaired locally in these local
shipyards.259
Design stage is the first component in the value chain where the layout of the ship is finalized. Ship production is primarily dependent on using
steel plates to manufacture the hull of the ship and installing engines, cables and machines inside the ship. Manufacturing of ship requires designing
of ship and availability of power sources. Shipbuilding industry requires input from various other downstream industries such as light engineering,
chemicals (paints and adhesives), and steel.
At present, Bangladesh has limited participation at the design stage of the value chain, which requires skilled manpower. Bangladesh shipbuilders
(due to lack of specialised skillset) are supplied with designs by foreign ship owners. From the input perspective, inputs such as steel plates, switch
254 Primary survey with industry players 255 Primary Survey with industry players 256 https://thefinancialexpress.com.bd/trade/export-earnings-from-shipbuilding-soar-1513396358 257 ITC Trade Database 258 https://thefinancialexpress.com.bd/trade/export-earnings-from-shipbuilding-soar-1513396358 259 Japan Bangla Business Center. 2014. A Report on Shipbuilding Industry of Bangladesh.

24 February 2021
PwC 275
Sector Description of raw materials, industrial linkages, and market access
boards, steel cables, and power transformers, are procured locally, whereas engines are imported exclusively. With regard to steel, which is the
primary input necessary for the industry, Bangladesh is import-dependent. This is because maximum steel rolling mills in Bangladesh are focussed
towards producing long bars which have a higher demand from the construction industry and Bangladesh has a limited steel plate producing
capacity.
The coastline of Bangladesh is also conducive for setting up ship breaking industry which primarily requires cheap labour. Shipyards in India,
Pakistan and Bangladesh comprise around 80% of global breaking and recycling market.260 The biggest ship recycling yard out of these 3 countries
is in Chattogram, which recycled 230 ships in 2017.261 Basis primary interaction and sectoral research, it was understood that Bangladesh gets 60%
of its steel supply from ship breaking industry, which is used in iron, steel, light engineering and equipment manufacturing industries.
Petroleum
products
(including
bottling)
Petroleum sector in Bangladesh is exhibiting historical annual growth trend of 10%.262 Bangladesh is a major importer of petroleum products.
Based on the petroleum and petroleum-based products (such as LPG, LNG, and polymers), gas refining, storage and bottling facilities have been
developed in waterfront locations mostly located near the sea sides of the country.
Based on extraction of crude oil, distillation and polymerization takes place to manufacture various downstream products such as lube oil, plastic,
and rubber. Since there is no crude oil reserve in this country, Bangladesh is not present across the value chain of this sector. Crude oil is mostly
being imported from gulf countries. Setting up of oil refineries is highly capital intensive and it involves usage of advanced technologies and heavy
machineries. Further, highly skilled and specialized manpower is essential towards smooth functioning of this sector. Basis primary survey with
industry players, Bangladesh lacks in terms of availability of highly skilled manpower; as a result of which, Bangladesh is present in less
technologically challenging aspects in the value chain of this sector. There are various local players manufacturing lube oil and blended oil which
are primarily consumed in sectors such as automobile, heavy engineering, and light machinery. LPG based cylinders are bottled in cylinders for
industrial, commercial, and domestic supply. This sector caters to the local demand and not export oriented.
Pharmaceuticals Pharmaceuticals is one of the most popular industry sectors in the country. Bangladeshi pharmaceutical industry is growing very fast meeting 98%
of domestic demand and posting a 27% growth in export earnings. In 2018, the country's domestic pharmaceutical market size stood at BDT
20,511.8 crore with 15.6% CAGR for the last five years.263 The sector is expected to grow at 15% year-on-year to reach $5.11 billion by 2023, propelled
by high investment by local companies as they seek to grab a bigger share of the global market.
260 http://www.atimes.com/article/shipbreaking-asia-profit-price/ 261 http://www.atimes.com/article/shipbreaking-asia-profit-price/ 262 http://fpd-bd.com/wp-content/uploads/2016/10/Research-Report-on-Energy-Sector-of-Bangladesh-Initiation-Mar-15-11.pdf 263 https://www.dhakatribune.com/business/2019/08/22/bangladesh-pharmaceutical-industry-blooms-bigger

24 February 2021
PwC 276
Sector Description of raw materials, industrial linkages, and market access
Pharmaceuticals is a highly research and development-oriented industry where regulatory aspects (like drug laws, patent issues, and affiliation
with drug agencies) play key role. From basic chemicals and other products (like herbal contents), APIs are manufactured. APIs are the key
ingredients for drug manufacturing.
APIs of Pharmaceutical sector is sourced through import owing to quality issues and lack of API manufacturing ecosystem in the country. Basis
primary survey, Bangladesh has commenced API manufacturing, but the production is not sufficient to cater to the economies of scale (~10% APIs
are locally sourced). Also, owing to lack of educational ecosystem and lack of research facilities, Bangladesh is limited in R&D and sourcing of
skilled technicians in this sector. Chemicals and various ingredients of drug are imported (from various markets spread across USA, Europe, and
Asia) and end products (drugs) are being manufactured in this country.
Dhaka and the surrounding region have evolved as a hub for pharmaceutical manufacturing with majority of the pharmaceutical units are located
in this region. Basis primary survey with industry players, lack of adequate educational system related to pharmaceutical sector and availability of
skilled human resources are major challenges that this sector is facing. End products of this industry primarily caters to domestic demand and
minuscule export takes place (mostly to Africa and LDC countries).
Light Machinery,
Equipment and
Furniture
This sector involves production of mechanical equipment, agricultural machinery, bicycles, and furniture. Produces from this sector is
predominantly used for catering to domestic demand.
This is an important industry in Bangladesh as it provides backward and forward linkages to all other industries. Light machinery sector provides
support for operation and maintenance of heavy machines through production of spare parts, castings, moulds, dies, fittings etc. As per information
provided by BIDA there are currently 40,000 light engineering units/workshops scattered across Bangladesh. These industries develop in vicinity
of industrial clusters in order to provide support to large-scale capital-intensive factories requiring heavy machinery. Products manufactured by
this sector can be made out of rubber, ceramics, metals or plastic. Exporters from countries like China, Japan and Korea are developing light
engineering facilities in Bangladesh in order to cater to export market.
Raw materials are steel scraps, components of plastic and rubber, and wood. Basis primary interaction, we were informed that steel scrap is sourced
primarily from ship breaking industries (located in Chattogram and Narayanganj). Other raw materials (such as articles made of plastic and rubber)
are sourced locally; Bangladesh doesn’t produce good quality wood required for manufacturing of furniture. Since, wood available in Bangladesh
are high in moisture and fibre content and is not fit for processing.
Bicycle sector in Bangladesh participates in the entire value chain (assembling and manufacturing). Manufacturers focused on export are
completely import dependent for raw material sourcing. According to them, quality raw material fit for export is not available locally. However,
majority of manufacturers are focused on catering to domestic demand.

24 February 2021
PwC 277
11.11. Annexure 11 – Respondents’ Profile: Primary Survey
Sl. No. Name of Company Sector Contact Email Origin
1 Adhesion Products (Pvt)
LTD Chemicals 1819335979 [email protected] Domestic
2 SAF Chemicals LTD. Chemicals 1711489847 [email protected] Domestic
3 GDS Chemical Bangladesh
(Pvt.) Ltd Chemicals 1755645283 [email protected] Domestic
4 Kohinoor Chemical Chemicals 1711670123 N/A Domestic
5 Chemicolour Chemicals 1741406000 N/A Domestic
6 Lily Cosmetics Ltd Chemicals 1921823525 [email protected] Domestic
7 Kannauj Perfumery House Chemicals 7390186 N/A Domestic
8 Tasnim Chemical Complex Chemicals 1755596547 [email protected] Domestic
9 Khulna Alied Industries
Ltd. Chemicals 1714905436 N/A Domestic
10 ADIB Chemical Company Chemicals 0088-02-7342318
[email protected] Domestic
11 Ikbal Perfumery &
Chemical Chemicals 1716729944 N/A Domestic
12 Jamal IPS & Battery House Chemicals 01716-467561 [email protected] Domestic
13 S Alam Bag Manufacturing
Mills Ltd Non-metallic minerals 1554339582 [email protected] Domestic
14 PHP Float Glass Ins.Ltd Non-metallic minerals 031-632316 [email protected] Domestic
15 Kashfia Furniture Mart Non-metallic minerals 1672191268 NA Domestic
16 Khan Furniture House Non-metallic minerals 1922753244 NA Domestic
17 Ma Furniture Mart Non-metallic minerals 1921602353 NA Domestic
18 Allahordan Furniture Non-metallic minerals 182428816 NA Domestic
19 Super Filling Station Non-metallic minerals 1710862240 NA Domestic
20 M/S Super Bricks Non-metallic minerals 1718306041 NA Domestic
21 Prince Bricks Non-metallic minerals 1988455555 NA Domestic
22 Ekota auto bricks ltd. Non-metallic minerals 1711232699 [email protected] Domestic
23 Best bricks Non-metallic minerals 1937706355 NA Domestic
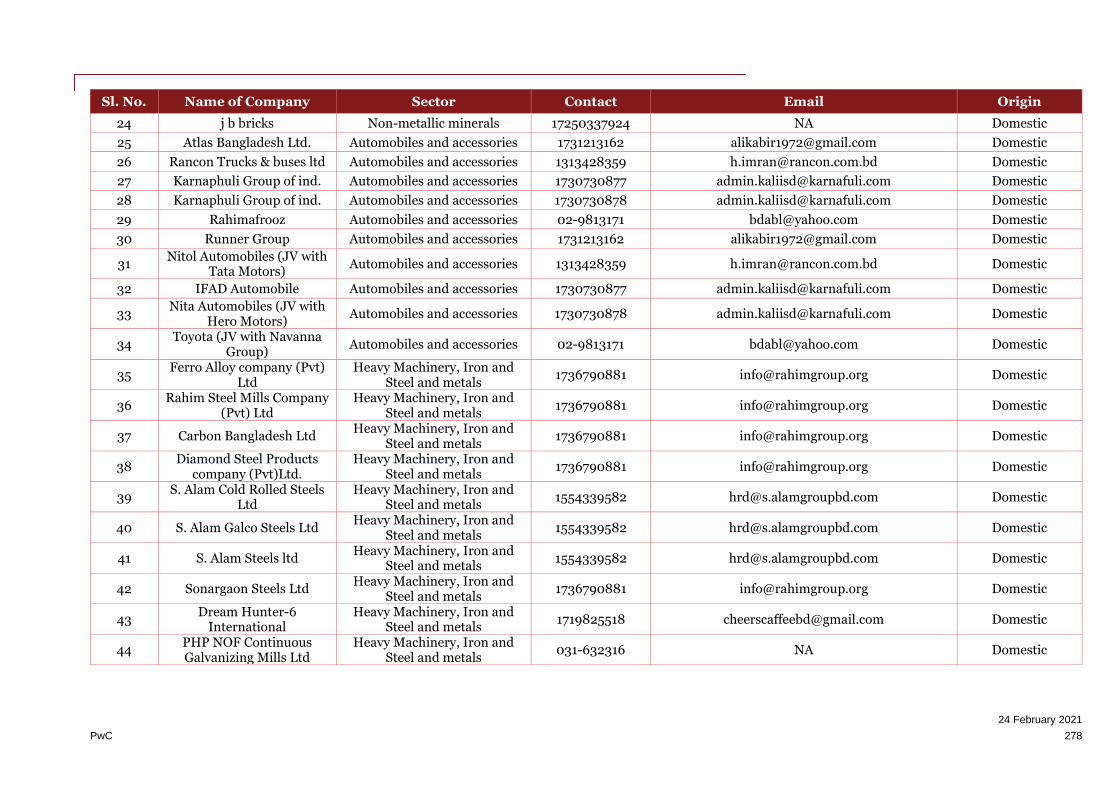
24 February 2021
PwC 278
Sl. No. Name of Company Sector Contact Email Origin
24 j b bricks Non-metallic minerals 17250337924 NA Domestic
25 Atlas Bangladesh Ltd. Automobiles and accessories 1731213162 [email protected] Domestic
26 Rancon Trucks & buses ltd Automobiles and accessories 1313428359 [email protected] Domestic
27 Karnaphuli Group of ind. Automobiles and accessories 1730730877 [email protected] Domestic
28 Karnaphuli Group of ind. Automobiles and accessories 1730730878 [email protected] Domestic
29 Rahimafrooz Automobiles and accessories 02-9813171 [email protected] Domestic
30 Runner Group Automobiles and accessories 1731213162 [email protected] Domestic
31 Nitol Automobiles (JV with
Tata Motors) Automobiles and accessories 1313428359 [email protected] Domestic
32 IFAD Automobile Automobiles and accessories 1730730877 [email protected] Domestic
33 Nita Automobiles (JV with
Hero Motors) Automobiles and accessories 1730730878 [email protected] Domestic
34 Toyota (JV with Navanna
Group) Automobiles and accessories 02-9813171 [email protected] Domestic
35 Ferro Alloy company (Pvt)
Ltd Heavy Machinery, Iron and
Steel and metals 1736790881 [email protected] Domestic
36 Rahim Steel Mills Company
(Pvt) Ltd Heavy Machinery, Iron and
Steel and metals 1736790881 [email protected] Domestic
37 Carbon Bangladesh Ltd Heavy Machinery, Iron and
Steel and metals 1736790881 [email protected] Domestic
38 Diamond Steel Products
company (Pvt)Ltd. Heavy Machinery, Iron and
Steel and metals 1736790881 [email protected] Domestic
39 S. Alam Cold Rolled Steels
Ltd Heavy Machinery, Iron and
Steel and metals 1554339582 [email protected] Domestic
40 S. Alam Galco Steels Ltd Heavy Machinery, Iron and
Steel and metals 1554339582 [email protected] Domestic
41 S. Alam Steels ltd Heavy Machinery, Iron and
Steel and metals 1554339582 [email protected] Domestic
42 Sonargaon Steels Ltd Heavy Machinery, Iron and
Steel and metals 1736790881 [email protected] Domestic
43 Dream Hunter-6
International Heavy Machinery, Iron and
Steel and metals 1719825518 [email protected] Domestic
44 PHP NOF Continuous Galvanizing Mills Ltd
Heavy Machinery, Iron and Steel and metals
031-632316 NA Domestic
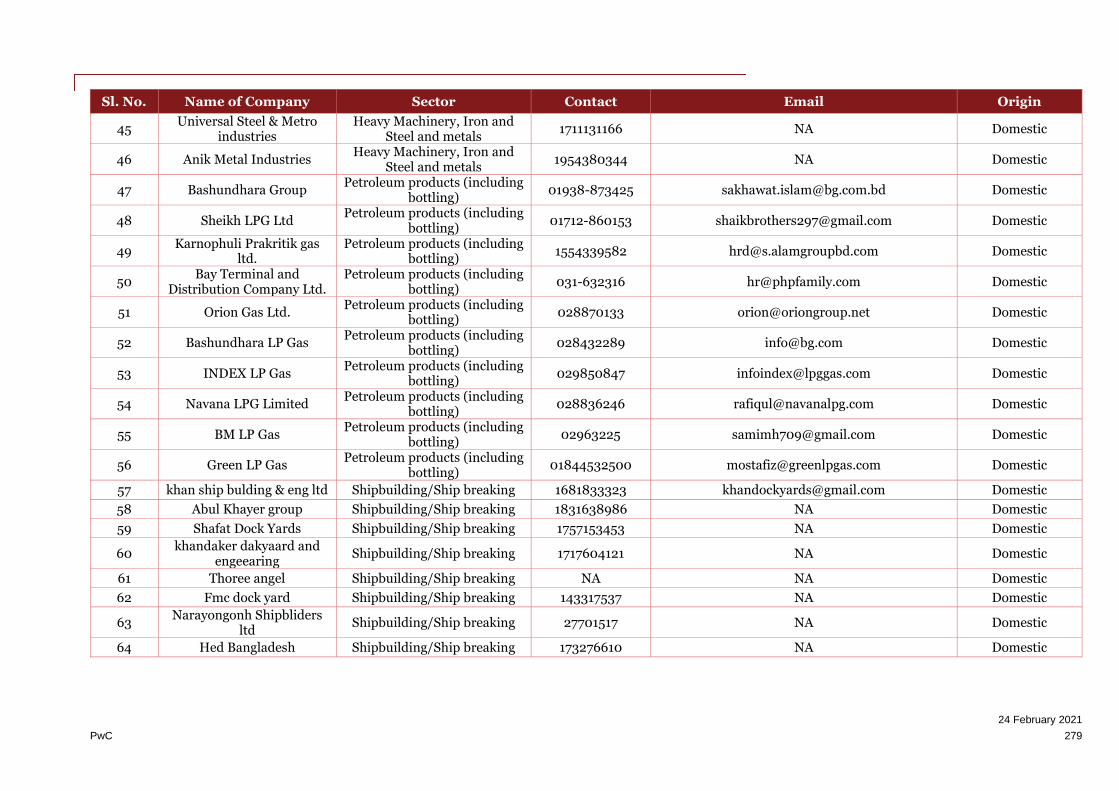
24 February 2021
PwC 279
Sl. No. Name of Company Sector Contact Email Origin
45 Universal Steel & Metro
industries Heavy Machinery, Iron and
Steel and metals 1711131166 NA Domestic
46 Anik Metal Industries Heavy Machinery, Iron and
Steel and metals 1954380344 NA Domestic
47 Bashundhara Group Petroleum products (including
bottling) 01938-873425 [email protected] Domestic
48 Sheikh LPG Ltd Petroleum products (including
bottling) 01712-860153 [email protected] Domestic
49 Karnophuli Prakritik gas
ltd. Petroleum products (including
bottling) 1554339582 [email protected] Domestic
50 Bay Terminal and
Distribution Company Ltd. Petroleum products (including
bottling) 031-632316 [email protected] Domestic
51 Orion Gas Ltd. Petroleum products (including
bottling) 028870133 [email protected] Domestic
52 Bashundhara LP Gas Petroleum products (including
bottling) 028432289 [email protected] Domestic
53 INDEX LP Gas Petroleum products (including
bottling) 029850847 [email protected] Domestic
54 Navana LPG Limited Petroleum products (including
bottling) 028836246 [email protected] Domestic
55 BM LP Gas Petroleum products (including
bottling) 02963225 [email protected] Domestic
56 Green LP Gas Petroleum products (including
bottling) 01844532500 [email protected] Domestic
57 khan ship bulding & eng ltd Shipbuilding/Ship breaking 1681833323 [email protected] Domestic
58 Abul Khayer group Shipbuilding/Ship breaking 1831638986 NA Domestic
59 Shafat Dock Yards Shipbuilding/Ship breaking 1757153453 NA Domestic
60 khandaker dakyaard and
engeearing Shipbuilding/Ship breaking 1717604121 NA Domestic
61 Thoree angel Shipbuilding/Ship breaking NA NA Domestic
62 Fmc dock yard Shipbuilding/Ship breaking 143317537 NA Domestic
63 Narayongonh Shipbliders
ltd Shipbuilding/Ship breaking 27701517 NA Domestic
64 Hed Bangladesh Shipbuilding/Ship breaking 173276610 NA Domestic
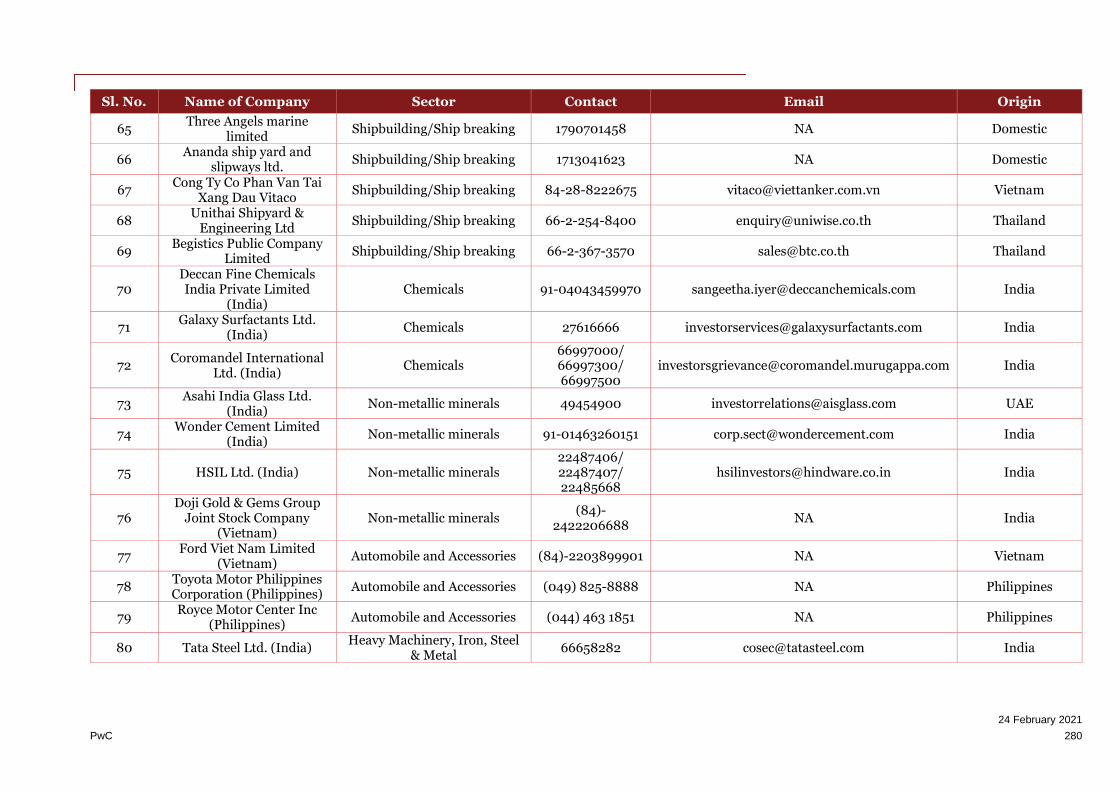
24 February 2021
PwC 280
Sl. No. Name of Company Sector Contact Email Origin
65 Three Angels marine
limited Shipbuilding/Ship breaking 1790701458 NA Domestic
66 Ananda ship yard and
slipways ltd. Shipbuilding/Ship breaking 1713041623 NA Domestic
67 Cong Ty Co Phan Van Tai
Xang Dau Vitaco Shipbuilding/Ship breaking 84-28-8222675 [email protected] Vietnam
68 Unithai Shipyard &
Engineering Ltd Shipbuilding/Ship breaking 66-2-254-8400 [email protected] Thailand
69 Begistics Public Company
Limited Shipbuilding/Ship breaking 66-2-367-3570 [email protected] Thailand
70 Deccan Fine Chemicals India Private Limited
(India) Chemicals 91-04043459970 [email protected] India
71 Galaxy Surfactants Ltd.
(India) Chemicals 27616666 [email protected] India
72 Coromandel International
Ltd. (India) Chemicals
66997000/ 66997300/ 66997500
[email protected] India
73 Asahi India Glass Ltd.
(India) Non-metallic minerals 49454900 [email protected] UAE
74 Wonder Cement Limited
(India) Non-metallic minerals 91-01463260151 [email protected] India
75 HSIL Ltd. (India) Non-metallic minerals 22487406/ 22487407/ 22485668
[email protected] India
76 Doji Gold & Gems Group
Joint Stock Company (Vietnam)
Non-metallic minerals (84)-
2422206688 NA India
77 Ford Viet Nam Limited
(Vietnam) Automobile and Accessories (84)-2203899901 NA Vietnam
78 Toyota Motor Philippines Corporation (Philippines)
Automobile and Accessories (049) 825-8888 NA Philippines
79 Royce Motor Center Inc
(Philippines) Automobile and Accessories (044) 463 1851 NA Philippines
80 Tata Steel Ltd. (India) Heavy Machinery, Iron, Steel
& Metal 66658282 [email protected] India

24 February 2021
PwC 281
Sl. No. Name of Company Sector Contact Email Origin
81 Vedanta Ltd. (India) Heavy Machinery, Iron, Steel
& Metal 66434500 [email protected] India
82 Steel Authority of India
SAIL Ltd. (India) Heavy Machinery, Iron, Steel
& Metal 24367481 [email protected] India
83 Totalgaz Bangladesh Petroleum Products +880 2-9841936 NA France
84 Shell Bangladesh Petroleum Products 01610010030 NA Netherlands
85 Summit Power International
Petroleum Products 01711885223 [email protected] Singapore
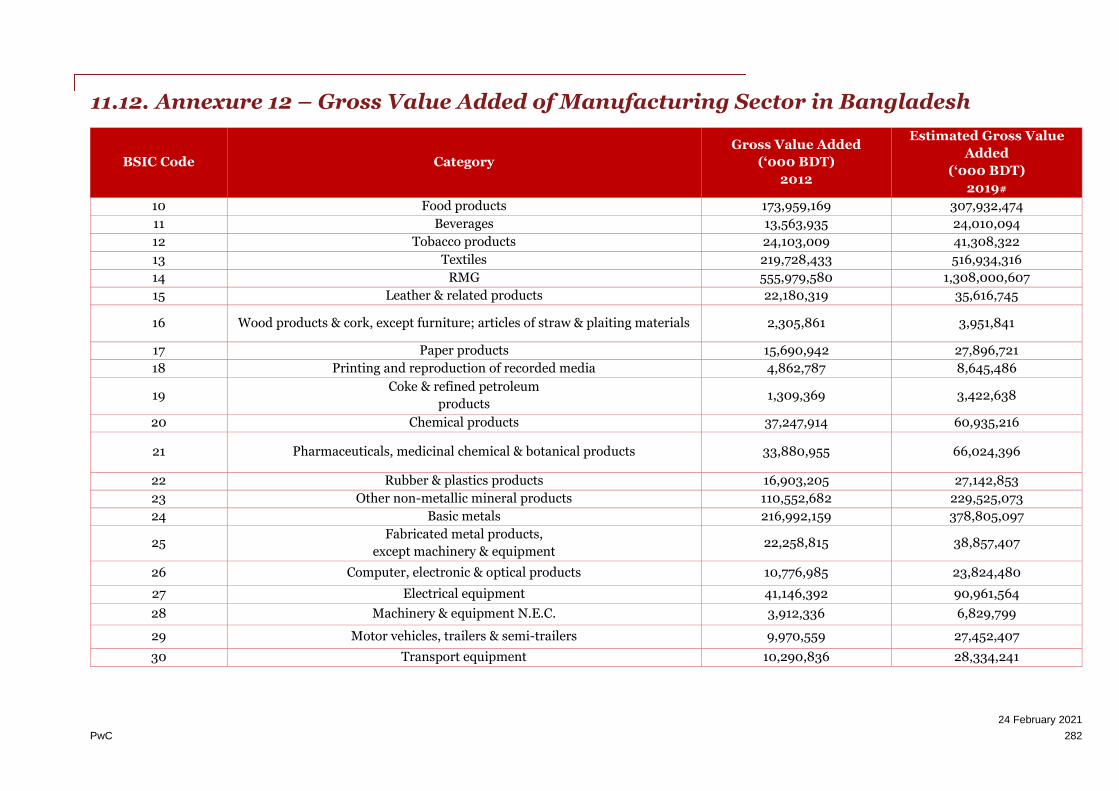
24 February 2021
PwC 282
11.12. Annexure 12 – Gross Value Added of Manufacturing Sector in Bangladesh
BSIC Code Category
Gross Value Added
(‘000 BDT)
2012
Estimated Gross Value
Added
(‘000 BDT)
2019#
10 Food products 173,959,169 307,932,474
11 Beverages 13,563,935 24,010,094
12 Tobacco products 24,103,009 41,308,322
13 Textiles 219,728,433 516,934,316
14 RMG 555,979,580 1,308,000,607
15 Leather & related products 22,180,319 35,616,745
16 Wood products & cork, except furniture; articles of straw & plaiting materials 2,305,861 3,951,841
17 Paper products 15,690,942 27,896,721
18 Printing and reproduction of recorded media 4,862,787 8,645,486
19 Coke & refined petroleum
products 1,309,369 3,422,638
20 Chemical products 37,247,914 60,935,216
21 Pharmaceuticals, medicinal chemical & botanical products 33,880,955 66,024,396
22 Rubber & plastics products 16,903,205 27,142,853
23 Other non-metallic mineral products 110,552,682 229,525,073
24 Basic metals 216,992,159 378,805,097
25 Fabricated metal products,
except machinery & equipment 22,258,815 38,857,407
26 Computer, electronic & optical products 10,776,985 23,824,480
27 Electrical equipment 41,146,392 90,961,564
28 Machinery & equipment N.E.C. 3,912,336 6,829,799
29 Motor vehicles, trailers & semi-trailers 9,970,559 27,452,407
30 Transport equipment 10,290,836 28,334,241
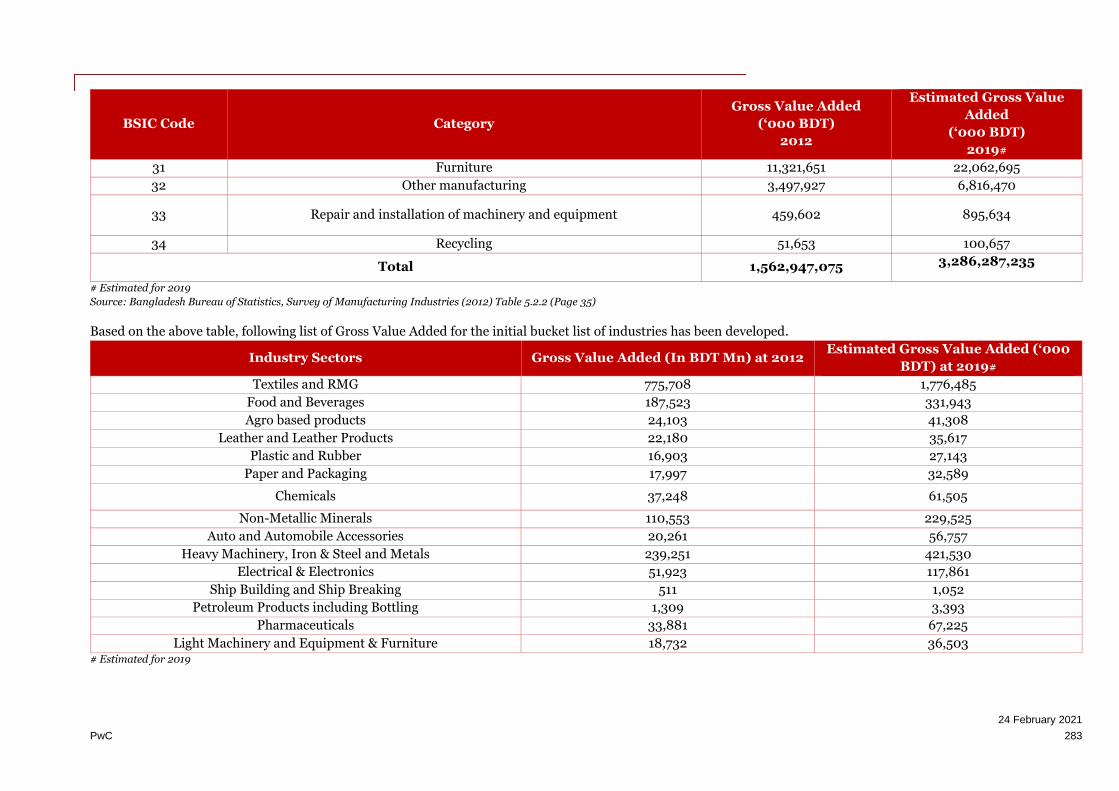
24 February 2021
PwC 283
BSIC Code Category
Gross Value Added
(‘000 BDT)
2012
Estimated Gross Value
Added
(‘000 BDT)
2019#
31 Furniture 11,321,651 22,062,695
32 Other manufacturing 3,497,927 6,816,470
33 Repair and installation of machinery and equipment 459,602 895,634
34 Recycling 51,653 100,657
Total 1,562,947,075 3,286,287,235
# Estimated for 2019
Source: Bangladesh Bureau of Statistics, Survey of Manufacturing Industries (2012) Table 5.2.2 (Page 35)
Based on the above table, following list of Gross Value Added for the initial bucket list of industries has been developed.
Industry Sectors Gross Value Added (In BDT Mn) at 2012 Estimated Gross Value Added (‘000
BDT) at 2019#
Textiles and RMG 775,708 1,776,485
Food and Beverages 187,523 331,943
Agro based products 24,103 41,308
Leather and Leather Products 22,180 35,617
Plastic and Rubber 16,903 27,143
Paper and Packaging 17,997 32,589
Chemicals 37,248 61,505
Non-Metallic Minerals 110,553 229,525
Auto and Automobile Accessories 20,261 56,757
Heavy Machinery, Iron & Steel and Metals 239,251 421,530
Electrical & Electronics 51,923 117,861
Ship Building and Ship Breaking 511 1,052
Petroleum Products including Bottling 1,309 3,393
Pharmaceuticals 33,881 67,225
Light Machinery and Equipment & Furniture 18,732 36,503 # Estimated for 2019

24 February 2021
PwC 284
11.13. Annexure 13 – Estimation of Industrial Growth Rate
Methodology for assessment of COVID 19 Impact on Industry Growth Rates:
• Step-1: In the first step, impact of COVID 19 on every industry was assessed on various parameters such as industry inputs, domestic and international market,
and trade, and possible impact on each industry was rated on a scale of 5.
• Step-2: In second step, growth rates of every industry were decreased in the ratio of the rating received through impact assessment exercise. The Word Bank
revised growth rate estimates for Bangladesh’s industrial sector along with the ratings received were used to calculate the dips in growth rates of every industry
Industry 2019 2020 2021 2022 2023 2024 2025
Textiles and RMG 10.00% -0.10% 0.83% 2.83% 4.31% 5.89% 8.00%
Food and Beverages 8.50% 5.96% 6.41% 7.41% 8.16% 8.95% 10.00%
Agro based products 8.00% 6.38% 7.39% 7.84% 8.17% 8.53% 9.00%
Leather and Leather Products 7.00% 1.53% 2.26% 3.86% 5.05% 6.32% 8.00%
Plastic and Rubber 7.00% 3.15% 3.70% 4.90% 5.79% 6.74% 8.00%
Paper and Packaging 10.00% 5.96% 7.06% 8.16% 8.97% 9.84% 11.00%
Chemicals 8.00% 1.53% 2.83% 4.83% 6.31% 7.89% 10.00%
Non-Metallic Minerals 11.00% 2.68% 3.96% 6.76% 8.84% 11.05% 14.00%
Auto and Automobile Accessories 17.00% 3.26% 4.24% 7.24% 9.47% 11.84% 15.00%
Heavy Machinery, Iron & Steel
and Metals 9.00% 1.72% 2.83% 4.83% 6.31% 7.89% 10.00%
Electrical & Electronics 15.00% 2.87% 4.24% 7.24% 9.47% 11.84% 12.00%
Ship Building and Ship Breaking 12.00% 7.15% 6.41% 7.41% 8.16% 8.95% 10.00%
Petroleum Products including
Bottling 14.00% 2.68% 3.68% 6.28% 8.21% 10.26% 13.00%
Pharmaceuticals 12.00% 9.57% 9.85% 10.45% 10.89% 11.37% 12.00%
Light Machinery and Equipment
& Furniture 15.00% 7.09% 8.32% 11.02% 13.02% 15.16% 18.00%
Industry 2026 2027 2028 2029 2030 2031 2032
Textiles and RMG 9.63% 9.64% 8.00% 8.00% 8.00% 8.00% 8.00%
Food and Beverages 10.82% 10.82% 10.00% 10.00% 10.00% 9.00% 9.00%
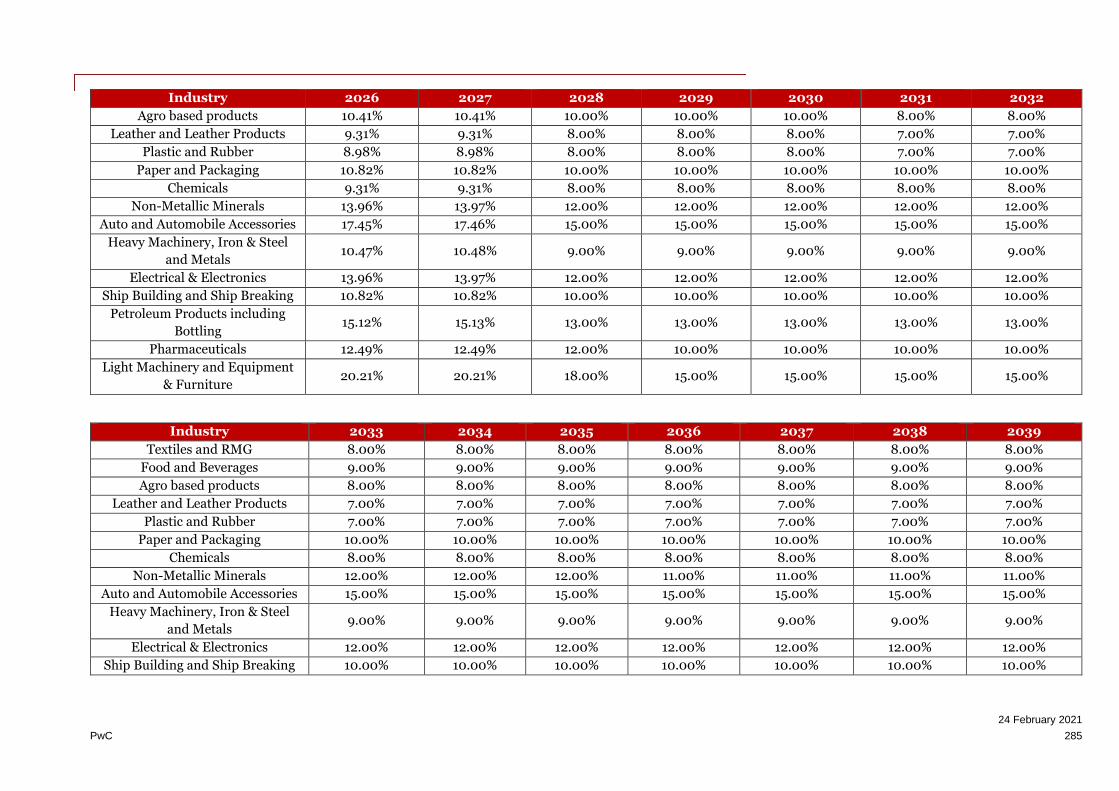
24 February 2021
PwC 285
Industry 2026 2027 2028 2029 2030 2031 2032
Agro based products 10.41% 10.41% 10.00% 10.00% 10.00% 8.00% 8.00%
Leather and Leather Products 9.31% 9.31% 8.00% 8.00% 8.00% 7.00% 7.00%
Plastic and Rubber 8.98% 8.98% 8.00% 8.00% 8.00% 7.00% 7.00%
Paper and Packaging 10.82% 10.82% 10.00% 10.00% 10.00% 10.00% 10.00%
Chemicals 9.31% 9.31% 8.00% 8.00% 8.00% 8.00% 8.00%
Non-Metallic Minerals 13.96% 13.97% 12.00% 12.00% 12.00% 12.00% 12.00%
Auto and Automobile Accessories 17.45% 17.46% 15.00% 15.00% 15.00% 15.00% 15.00%
Heavy Machinery, Iron & Steel
and Metals 10.47% 10.48% 9.00% 9.00% 9.00% 9.00% 9.00%
Electrical & Electronics 13.96% 13.97% 12.00% 12.00% 12.00% 12.00% 12.00%
Ship Building and Ship Breaking 10.82% 10.82% 10.00% 10.00% 10.00% 10.00% 10.00%
Petroleum Products including
Bottling 15.12% 15.13% 13.00% 13.00% 13.00% 13.00% 13.00%
Pharmaceuticals 12.49% 12.49% 12.00% 10.00% 10.00% 10.00% 10.00%
Light Machinery and Equipment
& Furniture 20.21% 20.21% 18.00% 15.00% 15.00% 15.00% 15.00%
Industry 2033 2034 2035 2036 2037 2038 2039
Textiles and RMG 8.00% 8.00% 8.00% 8.00% 8.00% 8.00% 8.00%
Food and Beverages 9.00% 9.00% 9.00% 9.00% 9.00% 9.00% 9.00%
Agro based products 8.00% 8.00% 8.00% 8.00% 8.00% 8.00% 8.00%
Leather and Leather Products 7.00% 7.00% 7.00% 7.00% 7.00% 7.00% 7.00%
Plastic and Rubber 7.00% 7.00% 7.00% 7.00% 7.00% 7.00% 7.00%
Paper and Packaging 10.00% 10.00% 10.00% 10.00% 10.00% 10.00% 10.00%
Chemicals 8.00% 8.00% 8.00% 8.00% 8.00% 8.00% 8.00%
Non-Metallic Minerals 12.00% 12.00% 12.00% 11.00% 11.00% 11.00% 11.00%
Auto and Automobile Accessories 15.00% 15.00% 15.00% 15.00% 15.00% 15.00% 15.00%
Heavy Machinery, Iron & Steel
and Metals 9.00% 9.00% 9.00% 9.00% 9.00% 9.00% 9.00%
Electrical & Electronics 12.00% 12.00% 12.00% 12.00% 12.00% 12.00% 12.00%
Ship Building and Ship Breaking 10.00% 10.00% 10.00% 10.00% 10.00% 10.00% 10.00%
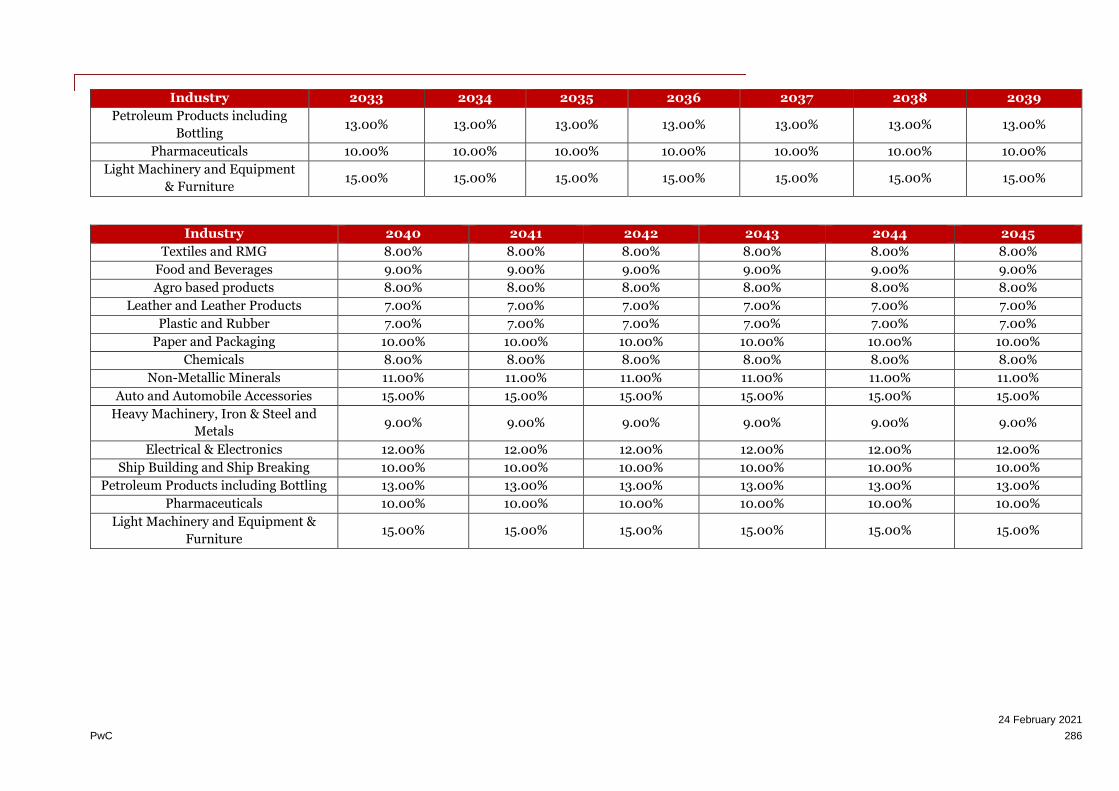
24 February 2021
PwC 286
Industry 2033 2034 2035 2036 2037 2038 2039
Petroleum Products including
Bottling 13.00% 13.00% 13.00% 13.00% 13.00% 13.00% 13.00%
Pharmaceuticals 10.00% 10.00% 10.00% 10.00% 10.00% 10.00% 10.00%
Light Machinery and Equipment
& Furniture 15.00% 15.00% 15.00% 15.00% 15.00% 15.00% 15.00%
Industry 2040 2041 2042 2043 2044 2045
Textiles and RMG 8.00% 8.00% 8.00% 8.00% 8.00% 8.00%
Food and Beverages 9.00% 9.00% 9.00% 9.00% 9.00% 9.00%
Agro based products 8.00% 8.00% 8.00% 8.00% 8.00% 8.00%
Leather and Leather Products 7.00% 7.00% 7.00% 7.00% 7.00% 7.00%
Plastic and Rubber 7.00% 7.00% 7.00% 7.00% 7.00% 7.00%
Paper and Packaging 10.00% 10.00% 10.00% 10.00% 10.00% 10.00%
Chemicals 8.00% 8.00% 8.00% 8.00% 8.00% 8.00%
Non-Metallic Minerals 11.00% 11.00% 11.00% 11.00% 11.00% 11.00%
Auto and Automobile Accessories 15.00% 15.00% 15.00% 15.00% 15.00% 15.00%
Heavy Machinery, Iron & Steel and
Metals 9.00% 9.00% 9.00% 9.00% 9.00% 9.00%
Electrical & Electronics 12.00% 12.00% 12.00% 12.00% 12.00% 12.00%
Ship Building and Ship Breaking 10.00% 10.00% 10.00% 10.00% 10.00% 10.00%
Petroleum Products including Bottling 13.00% 13.00% 13.00% 13.00% 13.00% 13.00%
Pharmaceuticals 10.00% 10.00% 10.00% 10.00% 10.00% 10.00%
Light Machinery and Equipment &
Furniture 15.00% 15.00% 15.00% 15.00% 15.00% 15.00%

24 February 2021
PwC 287
11.14. Annexure 14 – Assumption Related to Investment
Inflow
Greenfield Investment Inflow:
In developing countries, Greenfield investment inflow is 57.85% of total investment inflow.
Source: http://documents.worldbank.org/curated/en/628261468781753575/110510322_20041117173021/additional/325780wps3192.pdf
GDP share of influence region of Sitakundo EZ in Chattogram Division as a proxy of Investment share with respect to the country:
District
Total GDP (Estimated 2018) in Mn USD in Current USD
Chattogram 28037
Feni 2605
Khagrachari 1582
Rangamati 1895
Noakhali 13155
Bangladesh 262512
Contribution of Chattogram division 18.1% Source: http://www.plancomm.gov.bd/wp-content/uploads/2015/02/15_Lagging-Regions-Study.pdf
Incremental Capital Investment to Value Addition
Industry Sectors
Fixed Asset to
Value added
ratio
Total Fixed
Assets (In
BDT Mn) #
Gross Value
added (In BDT
Mn) #
Textiles and RMG 0.74 1,313,004 1,776,485
Food & Beverages 0.84 280,013 331,943
Agro based products 0.45 18,756 41,308
Leather and Footwear 1.29 45,917 35,617
Plastic and Rubber 0.98 26,609 27,143
Paper and Packaging 1.05 34,065 32,589
Chemicals 1.40 86,299 61,505
Non-Metallic Minerals 0.80 92,224 229,525
Auto and Automobile Accessories 0.67 38,266 56,757
Heavy Machinery, Iron & Steel and Metals 0.47 197,544 421,530
Electrical, Electronics and ICT 0.48 57,091 117,861
Ship Building and Ship Breaking 0.63 667 1,052
Petroleum Products including Bottling 1.71 5,805 3,393
Pharmaceuticals 2.05 137,662 67,225
Light Machinery and Equipment & Furniture 0.76 37,625 49,827 #Estimated till 2019
Source: Survey of Manufacturing Industries 2012
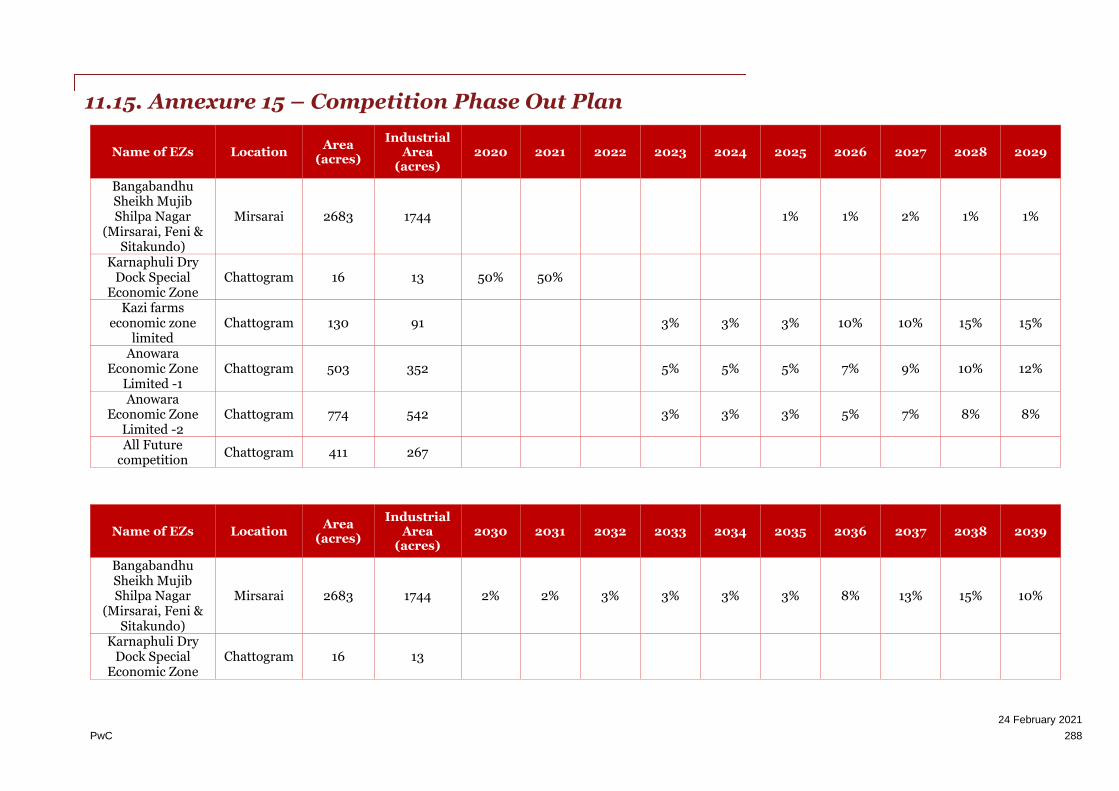
24 February 2021
PwC 288
11.15. Annexure 15 – Competition Phase Out Plan
Name of EZs Location Area
(acres)
Industrial Area
(acres) 2020 2021 2022 2023 2024 2025 2026 2027 2028 2029
Bangabandhu Sheikh Mujib Shilpa Nagar
(Mirsarai, Feni & Sitakundo)
Mirsarai 2683 1744 1% 1% 2% 1% 1%
Karnaphuli Dry Dock Special
Economic Zone Chattogram 16 13 50% 50%
Kazi farms economic zone
limited Chattogram 130 91 3% 3% 3% 10% 10% 15% 15%
Anowara Economic Zone
Limited -1 Chattogram 503 352 5% 5% 5% 7% 9% 10% 12%
Anowara Economic Zone
Limited -2 Chattogram 774 542 3% 3% 3% 5% 7% 8% 8%
All Future competition
Chattogram 411 267
Name of EZs Location Area
(acres)
Industrial Area
(acres) 2030 2031 2032 2033 2034 2035 2036 2037 2038 2039
Bangabandhu Sheikh Mujib Shilpa Nagar
(Mirsarai, Feni & Sitakundo)
Mirsarai 2683 1744 2% 2% 3% 3% 3% 3% 8% 13% 15% 10%
Karnaphuli Dry Dock Special
Economic Zone Chattogram 16 13

24 February 2021
PwC 289
Name of EZs Location Area
(acres)
Industrial Area
(acres) 2030 2031 2032 2033 2034 2035 2036 2037 2038 2039
Kazi farms economic zone
limited Chattogram 130 91 10% 10% 10% 11%
Anowara Economic Zone
Limited -1 Chattogram 503 352 10% 10% 10% 10% 7%
Anowara Economic Zone
Limited -2 Chattogram 774 542 8% 8% 12% 10% 10% 7% 8%
All Future competition
Chattogram 411 267 2% 2% 3% 2% 4% 5% 7% 9% 10% 5%
Name of EZs Location Area
(acres) Industrial
Area (acres) 2040 2041 2042 2043 2044 2045 2046 2047
Bangabandhu Sheikh Mujib Shilpa Nagar
(Mirsarai, Feni & Sitakundo)
Mirsarai 2683 1744 18% 7% 8%
Karnaphuli Dry Dock Special Economic
Zone Chattogram 16 13
Kazi farms economic zone limited
Chattogram 130 91
Anowara Economic Zone Limited -1
Chattogram 503 352
Anowara Economic Zone Limited -2
Chattogram 774 542
All Future competition
Chattogram 411 267 10% 8% 5% 5% 5% 6% 6% 6%

24 February 2021
PwC 290
11.16. Annexure 16 – Demand Forecasting Calculations
Cumulative power demand (Conservative) - figures in MVA
Industry 2025 2026 2027 2028 2029 2030 2031 2032
Chemicals 0.4 0.7 1.1 1.4 1.8 2.2 2.6 3.0
Non-Metallic Minerals 3.0 6.4 9.9 13.3 17.1 21.5 26.4 31.5
Auto and Automobile Accessories 0.4 0.9 1.5 2.0 2.7 3.5 4.3 5.3
Heavy Machinery, Iron & Steel and Metals 2.1 4.5 7.0 9.3 11.8 14.5 17.6 20.6
Petroleum Products including Bottling 0.1 0.2 0.3 0.4 0.5 0.6 0.8 0.9
Total 6.0 12.7 19.8 26.4 33.8 42.3 51.7 61.3
Industry 2033 2034 2035 2036 2037 2038 2039 2040 2041 to
2044
Chemicals 3.6 4.1 4.8 5.4 6.1 6.7 7.6 8.42 8.87
Non-Metallic Minerals 37.7 44.9 53.7 61.6 69.8 78.7 90.5 101.57 108.06
Auto and Automobile Accessories 6.4 7.8 9.6 11.3 13.2 15.4 18.3 21.12 22.85
Heavy Machinery, Iron & Steel and Metals 24.3 28.4 33.3 37.9 42.7 47.8 54.4 60.42 63.91
Petroleum Products including Bottling 1.1 1.3 1.6 1.8 2.1 2.4 2.9 3.27 3.51
Total 73.0 86.6 103.0 118.1 133.9 151.1 173.7 194.80 207.20

24 February 2021
PwC 291
Cumulative power demand (Base) – figures in MVA
Industry 2025 2026 2027 2028 2029 2030 2031 2032
Chemicals 0.4 0.8 1.2 1.5 1.9 2.4 2.9 3.3
Non-Metallic Minerals 3.3 6.9 10.8 14.5 18.7 23.5 28.9 34.5
Auto and Automobile Accessories 0.4 1.0 1.6 2.2 3.0 3.8 4.7 5.8
Heavy Machinery, Iron & Steel and Metals 2.3 4.9 7.6 10.1 12.9 15.9 19.2 22.6
Petroleum Products including Bottling 0.1 0.2 0.3 0.4 0.5 0.7 0.8 1.0
Total 6.5 13.8 21.6 28.9 37.0 46.3 56.6 67.2
Industry 2033 2034 2035 2036 2037 2038 2039 2040 2041 to
2044
Chemicals 3.9 4.5 5.2 5.9 6.6 7.4 8.3 8.99 8.99
Non-Metallic Minerals 41.3 49.2 58.8 67.3 76.4 86.3 99.1 108.10 108.10
Auto and Automobile Accessories 7.1 8.6 10.5 12.4 14.5 16.8 20.0 22.33 22.33
Heavy Machinery, Iron & Steel and Metals 26.6 31.1 36.4 41.5 46.7 52.3 59.5 64.44 64.44
Petroleum Products including Bottling 1.2 1.4 1.7 2.0 2.3 2.7 3.1 3.47 3.47
Total 80.0 94.8 112.6 129.2 146.6 165.5 190.1 207.3 207.3
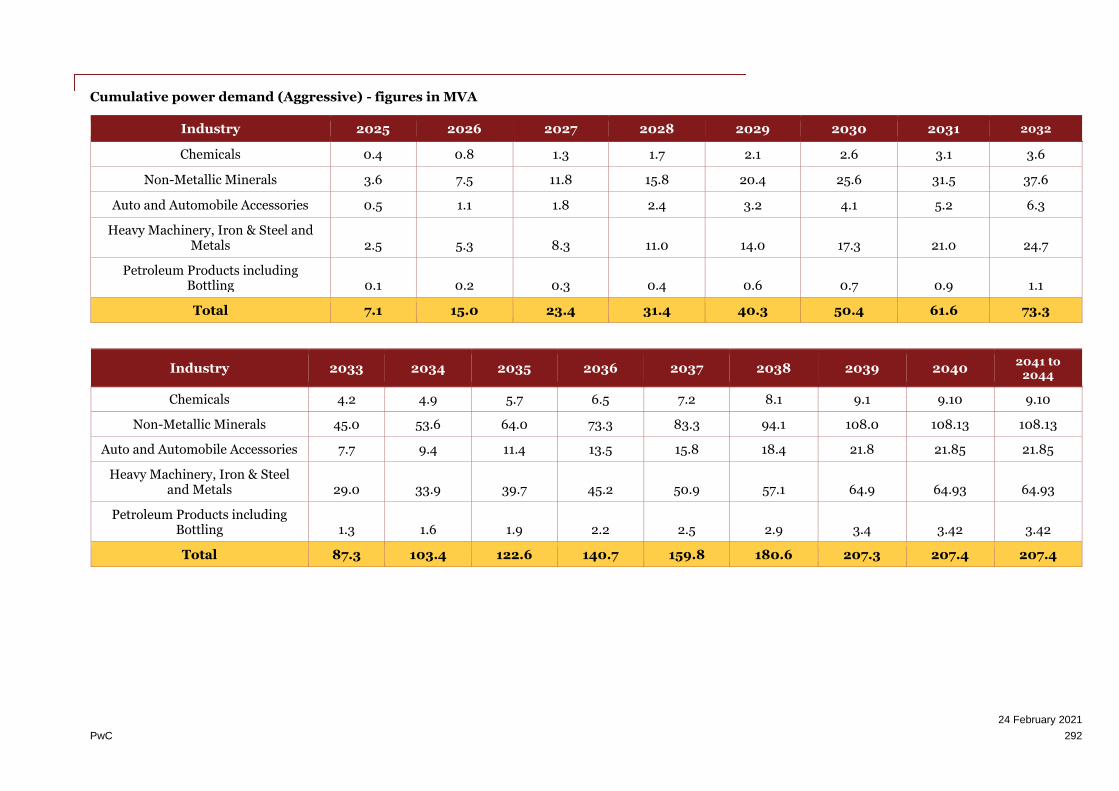
24 February 2021
PwC 292
Cumulative power demand (Aggressive) - figures in MVA
Industry 2025 2026 2027 2028 2029 2030 2031 2032
Chemicals 0.4 0.8 1.3 1.7 2.1 2.6 3.1 3.6
Non-Metallic Minerals 3.6 7.5 11.8 15.8 20.4 25.6 31.5 37.6
Auto and Automobile Accessories 0.5 1.1 1.8 2.4 3.2 4.1 5.2 6.3
Heavy Machinery, Iron & Steel and Metals 2.5 5.3 8.3 11.0 14.0 17.3 21.0 24.7
Petroleum Products including Bottling 0.1 0.2 0.3 0.4 0.6 0.7 0.9 1.1
Total 7.1 15.0 23.4 31.4 40.3 50.4 61.6 73.3
Industry 2033 2034 2035 2036 2037 2038 2039 2040 2041 to
2044
Chemicals 4.2 4.9 5.7 6.5 7.2 8.1 9.1 9.10 9.10
Non-Metallic Minerals 45.0 53.6 64.0 73.3 83.3 94.1 108.0 108.13 108.13
Auto and Automobile Accessories 7.7 9.4 11.4 13.5 15.8 18.4 21.8 21.85 21.85
Heavy Machinery, Iron & Steel and Metals 29.0 33.9 39.7 45.2 50.9 57.1 64.9 64.93 64.93
Petroleum Products including Bottling 1.3 1.6 1.9 2.2 2.5 2.9 3.4 3.42 3.42
Total 87.3 103.4 122.6 140.7 159.8 180.6 207.3 207.4 207.4

24 February 2021
PwC 293
Cumulative water demand (Conservative) - figures in thousand cum/ day (MLD)
Industry 2025 2026 2027 2028 2029 2030 2031 2032
Chemicals 0.12 0.23 0.35 0.46 0.58 0.71 0.85 0.99
Non-Metallic Minerals 1.21 2.54 3.97 5.33 6.85 8.60 10.56 12.58
Auto and Automobile Accessories 0.11 0.24 0.40 0.55 0.72 0.92 1.15 1.40
Heavy Machinery, Iron & Steel and Metals 0.58 1.22 1.89 2.50 3.18 3.93 4.75 5.57
Petroleum Products including Bottling 0.04 0.08 0.13 0.18 0.23 0.30 0.37 0.44
Total 2.05 4.32 6.74 9.01 11.56 14.46 17.68 20.99
Industry 2033 2034 2035 2036 2037 2038 2039 2040 2041 to
2044
Chemicals 1.15 1.34 1.56 1.76 1.97 2.19 2.47 2.73 2.88
Non-Metallic Minerals 15.07 17.96 21.50 24.63 27.92 31.49 36.21 40.63 43.23
Auto and Automobile Accessories 1.71 2.08 2.55 3.02 3.52 4.09 4.87 5.62 6.08
Heavy Machinery, Iron & Steel and Metals 6.56 7.67 9.00 10.25 11.54 12.91 14.69 16.33 17.27
Petroleum Products including Bottling 0.53 0.64 0.77 0.90 1.04 1.19 1.39 1.59 1.71
Total 25.02 29.69 35.38 40.55 45.99 51.87 59.64 66.90 71.16
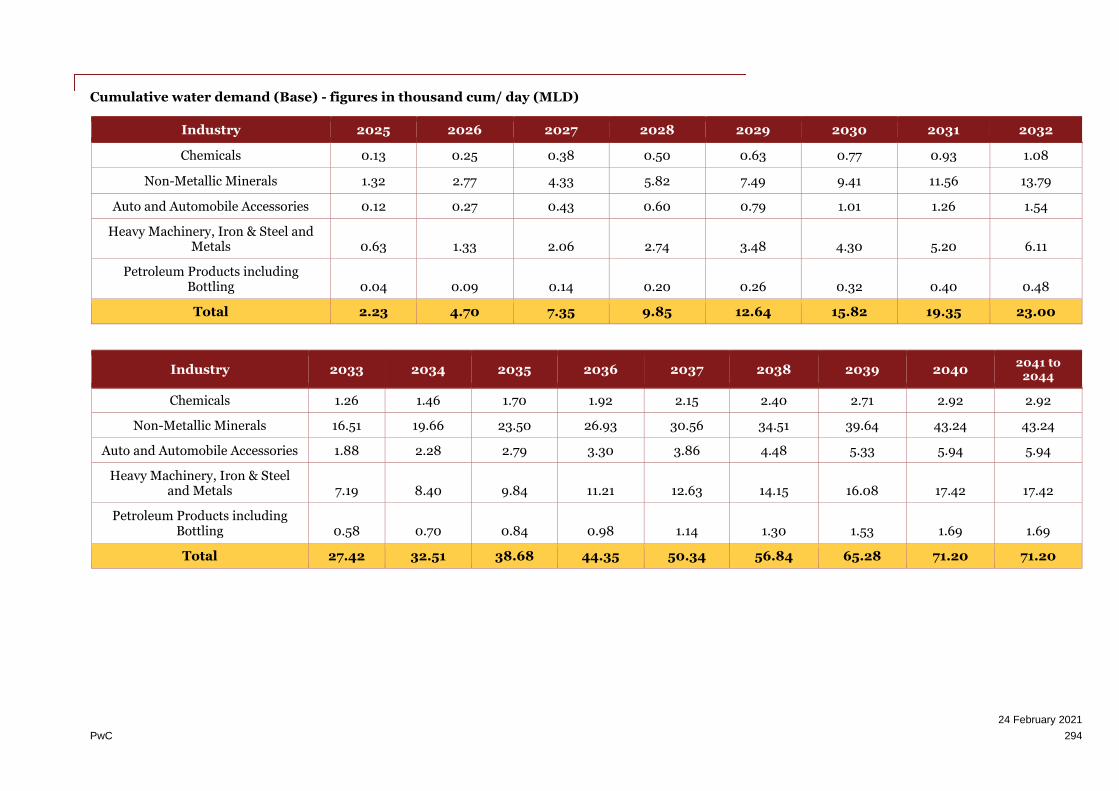
24 February 2021
PwC 294
Cumulative water demand (Base) - figures in thousand cum/ day (MLD)
Industry 2025 2026 2027 2028 2029 2030 2031 2032
Chemicals 0.13 0.25 0.38 0.50 0.63 0.77 0.93 1.08
Non-Metallic Minerals 1.32 2.77 4.33 5.82 7.49 9.41 11.56 13.79
Auto and Automobile Accessories 0.12 0.27 0.43 0.60 0.79 1.01 1.26 1.54
Heavy Machinery, Iron & Steel and Metals 0.63 1.33 2.06 2.74 3.48 4.30 5.20 6.11
Petroleum Products including Bottling 0.04 0.09 0.14 0.20 0.26 0.32 0.40 0.48
Total 2.23 4.70 7.35 9.85 12.64 15.82 19.35 23.00
Industry 2033 2034 2035 2036 2037 2038 2039 2040 2041 to
2044
Chemicals 1.26 1.46 1.70 1.92 2.15 2.40 2.71 2.92 2.92
Non-Metallic Minerals 16.51 19.66 23.50 26.93 30.56 34.51 39.64 43.24 43.24
Auto and Automobile Accessories 1.88 2.28 2.79 3.30 3.86 4.48 5.33 5.94 5.94
Heavy Machinery, Iron & Steel and Metals 7.19 8.40 9.84 11.21 12.63 14.15 16.08 17.42 17.42
Petroleum Products including Bottling 0.58 0.70 0.84 0.98 1.14 1.30 1.53 1.69 1.69
Total 27.42 32.51 38.68 44.35 50.34 56.84 65.28 71.20 71.20

24 February 2021
PwC 295
Cumulative water demand (Aggressive) - figures in thousand cum/ day (MLD)
Industry 2025 2026 2027 2028 2029 2030 2031 2032
Chemicals 0.14 0.27 0.42 0.55 0.69 0.84 1.01 1.18
Non-Metallic Minerals 1.43 3.00 4.71 6.34 8.17 10.26 12.60 15.05
Auto and Automobile Accessories 0.13 0.29 0.47 0.65 0.86 1.10 1.38 1.68
Heavy Machinery, Iron & Steel and Metals 0.68 1.44 2.24 2.98 3.79 4.69 5.67 6.67
Petroleum Products including Bottling 0.04 0.10 0.16 0.21 0.28 0.35 0.44 0.53
Total 2.41 5.10 7.99 10.72 13.77 17.24 21.09 25.10
Industry 2033 2034 2035 2036 2037 2038 2039 2040 2041 to
2044
Chemicals 1.38 1.60 1.85 2.10 2.35 2.62 2.95 2.95 2.95
Non-Metallic Minerals 18.02 21.44 25.59 29.33 33.32 37.65 43.21 43.25 43.25
Auto and Automobile Accessories 2.05 2.49 3.04 3.59 4.20 4.89 5.81 5.82 5.82
Heavy Machinery, Iron & Steel and Metals 7.84 9.16 10.72 12.21 13.77 15.43 17.53 17.55 17.55
Petroleum Products including Bottling 0.64 0.76 0.92 1.07 1.24 1.42 1.66 1.67 1.67
Total 29.92 35.45 42.11 48.31 54.88 62.01 71.17 71.23 71.23
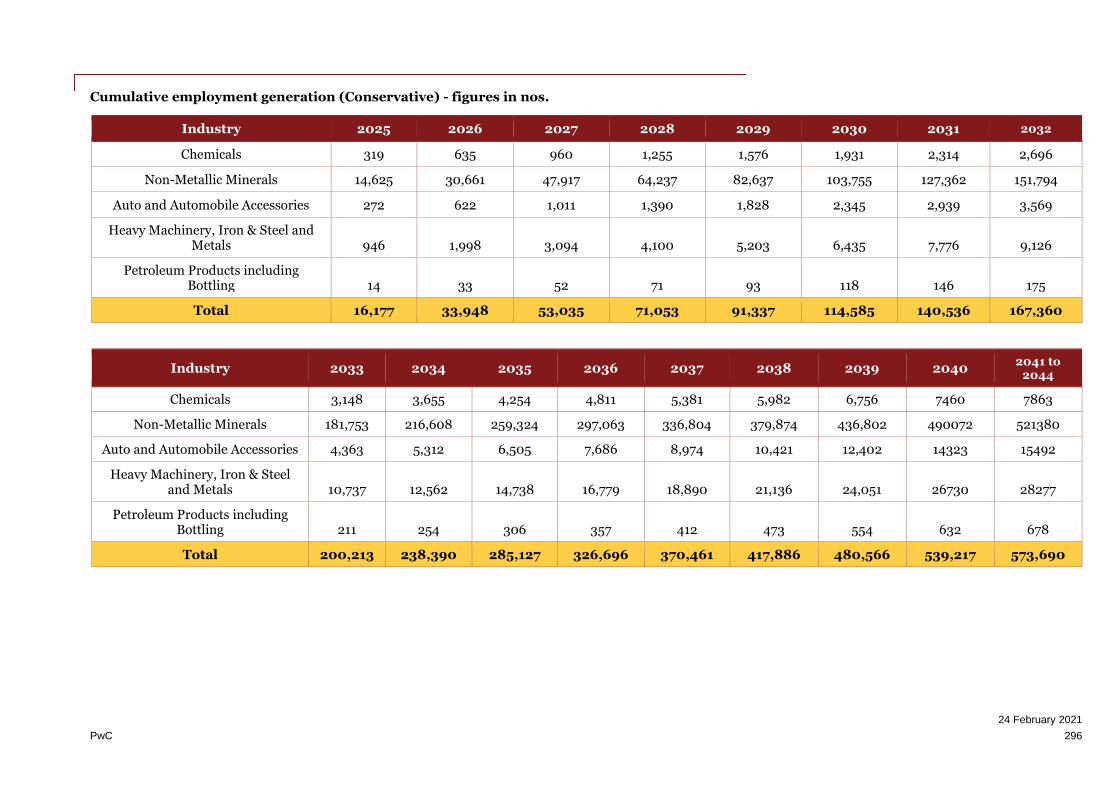
24 February 2021
PwC 296
Cumulative employment generation (Conservative) - figures in nos.
Industry 2025 2026 2027 2028 2029 2030 2031 2032
Chemicals 319 635 960 1,255 1,576 1,931 2,314 2,696
Non-Metallic Minerals 14,625 30,661 47,917 64,237 82,637 103,755 127,362 151,794
Auto and Automobile Accessories 272 622 1,011 1,390 1,828 2,345 2,939 3,569
Heavy Machinery, Iron & Steel and Metals 946 1,998 3,094 4,100 5,203 6,435 7,776 9,126
Petroleum Products including Bottling 14 33 52 71 93 118 146 175
Total 16,177 33,948 53,035 71,053 91,337 114,585 140,536 167,360
Industry 2033 2034 2035 2036 2037 2038 2039 2040 2041 to
2044
Chemicals 3,148 3,655 4,254 4,811 5,381 5,982 6,756 7460 7863
Non-Metallic Minerals 181,753 216,608 259,324 297,063 336,804 379,874 436,802 490072 521380
Auto and Automobile Accessories 4,363 5,312 6,505 7,686 8,974 10,421 12,402 14323 15492
Heavy Machinery, Iron & Steel and Metals 10,737 12,562 14,738 16,779 18,890 21,136 24,051 26730 28277
Petroleum Products including Bottling 211 254 306 357 412 473 554 632 678
Total 200,213 238,390 285,127 326,696 370,461 417,886 480,566 539,217 573,690
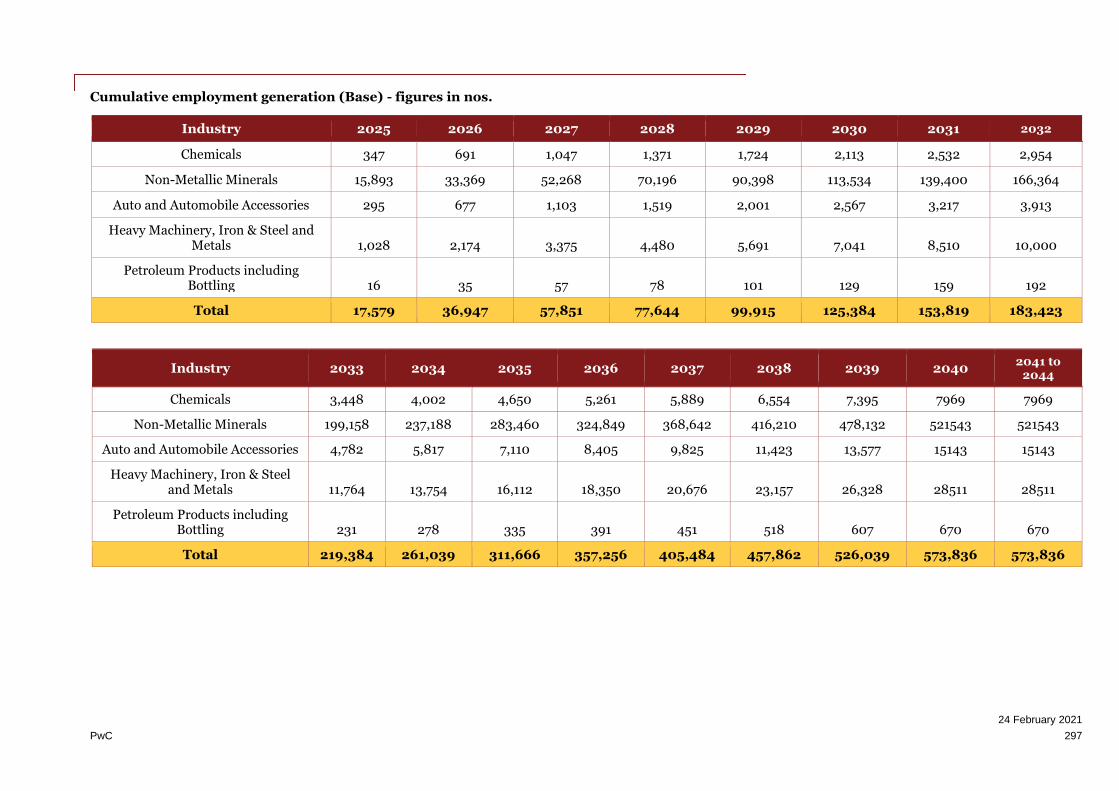
24 February 2021
PwC 297
Cumulative employment generation (Base) - figures in nos.
Industry 2025 2026 2027 2028 2029 2030 2031 2032
Chemicals 347 691 1,047 1,371 1,724 2,113 2,532 2,954
Non-Metallic Minerals 15,893 33,369 52,268 70,196 90,398 113,534 139,400 166,364
Auto and Automobile Accessories 295 677 1,103 1,519 2,001 2,567 3,217 3,913
Heavy Machinery, Iron & Steel and Metals 1,028 2,174 3,375 4,480 5,691 7,041 8,510 10,000
Petroleum Products including Bottling 16 35 57 78 101 129 159 192
Total 17,579 36,947 57,851 77,644 99,915 125,384 153,819 183,423
Industry 2033 2034 2035 2036 2037 2038 2039 2040 2041 to
2044
Chemicals 3,448 4,002 4,650 5,261 5,889 6,554 7,395 7969 7969
Non-Metallic Minerals 199,158 237,188 283,460 324,849 368,642 416,210 478,132 521543 521543
Auto and Automobile Accessories 4,782 5,817 7,110 8,405 9,825 11,423 13,577 15143 15143
Heavy Machinery, Iron & Steel and Metals 11,764 13,754 16,112 18,350 20,676 23,157 26,328 28511 28511
Petroleum Products including Bottling 231 278 335 391 451 518 607 670 670
Total 219,384 261,039 311,666 357,256 405,484 457,862 526,039 573,836 573,836
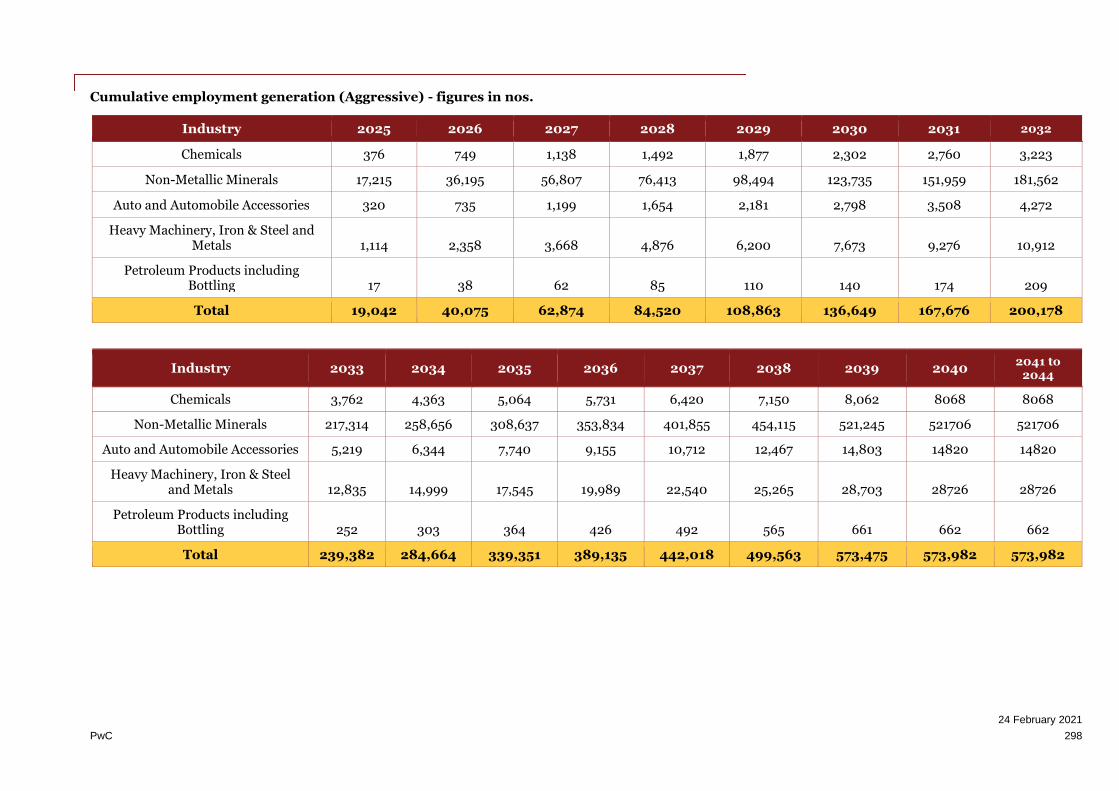
24 February 2021
PwC 298
Cumulative employment generation (Aggressive) - figures in nos.
Industry 2025 2026 2027 2028 2029 2030 2031 2032
Chemicals 376 749 1,138 1,492 1,877 2,302 2,760 3,223
Non-Metallic Minerals 17,215 36,195 56,807 76,413 98,494 123,735 151,959 181,562
Auto and Automobile Accessories 320 735 1,199 1,654 2,181 2,798 3,508 4,272
Heavy Machinery, Iron & Steel and Metals 1,114 2,358 3,668 4,876 6,200 7,673 9,276 10,912
Petroleum Products including Bottling 17 38 62 85 110 140 174 209
Total 19,042 40,075 62,874 84,520 108,863 136,649 167,676 200,178
Industry 2033 2034 2035 2036 2037 2038 2039 2040 2041 to
2044
Chemicals 3,762 4,363 5,064 5,731 6,420 7,150 8,062 8068 8068
Non-Metallic Minerals 217,314 258,656 308,637 353,834 401,855 454,115 521,245 521706 521706
Auto and Automobile Accessories 5,219 6,344 7,740 9,155 10,712 12,467 14,803 14820 14820
Heavy Machinery, Iron & Steel and Metals 12,835 14,999 17,545 19,989 22,540 25,265 28,703 28726 28726
Petroleum Products including Bottling 252 303 364 426 492 565 661 662 662
Total 239,382 284,664 339,351 389,135 442,018 499,563 573,475 573,982 573,982

24 February 2021
PwC 299
Cumulative no. of establishments (Conservative) - figures in nos.
Industry 2025 2026 2027 2028 2029 2030 2031 2032
Chemicals 2 4 6 8 10 12 14 16
Non-Metallic Minerals 5 10 16 21 27 34 42 50
Auto and Automobile Accessories 3 6 10 14 19 24 30 36
Heavy Machinery, Iron & Steel and Metals
1 2 4 5 6 8 10 11
Petroleum Products including Bottling
0 0 0 0 0 0 0 0
Total 11 23 36 48 62 78 96 115
Industry 2033 2034 2035 2036 2037 2038 2039 2040 2041 to
2044
Chemicals 19 22 26 29 33 36 41 45 48
Non-Metallic Minerals 60 72 86 99 112 126 145 163 173
Auto and Automobile Accessories 44 54 66 78 91 106 126 146 158
Heavy Machinery, Iron & Steel and Metals
13 15 18 21 23 26 29 33 35
Petroleum Products including Bottling
1 1 1 1 1 1 2 2 2
Total 138 164 197 228 260 296 343 388 415

24 February 2021
PwC 300
Cumulative no. of establishments (Base) - figures in nos.
Industry 2025 2026 2027 2028 2029 2030 2031 2032
Chemicals 2 4 6 8 11 13 15 18
Non-Metallic Minerals 5 11 17 23 30 38 46 55
Auto and Automobile Accessories 3 7 11 15 20 26 33 40
Heavy Machinery, Iron & Steel and Metals
1 3 4 5 7 9 10 12
Petroleum Products including Bottling
0 0 0 0 0 0 0 1
Total 12 25 39 53 68 86 105 126
Industry 2033 2034 2035 2036 2037 2038 2039 2040 2041 to
2044
Chemicals 21 24 28 32 36 40 45 49 49
Non-Metallic Minerals 66 79 94 108 122 138 159 173 173
Auto and Automobile Accessories 49 59 72 85 100 116 138 154 154
Heavy Machinery, Iron & Steel and Metals
14 17 20 22 25 28 32 35 35
Petroleum Products including Bottling
1 1 1 1 1 1 2 2 2
Total 151 180 215 249 285 324 376 412 412
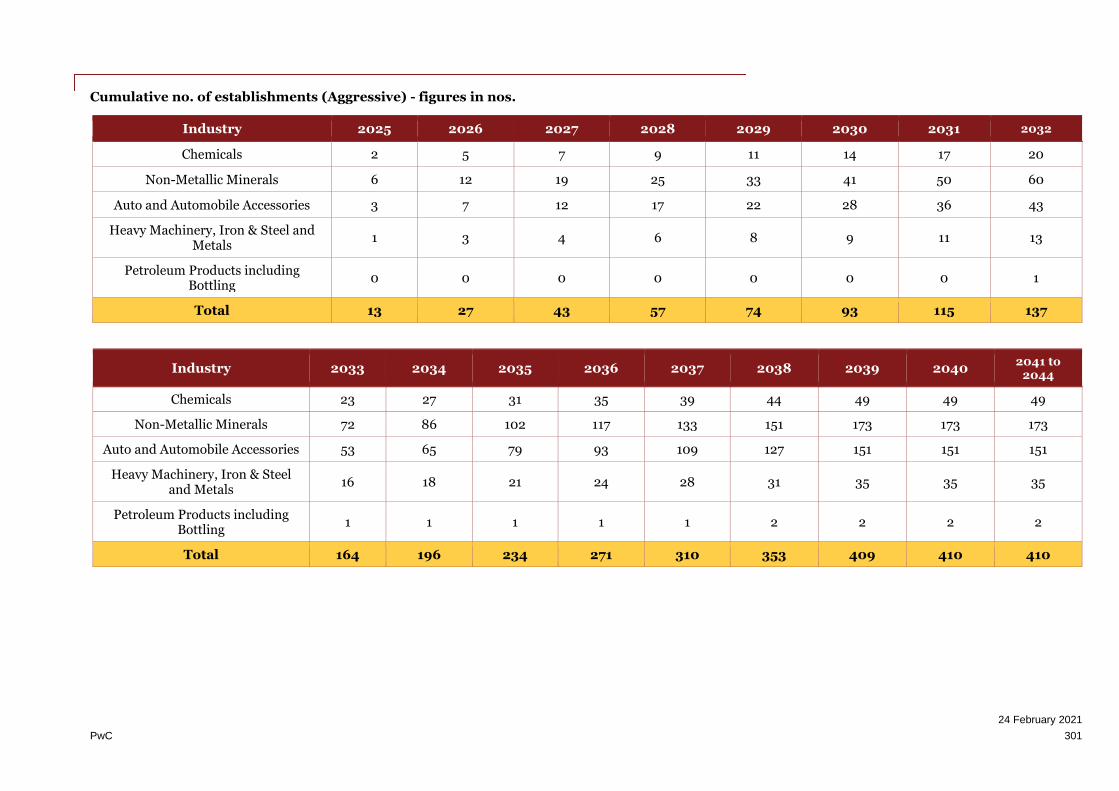
24 February 2021
PwC 301
Cumulative no. of establishments (Aggressive) - figures in nos.
Industry 2025 2026 2027 2028 2029 2030 2031 2032
Chemicals 2 5 7 9 11 14 17 20
Non-Metallic Minerals 6 12 19 25 33 41 50 60
Auto and Automobile Accessories 3 7 12 17 22 28 36 43
Heavy Machinery, Iron & Steel and Metals
1 3 4 6 8 9 11 13
Petroleum Products including Bottling
0 0 0 0 0 0 0 1
Total 13 27 43 57 74 93 115 137
Industry 2033 2034 2035 2036 2037 2038 2039 2040 2041 to
2044
Chemicals 23 27 31 35 39 44 49 49 49
Non-Metallic Minerals 72 86 102 117 133 151 173 173 173
Auto and Automobile Accessories 53 65 79 93 109 127 151 151 151
Heavy Machinery, Iron & Steel and Metals
16 18 21 24 28 31 35 35 35
Petroleum Products including Bottling
1 1 1 1 1 2 2 2 2
Total 164 196 234 271 310 353 409 410 410
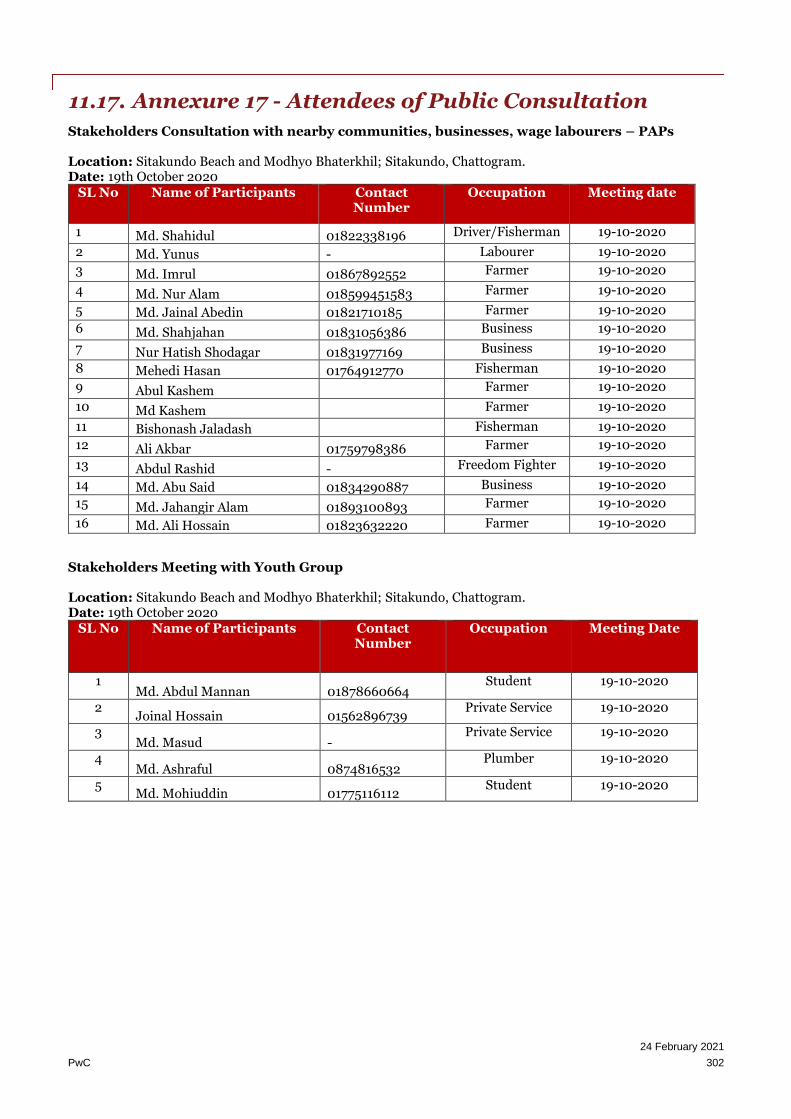
24 February 2021
PwC 302
11.17. Annexure 17 - Attendees of Public Consultation
Stakeholders Consultation with nearby communities, businesses, wage labourers – PAPs
Location: Sitakundo Beach and Modhyo Bhaterkhil; Sitakundo, Chattogram. Date: 19th October 2020
SL No Name of Participants Contact Number
Occupation Meeting date
1 Md. Shahidul 01822338196 Driver/Fisherman 19-10-2020
2 Md. Yunus - Labourer 19-10-2020
3 Md. Imrul 01867892552 Farmer 19-10-2020
4 Md. Nur Alam 018599451583 Farmer 19-10-2020
5 Md. Jainal Abedin 01821710185 Farmer 19-10-2020
6 Md. Shahjahan 01831056386 Business 19-10-2020
7 Nur Hatish Shodagar 01831977169 Business 19-10-2020
8 Mehedi Hasan 01764912770 Fisherman 19-10-2020
9 Abul Kashem Farmer 19-10-2020
10 Md Kashem Farmer 19-10-2020
11 Bishonash Jaladash Fisherman 19-10-2020
12 Ali Akbar 01759798386 Farmer 19-10-2020
13 Abdul Rashid - Freedom Fighter 19-10-2020
14 Md. Abu Said 01834290887 Business 19-10-2020
15 Md. Jahangir Alam 01893100893 Farmer 19-10-2020
16 Md. Ali Hossain 01823632220 Farmer 19-10-2020
Stakeholders Meeting with Youth Group Location: Sitakundo Beach and Modhyo Bhaterkhil; Sitakundo, Chattogram. Date: 19th October 2020
SL No Name of Participants Contact Number
Occupation Meeting Date
1 Md. Abdul Mannan 01878660664
Student 19-10-2020
2 Joinal Hossain 01562896739
Private Service 19-10-2020
3 Md. Masud -
Private Service 19-10-2020
4 Md. Ashraful 0874816532
Plumber 19-10-2020
5 Md. Mohiuddin 01775116112
Student 19-10-2020

24 February 2021
PwC 303
11.18. Annexure 18 - Project Boundary shown on Mouza Map

E 348000 m
E 352000 m
E 356000 m
E 360000 m
E 364000 m
N 2496000 m
N 2500000 m
N 2504000 m
N 2508000 m
N 2512000 m
Proposed site
Proposed embankment
National road
Other road
Railway line
10km radius
Agriculture
Settlements
Reserved forest
Charland
Water body
Town/village
Railway station
LEGEND:
Proposed site
22°37'59.22"N
91°35'29.65"E
0.0 2 4 6 8km
Sitakunda
rly stn
Muradpur
Saidpur
Mohanagar
Satbaria
T
o
F
e
n
i
r
l
y
s
t
n
(
4
1
k
m
)
T
o
F
e
n
i
(
4
3
k
m
)
T
o
C
h
i
t
t
a
g
o
n
g
r
l
y
s
t
n
(
3
6
k
m
)
T
o
C
h
itta
g
o
n
g(3
3
k
m
)
Bay of Bengal
N
1
N
1
P
r
o
p
o
s
e
d
e
m
b
a
n
k
m
e
n
t
Drawing no : Rev no :
Project title
Drawing title
Development of economiczone - Sitakundo,Bangladesh
Land use layout

24 February 2021
PwC 304
11.19. Annexure 19 – Affected Plot detail

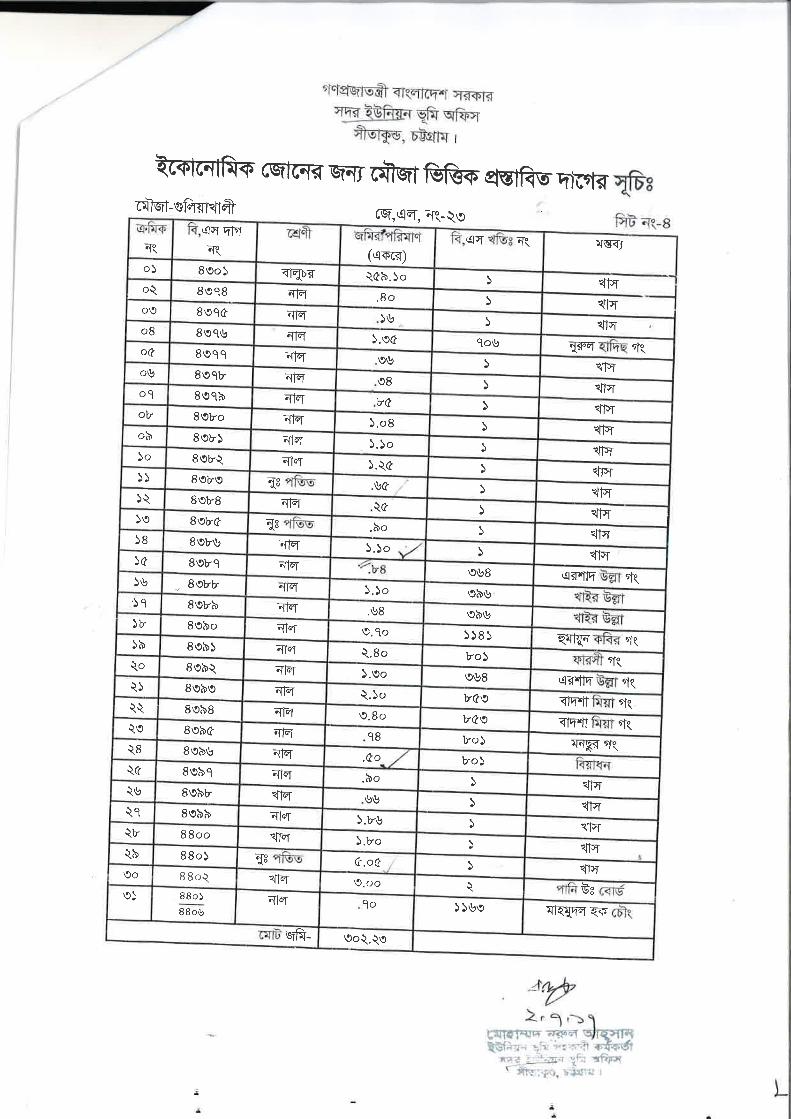


24 February 2021
PwC 305
11.20. Annexure 20- Baseline Monitoring Map

Environmental Baseline Report
(January, 2021)
BANGLADESH ENVIRONMENTAL ENGINEERING
TRAINING & LAB SERVICES LTD. Mamun Plaza (First Floor), 31, ShahidNazrul Islam Sharak, Hatkhola, Tikatuli, Dhaka - 1203, Bangladesh,
Phone: +88-02-7175845, 7118094, Mobile: +88 01715185643
Email: [email protected]
Sitakundo Economic Zone

Sitakundo Economic Zone
ii | P a g e Environmental Monitoring Report
EXECUTIVE SUMMARY
Bangladesh has been depicting sound growth with Gross Domestic Product (GDP) growth rate
ranging over 6% in the last decade. The country is taking rapid strides towards shaping up as a
“developed economy” by 2041. The country aims to become efficiency driven economy in the
future by focusing on efficient process and technology enablement to produce specialized
products and to obviate the import dependency. For the economic development of nation of a
country, investment is a crucial component that cannot be overlooked. Bangladesh has a broad
market oriented economy and offers the most investor friendly regulatory regime in South Asia.
The country provides trainable, enthusiastic, hardworking and competent labor force for labor
intensive industries. Bangladesh is a highly populated country. Economic growth will enhance
the purchasing power of that population and make the country a significantly big market.
Bangladesh is endowed with abundant supply of natural gas, water, and its soil is very fertile.
The Geographical location of the country is ideal for global trade with very convenient access to
international sea and air route. Current government has targeted to make Bangladesh a middle
income country within 2021 by creating economic zones in different investment sectors under
the constitution of Bangladesh Economic Zone Authority (BEZA).
Sitakundo Economic Zone is spread over an area of approximately 2206.84 acres (entirely
government land) out of which 1,273.58 acres falls under BSMSN, thus the proposed EZ can
leverage the offsite and onsite infrastructure planned for BSMSN. It is located in Sitakundo and
Mirsarai upazilas of Chittagong district in Chittagong division.
Geographic Location of the project area is 22°39'42.35"N, 91°34'17.39"E. Total area of the site
is 2206.84 acres (out of which 1,273.58 acres is within BSMSN) where 2206.84 acres comes
from Government Land/ Khas land. Current land use pattern of the economic zone is Water
channels, Embankment road, agricultural land (single cropping) and settlements.
Air Quality Monitoring
The condition of environmental quality in the locality of project site serves as the basis for
identification, prediction and evaluation of impacts. The environmental quality was assessed
through extensive field visits within the project impact zone for various components of the
environment and in order to depict the existing physical environment in the project area.
Sitakundo Economic Zone
iii | P a g e Environmental Monitoring Report
The result found for ambient air quality monitoring shows concentrations of the SPM, SO2 and
NO2. From the results it is discernible that all the parameters are within the permissible limits.
Monitoring of Noise Level
Noise is an important environmental physical pollutant. A survey by the U S. Federal Council of
Science and Technology has revealed that noise is a technology generated problem and that the
overall loudness of environmental noise doubles every ten years in pace with our social and
industrial progress. This geometric progression wise growth of noise could be mind-boggling in
view of the ever-increasing pace of technological growth. Noise quality has been measured
instantly on the site by Noise level meter. At each location Leq data was taken uninterruptedly
for 8 hours. At the time of measurement, whenever there was an interfering effect was also
recorded. According to the Department of Environment (ECR-1997), the standard for ambient
noise level in the industrial zone is 75 decibels at day & 70 decibels at night. In that case all the
results were found within the limit as per DoE Standards.
Monitoring of Surface & Ground Water
Water quality is one of the important indicators of the environment. Surface and Groundwater
samples were collected from the shallow water bodies adjacent to the proposed EZ and a tube
well respectively to understand the baseline condition of the water quality in the study area.
Major physicochemical parameters such as pH, EC and TDS, of the surface water quality were
measured in-situ during the field visit while the rests were measured in the lab. For the
groundwater, water sample was collected from the tube-wells at the identified area and tested
in BEETLSL Environmental Laboratory. The test result shows that most of the tested parameters of
both ground water and surface water were found within the national standard set by government of
Bangladesh but the label of total Iron in ground water was found above the standard.

vi | P a g e
Sitakundo Economic Zone
Environmental Monitoring Report
List of Contents
EXECUTIVE SUMMARY ......................................................................................................................................................................... II
AIR QUALITY MONITORING .............................................................................................................................................................................. II MONITORING OF NOISE LEVEL ......................................................................................................................................................................... III MONITORING OF SURFACE & GROUND WATER ................................................................................................................................................... III
1 INTRODUCTION ............................................................................................................................................................................ 1
1.1 PROJECT BACKGROUND ...................................................................................................................................................................... 1 1.2 PURPOSE OF THE REPORT.................................................................................................................................................................... 2 1.3 LOCATIONS OF THE PROJECT AREAS ...................................................................................................................................................... 2 1.4 SCOPE OF WORKS ............................................................................................................................................................................. 3
2 LEGISLATIVE, REGULATION AND POLICY CONSIDERATION ........................................................................................................... 5
2.1 THE BANGLADESH ENVIRONMENT CONSERVATION ACT OF 1995 (ECA, 1995) ............................................................................................ 5 2.2 THE BANGLADESH ENVIRONMENT CONSERVATION ACT (AMENDMENT), 2000 FOCUSES ON ........................................................................... 6 2.3 THE BANGLADESH ENVIRONMENT CONSERVATION ACT (AMENDMENT), 2002 ELABORATES ON ...................................................................... 6 2.4 THE BANGLADESH ENVIRONMENT CONSERVATION ACT (AMENDMENT), 2010 ............................................................................................. 6 2.5 THE BANGLADESH ENVIRONMENT CONSERVATION RULES, 1997 ............................................................................................................... 6 2.6 NOISE POLLUTION (CONTROL) RULES, 2006 .......................................................................................................................................... 7 2.7 THE BANGLADESH WATER ACT 2013 ................................................................................................................................................... 7 2.8 IFC SAFEGUARD POLICIES ................................................................................................................................................................... 9
3 METHODOLOGY ........................................................................................................................................................................... 9
3.1 SAMPLING DETAILS ............................................................................................................................................................................ 9 3.2 METHODOLOGY OF DETERMINING AIR QUALITY PARAMETERS ................................................................................................................. 10
3.2.1 SPM (Suspended Particulate Matter) Gravimetric Method ................................................................................................... 11 3.2.2 Sulfur Dioixide (SO2): Principle of west-geake method: ......................................................................................................... 12 3.2.3 Nitrogen Dioixide (NO2): ........................................................................................................................................................ 12
3.3 METHODOLOGY OF NOISE LEVEL ANALYSIS .......................................................................................................................................... 13 3.4 METHODOLOGY OF SURFACE WATER QUALITY TEST: .............................................................................................................................. 14 3.5 METHODOLOGY OF GROUND WATER QUALITY TEST: .............................................................................................................................. 15
4 RESULT AND DISCUSSION: ......................................................................................................................................................... 15
4.1 AMBIENT AIR QUALITY MONITORING RESULT: ...................................................................................................................................... 15 4.2 NOISE INSPECTION RESULTS: ............................................................................................................................................................. 17 4.3 SURFACE WATER QUALITY TEST RESULT ............................................................................................................................................... 20 4.4 GROUND WATER QUALITY TEST RESULT ............................................................................................................................................... 21
5 INTERPRETATION ....................................................................................................................................................................... 23
5.1 AIR QUALITY MONITORING REPORT: .................................................................................................................................................. 23 5.2 INTERPRETATION ON NOISE INSPECTION REPORT: .................................................................................................................................. 24 5.3 INTERPRETATION ON GROUND WATER TEST REPORT: ............................................................................................................................. 24 5.4 INTERPRETATION ON SURFACE WATER TEST REPORT: ............................................................................................................................. 25

vi | P a g e
Sitakundo Economic Zone
Environmental Monitoring Report
List of Tables
Table 1.1: Primary monitoring for ambient air, ambient noise, groundwater and surface water………………………………….… 04
Table 3.1: Sampling Location for primary monitoring of ambient air, ambient noise, groundwater and surface water……10
Table 3.2: Time Duration of Sample Collection……………………………………………………………………………………………………..………..…11
Table 3.3: Instrument Specification for Noise Level ………………………………………………………………………………………………………….14
Table 4.1: Test Result of Ambient Air Quality Analysis ……………………………………………….……………….…….……………………….….…16
Table 4.2: Description of the Surrounding Environment……………………………………………..………………………………………..………..…17
Table 4.3: Inspection Result of Noise Level…………………………………………………….…………………………………………………..…………....18
Table 4.4: Test Report of Surface Water (River Water)……………………………………………………………………………………………..….…..21
Table 4.5: Test Report of Ground Water (Tubewell Water)………………………..……..…………………………………………………….…..……23
List of Figures
Figure 1.1: Project location…………………………………………………………………………………………………………….………..………………….……03
Figure 3.1: Location map of the Sample Collection Point…………………………………………………………..…………..…..………………...….10
Figure 3.2: Air Quality Test …..........................……………………………………………………………………………………..…...........................13
Figure 3.3: Noise Inspection…............................. ……………………………………............................................................................14
Figure 3.4: Surface Water Sample Collection …............................. ………………………..…..……………………………………………….……15
Figure 3.5: Ground Water Sample Collection …............................. ……………………………………………….……….………………….……..15

vi | P a g e
Sitakundo Economic Zone
Environmental Monitoring Report
ABBREVIATIONS AND NOTATIONS
ASTM
AASHTO
BNBC
API
:
:
:
American Society for Testing and Materials
American Association of State Highway Transportation Official
Bangladesh National Building Code
American Petroleum Institute
B.M : Bench Mark
EGL : Existing Ground Level
F.M : Fineness Modulus
SBC : Safe Bearing Capacity
FoS : Factor of Safety
GWT : Ground Water Table
KN : Kilo Newton
LL : Liquid Limit
MN : Mega Newton
MPa : Mega Pascal
NBC : Net Bearing Capacity
TBM : Temporary Bench Mark
USCS : Unified Soil Classification System
UCT : Unconfined Compression Test
UD : Undisturbed Sample
Cc : Compression index
Cr : Recompression index
Cs ; Swelling index
Cz : Coefficient of curvature
Cu : Coefficient of uniformity
cu : Undrained shear strength
c : Apparent cohesion
F : Silt factor
Fb : Unit end bearing
Fs : Unit skin friction

vi | P a g e
Sitakundo Economic Zone
Environmental Monitoring Report
Nc : Bearing capacity factor
Qult : Ultimate load bearing capacity
Qs : Friction or shaft friction or side shear of the pile
Qb : Base or tip of the pile
qu : Unconfined compression strength
σ´z : Effective stress
σ : Normal stress
τ : Shearing stress
ε : Strain
Sitakundo Economic Zone
Environmental Monitoring Report Page | 1
1 INTRODUCTION
1.1 Project Background
Sitakundo Economic Zone is going to be a government approved multi-sector Economic Zone in
the country. The proposed EZ is spread over an area of approximately 2206.84 acres (entirely
government land) out of which 1,273.58 acres falls under BSMSN, thus the proposed EZ can
leverage the offsite and onsite infrastructure planned for BSMSN. It is located in Sitakundo and
Mirsarai upazilas of Chittagong district in Chittagong division. Nearest highway connectivity to
the proposed EZ is Dhaka-Chittagong highway (N1) which is ~8 km from the proposed EZ. At
present, last mile approach to proposed EZ is via ~8 km long pitched road (~3 m wide) which
connects the proposed EZ with N1. As per Draft Report of BSMSN Master Plan IV (by Sheltech)
report, the proposed EZ will have access to/from N1 via road networks within BSMSN to
support the movement of heavy cargo. N1 connects the proposed EZ with Chittagong (~51 km),
Comilla (~116) and Dhaka (~226 km). The nearest rail head is at Sitakundo which is at a distance
of around 19 km from the proposed EZ. Chittagong seaport is at distance of ~51 km from the
proposed EZ. The proposed Mirsarai port (to come up within BSMSN) is located in close
proximity (~1 km) to the proposed EZ. Chandpur river port is the nearest river port which is
located at a distance of ~177 km from the proposed EZ. There are few water channels in the
vicinity of the proposed EZ (Mohuri Lake). However, due to the salinity levels it cannot be relied
a source of water. Tube wells and water reservoirs envisaged within BSMSN can act as surface
water sources for the proposed EZ. The nearest power source is 132/33 kV Baroawliya sub-
station (~20 km having capacity of 240 MVA with a surplus of ~20 MVA. Apart from this, 230/33
kV grid substation within BSMSN having capacity of 2×120/180 is envisaged by PGCB. As per
Draft Report of BSMSN Master Plan IV (by Sheltech) report, 150 MW solar power plant is
proposed in the master plan of BSMSN. Nearest gas station is Barabkundu gas station (~5 km) in
Sitakundo Upazila. Utility requirements (power, water and gas) and the possible strategies to
source the same would be assessed in the draft final report. BEZA may request relevant nodal
agencies to extend the utility connection to the proposed EZ. Basic social infrastructure
(medical, residential, and academic) are available in this region to cater to the requirements of
unskilled and semi-skilled manpower. Quality social infrastructure (medical, residential, and 18

Sitakundo Economic Zone
Environmental Monitoring Report Page | 2
June 2020 PwC 13 academic facilities suitable for expats, executives and skilled human
resources) is available in Chittagong. In addition, proposed EZ could also leverage the world-
class social infrastructure facilities envisaged within BSMSN.
The proposed project is one of the environmental friendly projects. As enhancement plan, BEZA
will develop a green belt in the EZ site. However to ensure the proper planning at first it is
necessary to identify the impact so baseline monitoring is essential issue. Bangladesh
Environmental Engineering Training & Lab Services Ltd. (BEETLSL) will perform these overall
baseline survey for executing the said project for Environmental Compliance of the client.
1.2 Purpose of the Report
The main purpose of this Environmental Baseline Monitoring Report is to understand the
current conditions of the area, and how the project needs to be implemented considering these
conditions. Second, it helps us assess and predict the possible environmental changes that
could occur, once the project is underway.
1.3 Locations of the Project Areas
Proposed EZ is located in Sitakundo and Mirsarai upazilas of Chittagong district in Chittagong
division. Regional landscape of Chittagong district indicates dependency on non-farm activities.
The industrial eco-system of the district is characterized by the dominance of the
manufacturing sector (such as shipbuilding/shipbreaking, iron & steel, textile and RMG, cement,
food processing, steel, light engineering, furniture etc). A part of the proposed EZ (1,273.58
acres) falls within the precinct plan of Bangabandhu Sheikh Mujib Shilpa Nagar (BSMSN) which
is the flagship project of BEZA. The remaining portion i.e. 933.26 acres (out of total alienated
area of 2,206.84 acres) is located in the outside the BSMSN in the Sitakundo upazila. The
BSMSN comprises of three EZs- Mirsarai and Sitakundo in Chittagong district and Sonagazi in
Feni district.2 It is the biggest industrial city in the country and is currently developed by BEZA
on ~30,000 acres of land spread across Mirsarai and Sitakundo upazila in Chittagong district and
Sonagazi upazila in Feni district. It is developed with a target of creating employment
opportunities for 15 lakh people within the next 15 years and generating exports worth $15
billion.

Sitakundo Economic Zone
Environmental Monitoring Report Page | 3
Figure 1.1: Project location
1.4 Scope of Works
BEETLSL has been engaged by PricewaterhouseCoopers Private Limited (“PwC”) for preparing
Environmental Baseline monitoring report of Sitakundo Economic Zone. A baseline study is
essential in order to be able to determine the level of impact expected and to enable the
monitoring of impacts after the development has occurred. According to the Technical
specification, the environmental baseline report of this project includes following scope of
work:
• Conducting primary monitoring for ambient air, ambient noise, groundwater and
surface water as per the below scope in accordance to Bangladesh DoE, WHO, etc.
guidelines;
• Baseline Monitoring report by elaborating sampling, preservation technique,
transportation and analysis methodology for each and every parameters;
• The baseline monitoring report must explain results with proper inferences and
compare with prevailing standards of DoE-Bangladesh, WHO, etc. and

Sitakundo Economic Zone
Environmental Monitoring Report Page | 4
• Photographs and GPS coordinates for all the monitoring / sampling locations must be
taken and should be presented in the report.
Table 1.1: Primary monitoring for ambient air, ambient noise, groundwater and surface water
Environmental Component Parameters/Activities
Air Quality SO2, NO2, SPM.
Noise Measurement (Leq) (8 hours average days and nights as per DoE requirement)
Surface Water Quality pH, Total Dissolved Solids (TDS), EC, BOD5 day, COD, Chlorine.
Groundwater Quality Total Dissolved Solid (TDS), BOD5, COD, Turbidity, Total Coliform, Fecal
Coliform, Total Iron.

Sitakundo Economic Zone
Environmental Monitoring Report Page | 5
2 LEGISLATIVE, REGULATION AND POLICY CONSIDERATION
2.1 The Bangladesh Environment Conservation Act of 1995 (ECA, 1995)
The Bangladesh Environment Conservation Act of 1995 (ECA, 1995) is the key legislation in
relation to environment protection in Bangladesh. This Act is promulgated for environment
conservation, standards, development, pollution control, and abatement. It has repealed the
Environment Pollution Control Ordinance of 1977. The Act has been amended in 2000, 2002,
2007 and 2010. This law governs all environmental degradation and pollution management
issues including impacts management due to implementation of any development projects as
well.
The main objectives of the Act are:
• Conservation and improvement of the environment; and
• Control and mitigation of pollution of the environment.
The main strategies of the Act can be summarized as:
• Declaration of ecologically critical areas and restriction on the operations and
processes, which can or cannot be carried/initiated in the ecologically critical
areas;
• Regulations in respect of vehicles emitting smoke harmful for the environment;
• Environmental clearance;
• Regulation of the industries and other development activities’ discharge permits;
• Promulgation of standards of ECR (1997) and also IFC HES standards guidelines
(whichever is stringent) for quality of air, water, noise and soil for different areas
for different purposes;

Sitakundo Economic Zone
Environmental Monitoring Report Page | 6
• Promulgation of a IFC HES thermal power plant standard limit for discharging
and emitting waste; and
• Formulation and declaration of environmental guidelines (ECR, 1997).
2.2 The Bangladesh Environment Conservation Act (Amendment), 2000 Focuses on
(1) Ascertaining responsibility for Compensation in cases of damage to ecosystems, (2)
increased provision of punitive measures both for fines and imprisonment and (3) fixing
authority on cognizance of offences.
2.3 The Bangladesh Environment Conservation Act (Amendment), 2002 Elaborates on
(1) restriction on polluting automobiles, (2) restriction on the sale and production of
environmentally harmful items like polythene bags, (3) assistance from law enforcement
agencies for environmental actions, (4) break up of punitive measures and (5) authority to try
environmental cases.
2.4 The Bangladesh Environment Conservation Act (Amendment), 2010
This act introduces new rules & restriction on: a) Ensure proper management of hazardous
wastes to prevent environmental pollution and Health Risk, b) No remarked water body cannot
be filled up/changed; in case of national interest; it can be done after getting clearance from
the respective department; and c) Emitter of any activities/incident will be bound to control
emission of environmental pollutants that exceeds the existing emission standards (d)
Government may declare any ecosystem as “Ecologically Critical Area(ECA)” if it appears to be
degraded or expected to be degraded and take all precaution measures to protect that
ecosystem. In addition, Government shall stop any ongoing activities and will not allow any new
developments in the ecosystem after declaration of “Ecologically Critical Area”.
2.5 The Bangladesh Environment Conservation Rules, 1997
This is the first set of rules, promulgated under the ECA, 95 (so far there have been three
amendments to this set of rules – February and August 2002 and April 2003). The Environment
Conservation Rules of 1997 has provided categorization of industries and Projects and
Sitakundo Economic Zone
Environmental Monitoring Report Page | 7
identified types of environmental assessments needed against respective categories of
industries or Projects.
Among other things, these rules set (i) the National Environmental Quality Standards for
ambient air, various types of water, industrial effluent, emission, noise, vehicular exhaust etc.,
(ii) the requirement for and procedures to obtain environmental clearance, and (iii) the
requirement for IEE and EIA’s according to categories of industrial and other development
interventions.
2.6 Noise Pollution (Control) Rules, 2006
Noise Pollution (Control) Rules, 2006 gives the authority to all the Union Councils, Paurasabhas,
City Corporations, City Development Authority (i.e. RAJUK, CDA, KDA, RDA etc.) to mark off the
areas under their jurisdiction as silent, residential, mixed, commercial or industrial. They should
also put signs to mark those areas. The act also describes the approved standard limit of sound
in the added schedule 1 and 2. In the schedule 1, silent area means area up-to a radius of 100
meters around hospitals or educational institutions or special institutions/ establishments
identified/to be identified by the government. In the silent area it is prohibited to use any kind
of horns of vehicles, audio signals and loudspeakers.
2.7 The Bangladesh Water Act 2013
The Bangladesh Water Act. 2013 was passed by the Government on 6 November 2013 to
ensure “integrated development, management, abstraction, distribution, use, protection and
conservation of water resources”. By virtue of this Act, all rights over surface water, ground
water, sea water rain water and water in the atmosphere is vested on the State.
Notwithstanding the above, “rights over the surface water on any private land shall remain with
the owners of such land”, and such right to use the water shall be subject to the provision of
the Act. Furthermore, under the provisions of this Act, “right to potable water, and to water for
hygiene and sanitation shall be treated as the highest priority right”.
The Act makes a provision for constituting a National Water Resources Council headed by the
Prime Minister. The Council is the highest decision making body and is empowered to make
policies, give instructions to develop National Water Resources Plan for integrated

Sitakundo Economic Zone
Environmental Monitoring Report Page | 8
development and safe abstraction of water and its proper use to ensure protection and
conservation of water resources. The Council is also mandated to approve the National Water
Resources Plan and ensure its implementation, as well as give advice to the Government to
enter into agreement through signing memorandum of understanding and/or signing
conventions and treaty with any Government and international or regional organization to
undertake joint survey, exchange data/information with respect to common water resources
and it abstraction and development and undertaking joint measures to prevent pollution of
common water resources.
The Act also makes a provision for approving national water resources plan prepared in
accordance with the Water Resources Planning Act, 1992 containing among others the
following matters namely:
• Analysis of economic , natural, social, political, environmental, and ecological
and institutional elements, characteristics and impact of water resources;
• Integrated use of surface and ground water emphasizing the highest possible use
of rain water;
• Determination of water quality standard;
• Fixation of priority of water use.
The Act also makes further provision for:
• declaration of water stress area and management thereof;
• preferential use of water in the water stress area and exemption thereof;
• fixing the lowest safe yield level of aquifer and restrictions on abstracting
groundwater; and
• Protection of flood control embankment, which states “to ensure the
sustainability of the flood control embankment, no person shall, without the
permission of the appropriate authority, be allowed to construct any house,
establishment or any other structure on, or on the slope of such embankment.”
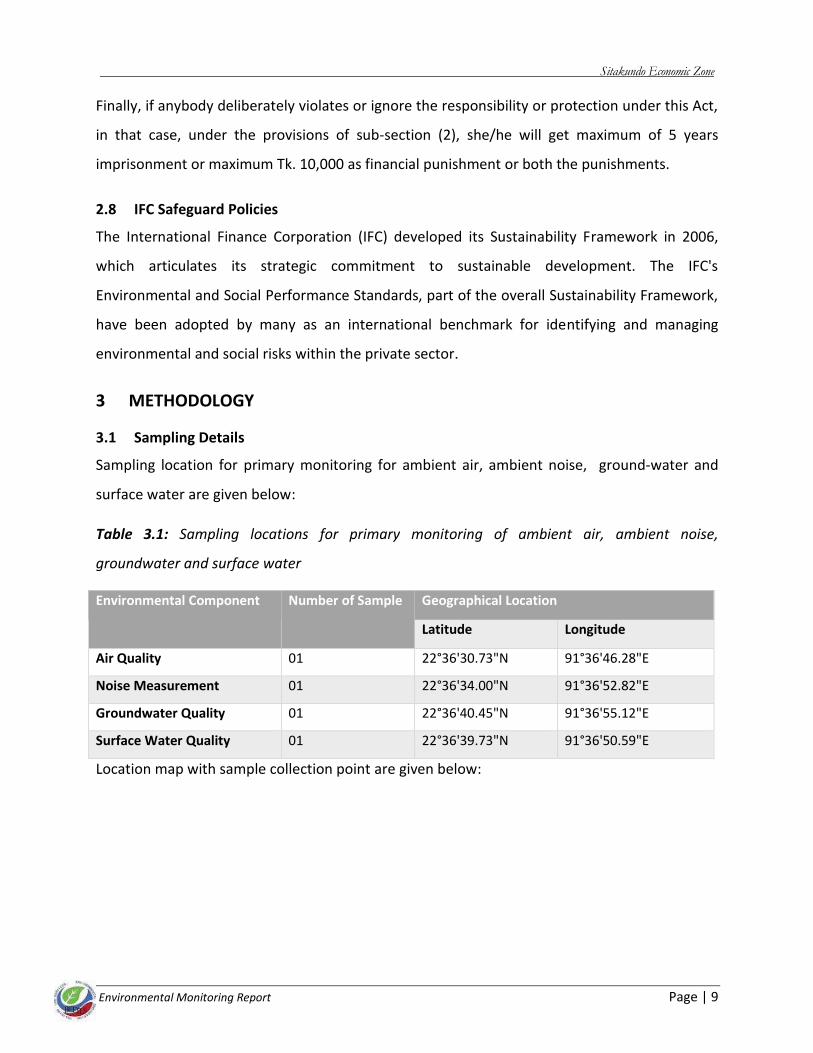
Sitakundo Economic Zone
Environmental Monitoring Report Page | 9
Finally, if anybody deliberately violates or ignore the responsibility or protection under this Act,
in that case, under the provisions of sub-section (2), she/he will get maximum of 5 years
imprisonment or maximum Tk. 10,000 as financial punishment or both the punishments.
2.8 IFC Safeguard Policies
The International Finance Corporation (IFC) developed its Sustainability Framework in 2006,
which articulates its strategic commitment to sustainable development. The IFC's
Environmental and Social Performance Standards, part of the overall Sustainability Framework,
have been adopted by many as an international benchmark for identifying and managing
environmental and social risks within the private sector.
3 METHODOLOGY
3.1 Sampling Details
Sampling location for primary monitoring for ambient air, ambient noise, ground-water and
surface water are given below:
Table 3.1: Sampling locations for primary monitoring of ambient air, ambient noise,
groundwater and surface water
Environmental Component Number of Sample Geographical Location
Latitude Longitude
Air Quality 01 22°36'30.73"N 91°36'46.28"E
Noise Measurement 01 22°36'34.00"N 91°36'52.82"E
Groundwater Quality 01 22°36'40.45"N 91°36'55.12"E
Surface Water Quality 01 22°36'39.73"N 91°36'50.59"E
Location map with sample collection point are given below:
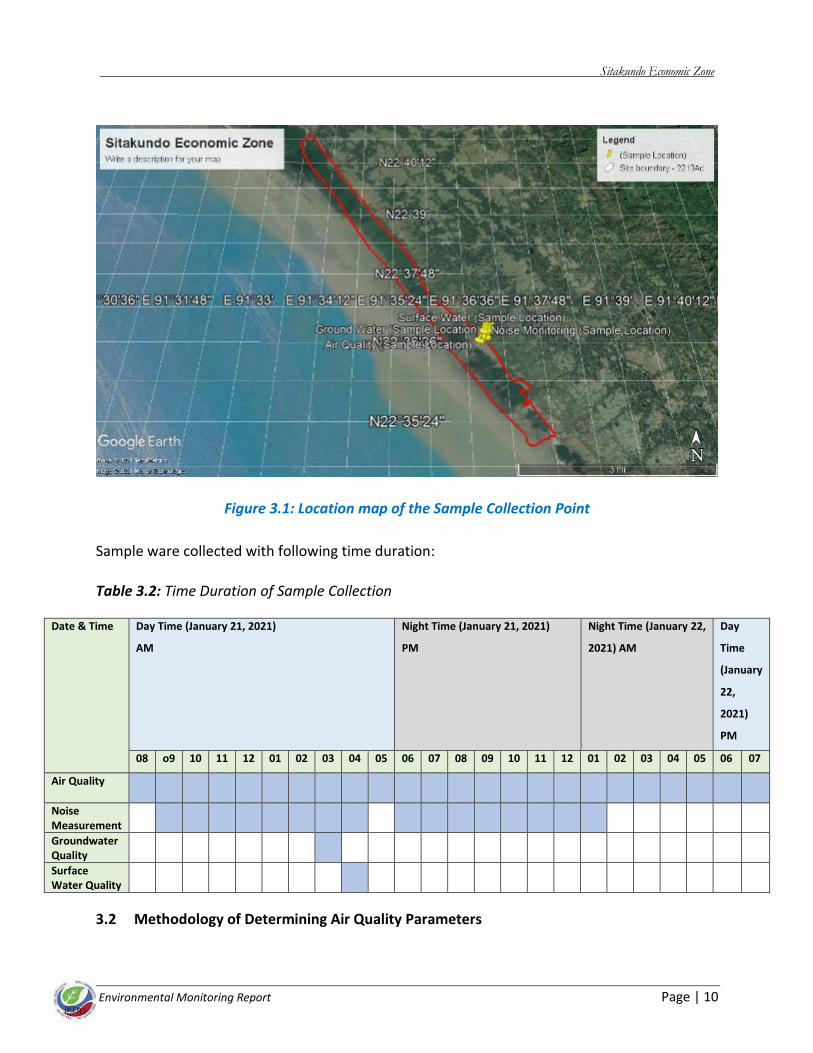
Sitakundo Economic Zone
Environmental Monitoring Report Page | 10
Figure 3.1: Location map of the Sample Collection Point
Sample ware collected with following time duration:
Table 3.2: Time Duration of Sample Collection
Date & Time Day Time (January 21, 2021)
AM
Night Time (January 21, 2021)
PM
Night Time (January 22,
2021) AM
Day
Time
(January
22,
2021)
PM
08 o9 10 11 12 01 02 03 04 05 06 07 08 09 10 11 12 01 02 03 04 05 06 07
Air Quality
Noise Measurement
Groundwater Quality
Surface Water Quality
3.2 Methodology of Determining Air Quality Parameters
Sitakundo Economic Zone
Environmental Monitoring Report Page | 11
Ambient air sample is collected from the site using Respirable Dust Sampler Lata Envirotech
APM–860 for SPM with an attachment APM 411TE to measure ambient gaseous compounds
(SO2, NO2). The APM 860 system is a manual method for sampling SPM and is based on
impactor designs standardized by USEPA for ambient air quality monitoring. The collected
samples are analyzed as per standard procedure to determine all parameters in the BEETLSL
laboratory.
3.2.1 SPM (Suspended Particulate Matter) Gravimetric Method
*Filter Preparation –Expose each filter to the light source and inspect for pinholes, particles and
other imperfection. Filters with visible imperfection s hall not are used. A small brush is useful
for removing particles. Equlibrate the filters in the filter conditioning environment for 24 hours.
Weigh the filters to the nearest milligram; record tare and filter identification number. Do not
bend or fold the filter before collection of the sample.
*Sample Collection: Open the shelter. Loosen the wing nuts, and remove the face plate from
the filter holder. Install the numbered, pre-weighed, glass-fiber filter in position (rough side up).
Replace the face plate without disturbing the filter and fasten securely under tightening will
allow air leakage. Over tightening will damage the sponge-rubber face plate gasket. A very light
application of talcum powder may be used on the sponge-rubber face-plate gasket to prevent
the filter from sticking. During inclement weather the sampler may be removed to a protected
area for filter change.
*Close the roof of the shelter run the sampler for about 5 minutes, connect the rotameter to
the nipple on the lock of the sampler and lead the rotameter ball with rotameter in the vertical
position. Estimate to the nearest whole number. If the ball is fluctuating rapidly, tap the
rotameter and slowly straighten it until the ball gives a constant reading. Disconnect the
rotameter from the nipple; record the initial rotameter reading and the starting time and date
on the filter holder. Note – The rotameter should never be connected to the sampler except
when the flow is being measured.
*Collect the sample for 24 hours and take a final rotameter reading. Record the final rotameter
reading and ending time and date on the filter holder. Remove the face-plate as described
above and carefully remove the filter from the holder, touching only the outer edges. Fold the
Sitakundo Economic Zone
Environmental Monitoring Report Page | 12
filter lengthways so that only surfaces with collected particulate are in contact and place in
special folder. Record on the folder the filter number. Location and any other factors, such as
meteorological conditions or razing of nearby buildings that might affect the results.
3.2.2 Sulfur Dioixide (SO2): Principle of west-geake method:
When air containing SO2 is bubbled through potassium tetrachloromercurate solution
(absorbent) taken in the impinge, SO2 forms a stable dichlorosulphitomercurate complex
(DCSM).This complex is not oxidized by the oxygen of air of that remains dissolved in the
absorbent containing DCSM is then treated with pararosaniline and formaldehyde to form an
intense red-violet color . The intensity of this occurence is directly related to the amount of SO2
absorbed and is measured colorimetrically by spectrophotometer .The quantity of SO2 is then
obtained from a calibration curve prepared earlier. The absorbed are relatively stable. Losses of
SO2 from the sample may occur at a rate of one percent per day at 22◦C. No measurable loss is
found to occur when stored at 5 ͦC for 30 days.
3.2.3 Nitrogen Dioixide (NO2):
Measurement of Nitrogen Dioxide in Ambient Air:
Principle: NO2 is absorbed in an alkaline solution (NaOH-sodium arsenite solution) where in it
forms sodium nitrite which is quite stable. The solution is then freed of possible SO2
interference, by treatment with H2O2 and acidified. The nitrite ion reacts with sulphnilamide
phosphoric acid solution to form a diazonium salt which couples with NEDA to form a deep
colored azo dye. Absorbance due to this color is measured in spectrophotometer against a
blank. Analysis Procedure:
• At the end of the stipulated sampling period note the flowmeter reading and switch off the
air pump.
• Make up the exposed absorbent volume to 20 ml with distilled water to compensate for any
loss of water due to evaporation during sampling.
• Transfer by pipetting 10 ml of the exposed absorbent into a test tube.Add 1.0 ml of H2O2
solution, 10.0 of sulphanilamide solution and 1.4 ml of NEDA with through mixing after the
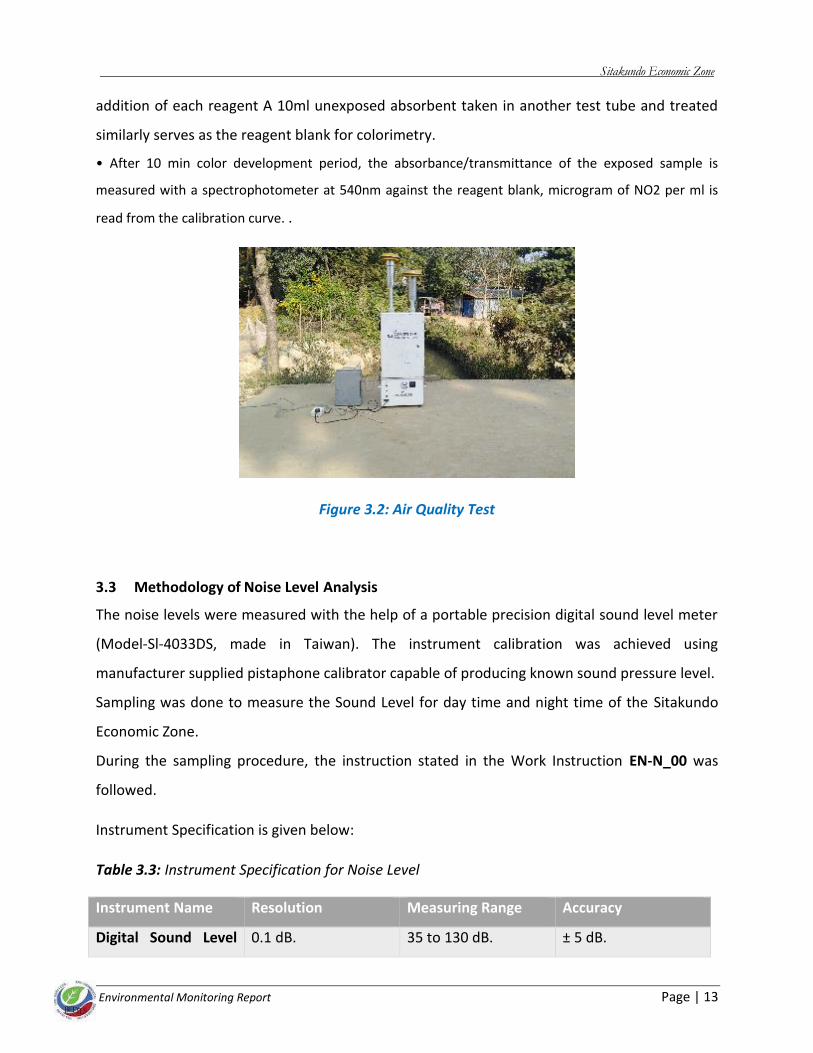
Sitakundo Economic Zone
Environmental Monitoring Report Page | 13
addition of each reagent A 10ml unexposed absorbent taken in another test tube and treated
similarly serves as the reagent blank for colorimetry.
• After 10 min color development period, the absorbance/transmittance of the exposed sample is
measured with a spectrophotometer at 540nm against the reagent blank, microgram of NO2 per ml is
read from the calibration curve. .
Figure 3.2: Air Quality Test
3.3 Methodology of Noise Level Analysis
The noise levels were measured with the help of a portable precision digital sound level meter
(Model-Sl-4033DS, made in Taiwan). The instrument calibration was achieved using
manufacturer supplied pistaphone calibrator capable of producing known sound pressure level.
Sampling was done to measure the Sound Level for day time and night time of the Sitakundo
Economic Zone.
During the sampling procedure, the instruction stated in the Work Instruction EN-N_00 was
followed.
Instrument Specification is given below:
Table 3.3: Instrument Specification for Noise Level
Instrument Name Resolution Measuring Range Accuracy
Digital Sound Level 0.1 dB. 35 to 130 dB. ± 5 dB.

Sitakundo Economic Zone
Environmental Monitoring Report Page | 14
Meter
Figure 3.3: Noise Inspection
3.4 Methodology of Surface water quality Test:
Surface water quality parameters such as, pH, Total Dissolved Solids (TDS), EC, BOD5, COD,
Chlorine were measure among which major physicochemical properties such as pH, EC, TDS
were measure in-situ during the field visit while the rests were measured in the laboratory.
Values of different parameters of the surface water quality with reference to the DoE standard
are given in result and discussion part. For Surface water quality test APHA22ndEDN.2012
guideline was followed.
Figure 3.4: Surface Water Sample Collection
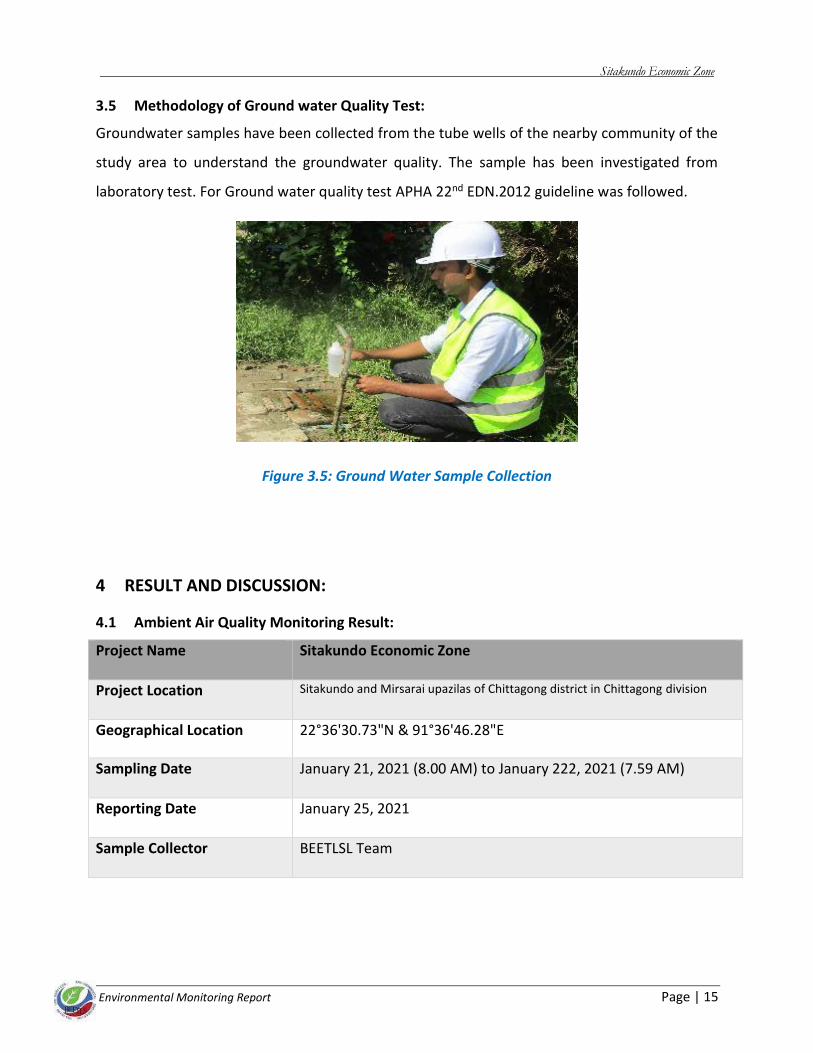
Sitakundo Economic Zone
Environmental Monitoring Report Page | 15
3.5 Methodology of Ground water Quality Test:
Groundwater samples have been collected from the tube wells of the nearby community of the
study area to understand the groundwater quality. The sample has been investigated from
laboratory test. For Ground water quality test APHA 22nd EDN.2012 guideline was followed.
Figure 3.5: Ground Water Sample Collection
4 RESULT AND DISCUSSION:
4.1 Ambient Air Quality Monitoring Result:
Project Name Sitakundo Economic Zone
Project Location Sitakundo and Mirsarai upazilas of Chittagong district in Chittagong division
Geographical Location 22°36'30.73"N & 91°36'46.28"E
Sampling Date January 21, 2021 (8.00 AM) to January 222, 2021 (7.59 AM)
Reporting Date January 25, 2021
Sample Collector BEETLSL Team

Sitakundo Economic Zone
Environmental Monitoring Report Page | 16
Table 4.1: Test Result of Ambient Air Quality Analysis
Paramet
er
Unit Concentration
Presentat AQ 1
(Longitude:
91.412643°
Latitude: 22.783037°)
IFC
Standard
mg/m3
Bangladesh
Standard**
Duration
(hours)
Method of
Analysis
SPM µg/m3 78 - 200 24 Hr Gravimetric
SO2 µg/m3 01 125 365 24 Hr West- Geake
NO2 µg/m3 01 200 (1 Hr) NYS 24 Hr Jacob and
Hochheiser
Note:
• The Bangladesh National Ambient Air Quality Standards have been taken from the
Environmental Conservation Rules, 1997which was amended on 19thJuly 2005 vide
S.R.O. No. 220-Law/2005.
• WHO Ambient Air Quality Guideline Values (2005 and 2000), which are also being
referred in the World Bank and IFC’s General EHS Guidelines (2007)
• NYS: Not Yet Standardized
Description of the Surrounding Environment
Table 4.2: Description of the Surrounding Environment
Location Sample site description
Sitakundo Economic Zone ➢ Weather Condition:
• Weather: Sunny
• Temperature 21° C,
• Wind: 6 km/h
• Humidity: 77%
➢ Sampling site was open area.
➢ No traffic congestion were observed in there.

Sitakundo Economic Zone
Environmental Monitoring Report Page | 17
➢ Very low people movement was observed in there.
Comments: Air sample has been carried out by high volume dust sampler at the identified
geographical location of the Sitakundo Economic Zone. Approved analytical methods have been
applied for estimation of air pollutants. The level of concentrations of air pollutants were within
the limit of Environmental Conservation Rules 1997 of Bangladesh (Amendment 2005) and IFC’s
General EHS Guidelines (2007).
Lab Report Prepared By Test Supervised By
Mousumi Rani Bepari
(Lab & Environment) BEETL
Dr. Fatima Akter
Director, BEETLSL
4.2 Noise Inspection Results:
Project Name Sitakundo Economic Zone
Project Location Sitakundo and Mirsarai upazilas of Chittagong district in Chittagong division
Geographical Location 22°36'34.00"N & 91°36'52.82"E
Sampling Date January 21, 2021 (9.00 AM) to January 22, 2021 (2.00 AM)
Reporting Date January 25, 2020
Sample Collector BEETLSL Team
Test Method:

Sitakundo Economic Zone
Environmental Monitoring Report Page | 18
The noise levels were measured with the help of a portable precision digital sound level meter
(Model-Sl-4033DS, made in Taiwan). The instrument calibration was achieved using
manufacturer supplied pistaphone calibrator capable of producing known sound pressure level.
Instrument’s Specifications:
Instrument Name Digital Sound Level Meter Resolution 0.1 dB.
Measuring Range 35 to 130 dB. Accuracy ± 5 dB.
Table 4.3: Inspection Result of Noise Level
Sample
ID
Sample
Location
Land Use
Category
Time Noise Level
(dBA) (LAeq)
Day Night Day Night
Start End Start End
N1 Sitakundo
Economic
Zone
Industrial Zone
8.00 AM 3.59
PM
5.00
PM
12.59
AM
53.6 36.7
Noise level standard:
Bangladesh ECR -
1997Standard for
Day Time Night Time
Industrial area 75 70
Commercial 70 60
Mixed area 60 50
Residential area 55 45
World Bank / IFC Standard Day Time Night Time
Industrial area 70 70
Residential; Intuitional;
Educational
55 45
Notes:

Sitakundo Economic Zone
Environmental Monitoring Report Page | 19
• Land use category is based on the classification provided in the Noise Pollution Control
Rules (2006)
• Abbreviation: NM- Noise Measurement, dB- decibel
Location Sample site description
Sitakundo Economic Zone ➢ Weather Condition:
• Weather: Sunny
• Temperature 21° C,
• Wind: 6 km/h
• Humidity: 77%
➢ Sampling site was open area.
➢ No traffic congestion were observed in there.
➢ Very low people movement was observed in there.
Comments: In-situ noise levels for both day and night time have collected from the sample
locations of the Sitakundo Economic Zone. LAeq data of 8 hours represent that the noise levels
were found below the standard limit of Department of Environment, Govt. of Bangladesh and
IFC/WB standard.
Lab Report Prepared By Test Supervised By
Mousumi Rani Bepari
(Lab & Environment) BEETL
Dr. Fatima Akter
Director, BEETLSL

Sitakundo Economic Zone
Environmental Monitoring Report Page | 20
4.3 Surface Water Quality test result
Table 4.4: Test Report of Surface Water (River Water)
Sample Ref. No : 2021.01.SW-22 Delivery Date : 25.01.2021
Sample Location : Sitakundo Economic Zone Address: Sitakundo and Mirsarai upazilas of
Chittagong district in Chittagong division
Sample Collected by : BEETLSL Team Sampling Date : 21.01.2021
Client Rf. No. & Date: 2021.01-BEETLSL-22;
25.01. 2021
Geographical Location: 22°36'39.73"N &
91°36'50.59"E
Name of Test : Physical/ Chemical/ Biological Analysis of Surface Water
SL No. Surface Water
Upstream
Concentration
Present
Unit ECR 1997
Standard for
Surface
Water
Methods of
Analysis
1. PH 7.47 mg/L 6-9 APHA 22nd
EDN.2012
(4500H+B)
2. Electrical Conductivity
(EC)
1120 μS/cm 1200 APHA22nd
EDN.2012
(2510 B)
3. Total Dissolved Solids
(TDS)
589 mg/L 2100 APHA 22nd
EDN.2012
(2540C)
4. BOD5 1.9 mg/L 50 APHA 22nd
EDN.2012
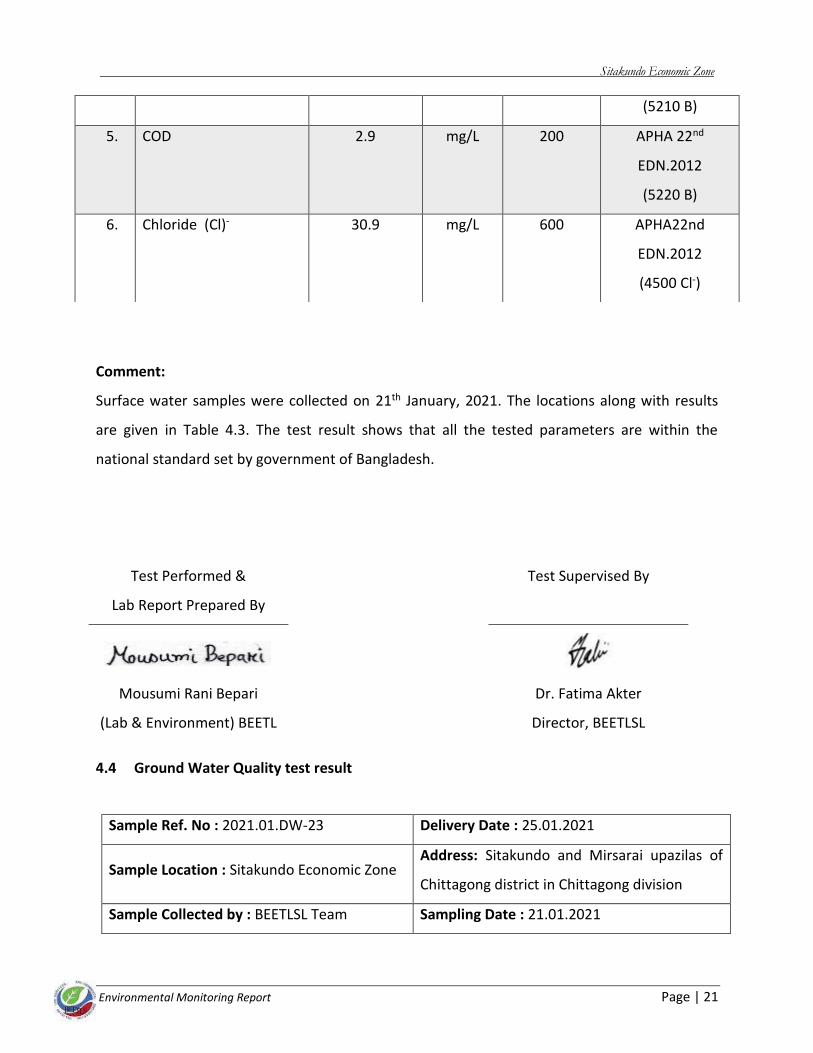
Sitakundo Economic Zone
Environmental Monitoring Report Page | 21
Comment:
Surface water samples were collected on 21th January, 2021. The locations along with results
are given in Table 4.3. The test result shows that all the tested parameters are within the
national standard set by government of Bangladesh.
Test Performed &
Lab Report Prepared By
Test Supervised By
Mousumi Rani Bepari
(Lab & Environment) BEETL
Dr. Fatima Akter
Director, BEETLSL
4.4 Ground Water Quality test result
Sample Ref. No : 2021.01.DW-23 Delivery Date : 25.01.2021
Sample Location : Sitakundo Economic Zone Address: Sitakundo and Mirsarai upazilas of
Chittagong district in Chittagong division
Sample Collected by : BEETLSL Team Sampling Date : 21.01.2021
(5210 B)
5. COD 2.9 mg/L 200 APHA 22nd
EDN.2012
(5220 B)
6. Chloride (Cl)- 30.9 mg/L 600 APHA22nd
EDN.2012
(4500 Cl-)

Sitakundo Economic Zone
Environmental Monitoring Report Page | 22
Client Rf. No. & Date: 2021.01-BEETLSL-22;
25.01. 2021
Geographic Location: 22°36'40.45"N &
91°36'55.12"E
Name of Test : Physical/ Chemical/ Biological Analysis of Ground Water.
Table 4.5: Test Report of Ground Water (Tubewell Water)
SL
No.
Ground Water Upstream Concentration
Present
Unit ECR 1997
Standard for
Drinking
Water
Methods of Analysis
1. Total Dissolved Solids
(TDS)
138 mg/L 1000 APHA22nd
EDN.2012
(2540C)
2. BOD 01 mg/L 0.2 APHA22nd
EDN.2012
(5210 B)
3. COD 2.9 mg/L 4 APHA22nd
EDN.2012
(5220 B)
4. Turbidity 5.9 NTU 10 APHA22nd
EDN.2012
(2130 B)
5. Total Coliform(TC) 00 CFU/100
ml
0.00 APHA22nd
EDN.2012
(9222H)
6. Fecal Coliform(FC) 00 CFU/100
ml
0.00 APHA22nd
EDN.2012
(9222B)
7. Total Iron (Fe) 3.6 mg/L 0.3-1.0 APHA22nd

Sitakundo Economic Zone
Environmental Monitoring Report Page | 23
Comment:
Ground water samples were collected from project area on 20th January, 2020. The locations
along with results are given in Table 4.4. The test result shows that most of the tested
parameters are within the national standard set by government of Bangladesh but the label of
Total Iron in ground water was found above the standard.
Test Performed &
Lab Report Prepared By
Test Supervised By
Mousumi Rani Bepari
(Lab & Environment) BEETL
Dr. Fatima Akter
Director, BEETLSL
5 INTERPRETATION
5.1 Air Quality Monitoring Report:
Particulate Matter (SPM):
Particulate matter is the general term used to describe a mixture of solid and liquid particles in
air including dust, soot, smoke, and dirt. Normally SPM is partial matter less than 100 micron,
Exposure of this SPM can cause respiratory morbidity, impaired lung function and irritation. It
may also be carcinogenic. This pollution is sometimes referred to as “black carbon pollution”.
Ambient air quality report reflects that SPM is within the standard according the Bangladesh
Ambient Air Quality Standard ECR 1997, Schedule 2 so that it can be interpret that the air is
good for human health and other living thing.
EDN.2012
(3500- Fe)
Sitakundo Economic Zone
Environmental Monitoring Report Page | 24
Gaseous Pollutant NO2:
Oxides of Nitrogen are a noxious gas. It’s highly reactive and formed when fuel is burned at high
temperature. The main sources are motor vehicles, engine water vessel with, generator and
industrial fuel burning instruments. Nitrogen dioxide can cause respiratory problems. It can also
take part in the chemical reactions in the atmosphere to form corrosive nitric acid and can also
react with sunlight to form ground level ozone Long term exposure can decrease lung function,
increase the risk of respiratory conditions and increases the response to allergens. Results
revealed that concentration of NO2 is within the standard of WHO Ambient Air Quality
Guideline Values (2005 and 2000), which are also being referred in the World Bank and IFC’s
General EHS Guidelines (2007) On the other hand DoE yet not set any standard on it.
Gaseous Pollutant SO2:
Sulfur dioxide (SOx) is a gas that is often produced in the burning of fossil fuels containing
Sulphur. It can cause respiratory problems and damage vegetation. Sulfur dioxide dissolves
easily in water and therefore can contribute to acid rain, once it released into the atmosphere.
To know the concentration of SO2 ambient air quality was tested. Results revealed that
concentration of SO2 is within the standard of according the Bangladesh Ambient Air Quality
Standard ECR 1997, Schedule 2 so that it can be interpret that the air is good for human health,
agriculture and other living thing. As well as it will not contribute to create acid rain.
5.2 Interpretation on Noise Inspection Report:
Exposure to loud noise can also cause high blood pressure, heart disease, sleep disturbances,
and stress. Noise pollution also impacts the environmental health and well-being of wildlife.
Study area falls on industrial area. Day time and night time data was monitored. Results
revealed that noise level is within the standard of according the ECR 1997, Schedule 4 so that it
can be interpret that present sound level is good for human health and other living thing.
However during construction period noise level may increase.
5.3 Interpretation on Ground water Test Report:

Sitakundo Economic Zone
Environmental Monitoring Report Page | 25
Ground water samples were collected from project area on 21th January, 2021. The locations
along with results are given in Table 4.4. The test result shows that most of the tested parameters
are within the national standard set by government of Bangladesh but the label of Total Iron in ground
water was found above the standard. This results indicates that ground water is polluted with iron
due to geographic condition of this area and it is not fully safe for human health for long term
use.
5.4 Interpretation on Surface Water Test Report:
Surface water samples were collected on 21th January, 2021. The locations along with results
are given in Table 4.3. The test result shows that all the tested parameters are within the
national standard set by government of Bangladesh. This results indicates that this surface
water is safe for aquatic biodiversity.

24 February 2021
PwC 306
11.21. Annexure 21 – Information Regarding Private EZ


24 February 2021
PwC 307
11.22. Annexure 22 – Response Matrix

Response Matrix
Comments common to all sites
Sl Common Observations/Comments Consultants (Study team’s) response
1 It was proposed to evaluate the impact on land uptake in proposed EZs due to availability of land in BSCIC parks in proximity, where applicable.
BSCIC parks lack quality infrastructure compared to EZs and are focused for development of MSMEs. Hence, comparison with EZs is not feasible. Additionally, EZs allow all sizes of industries to set up operations in the parks. The target investors/tenants are different in the case of EZ as the minimum plot size in EZ’s are 1 acre as compared to 0.10 acre in BSCIC parks. This allows MSMEs to be in close proximity to the anchor industries and hence more attractive compared to BSCIC parks.
2 It was recommended to integrate the zoning plan of Urban Development Directorate with the EZs in the region.
Zoning plan is planned as per the World Bank guidelines.
3 It was suggested to identify the broad area from where sand will be dredged for site filling
Source for landfilling is already highlighted in the Onsite infrastructure – Site development sections. Detailed hydrostatic study needs to be carried out during detailed design stage to identifying the suitable point of dredging.
4
Site planning should be aligned with phasing of zones for EZs i.e. utility shown in some conceptual layout fall in Phase 2. Will the utility be developed in the same location for Phase 1? Demarcation of phase wise utility and road map development is required.
The utility will be developed in the same location for phase 1 also. Demarcation of phase wise road map development is already highlighted on the Master planning chapter – Phasing section.
5
Unit cost break up used for broad cost estimate (for all off-site infrastructure) with source is required to be mentioned in master planning section for all sites. BEZA has requested for a consolidated table showing all on-site and off-site infrastructure costs for all 12 (twelve) sites. Also, original source of information for data is required to be provided.
The report has considered unit rates as per Bangladesh SoR. Additionally, vendor quotations will be provided for the non-schedule items. Detailed cost break-up is provided as annexure in the final report. The study team shared a consolidated table showing all on-site and off-site infrastructure costs for 12 sites. The study team updated the reports and provided the original source of information for each data points.
6 It has been recommended that topography survey is required
The study team has included GIS based 1m level contour survey on the on-site development sections.
7 Project viability for EZs to be tested under tariff sensitivity analysis to provide pricing strategy for each EZ
As a part of the financial model chapter, sensitivity analysis has been done to understand the most sensitive parameters/assumptions of the financial model and to assess the viability of the proposed SEZ across various modes of development (PPP/BEZA/BEZA and other nodal agencies). In general, for making SEZs viable wherein BEZA is a developer, study team recommend the following: 1. Seek assistance from World bank and other donor agencies for development of off-site and on-site infrastructure

Sl Common Observations/Comments Consultants (Study team’s) response
2. BEZA being a government agency under the PMO can arrange for financing at low interest rates and longer repayment periods 3. Development of more Standard factory building (SFB) within the SEZ’s The study team carried out tariff sensitivity analysis and provide various pricing points to BEZA for project. BEZA can identify the tariff to be used for the EZ based on sensitivity analysis output.
8 BEZA suggested to remove reference to specific multilateral agency funding.
The study team removed references to specific multilateral agency funding under financial feasibility section.
9 BEZA has requested for basic river morphology for all sites.
River morphology is included in the final report, subject to availability of data from BWDB.
10 BEZA suggested to assess the export options for each EZs.
Sectoral analysis has identified key products under sectors for EZ. Additionally, the study team added a section on high-level logistic cost assessment for each of the EZ (to be included as annexure) and also identified the suitable export gateways.
11 Re-evaluate the cost of resettlement plan and revalidate the EMP cost.
Cost for proposed land parcel already provided in the Social review section. A ballpark figure for the compensation of structures (commercial/residential) based on BEZA’s Resettlement and Social Management Framework and PWD rates is included in the final report. The study team has incorporated changes to EMP cost in consultation with BEZA. The detailed EMP cost study needs to be carried out as part of the masterplan study. Currently, the EMP cost has been assessed based on pre-feasibility study requirements.
12 BEZA indicated the need to assess the ground water level and include soil test report for all the sites.
The study team incorporated the lithological profile (source from DPHE) in the report.
13
It has been advised to provide the contact details of the respondents. Further, it was suggested to consult with the prospective investors from China, Japan and other countries to understand the infrastructure requirement for setting up of manufacturing units.
The study team included the respondent’s contact details and classified these stakeholders on the basis of respondent’s industry size (MSME and large). While estimating demand for any SEZ, two thronged approach comprising of both primary and secondary data research and analysis has been adopted. For each site and each sector, the study team has conducted primary interactions with at least 3 foreign investors. Excerpts of this analysis is captured in the industry assessment and demand estimation chapter of the report. Moreover, the consultations include few stakeholders from countries like China, UK, France, India, Japan among others to capture the investor requirements. The list has been annexed in the reports for the sites.
14
BEZA asked for referencing Super Dyke project in the report for all applicable slides. BEZA has asked to consider the impact of Super Dyke on embankment of applicable sites.
Detailed cross section for the proposed embankment/Super dyke along with the FGL isincluded in the final report
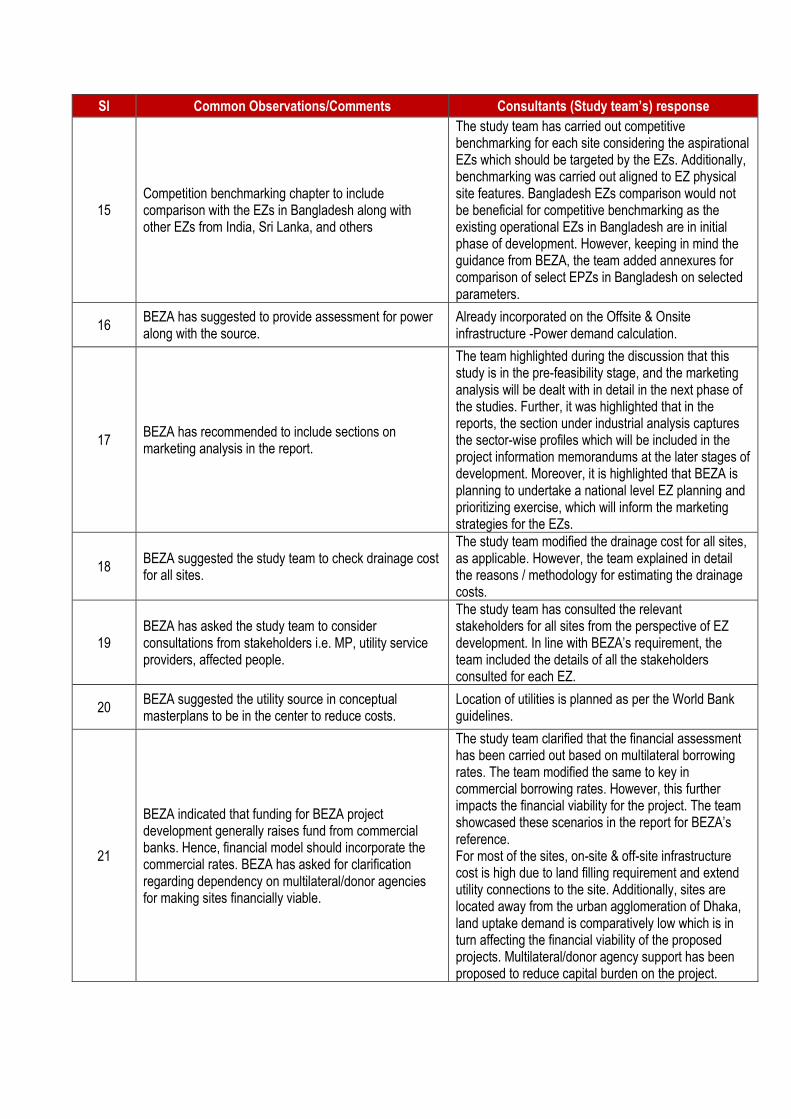
Sl Common Observations/Comments Consultants (Study team’s) response
15 Competition benchmarking chapter to include comparison with the EZs in Bangladesh along with other EZs from India, Sri Lanka, and others
The study team has carried out competitive benchmarking for each site considering the aspirational EZs which should be targeted by the EZs. Additionally, benchmarking was carried out aligned to EZ physical site features. Bangladesh EZs comparison would not be beneficial for competitive benchmarking as the existing operational EZs in Bangladesh are in initial phase of development. However, keeping in mind the guidance from BEZA, the team added annexures for comparison of select EPZs in Bangladesh on selected parameters.
16 BEZA has suggested to provide assessment for power along with the source.
Already incorporated on the Offsite & Onsite infrastructure -Power demand calculation.
17 BEZA has recommended to include sections on marketing analysis in the report.
The team highlighted during the discussion that this study is in the pre-feasibility stage, and the marketing analysis will be dealt with in detail in the next phase of the studies. Further, it was highlighted that in the reports, the section under industrial analysis captures the sector-wise profiles which will be included in the project information memorandums at the later stages of development. Moreover, it is highlighted that BEZA is planning to undertake a national level EZ planning and prioritizing exercise, which will inform the marketing strategies for the EZs.
18 BEZA suggested the study team to check drainage cost for all sites.
The study team modified the drainage cost for all sites, as applicable. However, the team explained in detail the reasons / methodology for estimating the drainage costs.
19 BEZA has asked the study team to consider consultations from stakeholders i.e. MP, utility service providers, affected people.
The study team has consulted the relevant stakeholders for all sites from the perspective of EZ development. In line with BEZA’s requirement, the team included the details of all the stakeholders consulted for each EZ.
20 BEZA suggested the utility source in conceptual masterplans to be in the center to reduce costs.
Location of utilities is planned as per the World Bank guidelines.
21
BEZA indicated that funding for BEZA project development generally raises fund from commercial banks. Hence, financial model should incorporate the commercial rates. BEZA has asked for clarification regarding dependency on multilateral/donor agencies for making sites financially viable.
The study team clarified that the financial assessment has been carried out based on multilateral borrowing rates. The team modified the same to key in commercial borrowing rates. However, this further impacts the financial viability for the project. The team showcased these scenarios in the report for BEZA’s reference. For most of the sites, on-site & off-site infrastructure cost is high due to land filling requirement and extend utility connections to the site. Additionally, sites are located away from the urban agglomeration of Dhaka, land uptake demand is comparatively low which is in turn affecting the financial viability of the proposed projects. Multilateral/donor agency support has been proposed to reduce capital burden on the project.
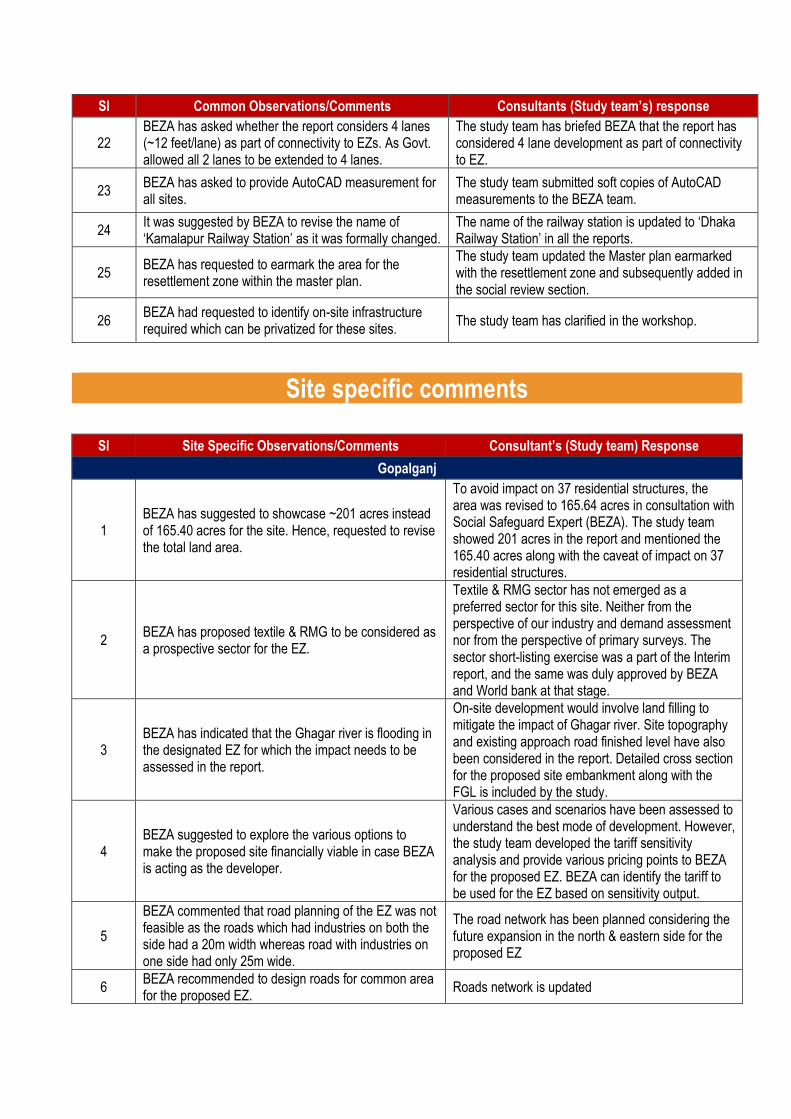
Sl Common Observations/Comments Consultants (Study team’s) response
22 BEZA has asked whether the report considers 4 lanes (~12 feet/lane) as part of connectivity to EZs. As Govt. allowed all 2 lanes to be extended to 4 lanes.
The study team has briefed BEZA that the report has considered 4 lane development as part of connectivity to EZ.
23 BEZA has asked to provide AutoCAD measurement for all sites.
The study team submitted soft copies of AutoCAD measurements to the BEZA team.
24 It was suggested by BEZA to revise the name of ‘Kamalapur Railway Station’ as it was formally changed.
The name of the railway station is updated to ‘Dhaka Railway Station’ in all the reports.
25 BEZA has requested to earmark the area for the resettlement zone within the master plan.
The study team updated the Master plan earmarked with the resettlement zone and subsequently added in the social review section.
26 BEZA had requested to identify on-site infrastructure required which can be privatized for these sites.
The study team has clarified in the workshop.
Site specific comments
Sl Site Specific Observations/Comments Consultant’s (Study team) Response
Gopalganj
1 BEZA has suggested to showcase ~201 acres instead of 165.40 acres for the site. Hence, requested to revise the total land area.
To avoid impact on 37 residential structures, the area was revised to 165.64 acres in consultation with Social Safeguard Expert (BEZA). The study team showed 201 acres in the report and mentioned the 165.40 acres along with the caveat of impact on 37 residential structures.
2 BEZA has proposed textile & RMG to be considered as a prospective sector for the EZ.
Textile & RMG sector has not emerged as a preferred sector for this site. Neither from the perspective of our industry and demand assessment nor from the perspective of primary surveys. The sector short-listing exercise was a part of the Interim report, and the same was duly approved by BEZA and World bank at that stage.
3 BEZA has indicated that the Ghagar river is flooding in the designated EZ for which the impact needs to be assessed in the report.
On-site development would involve land filling to mitigate the impact of Ghagar river. Site topography and existing approach road finished level have also been considered in the report. Detailed cross section for the proposed site embankment along with the FGL is included by the study.
4 BEZA suggested to explore the various options to make the proposed site financially viable in case BEZA is acting as the developer.
Various cases and scenarios have been assessed to understand the best mode of development. However, the study team developed the tariff sensitivity analysis and provide various pricing points to BEZA for the proposed EZ. BEZA can identify the tariff to be used for the EZ based on sensitivity output.
5
BEZA commented that road planning of the EZ was not feasible as the roads which had industries on both the side had a 20m width whereas road with industries on one side had only 25m wide.
The road network has been planned considering the future expansion in the north & eastern side for the proposed EZ
6 BEZA recommended to design roads for common area for the proposed EZ.
Roads network is updated

7 It has been recommended by the BEZA to delineate area for parking in the masterplan for the proposed site.
The area for the truck parking is already considered in the support amenity area. Layout for the truck parking is included in the final report.
8 BEZA recommended to assess the impact of land uptake for the proposed EZ due to the upcoming industrial park ‘Goplaganj EZ-2’ in the same region.
The impact of Gopalganj EZ-2 on the land uptake of Gopalganj EZ-1 has been assessed while projecting the demand for the proposed EZ.
9 BEZA has asked to identify the unique selling proposition for Gopalganj EZ-1 in comparison to other SEZs/EZs in Bangladesh.
The study team has strategically shortlisted the best fit sectors for the proposed EZ and accordingly infrastructure planning has been done to cater the requirement of the industries.
Bhola
10 BEZA suggested to assess the impact on EZ due to lack of direct road access to the mainland island.
The study team has assessed the impact of not having road connectivity with the mainland Bangladesh as part of the transport assessment section of the report, basis which a bridge has been proposed to connect the island from mainland to provide better connectivity to the EXIM gateways and consumption centers.
11
BEZA has indicated that the gas supply is not available whereas the gas connection is present. Hence, BEZA requested to revisit the gas availability and connectivity to the proposed site.
Already incorporated in the Offsite infrastructure -external gas supply section
12 BEZA has recommended to identify the settlements and households within the proposed EZ.
The details of the settlement and households within the proposed EZ site are already covered in the Environmental and Social review section. Please refer to section 11.7.5 and annexure 31.
13 BEZA requested to incorporate historical flood level data to identify the requirement of embankment.
Detailed cross section for the proposed site embankment along with the FGL will be included along with the HFL data in the final report.
14 BEZA has asked to provide details pertaining to waterlogging within the proposed EZ.
Already incorporated in the Onsite infrastructure -site development section
15 BEZA recommended to identify the marine resources within the proposed EZ region.
Access to aquaculture resource section provides the brief information about available marine resource in the region. Please refer to section 5.5.2.2 and 5.5.2.3
Panchagarh
16 It has been advised to incorporate nearest Indian SEZs as part of competition benchmarking exercise for the proposed EZ.
SEZs/EZs of similar magnitude from different geographies have been assessed as a part of competition benchmarking exercise. The study team incorporated Indian SEZs of the comparable scale as part of competition benchmarking for the proposed site.
17 BEZA asked to identify the products that can be exported through the nearest land ports.
The study team has shortlisted sectors based on the holistic assessment with backward and forward linkages which includes export options. Further, Land ports assessment has been undertaken under the Transport assessment chapter under the Transport assessment chapter which includes these details. However, a brief assessment of the export options through land ports of Bangladesh will be included in the report.
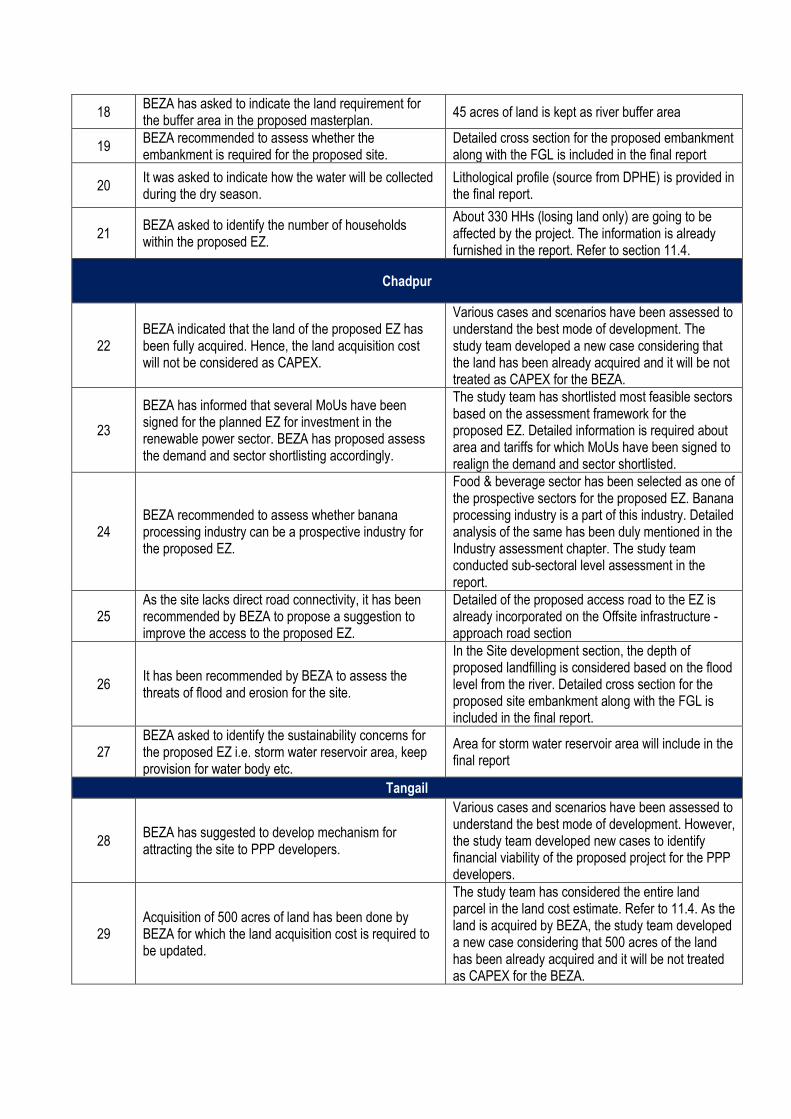
18 BEZA has asked to indicate the land requirement for the buffer area in the proposed masterplan.
45 acres of land is kept as river buffer area
19 BEZA recommended to assess whether the embankment is required for the proposed site.
Detailed cross section for the proposed embankment along with the FGL is included in the final report
20 It was asked to indicate how the water will be collected during the dry season.
Lithological profile (source from DPHE) is provided in the final report.
21 BEZA asked to identify the number of households within the proposed EZ.
About 330 HHs (losing land only) are going to be affected by the project. The information is already furnished in the report. Refer to section 11.4.
Chadpur
22 BEZA indicated that the land of the proposed EZ has been fully acquired. Hence, the land acquisition cost will not be considered as CAPEX.
Various cases and scenarios have been assessed to understand the best mode of development. The study team developed a new case considering that the land has been already acquired and it will be not treated as CAPEX for the BEZA.
23
BEZA has informed that several MoUs have been signed for the planned EZ for investment in the renewable power sector. BEZA has proposed assess the demand and sector shortlisting accordingly.
The study team has shortlisted most feasible sectors based on the assessment framework for the proposed EZ. Detailed information is required about area and tariffs for which MoUs have been signed to realign the demand and sector shortlisted.
24 BEZA recommended to assess whether banana processing industry can be a prospective industry for the proposed EZ.
Food & beverage sector has been selected as one of the prospective sectors for the proposed EZ. Banana processing industry is a part of this industry. Detailed analysis of the same has been duly mentioned in the Industry assessment chapter. The study team conducted sub-sectoral level assessment in the report.
25 As the site lacks direct road connectivity, it has been recommended by BEZA to propose a suggestion to improve the access to the proposed EZ.
Detailed of the proposed access road to the EZ is already incorporated on the Offsite infrastructure -approach road section
26 It has been recommended by BEZA to assess the threats of flood and erosion for the site.
In the Site development section, the depth of proposed landfilling is considered based on the flood level from the river. Detailed cross section for the proposed site embankment along with the FGL is included in the final report.
27 BEZA asked to identify the sustainability concerns for the proposed EZ i.e. storm water reservoir area, keep provision for water body etc.
Area for storm water reservoir area will include in the final report
Tangail
28 BEZA has suggested to develop mechanism for attracting the site to PPP developers.
Various cases and scenarios have been assessed to understand the best mode of development. However, the study team developed new cases to identify financial viability of the proposed project for the PPP developers.
29 Acquisition of 500 acres of land has been done by BEZA for which the land acquisition cost is required to be updated.
The study team has considered the entire land parcel in the land cost estimate. Refer to 11.4. As the land is acquired by BEZA, the study team developed a new case considering that 500 acres of the land has been already acquired and it will be not treated as CAPEX for the BEZA.
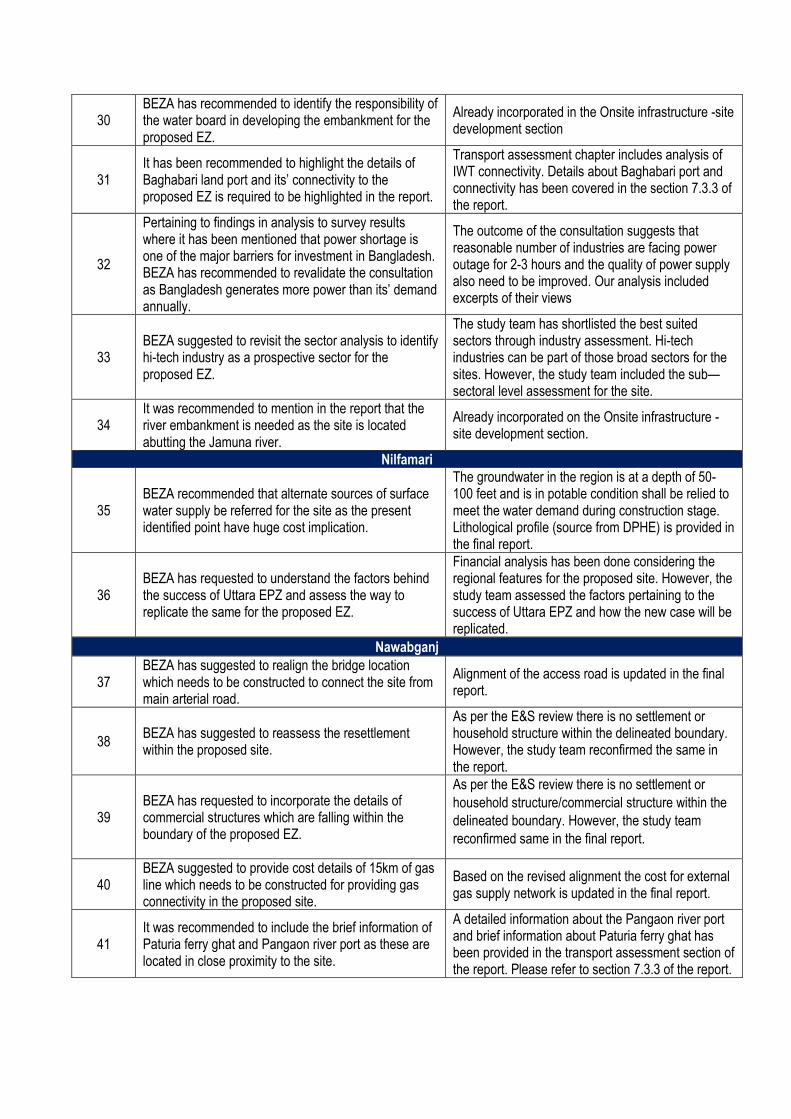
30 BEZA has recommended to identify the responsibility of the water board in developing the embankment for the proposed EZ.
Already incorporated in the Onsite infrastructure -site development section
31 It has been recommended to highlight the details of Baghabari land port and its’ connectivity to the proposed EZ is required to be highlighted in the report.
Transport assessment chapter includes analysis of IWT connectivity. Details about Baghabari port and connectivity has been covered in the section 7.3.3 of the report.
32
Pertaining to findings in analysis to survey results where it has been mentioned that power shortage is one of the major barriers for investment in Bangladesh. BEZA has recommended to revalidate the consultation as Bangladesh generates more power than its’ demand annually.
The outcome of the consultation suggests that reasonable number of industries are facing power outage for 2-3 hours and the quality of power supply also need to be improved. Our analysis included excerpts of their views
33 BEZA suggested to revisit the sector analysis to identify hi-tech industry as a prospective sector for the proposed EZ.
The study team has shortlisted the best suited sectors through industry assessment. Hi-tech industries can be part of those broad sectors for the sites. However, the study team included the sub—sectoral level assessment for the site.
34 It was recommended to mention in the report that the river embankment is needed as the site is located abutting the Jamuna river.
Already incorporated on the Onsite infrastructure -site development section.
Nilfamari
35 BEZA recommended that alternate sources of surface water supply be referred for the site as the present identified point have huge cost implication.
The groundwater in the region is at a depth of 50-100 feet and is in potable condition shall be relied to meet the water demand during construction stage. Lithological profile (source from DPHE) is provided in the final report.
36 BEZA has requested to understand the factors behind the success of Uttara EPZ and assess the way to replicate the same for the proposed EZ.
Financial analysis has been done considering the regional features for the proposed site. However, the study team assessed the factors pertaining to the success of Uttara EPZ and how the new case will be replicated.
Nawabganj
37 BEZA has suggested to realign the bridge location which needs to be constructed to connect the site from main arterial road.
Alignment of the access road is updated in the final report.
38 BEZA has suggested to reassess the resettlement within the proposed site.
As per the E&S review there is no settlement or household structure within the delineated boundary. However, the study team reconfirmed the same in the report.
39 BEZA has requested to incorporate the details of commercial structures which are falling within the boundary of the proposed EZ.
As per the E&S review there is no settlement or
household structure/commercial structure within the
delineated boundary. However, the study team
reconfirmed same in the final report.
40 BEZA suggested to provide cost details of 15km of gas line which needs to be constructed for providing gas connectivity in the proposed site.
Based on the revised alignment the cost for external gas supply network is updated in the final report.
41 It was recommended to include the brief information of Paturia ferry ghat and Pangaon river port as these are located in close proximity to the site.
A detailed information about the Pangaon river port and brief information about Paturia ferry ghat has been provided in the transport assessment section of the report. Please refer to section 7.3.3 of the report.

42 BEZA has asked to provide information for the foundation level of the boundary wall for the proposed site.
Detailed cross section for the proposed embankment along with the boundary wall alignment is included in the final report.
43 BEZA recommended to revise the masterplan as the service area (including loading and unloading area) cannot be kept in a corner of the plot.
Location of the support amenities is updated based on the revised alignment of the access road in the final report.
44 BEZA has recommended to not the change the natural flow of the water channel flowing within the EZ.
To achieve better industrial plots and to reduce the infrastructure cost it is recommended to channelize the water channel flowing within the EZ.
45 BEZA has indicated that high voltage substation can be sourced from Nobabgonj substation
Location of 132/33 kV substation has been revised based on the updated capacity of the Nobabgonj grid substation.
Manikgonj
46 BEZA has requested to assess the total number of households for the proposed site.
As per the E&S review there are 20 household structures within the delineated boundary. The project will affect more than 300 HHs (both physical and economic displacement) – those who will lose land or other assets. Refer to 11.7.5 and annexure 31. Study team will reconfirm in the final report.
47 BEZA has suggested to update the name of ‘Brahmaputra’ river to ‘Jamuna’.
The name of the river would be updated to in the report.
48 BEZA asked to demonstrate vulnerability of Padma and Jamuna River in the EIA for the site
In the Environmental review section probable impact on Padma and Jamuna River will be discussed in the final report.
49 BEZA asked for a road setback in Dhaka-Patulia highway for the proposed site.
200 m set back will be provided along the Dhaka-Patulia highway
Jamalpur
51 BEZA has recommended to propose strategies to avoid the resettlement.
As discussed in the workshop, the location of household structures is sporadically spread across the proposed project boundary. The indicative maps showing the settlements is shared with BEZA to seek their view towards revision of proposed site boundary.
52 Re-evaluate the cost of resettlement plan for the proposed site.
As discussed in the workshop, the location of household structures is sporadically spread across the proposed project boundary. The indicative maps showing the settlements is shared with BEZA to seek their view towards revision of proposed site boundary.
53 It was asked to assess detailed cross section for the proposed embankment along with boundary wall alignment in the report.
The study team included detailed cross section for the proposed embankment along with the boundary wall alignment in the report.

24 February 2021
PwC 308
pwc.com
© 2021. PricewaterhouseCoopers Pvt Ltd. All rights reserved. In this document, “PwC” refers to PricewaterhouseCoopers Pvt Ltd which is a member firm of PricewaterhouseCoopers International Limited, each member firm of which is a separate legal entity.


