47
Financial System in Poland 2014

Financial System in Poland 2014


Warsaw, 2016
Financial System in Poland 2014

This document contains the summary and the first chapter of a comprehensive report Rozwój systemu finansowego w Polsce w 2014 r. [Financial system development in Poland 2014], prepared by the Financial Stability Department. The report is available in Polish, together with its previous editions, on NBP website: www.nbp.pl/systemfinansowy/rozwoj
Narodowy Bank Polski 00-919 Warszawa ul. Świętokrzyska 11/21 tel.: +48 22 185 22 23 www.nbp.pl
© Copyright Narodowy Bank Polski, 2016

Summary
3 Financial System in Poland 2014
Summary
At the end of 2014, the domestic financial system assets to GDP ratio amounted to 121.4%. When
compared with the real economy, the financial system is not developed excessively. It includes all
types of financial institutions and financial markets typical for well-developed market economies.
From the point of view of its positive effect on economic growth, the level of financial system
development, according to international institutions is of optimal size and structure. Maintaining
favourable trends in changes in the composition of banks’ loan portfolio would be desirable. The
description of individual segments of Poland’s financial system, changes in the related
regulations and infrastructure, and the results of the analyses, all of which are presented in this
study, allow use to formulate the following conclusions and suggestions about the development
of domestic financial institutions and markets.
Financial institutions
In Poland, as in other countries of the region, the banking sector continued to play the key
role in the financial system. In 2014, assets of domestic banks increased by around 9%, which
led to a slight increase of the assets to GDP ratio to 89%.
The growth rate of lending to the non-financial sector amounted to 4.5% and was similar for
all main categories of credit. Since the outbreak of the global financial crisis, credit growth in
Poland was the highest among all EU member states. At the same time, the share of corporate
loans in banking sector assets is one of the lowest both in the whole EU and in the region. The
rising concentration on lending to households is an unfavourable development for economic
growth; however, this came to a halt in recent years amid the lower significance of lending to
enterprises. A further decline in the value of foreign currency housing loans was also a
favourable change in the structure of loans to the non-financial sector.
Deposits of the non-financial sector were the main source of funding of domestic banks. The
rate at which deposits growing was higher than the credit growth rate, resulting in a
narrower funding gap. At the same time, the share of foreign funding in the structure of
banks’ liabilities decreased.
A relatively strong increase in cooperative banking sector’s assets was largely driven by the
growing penetration of cooperative banks of new business areas, including business lines that
were so far a matter of commercial banks. The lack of properly developed risk management
systems related to such an activity was one of the factors behind a deterioration in the quality
of the credit portfolio and a fall in the sector’s returns. In order to contain the risks associated
with the existing operating model of cooperative banks and meet the new regulatory
requirements, affiliating cooperative banks may need to change the way they operate. One of
the measures should be to tighten collaboration of cooperative and affiliating banks under the
institutional protection scheme, i.e. a group of entities that mutually warrant their liquidity
and capital adequacy.

Summary
4 Narodowy Bank Polski
In 2014, restructuring processes were carried out in the credit unions sector. As a result of the
processes, the sector’s scale of activities was limited. At the end of 2014, operational activities
were carried on by 50 credit unions (5 fewer than at the end of 2013), and the value of their
assets decreased by approximately 27%. At the end of 2014, credit unions that carried on their
activities reported a combined net loss. The earnings of credit unions were heavily affected
by the deteriorating quality of assets (the need to create provisions) and a decrease in interest
income resulting from, among others, decreasing interest rates. The capital position of credit
unions was difficult, and the value of regulatory capital – inadequate to the scale of their
operations.
Domestic enterprises prefer a conservative strategy of financing their activities and use
mainly own funds to do so. Among external sources of financing, they are increasingly
willing to use leasing and issue of bonds, including bonds issued in foreign markets. In 2014,
the value of leasing contracts and loans extended to enterprises by leasing companies
increased to PLN 42.8 billion. Non-financial entities raised PLN 21 billion in the domestic
market for long-term bonds, while the value of new share issues on the WSE-organised
markets (Main Market and NewConnect) amounted to merely PLN 2 billion. Another source
of financing are private equity funds. In 2014, private equity funds invested around PLN 1
billion in Poland, but the ratio of capital provided by private equity funds to capital raised
through the new share issues was always above 25% in the past four years.
Non-bank lending companies specialize in granting short-term low-amount loans to less
affluent consumer groups, which means that the products supplement the range of products
offered by banks. GUS data show that lending provided by the companies in 2014 amounted
to PLN 7.6 billion, which represents a 35.4% rise on the 2013 figure. Some of non-bank
lending companies fund their activities with bank loans, bond issues or advances from
controlling entities, and they are therefore included in the shadow banking sector. The fact
that these companies are not subject to supervision has a negative impact on borrowers’
security, and the malfunctions relating to, among others, non-interest costs of advances,
present on this market, may lower Poles’ confidence in other financial institutions. This
situation justifies an implementation of a regulation aimed at eliminating practices that
infringe on the interests of consumers and at strengthening their protection on Poland’s
lending services market.
At the end of 2014, the value of net assets of investment funds reached a record level of PLN
219.5 billion. The increase was driven mainly by a net inflow of funds. The balance of inflows
and outflows was lower than in 2013, which was related to the worse situation on the
domestic equity market and lower investor interest in funds that serve to provide tax
optimization solutions. Households continued to prevail among participants in investment
funds. Both the ratio of the value of funds invested by households in participation units to
household bank deposits and the share of the units in the savings structure of households
increased. In 2014, for the first time in the sector’s history, the Polish Financial Supervision

Summary
5 Financial System in Poland 2014
Authority (KNF) revoked an operating licence of an investment fund management company
on the grounds of the company’s delay in paying investors for the redeemed units.
Net assets of open pension funds (OFEs) fell by 50.2% to PLN 149.1 billion in 2014 in the
wake of entry into force of the new provisions of law according to which open pension funds
were required to transfer more than 50% of their assets to the Social Insurance Institution
(ZUS) and which introduced membership of an open pension fund on a voluntary basis. As a
result of changes in the investment policy of pension funds, which were caused by the new
investment limits, domestic equities – which at the end of 2014 accounted for 79.6% of the
portfolio’s value – have prevailed in pension funds’ portfolios since February 2014. The new
catalogue of acceptable investments of open pension funds does not include Treasury
securities, which has so far accounted for almost half of their assets. In 2014, the average
weighted rate of return of OFEs stood at 0.5%.
At the end of 2014, assets accumulated as part of contributions to the pension system on a
voluntary basis amounted to PLN 15.6 billion and were by 13% higher than in 2013. The most
assets were gathered in occupational pensions schemes (PLN 10.3 billion), and the least ‒ on
individual retirement security accounts (PLN 0.3 billion). Although the number of persons
who save additional funds for retirement purposes has grown slightly, the schemes and
accounts remain not popular.
In 2014, assets and deposits of the insurance sector rose, and its profit was PLN 6.8 billion.
Treasury securities prevailed in the deposit structure of domestic insurance companies.
Although the gross written premium declined, the domestic insurance industry had sufficient
own funds to cover the statutory solvency ratios and held deposits higher than liabilities
arising from insurance contracts.
Investment firms conduct their activity primarily on domestic markets ogranised by WSE and
BondSpot. As the number of transactions in the equity and forward transactions market is
decreasing and competition in the market for brokerage services is fierce, which is reflected in
falling fees, the core activity of investment firms is becoming less profitable, which in turn
may trigger mergers and acquisitions in the sector.
Due to such a situation in the capital market, investment firms are forced to seek alternative
sources of income and to broaden the range of services for individual investors with, among
others, the possibility of concluding transactions in organized foreign markets and cash-
settled forward transactions for foreign exchange rates, goods and stock exchange indices via
the online trading platforms. High leverage and investment risk associated with the use of
such contracts were behind the law-makers’ decision to set at 1% the minimum ratio of the
margin call to the nominal value of a financial instrument, required to execute transactions in
derivatives that are not cleared by a CCP.
Financial markets and their infrastructure
The structure of interbank deposit transactions in Poland differed significantly from that in
the euro area. Interbank unsecured deposits remain the main liquidity management

Summary
6 Narodowy Bank Polski
instrument used by domestic banks. The volume and term structure of turnover in the
interbank unsecured deposits market were determined by a small number of participants and
low credit limits imposed by banks on one another. O/N transactions prevailed, and their
share in the turnover in this market in 2014 was over 90%.
The number of participants in the WIBID/WIBOR reference rate fixing increased from 11 to
13. Domestic banks, which use the WIBID/WIBOR rates to the greatest extent (among others,
as they hold balance sheet receivables indexed by the rates and portfolios of WIBOR/WIBID-
based derivative instruments), should participate in their fixing, while complying with the
supervisory recommendations on the internal process of fixing and providing quotations for
its needs. A regulation on indices used as indicators in financial instruments and contracts,
now developed by the European Union, will have a substantial impact on the organisation of
reference rate fixing. The draft provisions are intended to improve supervision of the process
of market indicator fixing and guarantee high quality source data. The proposed solutions
provide for, among others, the introduction of strict organisational requirements for
administrators of key indicators, which the WIBID/WIBOR rates should be regarded as.
Transactions of domestic banks accounted for around 17% of the turnover in the global fx
swap market of the zloty. Domestic banks concluded FX swaps mainly with foreign banks
that financed investments in Poland’s capital market, in particular in the Treasury bond
market, and speculated on the zloty exchange rate. They often used the transactions in their
strategies aimed at mitigating FX risk.
In 2014, the turnover on the market for conditional transactions continued to grow in Poland.
However, the share of repo transactions in the structure of interbank deposits transactions
remained low. The domestic post-trading infrastructure for conditional transactions (i.e. the
KDPW group’s offer) complies with the standards used in mature financial markets, e.g. in
the euro area; therefore, the development of the interbank conditional markets transactions in
Poland currently depends on the measures taken by banks and their liquidity management
policy. It would be advisable to introduce relevant amendments to the standard master
agreement for the conclusion of conditional transactions, contained in the recommendation of
the Polish Bank Association. The model should be adjusted to amendments in the domestic
bankruptcy law, new solutions in the post-trading infrastructure and the 2011 Global Master
Repurchase Agreement. The model should also regulate cross-currency repo transactions that
domestic banks may use in managing risk arising from the currency mismatch of assets and
liabilities.
The changes to the pensions system in February 2014 resulted in a 20% decline in the
Treasury bond debt and a simultaneous rise (by around 10 percentage points) in non-resident
share in the structure of Treasury bond buyers. Exposure of the investor group to the
domestic Treasury bond market was relatively stable (it ranged from PLN 180 to 200 billion).
The value of the portfolio of Treasury securities held by Asian investors and Polish banks
was steadily growing. The importance of variable interest-bearing instruments rose for
another year in a row, and at the end of 2014 their share in the structure of domestic Treasury

Summary
7 Financial System in Poland 2014
bonds was over 20%. Liquidity continued to fall in the wholesale market. The average daily
value of unconditional transactions dropped by nearly 30% on the 2013 figure and amounted
to PLN 11.1 billion.
The market for non-Treasury long-term debt instruments is relatively poorly developed and
not very liquid. In 2014, the value of outstanding instruments in almost all of its segments
continued to grow. An almost 40% rise in corporate debt due to long-term debt securities was
owed to improved macroeconomic conditions and low interest rates which encouraged
enterprises to increase investment outlays. The value of new issue programmes signed in
2014 implies that the debt securities market of enterprises will continue to grow in the
upcoming years. The market for municipal bonds was strongly fragmented, which resulted
from minor borrowing needs of smaller local government units and splitting issues in a
number of series. Banks continued to fund their needs by issuing debt securities to a minor
extent.
The capitalisation of the Polish stock market rose to PLN 1,262.1 billion, mainly on the back of
the listing of Spain’s Banco Santander. The market value of domestic companies dropped
slightly, and the ratio of their capitalisation to Poland’s GDP amounted to 34.7% at the end of
2014. The liquidity of the domestic stock market remained low as compared with stock
exchanges in developed countries. What affects low liquidity is the fact that securities of a
relatively large number of companies with low capitalization and low free float continue to
be dealt in on the stock exchange. A rise in activity of remote WSE members using high
frequency trading may contribute to increasing the trade on the stock market in the coming
years. In 2014, the value of shares sold in IPOs and SPOs, which was not only the result of
smaller-scale issues prepared by companies but also of investor’s lower interest in buying the
instruments, decreased substantially.
NewConnect shrank for the first time ever, both in terms of capitalisation and the number of
issuers. The decline in value was driven by both price movements of the shares listed on this
market, and delisting or transferring equities to the WSE Main Market by some issuers. The
liquidity of the NewConnect market was not supported by the low value of shares in original
offers. It would be worth considering a further increase in the requirements for issuers of
shares to be traded in NewConnect (e.g. setting a minimum size of the share issue of a given
company) and enhancement of the market’s information transparency.
The October 2014 change of the settlement cycle from T+3 to T+2 for shares, rights to shares,
depository receipts, ETFs and investment certificates was related to the harmonisation of the
Polish market to the provisions of the Regulation of the European Parliament and of the
Council improving securities settlement in the European Union and on central Securities
depositories. The switch to T+2 will allow the KDPW participants to receive securities
(buyers) and cash (sellers) resulting from the trade sooner.
Average daily turnover on the global spot market for the Polish zloty increased by 10% in
2014 to around USD 10.5 billion. The vast majority of transactions (over 80%) were concluded
in the offshore market. The EUR/PLN exchange rate was largely determined by

Summary
8 Narodowy Bank Polski
developments in the global financial markets and often poorly reflected the flows arising
from trading between real economy agents or non-resident investments in the domestic
capital market.
In 2014, the value of transactions in OTC derivatives denominated in the Polish zloty in the
offshore market, which involves transactions between non-residents, was significantly higher
than in the domestic market, which was primarily tied with a robust activity of London-
based banks and hedge funds. In Poland, OTC interest rate derivatives markedly prevailed,
in terms of turnover value, despite a substantial rise in market participants’ interest in
transactions in derivatives hedging against FX risk observed during the year. Investor activity
in the market for exchange derivatives remained considerably lower than in the OTC market
and was concentrated on the segment of WIG20 futures.
In order to mitigate market risk originating from foreign currency housing loans, domestic
banks commonly used CIRS basis transactions in their hedging strategies. The current sales
on the spot market of foreign currencies received in the initial exchange of the CIRS basis
transaction allowed the banks to offset a long currency position.
The obligation to send reports on the conclusion, modification and an early termination of a
derivatives contract to trade repositories of ESMA-registered trades came into force in
February 2014. Moreover, as of 12 August 2014, participants in the derivatives market were
obligated to send information on the mark to market valuations of contracts and their
collateral. The reporting requirement applies to both parties, which are legal persons, to the
derivatives contract.
When using the domestic post-trade infrastructure, financial market participants meet the EU
requirement regulation on trading in OTC derivatives. KDPW is an institution authorised by
ESMA to collect reports containing data on all types of derivatives transactions. This entity
also has the status of a unit responsible for assigning globally unique codes identifying
natural persons who are parties to a derivatives transaction. In April 2014, the KNF
authorised the clearing house KDPW_CCP to render clearing services as a CCP under the EU
Regulation EMIR. It can conduct clearing of, among others, derivatives cleared in PLN (FRAs,
IRSs and OISs). Introducing the obligation to clear transactions in standardised derivative
instruments by CCP, in particular if it concerns OTC interest rate derivatives in the zloty,
may be of great significance for the development of the domestic derivatives market and
functioning of KDPW_CCP.
As data are of poor duality and there is no single standard for making them available, few
institutions authorised to use information complied at trade repositories have decided to get
them from all repositories and make a comprehensive analysis. The following are necessary
to improve data quality: uniformisation by trade repositories of the rules of verification of
whether reports sent are complete, the regular and formalised reconciliation of reports sent
by 2 parties to the transaction, separating – on the basis of received reports – the chain of
linked transactions and a possible removal of the replicated data by the reporting entities.
Directions of the evolution of Poland’s financial system
9 Financial System in Poland 2014
1. Directions of the evolution of Poland’s
financial system
In 2014, the Polish economy was developing in an environment of diversified growth rates in the
major world economies. The US economy rebounded strongly, while in the euro area the GDP
growth rate remained at a low level. Poland’s GDP growth rate was 3.3%, compared with 1.7% in
2013. This growth was accompanied by the absence of price growth, and in the second half of the
year – deflation. The annual average CPI was 0.0%, and the annual CPI at the end of December
2014 was negative (-1.0%). It was mainly driven by falling commodity prices, including fuel and
food prices1, and subdued demand pressure in the national economy. The Monetary Policy
Council (MPC) lowered the NBP interest rates on one occasion, cutting the reference rate by 50
basis points to 2.0% and the Lombard rate by 100 basis points to 3.0% from 9 October 2014. The
NBP deposit rate remained unchanged at 1.0%.
In such an environment, the economic condition of enterprises improved and gross fixed capital
formation, including machinery and equipment, increased. Corporate investments were partly
financed with external sources. The value of long-term loan debt rose substantially.2 This was
supported by low interest rates and a less restrictive policy of banks in the second half of the
year, in particular an easing of the standards and terms of granting loans. The financial standing
of households improved in 2014. They reported higher income, and monthly available income
per capita was 3.2% higher, in real terms, than in 2013.3 Poland’s unemployment rate dropped to
11.5% from 13.4% in 2013. The total employment rate rose from 60% in 2013 to 61.7% in 2014.
Household financial assets also grew (by 8.8%), and the growth of savings (bank deposits) stood
at 10.4%.
In the period analysed, the monetary policies of central banks diverged, the global economic
growth outlook was bleak and geopolitical risks increased, which had an impact on sentiment in
the world financial markets. The global rise in risk aversion was conducive to a depreciation of
the currencies of a number of emerging markets. In Poland, share prices fell on the Warsaw Stock
Exchange. The yields on Polish government bonds reached their all-time low in response to
expectations of an interest rate cut by the MPC and an easing of the ECB monetary policy.
1 Inflation Report. March 2015, Warsaw, March 2015, NBP, pp. 9, 25 and 29. 2 Sytuacja finansowa sektora przedsiębiorstw w IV kw. 2014 r. [Financial situation in the enterprise sector in 2014 Q4],
Warsaw, April 2015, NBP, p. 5. 3 Sytuacja gospodarstw domowych w 2014 r. w świetle wyników badania budżetów gospodarstw domowych. [The situation
of households in 2014 as evidenced by the results of the household budget survey], Information note, Warsaw
26 May 2015, GUS, p. 1.

Directions of the evolution of Poland’s financial system
10 Narodowy Bank Polski
When assessing trends of the size of Poland’s financial system, one has to take into account the
impact of a one-off development related to the open pension system reform in 2014, which led to
a transfer of over 50% of open pension funds (OFEs) to the Social Security Institution (ZUS). As a
result, the ratio of domestic financial system assets to GDP decreased by 4.5 percentage points
when compared with the end of 2013 and amounted to 121.4% at the end of December 2014
(Table 1.1.). If, in order to preserve comparability with the year 2013, the amounts transferred
from the OFEs to ZUS were taken into account in the value of financial system assets, then the
ratio of domestic financial system assets to GDP in 2014 would stand at 130.5%. This would
imply a substantial increase against the year 2013.
Table 1.1. Assets of the financial system as a percentage of GDP in selected Central and Eastern
European countries and in the euro area, 2011-2014 (%)
2011 2012 2013 2014
Poland 116.4 121.2 125.9 121.4
Czech Republic 147.6 153.3 165.0 164.4
Hungary 148.6 135.1 132.9 133.3
Euro area 481.5 487.1 470.6 493.8
Notes: Data for the euro area refer to 17 countries in 2011-2013 and 18 countries in 2014. Due to the change of the
source of data, inclusion of assets of money market funds in the financial system assets and adjustments sent by
central banks, the data are not comparable with the data released in previous editions of the report.
Sources: For the euro area ‒ ECB Statistical Data Warehouse and Eurostat; for other countries ‒ data are provided
by national central banks (NCBs) and the Central Statistical Office of Poland (GUS).
In Poland, similarly to other Central and Eastern European (CEE) countries, the development of
financial intermediation, measured by the ratio of financial system assets to GDP, still exhibited a
low level compared with the ratio’s average value in the euro area countries (Figure 1.1.). Given
the extent and room for further development of the domestic financial system, it can be expected
that it will have a positive effect on economic growth (Box 1.2). At the end of 2014, assets of
institutions comprising the Polish financial sector amounted to PLN 2,098.3 billion, i.e. they were
0.2% higher than a year earlier. The minor increase was primarily caused by a fall in the value of
assets of open pension funds. On the other hand, assets of investment funds rose substantially –
by 12.6%, and assets of commercial banks – by 9.3%.
The analysis of financial institutions and markets of various countries against the level of
economic development implies that some segments of Poland’s financial system, including the
banking sector, remain relatively poorly developed (Figure 1.2).

Directions of the evolution of Poland’s financial system
11 Financial System in Poland 2014
Figure 1.1. Financial system assets in selected EU countries at the end of 2014
Sources: Calculations based on data provided by the ECB, Eurostat, GUS and NBP.
Figure 1.2. Financial system development depending on the level of GDP per capita
Sources: NBP calculations based on data provided by the International Monetary Fund (World Economic
Outlook, 04/2013), the World Bank (Financial Structure Dataset, 04/2013) as well as GUS, Office of the Polish
Financial Supervision Authority (UKNF), Warsaw Stock Exchange (WSE), Fitch Polska and NBP.
Note: Values of the regression function presented in the figure were estimated for panel data which included
information on the financial systems of 203 countries for the years 1991-2012.
The following development measures of the individual sectors of the financial systems were used:
banking sector: loans to non-public sector to GDP (for Poland ‒ banking sector’s loans and advances to the
non-financial sector in domestic and foreign currency),
equity market: capitalisation of domestic companies of the WSE Main Market to GDP,
insurance market: non-life and life insurance premium to GDP,
public sector debt securities: outstanding value of general government debt securities to GDP,
debt securities of other sectors: outstanding value of debt securities of financial institutions and enterprises to
GDP.
More in: T. Beck, A. Demirgüç-Kunt: Financial Institutions and Markets across Countries and over Time: Data and
Analysis, World Bank Policy Research Working Paper No. 4943, May 2009.
The regression function was estimated using the Fixed Effects GLS method in relation to the banking sector and
equity market, and the Random Effects GLS in relation to debt securities of the public sector, other sectors and the
insurance sector. The model was selected on the basis of the Hausman test (M. Verbeek: A Guide to Modern
Econometrics, 2004 John Wiley & Sons, pp. 351-352).
0
130
260
390
520
650
780
0
2
4
6
8
10
12
Germ
any
Italy
Neth
erla
nd
s
Spain
Belg
ium
Austr
ia
Fin
land
Pola
nd
Slo
va
kia
Slo
ve
nia
Esto
nia
Monetary financial institutions ‒ left-hand scale Investment funds ‒ left-hand scaleInsurance companies ‒ left-hand scale Pension funds ‒ left-hand scaleFinancial system assets/GDP ‒ right-hand scale
%EUR trillion
0
10
20
30
40
50
60
70
80
90
100
110
7.5 8 8.5 9 9.5 10
Segm
ents
of
the fin
ancia
l secto
r
(% o
f G
DP
)
Logarithm of GDP per capita (in PPP)
Banking sector Banking sector ‒ actual values in PolandEquity market Equity market ‒ actual values in PolandDebt securities of public sector Debt securities of public sector ‒ actual values in PolandDebt securities of other sectors Debt securities of other sectors ‒ actual values in PolandInsurance sector Insurance sector ‒ actual values in Poland
20
00
20
14
20
07

Directions of the evolution of Poland’s financial system
12 Narodowy Bank Polski
The Polish financial system is also characterised by a relatively low level of stock market
capitalisation and a low value of outstanding private sector debt securities, including corporate
and bank bonds. At the same time, evidence from the recent global financial crisis shows that
banking sectors, being a main element of a number of financial systems, were too large in some
countries and inadequate for the needs of the real economy.4
In Poland, as in the majority of other countries of the region, the banking sector continued to play
a major role in financial systems, although the Polish financial system can be viewed as the least
banking-oriented in CEE (Figure 1.3). This results from a larger sector of collective investment
undertakings, i.e. pension and investment funds and insurance companies.
Figure 1.3. Composition of financial systems in Central and Eastern European countries at the
end of 2014, by value of assets
Sources: For Slovakia, data were derived from the website of the central bank of Slovakia http://www.nbs.sk and
ECB Statistical Data Warehouse; for other countries ‒ data were provided by NCBs; for Poland ‒ NBP.
In CEE countries, the level of banking sector development remained low in comparison with the
euro area countries (Table 1.2). Domestic banks focused on providing traditional services, mainly
on deposit taking from and lending to non-financial clients.
The year 2014 saw a significant rise in the value of assets of banks and investment funds in
Poland (Tables 1.3 and 1.4). The balance sheet total of investment firms decreased for the second
year in a row, and the biggest fall in the value of assets was registered in the open pension funds
and credit unions sectors. In 2014, assets of the banking sector grew by 9.3% and their growth
rate was substantially higher than in 2013.
4 Changing Global Financial Structures: Can They Improve Economic Outcomes?, in: Global Financial Stability Report.
Restoring Confidence and Progressing on Reforms, Washington, October 2012, International Monetary Fund, pp.
150-152.
8.0 7.7 7.4 7.1
0.70.6 0.9 0.9
0.4 1.4 1.10.6
0.50.3 0.7
0.9
0.4 0.6
0
10
20
30
40
50
60
70
80
90
100
Czech Republic Hungary Poland Slovakia
Credit institutions Insurance companies Investment funds Pension funds Other financial sector institutions
%

Directions of the evolution of Poland’s financial system
13 Financial System in Poland 2014
Table 1.2. Banking sector development levels (commercial and cooperative banks) in
selected CEE countries and in the euro area, 2012-2014 (%)
Assets/GDP Loans1/GDP Deposits
2/PKB
2012 2013 2014 2012 2013 2014 2012 2013 2014
Poland 83.5 84.5 88.5 50.0 50.3 51.6 44.8 46.6 49.3
Czech Republic3 116.0 129.4 131.0 58.3 64.7 66.4 70.2 76.9 79.2
Hungary 110.1 104.4 102.7 43.1 39.3 36.7 34.8 32.4 31.6
Euro area4
334.1 308.3 309.9 100.0 97.0 94.2 80.5 82.4 83.4
1 Loans and advances from the banking sector to the non-financial sector in domestic and foreign currency. 2 Deposits of the non-financial sector in the banking sector in domestic and foreign currency. 3 The data also include loans to non-bank financial institutions and deposits of those entities. 4 Assets, loans and deposits of the monetary financial institutions sector. Data for the euro area refer to 17
countries for the years 2012–2013 and 18 countries for the year 2014. Due to the change of the source of data and
adjustments sent by central banks, the data are not fully comparable with the data published in previous
versions of the report.
Note: Due to the adjustments, the data may differ from the data presented in previous issues of the report.
Sources: For the euro area: ECB Statistical Data Warehouse; for other countries ‒ data provided by NCBs and
GUS.
Table 1.3. Assets1 of financial institutions in Poland, 2007-2014 (PLN billion)
2007 2008 2009 2010 2011 2012 2013 2014
Commercial banks2 727.1 963.2 977.2 1,062.1 1,187.9 1,233.7 1,275.4 1,393.9
Cooperative and affiliating banks2 65.7 75.9 82.4 96.4 106.1 115.8 129.3 135.4
Credit unions3 7.3 9,4 11.6 14.0 15.6 16.8 18.7 13.7
Insurance companies 126.9 137.9 139.0 145.2 146.1 162.7 167.6 178.5
Investment funds4 134.5 76.0 95.7 121.8 117.8 151.5 195.0 219.5
Open pension funds 140.0 138.3 178.6 221.3 224.7 269.6 299.3 149.1
Investment firms5 11.8 8.6 9.9 9.2 10.1 9.0 8.6 7.9
Total 1,213.3 1,409.3 1,494.4 1,670.0 1,808.3 1,958.9 2,093.9 2,098.0
1 Net asset value for banks, investment funds and open pension funds. 2 Banks that conduct operating activity. Commercial banks also included branches of credit institutions. 3 Data for 2014 include assets of operating unions. 4 Due to the change of the source of data, data on assets of investment funds since 2010 differ from data
published in previous editions of this report. Data starting from 2010 are not fully comparable with data
concerning earlier periods. 5 Up to and including 2009, assets of investment firms included assets of brokerage houses and offices. Starting
from 2010, assets of investment firms include exclusively assets of brokerage houses after the obligation to
financially separate the brokerage activity of banks was lifted.
Sources: NBP, UKNF, Analizy Online, KSKOK.
Banks continued to focus on lending to households. The value of housing loans denominated in
the Polish zloty rose by 14.2% in 2014, which represents a slowdown in lending compared with
previous years. The value of foreign currency loans, which accounted for 46% of the housing loan
portfolio in 2014, declined for the third year in succession. A further recovery was observed in the
market for consumer loans (a 6.2% increase), which was driven by banks easing their lending

Directions of the evolution of Poland’s financial system
14 Narodowy Bank Polski
policies and favourable macroeconomic conditions. Also in 2014, the value of loans taken by
enterprises rose by almost 7%, especially investment loans (by over 10%). The trend towards a
stable share of corporate loans in total loans, observed as early as in 2013, continued.
Table 1.4. Growth in assets1 of financial institutions in Poland, 2011-2014 (y/y, %)
2011 2012 2013 2014
Commercial banks2 11.8 3.9 3.4 9.3
Cooperative and affiliating banks2 10.1 9.1 11.7 4.7
Credit unions 11.4 7.7 11,3 -26.7
Insurance companies 0.6 11.4 3.0 6.5
Investment funds -3.3 28.4 28.9 12.6
Open pension funds 1.5 19.8 11.1 -50.2
Investment firms 9.8 -10.9 -4.4 -8.1
Total 8.3 8.3 6.9 0.2
1 Net asset value for banks, investment funds and open pension funds. 2 Banks that conduct operating activity. Commercial banks also included branches of credit institutions.
Sources: NBP, UKNF, Analizy Online and KSKOK.
Assets of investment funds rose by 12.6% and for the first time ever their value exceeded the PLN
200 billion mark. The asset growth was lower than in previous years and came mainly on high
net inflows. The ratio of assets accumulated by investment funds to bank deposits of households
increased again (Figure. 1.4).
The NBP interest rate cut was followed by a cut in the interest on bank deposits, which made
households seek more attractive forms of investing their savings than deposits. Households
invested most savings in units of domestic bond funds. Compared with 2013, households showed
less interest in equity funds, which was related to falling share prices on the WSE.
Figure 1.4. Assets of investment funds as a percentage of bank deposits from households, 2007-
2014
Sources: NBP and Analizy Online.
51.6
23.1
25.4
29.5
25.2
30.0
36.3
37.0
20
25
30
35
40
45
50
55
2007 2008 2009 2010 2011 2012 2013 2014
%

Directions of the evolution of Poland’s financial system
15 Financial System in Poland 2014
In the period under analysis, assets of open pension funds slumped by over 50%, mainly on
account of changes in the law. The trends mentioned earlier in the text led to an increase in the
banking sector’s share in the structure of financial sector assets, while the share of non-credit
financial institutions declined (Figures 1.5 and 1.6).
Figure 1.5. Asset structure of the Polish financial system, 2007-2014
Sources: NBP, UKNF, Analizy Online and KSKOK.
Figure 1.6. Share of individual financial institutions in the asset structure of the Polish financial
system in 2013 and 2014
A. 2013 B. 2014
Sources: NBP, UKNF and Analizy Online.
At the end of 2014, 64 commercial banks, including 28 branches of credit institutions, carried on
operations in Poland. Also 565 cooperative banks and 2 affiliating banks operated on the
domestic market. A further consolidation in the banking sector, insurance sector and the sector of
pension fund management companies was accompanied by a marked increase in the number of
investment funds (Table 1.5). This stemmed mainly from the establishment of private equity
investment funds (in the form of closed-end investment funds) that serve to provide customized
2007 2008 2009 2010 2011 2012 2013 2014
0
20
40
60
80
100
Banks Credit unions Insurance companies Investment funds Open pension funds Investment firms
%
67,1%0,9%
8,0%
9,3%
14,3%0,4%
Banks Credit unions Insurance companies
Investment funds Open pension funds Investment firms
72,9%
0,7%
8,5%
10,5%
7,1% 0,4%
Banks Credit unions Insurance companies
Investment funds Open pension funds Investment firms

Directions of the evolution of Poland’s financial system
16 Narodowy Bank Polski
investment solutions for companies and affluent individuals. For the first time in its history, the
Polish Financial Supervision Authority revoked a licence an investment fund management
company to conduct business in Poland.
In 2014, the capitalisation of the Polish stock market rose to PLN 1,262.1 billion, maintaining its
significance in Poland’s financial system and in the region (Table 1.6). Although the financial
results of companies listed on the WSE Main Market improved, the negative sentiment of
investors towards emerging markets caused the broad market index WIG to fall by 3.5%. Shares
of 21 new companies (23 companies in 2013) were admitted to trading in the regulated market,
but in the non-regulated organised market NewConnect the number of listed companies dropped
by 14. The value of new shares issued by the companies5 was PLN 0.4 billion (vs. PLN 0.6 billion
in 2013). The liquidity of the domestic stock market was still low compared with stock exchanges
in developed countries. A rise in non-residents’ share was observed in the WSE capitalisation,
which stood at 46.5% at the end of 2014.
Table 1.5. The number of financial institutions in Poland, 2007-20141
2007 2008 2009 2010 2011 2012 2013 2014
Commercial banks2
61 67 64 67 66 68 67 64
Affiliating banks2 3 3 3 3 2 2 2 2
Cooperative banks2 581 579 576 576 574 572 571 565
Credit unions 67 62 62 59 59 55 55 50
Insurance companies3 67 66 64 63 61 59 58 57
Investment funds (investment fund management companies)
4
277
(33)
319
(39)
369
(43)
407
(50)
482
(50)
580
(54)
635
(55)
676
(58)
Open pension funds (pension fund management companies)
5
15 14 14 14 14 14 13 12
Investment firms6 53 58 59 50 51 53 57 54
1 The table presents the number of institutions whose assets were taken into account in Table 1.1.3. It does not
include foreign entities which may pursue cross-border activity (without their legal and organisational presence
in Poland), branches of insurance companies and branches of foreign investment companies. 2 Banks that conduct banking activity. The number of commercial banks also includes branches of credit
institutions. In 2007, there were 14, in 2008 and 2009 ‒ 18, in 2010 and 2011 ‒ 21, in 2012 ‒ 25, and in 2014 ‒ 28
branches of credit institutions. 3 Entities carrying on operating activity in the area of insurance and reinsurance. 4 In 2007, the number of established investment funds and investment fund management companies (pursuant to
the decision of the Polish Financial Supervision Authority (KNF)); in 2008 and 2009 ‒ the number of entities
registered with the Investment Fund Register kept by the Regional Court in Warsaw; since 2010, the number of
operating funds. 5 The number of pension fund management companies equals the number of open pension funds. 6 Up to and including 2009, the number of investment firms included the number of brokerage houses and
offices. Since 2010, the number of investment firms applies exclusively to brokerage houses.
Sources: NBP, UKNF and KSKOK.
5 The value of new issues pertains to domestic and foreign companies that conducted IPOs on the WSE Main
Market and NewConnect.
Directions of the evolution of Poland’s financial system
17 Financial System in Poland 2014
The money bills market remained the largest segment of the short-term debt securities market in
2014. However, a drop in the value of these instruments came on the back of falling excess
liquidity in the banking sector. The Ministry of Finance was consistently pursing a strategy to
extend the maturity of the public debt. Enterprises and banks used their short-term debt
securities only to a minor extent to finance their needs.
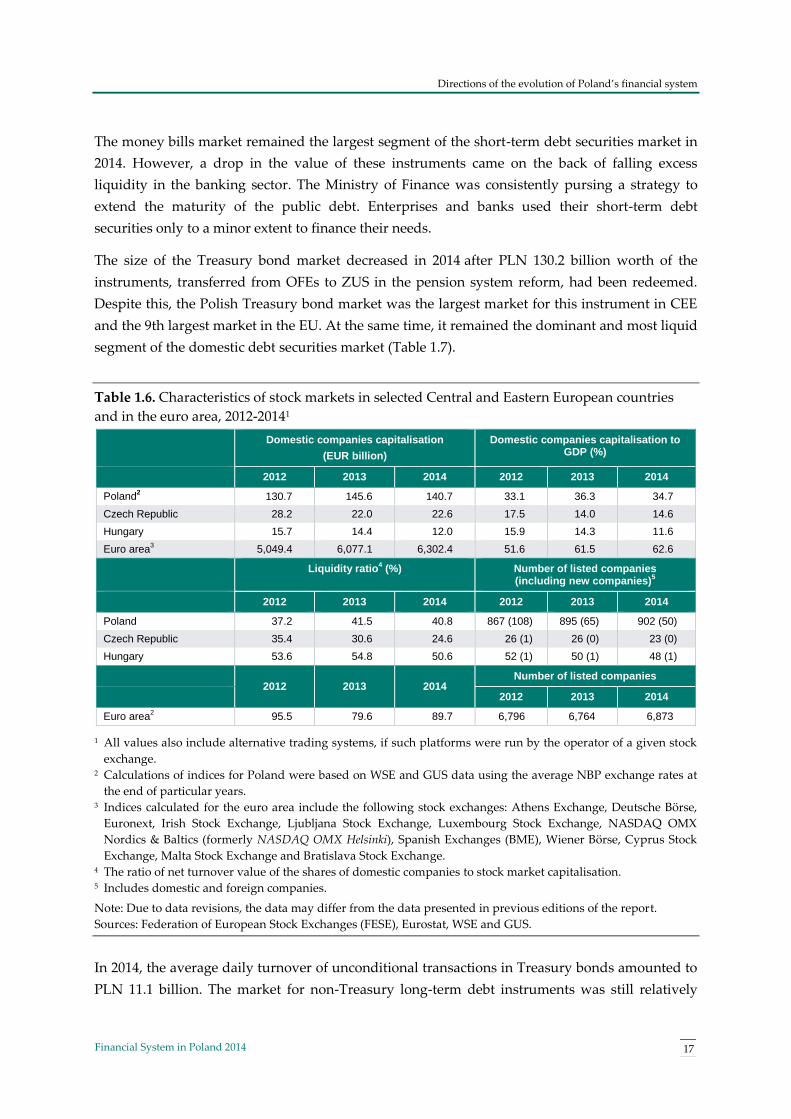
The size of the Treasury bond market decreased in 2014 after PLN 130.2 billion worth of the
instruments, transferred from OFEs to ZUS in the pension system reform, had been redeemed.
Despite this, the Polish Treasury bond market was the largest market for this instrument in CEE
and the 9th largest market in the EU. At the same time, it remained the dominant and most liquid
segment of the domestic debt securities market (Table 1.7).
Table 1.6. Characteristics of stock markets in selected Central and Eastern European countries
and in the euro area, 2012-20141
Domestic companies capitalisation
(EUR billion)
Domestic companies capitalisation to GDP (%)
2012 2013 2014 2012 2013 2014
Poland2 130.7 145.6 140.7 33.1 36.3 34.7
Czech Republic 28.2 22.0 22.6 17.5 14.0 14.6
Hungary 15.7 14.4 12.0 15.9 14.3 11.6
Euro area3
5,049.4 6,077.1 6,302.4 51.6 61.5 62.6
Liquidity ratio4 (%) Number of listed companies
(including new companies)5
2012 2013 2014 2012 2013 2014
Poland 37.2 41.5 40.8 867 (108) 895 (65) 902 (50)
Czech Republic 35.4 30.6 24.6 26 (1) 26 (0) 23 (0)
Hungary 53.6 54.8 50.6 52 (1) 50 (1) 48 (1)
2012 2013 2014
Number of listed companies
2012 2013 2014
Euro area2 95.5 79.6 89.7 6,796 6,764 6,873
1 All values also include alternative trading systems, if such platforms were run by the operator of a given stock
exchange. 2 Calculations of indices for Poland were based on WSE and GUS data using the average NBP exchange rates at
the end of particular years. 3 Indices calculated for the euro area include the following stock exchanges: Athens Exchange, Deutsche Börse,
Euronext, Irish Stock Exchange, Ljubljana Stock Exchange, Luxembourg Stock Exchange, NASDAQ OMX
Nordics & Baltics (formerly NASDAQ OMX Helsinki), Spanish Exchanges (BME), Wiener Börse, Cyprus Stock
Exchange, Malta Stock Exchange and Bratislava Stock Exchange. 4 The ratio of net turnover value of the shares of domestic companies to stock market capitalisation. 5 Includes domestic and foreign companies.
Note: Due to data revisions, the data may differ from the data presented in previous editions of the report.
Sources: Federation of European Stock Exchanges (FESE), Eurostat, WSE and GUS.
In 2014, the average daily turnover of unconditional transactions in Treasury bonds amounted to
PLN 11.1 billion. The market for non-Treasury long-term debt instruments was still relatively

Directions of the evolution of Poland’s financial system
18 Narodowy Bank Polski
poorly developed, although the value of instruments outstanding in each of its segments
continued to grow markedly. As a result, the share of non-Treasury instruments in the domestic
debt securities market grew by 15.7% at the end of 2013 to 20.9% at the end of 2014.
In the deposit transactions market, which is used mainly by financial institutions to manage
liquidity, an increase in turnover was observed, except for the category of unsecured interbank
market. The most liquid segment of the Polish money market was the conditional transactions
market, where SBB operations collateralised with Treasury bonds prevailed. The average daily
value of conditional transactions went up by almost 5%, while at the same time the trade in the
market for FX swaps was up by almost 9% (Table 1.8).
Table 1.7. Outstanding value of individual instruments of money and capital markets as of year-
end, 2011−2014 (PLN billion)
2011 2012 2013 2014
Treasury bills 12.0 6.1 0.0 0.0
NBP bills 93.4 127.5 131.4 110.6
Short-term bank debt securities 7.7 5.9 4.2 5.1
Short-term corporate bonds 15.9 18.5 16.2 13.5
Marketable Treasury bonds 495.2 520.0 565.7 482.9
BGK bonds for National Road Fund 22.6 25.6 25.4 19.6
Long-term corporate bonds 29.7 32.3 37.8 52.7
Municipal bonds 14.4 15.6 18.6 19.1
Long-term bank debt securities1
9.5 17.2 20.0 25.1
Covered bonds 2.9 3.1 3.3 4.1
1 The data include only bonds and bank securities, denominated in Polish zloty and in foreign currency, issued by
banks operating in Poland. European Investment Bank bonds and bonds issued by EU credit institutions were
also traded in the domestic market.
Note: Due to revisions, the data may differ from the data presented in previous editions of the report.
Sources: Ministry of Finance (MF), NBP, (Central Depository Securities of Poland (KDPW) and Fitch Polska.
The turnover also rose in the market for spot FX transactions and in the OIS market. The IRS
market was the most liquid OTS derivatives market. As in previous years, the majority of zloty
exchange transactions and OTC FX derivatives operations were concluded in the offshore
market, mainly in London. This means that the zloty exchange rate is largely determined by
operations executed between non-residents. Investor activity in the exchange-traded derivatives
market continued to concentrate on the segment of WIG20 futures.

Directions of the evolution of Poland’s financial system
19 Financial System in Poland 2014
Table 1.8. Average daily net turnover in the domestic financial market, 2011-2014 (PLN million)
2011 2012 2013 2014
Equity and debt instruments market
Shares and allotment certificates 1,076.1 820.0 1,041.8 941.0
Treasury bonds 29,555.3 28,491.7 30,113.8 27,158.9
Treasury bills 1,250.3 522.0 286.9 0.0
Deposit transactions market
TFX swap transactions 12,928.0 11,520.8 9,508.6 10,336.4
Repo/SBB transactions 11,572.5 12,557.5 14,508.2 15,249.9
Unsecured interbank deposits 6,195.4 5,874.2 5,833.4 4,925.8
Derivatives transactions market
FX forwards 1,379.6 1,210.7 1,396.1 1,795.0
CIRS transactions 113.3 200.9 188.3 183.5
Currency options 321.5 220.6 273.3 399.2
FRAs 5,572.6 5,116.4 5,772.7 4,404.8
IRSs 2,218.8 1,698.4 2,100.0 2,422.4
OISs 1,215.0 633.5 441.4 520.8
WIG20 futures 1,381.6 832.8 813.8 850.1
Spot FX market 5,219.1 5,179.9 5,106.8 5,549.3
Notes: 1. Average daily net turnover means the value of transactions (turnover calculated individually). In the
case of the FX swap market, turnover value was calculated for only one currency of the transaction.
2. The value of turnover in the Treasury bond and bills market takes into account unconditional and conditional
transactions (repo and sell-buy-back). In 2013, the average daily value of unconditional transactions in the market
amounted to PLN 14.3 billion for bonds and PLN 70 million for bills. In 2014, the value of such transactions for
Treasury bonds was PLN 11.1 billion (Treasury bills were not traded).
3. The value of conditional transactions (repo and sell-buy-back) was calculated according to the initial exchange
value. For fx swap transactions, the net turnover value was calculated according to the initial exchange value.
4. For the following markets: FX swap, FX, FX forwards, currency options and interest rate derivatives the value
represents the value of an exchange transaction involving the Polish zloty or PLN-denominated instruments. The
impact of changes in the population of Money Market Dealers was eliminated.
5. The turnover in shares includes the value of session and block transactions.
6. The turnover in WIG20 futures was calculated according to settlement values, taking into account session and
block transactions.
7. The turnover in the FX market includes domestic transactions only. It does not include the offshore market.
8. The turnover in the markets for interest rate derivatives refers to domestic money market rates instruments.
Sources: NBP study based on data from WSE, MF and NBP.

Directions of the evolution of Poland’s financial system
20 Narodowy Bank Polski
Box 1.1. Financial system in Poland ‒ from the perspective of 25 years of transformation
Size of financial system
In the last 25 years major changes have occurred in the scale and scope of activities of financial
institutions and the structure of Poland’s financial system.1 The ratio of financial institutions’ assets to
GDP showed the growth in the role of financial institutions in a synthetic manner. Following the initial
decline in this ratio to 48.3% in 1995, its rapid growth occurred in the following years, exceeding 120%
of GDP in 2012-2014 (Figure I). Growth in assets of financial institutions in the period of 25 years was
2.3-fold higher than the GDP growth rate. The development of the finance sector was significantly faster
as compared to the real economy. Nevertheless, the Polish financial system remained relatively small in
comparison with euro area countries. With the ratio of financial institutions’ assets to GDP for Poland
amounting to 121.4% in 2014, for euro area countries it reached 493.8% (757.9% for the Netherlands,
409.2% for Germany, 342.6% for Spain, 365.3% for Finland, 365.1% for Austria and 389.8% for Belgium).2
On the other hand, for Hungary and the Czech Republic this ratio reached a level only slightly higher
than for Poland (see Table 1.1).
Figure I. Assets of financial system institutions in Poland, 1990-2014
Sources: NBP, GUS.
The financial system structure ‒ institutions
Since the beginning of the transformation period, the banking sector has prevailed in Poland (Figure II).
Despite the fast growth of other financial institutions, the share of banks in the structure of financial
system assets remained at a relatively high level, reaching 72.9% in 2014 (in the 1990s, it exceeded 90%,
e.g. amounting to 94.5% in 1996). As compared to countries of the euro area, it was, for example, higher
than in the Netherlands ‒ 49.3% and in Germany ‒ 65.7%, similar to the level recorded in Austria ‒
73.4% and lower than in Italy ‒ 79.5% and Spain ‒ 82.0%. In Hungary (77.1%) and the Czech Republic
(79.7%), the share of the banking sector was higher than in the case of Poland.
The value of assets of other financial institutions at the end of 2014 amounted to PLN 555.1 billion,
which constituted 26.5% of total financial system assets and 32.1% of GDP.3 For comparison, at the end
of 2014 the value of assets of those institutions in Germany reached EUR 4,079.0 billion, which made up
34.3% of total financial system assets and 140.5% of GDP. In the Netherlands, it amounted to EUR
2,516.0 billion, constituting over 380% of GDP (Figure III).
0
30
60
90
120
150
0
500
1000
1500
2000
2500
199
0
199
1
199
2
199
3
199
4
199
5
199
6
199
7
199
8
199
9
200
0
200
1
200
2
200
3
200
4
200
5
200
6
200
7
200
8
200
9
201
0
201
1
201
2
201
3
201
4
Assets - left-hand scale Assets to GDP - right-hand scale
%PLN billion

Directions of the evolution of Poland’s financial system
21 Financial System in Poland 2014
Figure II. Asset structure of the Polish financial system institutions in 1996 and 2014
A 1996 r. B 2014 r.
Sources: NBP, UKNF, Analizy Online.
Figure III. Assets of other financial institutions in selected EU countries ‒ December 2014
Note: Other financial institutions comprise: investment funds (including investment firms), insurance companies
and pension funds.
Source: ECB.
The asset structure of non-bank financial institutions in EU member states was very diversified and
reflected, to a large extent, the historically determined role of financial institutions and the adopted
social security solutions, including pension systems. In Germany, assets of insurance companies –
46.2%, and investment funds – 40.5%, had the highest share in assets of non-bank financial institutions
in 2014. Pension funds played a lesser role, with the share of 13.3%. The structure of assets of those
institutions in the Netherlands was different. Pension funds with the share of 49.9% and investment
funds – 29.8%, prevailed. On the other hand, investment funds – 40.9%, and insurance
companies - 32.2%, had the highest share in Poland. The contribution of pension funds amounted to
26.9% (Figure IV).4
In Poland, in the years 1996-2014 the growth rate in assets of financial institutions other than banks (i.e.
credit unions, insurance companies, investment funds, open pension funds and investment firms) was
diversified (Figure V). The most stable growth in assets, although at a moderate pace, was recorded in
the sector of insurance companies. Investment funds and open pension funds demonstrated the highest
growth rate. In the case of investment funds, a decline in the value of assets was recorded in 2008 and
2011 in connection with turbulences in financial markets. Assets of open pension funds were growing
continuously until 2013. The 50% decline in the value of assets in 2014 resulted from the introduction of
statutory changes in the functioning of open pension funds.
94,5%
0,1%
3,9% 0,7%0,0%0,9%
Banks Credit unions Insurance companies
Investment funds Open pension funds Investment firms
72,9%
0,7%
8,5%
10,5%
7,1% 0,4%
Banks Credit unions Insurance companies
Investment funds Open pension funds Investment firms
0
50
100
150
200
250
300
350
400
450
0
500
1000
1500
2000
2500
3000
3500
4000
4500
Netherlands Germany Belgium Austria Finland Italy Spain Slovenia Poland Slovakia Estonia
Assets of other financial institutions - left-hand scale Assets of other financial institutions to GDP - right-hand scale
%

Directions of the evolution of Poland’s financial system
22 Narodowy Bank Polski
Figure IV. Asset structure of other financial institutions in selected EU countries as at the end of
December 2014
Note: Other financial institutions comprise: investment funds (including investment firms), insurance companies
and pension funds.
Source: ECB.
Figure V. Assets of non-bank financial institutions in Poland, 1996-2014
Sources: NBP, UKNF, Analizy Online and KSKOK
Financial system structure ‒ banking sector and financial markets
The financial system may be analysed not only in terms of the share of individual financial institutions.
Interrelations of the banking sector and capital market are also important (the ratio of banking sector
assets to capitalisation of domestic companies listed on the WSE (Warsaw Stock Exchange) and the
outstanding value of corporate bonds, i.e., the so-called financial system structure ratio). The higher the
ratio, the higher the role of the banking sector in the financial system. A decrease in this ratio means the
increasing importance of capital markets.
The financial system structure ratio for Poland in the years 1996 – 2014 showed a downward trend until
2007 (with a slower decline in the years 2001-2002 associated with a decrease in the capitalisation of
domestic companies) (Figure VI). As a consequence of the global financial crisis, the year 2008 brought a
sharp decline in the valuation of companies listed on the WSE and a decrease in stock exchange
capitalisation by almost 50%. In subsequent years, those losses were recovered; however, the capital
market has never returned to the fast growth path (Figure VII). As a consequence, the financial system
structure ratio stabilised at a level slightly exceeding 2. This confirms a strengthening of the leading role
of the banking sector in the Polish financial system.
0
10
20
30
40
50
60
70
80
90
100F
inla
nd
Euro
are
a
Austr
ia
Pola
nd
Germ
any
Spain
Neth
erland
s
Italy
Belg
ium
Slo
va
kia
Slo
ve
nia
Esto
nia
Investment funds Insurance companies Pension funds
%
0
6
12
18
24
30
36
42
0
100
200
300
400
500
600
700
199
6
199
7
199
8
199
9
200
0
200
1
200
2
200
3
200
4
200
5
200
6
200
7
200
8
200
9
201
0
201
1
201
2
201
3
201
4
Credit unions - left-hand scale Insurance companies - left-hand scale Investment funds - left-hand scale
Open pension funds - left-hand scale Investment firms- left-hand scale Assets to GDP - right-hand scale
%

Directions of the evolution of Poland’s financial system
23 Financial System in Poland 2014
Figure VI. Financial system structure ratio in Poland, 1996-2014
Note: The financial system structure ratio is the relation of financial system assets to capitalisation of domestic
companies listed on the WSE and the outstanding value of corporate bonds.
Sources: NBP, WSE, MF
Figure VII. Number of domestic companies and their capitalisation against GDP on the WSE Main Market,
1991-2014
Source: WSE.
Banking sector ‒ size and structure
The ratio of Polish banking sector assets to GDP, despite the dominant role of banks in the financial
system, was not high (in 2014 it amounted to 88.5%). For euro area countries, this ratio was several
times higher, reaching 309.9%.
The dominant role of banks in the financial system in Poland resulted mainly from historical conditions,
habits and client preferences as well as the range of products and services adjusted to clients' needs.
Other factors significant for the development of the banking sector included the liberalisation of legal
regulations as well as the ultimately adopted form of privatisation through the sale of banks to a
strategic investor and the use of various incentives towards foreign investors. The banking sector in
Poland has become predominated by foreign capital due to the privatisation process and foreign capital
inflow. In this respect, the years 1998–2000 were decisive, when the share of foreign investors in
banking sector assets increased from 16.6% in 1998 to 69.6% in 2000, remaining at the same high level
until 2008 (72.3%). After 2008, as a consequence of the global financial crisis and a higher growth of
banks with domestic capital, the share of foreign investors was gradually decreasing. At the end of 2014,
it reached 61.5% (Figure VIII).
0
1
2
3
4
5
6
7
8
9
1996 1997 1998 1999 2000 2001 2002 2003 2004 2005 2006 2007 2008 2009 2010 2011 2012 2013 2014
Financial system structure ratio Financial system structure ratio
0
5
10
15
20
25
30
35
40
45
0
50
100
150
200
250
300
350
400
450
199
1
199
2
199
3
199
4
199
5
199
6
199
7
199
8
199
9
200
0
200
1
200
2
200
3
200
4
200
5
200
6
200
7
200
8
200
9
201
0
201
1
201
2
201
3
201
4
%
Number of domestic companies - left-hand scale Capitalisation of domestic companies to GDP - right-hand scale

Directions of the evolution of Poland’s financial system
24 Narodowy Bank Polski
Figure VIII. Sector of commercial banks in Poland according to ownership structure, 1988-2014
Source: UKNF.
During the transformation period, the banking sector was undergoing consolidation comprising both
commercial banks and cooperative banks sectors. Despite those processes, within a long-term horizon
the concentration of the banking sector remains relatively stable (the peak occurred in 2001–2003).5 This
is indicated by the developments of C5 and C10 ratios (Figure IX) and the HHI.
The decline in the number of banks that conduct operating activity did not affect the level of banking
sector diversification in terms of business model, forms of the provision of services or ownership
structure. Besides commercial banking, Poland has a well-developed network of cooperative banks,
having changed significantly over the recent 25 years. The number of independently operating
cooperative banks decreased by approximately 2/3 (from 1,612 cooperative banks in 1989 to 574 in
2014).6 The share of cooperative banks in the banking sector (in assets, deposits and lending) was stable,
not exceeding 10%. At the beginning of 1990s, the share of the cooperative banking sector (cooperative
banks and BGŻ SA) in the total banking sector balance sheet stood at a level of 8.5%.7 At the end of 2014,
the share of the cooperative banking sector (cooperative banks and affiliating banks) in banking sector
assets amounted to 8.9%.8 In many EU countries, such as Italy, the Netherlands, France and Austria,
cooperative banking played a more significant role, which is confirmed by the share of this sector in the
market of deposits and lending exceeding 30%.9
Figure IX. Share of the five and ten largest banks in Poland in assets, deposits and lending, 1996-2014
Note: CR5 and CR10 mean, respectively, the share of the five and ten largest banks in assets, deposits and lending of
the banking sector.
Source: UKNF.
2,6
16,6
69,572,3
61,5
97,4
83,4
30,527,7
38,5
0
10
20
30
40
50
60
70
80
90
100
0
10
20
30
40
50
60
70
80
90
100198
8
198
9
199
0
199
1
199
2
199
3
199
4
199
5
199
6
199
7
199
8
199
9
200
0
200
1
200
2
200
3
200
4
200
5
200
6
200
7
200
8
200
9
201
0
201
1
201
2
201
3
201
4
Number of banks with majority state-owned capital - left-hand scale Number of banks with majority capital Polish private investors - left-hand scale
Number of banks with majority foreign capital - left-hand scale Foreign investors - share in assets - right-hand scale
Domestic investors - share in assets - right-hand scale
%
30
40
50
60
70
80
90
1996 1997 1998 1999 2000 2001 2002 2003 2004 2005 2006 2007 2008 2009 2010 2011 2012 2013 2014
Assets CR5 Deposits CR5 Loans CR5 Assets CR10 Deposits CR10 Loans CR10
%

Directions of the evolution of Poland’s financial system
25 Financial System in Poland 2014
Banking sector ‒- credits and loans
In the years 1990-2014, lending activity of banks changed profoundly. At the beginning of the
transformation period, the majority of loan debt referred to the so-called socialised entities, according to
the terminology used at that time (January 1990 – over 96%). In this period, lending to households
constituted 2.5% of total outstanding lending. In January 1992, almost 63% of outstanding loans were
those from state-run economic entities, 27.5% ‒ from private economic entities, and 3.7% ‒ from
households. In subsequent years, the share of lending to state economic entities steadily decreased (e.g.
to 37.2% in January 1996) and increased in relation to private economic entities and households
(reaching, respectively, 34.5% and 10.1% in January 1996).10
The tendency showing a decline in the share of corporate lending and growth in the role of lending to
consumers is visible in the data for the period from December 1996 to December 2014 (Figure X). The
share of corporate lending (enterprises, individual entrepreneurs and individual farmers were classified
in this category), aimed at financing business operations as well as investment and development
projects, decreased systematically from 84.2% in December 1996 to 39.5% in December 2010. Since then
it has remained at a more or less stabilised level, fluctuating around 40% (December 2014 – 41%). At the
same time, there was a systematic, rapid growth in the share of lending to consumers (this category
comprises credits and loans offered to private individuals) from 15.6% in December 1996 to 60% in
December 2010 as well as its stabilisation at a level exceeding 58% (58.3% in December 2014).
Banking sector ‒ housing loans
In the years 1996-2004, housing loans represented the fastest growing category of credit to consumers.
In December 1996, the share of housing loans in lending to consumers amounted to only 8.9% (Figure
XI). In practice, it comprised only loans granted in zlotys (98%). After almost four years, this share
doubled and housing loans amounted to 18.1% of the share in consumer loans (July 2000). At that time,
the share of foreign currency-denominated loans was insignificant ‒ only 2.5% of consumer loans. A
very fast growth of outstanding housing loans occurred in subsequent months.
Figure X. Share of credits and loans granted to entrepreneurs and consumers in lending to the non-
financial sector in Poland, 1996–2014Sektor bankowy – kredyty i pożyczki
Note: The category of "entrepreneurs" comprises credits and loans to enterprises (SMEs and large enterprises),
individual entrepreneurs and individual farmers. The category of "consumers" comprises credits and loans granted
to private individuals.
Source: NBP.
Only 35 months was needed for the share to double to 36.2%. This sharp increase was possible, inter
alia, due to the development of lending in foreign currency. The share of housing loans in consumer
0
10
20
30
40
50
60
70
80
90
354
30
355
50
356
73
357
95
359
15
360
38
361
60
362
80
364
03
365
25
366
46
367
69
368
91
370
11
371
34
372
56
373
76
374
99
376
21
377
41
378
64
379
86
381
07
382
30
383
52
384
72
385
95
387
17
388
37
389
60
390
82
392
02
393
25
394
47
395
68
396
91
398
13
399
33
400
56
401
78
402
98
404
21
405
43
406
63
407
86
409
08
410
29
411
52
412
74
413
94
415
17
416
39
417
59
418
82
420
04
Entrepreneurs Consumers
%

Directions of the evolution of Poland’s financial system
26 Narodowy Bank Polski
loans showed a permanent upward trend, even under the circumstances of a significant limitation of
lending in foreign currency, to stabilise at a level of 71% as of May 2013 (December 2014 ‒ 71.1%).
Figure XI. Share of housing loans in lending to consumers in Poland, 1996-2014
Note: The category of "consumers" comprises credits and loans granted to private individuals.
Source: NBP.
While analysing the foreign currency structure of debt arising from housing loans in 1996-2004, several
characteristic periods can be distinguished (Figure XII). The first period is the dominance of lending in
zlotys (December 1996 – April 2000). The following period is the high growth of foreign currency-
denominated loans (May 2000 – June 2003) and the sharp increase in their share in housing loans, from
11.4% (May 2000) to 68.4% (June 2003).11 Subsequent years demonstrated the stabilisation of foreign
currency-denominated loans at a high level, ranging from 57% to 71.8% (July 2003 – March 2009). As of
April 2009, a declining trend and a steady decrease in the share of foreign currency-denominated loans
was observed.12 The share of foreign currency and zloty loans levelled off in February 2014. In
December 2014, the outstanding foreign currency-denominated loans accounted for 46.3% of total
outstanding housing loans.
Figure XII. Foreign currency structure of outstanding housing loans, 1996–2014
Source: NBP.
Banking sector ‒ funding gap
The rapid development of lending and insufficient growth of the deposit base resulted in a gradual
decline in the surplus of liabilities (deposits) over receivables (loans). Consequently, in 2008 the funding
gap of the non-financial sector emerged, which meant that the value of receivables from the non-
0
10
20
30
40
50
60
70
80
12-1
99
6
04-1
99
7
08-1
99
7
12-1
99
7
04-1
99
8
08-1
99
8
12-1
99
8
04-1
99
9
08-1
99
9
12-1
99
9
04-2
00
0
08-2
00
0
12-2
00
0
04-2
00
1
08-2
00
1
12-2
00
1
04-2
00
2
08-2
00
2
12-2
00
2
04-2
00
3
08-2
003
12-2
00
3
04-2
00
4
08-2
00
4
12-2
00
4
04-2
00
5
08-2
00
5
12-2
00
5
04-2
00
6
08-2
00
6
12-2
00
6
04-2
00
7
08-2
00
7
12-2
00
7
04-2
00
8
08-2
00
8
12-2
00
8
04-2
00
9
08-2
00
9
12-2
00
9
04-2
01
0
08-2
01
0
12-2
01
0
04-2
011
08-2
01
1
12-2
01
1
04-2
01
2
08-2
01
2
12-2
01
2
04-2
01
3
08-2
01
3
12-2
01
3
04-2
01
4
08-2
01
4
12-2
01
4
Total Zloty Foreign currency
0
10
20
30
40
50
60
70
80
90
100
12-1
99
6
04-1
99
7
08-1
99
7
12-1
99
7
04-1
99
8
08-1
99
8
12-1
99
8
04-1
99
9
08-1
99
9
12-1
99
9
04-2
00
0
08-2
00
0
12-2
00
0
04-2
00
1
08-2
00
1
12-2
00
1
04-2
00
2
08-2
00
2
12-2
00
2
04-2
00
3
08-2
00
3
12-2
00
3
04-2
00
4
08-2
00
4
12-2
00
4
04-2
00
5
08-2
00
5
12-2
00
5
04-2
00
6
08-2
00
6
12-2
00
6
04-2
00
7
08-2
00
7
12-2
00
7
04-2
00
8
08-2
00
8
12-2
00
8
04-2
00
9
08-2
00
9
12-2
00
9
04-2
01
0
08-2
01
0
12-2
01
0
04-2
01
1
08-2
01
1
12-2
01
1
04-2
01
2
08-2
01
2
12-2
01
2
04-2
01
3
08-2
01
3
12-2
01
3
04-2
01
4
08-2
01
4
12-2
01
4
Zloty Foreign currency
%

Directions of the evolution of Poland’s financial system
27 Financial System in Poland 2014
financial sector exceeded the value of liabilities towards this sector. Following its rapid growth, from
2009 until mid-2012 the funding gap stabilised at a level exceeding 10%. Subsequently, it started to
decrease gradually, which fostered the strengthening of banking sector stability (Figure XIII).
Figure XIII. Funding gap in the banking sector, 1996-2014
Note: The funding gap is defined as the difference between total receivables from the non-financial sector and the
general government sector, and total liabilities received from the non-financial sector and the general government
sector, expressed as a percentage of the value of such receivables.
Source: NBP.
The emergence of the funding gap in the Polish banking sector was not unique, since this phenomenon
also occurred in other countries of Central and Eastern Europe. Given the low savings rate characteristic
for those countries, the fast growth in demand for lending resulted in a deepening of the funding gap at
banks. A factor fostering its strengthening was the development of financial system institutions, in
particular, investment funds and insurance companies, or the capital market which, by competing for
savings of households, limited the growth opportunities of the deposit base at banks.13
Summary
The financial system is not excessively developed in relation to the real economy. It also comprises all
types of financial institutions and financial markets typical for well-developed market economies.
Results of the IMF studies on the synthetic measure of financial system development confirm this
conclusion. The financial development (FD) index of Poland at a level of 0.5 indicates an optimum value
and structure in terms of its positive effect on economic growth.
1 The analysis covers the years 1990–2014. Due to the limited availability and comparability of data, arising from
methodological changes and changes in statistical standards, it was not possible to include data for the whole period in
each case. 2 Data source for EU countries: ECB Statistical Data Warehouse. 3 In this category, we do not take monetary financial institutions into account, i.e. the central bank, banks and credit unions.
In compliance with the sectoral classification of the economy, it comprises the so-called other financial sector institutions.
In the report, the following institutions were taken into account: investment funds (including brokerage houses),
insurance companies and pension funds. At the end of 2014, the value of assets of non-bank financial institutions, i.e.
including credit unions, amounted to PLN 569.3 billion, which accounted for 27.1% of total financial system assets and
32.9% of GDP. 4 In the case of Poland, changes related to open pension funds resulting in the reduction of pension funds’ assets had a
significant impact on the structure of assets of other financial institutions. In 2013, prior to the reform of open pension
funds, the asset structure of other financial institutions was as follows: pension funds – 44.6%, investment funds
(including brokerage houses) – 30.4%, insurance companies – 25.0%. 5 See Financial system in Poland 2013, Warsaw 2014, NBP, pp. 107-108. 6 Two acts which changed the shape of the cooperative banking sector in Poland had a significant impact on the operating
and internal organisation of the cooperative banking sector. Act on the Restructuring of Cooperative Banks and Bank
-60
-50
-40
-30
-20
-10
0
10
20
30
12-1
99
6
04-1
99
7
08-1
99
7
12-1
99
7
04-1
99
8
08-1
99
8
12-1
99
8
04-1
99
9
08-1
99
9
12-1
99
9
04-2
00
0
08-2
00
0
12-2
00
0
04-2
00
1
08-2
00
1
12-2
00
1
04-2
00
2
08-2
00
2
12-2
00
2
04-2
00
3
08-2
00
3
12-2
00
3
04-2
00
4
08-2
00
4
12-2
00
4
04-2
00
5
08-2
00
5
12-2
00
5
04-2
00
6
08-2
00
6
12-2
00
6
04-2
00
7
08-2
00
7
12-2
00
7
04-2
00
8
08-2
00
8
12-2
00
8
04-2
00
9
08-2
00
9
12-2
00
9
04-2
01
0
08-2
01
0
12-2
01
0
04-2
01
1
08-2
01
1
12-2
01
1
04-2
01
2
08-2
01
2
12-2
01
2
04-2
01
3
08-2
01
3
12-2
013
04-2
01
4
08-2
01
4
12-2
014
Funding gap in %
%

Directions of the evolution of Poland’s financial system
28 Narodowy Bank Polski
Gospodarki Żywnościowej and on Amendments to Certain Acts (Journal of Laws of 1994, No 80 item 369). The provisions of
the Act introduced a three-tier organisational structure of the cooperative banking sector, comprising cooperative banks,
9 regional banks and the national bank, namely, BGŻ SA. The second act is the Act on the Operation of Cooperative Banks,
their Association and Associating Banks, (Journal of Laws of 2000, No 119 item 1252), whose provisions introduced the
possibility to create a two-tier organisational structure of the cooperative banking sector, consisting of cooperative banks
and affiliating banks. 7 P. Wyczański, K. Nowiński, Polski system bankowy – bieżąca sytuacja funkcjonowanie i perspektywy [Polish banking system –
current situation, functioning and perspectives], Warsaw 1991, Friedrich Ebert Foundation in Poland, p. 13. 8 Informacja o sytuacji banków spółdzielczych i zrzeszających w 2014 r. [Information on the situation of cooperative banks and
affiliating banks in 2014], Warsaw 2014, UKNF, p. 5. 9 Data as at 31 December 2013, http://www.eacb.coop/en/cooperative_banks/key_figures/last_key_figures.html170. 10 P. Wyczański, M. Gołajewska, Polski system bankowy 1990-1995 [Polish banking system 1990-1995], Warsaw 1996, Friedrich
Ebert Foundation, p. 165. 11 In analytical materials of GINB (General Inspectorate of Banking Supervision) from this period it is pointed out that the
popularity of foreign currency-denominated loans resulted from their relatively low interest rate as compared with loans
denominated in the Polish zloty and exchange rate relations. Activities which were undertaken in order to reduce the
expansion of such loans are indicated. In the material evaluating the financial situation of banks in 2003, it was stated,
inter alia, that the growth of foreign currency-denominated loans was halted "also due to (…) communicating multiple
supervision instructions to management boards of banks, indicating the necessity of particular control of borrowers'
exposure to currency risks". See Sytuacja finansowa banków w 2003 r. Synteza [Financial situation of banks in 2003.
Synthesis], Warsaw, May 2004, GINB, p. 12. The identification of risks associated with housing loans denominated in
foreign currency was also contained in NBP’s Financial Stability Reports. For example, in the 2005 Report hazards
associated with the risk of depreciation of the Polish zloty rate were presented, as well as failures of banks related to the
assessment of the impact of currency risk on the creditworthiness of clients, as identified by supervision inspections. See
Financial Stability Report 2005, Warsaw, June 2006, NBP, pp. 63-69. 12 The various measures undertaken by supervision institutions and NBP aimed at limiting lending in foreign currency
were of key importance, in connection with excessive risks generated by such loans. Among others, the issuing of
Recommendation S by the KNF (Polish Financial Supervision Authority), limiting the granting of foreign currency-
denominated loans, in March 2006 can be mentioned here. The successive issues of Recommendation S – S(II) – December
2008, and S(III) – January 2011, published by the KNF, contained more restrictive solutions. 13Financial system development in Poland 2008, Warsaw 2010, NBP, p. 89. 14 More in Box 1.2.

Directions of the evolution of Poland’s financial system
29 Financial System in Poland 2014
Box 1.2. Assessment of the level of financial system development in Poland based on the IMF
studies
Studies carried out by experts of the International Monetary Fund, related to the elaboration of a
synthetic measure of financial system development, provide an important input into the discussion
concerning the role of the financial system and its impact on the economy. The proposed Financial
Development Index (FD) consists of the following: development measures of Financial Institutions (FI)
and development measures of Financial Markets (FM). Each of these measures contains three
components for which sub-indices are calculated: Depth, Access and Efficiency.1 However, individual
sub-indices are created based on the set of selected sub-measures (Table 1).
Table 1. Construction of the Financial Development Index (FD)
Feature Financial institutions (FI) Financial markets (FM)
Depth 1. Private sector credit (% of GDP)
2. Pension fund assets (% of GDP)
3. Mutual fund assets (% of GDP)
4. Insurance premiums, life and non-life (% of GDP)
1. Stock market capitalisation to GDP
2. Stocks traded to GDP
3. International debt securities government (% of GDP)
4. Total debt securities of non-financial corporations (% of GDP)
5. Total debt securities of financial corporations (% of GDP)
Access 1, Branches (commercial banks) per 10,000 adults
2. ATMs per 10,000 adults
1.Percent of market capitalization outside of tope 10 largest companies
2. Total number of issuers of debt (domestic and external, non-financial corporations and financial institutions)
Efficiency 1. Net interest margin
2. Lending-deposits spread
3. Non-interest income in total income
4. Overhead costs to total assets
5. ROA
6. ROE
1. Stock market turnover ratio (stocks traded/capitalisation)
Source: R. Sahay, M. Cihak, P. N'Diaye, A. Barajas, D. A. Pena, R. Bi, Y. Gao, A. Kyobe, L. Nguyen, C. Saborowski,
K. Svirydzenka, S. R. Yousefi, Rethinking Financial Deepening: Stability and Growth in Emerging Markets, IMF Staff
Discussion Note SDN/15/08, May 2015, IMF, p. 34.
On the basis of the analysis conducted, the following conclusions were formulated:2
First of all, by applying a new broad measure of financial system development, it is stressed that the
majority of emerging market countries may gain benefits from the continued development of the
financial system.3 Financial system development is defined as the combination of depth (size and
liquidity of markets), access (the possibility to use financial services) and efficiency (institutions'
capacity to render low-cost financial services and gain sustainable revenue, and the level of activity in
capital markets).
Secondly, the impact of financial system development on economic growth is of a non-linear nature and
may be mapped in the inverted U-shape: it weakens at higher level of financial system development
(Figure I). In terms of impact on economic growth, the optimum level of financial development index

Directions of the evolution of Poland’s financial system
30 Narodowy Bank Polski
(FD) ranges from 0.4 to 0.7.4 The weakening effect arises from the growth of the financial system depth
and is not associated with an increased access or a higher efficiency. It means that countries which
gained the maximum benefits arising from the financial system depth, through increased access, may
achieve positive effects on growth.
Thirdly, the rate of financial system development matters. If it is too fast, the growth in the depth of
financial institutions may lead to economic and financial instability. In the case of poor regulations and
weak supervision, it encourages to take on a higher risk and apply a high financial leverage. This
indicates an important role of effective supervision and good regulations.
Fourth, no conflict exists between regulations aimed at protection of financial stability and regulations
supporting financial system development. Better regulations foster both financial stability and financial
system development.
Fifth, no “one-size-fits-all” solutions exist which would be suitable for each country while determining
the sequence of development of financial institutions and financial markets. However, it should be
stressed that as the economy grows, benefits gained from the development of financial institutions
decrease, while benefits arising from the development of markets increase. It means that in the case of
creating the financial system development policy, at the initial stage, more attention should be paid to
the development of institutions whereas alongside the growth of per capita income, more attention
should be paid to the development of markets.
The IMF study also allows for positioning of the Polish financial system. In 2013, the financial
development index for Poland amounted to 0.5. It means that the financial system in Poland provides
optimum support of economic development (Figure I).
Figure I. Financial development effect on growth
Source: R. Sahay, M. Cihak, P. N'Diaye, A. Barajas, D. A. Pena, R. Bi, Y. Gao, A. Kyobe, L. Nguyen, C. Saborowski, K.
Svirydzenka, S. R. Yousefi, Rethinking Financial Deepening: Stability and Growth in Emerging Markets, IMF Staff
Discussion Note SDN/15/08, May 2015, IMF.
The analysis of the Polish financial system structure, taking into consideration financial development
indices (FD), development of financial institutions (FI) and development of financial markets (FM) in
the years 1996-2013 shows that until 2000 the development level of financial markets was higher than
the development level of financial institutions, which was associated with the high growth rate of
-1%
0%
1%
2%
3%
4%
5%
6%
0,0 0,1 0,2 0,3 0,4 0,5 0,6 0,7 0,8 0,9 1,0
Effe
ct o
n g
row
th
Financial Development Index
Ecuador
MoroccoPoland
Ireland
U.S.A.
Japan

Directions of the evolution of Poland’s financial system
31 Financial System in Poland 2014
financial markets in that period. In 2001, the FI index exceeded the FM index and in subsequent years
financial institutions developed much faster than markets. The years 2012-2013 saw a decline in the
development of financial markets’ value. This may indicate that the stagnation trend in relation to
financial markets strengthened (Figure II).
Figure II. Financial development index (FD), indices of development of financial institutions (FI) and
development of financial markets (FM) in Poland, 1991-2013
Source: NBP study based on R. Sahay, M. Cihak, P. N'Diaye, A. Barajas, D. A. Pena, R. Bi, Y. Gao, A. Kyobe,
L. Nguyen, C. Saborowski, K. Svirydzenka, S. R. Yousefi, Rethinking Financial Deepening: Stability and Growth in
Emerging Markets, IMF Staff Discussion Note SDN/15/08, May 2015, IMF.
The level of financial system development in Poland is explicitly lower than in highly developed
countries (Figure III).
Figure III. Financial development index (FD) in Poland, Germany, United Kingdom and United States,
1991-2013
Source: NBP study based on R. Sahay, M. Cihak, P. N'Diaye, A. Barajas, D. A. Pena, R. Bi, Y. Gao, A. Kyobe,
L. Nguyen, C. Saborowski, K. Svirydzenka, S. R. Yousefi, Rethinking Financial Deepening: Stability and Growth in
Emerging Markets, IMF Staff Discussion Note SDN/15/08, May 2015, IMF.
The role of financial institutions and financial markets is changing depending on the level of financial
system development. The lower the level of financial system development, the higher the role of
financial institutions and the more marginal the role of financial markets (Figure IV).
0
0,1
0,2
0,3
0,4
0,5
0,6
0,7
1991 1992 1993 1994 1995 1996 1997 1998 1999 2000 2001 2002 2003 2004 2005 2006 2007 2008 2009 2010 2011 2012 2013
FD FI FM
0
0,1
0,2
0,3
0,4
0,5
0,6
0,7
0,8
0,9
1
1991 1992 1993 1994 1995 1996 1997 1998 1999 2000 2001 2002 2003 2004 2005 2006 2007 2008 2009 2010 2011 2012 2013
Poland Germany United Kingdom United States

Directions of the evolution of Poland’s financial system
32 Narodowy Bank Polski
Figure IV. Financial development index (FD) and index of development of financial institutions (FI) in
the financial development index (FD) in EU countries in 2013
Source: NBP study based on R. Sahay, M. Cihak, P. N'Diaye, A. Barajas, D. A. Pena, R. Bi, Y. Gao, A. Kyobe,
L. Nguyen, C. Saborowski, K. Svirydzenka, S. R. Yousefi, Rethinking Financial Deepening: Stability and Growth in
Emerging Markets, IMF Staff Discussion Note SDN/15/08, May 2015, IMF.
1 R. Sahay, M. Cihak, P. N'Diaye, A. Barajas, D. A. Pena, R. Bi, Y. Gao, A. Kyobe, L. Nguyen, C. Saborowski,
K. Svirydzenka, S. R. Yousefi, Rethinking Financial Deepening: Stability and Growth in Emerging Markets, IMF Staff
Discussion Note SDN/15/08, May 2015, IMF. 2 Ibidem, p. 5. 3 The use of the financial development index (FD), including the multi-dimensional nature of the financial system, to study
the relationship between economic growth and financial system development, helped to gain results of a universal nature
applicable to countries at various development levels. 4 A broad confidence band around the turning point means that no single, optimum financial development index (FD),
universal for all countries, can be determined after exceeding of which the positive impact of the financial system on
economic growth becomes weaker. It depends on the characteristics of a given country, including the level of income,
institutions, the quality of regulations and supervision.
0
10
20
30
40
50
60
70
80
90
100
0
0,1
0,2
0,3
0,4
0,5
0,6
0,7
0,8
0,9
1
Ita
ly
Sp
ain
Un
ite
d K
ingd
om
Ge
rma
ny
Sw
ed
en
Fra
nce
Au
str
ia
Ne
the
rla
nd
s
Fin
land
De
nm
ark
Luxem
bou
rg
Be
lgiu
m
Po
rtu
ga
l
Ire
lan
d
Cypru
s
Gre
ece
Hu
ng
ary
Po
lan
d
Ma
lta
Slo
ve
nia
Czech R
epu
blic
Bu
lga
ria
Slo
va
kia
Cro
atia
Ro
man
ia
Esto
nia
Lith
ua
nia
Latv
ia
FD - left-hand scale FI share in FD - right-hand scale
%

Households and enterprises in the financial market in Poland
33 Financial System in Poland 2014
2. Households and enterprises in the financial
market in Poland
The financial system facilitates the flow of capital between entities having surplus and entities in
need of funds. The circulation of funds in the financial system takes places via banks or the
financial market, where businesses issue securities (shares or bonds). Investors, including
households, may acquire securities either directly in the financial market or via financial
institutions (i.e. investment funds).
2.1. Financial assets of households
The choice of the form of saving made by households is determined by both microeconomic (e.g.
their financial standing) and macroeconomic factors (the economic situation of the country).
Depending on the impact of individual determinants, households decide about the amount of
savings and choose specific savings and investment products. The level of savings of domestic
households and the form of saving are important for economic growth and financial system
development.
The CBOS survey on debts and savings shows that 40% of the survey respondents said they kept
savings in 2014.6 The number of persons convinced that it was worth saving for the future rose to
75% in 2014 compared with 61% in 2013. The percentage of persons declaring that they save on a
regular basis also increased from 10% in 2013 to 12% in 2014 and of persons making savings
occasionally – from 34% to 37%.7 According to GUS data, the financial condition of households
improved in 2014. The average monthly available income per capita in the household grew by
3.2% (to PLN 1,340).8 Despite the expenditure growth, the surplus of available income over
6 CBOS, Survey communique, Polacy o swoich długach i oszczędnościach [Poles on their debts and savings], Warsaw,
April 2014, p. 2. 7 According to the results of the survey Postawy Polaków wobec oszczędzania [The Poles’ Attitudes’ towards Saving],
a report by the Kronenberg Foundation at Citi Handlowy, PBS, October 2014, pp. 37, 38. 8 Household’s available income is understood as a sum of household’s current incomes from various sources
reduced by prepayments on personal income tax made of behalf of a tax payer by tax-remitter, by tax on income
from property, taxes paid by self-employed persons, including those in free professions and individual farmers
and by social security contributions and health insurance premiums. Available income is allocated to
expenditures, and savings’ increase. See: Methodological notes on household budget surveying, Warsaw, 2011, GUS,
p. 32.
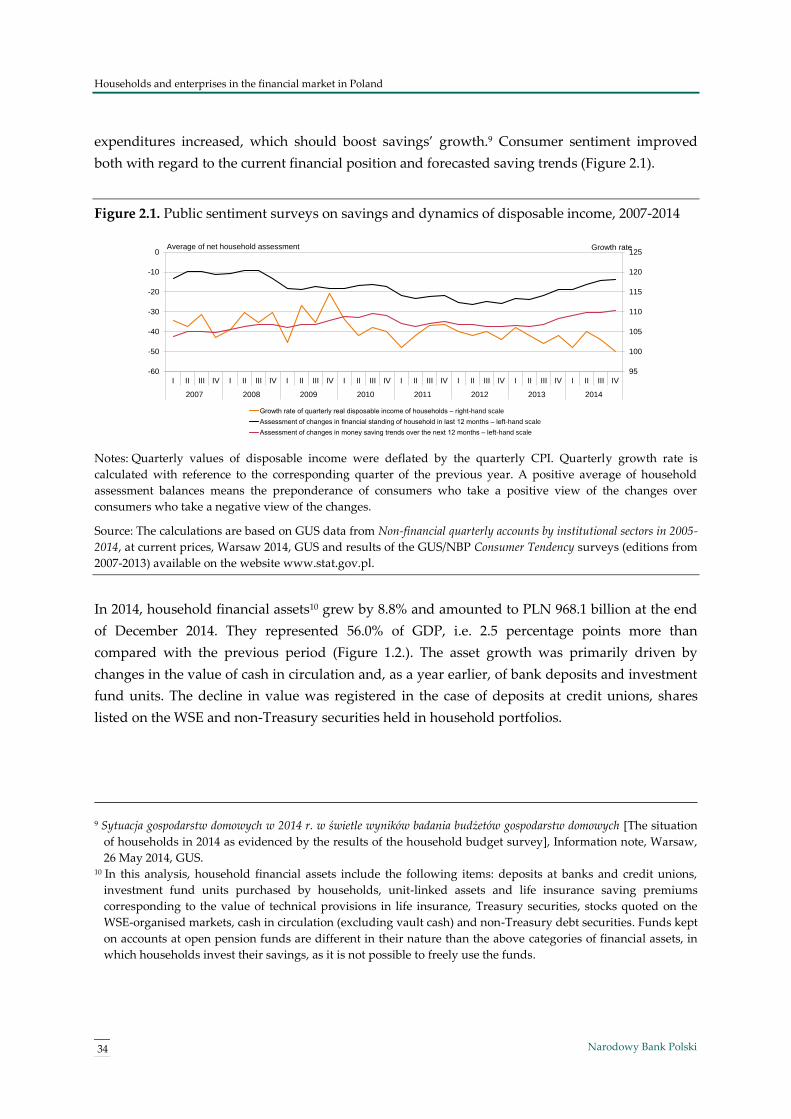
Households and enterprises in the financial market in Poland
34 Narodowy Bank Polski
expenditures increased, which should boost savings’ growth.9 Consumer sentiment improved
both with regard to the current financial position and forecasted saving trends (Figure 2.1).
Figure 2.1. Public sentiment surveys on savings and dynamics of disposable income, 2007-2014
Notes: Quarterly values of disposable income were deflated by the quarterly CPI. Quarterly growth rate is
calculated with reference to the corresponding quarter of the previous year. A positive average of household
assessment balances means the preponderance of consumers who take a positive view of the changes over
consumers who take a negative view of the changes.
Source: The calculations are based on GUS data from Non-financial quarterly accounts by institutional sectors in 2005-
2014, at current prices, Warsaw 2014, GUS and results of the GUS/NBP Consumer Tendency surveys (editions from
2007-2013) available on the website www.stat.gov.pl.
In 2014, household financial assets10 grew by 8.8% and amounted to PLN 968.1 billion at the end
of December 2014. They represented 56.0% of GDP, i.e. 2.5 percentage points more than
compared with the previous period (Figure 1.2.). The asset growth was primarily driven by
changes in the value of cash in circulation and, as a year earlier, of bank deposits and investment
fund units. The decline in value was registered in the case of deposits at credit unions, shares
listed on the WSE and non-Treasury securities held in household portfolios.
9 Sytuacja gospodarstw domowych w 2014 r. w świetle wyników badania budżetów gospodarstw domowych [The situation
of households in 2014 as evidenced by the results of the household budget survey], Information note, Warsaw,
26 May 2014, GUS. 10 In this analysis, household financial assets include the following items: deposits at banks and credit unions,
investment fund units purchased by households, unit-linked assets and life insurance saving premiums
corresponding to the value of technical provisions in life insurance, Treasury securities, stocks quoted on the
WSE-organised markets, cash in circulation (excluding vault cash) and non-Treasury debt securities. Funds kept
on accounts at open pension funds are different in their nature than the above categories of financial assets, in
which households invest their savings, as it is not possible to freely use the funds.
-60
-50
-40
-30
-20
-10
0
I II III IV I II III IV I II III IV I II III IV I II III IV I II III IV I II III IV I II III IV
2007 2008 2009 2010 2011 2012 2013 2014
95
100
105
110
115
120
125
Growth rate of quarterly real disposable income of households ‒ right-hand scale
Assessment of changes in financial standing of household in last 12 months ‒ left-hand scale
Assessment of changes in money saving trends over the next 12 months ‒ left-hand scale
Average of net household assessment Growth rate

Households and enterprises in the financial market in Poland
35 Financial System in Poland 2014
Figure 2.2. Households’ financial assets, 2007-2014
Note: Due to adjustments, data for 2011-2013 may differ from data presented in the report’s previous editions.
Sources: Based on GUS, UKNF, Analizy Online and NBP data.
The structure of household financial assets is derived from the declared goals of saving (in
Poland, these are primarily current consumption needs and unexpected events11). The methods of
financial surplus management most preferred by households in Poland are those that enable
them to use funds instantly or withdraw them easily, and are at the same time regarded as the
safest funds.12 Poles mostly deposit their savings at banks as 24% say their funds are kept at
current accounts, 13% ‒ at savings accounts, 10% ‒ at term deposit accounts and 9% of savers say
their cash is kept at home.13
Statistical data on financial assets confirm the preferences expressed by households in the
surveys (Figure 2.3). At the end of 2014, deposits at banks and credit unions, and cash accounted
for a total of 75.5% of household financial assets (Table 2.1). The value of cash accumulated by
households totalled PLN 125.9 billion. In 2014, the value of bank deposits placed by households
increased by 10.4%, i.e. 4 percentage points more than in 2013. A substantial rise in the cash in
circulation growth rate (14.7%) was also observed.
11 According to the results of the survey Postawy Polaków wobec oszczędzania, op. cit., p. 34. 12 The CBOS surveys show that just 7% of the survey respondents would choose financial investments with a high
rate of return and also carrying a potentially high loss. See: Płeć a podejmowanie decyzji inwestycyjnych, the survey
report, Warsaw, May 2014, CBOS, p. 7. 13 Data based on the survey Postawy Polaków wobec oszczędzania, op. cit., p. 52.
598.9 599.8
675.872.5
761.40.0
815.50.0
889.60.0
968.10.0
5.1
4.7
5.05.1
4.9
5.1
5.4
5.6
40
42
44
46
48
50
52
54
56
58
60
0
100
200
300
400
500
600
700
800
900
1000
2007 2008 2009 2010 2011 2012 2013 2014
Financial assets of households ‒ left-hand scale Ratio of financial assets of households to GDP ‒ right-hand scale
PLN billion %

Households and enterprises in the financial market in Poland
36 Narodowy Bank Polski
Figure 2.3. Structure of household financial assets, 2007-2014, as at period-ends
Notes: Units of unit-linked funds include life insurance saving premiums.
Source: NBP estimates based on UKNF, Analizy Online and NBP data.
Table 2.1. Value of household financial assets and their structure, 2011–2014, as at period-ends
2011 2012 2013 2014
Value of household financial assets (PLN billion)
Bank deposits 467.8 504.2 536.5 592.4
Deposits at credit unions 14.7 15.7 17.6 12.7
Units of investment funds 62.4 72.5 90.4 103.2
Units of unit-linked funds and life insurance saving premiums 69.9 77.8 80.1 82.7
Treasury securities 8.8 8.5 9.3 9.3
Non-Treasury securities 2.2 1.8 1.3 1.3
Shares listed on the WSE 38.7 37.2 44.6 40.5
Cash in circulation (excluding bank vault cash) 96.9 97.7 109.8 125.9
Total 761.4 815.5 889.6 968.1
Structure of household financial assets (%)
Bank deposits 61.4 61.8 60.3 61.2
Deposits at credit unions 1.9 1.9 2.0 1.3
Units of investment funds 8.2 8.9 10.2 10.7
Units of unit-linked funds and life insurance saving premiums 9.2 9.5 9.0 8.5
Treasury securities 1.2 1.0 1.0 1.0
Non-Treasury securities 0.3 0.2 0.1 0.1
Shares listed on the WSE 5.1 4.6 5.0 4.2
Cash in circulation (excluding bank vault cash) 12.7 12.0 12.3 13.0
Note: Due to adjustments, data for 2013 may differ from the data presented in the report’s previous edition.
Sources: The study based on UKNF, Analizy Online and NBP data.
2007 2008 2009 2010 2011 2012 2013 2014
0
100
200
300
400
500
600
700
800
900
1,000
Bank deposits Deposits at credit unions
Units of investment funds Units of unit-linked funds
Treasury securities Shares listed on the WSE
Non-Treasury securities Cash in circulation (without bank vault cash)
PLN billion

Households and enterprises in the financial market in Poland
37 Financial System in Poland 2014
The value of units of investment funds14 in the household portfolio rose by 14.2%. The change in
value of this part of the household deposit portfolio resulted primarily from net capital inflow to
these financial institutions. Households that sought alternative forms of saving to term deposits,
choose primarily investment funds with a low risk profile, purchasing mostly units of funds
investing in debt securities, and cash and money funds.15 Unlike in 2013, households withdrew
money from equity funds after they had reported poor results related to the downturn in the
WSE.16 The highest inflow of funds to investment funds was reported in the fourth quarter of
2014, when it amounted to net PLN 3.2 billion (Figure 2.4.).
Figure 2.4. Net inflow of funds from households to investment funds and the change in value of
household bank deposits in PLN, 2013-2014
Note: Households also include non-commercial institutions offering services to households.
Source: Calculations based on NBP data.
The year 2014 saw a slight increase in the value of unit-linked funds and life insurance saving
premiums in the household portfolio. The growth of this household financial asset category
resulted from profits from deposits of unit-linked funds as well as an inflow of funds to unit-
linked funds, which was driven by lower interest rates and low profits from alternative financial
products. At the same time, the sale of short-term life insurance products (the so-called
polisolokata, the quasi-deposit product) in the period under analysis was limited, which was
related to Recommendation U issued by KNF.17
14 Excluding the units purchased by insurance companies as a result of life insurance contracts concluded by
natural persons with unit-linked funds. 15 Annual Report for 2014 by Chamber of Fund and Asset Management, Warsaw, February 2015, IZFA, p. 18. 16 Unlike Polish stock funds, foreign stock funds turned out to be more competitive as they were promoted by a
boom in local stocks markets. Their share in the whole segment of stock funds rose from 18% in 2013 to over
25% in 2014. See Annual Report for 2014 by Chamber of Fund and Asset Management, op. cit., pp. 18-19. 17 More information on Recommendation U of KNF can be found in Chapter 2.
0.30.5
0.1
0.3
1.12 2.4
3.2
16.4
0.9 1.3
13.714.7
5.3
8.1
27.8
0
5
10
15
20
25
30
I II III IV I II III IV
2013 2014
Inflow of funds to investment funds Change in the value of household deposits (banking sector)
mld złPLN billion

Households and enterprises in the financial market in Poland
38 Narodowy Bank Polski
The value of shares in the investment portfolio of Poles decreased by 9.2% (to PLN 40.5 billion) in
the period analysed. The change in the portfolio’s value was primarily associated with the falling
prices of equity instruments on the WSE-organised markets.
The value of Treasury bonds in the portfolio of households remained unchanged and amounted
to PLN 9.3 billion at the end of 2014.
2.2. External sources of financing of Polish enterprises
The economic condition of non-financial enterprises, despite an observed drop in the return on
revenue indicator, remained good in 2014. Their growth of revenues was higher (by 2.1%) than in
2013 and profit on sales of products, goods and materials improved (by 6.2%). The financial
liquidity indicators of non-financial enterprises were still high.18
In the period analysed, enterprises substantially increased (by 16.8% to PLN 120 billion)
expenditures on tangible fixed assets, and compared with 2013, this resulted, to a larger extent,
from the development of their production potential than modernisation investments.19 The
expenditures remained, to a large extent, financed with own funds, which is evidence of the fact
that enterprises prefer to use a conservative funding strategy.20 As NBP surveys of Polish non-
financial enterprises show, in the past two years 40% of the survey-responding entities
consciously did not use bank credit and chose to finance their activity with own funds.21 The
results of another survey conducted among small and medium-sized enterprises (SMEs) in
2014 indicate that major factors behind their reluctance to use loans and advances are the
following: lack of borrowing needs, sufficient own funds, and also fear of default risk and the
company owner’s funding strategy.22
According to data received by NBP from banks, the value of loans granted to enterprises at the
end of 2014 was by 6.9% higher than a year earlier. The growth in interest in this funding form
was driven by low market interest rates as well the lending policy of banks which ‒ due to the
18 Financial results of non-financial enterprises 2014, GUS, Warsaw 2015. 19 Sytuacja finansowa sektora przedsiębiorstw w IV kw. 2014 r. [Financial situation in the enterprise sector in 2014 Q4],
NBP, Warsaw 2015, p. 25. 20 More on the subject in: A. Sawicka, I. D. Tymoczko, Dlaczego polskie przedsiębiorstwa nie korzystają z kredytu?
Zjawisko zniechęconego kredyto(nie)biorcy, Materiały i Studia No 310, NBP, Warsaw 2015. 21 Ibidem, p. 29. Data from the NBP annual survey of enterprises conducted on a group of around 1,200 non-
financial entities and data from F-01/I01 and F-02 financial reports collected by GUS from around 15 thousand
enterprises were used. 22 M. Starczewska-Krzysztoszek, Finansowanie działalności i rozwoju. Curriculum vitae mikro, małych i średnich
przedsiębiorstw 2014, Warsaw 2014. The survey by the CBOS Public Opinion Research Center was commissioned
by Konfederacja Lewiatan. It was conducted with a direct interview method from 6 May to 18 July 2014 on a
sample of 1,111 enterprises with employment from 2 to 249.

Households and enterprises in the financial market in Poland
39 Financial System in Poland 2014
improved growth outlook for Poland and a better financial condition of borrowers – eased their
standards and terms of granting loans, in particular long-term loans, from the second quarter of
the year. Loans were mostly used by enterprises from industry, trade and construction.
Leasing was the main non-banking external source of financing for domestic non-financial
enterprises, especially in the SME sector (Figure 2.5). The year 2014 saw a further dynamic
growth in turnover in Poland’s leasing market and an increase in the number of enterprises that
entered into leasing contracts to around 152.1 thousand. The segment of road transport modes
was responsible for an over 75% growth in value of assets leased.
Figure 2.5. Selected non-banking external sources of financing of Polish enterprises, 2011-2014
Notes: Data on leasing do not include loans granted by leasing companies and therefore may differ from data
released in previous editions of the report.
Sources: Calculations based on data provided by Fitch Polska, GUS, KDPW, GPW, EVCA and NBP.
The value of capital raised by enterprises on the domestic long-term bond market was again
substantially higher than in 2013. Investors’ great interest in these instruments helped organise
new issues as, in an environment of low market interest rates, they were seeking higher rates of
return than on investments in Treasury bonds. The growth in popularity of this form of external
financing is evidenced by a further development of the debt instruments trading platform
Catalyst.
The value of new share issues by non-financial enterprises admitted to trading in the WSE-
organised markets (WSE Main Market and NewConnect) amounted to PLN 2.0 billion in 2014.
Initial offers on the WSE-organised markets were conducted by a total of 50 domestic enterprises,
of which 22 floated their shares on NewConnect. The fall in the value of shares sold under IPOs
and SPOs was the consequence not only of a smaller scale of issues prepared by enterprises but
also of investors’ lower interest in the instruments. Periodic significant increases of price
volatility of quoted instruments were not conducive to share issue placements. The period of
price volatility was driven by structural factors, among others, low liquidity of NewConnect, and
business factors, e.g. Ukraine-Russia conflict-related developments.
8.2
5.6 6.1
2.0
13.2 12.9
15.8
21.0
2.61.6 1.6 1.0
2.72.5
2.9
31.1
0
5
10
15
20
25
30
35
2011 2012 2013 2014
Stock issues on the WSE Long-term bond issues on the domestic market Private equity Leasing
PLN billion

Households and enterprises in the financial market in Poland
40 Narodowy Bank Polski
Polish enterprises also used financing from private equity funds to finance their development. In
2014, the funds invested just over PLN 1 billion in Poland; however if one takes a look at the ratio
of capital raised by enterprises in that way to the value of capital raised via new share issues on
the WSE-organised markets (WSE Main Market and NewConnect), then in 2011-2014 the ratio
was always above 25%. This shows that despite the small size of the market, capital from private
equity funds is an important source of financing own funds of Polish enterprises.
Polish enterprises were more willing to raise funds in foreign bond markets than in previous
years. The increased interest in organising issues of debt securities denominated in the euro was
primarily related to lower market interest rates in the euro area than in Poland. In 2014, such
instruments were issued, via specific purpose vehicles registered outside Poland, by several
domestic entities.

Households and enterprises in the financial market in Poland
41 Financial System in Poland 2014
Box 2.1. External financing of enterprises in Poland and other European Union countries
Financing of enterprises is the subject of the Pan-European study carried out by the European
Commission and the European Central Bank.1 The survey of entrepreneurs' opinion, mainly small and
medium-sized enterprises (SMEs), was performed in mid-2014, covering 16,875 enterprises from 28 EU
member states, including 1,305 companies from Poland. The method applied in the study allows a
comparison of preferences and financing methods of enterprises in Poland and in other EU countries.
External methods of financing companies' activity preferred by entrepreneurs
Asked about the activity financing methods most suitable for their companies, among the many
external financing opportunities, Polish entrepreneurs indicated leasing (54% of responses), overdraft
and credit lines and/or credit card (53%), followed by bank loans (50%). In terms of their preferences,
they slightly differ from entrepreneurs in other EU countries, where bank lending was recognised as
the most suitable activity financing method (57% of responses), followed by overdraft and credit lines
and/or credit card (53%). The next indication was leasing (47%) (Figure I). In Poland, entrepreneurs
recognise trade credit as the activity financing source most suitable for them much more frequently
than the EU average (44% against 33% in the EU). This method is much more preferred in Ireland,
Greece, Portugal and the United Kingdom, where over 50% of surveyed companies would like to
finance their activity in such a way. In other countries it is not common, e.g. in Germany only 11% of
companies are willing to fund their activity by trade credit, and in practice 3% of companies use them.
The next possibility to acquire funds are grants and subsidised bank loans perceived as the optimum
source of financing by many entrepreneurs, not only in Poland (36%), but also in Greece, Italy and
Portugal, where over 50% of enterprises express such an opinion. It is several times more than in
Denmark (12%), the Netherlands (11%) or in Sweden (15%). Less well-known financing sources, such as
the issue of equity or debt securities, are less frequently indicated as the potential optimum source of
funding in Poland, as compared with the EU.
Figure I. Relevance of financing types for SMEs
Source: Developed according to the data derived from the Survey on the access to finance of enterprises (SAFE).
Analytical Report 2014, Brussels 2014, European Commission.
Asked to indicate the financial instrument most suitable for their company, Polish entrepreneurs are
less confident in their assessment than European entrepreneurs. Several times more entrepreneurs in
Poland than in other EU countries (from 5 to 8-fold, depending on the instrument) are unable to
evaluate whether a given financing instrument is suitable in their case. The assessment of the role of
debt securities and equity capital raises major difficulties.
0 10 20 30 40 50 60
Leasing
Bank overdraft or credit line
Bank loan
Trade credit
Grants or subsidised bank loan
Other loan
Factoring
Equity
Other sources
Debt securities
European Union Poland
%

Households and enterprises in the financial market in Poland
42 Narodowy Bank Polski
External financing sources used by entrepreneurs
Entrepreneurs’ preferences related to the optimum activity financing method are verified in practice.
The external financing instrument most commonly used by enterprises in Poland was the overdraft
and/or credit lines, instead of leasing, as indicated by the declared preferences. Almost 40% of
enterprises surveyed in Poland used the overdraft and credit lines over 6 months prior to the date of the
survey. The most common non-bank financing source was leasing, which was used by 32.7% of
enterprises.2 Use of overdraft and leasing in Poland was more popular than the average in the EU. In
addition, as compared with the overall number of enterprises surveyed in the European Union, Polish
entrepreneurs reach for trade credit more often, using bank loans less frequently (Figure II). 11% of
enterprises in Poland used bank loans, against 13% in the EU. Both in Poland and in other EU countries,
the number of companies actually using this instrument is almost 5-fold lower than the number of
enterprises declaring this financial instrument as appropriate for their business. However, it turns out
that the rejection rate of loan applications was, for example, in Greece, Ireland, Slovenia and Italy over
two-fold higher than in Poland, where only 11% of enterprises applying for a loan were refused credit
by the bank. 80% of applying enterprises received a loan at the level requested or lower. The remaining
9% of companies withdrew their loan applications.3
Figure II. Most commonly used external financing sources of Polish and European enterprises in 2014
Source: Developed according to the data derived from the Survey on the access to finance of enterprises (SAFE).
Analytical Report 2014, Brussels 2014, European Commission.
Grants and subsidised loans were used for enterprise funding at a similar level in Poland and in the EU
(9.1% and 9.4% of surveyed companies, respectively). In Poland, four times more companies perceived
subsidies as a source of optimal financing than the number that used this type of funding. In Poland,
equity market instruments were used less frequently than in the EU ‒ such as acquisition of financial
resources from the issue of shares or taking up new shares. This method was used only by one per 100
surveyed enterprises and only two companies per 1,000 used the issue of debt securities to acquire
funds.
The difficulties associated with fund raising were by Polish entrepreneurs ranked only as the sixth
barrier to their enterprises' development in 2014, in terms of significance (in the EU ‒ the fifth).4 In
Poland, every tenth company surveyed admitted that access to financing was its most important
problem, whereas in other EU countries this opinion was shared by 13% of companies. Both in Poland
and in other EU countries, enterprises mainly use the services of banks offering various financing
instruments. The indicator for Poland was equal to the EU average amounting to 68%. The highest
indicator of bank offer use (over 75% of responses) was recorded, inter alia, in France, Portugal,
0 5 10 15 20 25 30 35 40 45
Bank overdraft or credit line
Leasing
Trade credit
Bank loan
Grants or subsidised bank loan
Factoring
Other loan
Other sources
Equity
Debt securities
European Union Poland
%

Households and enterprises in the financial market in Poland
43 Financial System in Poland 2014
Belgium, Ireland and Italy. The lowest level of bank offer use was noted for enterprises in Sweden
(32%), in the Baltic States and in Finland (45%).
1Survey on the access to finance of enterprises (SAFE). Analytical Report 2014, Brussels 2014, European Commission. 2 Leasing in the main non-banking external source of enterprise financing, particularly for SMEs. See subsection 1.3.2. 3 Survey on the access to finance of enterprises (SAFE), op.cit., p. 36. 4 Ibidem, p. 144. Polish SMEs most commonly recognised lending financial terms as a barrier to using bank loans: the level
of interest rate (58.1% of respondents), amount of fees (35.8%) and the requirement to hold collateral, including its
amount. More in: M. Starczewska-Krzysztoszek, Finansowanie działalności i rozwoju. Curriculum vitae mikro, małych i
średnich przedsiębiorstw 2014 [Financing of activity and development. Curriculum vitae of micro, small and medium-
sized enterprises 2014], Warsaw 2014, Konfederacja Lewiatan, p. 66.


www.nbp.pl


