ORIGINAL PAPER Forward selection in a maritime pine polycross progeny trial using pedigree reconstruction Marjorie Vidal 1,2,3 & Christophe Plomion 1,2 & Annie Raffin 1,2 & Luc Harvengt 3 & Laurent Bouffier 1,2 Received: 2 February 2016 /Accepted: 28 November 2016 /Published online: 21 February 2017 # INRA and Springer-Verlag France 2017 Abstract & Key message Molecular markers were used for paternity recovery in a maritime pine (Pinus pinaster Ait.) polycross trial, facilitating forward selection. Different breeding strategies for seed orchard establishment were evaluated by comparing genetic gains and diversity. This work opens up new perspectives in maritime pine breeding. & Context Polycross mating designs are widely used in forest tree breeding to evaluate parental breeding values for back- ward selection. Alternatively, polycross progeny trials may be used to select the best trees on the basis of individual breeding values and molecular pedigree analysis. & Aims This study aimed to test such a forward selection strategy for the maritime pine breeding program. & Methods In a maritime pine polycross trial, progeny with higher breeding values for growth and stem straightness was first preselected with or without relatedness constraints. After paternity recovery, the preselected trees were ranked on the basis of their breeding values, estimated from the recovered full pedigree. Finally, the best candidates were selected with three different strategies (forward, backward, mixed) and three levels of coancestry constraints to establish a virtual clonal seed orchard. & Results Complete pedigrees were successfully recovered for most of the preselected trees. There was no major difference in expected genetic gains between the two preselection strategies which differed for relatedness constraints. Genetic gains were slightly higher for forward selection than for classical back- ward selection. & Conclusion This seminal study opens up new perspectives for using forward selection within the French maritime pine breeding program. Keywords Breeding strategy . Polymix breeding . Paternity recovery . SNP markers . Pinus pinaster Ait 1 Introduction Progeny testing for parental ranking is widely used in forest tree breeding (Zobel and Talbert 1984). In the French mari- time pine (Pinus pinaster Ait.) breeding program, multisite Handling Editor: Ricardo Alia Contribution of the co-authors MV sampled plant material and extracted DNA. MV and LB analyzed the data. MV wrote the manuscript, helped by AR, CP, and LB. AR, LB, CP, and LH read and revised the manuscript. LB designed and coordinated the study. All authors read and approved the final manuscript. Electronic supplementary material The online version of this article (doi:10.1007/s13595-016-0596-8) contains supplementary material, which is available to authorized users. * Laurent Bouffier [email protected]Marjorie Vidal [email protected]Christophe Plomion [email protected]Annie Raffin [email protected]Luc Harvengt [email protected]1 INRA, BIOGECO, UMR 1202, 33610 Cestas, France 2 University Bordeaux, BIOGECO, UMR 1202, 33400 Talence, France 3 Biotechnology and Advanced Silviculture Department, Genetics & Biotechnology Team, FCBA, 33610, Cestas, France Annals of Forest Science (2017) 74: 21 DOI 10.1007/s13595-016-0596-8
Transcript
ORIGINAL PAPER
Forward selection in a maritime pine polycross progeny trialusing pedigree reconstruction
Received: 2 February 2016 /Accepted: 28 November 2016 /Published online: 21 February 2017# INRA and Springer-Verlag France 2017
Abstract& Key message Molecular markers were used for paternityrecovery in a maritime pine (Pinus pinaster Ait.) polycrosstrial, facilitating forward selection. Different breedingstrategies for seed orchard establishment were evaluatedby comparing genetic gains and diversity. This work opensup new perspectives in maritime pine breeding.
& Context Polycross mating designs are widely used in foresttree breeding to evaluate parental breeding values for back-ward selection. Alternatively, polycross progeny trials may beused to select the best trees on the basis of individual breedingvalues and molecular pedigree analysis.&Aims This study aimed to test such a forward selection strategyfor the maritime pine breeding program.& Methods In a maritime pine polycross trial, progeny withhigher breeding values for growth and stem straightness wasfirst preselected with or without relatedness constraints. Afterpaternity recovery, the preselected trees were ranked on thebasis of their breeding values, estimated from the recoveredfull pedigree. Finally, the best candidates were selected withthree different strategies (forward, backward, mixed) and threelevels of coancestry constraints to establish a virtual clonalseed orchard.& Results Complete pedigrees were successfully recovered formost of the preselected trees. There was nomajor difference inexpected genetic gains between the two preselection strategieswhich differed for relatedness constraints. Genetic gains wereslightly higher for forward selection than for classical back-ward selection.& Conclusion This seminal study opens up new perspectivesfor using forward selection within the French maritime pinebreeding program.
Progeny testing for parental ranking is widely used in foresttree breeding (Zobel and Talbert 1984). In the French mari-time pine (Pinus pinaster Ait.) breeding program, multisite
Handling Editor: Ricardo Alia
Contribution of the co-authors MV sampled plant material andextracted DNA.MVand LB analyzed the data. MVwrote the manuscript,helped by AR, CP, and LB. AR, LB, CP, and LH read and revised themanuscript. LB designed and coordinated the study. All authors read andapproved the final manuscript.
Electronic supplementary material The online version of this article(doi:10.1007/s13595-016-0596-8) contains supplementary material,which is available to authorized users.
polycross progeny trials have been established in the last20 years for assessing breeding values and ranking femaleparents for backward selection. The ranking of parents accord-ing to the performance of their progeny is particularly impor-tant for traits with a low heritability (Falconer and Mackay1996), such as many traits of interest in forest trees (Burdonand Kumar 2004; Cornelius 1994; Pâques 2013). In suchpolycross trials, the progeny phenotyped to evaluate parentalbreeding values is not used to generate the next generation inthe breeding population (which is actually selected fromthe progeny of biparental crosses) or included in produc-tion populations (commercial seed orchards). The lack ofinformation about the male parent greatly limits selectionof advanced generation. However, progress in moleculargenetics, such as the development of highly informative andcost-effective DNA markers, has made new approaches pos-sible in tree breeding. One such new approach, pedigree re-construction, makes it possible to reconstruct genealogicalrelationships between individuals, providing opportunitiesfor the development of new breeding strategies. For example,controlled crosses can be replaced by pedigree recovery inopen pollinated populations for the estimation of genetic pa-rameters and the prediction of breeding values in a strategyknown as “breeding without breeding” (El-Kassaby et al.2011; El-Kassaby and Lstiburek 2009; Lstiburek et al.2011). This approach can be used to initiate a tree improve-ment programwithout the need for the initial cycle of breedingand testing (Lstiburek et al. 2015). Another approach,“polymix breeding with parental analysis (PMX/WPA)” wasdeveloped by Lambeth et al. (2001) and combines controlledcrosses and pedigree recovery. These authors proposed the useof molecular markers to identify the parents of potential selec-tion candidates in polycross mating designs for the evaluationof breeding values and the selection of progeny for the nextgeneration in the breeding program. Three different scenariosare presented, depending on the progeny set genotyped: (i)partial population paternity analysis (pedigree analysis onlyfor the best progeny using female general combining abilityand individual performance as selection criteria); (ii) fullpopulation paternity analysis (pedigree analysis for allprogeny); and (iii) full population parental analysis (identitiesof both female andmale parents recovered bymolecular markeranalysis as the identities of the mothers are not recorded in thisscenario to decrease logistical costs). Lambeth et al. (2001)claimed that PMX/WPA was a “viable alternative to full-sibbreeding and testing system.” Their approach presents severaladvantages. Polymix crosses are more cost-efficient than full-sib crosses for a given number of parents. They lead to a largernumber of recombination events for fewer crosses, and breed-ing values are more reliably estimated than for other methods,because each individual is crossed with a larger number ofparents. If pollens used for the polymix crosses are from treeswith high breeding values, the genetic gain from forward
selection with PMX/WPA should be greater. Thus, it shouldbe possible to deploy this gain more rapidly than that obtainedwith classical backward selection. Moreover, mislabeled clonescan be eliminated in the genotyping phase, potentially increas-ing selection efficiency.
We investigated the feasibility of using a forward selectionstrategy in a maritime pine polycross trial associated with ananalysis of the parentage of the progeny. It should be noted thatthis polycross trial was not designed initially to perform for-ward selection but backward selection. Forward selection mayhave two goals: recruitment of the best genotypes for the nextgeneration of the breeding population and the formation of aproduction population, such as a clonal seed orchard (CSO).This study focuses on selection for the constitution of a CSO.
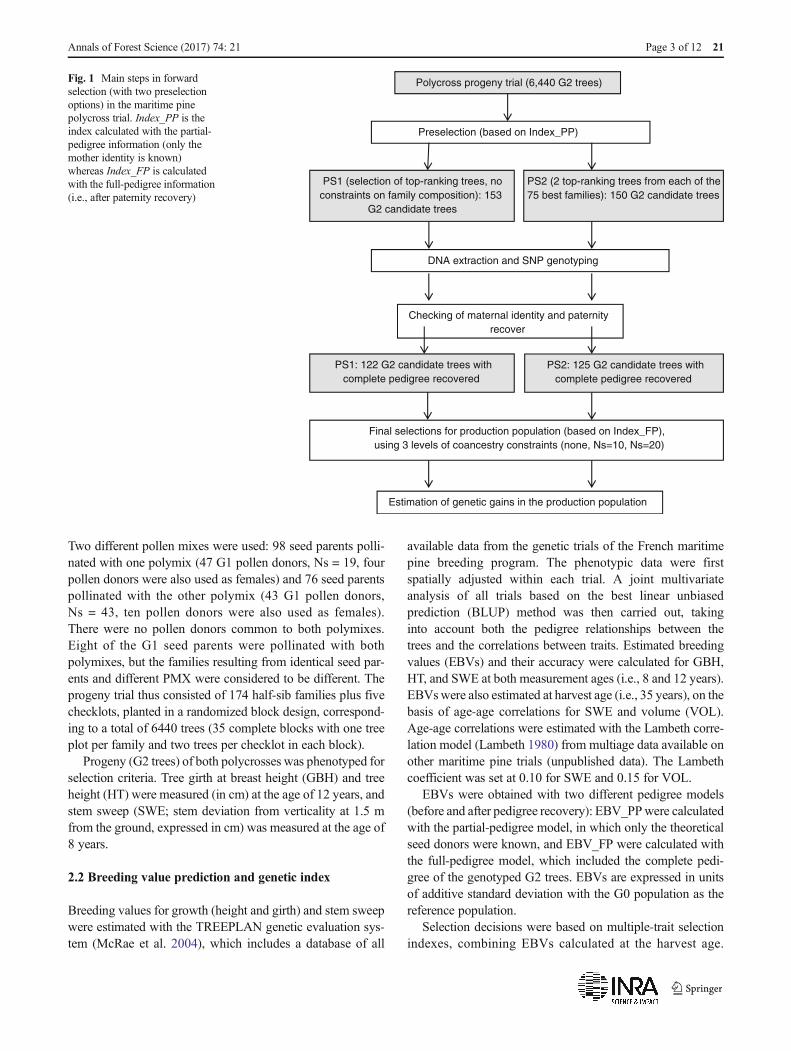
The successive stages of forward selection strategies studiedhere are presented in Fig. 1. Candidate trees were preselectedin a polycross trial, using two different preselection optionswithout (PS1) and with (PS2) constraints on relatedness. Thepreselected trees were then genotyped for single-nucleotidepolymorphism (SNP) markers. Once their complete pedigreeswere recovered, the best individuals were selected for the CSO,using three levels of coancestry constraints (none, status num-ber Ns = 10, Ns = 20). Forward selection strategies were thencompared, in terms of possible genetic gains, with backwardand mixed (i.e., a combination of both) selection strategies,using the same three levels of coancestry constraints. Finally,ways of optimizing the preselection and final selection optionsfor the establishment of a CSO were considered in the frame-work of the French maritime pine breeding program.
2 Materials and methods
2.1 Plant material and mating design
In this article, the successive maritime pine breeding popula-tions were named as follows:
– G0 trees, the “plus” trees mass selected from the Landesprovenance; they constitute the base population of theFrench maritime pine breeding program (Illy 1966)
– G1 trees, the selected progeny from G0 trees; they con-stitute the second generation of the breeding program
– G2 trees, the progeny from G1 progeny trials.
Six polycross progeny trials for the maritime pine breedingprogram were established from 1994 to 2002 in southwesternFrance for the prediction of second-generation (G1) parentalbreeding values. In total, 960 G1 trees were evaluated (as seeddonors) within these six polycross progeny trials, each ofwhich took place on three sites. This study focuses on oneof these trial sites, established in 1996 (at 44° 42′ 32″ N/0°46′ 8″ W) for the evaluation of 166 G1 trees as seed parents.
21 Page 2 of 12 Annals of Forest Science (2017) 74: 21
Two different pollen mixes were used: 98 seed parents polli-nated with one polymix (47 G1 pollen donors, Ns = 19, fourpollen donors were also used as females) and 76 seed parentspollinated with the other polymix (43 G1 pollen donors,Ns = 43, ten pollen donors were also used as females).There were no pollen donors common to both polymixes.Eight of the G1 seed parents were pollinated with bothpolymixes, but the families resulting from identical seed par-ents and different PMX were considered to be different. Theprogeny trial thus consisted of 174 half-sib families plus fivechecklots, planted in a randomized block design, correspond-ing to a total of 6440 trees (35 complete blocks with one treeplot per family and two trees per checklot in each block).
Progeny (G2 trees) of both polycrosses was phenotyped forselection criteria. Tree girth at breast height (GBH) and treeheight (HT) were measured (in cm) at the age of 12 years, andstem sweep (SWE; stem deviation from verticality at 1.5 mfrom the ground, expressed in cm) was measured at the age of8 years.
2.2 Breeding value prediction and genetic index
Breeding values for growth (height and girth) and stem sweepwere estimated with the TREEPLAN genetic evaluation sys-tem (McRae et al. 2004), which includes a database of all
available data from the genetic trials of the French maritimepine breeding program. The phenotypic data were firstspatially adjusted within each trial. A joint multivariateanalysis of all trials based on the best linear unbiasedprediction (BLUP) method was then carried out, takinginto account both the pedigree relationships between thetrees and the correlations between traits. Estimated breedingvalues (EBVs) and their accuracy were calculated for GBH,HT, and SWE at both measurement ages (i.e., 8 and 12 years).EBVswere also estimated at harvest age (i.e., 35 years), on thebasis of age-age correlations for SWE and volume (VOL).Age-age correlations were estimated with the Lambeth corre-lation model (Lambeth 1980) from multiage data available onother maritime pine trials (unpublished data). The Lambethcoefficient was set at 0.10 for SWE and 0.15 for VOL.
EBVs were obtained with two different pedigree models(before and after pedigree recovery): EBV_PPwere calculatedwith the partial-pedigree model, in which only the theoreticalseed donors were known, and EBV_FP were calculated withthe full-pedigree model, which included the complete pedi-gree of the genotyped G2 trees. EBVs are expressed in unitsof additive standard deviation with the G0 population as thereference population.
Selection decisions were based on multiple-trait selectionindexes, combining EBVs calculated at the harvest age.
PS1 (selection of top-ranking trees, no constraints on family composition): 153
G2 candidate trees
PS2 (2 top-ranking trees from each of the 75 best families): 150 G2 candidate trees
DNA extraction and SNP genotyping
Checking of maternal identity and paternity recover
PS1: 122 G2 candidate trees with complete pedigree recovered
PS2: 125 G2 candidate trees with complete pedigree recovered
Polycross progeny trial (6,440 G2 trees)
Preselection (based on Index_PP)
Estimation of genetic gains in the production population
Final selections for production population (based on Index_FP), using 3 levels of coancestry constraints (none, Ns=10, Ns=20)
Fig. 1 Main steps in forwardselection (with two preselectionoptions) in the maritime pinepolycross trial. Index_PP is theindex calculated with the partial-pedigree information (only themother identity is known)whereas Index_FP is calculatedwith the full-pedigree information(i.e., after paternity recovery)
Annals of Forest Science (2017) 74: 21 Page 3 of 12 21
Index_PP and Index_FP were successively considered de-pending on pedigree information used to calculate the EBVs.
Index PP ¼ EBV PP VOL−EBV PP SWE
where EBV_PP_VOL and EBV_PP_SWE are the EBVsestimated with the partial-pedigree model for volume andstem sweep at 35 years of age
Index FP ¼ EBV FP VOL−EBV FP SWE
where EBV_FP_VOL and EBV_FP_SWE are the EBVsestimated with the full-pedigree model for volume and stemsweep at 35 years of age.
2.3 Sampling in the polycross trial, with two differentpreselection strategies
The G2 trees of the progeny polycross trial were ranked ac-cording to Index_PP. As this index includes no evaluation ofmajor defects, G2 trees were also scored visually (binaryscore: 0 for trees with major defects, such as bad branching,forks, disease, or pest damage; 1 for trees without majordefects). Trees with a score of 0 were excluded from the pre-selection process described below.
Two different options were used in the polycross trial topreselect candidates with high growth and low sweep forpedigree recovery. The two options differed in terms ofthe contribution of the maternal family:
– In preselection 1 (PS1), no restriction was placed onrelatedness. PS1 involved the preselection of treeswith no major defects ranked among the 200 bestindividuals (based on Index_PP). In total, 153 G2 treeswere sampled.
– Preselection 2 (PS2) included a restriction on relatedness.PS2 involved preselection of the two top-ranking treeswith no major defects from each of the 75 best familiesin the progeny trial. The families and the trees within eachfamily were ranked according to Index_PP. Thus, 150 G2trees (2 individuals × 75 families) were sampled.
Overall, 57 preselected individuals were common in PS1and PS2 which means that 246 G2 trees were sampled in total.Young needles were collected from the preselected trees andtheir potential parents (seed donors and pollen donors of bothpolymixes) and stored at −80 °C for DNA extraction.
2.4 DNA extraction and fingerprinting
Frozen needle tissues were ground to a fine powder and usedfor DNA extraction with an Invisorb®DNA Plant HTS 96Kit(Stratec Molecular, Berlin, Germany), according to themanufacturer’s instructions. The DNA was quantified with
a NanoDrop microvolume spectrophotometer (ThermoFisher Scientific Inc., Waltham, CA, USA). The sampledindividuals were genotyped with SNP markers, in theSequenom MassARRAY iPLEX Gold assay (Sequenom,San Diego, CA, USA), performed at the genotyping andsequencing facility of Bordeaux, France (http://www.pgtb.u-bordeaux2.fr/). The 80 SNPs used here were originallydeveloped for paternity recovery in a maritime pine breedingpopulation (Vidal et al. 2015). These SNPs were selected froma 12-k Infinium SNP-array (Illumina, San Diego, USA) de-veloped by Chancerel et al. (2013), and each had a minorallele frequency greater than 0.45 and low levels of linkagedisequilibrium (rv
2 < 0.3).
2.5 Assignment of parentage for the preselected trees
Likelihood inference was carried out with Cervus 3.0(Kalinowski et al. 2007; Marshall et al. 1998), both to checkthe identity of the maternal parent and to recover the identityof the paternal parent for each of the preselected G2 trees.Cervus was run assuming a 0.1% genotyping error rate. Thefemale parent was confirmed if the LOD score (likelihoodratio estimated over all loci, Marshall et al. 1998) was positive,and only one mismatch allele was allowed for each progenyand its supposed female parent. For paternity recovery,90% of the pollen donors were considered to have beensampled (Vidal et al. 2015). The delta score (i.e., thedifference in LOD scores of the two most likely candidateparents) was used as a criterion for paternity assignment atthe 99% confidence level. The critical values of deltascores were based on simulations of 100,000 progeny. Onemismatch allele was allowed between a given progeny and itsmale parent.
2.6 Final selection for clonal seed orchard establishment
OPSEL 1.0 software (Mullin 2014) was used for the optimalselection of a production population (virtual CSO), maximizinggenetic gains while imposing various constraints on coancestrywithin the selected population. Constraints on coancestry werebased on the minimum status number Ns. The status number ofa population describes the effective number of individuals, i.e.,the corresponding number of unrelated and non-inbred indi-viduals (Lindgren et al. 1997). Three levels of coancestryconstraints were tested: either no restriction on Ns, Ns = 10,or Ns = 20.
The “optimum selection of seed orchard method” wasused, allowing unequal numbers of ramets per genotype inthe CSO.
The final selection strategies studied were as follows:
– Forward (FOR) selection based on preselection PS1 orPS2: The candidate genotypes were G2 trees for which a
21 Page 4 of 12 Annals of Forest Science (2017) 74: 21
complete pedigree had been recovered. Genetic evaluationwas carried out with Index_FP (i.e., with EBVs estimatedfrom the full pedigree model)
– Backward (BACK) selection: all the 166 G1 seed donorsevaluated in the polycross trial were candidates. Geneticevaluation was carried out with Index_PP (i.e., withEBVs estimated from the partial-pedigree model)
– -Mixed (MIX) forward-backward selection: G2 trees forwhich a complete pedigree had been recovered, and all166 seed donors were candidates. The genetic evaluationwas carried out with Index_FP for G1 and G2 individuals.
The target number of selected ramets constituting the CSOwas set at 600 (named “census size” in OPSEL). For logisticalreasons, the number of ramets per genotype was set at amaximum of 50 for G2 trees and a maximum of 200 forG1 trees (several ramets of G1 trees were available fromclonal archives, but this was not the case for G2 trees,with only one tree per genotype, limiting the number ofavailable scions for grafting).
2.7 Estimation of genetic gain for seed orchards
The expected genetic gain (ΔG) was calculated asΔG ¼ CVa∑n
i¼1EBVi pi , where CVa is the additive coeffi-cient of variation of the base population (G0 trees), EBViand pi are the estimated breeding value and the proportionof ramets in the CSO of genotype i, respectively, and n isthe number of different genotypes in the CSO.
CVa values for height, girth, and stem sweep were extractedfrom the article by Bouffier et al. (2008) and were calculated asCVa = σa/μ, where σa is the square root of the additive geneticvariance and μ is the mean value for the trait. Expectedgenetic gains are expressed as a percentage relative to G0trees (plus trees) performances.
3 Results
In this study, a breeding strategy was defined as a combinationof two selection steps (preselection and final selection) at agiven diversity level. Two preselection options (PS1, withno restriction of within-family selection, and PS2, withrestriction), three final selection strategies (FOR, BACK,and MIX selection), and three diversity levels (no con-straint on Ns, Ns = 10, and Ns = 20) were investigated.The resulting breeding strategies were named according tothe combination of these three features. For example, instrategy “FOR_PS1_Ns10,” forward selection was per-formed on the candidate trees from preselection optionPS1, with a minimum status number of 10 in the CSO.
3.1 Sampling and genotyping
Two different types of preselection were applied to candidategenotypes in the polycross trial studied: (i) PS1 provided 153G2 trees from 35 half-sib families (with a family size of 1 to21 individuals/family), and (ii) PS2 provided 150 G2 trees from75 half-sib families (2 individuals/family). Genotyping was suc-cessfully achieved for 146 (PS1) and 147 (PS2) G2 individ-uals (minimum = 45 SNPs, maximum = 63 SNPs, mean = 60.5SNPs), which were analyzed for paternity recovery (Table 1).The dataset (Vidal et al. 2016) is available in the Zenodorepository (http://dx.doi.org/10.5281/zenodo.165158).
3.2 Pedigree recovery on preselected trees
The identity of the maternal parent was not confirmed for oneof the 146 individuals in PS1 and five of the 147 individuals inPS2 analyzed for paternity recovery with Cervus software.These individuals were thus excluded from the paternity anal-ysis. The identity of the maternal parent was confirmed for122 individuals in PS1 and 125 individuals in PS2, and pater-nity was recovered with 99% confidence for these individuals(see Table 1). In total, 23 individuals in PS1 and 17 individualsin PS2, respectively, were clearly fathered by outside pollen(i.e., not from the two polymixes).
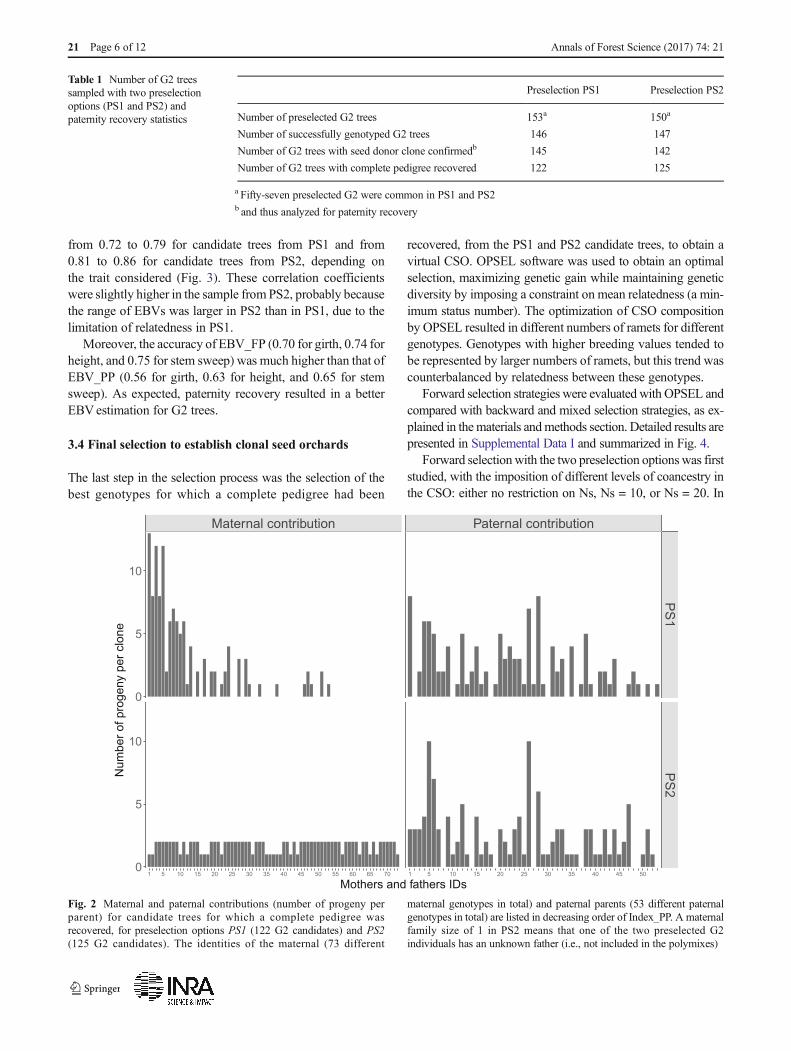
Only individuals for which a complete pedigree was recov-ered (i.e., the mother confirmed and the father identified) wereconsidered as candidate trees for final selection. All subse-quent analyses therefore focus on G2 trees with a completepedigree. Their pedigree information is summarized in Fig. 2.Overall, PS1 and PS2 G2 candidate trees came from 73 seeddonors and 53 pollen donors; 30 seed donors and 34 pollendonors were common to both PS1 and PS2.
The 122 G2 candidate trees from PS1 came from 30 differ-ent seed donor clones (maternal contribution of 1 to 13) andfrom 42 pollen donor clones (paternal contribution of 1 to 8)(Fig. 2). Mean coancestry within these candidate trees was0.029 (equivalent to Ns = 17). The best seed donor clonescontributed more than the others (Fig. 2), because the bestpreselected trees were from the best maternal families.
The 125 G2 candidate trees from PS2 came from 73 differ-ent seed donor clones (maternal contribution of 1 to 2) andfrom 45 pollen donor clones (paternal contribution of 1 to 10)(Fig. 2). Mean coancestry within these candidate trees was0.017 (equivalent to Ns = 29).
3.3 Correlation between the EBV_PP and the EBV_FPof candidate trees
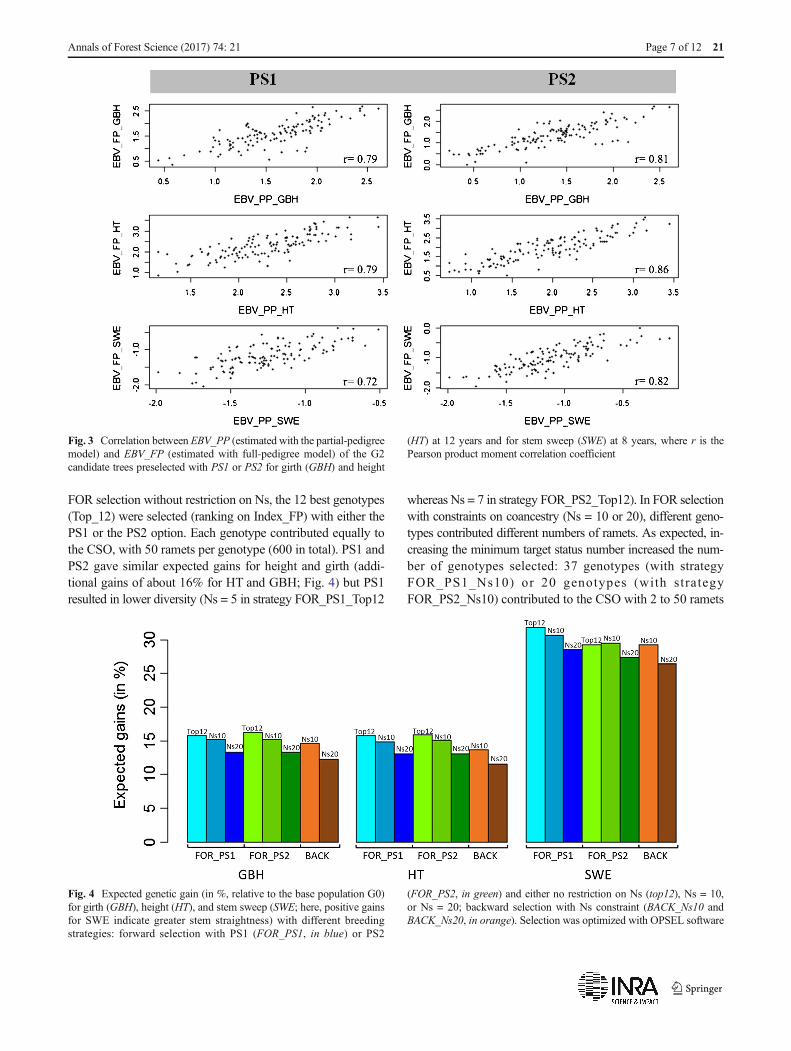
There was a strong correlation between the breeding valuesestimated with the partial (EBV_PP) and full (EBV_FP)pedigree models for the three traits in candidate trees fromPS1 and PS2. Pearson’s correlation coefficients ranged
Annals of Forest Science (2017) 74: 21 Page 5 of 12 21
from 0.72 to 0.79 for candidate trees from PS1 and from0.81 to 0.86 for candidate trees from PS2, depending onthe trait considered (Fig. 3). These correlation coefficientswere slightly higher in the sample from PS2, probably becausethe range of EBVs was larger in PS2 than in PS1, due to thelimitation of relatedness in PS1.
Moreover, the accuracy of EBV_FP (0.70 for girth, 0.74 forheight, and 0.75 for stem sweep) was much higher than that ofEBV_PP (0.56 for girth, 0.63 for height, and 0.65 for stemsweep). As expected, paternity recovery resulted in a betterEBVestimation for G2 trees.
3.4 Final selection to establish clonal seed orchards
The last step in the selection process was the selection of thebest genotypes for which a complete pedigree had been
recovered, from the PS1 and PS2 candidate trees, to obtain avirtual CSO. OPSEL software was used to obtain an optimalselection, maximizing genetic gain while maintaining geneticdiversity by imposing a constraint on mean relatedness (a min-imum status number). The optimization of CSO compositionby OPSEL resulted in different numbers of ramets for differentgenotypes. Genotypes with higher breeding values tended tobe represented by larger numbers of ramets, but this trend wascounterbalanced by relatedness between these genotypes.
Forward selection strategies were evaluated with OPSEL andcompared with backward and mixed selection strategies, as ex-plained in thematerials andmethods section. Detailed results arepresented in Supplemental Data I and summarized in Fig. 4.
Forward selectionwith the two preselection options was firststudied, with the imposition of different levels of coancestry inthe CSO: either no restriction on Ns, Ns = 10, or Ns = 20. In
Fig. 2 Maternal and paternal contributions (number of progeny perparent) for candidate trees for which a complete pedigree wasrecovered, for preselection options PS1 (122 G2 candidates) and PS2(125 G2 candidates). The identities of the maternal (73 different
maternal genotypes in total) and paternal parents (53 different paternalgenotypes in total) are listed in decreasing order of Index_PP. A maternalfamily size of 1 in PS2 means that one of the two preselected G2individuals has an unknown father (i.e., not included in the polymixes)
Table 1 Number of G2 treessampled with two preselectionoptions (PS1 and PS2) andpaternity recovery statistics
Preselection PS1 Preselection PS2
Number of preselected G2 trees 153a 150a
Number of successfully genotyped G2 trees 146 147
Number of G2 trees with seed donor clone confirmedb 145 142
Number of G2 trees with complete pedigree recovered 122 125
a Fifty-seven preselected G2 were common in PS1 and PS2b and thus analyzed for paternity recovery
21 Page 6 of 12 Annals of Forest Science (2017) 74: 21
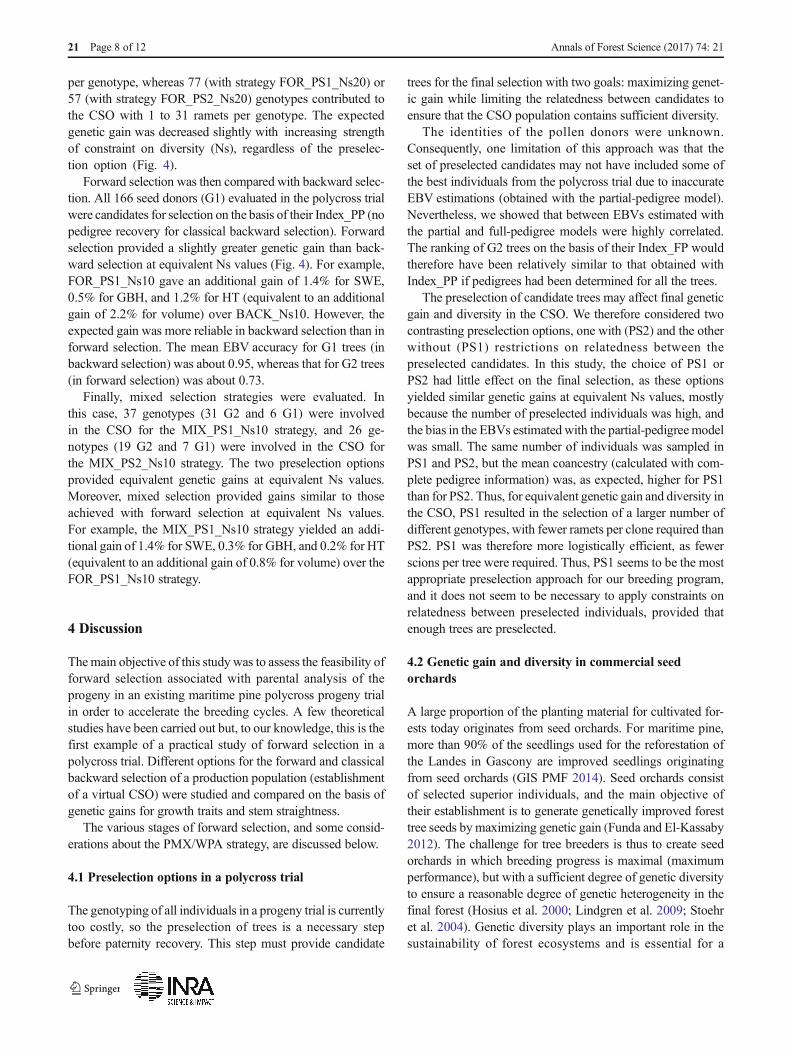
FOR selection without restriction on Ns, the 12 best genotypes(Top_12) were selected (ranking on Index_FP) with either thePS1 or the PS2 option. Each genotype contributed equally tothe CSO, with 50 ramets per genotype (600 in total). PS1 andPS2 gave similar expected gains for height and girth (addi-tional gains of about 16% for HT and GBH; Fig. 4) but PS1resulted in lower diversity (Ns = 5 in strategy FOR_PS1_Top12
whereas Ns = 7 in strategy FOR_PS2_Top12). In FOR selectionwith constraints on coancestry (Ns = 10 or 20), different geno-types contributed different numbers of ramets. As expected, in-creasing the minimum target status number increased the num-ber of genotypes selected: 37 genotypes (with strategyFOR_PS1_Ns10) or 20 genotypes (with strategyFOR_PS2_Ns10) contributed to the CSO with 2 to 50 ramets
Fig. 3 Correlation between EBV_PP (estimated with the partial-pedigreemodel) and EBV_FP (estimated with full-pedigree model) of the G2candidate trees preselected with PS1 or PS2 for girth (GBH) and height
(HT) at 12 years and for stem sweep (SWE) at 8 years, where r is thePearson product moment correlation coefficient
Fig. 4 Expected genetic gain (in %, relative to the base population G0)for girth (GBH), height (HT), and stem sweep (SWE; here, positive gainsfor SWE indicate greater stem straightness) with different breedingstrategies: forward selection with PS1 (FOR_PS1, in blue) or PS2
(FOR_PS2, in green) and either no restriction on Ns (top12), Ns = 10,or Ns = 20; backward selection with Ns constraint (BACK_Ns10 andBACK_Ns20, in orange). Selection was optimized with OPSEL software
Annals of Forest Science (2017) 74: 21 Page 7 of 12 21
per genotype, whereas 77 (with strategy FOR_PS1_Ns20) or57 (with strategy FOR_PS2_Ns20) genotypes contributed tothe CSO with 1 to 31 ramets per genotype. The expectedgenetic gain was decreased slightly with increasing strengthof constraint on diversity (Ns), regardless of the preselec-tion option (Fig. 4).
Forward selection was then compared with backward selec-tion. All 166 seed donors (G1) evaluated in the polycross trialwere candidates for selection on the basis of their Index_PP (nopedigree recovery for classical backward selection). Forwardselection provided a slightly greater genetic gain than back-ward selection at equivalent Ns values (Fig. 4). For example,FOR_PS1_Ns10 gave an additional gain of 1.4% for SWE,0.5% for GBH, and 1.2% for HT (equivalent to an additionalgain of 2.2% for volume) over BACK_Ns10. However, theexpected gain was more reliable in backward selection than inforward selection. The mean EBV accuracy for G1 trees (inbackward selection) was about 0.95, whereas that for G2 trees(in forward selection) was about 0.73.
Finally, mixed selection strategies were evaluated. Inthis case, 37 genotypes (31 G2 and 6 G1) were involvedin the CSO for the MIX_PS1_Ns10 strategy, and 26 ge-notypes (19 G2 and 7 G1) were involved in the CSO forthe MIX_PS2_Ns10 strategy. The two preselection optionsprovided equivalent genetic gains at equivalent Ns values.Moreover, mixed selection provided gains similar to thoseachieved with forward selection at equivalent Ns values.For example, the MIX_PS1_Ns10 strategy yielded an addi-tional gain of 1.4% for SWE, 0.3% for GBH, and 0.2% for HT(equivalent to an additional gain of 0.8% for volume) over theFOR_PS1_Ns10 strategy.
4 Discussion
Themain objective of this study was to assess the feasibility offorward selection associated with parental analysis of theprogeny in an existing maritime pine polycross progeny trialin order to accelerate the breeding cycles. A few theoreticalstudies have been carried out but, to our knowledge, this is thefirst example of a practical study of forward selection in apolycross trial. Different options for the forward and classicalbackward selection of a production population (establishmentof a virtual CSO) were studied and compared on the basis ofgenetic gains for growth traits and stem straightness.
The various stages of forward selection, and some consid-erations about the PMX/WPA strategy, are discussed below.
4.1 Preselection options in a polycross trial
The genotyping of all individuals in a progeny trial is currentlytoo costly, so the preselection of trees is a necessary stepbefore paternity recovery. This step must provide candidate
trees for the final selection with two goals: maximizing genet-ic gain while limiting the relatedness between candidates toensure that the CSO population contains sufficient diversity.
The identities of the pollen donors were unknown.Consequently, one limitation of this approach was that theset of preselected candidates may not have included some ofthe best individuals from the polycross trial due to inaccurateEBV estimations (obtained with the partial-pedigree model).Nevertheless, we showed that between EBVs estimated withthe partial and full-pedigree models were highly correlated.The ranking of G2 trees on the basis of their Index_FP wouldtherefore have been relatively similar to that obtained withIndex_PP if pedigrees had been determined for all the trees.
The preselection of candidate trees may affect final geneticgain and diversity in the CSO. We therefore considered twocontrasting preselection options, one with (PS2) and the otherwithout (PS1) restrictions on relatedness between thepreselected candidates. In this study, the choice of PS1 orPS2 had little effect on the final selection, as these optionsyielded similar genetic gains at equivalent Ns values, mostlybecause the number of preselected individuals was high, andthe bias in the EBVs estimated with the partial-pedigree modelwas small. The same number of individuals was sampled inPS1 and PS2, but the mean coancestry (calculated with com-plete pedigree information) was, as expected, higher for PS1than for PS2. Thus, for equivalent genetic gain and diversity inthe CSO, PS1 resulted in the selection of a larger number ofdifferent genotypes, with fewer ramets per clone required thanPS2. PS1 was therefore more logistically efficient, as fewerscions per tree were required. Thus, PS1 seems to be the mostappropriate preselection approach for our breeding program,and it does not seem to be necessary to apply constraints onrelatedness between preselected individuals, provided thatenough trees are preselected.
4.2 Genetic gain and diversity in commercial seedorchards
A large proportion of the planting material for cultivated for-ests today originates from seed orchards. For maritime pine,more than 90% of the seedlings used for the reforestation ofthe Landes in Gascony are improved seedlings originatingfrom seed orchards (GIS PMF 2014). Seed orchards consistof selected superior individuals, and the main objective oftheir establishment is to generate genetically improved foresttree seeds bymaximizing genetic gain (Funda and El-Kassaby2012). The challenge for tree breeders is thus to create seedorchards in which breeding progress is maximal (maximumperformance), but with a sufficient degree of genetic diversityto ensure a reasonable degree of genetic heterogeneity in thefinal forest (Hosius et al. 2000; Lindgren et al. 2009; Stoehret al. 2004). Genetic diversity plays an important role in thesustainability of forest ecosystems and is essential for a
21 Page 8 of 12 Annals of Forest Science (2017) 74: 21
population to adapt to new environmental factors, such asclimate change and diseases (Hansen 2008; Johnson andLipow 2002; Muller-Starck 1995). How much genetic diver-sity should be present in a CSO depends on the length of therotation and the environmental variation to which the plantingmaterial originating from the CSOwill need to adapt during itslifetime (Johnson and Lipow 2002). Johnson and Lipowshowed that a seed orchard with “25 unrelated selections con-tains about 92 percent of the genetic variation of the naturalpopulation” and that a minimum of “20 unrelated selectionsshould provide the same level of risks as seed collected fromthe natural population.” Moreover, restrictions on relatednessbetween the individuals selected for the CSO can limit in-breeding depression, with potential effects on the perfor-mance of the planting material (Durel et al. 1996;Olsson et al. 2001; Stoehr et al. 2008). However, themanagement of diversity and relatedness (expressed asgroup coancestry here) between selections becomes relative-ly complicated at the third generation of breeding. OPSELsoftware proposes an optimal selection, “not to completelyavoid kinship, but rather to find the set of selections thatmaximizes gain under a relatedness constraint” (Mullin2014). In this study, we used the status number Ns toquantify coancestry in the CSO. Ns is a useful parameterfor evaluating trade-offs between gain and diversity(Lindgren et al. 1997; Lindgren and Kang 1997;Lindgren and Mullin 1998). The minimum Ns was set at10 or 20 for a population census size of 600 (total num-ber of ramets in the CSO).
In the French maritime pine breeding program, the estab-lishment of a CSO based on forward selection could involvethe best G2 trees from several polycross progeny trials. Ourstandard CSO area is at least 10 ha, so about 2400 graftedtrees would be required. Four polycross trials are currentlyavailable for forward selection, so the selection of the bestgenotypes providing 600 ramets within a trial was consid-ered here. Due to the relatedness between the parents usedin the different polycross trials, we set the diversity in thestudied trial at Ns = 10 to ensure that the minimum di-versity required was attained (as described above and inaccordance with Johnson and Lipow 2002) in the finalcomplete CSO.
The number of ramets per genotype is limited in forwardselection approaches, because each selected clone is representedby a single tree (giving few scions). By contrast, in backwardselection, the parent trees selected are often grafted with severalreplicates in clonal archives. The development of efficientvegetative propagation methods (such as micropropagation,somatic embryogenesis, or micrografting through tissueculture) would increase the number of ramets available forthe best genotypes and provide powerful tools for scalingup the production of genetically improved planting material(Bonga 2015; Lelu-Walter et al. 2013). However, such
methods are not yet available for use in this species (andwere therefore not considered in our options).
Whatever the preselection option used, forward selectionresulted in a slightly higher genetic gain than backward selec-tion. It should be borne in mind that the polycross trial studiedwas not designedwith forward selection inmind. In particular,the pollen mixes were mostly of random composition ratherthan based on high EBVs. The expected genetic gain obtainedwith forward selection in this trial would therefore be far fromoptimal.
Finally, genetic gain and diversity in the production popu-lation were estimated under an assumption of randommating,equal reproductive success, and no pollen contamination with-in the CSO. However, many factors can affect the geneticquality of orchard seedlots. Both genetic gain and diversitydepend on the variation of reproductive success in the CSO,synchrony in reproductive phenology, pollen quality and con-tamination, self-fertilization rates, seed germination, and otherfactors. Many studies have shown that there can be a consid-erable gulf between expectations and reality (Askew 1988;Burczyk et al. 1997; Edwards and ElKassaby 1996; Fundaet al. 2009; Gomory et al. 2003; Hansen 2008; Kang andLindgren 1998; Machanska et al. 2013; Matziris 1994; Naet al. 2015), making it difficult to predict genetic quality.Moreover, the selfing rate in the CSO and inbreeding depres-sion were not taken into account in the estimation of geneticgain and diversity. However, absolute values were not ofprime importance here as the aim was to compare differentbreeding strategies.
4.3 Towards the implementation of a PMX/WPA strategy?
This study shows that forward selection associated with mo-lecular pedigree analysis of progeny is feasible in real-lifeconditions. In the polycross trial analyzed here, the expectedgenetic gain in the production population did not much exceedthat obtained with classical backward selection, largely be-cause this polycross trial was not designed for this kind ofselection.
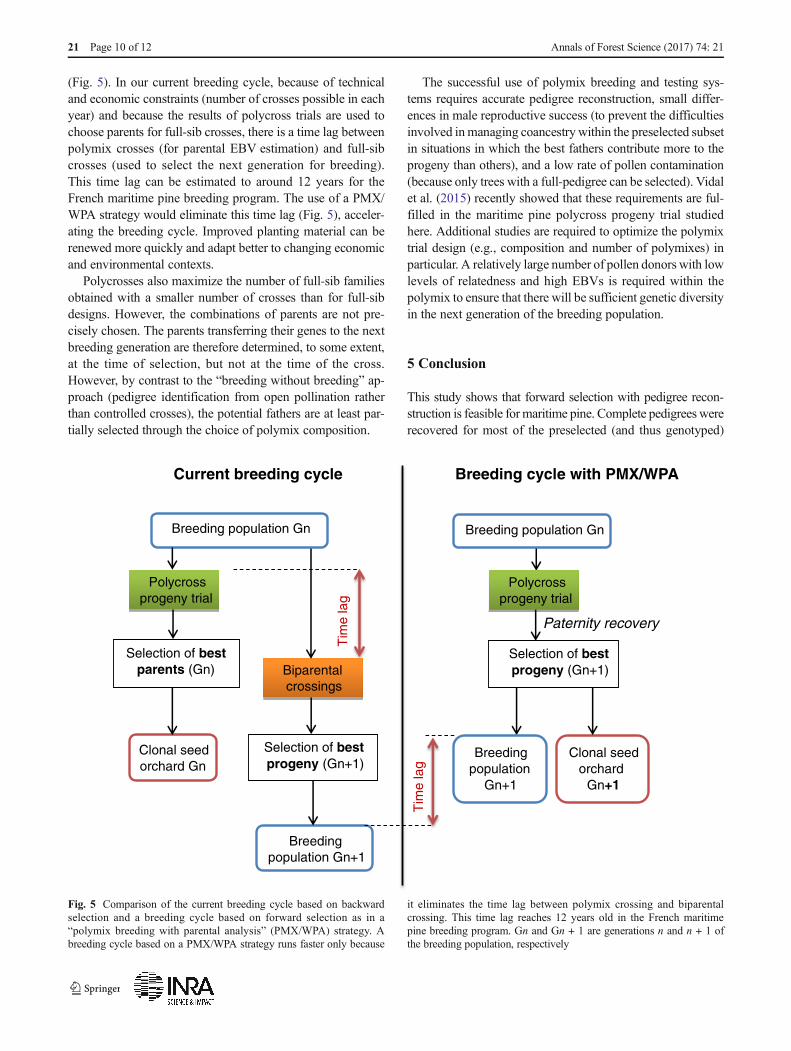
The implementation of a PMX/WPA strategy, as proposedby Lambeth et al. (2001) is a broader issue, because the bestprogeny is selected for the next generation of breeding, ratherthan just for a CSO. This strategy has clear advantages, in-cluding the need for only one round of crossing (polycross),for simultaneous testing and recruitment for forward selection.The many costly full-sib crosses required for classical ap-proaches are replaced by a small number of polycrosses (withone or several different polymixes), followed by genotypingand paternity recovery to identify the best progeny for use inthe next generation of breeding. This approach is thus easier toimplement than classical approaches, and, as breeding andtesting are performed at the same time, the interval betweenthe generations of consecutive seed orchards is shortened
Annals of Forest Science (2017) 74: 21 Page 9 of 12 21
(Fig. 5). In our current breeding cycle, because of technicaland economic constraints (number of crosses possible in eachyear) and because the results of polycross trials are used tochoose parents for full-sib crosses, there is a time lag betweenpolymix crosses (for parental EBV estimation) and full-sibcrosses (used to select the next generation for breeding).This time lag can be estimated to around 12 years for theFrench maritime pine breeding program. The use of a PMX/WPA strategy would eliminate this time lag (Fig. 5), acceler-ating the breeding cycle. Improved planting material can berenewed more quickly and adapt better to changing economicand environmental contexts.
Polycrosses also maximize the number of full-sib familiesobtained with a smaller number of crosses than for full-sibdesigns. However, the combinations of parents are not pre-cisely chosen. The parents transferring their genes to the nextbreeding generation are therefore determined, to some extent,at the time of selection, but not at the time of the cross.However, by contrast to the “breeding without breeding” ap-proach (pedigree identification from open pollination ratherthan controlled crosses), the potential fathers are at least par-tially selected through the choice of polymix composition.
The successful use of polymix breeding and testing sys-tems requires accurate pedigree reconstruction, small differ-ences in male reproductive success (to prevent the difficultiesinvolved inmanaging coancestry within the preselected subsetin situations in which the best fathers contribute more to theprogeny than others), and a low rate of pollen contamination(because only trees with a full-pedigree can be selected). Vidalet al. (2015) recently showed that these requirements are ful-filled in the maritime pine polycross progeny trial studiedhere. Additional studies are required to optimize the polymixtrial design (e.g., composition and number of polymixes) inparticular. A relatively large number of pollen donors with lowlevels of relatedness and high EBVs is required within thepolymix to ensure that there will be sufficient genetic diversityin the next generation of the breeding population.
5 Conclusion
This study shows that forward selection with pedigree recon-struction is feasible for maritime pine. Complete pedigrees wererecovered for most of the preselected (and thus genotyped)
Breeding population Gn
Polycross
Selection of best parents (Gn)
Selection of best progeny (Gn+1)
Clonal seed orchard Gn
Selection of best progeny (Gn+1)
Paternity recovery
Breeding population Gn
Clonal seed orchard
Gn+1
Current breeding cycle Breeding cycle with PMX/WPA
Breeding population
Gn+1
Tim
e la
g
Tim
e la
g
progeny trial
Biparental crossings
Breeding population Gn+1
Polycross progeny trial
Fig. 5 Comparison of the current breeding cycle based on backwardselection and a breeding cycle based on forward selection as in a“polymix breeding with parental analysis” (PMX/WPA) strategy. Abreeding cycle based on a PMX/WPA strategy runs faster only because
it eliminates the time lag between polymix crossing and biparentalcrossing. This time lag reaches 12 years old in the French maritimepine breeding program. Gn and Gn + 1 are generations n and n + 1 ofthe breeding population, respectively
21 Page 10 of 12 Annals of Forest Science (2017) 74: 21
progeny, a prerequisite for selection for the production popula-tion. In the polycross progeny trial analyzed, forward selectiongave a slightly greater genetic gain (despite the absence ofoptimization of polymix composition) than classical back-ward selection. No major differences in expected geneticgain in the production population were observed betweentwo contrasting preselection options (with and without con-straints on relatedness).
The implementation of a PMX/WPA strategy, speeding upthe production of the next breeding population and decreasingthe workload, would be possible. However, simulation studiesare required to optimize the general design of such breedingstrategies, and a cost/benefit analysis should be performed toassess their economic efficiency, given the specific cost andtime components of our maritime pine breeding program.
Forward selection also provides a favorable context forgenomic selection. Indeed, the additive genetic relationshipmatrix (derived from the pedigree) could be replaced with agenomic relationship matrix to improve the estimation ofEBVs and to ensure the maintenance of higher levels of ge-netic diversity within the breeding program.
Acknowledgments This study would not have been possible withoutthe support of the maritime Pine Breeding Cooperative (GIS “PinMaritime du Futur”). We gratefully acknowledge all its members. Theauthors also thank the INRA Experimental Unit (UE0570) for field mea-surements, Jean-Mathieu De Boisseson (FCBA) for needles sampling,Tim Mullin for providing access to OPSEL Software, and JérômeBartholomé (INRA) for useful advices in R.
The genotyping was performed at the Genomic Facility of Bordeaux(grants from the Conseil Regional d’Aquitaine, nos. 20030304002FA and20040305003FA; the European Union, FEDER no. 2003227; and ANR,no. ANR-10-EQPX-16 Xyloforest), with help from Christophe Bouryand Adline Delcamp (INRA).
Compliance with ethical standards
Data availability The dataset analyzed during the current study is avail-able in the Zenodo repository [http://dx.doi.org/10.5281/zenodo.165158].
Funding This study was funded by INRA (EFPA division “projetinnovant”), the European-Union (ProCoGen project: no. 289841), andConseil Regional d’Aquitaine (IMAF project cofunded by FCBA: no.120009468-052). Marjorie Vidal received a CIFRE Ph.D. fellowship(Public/Private Research Partnerships between FCBA and the FrenchMinistry of Higher Education and Research).
References
AskewGR (1988) Estimation of gamete pool compositions in clonal seedorchards. Silvae Genet 37:227–232
Bonga JM (2015) A comparative evaluation of the application of somaticembryogenesis, rooting of cuttings, and organogenesis of conifers.Can J For Res 45:379–383. doi:10.1139/cjfr-2014-0360
Bouffier L, Raffin A, Kremer A (2008) Evolution of genetic variation forselected traits in successive breeding populations of maritime pine.Heredity 101:156–165. doi:10.1038/hdy.2008.41
Burczyk J, Nikkanen T, Lewandowski A (1997) Evidence of an unbal-anced mating pattern in a seed orchard composed of two larch spe-cies. Silvae Genet 46:176–181
Burdon RD, Kumar S (2004) Forwards versus backwards selection:trade-offs between expected genetic gain and risk avoidance. N ZJ Forest Sci 34:3–21
Chancerel E, Lamy JB, Lesur I, Noirot C, Klopp C, Ehrenmann F, BouryC, Le Provost G, Label P, Lalanne C, Leger V, Salin F, Gion JM,Plomion C (2013) High-density linkage mapping in a pine tree re-veals a genomic region associated with inbreeding depression andprovides clues to the extent and distribution of meiotic recombina-tion. BMC Biol 11:19. doi:10.1186/1741-7007-11-50
Cornelius J (1994) Heritabilities and additive genetic coefficients ofvariation in forest trees. Can J For Res 24:372–379. doi:10.1139/x94-050
Durel CE, Bertin P, Kremer A (1996) Relationship between inbreedingdepression and inbreeding coefficient in maritime pine (Pinuspinaster). Theor Appl Genet 92:347–356
Edwards DGW, ElKassaby YA (1996) The biology and management ofconiferous forest seeds: genetic perspectives. For Chron 72:481–484
El-Kassaby YA, Cappa EP, Liewlaksaneeyanawin C, Klapste J, LstiburekM (2011) Breeding without breeding: is a complete pedigree neces-sary for efficient breeding? PLoS One 6:11. doi:10.1371/journal.pone.0025737
El-Kassaby YA, Lstiburek M (2009) Breeding without breeding. GenetRes 91:111–120. doi:10.1017/s001667230900007x
Falconer DS, Mackay TFC (1996) Introduction to quantitative genetics,vol Ed. 4. Longman Group Limited, Harlow
Funda T, Lstiburek M, Lachout P, Klapste J, El-Kassaby YA (2009)Optimization of combined genetic gain and diversity for collectionand deployment of seed orchard crops. Tree Genet Genomes 5:583–593. doi:10.1007/s11295-009-0211-3
GIS PMF (2014) GIS Groupe Pin maritime du futur. Les cahiers de lareconstitution n°4: matériel végétal de reboisement. http://www.onf.fr/outils/medias/20130708-143100-661300/++files++/4
Gomory D, Bruchanik R, Longauer R (2003) Fertility variation andflowering asynchrony in Pinus sylvestris: consequences for the ge-netic structure of progeny in seed orchards. For Ecol Manag 174:117–126. doi:10.1016/s0378-1127(02)00031-2
Hansen OK (2008) Mating patterns, genetic composition and diver-sity levels in two seed orchards with few clones—impact onplanting crop. For Ecol Manag 256:1167–1177. doi:10.1016/j.foreco.2008.06.032
Hosius B, Bergmann F, Konnert M, Henkel W (2000) A concept for seedorchards based on isoenzyme gene markers. For Ecol Manag 131:143–152. doi:10.1016/s0378-1127(99)00209-1
Illy G (1966) Recherches sur l’amélioration génétique du pin maritime.Ann Sci forest 23:765–948. doi:10.1051/forest/19660401
JohnsonR, Lipow S (2002) Compatibility of breeding for increased woodproduction and long-term sustainability: the genetic variation ofseed orchard seed and associated risks. In: Johnson AC, HaynesRW, Monserud RA (eds) Congruent management of multiple re-sources: proceedings from the wood compatibility initiative work-shop, vol 563. USDA Forest Service General Technical ReportPacific Northwest. Us Dept Agr, Forest Serv Pacific Nw ResearchStn, Portland, pp 169–179
Kalinowski ST, Taper ML, Marshall TC (2007) Revising how thecomputer program Cervus accommodates genotyping error in-creases success in paternity assignment. Mol Ecol 16:1099–1106. doi:10.1111/j.1365-294X.2007.03089.x
Annals of Forest Science (2017) 74: 21 Page 11 of 12 21
Kang KS, Lindgren D (1998) Fertility variation and its effect on therelatedness of seeds in Pinus densiflora, Pinus thunbergii andPinus koraiensis clonal seed orchards. Silvae Genet 47:196–201
Lambeth C, Lee BC, O’Malley D, Wheeler N (2001) Polymix breedingwith parental analysis of progeny: an alternative to full-sib breedingand testing. Theor Appl Genet 103:930–943. doi:10.1007/s001220100627
Lambeth C (1980) Juvenile-mature correlation in Pinaceae and its impli-cations for early selection. For Sci 26:571–580
Lelu-Walter MA, Thompson D, Harvengt L, Sanchez L, Toribio M,Paques LE (2013) Somatic embryogenesis in forestry with a focuson Europe: state-of-the-art, benefits, challenges and future direction.Tree Genet Genomes 9:883–899. doi:10.1007/s11295-013-0620-1
Lindgren D, Danusevicius D, Rosvall O (2009) Unequal deployment ofclones to seed orchards by considering genetic gain, relatedness andgene diversity. Forestry 82:17–28. doi:10.1093/forestry/cpn033
Lindgren D, Gea LD, Jefferson PA (1997) Status number for measuringgenetic diversity. For Genet 4:69–76
Lindgren D, Kang K (1997) Status number—a useful tool for tree breed-ing. Research Report of the Forest Genetics Research Institute(Suwon)154–165
Lindgren D, Mullin TJ (1998) Relatedness and status number in seedorchard crops. Can J For Res-Rev Can Rech For 28:276–283.doi:10.1139/cjfr-28-2-276
Lstiburek M, Hodge GR, Lachout P (2015) Uncovering genetic informa-tion from commercial forest plantations-making up for lost timeusing “breeding without breeding”. Tree Genet Genomes 11:12.doi:10.1007/s11295-015-0881-y
LstiburekM, Ivankova K, Kadlec J, Kobliha J, Klapste J, El-Kassaby YA(2011) Breeding without breeding: minimum fingerprinting effortwith respect to the effective population size. Tree Genet Genomes7:1069–1078. doi:10.1007/s11295-011-0395-1
Machanska E, Bajcar V, Longauer R, Gomory D (2013) Effective popu-lation size estimation in seed orchards: a case study of Pinus nigraARNOLD and Fraxinus excelsior L./F. angustifolia VAHL.Genetika-Belgrade 45:575–588. doi:10.2298/gensr1302575m
Marshall TC, Slate J, Kruuk LEB, Pemberton JM (1998) Statistical con-fidence for likelihood-based paternity inference in natural popula-tions. Mol Ecol 7:639–655. doi:10.1046/j.1365-294x.1998.00374.x
Matziris DI (1994) Genetic variation in the phenology of flowering inblack pine. Silvae Genet 43:321–328
McRae TA, Dutkowski GW, Pilbeam DJ, Powell MB, Tier B (2004)Genetic evaluation using the TREEPLAN® system. Paper presentedat the IUFRO Joint Conference of Division 2 “Forest Genetics andTree Breeding in the Age of Genomics: Progress and Future”Charleston, SC, USA, 1–5 November 2004
Muller-Starck G (1995) Protection of genetic variability in forest trees.For Genet 2:121–124
Mullin TJ (2014) OPSEL 1.0: a computer program for optimal selection inforest tree breeding. Technical Report Nr 841-2014, ArbetsrapportFrån Skogforsk
Na SJ, Lee HS, Han SU, Park JM, Kang KS (2015) Estimation of geneticgain and diversity under various genetic thinning scenarios in abreeding seed orchard of Quercus acutissima. Scand J Forest Res30:377–381. doi:10.1080/02827581.2015.1018936
Olsson T, Lindgren D, Li B (2001) Balancing genetic gain and related-ness in seed orchards. Silvae Genet 50:222–227
Pâques L (2013) Forest tree breeding in Europe: current state-of-the-artand perspectives. In: Pâques L E (ed) Managing Forest Ecosystems,Vol. 25. Springer, doi:10.1007/978-94-007-6146-9
Stoehr M, Webber J, Woods J (2004) Protocol for rating seed orchardseedlots in British Columbia: quantifying genetic gain and diversity.Forestry 77:297–303. doi:10.1093/forestry/77.4.297
Stoehr M, Yanchuk A, Xie CY, Sanchez L (2008) Gain and diversity inadvanced generation coastal Douglas-fir selections for seed produc-tion populations. Tree Genet Genomes 4:193–200. doi:10.1007/s11295-007-0100-6
Vidal M, Plomion C, Harvengt L, Raffin A, Boury C, Bouffier L (2015)Paternity recovery in two maritime pine polycross mating designsand consequences for breeding. Tree Genet Genomes 11:1–13.doi:10.1007/s11295-015-0932-4
Vidal M, Plomion C, Raffin A, Harvengt L, Bouffier L (2016)Forward selection in a maritime pine polycross progeny trial usingpedigree reconstruction. V1. INRA [Data set] doi: 10.5281/zenodo.165158
Zobel BJ, Talbert JT (1984) Applied forest tree improvement.Wiley, NewYork, p 528
21 Page 12 of 12 Annals of Forest Science (2017) 74: 21