PROCEEDINGS, Thirty-Second Workshop on Geothermal Reservoir Engineering Stanford University, Stanford, California, January 22-24, 2007 SGP-TR-183 GEOTHERMAL RESOURCES EXPLORATION AND WELLSITE SELECTION WITH ENVIRONMENTAL CONSIDERATION USING GIS IN SABALAN GEOTHERMAL AREA, IRAN Younes Noorollahi, Ryuichi Itoi, Hikari Fujii and Toshiaki Tanaka Department of Earth Resources Engineering, Kyushu University West Building 2, 744, Motooka, Nishi-ku Fukuoka, 819-0395, Japan e-mail: [email protected]ABSTRACT Geographical Information System (GIS) was used as a decision-making tool to determine the spatial association between exploration evidence layers and environmental evidence layers in the Sabalan geothermal field in northwestern Iran for geothermal exploration well siting. The wellsites are located contributing exploration and environmental datasets. The exploration data set comprises geological, geochemical and geophysical evidences. The environmental dataset contains restrictive (limitative) data layers and Classifying layers are taken into account for well siting. The Boolean and Index Overlay models were developed for processing the site selection. The result of exploration data modeling was combined with the result of environmental suitability analysis for final well targeting. Three exploration well sites were suggested for exploration drilling. INTRODUCTION Active geothermal areas have various natural manifestations such as hot springs, fumaroles and mud pots. Hydrothermal alterations, particularly in areas of high thermal activity, are natural indicators of geothermal activity. Geothermal exploration programs make use of such manifestations and other investigation techniques and measurements to identify prospective geothermal resources. A geothermal exploration programme comprises reconnaissance, feasibility, and assessment studies. During each stage of the exploration, less prospective areas are eventually eliminated from candidate site and efforts are concentrated on the most promising areas (Dickson and Fanelli, 2004). The decision-making process need to combine and analyze the results of a number of different surveys and studies. Thus, human errors are unavoidable during this complex procedure. To minimize human errors, The GIS can be a powerful tool for identifying prospective areas by employing various digital data layers. In these studies, the results of geological, geochemical and geophysical surveys were generally combined for locating prospective areas for further exploration. Objectives of exploration management are to identify the location and extent of areas for further detailed investigation. Identifying areas of high geothermal potential, however, can be a daunting task for project managers as it requires tedious works and GIS was used to facilitate that. In other hand, geothermal energy is recognized as an environmentally friendly energy source compared to the fossil fuels. The terminology “environmentally friendly” is used in comparison with other sources and should not mean that geothermal energy is completely friendly to the environment. A degree of friendliness of an impact on the environment depends on the point of view of the impacted community. In geothermal projects civil works are required for constructing access roads, drilling pads and power plant. These activities may lead to landscape modifications and alteration of natural features and cultural interest. A drilling site including drill pad and area for associated facilities need a land of 2500 – 10,000 m 2 . Thus, construction of drilling sites has led to the destruction including landscape modifications, vegetation change and losses, soil erosion, surface water pollution and alteration of natural features. Objectives of this work are to locate the well sites with minimum environmental impacts by taking into account the environmental consideration in wellsite selection process. For locating the geothermal well sites the exploration data and environmental data were contributed and the GIS (ArcMap 9.1) was used as a decision support system tool for performing site selection. The NW Sabalan geothermal prospect lies in the Moil valley on the western slopes of Mt. Sabalan, northern part of Iran. The area is located between 38° 12' 52'' and 38° 20' 00'' North and 47° 40' 30'' and
Transcript
PROCEEDINGS, Thirty-Second Workshop on Geothermal Reservoir Engineering Stanford University, Stanford, California, January 22-24, 2007 SGP-TR-183
GEOTHERMAL RESOURCES EXPLORATION AND WELLSITE SELECTION WITH ENVIRONMENTAL CONSIDERATION USING GIS IN SABALAN GEOTHERMAL AREA,
IRAN
Younes Noorollahi, Ryuichi Itoi, Hikari Fujii and Toshiaki Tanaka
Department of Earth Resources Engineering, Kyushu University West Building 2, 744, Motooka, Nishi-ku
Geographical Information System (GIS) was used as a decision-making tool to determine the spatial association between exploration evidence layers and environmental evidence layers in the Sabalan geothermal field in northwestern Iran for geothermal exploration well siting. The wellsites are located contributing exploration and environmental datasets. The exploration data set comprises geological, geochemical and geophysical evidences. The environmental dataset contains restrictive (limitative) data layers and Classifying layers are taken into account for well siting. The Boolean and Index Overlay models were developed for processing the site selection. The result of exploration data modeling was combined with the result of environmental suitability analysis for final well targeting. Three exploration well sites were suggested for exploration drilling.
INTRODUCTION
Active geothermal areas have various natural manifestations such as hot springs, fumaroles and mud pots. Hydrothermal alterations, particularly in areas of high thermal activity, are natural indicators of geothermal activity. Geothermal exploration programs make use of such manifestations and other investigation techniques and measurements to identify prospective geothermal resources. A geothermal exploration programme comprises reconnaissance, feasibility, and assessment studies. During each stage of the exploration, less prospective areas are eventually eliminated from candidate site and efforts are concentrated on the most promising areas (Dickson and Fanelli, 2004). The decision-making process need to combine and analyze the results of a number of different surveys and studies. Thus, human errors are unavoidable during this complex procedure. To minimize human
errors, The GIS can be a powerful tool for identifying prospective areas by employing various digital data layers. In these studies, the results of geological, geochemical and geophysical surveys were generally combined for locating prospective areas for further exploration. Objectives of exploration management are to identify the location and extent of areas for further detailed investigation. Identifying areas of high geothermal potential, however, can be a daunting task for project managers as it requires tedious works and GIS was used to facilitate that. In other hand, geothermal energy is recognized as an environmentally friendly energy source compared to the fossil fuels. The terminology “environmentally friendly” is used in comparison with other sources and should not mean that geothermal energy is completely friendly to the environment. A degree of friendliness of an impact on the environment depends on the point of view of the impacted community. In geothermal projects civil works are required for constructing access roads, drilling pads and power plant. These activities may lead to landscape modifications and alteration of natural features and cultural interest. A drilling site including drill pad and area for associated facilities need a land of 2500 – 10,000 m2. Thus, construction of drilling sites has led to the destruction including landscape modifications, vegetation change and losses, soil erosion, surface water pollution and alteration of natural features. Objectives of this work are to locate the well sites with minimum environmental impacts by taking into account the environmental consideration in wellsite selection process. For locating the geothermal well sites the exploration data and environmental data were contributed and the GIS (ArcMap 9.1) was used as a decision support system tool for performing site selection. The NW Sabalan geothermal prospect lies in the Moil valley on the western slopes of Mt. Sabalan, northern part of Iran. The area is located between 38° 12' 52'' and 38° 20' 00'' North and 47° 40' 30'' and
47° 49' 10'' East. The study area is an elevation of 2200 m in the north, to 3700 m in the south.
METHODOLOGY
This study incorporated the results of two main data integration models; exploration data modeling and environmental suitability analysis. In exploration data modeling different exploration data including geological, geochemical and geophysical data are integrated and suitable area which presents the location of geothermal resources is defined. The environmental suitability analyses were performed by overlaying environmentally important data layers and suitable area was selected. The result of two integration models is overlaid and suitable area for geothermal wellsites is selected. Index Overlay is a GIS operation that the layers with a common area are joined on the basis of their occupation of space (Clarke, 1997). The overlay function creates composite maps by combining diverse data sets. Each class of the maps is given a different score, allowing for a more flexible weighting system and the table of scores and the map weights can be adjusted to reflect the judgment of an expert in the domain of the application under consideration. At any location, the output score, S, is defined as;
∑∑=
i
ii
W
AWS (1)
where Wi is the weight of the i-th map, and Ai is the i-th map. Disadvantage of this method probably lay in its linear additive nature. The overlay operations such as multiplying and adding map attributes of different value. Index Overlay analysis is a simple and straightforward method for a combined analysis of multi-class maps. A weight represents the relative importance of a parameter vis a vis the objective. Index Overlay method takes into consideration the relative importance of the parameters and the classes belonging to each parameter. The criteria for the analysis should be defined and each parameter should be assigned importance (Saraf and Choudhury, 1997; Saraf and Choudhury, 1998). Determination of weightage of each class is the most crucial in integrated analysis, as the output is largely dependent on the assignment of appropriate weightage. Consideration of relative importance leads to a better representation of the actual field situation. In this method the Subjective- Based analyses are carried out, it means, the data layers in same category or subject are firstly combined, analyzed using Boolean “OR” operation and the prospected areas are defined. Secondly the derived map layers from different categories are weighted, overlaid, combined and analyzed by Index Overlay method and the prospected areas are defined and classified. This level
by level overlaying of the layers continues till all necessary data layers are employed in analyses. Figure 1 shows the conceptual model of data integration for geothermal favorability analysis.
Figure 1 conceptual model of geothermal exploration
favorability analysis By Index Overlay data integration model the geothermal resources are assumed to be located: - In close relation to volcanic domes which can be
assumed as a heat source - In close to the more permeable area of the system
defined by faults and fractures - In the vicinity of the surface manifestations such
as hot springs and acidic alteration zones which marks main upflow of the system
- In area where resistivity is less than 10 Ω m in target depth.
EVIDENCE LAYERS
Geological evidences
Geology Mt. Sabalan lies on the South Caspian plate, which underthrusts the Eurasian plate to the north. It is in turn underthrust by the Iranian plate, which produces compression in a northwest direction. This is complicated by a dextral rotational movement caused by northward underthrusting of the nearby Arabian plate beneath the Iranian plate. There is no Benioff-Wadati zone to indicate any present day subduction (McKenzie, 1972). The Mt. Sabalan region has a complex stratigraphy, with different sequences of rocks, with different structural patterns, exposed around the Mt. Sabalan volcano and stratigraphically underlying the volcanic sequences of Mt. Sabalan itself (Amidi, 1978; TBCE,
1979; ENEL, 1983; Manouchehri, 1989; Nejad, 1987; and Emami, 1994). From the geological map, the tracydacitic, trachyandesite and rhyolite domes were digitized and used as evidence layer (factor map). It was assumed that they would be related to the intrusive bodies that might serve as a heat source of the hydrothermal system. The geological map of the study area is illustrated in Figure 2.
Figure 2 Geological map of the NW Sabalan
Structural geology Fractures and faults can play an important role in geothermal fields, as fluid mostly flows through fractures in the source rocks. The importance of fractures in geothermal development is therefore well recognized (Hanano, 2000). Faults in the present study area might also contribute to the occurrence of natural convection in the observed geothermal systems. Accordingly, faults can be used as an evidence layer to find more permeable area in the selection of potential wellsites. The location of main faults and the high density of surface fracturing are useful surface observations in the determination of secondary permeability (Prol-Ledesma, 2000).
Structural study in NW Sabalan confirms two major types of structural setting; a set of linear faults and several arcuate ring faults (Figure 2). Interpretation of the SPOT satellite imagery and aerial photographs indicates a west-northwest trending major structural zone and the predominant fault strikes are northwest and northeast. Linear and arcuate ring faults were extracted and digitized from geological map of NW Sabalan (KML, 1998). These faults lead us to find out the high permeable zones which more likely can provide path way for ascending the geothermal fluid to the shallow geological formations.
Geochemical evidences
Hydrothermal alteration zones All of the hydrothermal alteration in the mapped area at NW Sabalan is confined to the Valhazir formation which belongs to pre-caldera trachyandesitic lava flows (Error! Reference source not found.). The weak development of secondary minerals in some of the upper volcanic units in this formation appears to be due to deuteric processes. Within the Valhazir formation, the original volcanic lithology exerts a major control over the intensity of alteration. The impermeable andesite lavas are generally weakly altered or fresh and are only strongly altered close to fractures. The tuffs and pyroclastic breccias are more permeable and are consequently strongly to intensely altered. The surface hydrothermal alteration(Figure 2) in the NW Sabalan area is relict and limited to the stratigraphically lower intervals of the Valhazir formation.
Hot Springs Several hot springs with temperature range of from 20 to 85 °C are located in the study area in NW Sabalan (Figure 2). The springs discharges mainly from the gravels of the Dizu formation. There are no springs reported downstream at lower elevations. The hot springs are divided into in two groups on their chemistry, Neutral-Cl-SO4 waters and Acid-SO4 waters (KML, 1998). Transport of the fluid from deeper parts of the reservoir to the surface is evidenced by surface manifestations such as hot springs, fumaroles and hot pools. Surface observations in study area can be used to delineate areas characterized by high permeability and hot fluid transport from the reservoir.
Geophysical evidence Resistivity surveys of Direct current (DC), Transient electromagnetic (TEM) and Magneto-telluric (MT) were conducted at Mt Sabalan, particularly on the northwest flanks where geothermal springs discharge at surface. The survey was conducted at 212 resistivity stations in great Sabalan volacano in 1998.
The 110 resistivity stations were located in NW Sabalan area (KML, 1998). Direct current resistivity measurements at each site provide an independent measure of the shallow resistivity in the two orthogonal directions using the same 50m electrode array as for the deeper penetrating magnetotelluric soundings. Significant differences in resistivity with orientation can be attributed to local shallow inhomogeneity or anisotropy, which may influence the interpretation of the MT soundings (static shift corrections). The TEM soundings at each site were conducted to obtain an independent measure of the subsurface resistivity at depths between about 100-300m and data was used for the treatment of "static shift" effects in MT soundings. The natural source MT method was adopted for deeper penetration using a frequency range of 8 kHz to 0.02 Hz. This covers the depth range of primary interest for exploration drilling. The MT resistivity data from the soundings revealed significant area of anomalously low resistivity at depths within that which can be reached by typical exploration drill holes. This anomaly is located in Moil Valley, an approximately 50km2, aligned NW-SE. The MT resistivity distribution map of the study area at sea level (about 3000 m depth) which is defined as a target depth for exploration drilling was modeled using ArcMap-3D analyst. The Natural Neighbor interpolation method is used.
Environmental evidences
Slope Slope represents an important terrain parameter from the land utilization point of view and also in environmental impact analysis. Natural slope of a geothermal prospected area is important for construction of wellsites and accompanying structures. The land with a greater slope may pose difficulty in the construction and may need leveling up and cause more environmental disturbance. The slope map of the study area was created from Digital Elevation Model (DEM) data and using the Spatial Analyst of ArcMap. The output raster map was asked to generate the percent of slope. For avoiding surface disturbances, it is preferred to construct the geothermal drill sites in a “Nearly level” (< 5 %) to “Very gently” (6-15%) sloping area. The slope map of the study area was symbolized in 9 different classes. In proposed geothermal project in NW Sabalan the construction of 100 by 100 m entirely level well sites are proposed. For minimizing the environmental effects of the wellsite construction, the well sites are required to assign in the less steep area. If the maximum of % 15 slope is define as criteria for
wellsite selection the area with slope more than 15 % was discarded.
Water drainage The water drainage which is canals that the surface waters are running during rainy season and are not suitable for wellsite locating because of water overflow and high flooding risk. In environmental suitability analysis the drainage system and movement ways of water across a surface is an important factor. The water drainage of the study area was derived from DEM data using Spatial Analyst tool and a 100 m buffer carried out to define the high risk area. The high risk area is discarded form well site locating.
Residential area There is no possibility to locate the geothermal wellsites over or nearby the residential, recreational and cultural interests. The more reaction often grows against landscape modifications and alteration of natural features of cultural or historical interest, caused by civil and construction work; and changes in the use of public areas resulting from project activities. There are two village and three swimming pools (geothermal direct use) in the study area. These features with 1000 m buffer were discarded from further analysis for well site selection.
Land Use The importance of all land use classes in environmental suitability analysis is not similar. The area of the cultivation and agricultural use are more important than pasture area. Study area are the watershed of Khiave river is including two villages is following the country regulation and law about land ownerships, and each family has his own land for cultivation. Land uses in the study area include two major types, farmland and rangeland. About %20 of area is farmland and %80 is rangeland currently. There are no any industrial activities in the area.
Vegetation The project site is marked by a mixture of vegetation, with Steppe flora covering with low density in very high and low elevation and highest density in moderate elevation. The study area with mean annual precipitation of 200-450 mm has been mostly covered by Steppe flora and consists of varied vegetation. Grasses of different kinds were very common in the past but have been greatly reduced by human activity, particularly by over grazing. Artemisia herba-alba is the predominant shrub and Aristida plumosa normally the predominant grass. Vegetation study in proposed area is shown that there are 369 plant species with 25 endemic species. Totally about 110, 12, 15 and 19 plant species are using for animal feed, human feed, industrial and
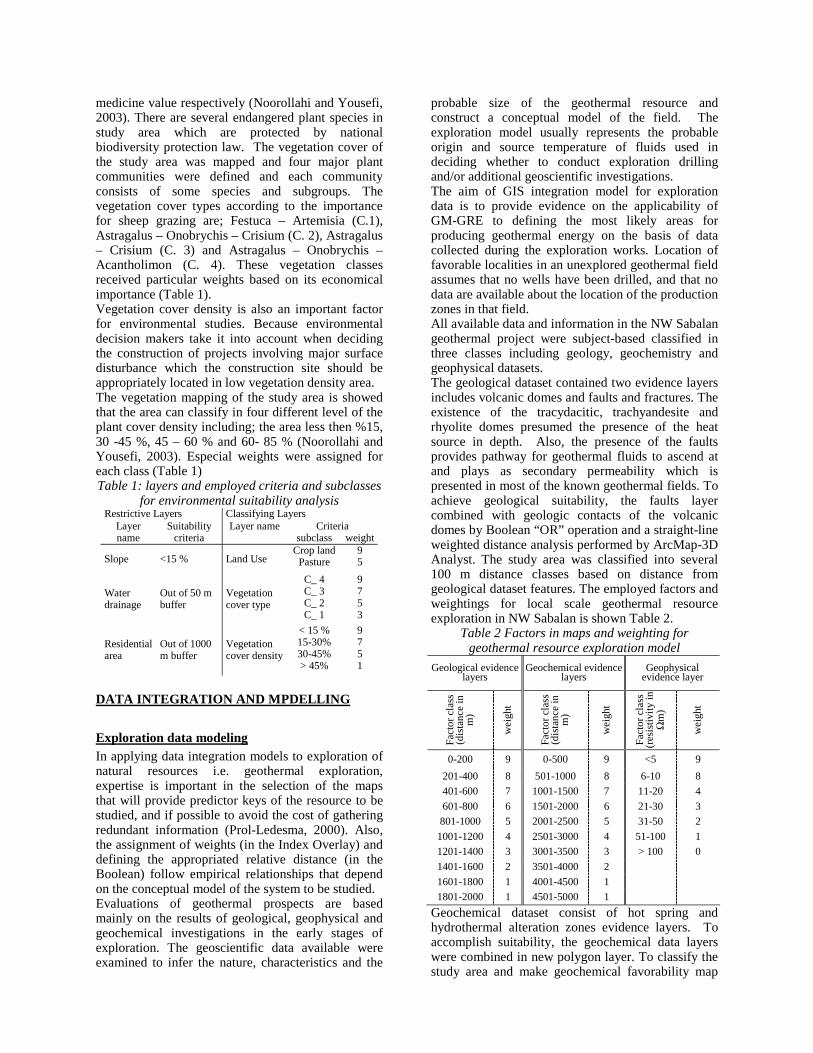
medicine value respectively (Noorollahi and Yousefi, 2003). There are several endangered plant species in study area which are protected by national biodiversity protection law. The vegetation cover of the study area was mapped and four major plant communities were defined and each community consists of some species and subgroups. The vegetation cover types according to the importance for sheep grazing are; Festuca – Artemisia (C.1), Astragalus – Onobrychis – Crisium (C. 2), Astragalus – Crisium (C. 3) and Astragalus – Onobrychis – Acantholimon (C. 4). These vegetation classes received particular weights based on its economical importance (Table 1). Vegetation cover density is also an important factor for environmental studies. Because environmental decision makers take it into account when deciding the construction of projects involving major surface disturbance which the construction site should be appropriately located in low vegetation density area. The vegetation mapping of the study area is showed that the area can classify in four different level of the plant cover density including; the area less then %15, 30 -45 %, 45 – 60 % and 60- 85 % (Noorollahi and Yousefi, 2003). Especial weights were assigned for each class (Table 1) Table 1: layers and employed criteria and subclasses
for environmental suitability analysis Restrictive Layers Classifying Layers
Criteria Layer name
Suitability criteria
Layer name subclass weight
Slope <15 % Land Use Crop land
Pasture 9 5
Water drainage
Out of 50 m buffer
Vegetation cover type
C_ 4 C_ 3 C_ 2 C_ 1
9 7 5 3
Residential area
Out of 1000 m buffer
Vegetation cover density
< 15 % 15-30% 30-45% > 45%
9 7 5 1
DATA INTEGRATION AND MPDELLING
Exploration data modeling In applying data integration models to exploration of natural resources i.e. geothermal exploration, expertise is important in the selection of the maps that will provide predictor keys of the resource to be studied, and if possible to avoid the cost of gathering redundant information (Prol-Ledesma, 2000). Also, the assignment of weights (in the Index Overlay) and defining the appropriated relative distance (in the Boolean) follow empirical relationships that depend on the conceptual model of the system to be studied. Evaluations of geothermal prospects are based mainly on the results of geological, geophysical and geochemical investigations in the early stages of exploration. The geoscientific data available were examined to infer the nature, characteristics and the
probable size of the geothermal resource and construct a conceptual model of the field. The exploration model usually represents the probable origin and source temperature of fluids used in deciding whether to conduct exploration drilling and/or additional geoscientific investigations. The aim of GIS integration model for exploration data is to provide evidence on the applicability of GM-GRE to defining the most likely areas for producing geothermal energy on the basis of data collected during the exploration works. Location of favorable localities in an unexplored geothermal field assumes that no wells have been drilled, and that no data are available about the location of the production zones in that field. All available data and information in the NW Sabalan geothermal project were subject-based classified in three classes including geology, geochemistry and geophysical datasets. The geological dataset contained two evidence layers includes volcanic domes and faults and fractures. The existence of the tracydacitic, trachyandesite and rhyolite domes presumed the presence of the heat source in depth. Also, the presence of the faults provides pathway for geothermal fluids to ascend at and plays as secondary permeability which is presented in most of the known geothermal fields. To achieve geological suitability, the faults layer combined with geologic contacts of the volcanic domes by Boolean “OR” operation and a straight-line weighted distance analysis performed by ArcMap-3D Analyst. The study area was classified into several 100 m distance classes based on distance from geological dataset features. The employed factors and weightings for local scale geothermal resource exploration in NW Sabalan is shown Table 2.
Table 2 Factors in maps and weighting for geothermal resource exploration model
Geological evidence layers
Geochemical evidence layers
Geophysical evidence layer
Fact
or c
lass
(d
ista
nce
in
m)
wei
ght
Fact
or c
lass
(d
ista
nce
in
m)
wei
ght
Fact
or c
lass
(r
esis
tivity
in
Ωm
)
wei
ght
0-200 9 0-500 9 <5 9
201-400 8 501-1000 8 6-10 8
401-600 7 1001-1500 7 11-20 4
601-800 6 1501-2000 6 21-30 3
801-1000 5 2001-2500 5 31-50 2
1001-1200 4 2501-3000 4 51-100 1
1201-1400 3 3001-3500 3 > 100 0
1401-1600 2 3501-4000 2
1601-1800 1 4001-4500 1
1801-2000 1 4501-5000 1
Geochemical dataset consist of hot spring and hydrothermal alteration zones evidence layers. To accomplish suitability, the geochemical data layers were combined in new polygon layer. To classify the study area and make geochemical favorability map
based on this layer, a 500 m straight-line weighted distance analysis conducted using ArcMap-3D Analyst. To delineate geothermal favorability based on geological and geochemical datasets, and to propose an appropriate area for geophysical survey, the geological and geochemical favorability maps were overlain in equal weight and the area was ranked in 5 classes. The geophysical data layer was the final layer which was incorporated in overlaying process in geothermal exploration data integration. The best indicators of the production zones are the low apparent resistivity areas, which are related with the presence of some alteration minerals and rock saturated with high-temperature saline fluids. In the case of clay minerals, they can also be present in areas of relic hydrothermal activity where, at present, no geothermal potential might be available. In order to distinguish the currently active areas from the relic hydrothermal areas at depth, information is needed on the geothermal gradient, which was not available for NW Sabalan. The analysis was therefore undertaken assuming that all areas with low resistivity were prospective for geothermal exploitation. But the area where a geothermal upflow zone is located can prove the existence of hot geothermal fluid. Thus the overlaying of the geophysical data layer by geochemical data layer is of great importance. The result of MT survey at 3000 m was plotted as point data and interpolated using Natural Neighbor tool in ArcMap-3D Analyst as geophysical suitability layer. The isosurface map was reclassified in 6 different classes including, 0-5, 5.1-10, 10.1-20, 20.1-50, 50.1-100, >100 Ωm. The highest relative value was given to the lowest class of resistivity value. The favorability map of the geothermal resources using exploration data was conducted overlaying geophysical resistivity distribution map and geological and geochemical favorability based map. Figure 3 shows the favorability map of the geothermal resources in NW Sabalan geothermal field using GIS integration method. Comparing the selected and defined area by this method shows that by applying every step of the work the promising area was minimized and further work was carried out in smaller area. Whole study area in NW Sabalan geothermal area was 121 km2, by using the geological and geochemical evidence layers 55 km2 (47%) of the study area was selected and in second step by applying geophysical evidence layer only 12 km2 (10%) was defined final prospected area. This presents how the method is useful to minimizing the study area to concentrate more detailed works in smaller land.
Environmental Suitability modeling To select wellsites with minimum environmental effects, environmentally important factors classifies into two main datasets; Restrictive layers and Classifying layers.
Restrictive layers In restrictive layers a certain area was confined by assigning selection criteria. The restricted layers are "slope", "Water drainage system", and "Residential and built up area". The restrictive layers define the area where environmental impacts will be the minimum and there is no physical and geographical difficulty to locate the well sites. The slope map of the study area was classified into two classes; less and more than 15 %. The area with the slope of less than 15 % was selected as a suitable area for well site and the rest was discarded. The location of the residential and other built up features were digitized and a buffer of 1000 m distance was made. This area is not suitable for locating well site and the rest was defined as a suitable area. For selecting an area to be outside of high risk area from surface waterways, a buffer analysis with a distance of 50m in both side of water drainage system were defined and assigned as a terrain of high risk and unsuitable. By using the intersect tool in ArcMap, those three layers were overlaid and the common area of the three layers were defined as suitable area for wellsites based on restrictive layers.
Figure 3 Favorability map of the geothermal
resources in NW Sabalan
Classifying layers In Classifying data layers, the study area was classified in several subclasses and particular weight factors was assigned to every classes based on
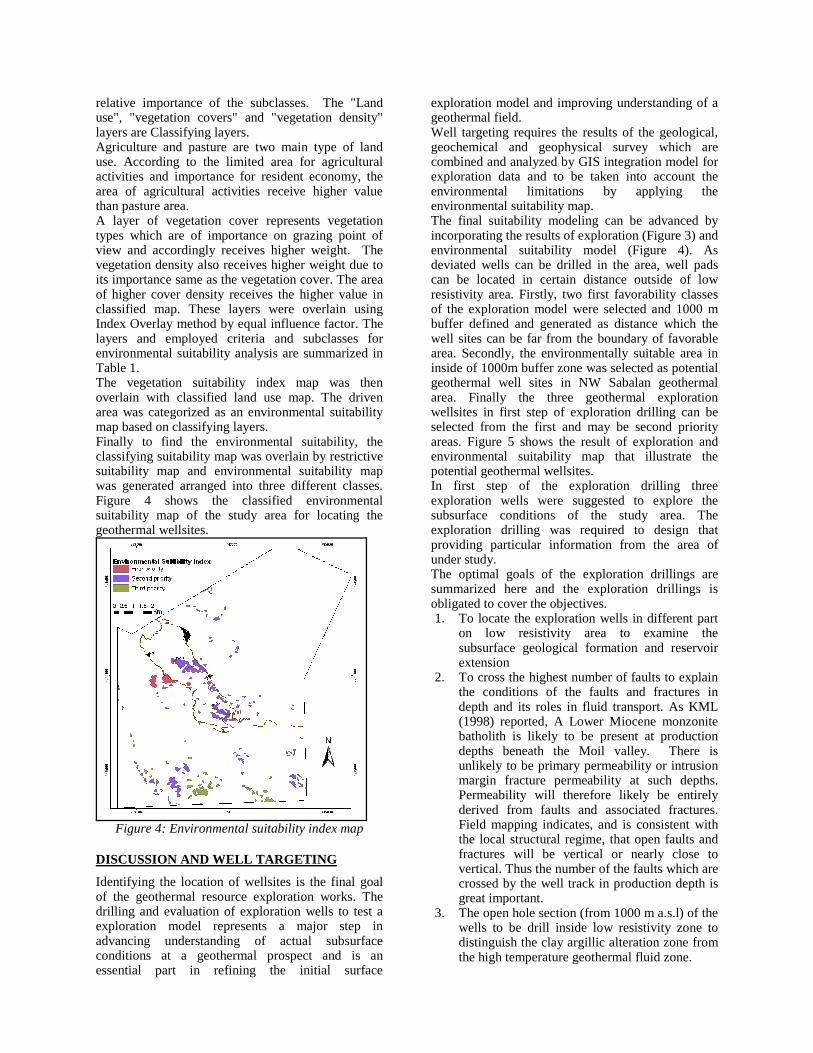
relative importance of the subclasses. The "Land use", "vegetation covers" and "vegetation density" layers are Classifying layers. Agriculture and pasture are two main type of land use. According to the limited area for agricultural activities and importance for resident economy, the area of agricultural activities receive higher value than pasture area. A layer of vegetation cover represents vegetation types which are of importance on grazing point of view and accordingly receives higher weight. The vegetation density also receives higher weight due to its importance same as the vegetation cover. The area of higher cover density receives the higher value in classified map. These layers were overlain using Index Overlay method by equal influence factor. The layers and employed criteria and subclasses for environmental suitability analysis are summarized in Table 1. The vegetation suitability index map was then overlain with classified land use map. The driven area was categorized as an environmental suitability map based on classifying layers. Finally to find the environmental suitability, the classifying suitability map was overlain by restrictive suitability map and environmental suitability map was generated arranged into three different classes. Figure 4 shows the classified environmental suitability map of the study area for locating the geothermal wellsites.
Figure 4: Environmental suitability index map
DISCUSSION AND WELL TARGETING
Identifying the location of wellsites is the final goal of the geothermal resource exploration works. The drilling and evaluation of exploration wells to test a exploration model represents a major step in advancing understanding of actual subsurface conditions at a geothermal prospect and is an essential part in refining the initial surface
exploration model and improving understanding of a geothermal field. Well targeting requires the results of the geological, geochemical and geophysical survey which are combined and analyzed by GIS integration model for exploration data and to be taken into account the environmental limitations by applying the environmental suitability map. The final suitability modeling can be advanced by incorporating the results of exploration (Figure 3) and environmental suitability model (Figure 4). As deviated wells can be drilled in the area, well pads can be located in certain distance outside of low resistivity area. Firstly, two first favorability classes of the exploration model were selected and 1000 m buffer defined and generated as distance which the well sites can be far from the boundary of favorable area. Secondly, the environmentally suitable area in inside of 1000m buffer zone was selected as potential geothermal well sites in NW Sabalan geothermal area. Finally the three geothermal exploration wellsites in first step of exploration drilling can be selected from the first and may be second priority areas. Figure 5 shows the result of exploration and environmental suitability map that illustrate the potential geothermal wellsites. In first step of the exploration drilling three exploration wells were suggested to explore the subsurface conditions of the study area. The exploration drilling was required to design that providing particular information from the area of under study. The optimal goals of the exploration drillings are summarized here and the exploration drillings is obligated to cover the objectives. 1. To locate the exploration wells in different part
on low resistivity area to examine the subsurface geological formation and reservoir extension
2. To cross the highest number of faults to explain the conditions of the faults and fractures in depth and its roles in fluid transport. As KML (1998) reported, A Lower Miocene monzonite batholith is likely to be present at production depths beneath the Moil valley. There is unlikely to be primary permeability or intrusion margin fracture permeability at such depths. Permeability will therefore likely be entirely derived from faults and associated fractures. Field mapping indicates, and is consistent with the local structural regime, that open faults and fractures will be vertical or nearly close to vertical. Thus the number of the faults which are crossed by the well track in production depth is great important.
3. The open hole section (from 1000 m a.s.l) of the wells to be drill inside low resistivity zone to distinguish the clay argillic alteration zone from the high temperature geothermal fluid zone.
To attain the first goal and delineating and examining the study area the well sites have to drill in in different parts of exploration suitability area. The first class of the final suitability map has a first priority for well sites. Three exploration wells were suggested to locate in suitable places. Thus the wells was assigned to locate in southern, central and the northern part of the area to cover entirely the low resistivity zone. There are zones of the first priority of final suitability in north and central part of the study area which were pre-selected. But in southern part there is no first priority that the zone of the second priority was selected. To attain the second and third objectives first well (well 101) should design to drill as; - The well location; 739350 E and 4238050 N - Elevation: 2680 m a.s.l - The faults, NW3, NNW5 and NNW2 are chosen
to be intersected by this well. - All three faults have to be intersected by the open
hole section of the well. The nearby fault (NW3) will be intersected in depth of 1000 m a.s.l.(1680 m depth).
The second well (well 201) was decided to locate in central part of the low resistivity area. To reach the goals of the exploration drilling this well should design to drill as; - Location; 738600 E and 4239870 N - Elevation; 2460 m a.s.l - The faults, NE3 and NNW2 can be the target of
this well - The intersection of the first fault can be
intersected in depth 1000m a.s.l (1460 m depth). The third well (well 301) has to be located in the northern part of the low resistivity area; - Location; 736900 E and 4240700 N - Elevation; 2268 m a.s.l - The azimuth of this well can not be toward NNE
and NNW directions, because the Moeil and Dizu villages are located in these directions and 3000 m wells is targeted exactly the beneath of the villages. As an environmental and sustainable point of view the wells cannot be drill in beneath of the residential area because of the higher potential of the risk. It is suggested to drill this well in SSE direction, to intersect the NE2 and W2 faults.
- The NE2 and W2 faults have to be intersected in somewhere deeper than 1200 m
CONCLUSIONS
The spatial association between geothermal exploration evidence layers and environmental evidence layers was analyzed using GIS as a decision-making tool to determine the location of the exploration well sites in NW Sabalan geothermal field in northwestern Iran. Digital data layers and maps were used in a GIS environment to target exploration wells. The Index Overlay integration
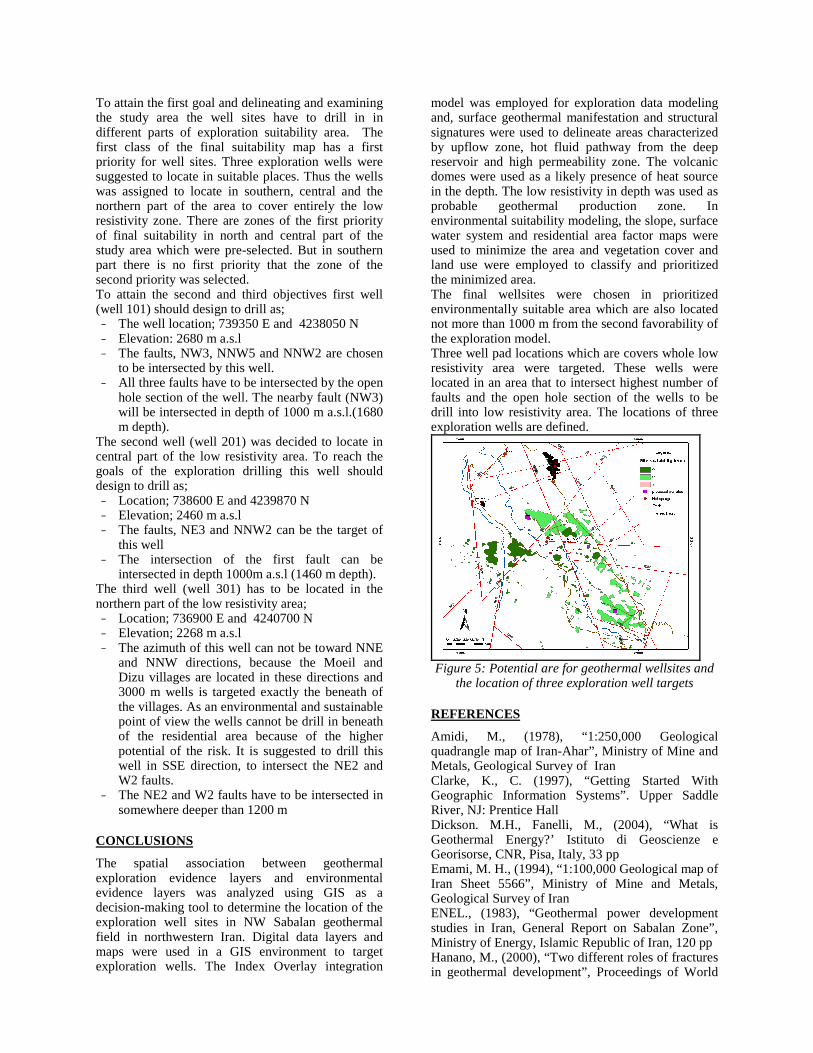
model was employed for exploration data modeling and, surface geothermal manifestation and structural signatures were used to delineate areas characterized by upflow zone, hot fluid pathway from the deep reservoir and high permeability zone. The volcanic domes were used as a likely presence of heat source in the depth. The low resistivity in depth was used as probable geothermal production zone. In environmental suitability modeling, the slope, surface water system and residential area factor maps were used to minimize the area and vegetation cover and land use were employed to classify and prioritized the minimized area. The final wellsites were chosen in prioritized environmentally suitable area which are also located not more than 1000 m from the second favorability of the exploration model. Three well pad locations which are covers whole low resistivity area were targeted. These wells were located in an area that to intersect highest number of faults and the open hole section of the wells to be drill into low resistivity area. The locations of three exploration wells are defined.
Figure 5: Potential are for geothermal wellsites and
the location of three exploration well targets
REFERENCES
Amidi, M., (1978), “1:250,000 Geological quadrangle map of Iran-Ahar”, Ministry of Mine and Metals, Geological Survey of Iran Clarke, K., C. (1997), “Getting Started With Geographic Information Systems”. Upper Saddle River, NJ: Prentice Hall Dickson. M.H., Fanelli, M., (2004), “What is Geothermal Energy?’ Istituto di Geoscienze e Georisorse, CNR, Pisa, Italy, 33 pp Emami, M. H., (1994), “1:100,000 Geological map of Iran Sheet 5566”, Ministry of Mine and Metals, Geological Survey of Iran ENEL., (1983), “Geothermal power development studies in Iran, General Report on Sabalan Zone”, Ministry of Energy, Islamic Republic of Iran, 120 pp Hanano, M., (2000), “Two different roles of fractures in geothermal development”, Proceedings of World
Geothermal Congress 2000, Kyushu–Tohoku, Japan, May 28–June 10, 2000, 2597–2602 McKenzie D. S., (1972), “Active tectonics of the Mediterranean region”, Geophys. J. R. astr.Soc. 30, 109-185 Nejad, J. E., (1987), “1:250,000 scale geological quadrangle map of Iran-Ardabil”, Ministry of Mine and Metals, Geological Survey of Iran Noorollahi.Y., and Yousefi. H., (2003), “Preliminary Environmental Impact Assessment of Meshkinshahr Geothermal Project, NW-Iran”, Proceeding International Geothermal Conference, Reykjavik-Iceland, Sept. 2003, Session 12, Paper 004, 1-11 Prol-Ledesma, R.M., (2000), ‘Evaluation of the reconnaissance results in geothermal exploration using GIS”, Geothermics 29, 83–103 Saraf, A. K. and Choudhury, P. R., (1998), “Integrated Remote Sensing and GIS for Groundwater Exploration and Identification of artificial recharge sites”, International Journal of Remote Sensing, 19(10), 1825-1841 Saraf, A. K. and Choudhury, P. R., (1997), “Integrated Application of Remote Sensing and GIS Groundwater exploration in hard rock terrain”, Proceedings. Int. Symp. on Emerging trends in Hydrology, Department of Hydrology, Roorkee, Sep. 25-27, 1997, Vol. I, 435-442 KML., (1998), “Sabalan geothermal project, stage 1- surface exploration, final exploration report”, report number. 2505-RPT-GE-003, Renewable Energy Organization of Iran and Kingston Morrison Limited Co. pp. 83 TBCE., (1979), “Geothermal power development studies, Sabalan Zone”, Geological Survey. Report to Ministry of Energy, Islamic republic of Iran